NEEDS GOO COMMUNITY - Goodwill Mokan · Goodwill of Western Missouri & Eastern Kansas (Goodwill)...
39
GOO IS DETERMINED TO GO FURTHER. GOOD GOES FURTHER. TM Goodwill empowers people with disadvantages and different abilities to earn and keep employment through individualized programs and services. COMMUNITY NEEDS ASSESSMENT OUR
Transcript of NEEDS GOO COMMUNITY - Goodwill Mokan · Goodwill of Western Missouri & Eastern Kansas (Goodwill)...
GOOIS DETERMINED TO GO FURTHER.
GOOD GOES FURTHER.TM
Goodwill empowers people with disadvantagesand different abilities to earn and keep employment through individualized programs and services.
COM
MUN
ITY NE
EDS A
SSES
SMEN
T
OUR

© 2017 Goodwill of Western Missouri & Eastern Kansas
Table of Contents
Tabl
e of
Con
tent
sGoodwill of Western Missouri & Eastern Kansas (Goodwill) adopted a five-step strategic plan in 2016. One of its key strategies is to revolutionize the Mission Services model. Before executing this plan and any new program initiatives, Goodwill sought to assess the community’s assets and needs within the employment sector and better understand the demographics of the Kansas City metro area (KCMA). Goodwill began the Community Needs Assessment (CNA) process in the spring of 2017. The CNA will provide a programmatic decision-making framework for future program initiatives that are scalable and repeatable within the Goodwill footprint. It will not serve as the final implementation plan for these future program initiatives nor be seen as a “one-size-fits-all” program approach for each of the Goodwill counties served but rather the CNA will serve as a tool used to ensure that the Mission Services model remains data-driven and person centered.
Statistical and informational data for this report was gathered from the following sources: U.S. Census Bureau, The American Community Survey, Bureau of Labor
Statistics, MERIC, National Skills Coalition, National Low Income Housing Coalition, The Missouri Department of Elementary and Secondary Education, Data
Source USA, Disability Statistics- Cornell University, Massachusetts Institute of Technology, Veterans Administration, Mid-America Regional Council, Bookings
Public Policy Report and Goodwill International.
A Message from CEO Stefany Williams
Our History
Goodwill Programs
The Community Needs Assessment Project
Demographics & Trends
Employment
Nonprofit Sector
Education
Income & Poverty
Populations in Need
Perceptions
Focus Groups
Community Conversations
Moving Forward
5
6
7
8
9
10
15
17
19
23
27
29
33
39

5
A M
essa
ge fr
om th
e C
EO
Message from Our CEO Stefany WilliamsAnyone who has lived in Kansas City any length of time knows how much it has changed. Just the last ten years have included a resurgence of downtown communities, robust job and housing markets and continued expansion in the suburbs. It is because of this change that service organizations have to find ways, large and small, to measure how these changes impact the challenges and opportunities to those we serve and the ways in which we serve those needing support. Falling into the category of large ways, Goodwill was excited to take on a comprehensive Community Needs Assessment focused on the employment challenges faced by the disadvantaged and different abled members of the Kansas City community. This report represents both an ending and a beginning. It is the end of an 18 month effort to compile data in a way to identify how workforce development services in Kansas City can have a bigger impact. For Goodwill, it is a beginning as we move into the next phase of mission advancement using this report as a map to guide our journey. Good goes further, and every journey needs a map (or GPS). What we develop next will be programs that address the gaps and opportunities identified in the community through this assessment. It will include infrastructure to scale, both in size and scope, programs that make the most progress in closing gaps and creating opportunities. And it will include feedback loops and inflection points to allow us to adapt along the way to our next assessment.
Thank you to everyone, from our team, to our partners and to those in the community who share Goodwill’s passion for helping people achieve their own success, for participating in this project. We hope the information will be put to good use, both inside and outside of Goodwill. When we work together, good goes furthest of all.
© Goodwill of Western Missouri & Eastern Kansas
6 © 2017 Goodwill of Western Missouri & Eastern Kansas
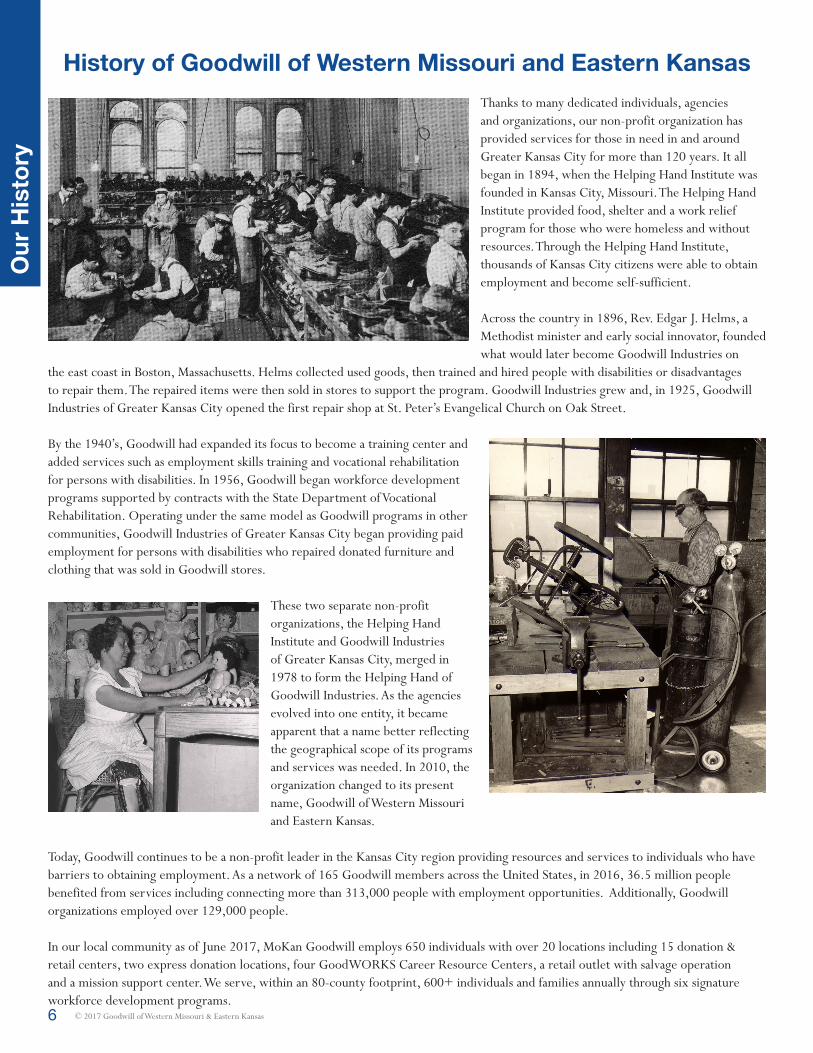
History of Goodwill of Western Missouri and Eastern KansasThanks to many dedicated individuals, agencies and organizations, our non-profit organization has provided services for those in need in and around Greater Kansas City for more than 120 years. It all began in 1894, when the Helping Hand Institute was founded in Kansas City, Missouri. The Helping Hand Institute provided food, shelter and a work relief program for those who were homeless and without resources. Through the Helping Hand Institute, thousands of Kansas City citizens were able to obtain employment and become self-sufficient.
Across the country in 1896, Rev. Edgar J. Helms, a Methodist minister and early social innovator, founded what would later become Goodwill Industries on
the east coast in Boston, Massachusetts. Helms collected used goods, then trained and hired people with disabilities or disadvantages to repair them. The repaired items were then sold in stores to support the program. Goodwill Industries grew and, in 1925, Goodwill Industries of Greater Kansas City opened the first repair shop at St. Peter’s Evangelical Church on Oak Street.
By the 1940’s, Goodwill had expanded its focus to become a training center and added services such as employment skills training and vocational rehabilitation for persons with disabilities. In 1956, Goodwill began workforce development programs supported by contracts with the State Department of Vocational Rehabilitation. Operating under the same model as Goodwill programs in other communities, Goodwill Industries of Greater Kansas City began providing paid employment for persons with disabilities who repaired donated furniture and clothing that was sold in Goodwill stores.
These two separate non-profit organizations, the Helping Hand Institute and Goodwill Industries of Greater Kansas City, merged in 1978 to form the Helping Hand of Goodwill Industries. As the agencies evolved into one entity, it became apparent that a name better reflecting the geographical scope of its programs and services was needed. In 2010, the organization changed to its present name, Goodwill of Western Missouri and Eastern Kansas.
Today, Goodwill continues to be a non-profit leader in the Kansas City region providing resources and services to individuals who have barriers to obtaining employment. As a network of 165 Goodwill members across the United States, in 2016, 36.5 million people benefited from services including connecting more than 313,000 people with employment opportunities. Additionally, Goodwill organizations employed over 129,000 people.
In our local community as of June 2017, MoKan Goodwill employs 650 individuals with over 20 locations including 15 donation & retail centers, two express donation locations, four GoodWORKS Career Resource Centers, a retail outlet with salvage operation and a mission support center. We serve, within an 80-county footprint, 600+ individuals and families annually through six signature workforce development programs.
Our
His
tory

7© Goodwill of Western Missouri & Eastern Kansas
Goodwill’s Career Impact Program offers services to individuals with barriers to employment including physical disadvantages, a mental health diagnosis, substance abuse, criminal backgrounds, or developmental disabilities. Goodwill assists with job matching, soft skills training, mock interviews, job development and negotiation, access to job leads, job coaching, and case management.
Career Impact Program
AbilityOne
Goodwill participates in AbilityOne with custodial service contracts at the Richard Bolling Federal Building in downtown Kansas City, Missouri and at Fort Leavenworth in Kansas. These jobs provide people with significant documented disabilities the opportunity to acquire job skills and training, receive strong wages and benefits, and gain greater independence and quality of life.
Extended Employment Services
Goodwill’s Extended Employment Services provide and support job skills training, case management and meaningful employment for individuals with significant disadvantages and different abilities based on the Missouri Department of Elementary and Secondary Education’s disability criteria. Employees are accompanied by a Goodwill Career Coach to their jobs at Goodwill stores in St. Joseph, Kansas City, Blue Springs, and Lee’s Summit, or at the Goodwill Mission Support Center.
goodWORKS Career Resource Centers
GoodWORKS Career Resource Centers connect job seekers in the Greater Kansas City community with individualized job search and employment related assistance. Resources include job posting information, computers & Internet access, phones, fax, copiers & printers as well as a resource library of social and community services. A Goodwill career professional is available to assist with job exploration, resume preparation, online job listing navigation, and online applications, as well as the use of job search tools and more.
Quest Academy
Quest Academy is a career planning and employment readiness program for young adults. Quest provides participants the opportunity to explore their career options through classroom training and an internship with a local business.
Project SEARCH
Goo
dwill
Pro
gram
s
Project SEARCH is a partnership between Goodwill, North Kansas City School District, Children’s Mercy Hospital, Vocational Rehabilitation Services, Center for Human Services and Truman Medical Center. Project SEARCH is a high school transition program that provides real-life work experience to help youth with significant disabilities make successful transitions from school to adult life. Students participate in three 10-week internship rotations where they learn job skills and receive on-the-job training. Project SEARCH provides training and career exploration, innovative adaptations, long-term job coaching, and continuous feedback from teachers, job coaches, and employers.

8 © 2017 Goodwill of Western Missouri & Eastern Kansas
The
CN
A Pr
ojec
tThe community needs assessment is a systematic process for determining the gaps between current conditions and desired conditions within the community. Goodwill will use this information to build a foundational decision-making process and long-term program strategy. The needs assessment process should spark more questions than answers, propelling our journey beyond raw data and into continued strategic planning.
GOALS OF THE CNAto more deeply know the community of kansas city, missouri (jackson county) through data analytics and listening sessions to identify the populations in need of goodwill services within our community
to understand the contributing factors behind the populations in need of services
to create community relationships core to revolutionizing our mission services model
ASPIRATIONS OF THE PROJECTto vet the success of current community program structures and services
to create a resource guide for all client services in the kansas city metro area
Additionally, Goodwill was active in 20 public and/or community initiative meetings, such as the Employment & Transportation Roundtable, NEXUS, STEP Coalition, Mobility Accessibility Committee, Kansas Employment Consortium, Workforce Development Subcommittee, the Greater Kansas City Coalition to End Homelessness, KC Works Together, Making a Mentor and Kansas City Chamber, to better understand the Jackson County community and initiatives within the Kansas City metro area.
Board of Directors, Community Advocates, Employees, Local Business Partners, & Service Providers participated.
140Perception Studies
OUR PROCESS
Community DataAnalytics
Community demographic and county statistics were gathered to identify key needs and top issues within the Kansas City Metro Area.
of business, training and education and the reentry sector to better understand the community at large as well as the
employment needs and trends within the workforce sector.
focus groups included a total of 20 participants in person and via online survey in the areas
3Focus Groups
individual interviews were held with service providers, community influencers, and community members to gain insight on community issues, service gaps, and duplications.
35One on One Interviews
125From
surveys
responses were obtained. Respondents included community members from 20 different public service and community organizations to gain insight from those in need of services about their employment experiences.
89
Community Surveys/Listening Sessions
The community needs assessment efforts will provide a brief section on services in our local area, the competitors in our space. However,
this effort is not complete. There is still work to be done to best understand the breadth of services in our local community and the success at which these entities are providing services. Several local initiatives remain ongoing (Money Smart KC, Case Worthy Coordinated Entry, United Way 211, Aunt Bertha, MARC) to catalog the vast number of community organizations serving those in need. Goodwill is aware and sitting at many of these project tables. We remain committed to the importance of coordinated entry and referral excellence for comprehensive wrap-around services.

9© 2017 Goodwill of Western Missouri & Eastern Kansas
Dem
ogra
phic
s &
Tren
ds
The Starting Point: Jackson County Demographics & Trends
PopulationWith a population of 674,158, Jackson County is the second largest county in the State of Missouri. Jackson County encompasses 19 cities; Kansas City, Missouri, Independence and Lee’s Summit being the top three in population. The Kansas City Metropolitan Area (KCMA) is home to 14 counties with a population now standing at 2,104,509 after a steady growth pattern resulting in an increase overall of 90,774 since 2010.
15,000 per year2013 to 2014
20,000 per year2015 to 2016
In 2016, natural growth and international migration patterns remained consistent; however, there was a spike in domestic migration of 6,693 in one year. The perceived cause of this spike is economic viability. The KCMA is a place of economic mobility and growth, enticing individuals, families, and businesses to relocate here for immense opportunities.
According to the 2013 U.S. Census, the typical population shifts in age occurred due to college attendance (losing some 6,000 18-19 year olds) as larger universities (KU, MU, UCM and K-State) are outside of the Kansas City metro statistical area. The overall incoming migration net gain was still positive by about 1,000. The two largest age ranges of net gain in the 2,000’s were 20-24 and 25-29 within the Kansas City metro area. Missouri’s
Kansas City, Missouri 6,558
Lee’s Summit, Missouri 1,153
Blue Springs, Missouri 376
Grain Valley, Missouri 327
Jackson County Cities Growing the Fastest
=1000 people
With the anticipated influx of senior citizens within the State of Missouri until the year 2030, organizations have the opportunity to increase their volunteer workforce with retirees. Our community will also see an increase in job openings within the industries of home health care, senior living facilities and hospice.
The Hispanic/Latino population is now the largest growing minority population within the workforce. Resources to support language learning, trade job skills training and partnerships with immigration providers will be crucial to successfully serve this population.
Connecting the dots:
senior population, as defined as those age 65 or older, is expected to increase fairly dramatically over the next several years, from less than 15 percent of the state population in 2000 to over 20 percent by 2030. This means that one in five people will be a senior citizen.
Within the areas of race, there have been increases in the Hispanic/Latino (8.7%), Asian (alone) (1.8%) and Native American/Other Pacific Native (alone) (.5%) racial groups. Caucasian remains the majority, closely followed by African American and Latino/Hispanic racial groups. Jackson County continues to hold the largest ratio of diversity among the 14 counties that make up the Kansas City metro area. Average age: native born 36.1, foreign-born 40.7.

10 © 2017 Goodwill of Western Missouri & Eastern Kansas
Empl
oym
ent
There are 367,099 in the civilian labor force in Jackson County. 15,441 were unemployed as of April 2017.
Unemployment remains one of the key indicators to most regarding the vitality of a geographic location’s economic success. As evident by the chart below, Jackson County’s unemployment rate has trended downward parallel with that of the State of Missouri, however it remains slightly higher than the State of Missouri. All trends point to the unemployment rate as a sign of increased job availability and people finding work. Unemployment, in combination with poverty rates, under employment rates, and the number of community organizations working to serve those in need, beg for a closer look.
Unemployment Rates
Missouri4.5% April 20163.7% April 2017
United States5.0% April 20164.7% April 2017
Although the numbers of people in need are decreasing overall, those still in need of employment are at alarming risk for remaining unemployed/underemployed permanently, given that the large majority of those individuals and families face co-occurring barriers to employment. Examples of these barriers include: lack of skills/education, chronic health issues, age, immigration status and disability discrimination.
Programs must provide holistic, wrap-around services to address the comprehensive issues prohibiting individuals from finding work.
0
100,000
200,000
300,000
400,000
Janu
ary
Febr
uary
Mar
ch
April
May
June
July
Augu
st
Sept
embe
r
Octo
ber
Nove
mbe
r
Dece
mbe
r
346,
911
348,
391
349,
052
352,
841
353,
160
351,
388
350,
677
355,
121
350,
639
350,
246
352,
869
351,
803
= Number of people employed* = Number of people and % of labor force unemployed*
16,1
84 (4
.4%
)
15,8
15 (4
.3%
)
18,0
07 (4
.9%
)
19,1
19 (5
.2%
)
21,0
50 (5
.7%
)
22,3
21 (5
.9%
)
19,6
16 (5
.3%
)
18,3
02 (5
%)
17,9
06 (4
.9%
)
19,4
48 (5
.3%
)
19,3
13 (5
.3%
)
17,7
59 (4
.9%
)
*Number of people in the labor force varied each month
Jackson County Local Area Unemployment Statistics 2016

11© 2017 Goodwill of Western Missouri & Eastern Kansas
Empl
oym
ent
The graph below illustrates the “Missouri Forgotten Middle”, a current crisis in Missouri. Middle-skill jobs which require education beyond high school but not a four-year degree make up the largest part of America’s and Missouri’s labor market.
Key industries in Missouri are unable to find enough sufficiently trained workers to fill these jobs. 54% of all Missouri jobs in 2012 were middle-skill jobs. 47% of the state’s labor force are trained to the middle-skill level. We have a gap.
Projections for 2010-2020 estimate that 53% of the jobs will remain in the middle-skill arena continuing this skills gap. These statistics do not simply call attention to those who need to enter the workforce but also to those that are currently employed. Nearly one in four low-skilled workers are actually supervising others.
While the statistics show middle-skilled workers are in shortage, it is not for lack of desire by our low-skilled labor force. According to the National Skills Coalition, nearly one in three low-skilled workers would like to participate in a training or remedial training program to advance their skills but often feel there is no time or supervisory support to do so.
Low-skilled workers have one of the highest retention rates among staff, often staying in jobs for a minimum of three years or longer (42%).
This information tells us that with the right combination of employer support and training programs the skills gap could be bridged.
Missouri’s Forgotten Middle

12 © 2017 Goodwill of Western Missouri & Eastern Kansas
Empl
oym
ent
Job Outlook versus Job Opportunity - Supporting the Middle Skills GapThe series of charts below outline for our Workforce Innovation and Opportunity Act Region the local job outlook projections and current job openings in Kansas City and the State of Missouri as a whole. Kansas City is expected to host more than 170,000 new jobs from now until 2024. The discrepancy for those in the middle-skill gap continues to be that the occupation outlooks offer positions within the high demand industries but at skill levels out of reach.
This information supports the notion that there is a gap between where the skills of the labor force are and where they need to be to earn a living wage job within in the local economy. The job openings are most opften within high demand industries but at entry level. If we do not offer skills training, those workers will remain at entry level and the projected outlookk positions will go unfilled; continuing the gap here locally.
Top Job Outlook – Kansas City
Occupation TitleTotal
OpeningsAverage Wages
Registered Nurses 4,429 $63,941
General & Operations Managers 3,538 $106,351
Team Assemblers 2,458 $45,734
Accountants and Auditors 2,118 $71,550
Personal Care Aides 1,806 $20,773
Construction Laborers 1,603 $41,653
Software Developers, Applications 1,376 $95,343
Sales Reps, Wholesale & Mfg 1,200 $60,859
Supervisors of Office/ Admin Support 1,175 $57,970
Computer System Analysts 1,049 $88,317
Top Job Openings – Kansas City
Occupation TitleTotal
OpeningsAverage Wages
Combined Food Prep & Service Workers 6,630 $19,026
Retail Salespersons 5,764 $23,585
Waiters and Waitresses 5,738 $20,315
Cashiers 5,716 $20,778
Registered Nurses 4,429 $63,941
Customer Service Representatives 3,621 $34,920
General & Operations Managers 3,538 $106,351
Office Clerks, General 2,596 $32,759
Stock Clerks & Order Fillers 2,497 $25,609
Team Assemblers 2,458 $45,734
Top Job Openings – Statewide
Occupation TitleTotal
OpeningsAverage Wages
Retail Salesperson 34,062 $25,636
Combined Food Prep & Service Workers 33,524 $19,160
Waiters and Waitresses
31,650 $20,376
Registered Nurses
26,749 $19,389
25,304 $59,145
Customer Service Representatives 18,621 $33,250
General & Operations Managers 16,699 $100,506
Nursing Assistants 16,039 $23,869
Office Clerks, General 14,478 $30,210
Cashiers
Top Job Outlook – Statewide
Occupation TitleTotal
OpeningsAverage Wages
Registered Nurses 25,304 $59,145
General & Operations Managers 16,699 $100,506
Accountants and Auditors 9,206 $71,485
Managers, All Others 4,614 $106,627
Computer Systems Analysts 4,028 $89,754
Software Developers, Applications 3,813 $92,663
Physical Therapists 2,219 $79,119
Medical and Health Serv Managers 2,032 $102,252
Computer & Information Sys Managers 1,740 $125,809
13© 2017 Goodwill of Western Missouri & Eastern Kansas
Empl
oym
ent
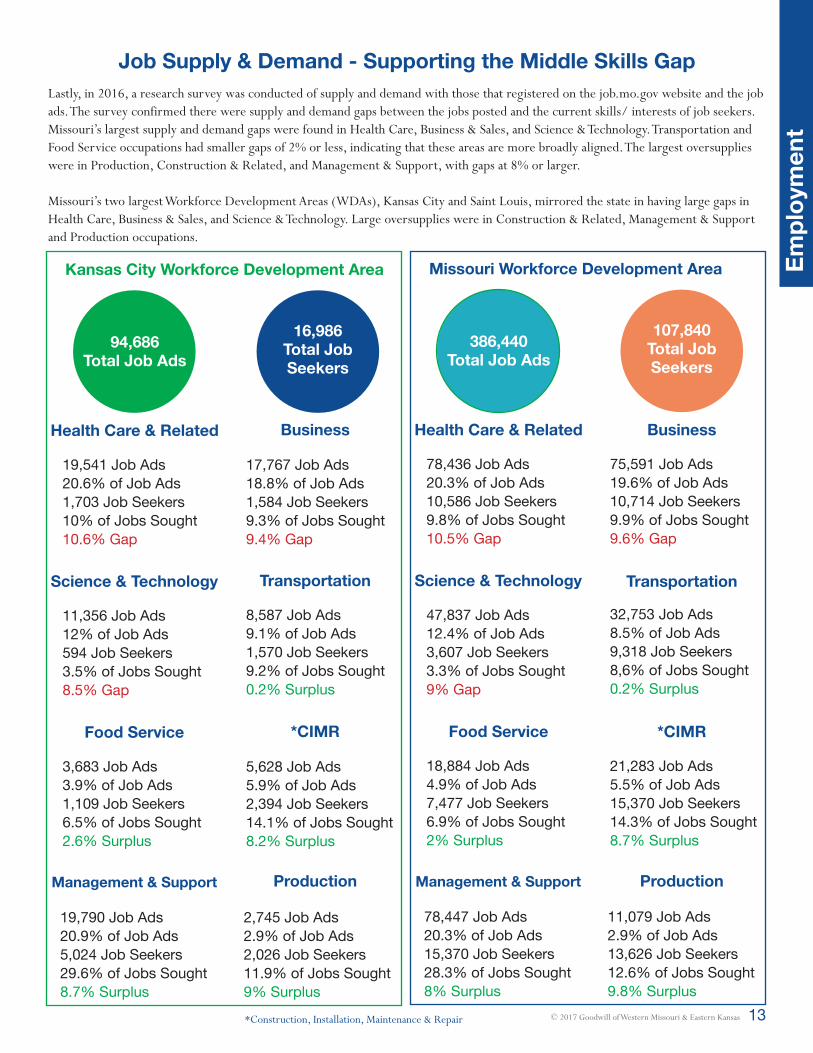
Job Supply & Demand - Supporting the Middle Skills GapLastly, in 2016, a research survey was conducted of supply and demand with those that registered on the job.mo.gov website and the job ads. The survey confirmed there were supply and demand gaps between the jobs posted and the current skills/ interests of job seekers. Missouri’s largest supply and demand gaps were found in Health Care, Business & Sales, and Science & Technology. Transportation and Food Service occupations had smaller gaps of 2% or less, indicating that these areas are more broadly aligned. The largest oversupplies were in Production, Construction & Related, and Management & Support, with gaps at 8% or larger.
Missouri’s two largest Workforce Development Areas (WDAs), Kansas City and Saint Louis, mirrored the state in having large gaps in Health Care, Business & Sales, and Science & Technology. Large oversupplies were in Construction & Related, Management & Support and Production occupations.
94,686Total Job Ads
386,440Total Job Ads
16,986Total JobSeekers
107,840Total JobSeekers
Kansas City Workforce Development Area Missouri Workforce Development Area
Health Care & Related Health Care & Related
Food Service Food Service
Business Business
*CIMR *CIMR
Science & Technology Science & Technology
Management & Support Management & Support
Transportation Transportation
Production Production
19,541 Job Ads 20.6% of Job Ads1,703 Job Seekers10% of Jobs Sought10.6% Gap
78,436 Job Ads 20.3% of Job Ads10,586 Job Seekers9.8% of Jobs Sought10.5% Gap
3,683 Job Ads 3.9% of Job Ads1,109 Job Seekers6.5% of Jobs Sought2.6% Surplus
18,884 Job Ads 4.9% of Job Ads7,477 Job Seekers6.9% of Jobs Sought2% Surplus
17,767 Job Ads18.8% of Job Ads1,584 Job Seekers9.3% of Jobs Sought9.4% Gap
75,591 Job Ads19.6% of Job Ads10,714 Job Seekers9.9% of Jobs Sought9.6% Gap
5,628 Job Ads5.9% of Job Ads2,394 Job Seekers14.1% of Jobs Sought8.2% Surplus
21,283 Job Ads5.5% of Job Ads15,370 Job Seekers14.3% of Jobs Sought8.7% Surplus
11,356 Job Ads12% of Job Ads594 Job Seekers3.5% of Jobs Sought8.5% Gap
47,837 Job Ads12.4% of Job Ads3,607 Job Seekers3.3% of Jobs Sought9% Gap
19,790 Job Ads20.9% of Job Ads5,024 Job Seekers29.6% of Jobs Sought8.7% Surplus
78,447 Job Ads20.3% of Job Ads15,370 Job Seekers28.3% of Jobs Sought8% Surplus
8,587 Job Ads9.1% of Job Ads1,570 Job Seekers9.2% of Jobs Sought0.2% Surplus
32,753 Job Ads8.5% of Job Ads9,318 Job Seekers8,6% of Jobs Sought0.2% Surplus
2,745 Job Ads2.9% of Job Ads2,026 Job Seekers11.9% of Jobs Sought9% Surplus
11,079 Job Ads2.9% of Job Ads13,626 Job Seekers12.6% of Jobs Sought9.8% Surplus
*Construction, Installation, Maintenance & Repair

14 © 2017 Goodwill of Western Missouri & Eastern Kansas
Empl
oym
ent
A Real Life Example in our CommunityNexus, a partnership with the Greater Kansas City Business Leadership Network, Vocational Rehabilitation and a host of community organizations, set out on a mission to provide 700 job opportunities to those in our community with different abilities by September of 2017.
In 2015 the initiative was successful in providing 215 job opportunities and in 2016, 256 opportunities. The majority of opportunities were within the $8.00-$9.50 an hour range with the second largest tier in the $9.50-$12.00 an hour wage range. Industries included customer service, food service, facilities, clerical, retail, and warehouse. At this time, we do not have data on job retention or wage progression statistics from this initiative.
Middle Skills Target Industries: Life Sciences Information Technology Advanced Manufacturing Auto Mechanics Labor Union Trades Engineering and Architecture
Business InfrastructureNumerous Fortune 1,000 companies have located operations in the area. C ompanies with headquarters in the Kansas City area include:
DST Systems Ferrellgas Partners Industry Garmin International Great Plains Energy H&R Block Kansas City Southern Seaboard
There are 15 Fortune 5,000 companies in the Kansas City metro area. Of these, healthcare industry services, motor vehicle manufacturing and government are the largest industries.
Cerner Corporation Children’s Mercy Health Systems Ford Motor Company Fort Leavenworth Hallmark Cards HCA Mid-America St. Luke’s Hospital of Kansas City Sprint State(s) of Missouri and Kansas
Many of the current and newcomers to the Kansas City metro area are production and warehouse industry businesses. Amazon is among the newest businesses to locate a fulfillment center locally. Others include Fed Ex, Aramark and Honeywell.
Kansas City supports small businesses, as it is ranked 26th among the nation’s 938 metropolitan areas. Small business makes up 97% of the 50,129 businesses; 48,575 have fewer than 110 employees. It is home to a variety of arts and entertainment districts such as 18th & Vine, The Crossroads, and The Jazz District. Missouri ranks in the top 15 states for charitable giving over the last five years, with Kansas City being in the top 20 cities per capita of philanthropic generosity.
Kansas City is home to a wealth of development projects and a vibrant entrepreneurial community. The Greater Kansas City Chamber of Commerce has a goal of making Kansas City the most entrepreneurial city in the United States. During the course of the CNA, Goodwill was able to learn about such ecosystem supports to this goal as The KC Startup Foundation, The KC Startup Village
and KC Source Link. In addition, Kansas City is home to projects like The Kauffman Foundation’s 1 Million Cups, a program designed to educate, engage and connect entrepreneurs with their communities.
Goodwill is equally eager to invest and engage in this arena, as the 2017 State of Entrepreneurship report highlighted the significant impact that disproportionate barriers facing disadvantaged entrepreneurs have on the U.S. economy. If minorities started and owned businesses at the same rate as non-minorities do, the United States would have more than 1 million additional employer businesses and approximately 9.5 million more jobs in the economy. Regardless of race, women are half as likely as men to own employer businesses. Though not a new trend, the persistent gender business gap costs the United States 1.7 million additional businesses. There is a need for minority-owned and operated businesses in the United States and in our local community. Goodwill can help connect people to these opportunities and give them the tools to be successful within the startup ecosystem.
15© 2017 Goodwill of Western Missouri & Eastern Kansas
Non
profi
t Sec
tor
Nonprofit Sector
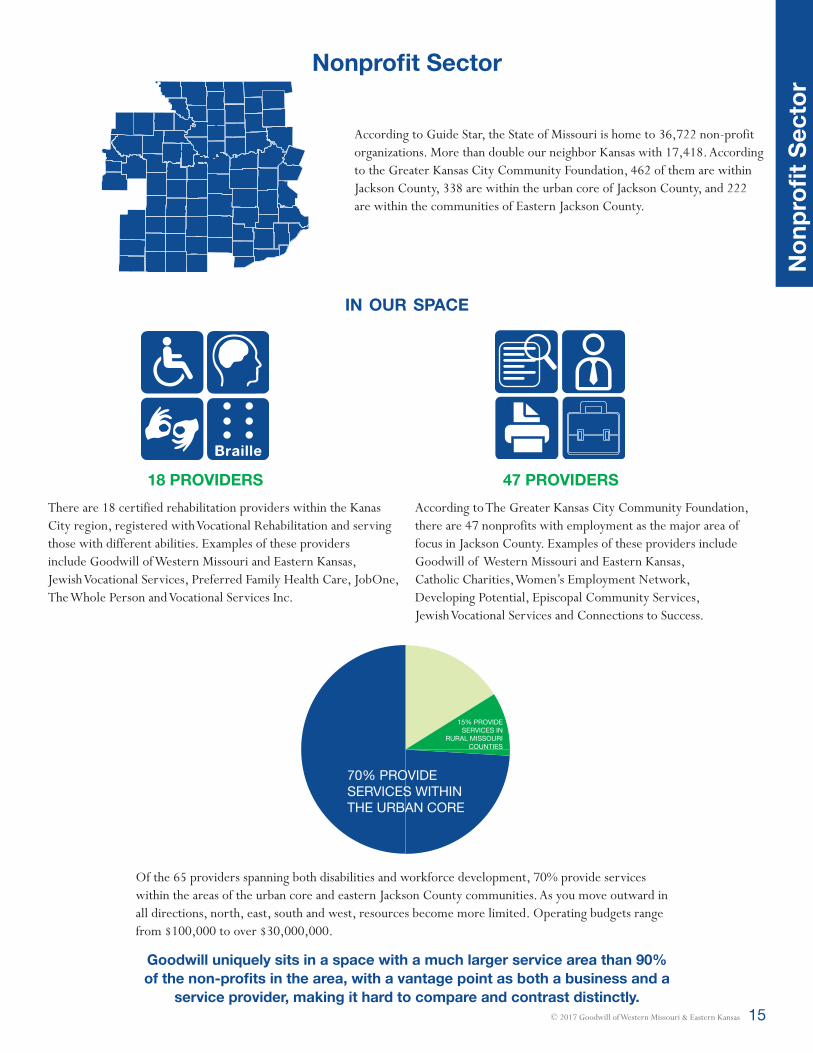
According to Guide Star, the State of Missouri is home to 36,722 non-profit organizations. More than double our neighbor Kansas with 17,418. According to the Greater Kansas City Community Foundation, 462 of them are within Jackson County, 338 are within the urban core of Jackson County, and 222 are within the communities of Eastern Jackson County.
in our space
There are 18 certified rehabilitation providers within the Kanas City region, registered with Vocational Rehabilitation and serving those with different abilities. Examples of these providers include Goodwill of Western Missouri and Eastern Kansas, Jewish Vocational Services, Preferred Family Health Care, JobOne, The Whole Person and Vocational Services Inc.
According to The Greater Kansas City Community Foundation, there are 47 nonprofits with employment as the major area of focus in Jackson County. Examples of these providers include Goodwill of Western Missouri and Eastern Kansas, Catholic Charities, Women’s Employment Network, Developing Potential, Episcopal Community Services, Jewish Vocational Services and Connections to Success.
18 PROVIDERS 47 PROVIDERS
Of the 65 providers spanning both disabilities and workforce development, 70% provide services within the areas of the urban core and eastern Jackson County communities. As you move outward in all directions, north, east, south and west, resources become more limited. Operating budgets range from $100,000 to over $30,000,000.
Goodwill uniquely sits in a space with a much larger service area than 90% of the non-profits in the area, with a vantage point as both a business and a
service provider, making it hard to compare and contrast distinctly.
70% PROVIDESERVICES WITHINTHE URBAN CORE
15% PROVIDESERVICES IN
RURAL MISSOURICOUNTIES
16 © 2017 Goodwill of Western Missouri & Eastern Kansas
Non
profi
t Sec
tor
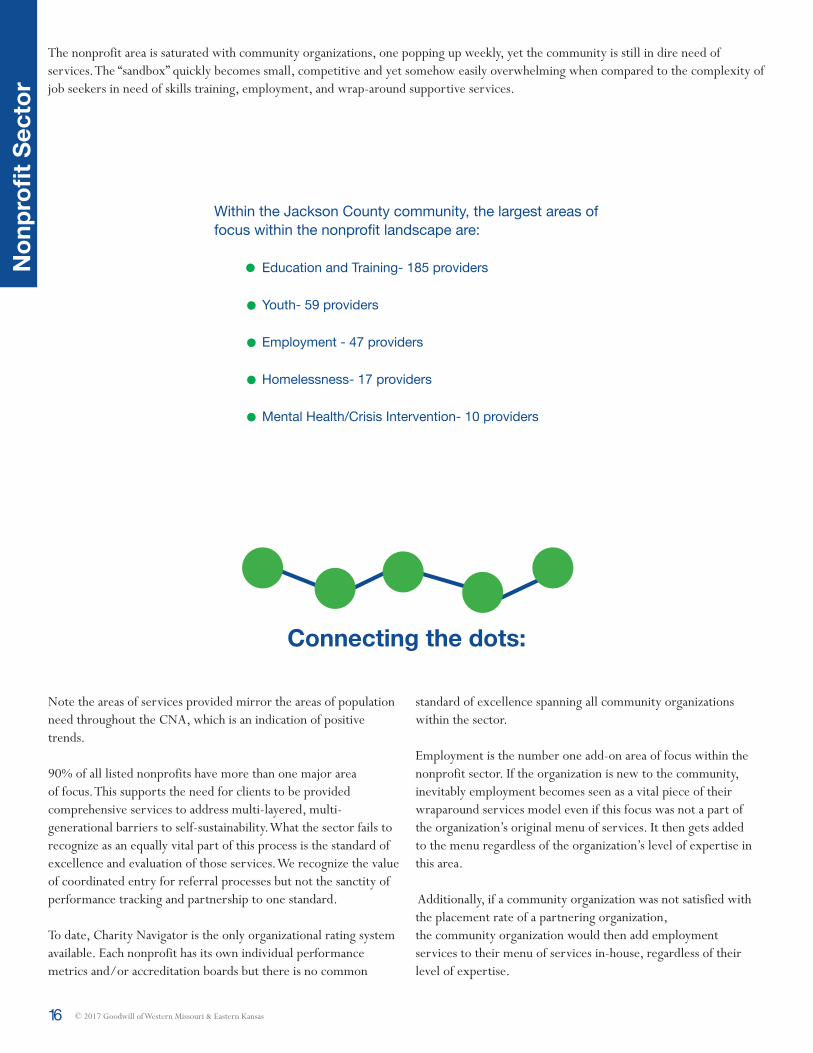
The nonprofit area is saturated with community organizations, one popping up weekly, yet the community is still in dire need of services. The “sandbox” quickly becomes small, competitive and yet somehow easily overwhelming when compared to the complexity of job seekers in need of skills training, employment, and wrap-around supportive services.
Within the Jackson County community, the largest areas of focus within the nonprofit landscape are: Education and Training- 185 providers Youth- 59 providers
Employment - 47 providers Homelessness- 17 providers Mental Health/Crisis Intervention- 10 providers
Connecting the dots:
Note the areas of services provided mirror the areas of population need throughout the CNA, which is an indication of positive trends.
90% of all listed nonprofits have more than one major area of focus. This supports the need for clients to be provided comprehensive services to address multi-layered, multi-generational barriers to self-sustainability. What the sector fails to recognize as an equally vital part of this process is the standard of excellence and evaluation of those services. We recognize the value of coordinated entry for referral processes but not the sanctity of performance tracking and partnership to one standard.
To date, Charity Navigator is the only organizational rating system available. Each nonprofit has its own individual performance metrics and/or accreditation boards but there is no common
standard of excellence spanning all community organizations within the sector.
Employment is the number one add-on area of focus within the nonprofit sector. If the organization is new to the community, inevitably employment becomes seen as a vital piece of their wraparound services model even if this focus was not a part of the organization’s original menu of services. It then gets added to the menu regardless of the organization’s level of expertise in this area.
Additionally, if a community organization was not satisfied with the placement rate of a partnering organization, the community organization would then add employment services to their menu of services in-house, regardless of their level of expertise.
17© 2017 Goodwill of Western Missouri & Eastern Kansas
Educ
atio
n
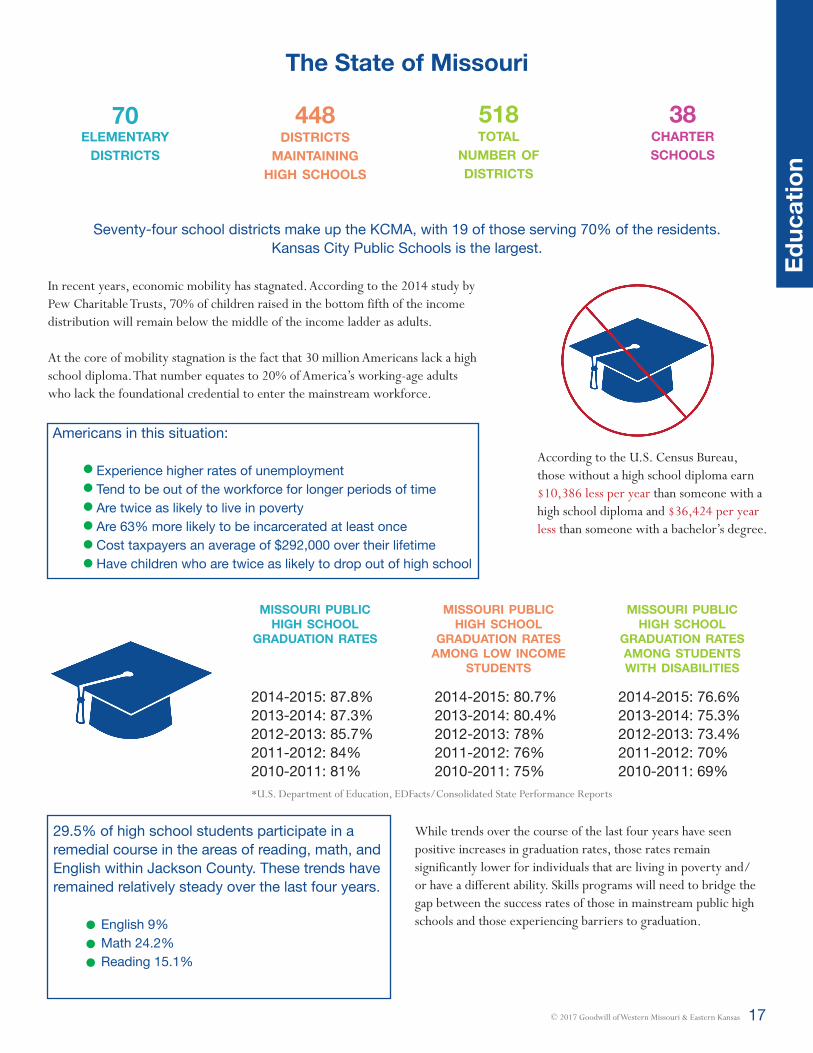
The State of Missouri
70 448 518 38elementary
districtsdistricts
maintaininghigh schools
totalnumber of districts
charterschools
Seventy-four school districts make up the KCMA, with 19 of those serving 70% of the residents. Kansas City Public Schools is the largest.
In recent years, economic mobility has stagnated. According to the 2014 study by Pew Charitable Trusts, 70% of children raised in the bottom fifth of the income distribution will remain below the middle of the income ladder as adults.
At the core of mobility stagnation is the fact that 30 million Americans lack a high school diploma. That number equates to 20% of America’s working-age adults who lack the foundational credential to enter the mainstream workforce.
Americans in this situation:
Experience higher rates of unemployment Tend to be out of the workforce for longer periods of time Are twice as likely to live in poverty Are 63% more likely to be incarcerated at least once Cost taxpayers an average of $292,000 over their lifetime Have children who are twice as likely to drop out of high school
According to the U.S. Census Bureau, those without a high school diploma earn $10,386 less per year than someone with a high school diploma and $36,424 per year less than someone with a bachelor’s degree.
missouri public high school
graduation rates
missouri public high school
graduation ratesamong low income
students
missouri public high school
graduation ratesamong studentswith disabilities
2014-2015: 87.8%2013-2014: 87.3%2012-2013: 85.7%2011-2012: 84%2010-2011: 81%
2014-2015: 80.7%2013-2014: 80.4%2012-2013: 78%2011-2012: 76%2010-2011: 75%
2014-2015: 76.6%2013-2014: 75.3%2012-2013: 73.4%2011-2012: 70%2010-2011: 69%
29.5% of high school students participate in a remedial course in the areas of reading, math, and English within Jackson County. These trends have remained relatively steady over the last four years.
English 9% Math 24.2% Reading 15.1%
*U.S. Department of Education, EDFacts/Consolidated State Performance Reports
While trends over the course of the last four years have seen positive increases in graduation rates, those rates remain significantly lower for individuals that are living in poverty and/or have a different ability. Skills programs will need to bridge the gap between the success rates of those in mainstream public high schools and those experiencing barriers to graduation.
18 © 2017 Goodwill of Western Missouri & Eastern Kansas
Educ
atio
nA battle for Accreditation: Kansas City Public Schools has long struggled with accreditation. From 1985-1999 a United States District Court Judge required KCPS to fund the creation of a number of magnet schools to reverse the “white flight” seen since the 1960’s. During this time facilities and programs improved, yet test scores remained unchanged and integration did not improve. In 2011, the district’s accreditation status was withdrawn.
From the 1980’s to 2000’s, some 30 buildings were closed and enrollment numbers plummeted to 18,000 students within the district. A variety of charter schools surfaced over the course of this time period offering another educational opportunity,
however many of the Kansas City residents could not afford the premier tuition costs of the charter, parochial or private schools. This was a large dilemma for families within the urban core, historic northeast and east side neighborhoods of the KCMA adding to the trauma of the impoverished communities.
As of November 2016, KCPS has been granted full accreditation with approximately 38 schools and roughly 15,000 students within the district. The district remains committed to clawing back for the success of their students and families yet the toll of the educational gaps during the fight for accreditation can be seen in the dropout rates within the district, homeless counts and the continued implications of poverty within these neighborhoods.
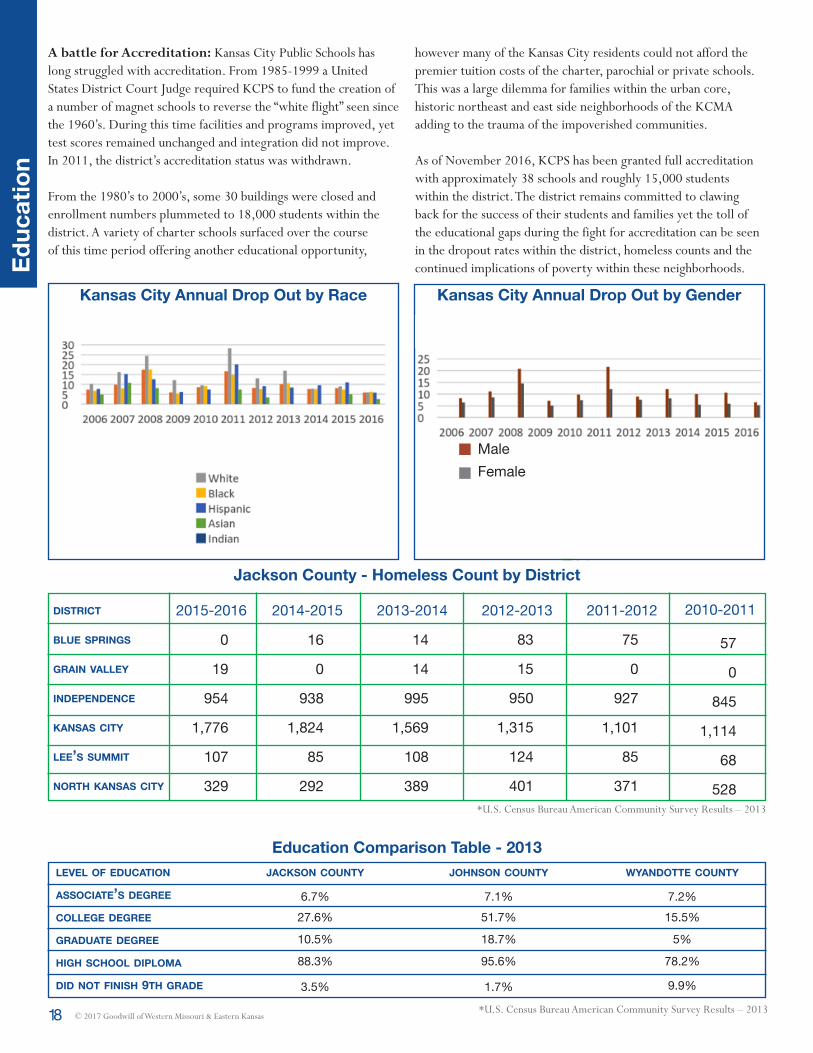
Kansas City Annual Drop Out by GenderKansas City Annual Drop Out by Race
Jackson County - Homeless Count by District
district
blue springs
grain valley
independence
kansas city
lee’s summit
north kansas city
2015-2016 2014-2015 2013-2014 2012-2013 2011-2012 2010-2011
*U.S. Census Bureau American Community Survey Results – 2013
level of education
associate’s degree
college degree
graduate degree
high school diploma
did not finish 9th grade
jackson county johnson county wyandotte county
6.7% 7.1% 7.2%27.6% 51.7% 15.5%
10.5% 18.7% 5%
3.5% 1.7% 9.9%
88.3% 95.6% 78.2%
*U.S. Census Bureau American Community Survey Results – 2013
Education Comparison Table - 2013
MaleFemale
0
19
954
1,776
107
329
16
0
938
1,824
85
292
14
14
995
1,569
108
389
83
15
950
1,315
124
401
75
0
927
1,101
85
371
57
0
845
1,114
68
528

19© 2017 Goodwill of Western Missouri & Eastern Kansas
Income & PovertyMany reports, including the Brookings Public Policy Program Report, state that as of 2009 the Great Recession is officially over, jobs are on the rise and unemployment is on the decline. However, poverty rates continue to hold steady and in some cases increase in the communities around us.
17.6% in Jackson County
14.8% in Missouri
13.5% in United States
Poverty Rates
Average Family Size = 2.65
Jackson CountyMedian Household Income
$48,212
Kansas City Metro Area Poverty Quick Facts
THERE HAS BEEN AN INCREASE OF ROUGHLY
90,000 PEOPLE LIVING IN POVERTY IN THE KC
METRO AREA FROM THE YEAR 2000. ONE-HALF OF
THE INCREASE OCCURRED SINCE 2007.
65%
1 out of 5 children & young adults (under the age of 25) is poor.
Poverty rates doubled or nearly doubled in the suburban areas of Clay,
Johnson, and Platte Counties. By 2010, 1 in 3 area poor
lived in the suburbs.
Jackson County average household income is roughly $15,000 below the median household income level of the KCMA as a whole. Jackson County continues to hold the most diverse of the community’s population, including the most impoverished communities of the historic Northeast, South and Eastside Kansas City neighborhoods. Examples of the neighborhoods hit hardest by these poverty statistics are the six neighborhoods of focus in historic Northeast Kansas City: Independence Plaza, Indian Mound, Lykins, Pendleton Heights, Scarritt Renaissance, and Sheffield.
White females ages 25-34 are the largest group most often experiencing poverty within Jackson County; however, African American and Latino females in this same age range experience a more severe poverty disparity. Hispanic/Latino ethnic minorities are three times more likely than their white counterparts to be experiencing poverty. African American ethnic minorities are five times more likely than their white counterparts to be experiencing poverty.
male average salary
female average salary
$58,299
$41,858
*2015 U.S. Census, supplemental metrics data 2016
Inco
me
& Po
vert
y*U.S. Census Bureau American Community Survey Results – 2013
*U.S. Census Bureau American Community Survey Results – 2013

20 © 2017 Goodwill of Western Missouri & Eastern Kansas
Inco
me
& Po
vert
y
There is a definite salary discrepancy between males and females within Jackson County. Females are paid nearly $17,000 less in average annual salary. Among common jobs within Jackson County, this discrepancy ranges from $5,000 to upwards of $20,000 annually depending on the job. Similarly, females are far more likely to be living in poverty than males in Jackson County; specifically, females ages 18-34. These figures, in conjunction with the statistics around females as single parent head of households, make this population an ideal target for employment services and skills training.
Poverty has spread into smaller metropolitan communities, rural areas and finds itself residing most comfortably at a rapid increase
in the suburbs. Scariest of all, it continues to hit those already experiencing poverty within poor communities, creating the most marginalized populations right here in the KCMA.
In the United States, between 2000 and 2009, the number of people living in poverty grew by over 40%. 14 million people lived in neighborhoods with a poverty rate of 40% or more. Of those 14 million, 6.3 million were living in poverty. Where there are poor individuals and families living in areas of poor resources (i.e. food deserts, lack of public transportation systems, businesses, and accredited schools), you have the most marginalized populations. This type of poverty remains the strongest in the historic Northeast, East Side, and South Kansas City areas of Jackson County at almost 45%.
Connecting the dots:

21© 2017 Goodwill of Western Missouri & Eastern Kansas
Jackson County Families & Poverty
Poverty Rate: 17%Male, no wife present
Poverty Rate: 23.7%Married Couple
Poverty Rate: 59.3%Female, no husband present
disability & poverty
Missouri Kansas City
Male: 15.1% Female: 19.8% Male: 17.3% Female: 20.8%
Inco
me
& Po
vert
y
North Andrew County R-VI School District 1,908 372 86
North Kansas City 74 School District 129,877 21,658 2,934
North Platte County R-I School District 4,147 718 57
Oak Grove R-VI School District 11,048 2,325 285
Odessa R-VII School District 12,047 2,161 410
Orrick R-XI School District 2,001 374 59
Osborn R-O School District 759 112 29
Park Hill School District 66,072 11,947 1,049
Pattonsburg R-II School District 1,091 160 40
Platte County R-III School District 23,891 3,981 315
School DistrictEstimated TotalPopulation
Estimated TotalPopulation of Students Age 15-17
Estimated TotalPopulation of Students Age15-17 Living in Poverty & Related to the Head of the Household

22 © 2017 Goodwill of Western Missouri & Eastern Kansas
state of missouri benefit quick facts:70,596 Adults & Children receiving welfare (TANF)
34,756 Children receiving subsidized childcare
13,137 Children in Foster Care
925,157 Individuals enrolled in Missouri Health Net or Children’s Health Insurance Program
37,021 Households receiving Missouri Rental Assistance
17,527 Children enrolled in Head Start programs
African American families were the largest majority of the population receiving supplemental benefits at 47.1% and Caucasian families followed at 44.7%. Of those households receiving benefits, 52.6% had one working member in the last twelve months, 24.4 % had two working members in the last twelve months, and 23% of those households had no working members in the last twelve months.
The State of Missouri saw a 3.4% increase in enrollment for Children’s Health Insurance Program & Medicaid benefits from 2015 to 2016.
Minimum wage versus living wage: 2016 poverty guidelines reflect an annual income of $11,880 or less for a family of one. For a family of four, the annual income is $24,300 or less. Someone making minimum wage at $7.65 an hour will earn roughly $15,080 annually. This figure draws attention to the lack of support for individuals and families within the working class, minimum wage structure.
The living wage is derived taking into account basic needs (food, shelter, healthcare, transportation, and childcare). It is an hourly rate an individual must earn if they are the sole provider, supporting a family and working full time. This information is assessed when an individual comes into workforce services for the purpose of creating a plan to thrive within a job market and should be taken into consideration when assessing the market value of a job opportunity.
HourlyWage
1 Adult 1 Adult1 Child
1 Adult2 Children
1 Adult3 Children
2 Adults1 Working
2 Adults1 Working1 Child
2 Adults1 Working2 Children
Living Wage
PovertyWage
MinimumWage
$10.45
$ 5.00
$ 7.65
$21.59
$ 7.00
$ 7.65
$26.77
$ 9.00
$ 7.65
$33.40
$11.00
$ 7.65
$17.63
$7.00
$ 7.65
$21.84
$ 9.00
$ 7.65
$24.70
$13.00
$ 7.65
*Source MIT Living Wage Calculator Information
Connecting the dots: For a family of three living on state benefits, it means they are living on an income of $3,097 a month with roughly $292 dollars in TANF assistance. What priorities would be abandoned if you were living on this level of income?
Inco
me
& Po
vert
y
CLAY
JACKSON
JOHNSON
CASS
PLATTE
WYANDOTTE
MIAMI
LEAVENWORTH
Population in Poverty (2010-2015)
1 dot = 20 people
23© 2017 Goodwill of Western Missouri & Eastern Kansas
Popu
latio
ns in
Nee
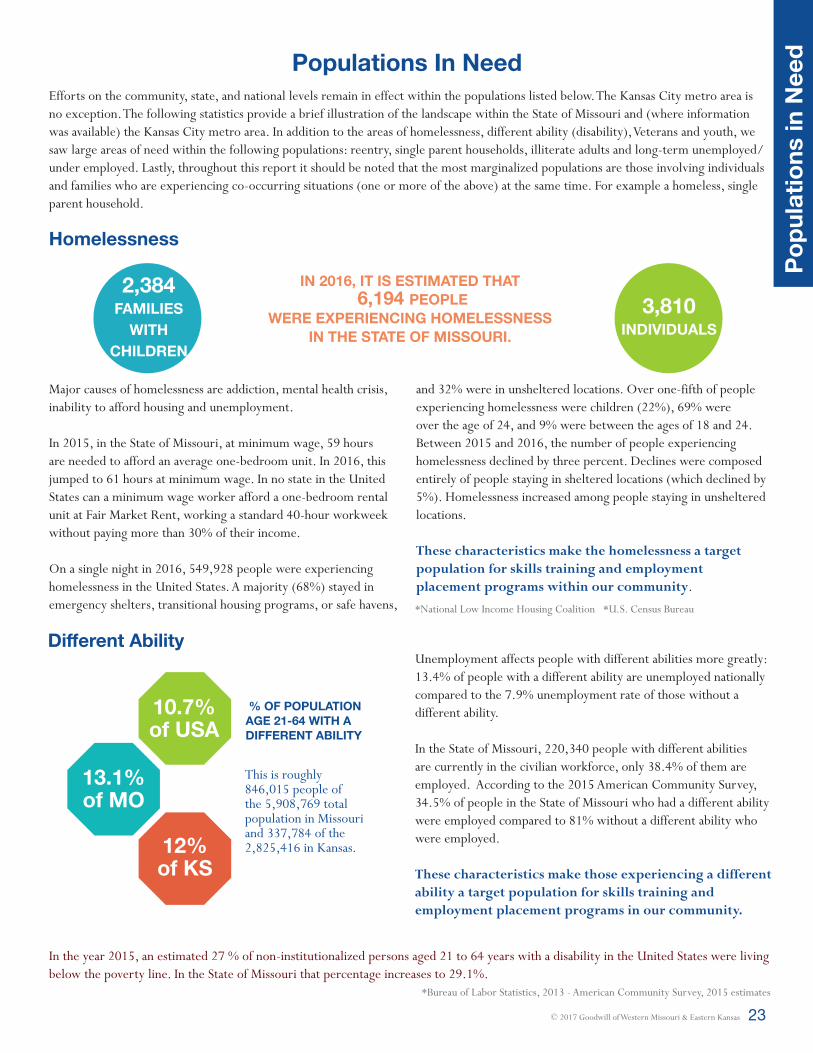
dPopulations In NeedEfforts on the community, state, and national levels remain in effect within the populations listed below. The Kansas City metro area is no exception. The following statistics provide a brief illustration of the landscape within the State of Missouri and (where information was available) the Kansas City metro area. In addition to the areas of homelessness, different ability (disability), Veterans and youth, we saw large areas of need within the following populations: reentry, single parent households, illiterate adults and long-term unemployed/under employed. Lastly, throughout this report it should be noted that the most marginalized populations are those involving individuals and families who are experiencing co-occurring situations (one or more of the above) at the same time. For example a homeless, single parent household.
Homelessness
2,384families
withchildren
*National Low Income Housing Coalition *U.S. Census Bureau
in 2016, it is estimated that 6,194 people
were eXperiencing homelessness in the state of missouri.
3,810individuals
Major causes of homelessness are addiction, mental health crisis, inability to afford housing and unemployment.
In 2015, in the State of Missouri, at minimum wage, 59 hours are needed to afford an average one-bedroom unit. In 2016, this jumped to 61 hours at minimum wage. In no state in the United States can a minimum wage worker afford a one-bedroom rental unit at Fair Market Rent, working a standard 40-hour workweek without paying more than 30% of their income.
On a single night in 2016, 549,928 people were experiencing homelessness in the United States. A majority (68%) stayed in emergency shelters, transitional housing programs, or safe havens,
and 32% were in unsheltered locations. Over one-fifth of people experiencing homelessness were children (22%), 69% were over the age of 24, and 9% were between the ages of 18 and 24. Between 2015 and 2016, the number of people experiencing homelessness declined by three percent. Declines were composed entirely of people staying in sheltered locations (which declined by 5%). Homelessness increased among people staying in unsheltered locations.
These characteristics make the homelessness a target population for skills training and employment placement programs within our community.
Different Ability
10.7%of USA
13.1%of MO
12%of KS
% of population age 21-64 with a different ability
In the year 2015, an estimated 27 % of non-institutionalized persons aged 21 to 64 years with a disability in the United States were living below the poverty line. In the State of Missouri that percentage increases to 29.1%.
This is roughly 846,015 people of the 5,908,769 total population in Missouri and 337,784 of the 2,825,416 in Kansas.
Unemployment affects people with different abilities more greatly: 13.4% of people with a different ability are unemployed nationally compared to the 7.9% unemployment rate of those without a different ability.
In the State of Missouri, 220,340 people with different abilities are currently in the civilian workforce, only 38.4% of them are employed. According to the 2015 American Community Survey, 34.5% of people in the State of Missouri who had a different ability were employed compared to 81% without a different ability who were employed.
These characteristics make those experiencing a different ability a target population for skills training and employment placement programs in our community.
*Bureau of Labor Statistics, 2013 - American Community Survey, 2015 estimates

24 © 2017 Goodwill of Western Missouri & Eastern Kansas
Popu
latio
ns in
Nee
d
Veterans Missouri ranks number 15 in Veteran population with a population total of 488,220. 39,000 of those are women Veterans and 227,000 are 65 years or older. There are 45,503 Veterans within Jackson County. The majority of Veterans are served through the Veterans Administration locally within the state’s five in-care patient centers and 36 out-care patient centers.
As of 2016, Bureau of Labor Statistics estimates 49.9% of the Veteran civilian labor workforce 18-years or older were employed.
397 55
164 27
Veterans were homeless or had previously been
homeless in Jackson County.
was the average age of the Veterans surveyed within the
HUD-VASH program.
were employable. were employed full-time.
At the time of a local survey conducted by the Veterans Administration (VA), according to the U.S. Census:
*Veterans Administration Community Survey 2016
Youth11.3% of the labor workforce are unemployed youth ages 16-24. This number increases drastically over the period of April to July when young people are in search of summer employment. Youth make up roughly 53.2% of the total population.
The breakdown of America’s family unit continues to be a large factor in childhood and young adult poverty. A side effect of this breakdown, America’s foster care system continues to struggle in preparing young adults for self-sufficiency.
Studies show the period of transition from foster care into independent adulthood is
the period of greatest risk for homelessness.
1/5 ofhomelesspopulationis children
1/5 ofchildren
are living inpoverty
Jackson County Youth Removed into Foster Care
2008 2009 2010 2011 2012
1,818 1,804 1,992 2,245 2,407
Additionally, domestic violence due to trauma, poverty, and stress of limited family resources continues to be a large contributing factor to child poverty.
In Jackson County, from October 2015 to September 2016, 11,146 children were the subject of maltreatment reports. Of 401 victim reports, 129 of those or 32.2% were moved into the foster care system.
With the uncertainty of home life, and the movement of school-life it is not uncommon that children and teens often face additional challenges to obtaining their high school education and earning employment.
These factors make them a target population for skills training and employment placement programs.
year
you
th

25© 2017 Goodwill of Western Missouri & Eastern Kansas
Popu
latio
ns in
Nee
dOver the course of the CNA, the following populations surfaced within the community conversations and one-to-one community interviews. Again, the statistics provided are intended to illustrate a picture of the landscape within the State of Missouri and (when information was available) the Kansas City metro area.
Reentry19,000 inmates are returned to the State of Missouri each year. 2,239 are reentered into the Kansas City metro area, the bulk of whom will be released under supervision in Jackson County. Expectations of their probation and parole include securing housing, employment, education, and training. In addition, these individuals must meet the required reoccurring meetings with their probation and parole officers.
Kansas City metro area released 1,911 male inmates and 328 female inmates in 2016, with the largest ethnic group being Caucasian at 1,156 followed by African American at 658. *State of Missouri Reentry Statistics
48% 55%
48% of the population that leaves the prison system without a high school diploma or GED will return to prison within 2 years.
This rate jumps to 55% if the inmate has no promise of employment.
Connecting the dots: This population continues to grow. The pipeline of offfenders will increase unemployment rates and add to the middle skills gap unless efforts are successful in rehabilitating ex-offenders back into the community. These characteristics make those reentering our communities a target population for skills training and employment programs.
In support of the above statistics, during the course of the CNA community conversations, 59% of the survey respondents marked “single, never married” on the demographics form. Of the respondents, 85% of them were living on $25,000 or less annually in the last twelve months. These characteristics make single parent households a target population for skills training and employment programs in our community.
Single Parent Household
Single parent homes make up 28.5% of the population in the United States. In Jackson County, that number rises to 37%.
Families headed by a single female are four-times more likely to be living in poverty.Single parent families with children account for nearly 60% of the area’s poor families.
Families with children and headed by a single mother have a poverty rate of nearly 40%. For single fathers, the poverty rate is 20%.

26 © 2017 Goodwill of Western Missouri & Eastern Kansas
Popu
latio
ns in
Nee
d Illiterate AdultsThe Missouri State Assessment of Adult Literacy (SAAL) report defines literacy as an individual’s ability to read, write, and speak in English, compute, and solve problems, at levels of proficiency necessary to function on the job, in the family of the individual, and in society.
of missouri adults have reading comprehension
skills at or below the basic skill level
of missouri adults are at or below
the basic skills level in document literacy
of missouri adults are at or below the basic skill level of
mathematical literacy.
According to the Missouri State Assessment of Adult Literacy (SAAL) conducted in 2003:
*Missouri Department of Elementary and Secondary Education, U.S. Census 2000
35% 26% 49%
Based on the 2000 Census, approximately 756,515 Missouri adults aged 16 years and older are not enrolled in school and do not possess a high school credential. This represents 22.11% of the total population of the State of Missouri.
As a real-life example in our community, during the course of the CNA while interviewing a member of the Literacy KC team, it was noted that roughly 40% of the clients served have a high school diploma yet are in need of reading or remedial reading services. 40% is an extremely large number for those who are ‘progressing’ through the public school systems and/or have graduated from the public school systems.
These characteristics make illiterate adults a target population for skills training and employment placement programs.
Long-term Unemployed/Underemployed
The long-term unemployed statistics remain highest within the groups of:
White males, 45-54 with a disability or criminal background
Minority females, 35-44 with children
Individuals with co-occurring barriers to employment: mental health, drug abuse, age, reliable transportation and childcare challenges
Unemployment rates have decreased over time yet consistently hover around 5%. Many of these individuals have been unemployed for more than four weeks and far more for upwards of twenty weeks without success in finding employment.
The long-term unemployed continues to be a population the service sector struggles to provide resources for, as they often have co-occurring barriers to employment such as substance abuse, legal history, illiteracy and poor work history. In addition, the long-term unemployed often face discrimination due to age and their disability status. Those underemployed have employment that does not meet their basic needs yet do not qualify for public benefit supports.
These characteristics make those experiencing long-term unemployment a target population for skills training and employment placement programs.
27© 2017 Goodwill of Western Missouri & Eastern Kansas
Perc
eptio
ns
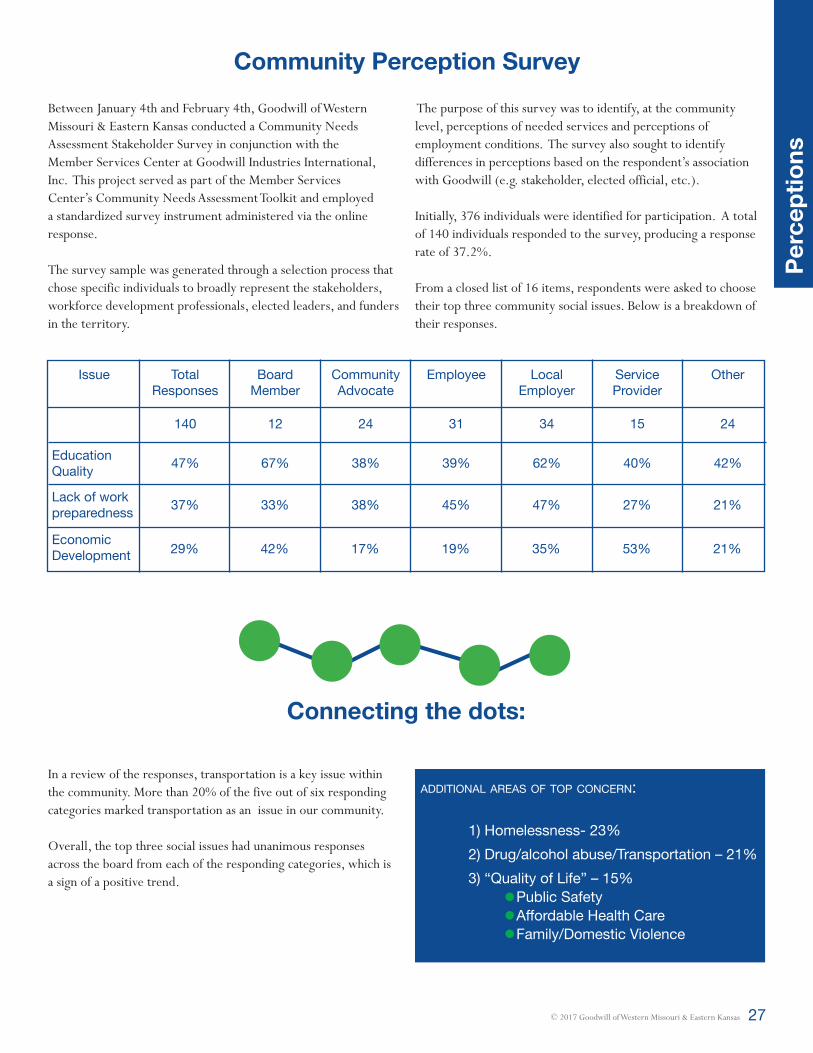
Community Perception SurveyBetween January 4th and February 4th, Goodwill of Western Missouri & Eastern Kansas conducted a Community Needs Assessment Stakeholder Survey in conjunction with the Member Services Center at Goodwill Industries International, Inc. This project served as part of the Member Services Center’s Community Needs Assessment Toolkit and employed a standardized survey instrument administered via the online response.
The survey sample was generated through a selection process that chose specific individuals to broadly represent the stakeholders, workforce development professionals, elected leaders, and funders in the territory.
The purpose of this survey was to identify, at the community level, perceptions of needed services and perceptions of employment conditions. The survey also sought to identify differences in perceptions based on the respondent’s association with Goodwill (e.g. stakeholder, elected official, etc.).
Initially, 376 individuals were identified for participation. A total of 140 individuals responded to the survey, producing a response rate of 37.2%.
From a closed list of 16 items, respondents were asked to choose their top three community social issues. Below is a breakdown of their responses.
Issue
Education Quality
Lack of work preparedness
Economic Development
TotalResponses
47%
37%
29%
140
BoardMember
67%
33%
42%
12
CommunityAdvocate
38%
38%
17%
24
Employee
39%
45%
19%
31
Local Employer
62%
47%
35%
34
Service Provider
40%
27%
53%
15
Other
42%
21%
21%
24
additional areas of top concern: 1) Homelessness- 23% 2) Drug/alcohol abuse/Transportation – 21% 3) “Quality of Life” – 15% Public Safety Affordable Health Care Family/Domestic Violence
Connecting the dots:
In a review of the responses, transportation is a key issue within the community. More than 20% of the five out of six responding categories marked transportation as an issue in our community.
Overall, the top three social issues had unanimous responses across the board from each of the responding categories, which is a sign of a positive trend.
28 © 2017 Goodwill of Western Missouri & Eastern Kansas
Perc
eptio
nsPopulations most in need
Perceived barriers to employment
Perceived workforce services in the community
Populations growing the fastest
Perception Themes
Perceived high-demand occupations
Overall, there was a resounding 60% response rate for the working poor, underemployed as the most in-need population.
Following this were at-risk-youth (47%), unemployed and single parent populations (31%), then the homeless (24%) population.
Within the disability community: Psychiatric/Emotional disability (69%) Developmental disability (45%) Chemical Dependency disability (51%) Learning disability (50%)
Overall, at 45% response rate, the vast majority working poor/underunemployed again rises to the top. However now we see an increase in the response rate in the categories of older workers aged 55+ (30%) and Limited English speaking Residents (26%) followed by at-risk youth (29%) and single parents (28%).
Note the changes in the ranking of populations growing the fastest within the community’s disabled persons; chemical dependency has taken over majority and learning disability has increased in response rate significantly. Chemical Dependency disability (66%) Psychiatric/Emotional disability (65%) Learning disability (43%) Developmental disability (23%)
The top perceived barriers to employment were: Limited living wage employment opportunities (40%) Limited public transportation (38%) Limited skills training programs (37%) Limited childcare opportunities (30%)
The areas of highest growth potential remain in food service, healthcare, construction, janitorial, and maintenance and repair.
Areas of decline were seen as those in office administration, management, agriculture, and sales.
Both manufacturing and transportation had direct contradictions between the board respondents and the service provider respondent groups. The Board Members believed these areas to be in decline whereas the Service Providers believed these areas to be growing. This is an area of assumption to continue to follow.
Respondents were asked to rate the availability of eight workforce services for persons with disadvantages and different abilities in our community. Overall, not one area stands out.
Trends to note: key stakeholders such as employees and local employers ranked lower on average in the areas of job placement and retention services, as well as knowledge around GED and ESL services.
Skills training services ranked highest among the local employer and employee group with comments made by the community advocate group that the training is available but limitedly to the clients truly in need of the skills, resulting in a coordination gap for those in need. The gap was due in large part to the need to work during hours of training availability and/or limited paid training opportunities.
Barrier to Employment
Limited living wage employment opportunities Transportation Childcare Limited skills training programs
High Demand Industries Food service Maintenance and repair Healthcare Janitorial Construction
Populations in Need Unemployed/Underemployed At-risk youth Single parent households Homeless Different Ability
Service Gaps
GED classes ESL classes Paid internship and apprenticeship programs

29© 2017 Goodwill of Western Missouri & Eastern Kansas
Focu
s G
roup
s
Focus Groups Tell AllThe following information was gathered over the course of three focus groups held in the months of March and May. The groups were comprised of community members in the areas of business, training, education and reentry. Those invited to participate in the focus group but unable to be there in person provided feedback via an online survey. A total of 20 respondents participated in the focus group process.
Nine participants representing six businesses were present for the focus group or gave feedback via the online survey tool. Participants spanned small, medium and large businesses and both corporate and nonprofit sectors.
Are you hiring? Is hiring a diverse workforce a priority within your company?
In what areas could Goodwill offer customized training that your company would utilize? In other words, what skills are vital for job seekers?
Hiring those with disadvantages and different abilities is a priority for 100% of those surveyed.
Roughly 70% felt challenged to move from the awareness of their internal diversity hiring campaigns and initiatives to actual hiring of persons with disadvantages and different abilities.
This was often a result of lack of tools to hire appropriately, lack of Human Resource personnel to train hiring managers, the hiring process, and lack of qualified diverse candidates within their hiring pool.
Why not use an organization like Goodwill as a talent resource?
What comes to mind when you hear the words “disadvantaged” or “different ability”?
Entry level positions remain in high demand for small, medium and large size businesses. 85% of employers surveyed stated the culture of their business is one of on-the-job training, should the candidate have the soft skills to successfully complete the application, interview, and initial onboarding processes. Often businesses struggle to:
Create a solid, ongoing pipeline of qualified entry-level candidates Trust the nonprofit sector’s ‘stamp of approval’ as a talent resource provider
Understand the benefits versus costs of hiring a job placement client from an organization like Goodwill
Hiring managers are not always trained as Human Resource professionals and often lack the inclusion training necessary to adequately interview without bias
“Disadvantaged” conjured distinct difference from “different ability”- visions of unclear, poorly dressed and poorly skilled “Different ability” immediately assumed physical impairment with limited knowledge of the variety of documented disabilities General consensus was that those labeled disadvantaged or different ability will take too much time in the onboarding process and after, slowing production and efficiency
Dressing for success
Creation of a resume or work history
Mock Interview
Online application and pre-screening processes
Communication with coworkers, supervisors
Customer service skills spanning multiple industries (transferable)
Basic computer literacy (how to set up an email address, complete an online application)
Businesses Told Us

30 © 2017 Goodwill of Western Missouri & Eastern Kansas
Focu
s G
roup
s High demand industries locally?
How does Goodwill serve as your talent organization?
Retail/Customer Service (could be online)
Packaging, handling, and distribution
Administrative, clerical
Banking
Warehouse, production
Food service
Trainers & Educators Told Us
Goodwill intends to be a premier talent resource for businesses in our community. We believe our clients are part of an underutilized workforce and have every potential to enter, retain, remain and advance their employment goals within our community.
Employers told us this will take:
Building strategic relationships with companies for a long-term talent pool pipeline, rather than just a placement
Ensuring we are matching the talent pool supply with the needs of the employer in high-demand industries
Becoming experts on our partnering businesses systems, processes, and cultures and preparing our clients for such
Providing ongoing support for both the employee and employer through the hiring and onboarding processes
Tell us about the most impactful program aiding job seekers now.
Programs that:
Offer early education, eighth-grade job exploration and work ethic workshops familiarity
Training that starts early and is long-term in focus, preparing for a life within a job market versus one career Priority on the value of education, whatever type of education that client may choose. The client needs to be able to read, write, and look beyond the basics but not necessarily a four-year degree program
How can Goodwill support the above?
Seek to provide a life plan to survive a job market versus a career plan or initial job placement
Offer clients a safe space to fail, seek experience in an industry they believe they are interested in through internships
Recognize the need for: Early job experiences to create long-term behavior patterns in the work world Paid work experiences as early as high school (some students are supporting a family already) Transportation and childcare, clothing supports (wrap around)
Create a strong pipeline of business relationships willing to intern and hire clients
Ensure you are content experts on labor market trends, our clients are counting on your expertise
Know the local businesses and serve as the client ambassador; systems, hiring needs, culture, pay, benefits, training and supports
Businesses Told Us (continued)
Middle Skills IndustriesLife Sciences
Information Technology
Auto Mechanics, Collision, Repair
31© 2017 Goodwill of Western Missouri & Eastern Kansas
Are there successful partnerships between employers and training programs currently working well?
The group mentioned several ideas that started within the community as great ideas but have since ceased and/or begun to operate in silos, serving a very limited number of clients and creating eligibility criteria that are difficult for the majority of clients in need to meet.
In addition, there was again much discussion around the idea of centralization of efforts within the nonprofit community regarding employment efforts. Most in the group had the impression that if their clients were not getting effectively served on the job front the organization began to start their own employment services, creating much duplication with limited awareness if those efforts were any more fruitful than the prior.
Focu
s G
roup
s
Reentry Sector Told Us
Tell us about the demographics of the reentry population.
What does this population need to be successful in our community?
Spans all race and ethnic groups
Spans all ages, 20-50 largest group
Entering younger and younger, large older population due to long sentence served
High population of mental health challenges (determination is still out if these were prior to or during incarceration)
Males are the majority over females
Drug-related crimes
Technology, social media, and basic computer skills
Financial literacy, realistic understanding of job market
Home plan
Literacy training
Job retention supports
Where are the gaps in services?
Transportation
Computer access (based on their offense, e.g. sex offender)
Pipeline to employers, placement services (have training but can’t land job)
Retention services (lose job because they lack continued mentor on job)
Are there training programs offered within the prison system?
There are a variety of training programs offered within the correctional system, depending on which facility an inmate attends. There is a process in which to add a training program based on need and industry demand. Those noted mirrored both the high demand industry list and training needs listed in the other focus groups.
Examples:
Warehouse: forklift, production
Workshops: dressing for success, basic computer classes, resume writing and mock interview

32 © 2017 Goodwill of Western Missouri & Eastern Kansas
Focu
s G
roup
s
Key Takeaway
Focus Group Themes
Community Acceptance
Community-at-large lacks awareness on the vast majority of disabilities beyond physical impairment
Hiring Managers have unpopular bias to populations seen as disadvantaged and with different abilities
Employers need additional training and support to ensure inclusivity and diversity are made a priority throughout the hiring process and the best candidate is selected for the position routinely
Job Preparation
Service Gaps
High Demand Industries
Dressing for success
Creation of a resume or work history
Mock Interview
Communication with coworkers, supervisors
Customer service skills spanning multiple industries (transferable)
Basic computer literacy (how to set up an email address, complete an online application)
Hospitality
Warehouse, production
Construction
Food Service
Retail, Customer service
Mechanics
Disposal services
Pipeline of qualified candidates
Pipeline of open positions beyond entry-level jobs
Coordination of placement services
Coordination of the placement process for client and partners
Each focus group (sector) saw a niche for a large-scale placement vessel within the nonprofit community embedded in the business community- (one organization acting as the face for all organizations completing job placement services in the business arena).
This model would incorporate inclusion training for all Human Resource professionals associated for their respective hiring managers within the company (train the trainer) and:
Common language around ‘different ability’ to strengthen the movement
A well-understood talent pipeline able to keep up with the demand of the business client demand
A strong sales pitch, ROI analysis, business case
Vetted wrap-around client services in preparation for the job (we want the client to be ready to work!)
Be a part of bridging the gap between corporate and service sectors in the community (example Nexus)
Nonprofit sector equally needs qualified talent and should be promoted to clients, seen as a customer of the nonprofit job placement efforts

33© 2017 Goodwill of Western Missouri & Eastern Kansas
Com
mun
ity C
onve
rsat
ions
Community ConversationsSurvey Demographics
Age of Respondent
Highest Level of Education of Respondent
Top Five Zip Codes of Respondents
Race & Ethnicity of RespondentOut of 125 surveys, there were 89 respondents within Jackson County, Missouri. The survey was intended to capture information about community member experiences with employment for the purpose of strengthening Goodwill’s employment programs.
This is a small sample of the Goodwill footprint; however, it will serve as a basis for building foundation and trend analytics. Each of the twelve questions was intentionally left open-ended for respondents to respond with as much information as possible.
The majority of responses came from within the Kansas City metro area from a wide variety of locations; KC Public Health Department, KC Public Library, KC Public Transit along with a host of local community organizations.
For a full list of participating organizations please send a request to [email protected].
The largest age group was 25-34. The second largest age group to respond was 55-64. These statistics follow our initial population trends with Millennials now the larger generation to the Baby Boomers, Baby Boomers still representing a large majority of the community’s population.
Gender of Respondent62% Female38% Male *One respondent answered both male and female
641096412764130/316412464127
Of 88 respondents, 35% were unemployed and looking for work, 6.8% were employed full-time, and 0.6% were employed part-time. Of those employed full or part-time, 33% received benefits from their employer and 67% did not.
When asked how many hours respondents worked per week on average, 40% said 11-21 hours per week, 36% said less than 10 hours a week. 24% said between 31-40 hours a week. Of 85 respondents, 92% said in the last twelve months their family household incomes was $25,000 or below.
93% of respondents were not active military. One respondent was active military and one respondent was retired military.
92% of respondents spoke English as their first language.
59% were living in single households at the time of the survey.
18% were married
23% were divorced or separated
Additional Information

34 © 2017 Goodwill of Western Missouri & Eastern Kansas
Com
mun
ity C
onve
rsat
ions
Connecting the dots: Our survey demographics follow the trends noted previously in this report. The profile of a respondent is an African American, single female, un- or underemployed who speaks English and is not a Veteran and is living in the urban core of the KCMA. She has obtained a high school diploma and is supporting a family on a low-skilled, minimum wage job.
Within the KCMA there is a long-standing history of racial tensions spanning more than a hundred years. This tension was seen during the CNA process in respondent’s reactions to the survey questions; the histories they gave of their own impoverished neighborhoods, and the unsettling fact that most had found comfort in the trauma of things remaining this way for years to come.
The following statistics from the survey demographics provide an illustration of this. More than 80 percent of respondents have a high school diploma yet responded that they made less than $25,000 annually in the last twelve months and worked 20 hours or less a week.
While our unemployment rates have lowered and continue to hold steady at roughly 5 percent, our workforce is severely underemployed when the living wage metrics and these survey results are compared. Interestingly enough, when asked if respondents were underemployed only 5 total respondents answered yes and only 31 respondents answered that they were out of work and looking, given their low wage, per hour current job status.
Often times service providers begin the creation of programs without engaging those in need about THEIR needs. we began this survey by asking community members “what is the best way to engage you?”
Engaging Those in Need
What do you wish service providers knew, understood about YOU?
The overwhelming top three response themes were:
I am a good person who has simply fallen on hard times.
Please help me by coordinating with other service providers.
Clients need consistency and motivation from their providers as much as the providers need it from their clients.
The top three response answers were:Goodwill is both an employer and a service provider. This gives us a unique vantage point; a vantage point we want to perfect within the nonprofit and business sectors, taking diversity and inclusivity well beyond awareness into all facets of hiring.
What are the signs an employer supports diversity and inclusivity in the workplace?
People from all walks of life are actually hired to work at all levels of the company/organization
Employees are provided consistent education and training in diversity and inclusivity practices; hiring, training, onboarding
The culture, employees are engaged, happy and compassionate to one another
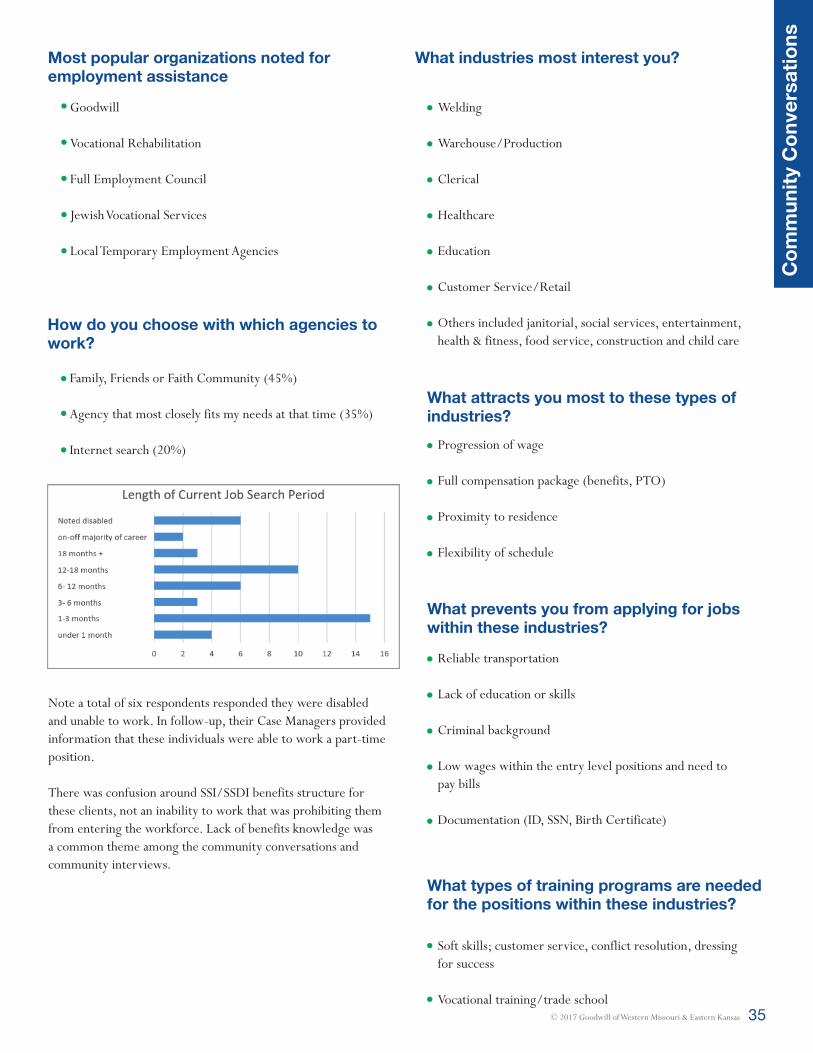
35© 2017 Goodwill of Western Missouri & Eastern Kansas
Most popular organizations noted for employment assistance
How do you choose with which agencies to work?
Note a total of six respondents responded they were disabled and unable to work. In follow-up, their Case Managers provided information that these individuals were able to work a part-time position.
There was confusion around SSI/SSDI benefits structure for these clients, not an inability to work that was prohibiting them from entering the workforce. Lack of benefits knowledge was a common theme among the community conversations and community interviews.
Family, Friends or Faith Community (45%)
Agency that most closely fits my needs at that time (35%)
Internet search (20%)
Goodwill
Vocational Rehabilitation
Full Employment Council
Jewish Vocational Services
Local Temporary Employment Agencies
What industries most interest you?
Welding
Warehouse/Production
Clerical
Healthcare
Education
Customer Service/Retail
Others included janitorial, social services, entertainment, health & fitness, food service, construction and child care
What attracts you most to these types of industries?
What prevents you from applying for jobs within these industries?
Progression of wage
Full compensation package (benefits, PTO)
Proximity to residence
Flexibility of schedule
Reliable transportation
Lack of education or skills
Criminal background
Low wages within the entry level positions and need to pay bills
Documentation (ID, SSN, Birth Certificate)
What types of training programs are needed for the positions within these industries?
Soft skills; customer service, conflict resolution, dressing for success
Vocational training/trade school
Com
mun
ity C
onve
rsat
ions

36 © 2017 Goodwill of Western Missouri & Eastern Kansas
Are these types of training programs available near you?
87% answered yes. But when asked if the respondent had access to this training, that percentage dropped to 56% because of barriers like transportation, reliable child care, training offered during times when the respondent needed to be at work, lack of employer support and, lastly, because of lack of funds to access the training programs.
Are you interested in furthering your education through a career training program?
The responses were fairly even - 52% answered yes to 48% answering no, when asked if the respondent would participate in a paid training program or apprenticeship, the response jumped to 82% yes.
What is the wage for which you are applying?
80% said $10-$12.00 per hour. Following this was 15% with $13-$15.00 an hour and then 5% with negotiable.
Prior to picking a category, most often respondents commented they were willing to start at a lower wage if the company offered a benefits package that included paid time off and health care for their children.
Interestingly though, when given the example scenario of a job with a higher wage or a job making less an hour but including a benefits package, 90% of the respondents chose the higher wage position.
Case Managers reflected during the survey meetings that often the clients cannot calculate total compensation and the need for benefits was vital, especially when working with those on state benefits.
Connecting the dots:
84%drive alone
9%carpool
4%work from
home
1%walk
1%use a
combinationof resources
1%use public
transportation
Within the KCMA
This means roughly 7,000 utilize the public transit system on a daily basis for their transportation needs. The average commute to work is approximately 25 minutes, with the typical trip taking between 15-24 minutes.
The public transportation system is predominantly focused on the downtown area. We know transportation is an issue in both urban and rural communities. Often times the urban riders need to take multiple bus lines, resulting in high fares and long-time commutes to work and home. Often times our rural commuters have limited routes from which to choose resulting in similar outcomes.
Most often respondents told us that logistically they were unable to utilize the public transit system because of the dangers of the
bus stops; they had to walk miles to and from the stop in poor weather, at night. They had to walk where there was no sidewalk or the bus stop itself was in a ditch making it nearly impossible for those using wheelchairs to utilize the bus stop.
Most said they could afford bus passes or knew of resources through a service provider that would assist in providing supports for bus passes if they were engaged in services.
Com
mun
ity C
onve
rsat
ions

37© 2017 Goodwill of Western Missouri & Eastern Kansas
Com
mun
ity C
onve
rsat
ions
What circumstances make it the most difficult to find or keep a job?Transportation, legal history, requirements of service providers (probation, parole, child support, court, training programs, school), competitive job market, limited skills with limited ability to pursue educational training programs, health conditions (mental health, disability, child/parent care), quality child care.
What is your longest period of employment?
What sorts of things caused disruption within
your employment?
What sorts of things supported longer periods
of employment?
3 - 5 years (33%)
3 - 6 months (22%)
1 - 2 years (10%)
Reliable transportation
Mental Health/Chronic or Family Health Issues
Conflicts with Co-workers and Supervisor
Childcare Conflicts
Support Systems (family, church, spouse)
Sobriety
Strong Reliable Behavior
Flexible Employer
Credentials to Fall Back On
Community Conversation ThemesCommunity Acceptance
Education on inclusivity and diversity in the workplace among employers and workers
Cultural shifts around racial tensions within minority groups and employers
Cultural shift around the realization of what a person believes they are capable of and what they are actually capable of- ‘I never believed I could do this!’
Welding
Warehouse/Production
Clerical
Healthcare
Education
Customer Service/Retail
High Demand Industries Service GapsBenefits knowledge (specialists)
Coordination of service providers
Reliable, affordable and safe transportation and childcare
Paid training programs (a safe place to fail while learning)
Retention supports- on-the-job coaching
Middle-skill job placement
Entry level jobs with clear wage progression
Multi-generational programming
Nonacademic supports (identification, social security cards, clothing, food and hygiene items)

38 © 2017 Goodwill of Western Missouri & Eastern Kansas
Com
mun
ity C
onve
rsat
ions
Community Interviews
Emerging Demographic Trends
Populations in Need
Service Gaps
International immigration – fear surrounding immigration- seeing status as a barrier to work, how do service providers assist
Growing Hispanic/Latino population in workforce- limited translation and interpretation resources
Continued population with background challenges to work entry and advancement
Increased older population with new challenges in workforce and retirement – how to use as volunteers to continue workforce goals, give back
Growing understanding of illiteracy rates and how to correct this, support current service providers efforts
Reentry
Homeless
Clients with co-occurring challenges (two or more challenges to employment)
Older adults
Benefits specialist for clients experiencing state or federal benefits programs
‘Slush’ funds for emergency assistance: clothing, transportation allowance, identification needs, hygiene, food
Referral coordination- more than a referral form, a warm transfer to a working partner that will ensure progress of client’s goals and a follow up report
Shared data entry system for providers- hospital model
Multi-generational program strategies
Program evaluation funding and processes – are services working?
More robust efforts to improve literacy within the Kansas City metro area (most don’t realize this is a large need)
Total wrap-around service from one provider; employment, transportation, child care, mental health and wellness, housing
Follow-up client services
Paid skills training and apprentice programs
Job placement beyond entry level positions
Translation and interpretation services
Peer, alumni support groups
Service Duplications
Surplus of entry-level and part-time job placement services
Financial literacy, too short-term, material too advanced for client in need
Resume workshops without a standard of excellence
Soft skills training, job clubs do not offer practical ways to practice what clients learn Tiered approach to job club in order for clients at all different soft skill levels to advance their skills
Competition for resources
Duplication of services versus common strategy of providers
Deep understanding of client needs, strategy based on large, broad needs versus specialized needs of one population
Lack of engagement and partnership from the business sector
Lack of evaluation process and standards of excellence for the service sector (accountability)
Contributing Factors to Continued Community Needs

39© 2017 Goodwill of Western Missouri & Eastern Kansas
Mov
ing
Forw
ard
ConclusionGoodwill started this journey with the intent of identifying those most in need of our services and a better understanding of why they are in need.
We took a macro look at the contributing factors to the Jackson County (KCMA) landscape by providing a broad overview of the community make-up. From this information, we dove down to identify the most marginalized populations, those living in the depths of poverty within poor communities experiencing co-occurring barriers to self-sustainability. Those populations are the homeless, the long-term underemployed (working poor), the single parent head of household, the at-risk youth, those experiencing a different ability, and the illiterate in our community.
Individuals within these groups are in need because they face barriers to self-sustainability such as age, race, gender and sexual orientation discrimination, mental health and immigration status, low-skill and illiteracy challenges and they have limited resources
and personal bandwidth to survive within the job market.We identified that there is a skills gap between the skill level of our labor force and the current workforce demands. We have noted that there is a need for supportive efforts within our education systems for those experiencing poverty and different abilities to ensure that those individuals and families can successfully complete high school. In addition, supports will be necessary to ensure literacy is prioritized within the school system and for those adults who were a product of the accreditation challenges of the past.
We better understand that poverty continues to hit the hardest in our historic Northeast, Eastside and Southside communities and is spreading to our suburban neighborhoods as well.
Lastly, we derived this information from actual people impacted professionally and personally within our community.
We know from this project we must work to:
Engage the business community more deeply, embed in their systems, understand their cultures and on a larger scale ensure they not only see but use Goodwill as a talent organization
Create a strong vetting system for our partnerships to ensure when we partner, the expectations are clear, we are moving the needle in employment, changing lives and will expect no less
Roll up our sleeves, be extremely strategic in who and how we serve to make the most impact despite lack of funding or the number of barriers a client presents to employment
Be open to taking calculated risks within research and development to provide programs with long-term impact
Invest in a highly skilled, trained and credentialed mission services staff team
We must address the needs of major populations experiencing one or more of the following:
Different abilities
Re-entering into our community from the prison system
Serving as the single adult leading their household
Illiteracy
Homelessness
Long-term unemployment/underemployed/working poor
Youth
We must create programs that support:
A multi-generational approach to service provision
Prepare clients to thrive in a labor market long-term versus within one career
Wage progression and full compensation
A focus on job retention support, not simply job placement supports
Skills training and education that is affordable and available to those most in need

40 © 2017 Goodwill of Western Missouri & Eastern Kansas
Mov
ing
Forw
ard As a final thought, one of the most difficult results of the CNA to quantify is the relationship building that occurs throughout the process
of information gathering.
Goodwill has often been labeled a “sleeping giant in the workforce community, one that lacks mission recognition and is in need of a comeback”.
During the community needs assessment project, a wide variety of connections were formed. Long lists of tables we once sat at were revitalized and our name was added to new lists altogether. These efforts offer exciting new partnerships and involvement in community initiatives that are core to furthering our mission. Examples of those efforts are listed below:
Founding Sponsor to STEP Coalition Relationships/pilot projects with Congressman Cleaver, Lawmakers in Kansas and our local City Council that were previously nonexistent
Making A Mentor KC Works Together
KC Rising
KC Startup Foundation
Enactus Business Advisory Board
Greater Kansas City Coalition to End Homelessness Greater Kansas City Business Leadership Network Mobility Access Committee
Employment and Transportation Round Table
Reentry Prerelease Community Meetings Kansas Employment Consortium
Continum of Care Workforce Subcommittee
Housing Authority of Kansas City Coordination Committee
Goodwill will be the leader in innovative practices that promote individual self-sustainability for people who have been marginalized. This is our vision statement, our aspiration. The journey of the community needs assessment solidifies that there is a place for our work and a call to action within our community. We must answer that call. Our good must go further.