Needham Retirement Board Valuation Report 2018 | Mass.gov
45
This report has been prepared at the request of the Retirement Board to assist in administering the Town of Needham Contributory Retirement System. This valuation report may not otherwise be copied or reproduced in any form without the consent of the Retirement Board and may only be provided to other parties in its entirety, unless expressly authorized by Segal. The measurements shown in this actuarial valuation may not be applicable for other purposes. © 2020 by The Segal Group, Inc. All rights reserved. doctag_01_actuarialvaluation Town of Needham Contributory Retirement System Actuarial Valuation and Review as of January 1, 2020
Transcript of Needham Retirement Board Valuation Report 2018 | Mass.gov

This report has been prepared at the request of the Retirement Board to assist in administering the Town of Needham Contributory Retirement System. This valuation report may not otherwise be copied or reproduced in any form without the consent of the Retirement Board and may only be provided to other parties in its entirety, unless expressly authorized by Segal. The measurements shown in this actuarial valuation may not be applicable for other purposes.
© 2020 by The Segal Group, Inc. All rights reserved. doctag_01_actuarialvaluation
Town of Needham Contributory Retirement System Actuarial Valuation and Review as of January 1, 2020

116 Huntington Ave., 8th Floor Boston, MA 02116-5744
segalco.com T 617.424.7300
October 30, 2020
Retirement Board Town of Needham Contributory Retirement System 1471 Highland Avenue Needham, MA 02492-2605
Dear Board Members:
We are pleased to submit this Actuarial Valuation and Review as of January 1, 2020. It summarizes the actuarial data used in the valuation, analyzes the preceding two years' experience, and establishes the funding requirements for fiscal 2021 and later years.
This report was prepared in accordance with generally accepted actuarial principles and practices at the request of the Board to assist in administering the Retirement System. The census information and financial information on which our calculations were based was prepared by the staff of the Town of Needham Contributory Retirement System. That assistance is gratefully acknowledged.
The actuarial calculations were directed under the supervision of Kathleen A. Riley, FSA, MAAA, EA. She is a member of the American Academy of Actuaries and meets the Qualification Standards of the American Academy of Actuaries to render the actuarial opinion herein. To the best of her knowledge, the information supplied in this actuarial valuation is complete and accurate. Further, in her opinion, the assumptions as approved by the Board are reasonably related to the experience of and the expectations for the Town of Needham Contributory Retirement System.
We look forward to reviewing this report at your next meeting and to answering any questions.
Sincerely, Segal
Lisa VanDermark, FSA, MAAA, EA Kathleen A. Riley, FSA, MAAA, EA Vice President and Consulting Actuary
Senior Vice President and Actuary

Table of Contents
9181867v2/14008.008 Town of Needham Contributory Retirement System 3
Section 1: Actuarial Valuation Summary .................................................................................................................................................. 4 Purpose and basis ............................................................................................................................................................................... 4 Valuation highlights ............................................................................................................................................................................. 5 Summary of key valuation results ........................................................................................................................................................ 7 Important information about actuarial valuations ................................................................................................................................. 8
Section 2: Actuarial Valuation Results ................................................................................................................................................... 10 Participant data .................................................................................................................................................................................. 10 Financial information ......................................................................................................................................................................... 13 Actuarial experience .......................................................................................................................................................................... 16 Actuarially determined contribution ................................................................................................................................................... 23 Funding schedule .............................................................................................................................................................................. 24 Risk .................................................................................................................................................................................................... 25
Section 3: Supplemental Information ..................................................................................................................................................... 27 Exhibit A: Table of Plan Coverage ..................................................................................................................................................... 27 Exhibit B: Participants in Active Service as of December 31, 2019 by Age, Years of Service, and Average Payroll ........................ 28 Exhibit C: Summary Statement of Income and Expenses on a Market Value Basis ......................................................................... 29 Exhibit D: Definition of Pension Terms .............................................................................................................................................. 30
Section 4: Actuarial Valuation Basis ...................................................................................................................................................... 34 Exhibit I: Statement of Actuarial Assumptions, Methods and Models ............................................................................................... 34 Exhibit II: Summary of Plan Provisions .............................................................................................................................................. 41

9181867v2/14008.008 Town of Needham Contributory Retirement System 4
Section 1: Actuarial Valuation Summary Purpose and basis This report was prepared by Segal to present a valuation of the System as of January 1, 2020. The valuation was performed to determine whether the assets and contributions are sufficient to provide the prescribed benefits. The measurements shown in this actuarial valuation may not be applicable for other purposes. In particular, the measures herein are not necessarily appropriate for assessing the sufficiency of System assets to cover the estimated cost of settling the System’s benefit obligations. Future actuarial measurements may differ significantly from the current measurements presented in this report due to such factors as the following: plan experience differing from that anticipated by the economic or demographic assumptions; changes in economic or demographic assumptions; increases or decreases expected as part of the natural operation of the methodology used for these measurements; and changes in plan provisions or applicable law.
The contribution requirements presented in this report are based on:
• The benefit provisions of Massachusetts General Law Chapter 32;
• The characteristics of covered active participants, inactive participants, and retired participants and beneficiaries as of December 31, 2019, provided by the staff of the Retirement System;
• The assets of the System as of December 31, 2019, provided by the staff of the Retirement System;
• Economic assumptions regarding future salary increases and investment earnings; and
• Other actuarial assumptions regarding employee terminations, retirement, death, etc.
Certain disclosure information required by GASB Statements No 67 and 68 as of December 31, 2019 for the Retirement System is provided in a separate report.

Section 1: Actuarial Valuation Summary
9181867v2/14008.008 Town of Needham Contributory Retirement System 5
Valuation highlights 1. It is important to note that this actuarial valuation is based on plan assets as of December 31, 2019. Due to the COVID-19
pandemic, market conditions have changed significantly since the valuation date. The System’s actuarial status does not reflect short-term fluctuations of the market, but rather is based on the market values on the last day of the Plan Year. While it is impossible to determine how the market will perform over the next several months, and how that will affect the results of next year’s valuation, Segal is available to prepare projections of potential outcomes upon request.
2. Segal strongly recommends an actuarial funding method that targets 100% funding of the actuarial accrued liability. Generally, this implies payments that are ultimately at least enough to cover normal cost, interest on the unfunded actuarial accrued liability and the principal balance. The funding policy adopted by the Town of Needham Contributory Retirement System meets this standard and funds the unfunded actuarial accrued liability by June 30, 2033.
3. The funded ratio (the ratio of the actuarial value of assets to actuarial accrued liability) is 65.57%, compared to the prior valuation funded ratio of 68.80%. This ratio is one measure of funding status, and its history is a measure of funding progress. Using the market value of assets, the funded ratio is 68.07%, compared to 71.58% as of the prior valuation date. These measurements are not necessarily appropriate for assessing the sufficiency of System assets to cover the estimated cost of settling the System’s benefit obligation or the need for or the amount of future contributions.
4. During the plan years ending December 31, 2019 and December 31, 2018, the rate of return on the market value of assets was 15.83% and -2.28%, respectively. The rate of return on the actuarial value of assets (which gradually recognizes market fluctuations) for the plan years ending December 31, 2019 and December 31, 2018 was 7.09% and 5.93%, respectively. This resulted in an actuarial loss when measured against the assumed rate of return of 7.25%.
5. The actuarial value of assets of as of December 31, 2019 was $175.5 million, or 96.32% of the market value of assets of $182.2 million. As of December 31, 2017, the actuarial value of assets was $158.0 million, or 96.11% of the market value of assets of $164.4 million.
6. The investment experience in the past years has only been partially recognized in the actuarial value of assets. As the deferred net gain of $6.7 million is recognized in future years, the cost of the System is likely to decrease unless the net gain is offset by future experience. This implies that earning the assumed rate of investment return (net of expenses) on a market value basis will result in investment gains on the actuarial value of assets in the next few years. The deferred investment gains are not recognized in the projection of the unfunded actuarial accrued liability in the funding schedule shown in Section 2.
7. The following actuarial assumptions were changed with this valuation:
• The investment return assumption was lowered from 7.25% to 6.50%.

Section 1: Actuarial Valuation Summary
9181867v2/14008.008 Town of Needham Contributory Retirement System 6
• The administrative expense assumption was increased from $325,000 for calendar year 2018 increasing 3.50% per year to $375,000 for calendar year 2020 increasing 3.00% per year, based on information on expenses provided by the staff of the Retirement System.
• We have updated the salary increase assumption from a scale that varies by length of service with ultimate rates of 4.25% for Group 1, 4.50% for Group 2, and 4.75% for Group 4 to a scale that varies by length of service with ultimate rates of 3.75% for Group 1, 4.00% for Group 2, and 4.25% for Group 4.
• The allowance for wage inflation was lowered from 3.50% to 3.00%.
• Based on average net 3(8)(c) payments of $364,517 for the last four years and the average characteristics of retired participants and beneficiaries, we have included a liability of approximately $3.7 million for future net 3(8)(c) payments. Previously, no liability was included for future net 3(8)(c) payments.
These changes increased the actuarial accrued liability by approximately $21.4 million and increased the normal cost by approximately $0.9 million.
8. The unfunded liability was expected to decrease by $1.5 million from $71.7 million as of January 1, 2018 to $70.2 million as of January 1, 2020. The actual unfunded liability as of January 1, 2020 is $92.2 million, $22.0 million higher than expected. The increase is primarily due to the assumption changes noted above. Other sources of gains and losses are discussed in Section 2.
9. In the funding schedule included in this report, the fiscal 2021 appropriation has been set equal to the previously budgeted amount of $9,513,543. The funding schedule is projected to fully fund the System by June 30, 2033, if all assumptions are met and there are no changes in the plan of benefits or actuarial assumptions, with appropriations that increase 9.50% per year through fiscal 2026 and 5.25% per year thereafter. The funding schedule included in the prior report fully funded the System by June 30, 2030 with appropriations that increased 9.50% per year through fiscal 2024 and amortization payments that increased 4.50% per year thereafter.
10. Since the actuarial valuation results are dependent on a given set of assumptions, there is a risk that emerging results may differ significantly as actual experience proves to be different from the assumptions. We have not been engaged to perform a detailed analysis of the potential range of the impact of risk relative to the System’s future financial condition, but have included a brief discussion of some risks that may affect System in Section 2. A more detailed assessment would provide the Board with a better understanding of the inherent risks.

Section 1: Actuarial Valuation Summary
9181867v2/14008.008 Town of Needham Contributory Retirement System 7
Summary of key valuation results 2020 2018
Contributions for • Actuarially Determined Contribution for fiscal year 2021 and 2019 $9,513,643 $7,934,482 fiscal year beginning • Actuarially Determined Contribution for fiscal year 2022 and 2020 10,417,439 8,688,258 July 1: • Actuarially Determined Contribution for fiscal year 2023 and 2021 11,407,096 9,513,643 Actuarial accrued • Retired participants and beneficiaries $134,739,470 $115,286,861 liability for plan year • Inactive vested participants 2,805,686 2,325,705 beginning January 1: • Inactive participants due a refund of employee contributions 1,423,136 1,068,811 • Active participants 128,709,219 110,974,798 • Total 267,677,511 229,656,175 • Normal cost including administrative expense assumption for plan year
beginning January 1 7,557,254 6,145,915
Assets for plan year • Market value of assets (MVA) $182,212,464 $164,383,140 beginning January 1: • Actuarial value of assets (AVA) 175,515,028 157,994,334 • Actuarial value of assets as a percentage of market value of assets 96.32% 96.11% Funded status for plan • Unfunded actuarial accrued liability on market value of assets $85,465,047 $65,273,035 year beginning January 1: • Funded percentage on MVA basis 68.07% 71.58% • Unfunded actuarial accrued liability on actuarial value of assets $92,162,483 $71,661,841 • Funded percentage on AVA basis 65.57% 68.80% Key assumptions: • Net investment return 6.50% 7.25% • Long-term wage inflation rate 3.00% 3.50% Demographic data for • Number of retired participants and beneficiaries 459 459 plan year beginning • Number of inactive vested participants 20 16 January 1: • Number of inactive participants due a refund of employee contributions 235 195 • Number of active participants 742 692 • Total payroll $41,727,878 $37,654,836 • Average payroll 56,237 54,415
Notes: Payroll figures are for the prior calendar year and reflect annualized salaries for participants hired during the year. Calendar year 2017 salaries for firefighters were reduced to reflect retroactive payments that were included in the data.

Section 1: Actuarial Valuation Summary
9181867v2/14008.008 Town of Needham Contributory Retirement System 8
Important information about actuarial valuations An actuarial valuation is a budgeting tool with respect to the financing of future projected obligations of a pension plan. It is an estimated forecast – the actual long-term cost of the plan will be determined by the actual benefits and expenses paid and the actual investment experience of the plan.
In order to prepare a valuation, Segal relies on a number of input items. These include:
Plan of benefits Plan provisions define the rules that will be used to determine benefit payments, and those rules, or the
interpretation of them, may change over time. Even where they appear precise, outside factors may change how they operate. It is important to keep Segal informed with respect to plan provisions and administrative procedures, and to review the plan summary included in our report to confirm that Segal has correctly interpreted the plan of benefits.
Participant data An actuarial valuation for a plan is based on data provided to the actuary by the Retirement System. Segal does not audit such data for completeness or accuracy, other than reviewing it for obvious inconsistencies compared to prior data and other information that appears unreasonable. It is important for Segal to receive the best possible data and to be informed about any known incomplete or inaccurate data.
Assets The valuation is based on the market value of assets as of the valuation date, as provided by the Retirement System. The Retirement System uses an “actuarial value of assets” that differs from market value to gradually reflect year-to-year changes in the market value of assets in determining the contribution requirements.
Actuarial assumptions In preparing an actuarial valuation, Segal projects the benefits to be paid to existing plan participants for the rest of their lives and the lives of their beneficiaries. This projection requires actuarial assumptions as to the probability of death, disability, withdrawal, and retirement of each participant for each year. In addition, the benefits projected to be paid for each of those events in each future year reflect actuarial assumptions as to salary increases and cost-of-living adjustments. The projected benefits are then discounted to a present value, based on the assumed rate of return that is expected to be achieved on the plan’s assets. There is a reasonable range for each assumption used in the projection and the results may vary materially based on which assumptions are selected. It is important for any user of an actuarial valuation to understand this concept. Actuarial assumptions are periodically reviewed to ensure that future valuations reflect emerging plan experience. While future changes in actuarial assumptions may have a significant impact on the reported results that does not mean that the previous assumptions were unreasonable.

Section 1: Actuarial Valuation Summary
9181867v2/14008.008 Town of Needham Contributory Retirement System 9
The user of Segal’s actuarial valuation (or other actuarial calculations) should keep the following in mind: The actuarial valuation is prepared at the request of the Retirement Board. Segal is not responsible for the use or misuse of its report, particularly by any other party.
An actuarial valuation is a measurement of the plan’s assets and liabilities at a specific date. Accordingly, except where otherwise noted, Segal did not perform an analysis of the potential range of future financial measures. The actual long-term cost of the plan will be determined by the actual benefits and expenses paid and the actual investment experience of the plan.
Actuarial results in this report are not rounded, but that does not imply precision.
If the Retirement Board is aware of any event or trend that was not considered in this valuation that may materially change the results of the valuation, Segal should be advised, so that we can evaluate it.
Segal does not provide investment, legal, accounting, or tax advice. Segal’s valuation is based on our understanding of applicable guidance in these areas and of the plan’s provisions, but they may be subject to alternative interpretations. The Retirement Board should look to their other advisors for expertise in these areas.
As Segal has no discretionary authority with respect to the management or assets of the System, it is not a fiduciary in its capacity as actuaries and consultants with respect to the System.

9181867v2/14008.008 Town of Needham Contributory Retirement System 10
Section 2: Actuarial Valuation Results Participant data The Actuarial Valuation and Review considers the number and demographic characteristics of covered participants, including active participants, inactive participants, retired participants and beneficiaries.
This section presents a summary of significant statistical data on these participant groups.
More detailed information for this valuation year and the preceding valuation can be found in Section 3, Exhibits A and B.
Participant Population: 2010 – 2019
Year Ended December 31
Active Participants
Inactive Participants
Retired Participants
and Beneficiaries
Total Non-Actives
Ratio of Non-Actives to Actives
2010 631 107 487 594 0.94
2011 644 127 473 600 0.93
2012 646 133 471 604 0.93
2013 631 143 464 607 0.96
2014 647 161 462 623 0.96
2016 650 209 463 672 1.03
2017 692 211 459 670 0.97
2019 742 255 459 714 0.96

Section 2: Actuarial Valuation Results
9181867v2/14008.008 Town of Needham Contributory Retirement System 11
0
20
40
60
80
100
120
140
0
50
100
150
200
250
300
350
Active participants Plan costs are affected by the age, years of service and payroll of active participants. In this year’s valuation, there were 742 active participants with an average age of 47.2, average years of service of 10.6 years and average payroll of $56,237. The 692 active participants in the prior valuation had an average age of 47.8, average service of 11.2 years and average payroll of $54,415.
Among the active participants, there were none with unknown age and/or service information.
Distribution of Active Participants as of December 31, 2019
by Age
by Years of Service
Inactive participants In this year’s valuation, there were 20 participants with a vested right to a deferred or immediate vested benefit and 235 participants entitled to a return of their employee contributions.
Average age 47.2 Average years of service 10.6 Prior average age 47.8 Prior average years of service 11.2
Difference -0.6 Difference -0.6

Section 2: Actuarial Valuation Results
9181867v2/14008.008 Town of Needham Contributory Retirement System 12
0102030405060708090
Superannuation Accidental DisabilityOrdinary Disability Beneficiaries
0102030405060708090
100
Superannuation Accidental DisabilityOrdinary Disability Beneficiaries
Retired participants and beneficiaries As of December 31, 2019, 411 retired participants and 48 beneficiaries were receiving total monthly benefits of $1,084,855, excluding COLAs reimbursed by the Commonwealth. For comparison, in the previous valuation, there were 408 retired participants and 51 beneficiaries receiving monthly benefits of $1,007,919, excluding COLAs reimbursed by the Commonwealth.
As of December 31, 2019, the average monthly benefit for retired participants and beneficiaries is $2,364, compared to $2,196 in the previous valuation. The average age for retired participants and beneficiaries is 75.8 in the current valuation, compared with 76.0 in the prior valuation.
Distribution of Pensioners as of December 31, 2019
by Type and Monthly Amount
by Type and Age

Section 2: Actuarial Valuation Results
9181867v2/14008.008 Town of Needham Contributory Retirement System 13
0
2
4
6
8
10
12
14
16
2011 2012 2013 2014 2015 2016 2017 2018 2019
$ M
illio
ns
Employer Contributions Employee Contributions Other Contributions Benefits Paid Administrative Expenses
Financial information Retirement plan funding anticipates that, over the long term, both contributions (less administrative expenses) and investment earnings (less investment fees) will be needed to cover benefit payments. Retirement plan assets change as a result of the net impact of these income and expense components.
Additional financial information, including a summary of transactions for the valuation year, is presented in Section 3, Exhibit C.
Comparison of Contributions with Benefits and Expenses for Years Ended December 31, 2011 – 2019

Section 2: Actuarial Valuation Results
9181867v2/14008.008 Town of Needham Contributory Retirement System 14
It is desirable to have level and predictable plan costs from one year to the next. For this reason, the Board has approved an asset valuation method that gradually adjusts to market value. Under this valuation method, the full value of market fluctuations is not recognized in a single year and, as a result, the asset value and the plan costs are more stable. The amount of the adjustment to recognize market value is treated as income, which may be positive or negative. Realized and unrealized gains and losses are treated equally and, therefore, the sale of assets has no immediate effect on the actuarial value.
Determination of Actuarial Value of Assets Year Ended
December 31, 2019 December 31, 2018
1 Market value of assets, December 31, 2019 $182,212,464 $158,729,118
2 Calculation of unrecognized return Original Amount1
Percent Deferred
Unrecognized Amount2
Unrecognized Amount
(a) Year ended December 31, 2019 $13,553,868 80% $10,843,094 0
(b) Year ended December 31, 2018 -15,571,723 60% -9,343,035 -12,457,378
(c) Year ended December 31, 2017 13,255,340 40% 5,302,136 7,953,204
(d) Year ended December 31, 2016 -523,793 20% -104,759 -209,518
(e) Year ended December 31, 2015 -9,639,314 0% 0 -1,927,863
(f) Total unrecognized return $6,697,436 -$6,641,555
3 Preliminary actuarial value: (1) - (2f) 175,515,028 165,370,674
4 Adjustment to be within 20% corridor 0 0
5 Final actuarial value of assets as of December 31, 2019: (3) + (4) 175,515,028 165,370,674
6 Actuarial value as a percentage of market value: (5) ÷ (1) 96.32% 104.18%
7 Amount deferred for future recognition: (1) - (5) $6,697,436 -$6,641,555
1 Total return minus expected return on a market value basis. 2 Recognition at 20% per year over five years.

Section 2: Actuarial Valuation Results
9181867v2/14008.008 Town of Needham Contributory Retirement System 15
80
100
120
140
160
180
200
2010 2011 2012 2013 2014 2015 2016 2017 2018 2019
$ M
illion
s
Actuarial Value Market Value
Both the actuarial value and market value of assets are representations of the System’s financial status. The actuarial asset value is significant because the Town of Needham Contributory Retirement System's liabilities are compared to these assets to determine what portion, if any, remains unfunded. Amortization of the unfunded actuarial accrued liability is an important element in determining the contribution requirement.
Actuarial Value of Assets vs. Market Value of Assets as of December 31, 2010 – 2019

Section 2: Actuarial Valuation Results
9181867v2/14008.008 Town of Needham Contributory Retirement System 16
Actuarial experience To calculate any actuarially determined contribution, assumptions are made about future events that affect the amount and timing of benefits to be paid and assets to be accumulated. Each year actual experience is measured against the assumptions. If overall experience is more favorable than anticipated (an actuarial gain), any contribution requirement will decrease from the previous year. On the other hand, any contribution requirement will increase if overall actuarial experience is less favorable than expected (an actuarial loss).
Taking account of experience gains or losses in one year without making a change in assumptions reflects the belief that the single year’s experience was a short-term development and that, over the long term, experience will return to the original assumptions. For contribution requirements to remain stable, assumptions should approximate experience.
If assumptions are changed, the contribution requirement is adjusted to take into account a change in experience anticipated for all future years.
The net loss for the two-year period is $536,738, which includes $2,344,810 from investment losses and $1,808,072 in gains from all other sources. The net experience variation from individual sources other than investments was 0.7% of the actuarial accrued liability. A discussion of the major components of the actuarial experience is on the following pages.
Actuarial Experience for Two-Year Period Ended December 31, 2019
1 Net loss from investments -$2,344,810
2 Net gain from administrative expenses 59,907
3 Net gain from other experience 1,748,165
4 Net experience loss: 1 + 2 + 3 -$536,738

Section 2: Actuarial Valuation Results
9181867v2/14008.008 Town of Needham Contributory Retirement System 17
Investment experience A major component of projected asset growth is the assumed rate of return. The assumed return should represent the expected long-term rate of return, based on the System’s investment policy. The rate of return on the market value of assets for the 2019 and 2018 plan years was 15.83% and -2.28%, respectively.
For valuation purposes, the assumed rate of return on the actuarial value of assets is 7.25% for 2019 and 2018. The actual rate of return on an actuarial basis for the 2019 plan year was 7.09% and for the 2018 year was 5.93%. Since the actual return for the two-year period was less than the assumed return, the System experienced an actuarial loss during the two-year period ending December 31, 2019 with regard to its investments.
Investment Experience Year Ended
December 31, 2019 Year Ended
December 31, 2018
Market Value Actuarial Value Market Value Actuarial Value
1 Net investment income $25,006,514 $11,667,522 -$3,723,913 $9,306,449
2 Average value of assets 157,967,534 164,609,090 163,418,085 157,029,279
3 Rate of return: 1 ÷ 2 15.83% 7.09% -2.28% 5.93%
4 Assumed rate of return 7.25% 7.25% 7.25% 7.25%
5 Expected investment income: 2 x 4 $11,452,646 $11,934,159 $11,847,811 $11,384,623
6 Actuarial gain/(loss): 1 - 5 $13,553,868 -$266,637 -$15,571,724 -$2,078,174

Section 2: Actuarial Valuation Results
9181867v2/14008.008 Town of Needham Contributory Retirement System 18
Because actuarial planning is long term, it is useful to see how the assumed investment rate of return has followed actual experience over time. The chart below shows the rate of return on an actuarial basis compared to the actual market value investment return for the last nine years, including averages over select time periods.
Based on this experience and future expectations, we have lowered the assumed rate of return from 7.25% to 6.50%.
Investment Return – Actuarial Value vs. Market Value: 2010 - 2019
Year Ended December 31
Actuarial Value Investment Return Market Value Investment Return
Amount Percent Amount Percent
2010 - - 2.58% - - 12.74%
2011 $419,144 0.36 -$399,618 -0.38
2012 541,125 0.48 13,507,074 13.22
2013 12,121,552 10.92 16,526,053 14.60
2014 11,547,431 9.54 9,661,449 7.57
2015 9,291,786 7.13 826,214 0.61
2016 10,835,584 7.89 9,829,743 7.36
2017 12,673,766 8.67 23,862,120 16.87
2018 9,306,449 5.93 -3,723,913 -2.28
2019 11,667,522 7.09 25,006,514 15.83
Most recent five-year average return 7.31% 6.40%
Most recent nine-year average return 6.56% 7.20%
Note: Each year’s yield is weighted by the average asset value in that year.

Section 2: Actuarial Valuation Results
9181867v2/14008.008 Town of Needham Contributory Retirement System 19
-5%
0%
5%
10%
15%
20%
2010 2011 2012 2013 2014 2015 2016 2017 2018 2019
Actuarial Value Market Value
As described earlier in this section, the actuarial asset valuation method gradually recognizes fluctuations in the market value rate of return. The goal of this is to stabilize the actuarial rate of return and to produce more level pension plan costs.
Market and Actuarial Rates of Return for Years Ended December 31, 2010 - 2019

Section 2: Actuarial Valuation Results
9181867v2/14008.008 Town of Needham Contributory Retirement System 20
Non-investment experience Administrative expenses Administrative expenses for the years ended December 31, 2018 and December 31, 2019 were $328,142 and $299,553, respectively, compared to the assumption of $325,000 for calendar 2018 and $336,375 for calendar 2019. This resulted in a gain of $59,907 for the two-year period, including an adjustment for interest. Based on information on expenses provided by the Retirement System, we have increased the assumption to $375,000 for calendar year 2020.
Mortality experience Mortality experience (more or fewer than expected deaths) yields actuarial gains or losses. The average number of deaths for nondisabled pensioners over the past two years was 18.0 per year compared to 17.0 projected deaths per year. The average number of deaths for disabled pensioners over the past two years was 0.5 per year compared to 1.0 projected deaths per year. The average number of deaths for beneficiaries over the past two years was 3.0 per year compared to 3.1 projected deaths per year.
Other experience There are other differences between the expected and the actual experience that appear when the new valuation is compared with the projections from the previous valuation. These include:
• the extent of turnover among participants,
• retirement experience (earlier or later than projected),
• the number of disability retirements (more or fewer than projected), and
• salary increases (greater or smaller than projected).
The net gain from this other experience for the two-year period ending December 31, 2019 amounted to $1,748,165.
Liability Changes Due to Demographic Experience for Two-Year Period Ended December 31, 2019 Gain due to salaries increasing less than expected $1,926,408
Loss due to mortality experience among retired members and beneficiaries -552,699
Miscellaneous experience gain 374,456
Total $1,748,165
Section 2: Actuarial Valuation Results
9181867v2/14008.008 Town of Needham Contributory Retirement System 21
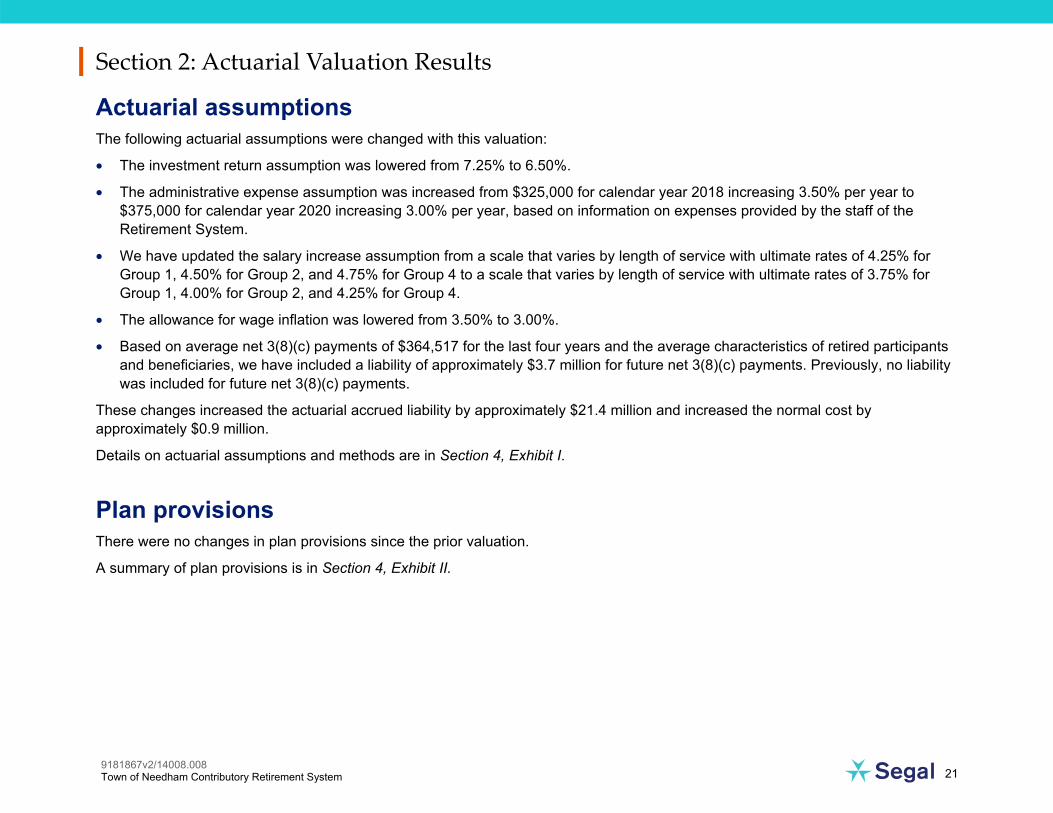
Actuarial assumptions The following actuarial assumptions were changed with this valuation:
• The investment return assumption was lowered from 7.25% to 6.50%.
• The administrative expense assumption was increased from $325,000 for calendar year 2018 increasing 3.50% per year to $375,000 for calendar year 2020 increasing 3.00% per year, based on information on expenses provided by the staff of the Retirement System.
• We have updated the salary increase assumption from a scale that varies by length of service with ultimate rates of 4.25% for Group 1, 4.50% for Group 2, and 4.75% for Group 4 to a scale that varies by length of service with ultimate rates of 3.75% for Group 1, 4.00% for Group 2, and 4.25% for Group 4.
• The allowance for wage inflation was lowered from 3.50% to 3.00%.
• Based on average net 3(8)(c) payments of $364,517 for the last four years and the average characteristics of retired participants and beneficiaries, we have included a liability of approximately $3.7 million for future net 3(8)(c) payments. Previously, no liability was included for future net 3(8)(c) payments.
These changes increased the actuarial accrued liability by approximately $21.4 million and increased the normal cost by approximately $0.9 million.
Details on actuarial assumptions and methods are in Section 4, Exhibit I.
Plan provisions There were no changes in plan provisions since the prior valuation.
A summary of plan provisions is in Section 4, Exhibit II.

Section 2: Actuarial Valuation Results
9181867v2/14008.008 Town of Needham Contributory Retirement System 22
Development of Unfunded Actuarial Accrued Liability
Year Ended
December 31, 2019 December 31, 2018
1 Unfunded actuarial accrued liability at beginning of year $71,353,576 $71,661,841
2 Normal cost at beginning of year 6,370,564 6,145,915
3 Total contributions -12,757,324 -11,711,012
4 Interest
• For whole year on 1 + 2 $5,635,000 $5,641,062
• For half year on 3 -418,558 -384,230
Total interest 5,216,422 5,256,832
5 Expected unfunded actuarial accrued liability $70,183,258 $71,353,576
6 Changes due to:
• Net loss from investments $2,344,810
• Net gain from experience -1,808,072
• Increase from change in assumptions 21,442,487
Total changes 21,979,225
7 Unfunded actuarial accrued liability at end of year $92,162,483

Section 2: Actuarial Valuation Results
9181867v2/14008.008 Town of Needham Contributory Retirement System 23
Actuarially determined contribution The Actuarially Determined Contribution is equal to the employer normal cost payment and a payment on the unfunded actuarial accrued liability. For fiscal 2021, the Actuarially Determined Contribution has been set equal to the previously budgeted amount of $9,513,643 determined with the prior valuation.
The funding schedule included in this report is projected to fully fund the System by June 30, 2033, if all assumptions are met and there are no changes in the plan of benefits or actuarial assumptions, with appropriations that increase 9.50% per year through fiscal 2026 and 5.25% per year thereafter. The funding schedule included in the prior report fully funded the System by June 30, 2030 with appropriations that increased 9.50% per year through fiscal 2024 and amortization payments that increased 4.50% per year thereafter.
Actuarially Determined Contribution for Year Beginning July 1
2020 2018
Amount
% of Projected
Payroll Amount
% of Projected
Payroll
1 Total normal cost $7,182,254 16.55% $5,820,915 14.80% 2 Administrative expenses 375,000 0.86% 325,000 0.83% 3 Expected employee contributions -4,248,145 -9.79% -3,817,069 -9.71%
4 Employer normal cost: (1) + (2) + (3) $3,309,109 7.63% $2,328,846 5.92% 5 Actuarial accrued liability $267,677,511 $229,656,175 6 Actuarial value of assets 175,515,028 157,994,334
7 Unfunded actuarial accrued liability: (5) - (6) $92,162,483 $71,661,841 8 Employer normal cost projected to July 1, 2020 and 2018 3,358,379 7.63% 2,369,250 5.92% 9 Projected unfunded actuarial accrued liability 95,110,611 74,214,132
10 Payment on unfunded actuarial accrued liability 6,155,264 13.98% 5,565,232 13.91% 11 Actuarially Determined Contribution: (4) + (10) $9,513,643 21.60% $7,934,482 19.83% 12 Projected payroll $44,043,609 $40,006,167
Notes: Actuarially Determined Contributions are assumed to be paid on July 1. Actuarially Determined Contributions are set equal to the budgeted amounts determined with the prior valuation

Section 2: Actuarial Valuation Results
9181867v2/14008.008 Town of Needham Contributory Retirement System 24
Funding schedule
(1) Fiscal year ended
June 30
(2) Employer Normal
Cost
(3) Amortization of
Unfunded Liability
(4) Actuarially Determined
Contribution (ADC): (2) + (3)
(5) Total Unfunded
Actuarial Accrued Liability at
Beginning of Fiscal Year
(6) Percent Increase in
ADC Over Prior Year
2021 $3,358,379 $6,155,264 $9,513,643 $95,110,611 - -
2022 3,470,392 6,947,047 10,417,439 94,737,444 9.50%
2023 3,586,121 7,820,975 11,407,096 93,496,773 9.50%
2024 3,705,688 8,785,082 12,490,770 91,244,725 9.50%
2025 3,829,220 9,848,173 13,677,393 87,819,520 9.50%
2026 3,956,848 11,019,897 14,976,745 83,039,485 9.50%
2027 4,088,707 11,674,317 15,763,024 76,700,861 5.25%
2028 4,224,937 12,365,646 16,590,583 69,253,269 5.25%
2029 4,365,682 13,095,907 17,461,589 60,585,318 5.25%
2030 4,511,091 13,867,231 18,378,322 50,576,223 5.25%
2031 4,661,317 14,681,867 19,343,184 39,095,076 5.25%
2032 4,816,520 15,542,181 20,358,701 26,000,068 5.25%
2033 4,976,864 11,137,650 16,114,514 11,137,650 -20.85%
2034 5,142,518 0 5,142,518 0 -68.09%
Notes: Fiscal 2021 Actuarially Determined Contribution set equal to budgeted amount. Actuarially Determined Contributions are assumed to be paid on July 1. Item (2) reflects 3.0% growth in payroll, plus an additional 0.15% adjustment to total normal cost to reflect the effects of mortality improvement due to generational mortality assumption. Projected normal cost does not reflect the impact of pension reform for future hires. Projected unfunded actuarial accrued liability does not reflect the recognition of deferred investment gains.

Section 2: Actuarial Valuation Results
9181867v2/14008.008 Town of Needham Contributory Retirement System 25
Risk Since the actuarial valuation results are dependent on a given set of assumptions and data as of a specific date, there is a risk that emerging results may differ significantly as actual experience differs from the assumptions.
This report does not contain a detailed analysis of the potential range of future measurements, but does include a brief discussion of some risks that may affect the System. This discussion is focused on funding-related risks, but similar concerns may apply to risks regarding the level of expense and liabilities reported for System accounting purposes as well.
• Investment Risk (the risk that returns will be different than expected)
The market value rate of return over the last 10 years has ranged from a low of -2.28% to a high of 16.87%.
As an illustration of the sensitivity of future employer contributions to investment volatility, we have estimated the impact of a 0% return in 2020 on the funding schedule that would be developed with the next valuation. Because the actuarial value of assets is used, only 60% of the 2020 investment loss will be recognized as of January 1, 2022. If all assumptions other than the investment return assumption for 2020 are met, we estimate that the funding schedule included in the next valuation report will reflect appropriations that increase 6.15% per year for fiscal years 2027 and later, compared with 5.25% increases in the current funding schedule, if the current full funding date of 2033 is maintained. Please note that this estimate assumes that any deferred investment losses as of January 1, 2022 are not recognized in the projection of the unfunded actuarial accrued liability in the funding schedule.
• Longevity Risk (the risk that mortality experience will be different than expected)
The actuarial valuation includes an expectation of future improvement in life expectancy. Emerging plan experience that does not match these expectations will result in either an increase or decrease in the actuarially determined contribution.
• Contribution Risk (the risk that actual contributions will be different from actuarially determined contribution)
Massachusetts General Law requires payment of the actuarially determined contribution. If future experience matches the current assumptions, we project the unfunded actuarial accrued liability will be paid off in 13 years.

Section 2: Actuarial Valuation Results
9181867v2/14008.008 Town of Needham Contributory Retirement System 26
• Demographic Risk (the risk that participant experience will be different than assumed)
Examples of this risk include: – Actual retirements occurring earlier or later than assumed. – More or less active participant turnover than assumed. – Disability experience greater or less than expected. – Salary increases greater or less than projected.
• Actual Experience and Implications for the Future
Past experience can help demonstrate the sensitivity of key results to the Plan’s actual experience. Over the past several years:
The investment gain(loss) has ranged from a loss of $15.6 million to a gain of $13.6 million.
The non-investment gain(loss) for a year has ranged from a loss of $0.8 million to a gain of $1.8 million.
The funded percentage on the actuarial value of assets has ranged from a low of 65.6% as of January 1, 2020 to a high of 77.9% as of January 1, 2011.
• Maturity Measures
As pension plans mature, the cash need to fulfill benefit obligations will increase over time. Therefore, cash flow projections and analysis should be performed to assure that the System’s asset allocation is aligned to meet emerging pension liabilities.
In 2019, benefits paid plus administrative expenses were $1.5 million more than contributions received. As the System matures, more cash may be needed from the investment portfolio to meet benefit payments.
9181867v2/14008.008 Town of Needham Contributory Retirement System 27
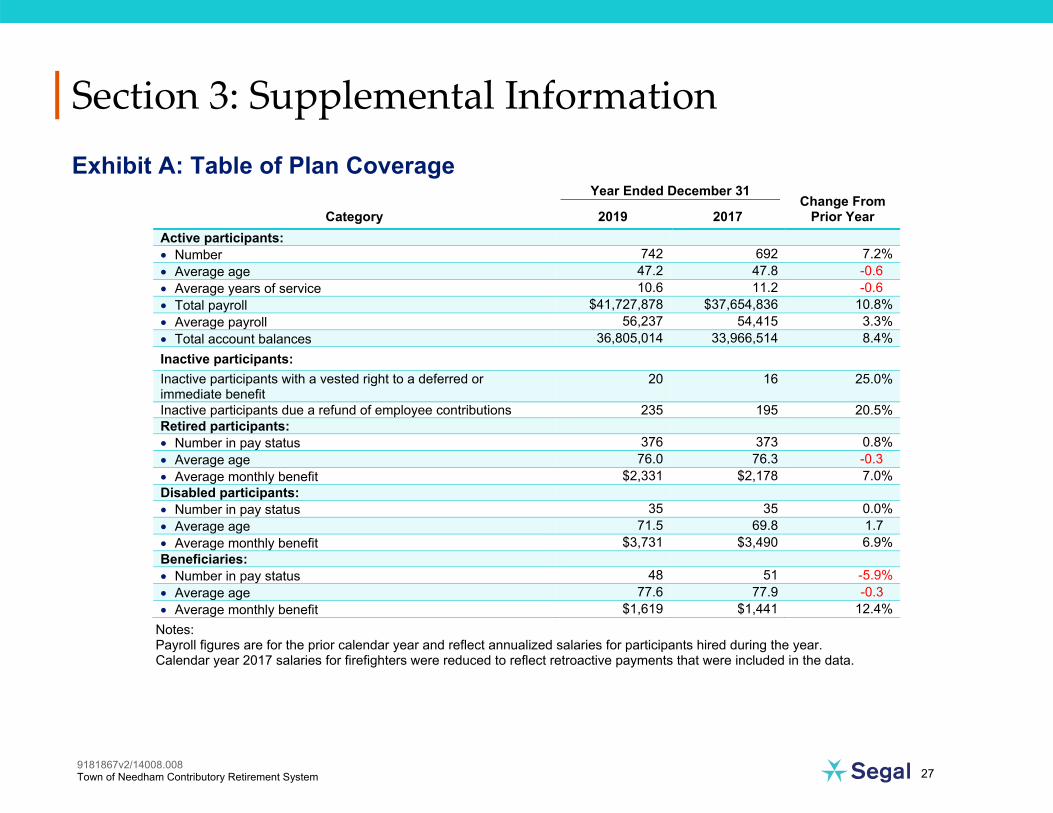
Section 3: Supplemental Information Exhibit A: Table of Plan Coverage
Category
Year Ended December 31 Change From
Prior Year 2019 2017 Active participants: • Number 742 692 7.2% • Average age 47.2 47.8 -0.6 • Average years of service 10.6 11.2 -0.6 • Total payroll $41,727,878 $37,654,836 10.8% • Average payroll 56,237 54,415 3.3% • Total account balances 36,805,014 33,966,514 8.4% Inactive participants:
Inactive participants with a vested right to a deferred or immediate benefit
20 16 25.0%
Inactive participants due a refund of employee contributions 235 195 20.5% Retired participants: • Number in pay status 376 373 0.8% • Average age 76.0 76.3 -0.3 • Average monthly benefit $2,331 $2,178 7.0% Disabled participants: • Number in pay status 35 35 0.0% • Average age 71.5 69.8 1.7 • Average monthly benefit $3,731 $3,490 6.9% Beneficiaries: • Number in pay status 48 51 -5.9% • Average age 77.6 77.9 -0.3 • Average monthly benefit $1,619 $1,441 12.4%
Notes: Payroll figures are for the prior calendar year and reflect annualized salaries for participants hired during the year. Calendar year 2017 salaries for firefighters were reduced to reflect retroactive payments that were included in the data.

Section 3: Supplemental Information
9181867v2/14008.008 Town of Needham Contributory Retirement System 28
Exhibit B: Participants in Active Service as of December 31, 2019 by Age, Years of Service, and Average Payroll
Age
Years of Service
Total 0-4 5-9 10-14 15 - 19 20 - 24 25 - 29 30 - 34 35 - 39 40 & over Under 25 38 38 - - - - - - - - - - - - - - - -
$31,304 $31,304 - - - - - - - - - - - - - - - - 25 - 29 74 69 5 - - - - - - - - - - - - - -
$39,852 $38,928 $52,603 - - - - - - - - - - - - - - 30 - 34 57 37 17 3 - - - - - - - - - - - -
$56,042 $50,129 $64,357 $81,846 - - - - - - - - - - - - 35 - 39 54 23 12 17 2 - - - - - - - - - -
$62,815 $49,177 $64,659 $77,050 $87,593 - - - - - - - - - - 40 - 44 74 30 10 15 15 4 - - - - - - - -
$62,503 $44,182 $72,981 $72,620 $86,270 $46,658 - - - - - - - - 45 - 49 96 37 13 14 20 10 2 - - - - - -
$63,049 $43,200 $57,722 $60,848 $84,541 $102,389 $68,685 - - - - - - 50 - 54 99 23 23 12 11 15 7 8 - - - -
$58,495 $40,963 $43,894 $53,462 $66,361 $73,147 $102,075 $82,007 - - - - 55 - 59 119 18 18 33 15 13 9 11 2 - -
$59,498 $40,393 $41,963 $59,280 $60,569 $57,887 $82,888 $93,139 $104,979 - - 60 - 64 88 15 12 15 15 10 9 8 4 - -
$56,155 $37,429 $52,403 $44,184 $50,383 $60,891 $75,002 $98,073 $66,081 - - 65 - 69 28 4 7 3 7 2 2 - - 2 1
$54,487 $40,445 $43,516 $39,798 $45,981 $53,514 $73,580 - - $98,360 $167,083 70 & over 15 1 2 1 3 2 1 1 2 2
$65,759 $19,535 $34,899 $17,362 $72,215 $54,310 $40,207 $48,185 $115,907 $117,112 Total 742 295 119 113 88 56 30 28 10 3
$56,237 $41,347 $53,625 $61,008 $69,237 $69,372 $82,009 $89,763 $90,281 $133,769

Section 3: Supplemental Information
9181867v2/14008.008 Town of Needham Contributory Retirement System 29
Exhibit C: Summary Statement of Income and Expenses on a Market Value Basis
Year Ended December 31, 2019
Year Ended December 31, 2017
Net assets at market value at the beginning of the year $158,729,118 $164,383,140
Contribution income:
• Employer contributions $8,688,258 $7,934,482 • Employee contributions 4,069,066 3,776,530 • Less administrative expenses -299,553 -328,142 Net contribution income 12,457,771 11,382,870
Net investment income 25,006,514 -3,723,913
Total income available for benefits $37,464,285 $7,658,957
Less benefit payments:
• Pensions, annuities, refunds and net transfers -$13,495,380 -$12,727,870 • Net 3(8)(c) reimbursements -485,559 -585,109 Net benefit payments -$13,980,939 -$13,312,979
Change in reserve for future benefits $23,483,346 -$5,654,022
Net assets at market value at the end of the year $182,212,464 $158,729,118

Section 3: Supplemental Information
9181867v2/14008.008 Town of Needham Contributory Retirement System 30
Exhibit D: Definition of Pension Terms The following list defines certain technical terms for the convenience of the reader:
Actuarial Accrued Liability for Actives:
The equivalent of the accumulated normal costs allocated to the years before the valuation date.
Actuarial Accrued Liability for Pensioners and Beneficiaries:
Actuarial Present Value of lifetime benefits to existing pensioners and beneficiaries. This sum takes account of life expectancies appropriate to the ages of the annuitants and the interest that the sum is expected to earn before it is entirely paid out in benefits.
Actuarial Cost Method: A procedure allocating the Actuarial Present Value of Future Benefits to various time periods; a method used to determine the Normal Cost and the Actuarial Accrued Liability that are used to determine the actuarially determined contribution.
Actuarial Gain or Loss: A measure of the difference between actual experience and that expected based upon a set of Actuarial Assumptions, during the period between two Actuarial Valuation dates. To the extent that actual experience differs from that assumed, Actuarial Accrued Liabilities emerge which may be the same as forecasted, or may be larger or smaller than projected. Actuarial gains are due to favorable experience, e.g., assets earn more than projected, salary increases are less than assumed, members retire later than assumed, etc. Favorable experience means actual results produce actuarial liabilities not as large as projected by the actuarial assumptions. On the other hand, actuarial losses are the result of unfavorable experience, i.e., actual results yield actuarial liabilities that are larger than projected.
Actuarially Equivalent: Of equal Actuarial Present Value, determined as of a given date and based on a given set of Actuarial Assumptions.
Actuarial Present Value (APV):
The value of an amount or series of amounts payable or receivable at various times, determined as of a given date by the application of a particular set of Actuarial Assumptions. Each such amount or series of amounts is: Adjusted for the probable financial effect of certain intervening events (such as changes in compensation levels, marital status, etc.) Multiplied by the probability of the occurrence of an event (such as survival, death, disability, withdrawal, etc.) on which the payment is conditioned, and Discounted according to an assumed rate (or rates) of return to reflect the time value of money.
Actuarial Present Value of Future Benefits:
The Actuarial Present Value of benefit amounts expected to be paid at various future times under a particular set of Actuarial Assumptions, taking into account such items as the effect of advancement in age, anticipated future compensation, and future service credits. The Actuarial Present Value of Future Benefits includes the liabilities for active members, retired members, beneficiaries receiving benefits, and inactive members entitled to either a refund of member contributions or a future retirement benefit. Expressed another way, it is the value that would have to be invested on the valuation date so that the amount invested plus investment earnings would provide sufficient assets to pay all projected benefits and expenses when due.
Section 3: Supplemental Information
9181867v2/14008.008 Town of Needham Contributory Retirement System 31
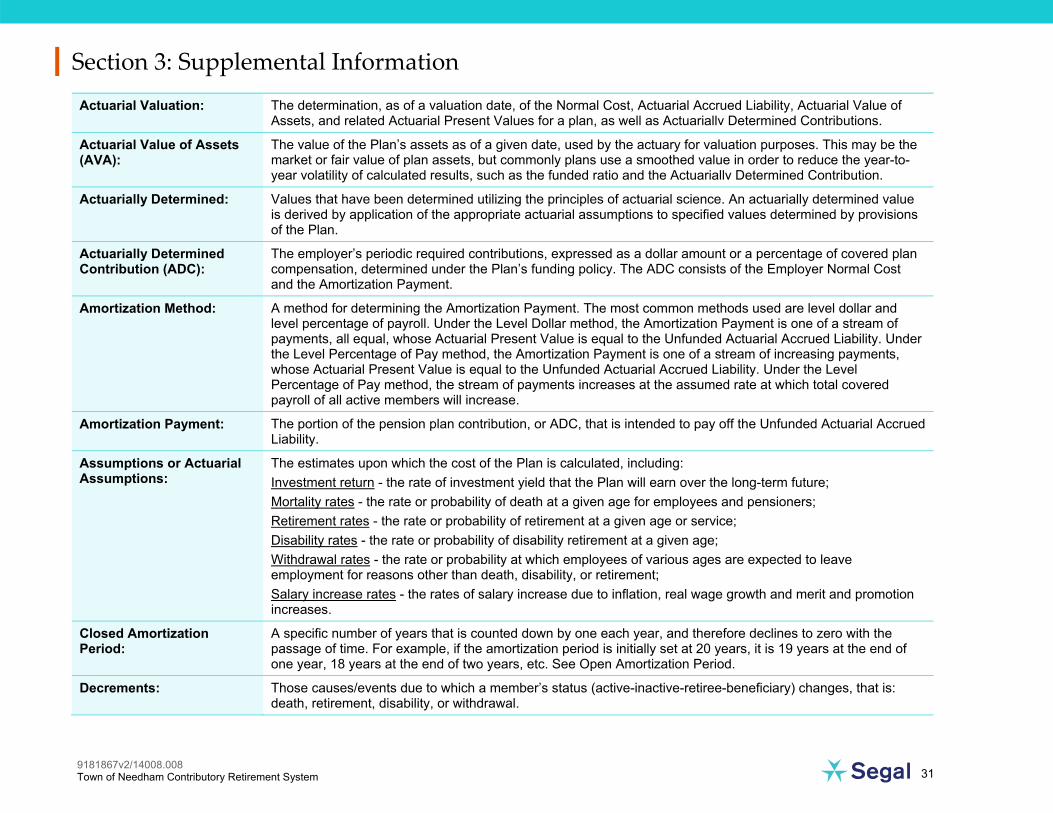
Actuarial Valuation: The determination, as of a valuation date, of the Normal Cost, Actuarial Accrued Liability, Actuarial Value of Assets, and related Actuarial Present Values for a plan, as well as Actuariallv Determined Contributions.
Actuarial Value of Assets (AVA):
The value of the Plan’s assets as of a given date, used by the actuary for valuation purposes. This may be the market or fair value of plan assets, but commonly plans use a smoothed value in order to reduce the year-to-year volatility of calculated results, such as the funded ratio and the Actuariallv Determined Contribution.
Actuarially Determined: Values that have been determined utilizing the principles of actuarial science. An actuarially determined value is derived by application of the appropriate actuarial assumptions to specified values determined by provisions of the Plan.
Actuarially Determined Contribution (ADC):
The employer’s periodic required contributions, expressed as a dollar amount or a percentage of covered plan compensation, determined under the Plan’s funding policy. The ADC consists of the Employer Normal Cost and the Amortization Payment.
Amortization Method: A method for determining the Amortization Payment. The most common methods used are level dollar and level percentage of payroll. Under the Level Dollar method, the Amortization Payment is one of a stream of payments, all equal, whose Actuarial Present Value is equal to the Unfunded Actuarial Accrued Liability. Under the Level Percentage of Pay method, the Amortization Payment is one of a stream of increasing payments, whose Actuarial Present Value is equal to the Unfunded Actuarial Accrued Liability. Under the Level Percentage of Pay method, the stream of payments increases at the assumed rate at which total covered payroll of all active members will increase.
Amortization Payment: The portion of the pension plan contribution, or ADC, that is intended to pay off the Unfunded Actuarial Accrued Liability.
Assumptions or Actuarial Assumptions:
The estimates upon which the cost of the Plan is calculated, including: Investment return - the rate of investment yield that the Plan will earn over the long-term future; Mortality rates - the rate or probability of death at a given age for employees and pensioners; Retirement rates - the rate or probability of retirement at a given age or service; Disability rates - the rate or probability of disability retirement at a given age; Withdrawal rates - the rate or probability at which employees of various ages are expected to leave employment for reasons other than death, disability, or retirement; Salary increase rates - the rates of salary increase due to inflation, real wage growth and merit and promotion increases.
Closed Amortization Period:
A specific number of years that is counted down by one each year, and therefore declines to zero with the passage of time. For example, if the amortization period is initially set at 20 years, it is 19 years at the end of one year, 18 years at the end of two years, etc. See Open Amortization Period.
Decrements: Those causes/events due to which a member’s status (active-inactive-retiree-beneficiary) changes, that is: death, retirement, disability, or withdrawal.

Section 3: Supplemental Information
9181867v2/14008.008 Town of Needham Contributory Retirement System 32
Defined Benefit Plan: A retirement plan in which benefits are defined by a formula based on the member’s compensation, age and/or years of service.
Defined Contribution Plan: A retirement plan, such as a 401(k) plan, a 403(b) plan, or a 457 plan, in which the contributions to the plan are assigned to an account for each member, the plan’s earnings are allocated to each account, and each member’s benefits are a direct function of the account balance.
Employer Normal Cost: The portion of the Normal Cost to be paid by the employer. This is equal to the Normal Cost less expected member contributions.
Experience Study: A periodic review and analysis of the actual experience of the Plan that may lead to a revision of one or more actuarial assumptions. Actual rates of decrement and salary increases are compared to the actuarially assumed values and modified based on recommendations from the Actuary.
Funded Ratio: The ratio of the Valuation/Actuarial Value of Assets (VVA/AVA) to the Actuarial Accrued Liability (AAL). Plans sometimes also calculate a market funded ratio, using the Market Value of Assets (MVA), rather than the VVA/AVA.
GASB 67 and GASB 68: Governmental Accounting Standards Board (GASB) Statements No. 67 and No. 68. These are the governmental accounting standards that set the accounting rules for public retirement systems and the employers that sponsor or contribute to them. Statement No. 68 sets the accounting rules for the employers that sponsor or contribute to public retirement systems, while Statement No. 67 sets the rules for the systems themselves.
Investment Return: The rate of earnings of the Plan from its investments, including interest, dividends and capital gain and loss adjustments, computed as a percentage of the average value of the fund. For actuarial purposes, the investment return often reflects a smoothing of the capital gains and losses to avoid significant swings in the value of assets from one year to the next.
Net Pension Liability (NPL): The Net Pension Liability is equal to the Total Pension Liability minus the Plan Fiduciary Net Position.
Normal Cost: The portion of the Actuarial Present Value of Future Benefits and expenses allocated to a valuation year by the Actuarial Cost Method. Any payment with respect to an Unfunded Actuarial Accrued Liability is not part of the Normal Cost (see Amortization Payment). For pension plan benefits that are provided in part by employee contributions, Normal Cost refers to the total of member contributions and employer Normal Cost unless otherwise specifically stated.
Open Amortization Period: An open amortization period is one which is used to determine the Amortization Payment but which does not change over time. If the initial period is set as 30 years, the same 30-year period is used in each future year in determining the Amortization Period.
Plan Fiduciary Net Position:
Market value of assets.
Total Pension Liability (TPL):
The actuarial accrued liability under the entry age normal cost method and based on the blended discount rate as described in GASB 67 and 68.

Section 3: Supplemental Information
9181867v2/14008.008 Town of Needham Contributory Retirement System 33
Unfunded Actuarial Accrued Liability:
The excess of the Actuarial Accrued Liability over the Valuation/Actuarial Value of Assets. This value may be negative, in which case it may be expressed as a negative Unfunded Actuarial Accrued Liability, also called the Funding Surplus or an Overfunded Actuarial Accrued Liability.
Valuation Date or Actuarial Valuation Date:
The date as of which the value of assets is determined and as of which the Actuarial Present Value of Future Benefits is determined. The expected benefits to be paid in the future are discounted to this date.

9181867v2/14008.008 Town of Needham Contributory Retirement System 34
Section 4: Actuarial Valuation Basis Exhibit I: Statement of Actuarial Assumptions, Methods and Models Net Investment Return: 6.50% (previously, 7.25%).
The net investment return assumption is a long-term estimate derived from historical data, current and recent market expectations, and professional judgment. As part of the analysis, a building block approach was used that reflects inflation expectations and anticipated risk premiums for each of the portfolio’s asset classes, as well as the System’s target asset allocation.
Salary Increases: Group 1 Group 2 Group 4 Years of Service
Current Previous Current Previous Current Previous
0 6.00% 6.00% 6.00% 6.00% 7.00% 7.00%
1 5.50% 5.50% 5.50% 5.50% 6.50% 6.50%
2 5.50% 5.50% 5.50% 5.50% 6.00% 6.00%
3 5.25% 5.25% 5.25% 5.25% 5.75% 5.75%
4 5.25% 5.25% 5.25% 5.25% 5.50% 5.25%
5 5.00% 4.75% 5.00% 4.75% 5.25% 5.25%
6 4.75% 4.75% 4.75% 4.75% 5.00% 4.75%
7 4.50% 4.50% 4.50% 4.50% 4.75% 4.75%
8 4.25% 4.50% 4.25% 4.50% 4.50% 4.75%
9 4.00% 4.25% 4.00% 4.50% 4.25% 4.75%
10+ 3.75% 4.25% 4.00% 4.50% 4.25% 4.75%
Includes an allowance for wage inflation of 3.00% (previously, 3.50%) The salary increase assumption is a long-term estimate derived from historical data, current and recent market expectations, and professional judgment.
Interest on Employee Contributions:
3.5%

Section 4: Actuarial Valuation Basis
9181867v2/14008.008 Town of Needham Contributory Retirement System 35
Administrative Expenses: $375,000 for calendar year 2020, increasing 3.00% per year (previously, $325,000 for calendar 2018, increasing 3.50% per year) The administrative expense assumption is based on information on expected expenses provided by the Retirement System.
Mortality Rates: Pre-Retirement: RP-2014 Blue Collar Employee Mortality Table projected generationally with Scale MP-2016 Healthy Retiree: RP-2014 Blue Collar Healthy Annuitant Mortality Table projected generationally with Scale MP-2016 Disabled Retiree: RP-2000 Healthy Annuitant Mortality Table projected generationally from 2015 with Scale BB2D The underlying tables with generational projection to the ages of participants as of the measurement date reasonably reflect the mortality experience of the plan as of the measurement date based on historical and current demographic data. As part of the analysis, a comparison was made between the actual number of retiree deaths and the projected number based on the prior years’ assumption over the most recent five valuations. The mortality tables were then adjusted to future years using the generational projection to reflect future mortality improvement between the measurement date and those years.
Termination Rates before Retirement:
Age
Groups 1 and 2 - Rate (%)
Mortality
Disability Male Female
20 0.05 0.02 0.01
25 0.06 0.02 0.02
30 0.06 0.02 0.03
35 0.07 0.03 0.06
40 0.08 0.04 0.10
45 0.13 0.07 0.15
50 0.22 0.12 0.19
55 0.36 0.19 0.24
60 0.61 0.27 0.28
Notes: Mortality rates do not reflect generational projection. 55% of the disability rates shown represent accidental disability. 20% of the accidental disabilities will die from the same cause as the disability. 55% of the death rates shown represent accidental death.

Section 4: Actuarial Valuation Basis
9181867v2/14008.008 Town of Needham Contributory Retirement System 36
Age
Group 4 - Rate (%)
Mortality
Disability Male Female
20 0.05 0.02 0.10
25 0.06 0.02 0.20
30 0.06 0.02 0.30
35 0.07 0.03 0.30
40 0.08 0.04 0.30
45 0.13 0.07 1.00
50 0.22 0.12 1.25
55 0.36 0.19 1.20
60 0.61 0.27 0.85
Notes: Mortality rates do not reflect generational projection. 90% of the disability rates shown represent accidental disability. 60% of the accidental disabilities will die from the same cause as the disability. 90% of the death rates shown represent accidental death. The termination rates and disability rates were based on historical and current demographic data, adjusted to reflect economic conditions of the area and estimated future experience and professional judgment. As part of the analysis, a comparison was made between the actual number of terminations and disability retirements and the projected number based on the prior years’ assumptions over the past five valuations.

Section 4: Actuarial Valuation Basis
9181867v2/14008.008 Town of Needham Contributory Retirement System 37
Withdrawal Rates: Rate per year (%)
Years of Service Groups 1 and 2 Years of Service Group 4
0 15.0 0 – 10 1.5
1 12.0 11+ 0.0
2 10.0
3 9.0
4 8.0
5 7.6
6 7.5
7 6.7
8 6.3
9 5.9
10 5.4
11 5.0
12 4.6
13 4.1
14 3.7
15 3.3
16 – 20 2.0
21 – 29 1.0
30+ 0.0
The termination rates and disability rates were based on historical and current demographic data, adjusted to reflect economic conditions of the area and estimated future experience and professional judgment. As part of the analysis, a comparison was made between the actual number of terminations and disability retirements and the projected number based on the prior years’ assumption over the most recent five valuations.

Section 4: Actuarial Valuation Basis
9181867v2/14008.008 Town of Needham Contributory Retirement System 38
Retirement Rates: Rate per year (%)
Groups 1 and 2 Group 4
Age Male Female Age Male and Female
50 1.0 1.5 45 1.0
51 1.0 1.5 46 1.0
52 1.0 2.0 47 1.0
53 1.0 2.5 48 1.0
54 2.0 2.5 49 1.0
55 2.0 5.5 50 2.0
56 2.5 6.5 51 2.0
57 2.5 6.5 52 2.0
58 5.0 6.5 53 5.0
59 6.5 6.5 54 7.5
60 12.0 5.0 55 15.0
61 20.0 13.0 56 10.0
62 30.0 15.0 57 10.0
63 25.0 12.5 58 10.0
64 22.0 18.0 59 15.0
65 40.0 15.0 60 20.0
66 25.0 20.0 61 20.0
67 25.0 20.0 62 25.0
68 30.0 25.0 63 25.0
69 30.0 20.0 64 30.0
70 100.0 100.0 65 100.0
The retirement rates were based on historical and current demographic data, adjusted to reflect economic conditions of the area and estimated future experience and professional judgment. As part of the analysis, a

Section 4: Actuarial Valuation Basis
9181867v2/14008.008 Town of Needham Contributory Retirement System 39
comparison was made between the actual number of retirements by age and the projected number based on the prior years’ assumption over the most recent five valuations.
Retirement Rates for Inactive Vested Participants:
Age 65 for Group 1 and Group 2 members and age 55 for Group 4 employees. The retirement age for inactive vested participants was based on historical and current demographic data, adjusted to reflect economic conditions of the area and estimated future experience and professional judgment.
Unknown Data for Participants:
Same as those exhibited by participants with similar known characteristics. If not specified, participants are assumed to be male.
Family Composition: 80% of participants are assumed to be married. None are assumed to have dependent children. Females are assumed to be three years younger than their male spouses.
Benefit Election: All participants are assumed to elect Option A. The benefit election reflects the fact that all benefit options are actuarially equivalent.
2019 Salary: 2019 salaries are equal to salaries provided in the data, except for new hires where salaries were annualized based on date of hire.
Total Service: Total creditable service reported in the data.
Net 3(8)(c) Liability: Based on average net 3(8)(c) payments of $364,517 for the last four years and the average characteristics of retired participants and beneficiaries, we have included a liability of approximately $3.7 million for future net 3(8)(c) payments (previously, no liability was included for future net 3(8)(c) payments).
Actuarial Value of Assets: Market value of assets as reported in the System’s Annual Statement less unrecognized return in each of the last five years. Unrecognized return is equal to the difference between the actual market value return and the expected market value return and is recognized over a five-year period, further adjusted, if necessary, to be within 20% of the market value.
Actuarial Cost Method: Entry Age Normal Actuarial Cost Method. Entry Age is the attained age of the participant less Total Service as defined above. Normal Cost and Actuarial Accrued Liability are calculated on an individual basis and are allocated by salary. Normal Cost is determined using the plan of benefits applicable to each participant.

Section 4: Actuarial Valuation Basis
9181867v2/14008.008 Town of Needham Contributory Retirement System 40
Justification for Change in Actuarial Assumptions:
Based on past experience and future expectations, the following actuarial assumption were changed as of January 1, 2020: • The investment return assumption was lowered from 7.25% to 6.50%. • The administrative expense assumption was increased from $325,000 for calendar year 2018 increasing
3.50% per year to $375,000 for calendar year 2020 increasing 3.00% per year, based on information on expenses provided by the staff of the Retirement System.
• We have updated the salary increase assumption from a scale that varies by length of service with ultimate rates of 4.25% for Group 1, 4.50% for Group 2, and 4.75% for Group 4 to a scale that varies by length of service with ultimate rates of 3.75% for Group 1, 4.00% for Group 2, and 4.25% for Group 4.
• The allowance for wage inflation was lowered from 3.50% to 3.00%. • Based on average net 3(8)(c) payments of $364,517 for the last four years and the average characteristics of
retired participants and beneficiaries, we have included a liability of approximately $3.7 million for future net 3(8)(c) payments. Previously, no liability was included for net 3(8)(c) payments.
Segal valuation results are based on proprietary actuarial modeling software. The actuarial valuation models generate a comprehensive set of liability and cost calculations that are presented to meet regulatory, legislative and client requirements. Deterministic cost projections are based on a proprietary forecasting model. Our Actuarial Technology and Systems unit, comprised of both actuaries and programmers, is responsible for the initial development and maintenance of these models. The models have a modular structure that allows for a high degree of accuracy, flexibility and user control. The client team programs the assumptions and the plan provisions, validates the models, and reviews test lives and results, under the supervision of the responsible actuary.
Section 4: Actuarial Valuation Basis
9181867v2/14008.008 Town of Needham Contributory Retirement System 41
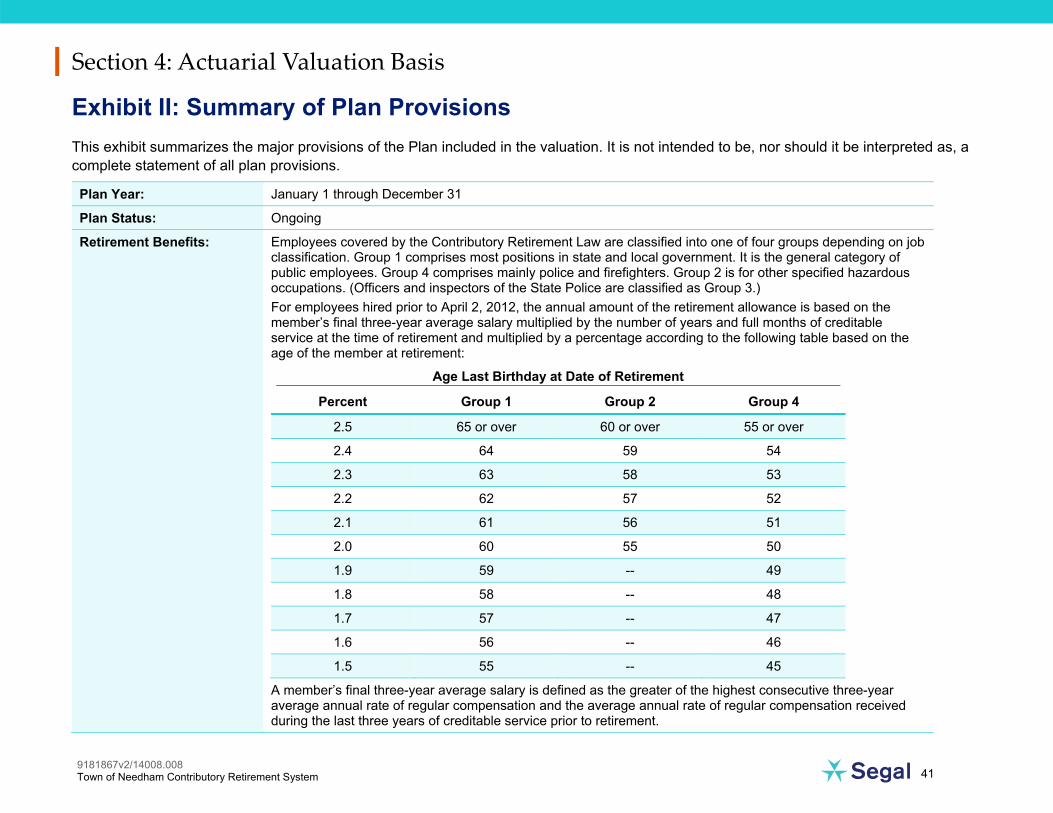
Exhibit II: Summary of Plan Provisions This exhibit summarizes the major provisions of the Plan included in the valuation. It is not intended to be, nor should it be interpreted as, a complete statement of all plan provisions.
Plan Year: January 1 through December 31
Plan Status: Ongoing
Retirement Benefits: Employees covered by the Contributory Retirement Law are classified into one of four groups depending on job classification. Group 1 comprises most positions in state and local government. It is the general category of public employees. Group 4 comprises mainly police and firefighters. Group 2 is for other specified hazardous occupations. (Officers and inspectors of the State Police are classified as Group 3.) For employees hired prior to April 2, 2012, the annual amount of the retirement allowance is based on the member’s final three-year average salary multiplied by the number of years and full months of creditable service at the time of retirement and multiplied by a percentage according to the following table based on the age of the member at retirement:
Age Last Birthday at Date of Retirement
Percent Group 1 Group 2 Group 4
2.5 65 or over 60 or over 55 or over
2.4 64 59 54
2.3 63 58 53
2.2 62 57 52
2.1 61 56 51
2.0 60 55 50
1.9 59 -- 49
1.8 58 -- 48
1.7 57 -- 47
1.6 56 -- 46
1.5 55 -- 45
A member’s final three-year average salary is defined as the greater of the highest consecutive three-year average annual rate of regular compensation and the average annual rate of regular compensation received during the last three years of creditable service prior to retirement.

Section 4: Actuarial Valuation Basis
9181867v2/14008.008 Town of Needham Contributory Retirement System 42
For employees hired on April 2, 2012 or later, the annual amount of the retirement allowance is based on the member’s final five-year average salary multiplied by the number of years and full months of creditable service at the time of retirement and multiplied by a percentage according to the following tables based on the age and years of creditable service of the member at retirement:
For members with less than 30 years of creditable service: Age Last Birthday at Date of Retirement
Percent Group 1 Group 2 Group 4
2.50 67 or over 62 or over 57 or over
2.35 66 61 56
2.20 65 60 55
2.05 64 59 54
1.90 63 58 53
1.75 62 57 52
1.60 61 56 51
1.45 60 55 50
For members with 30 years of creditable service or greater: Age Last Birthday at Date of Retirement
Percent Group 1 Group 2 Group 4
2.500 67 or over 62 or over 57 or over
2.375 66 61 56
2.250 65 60 55
2.125 64 59 54
2.000 63 58 53
1.875 62 57 52
1.750 61 56 51
1.625 60 55 50
A member’s final five-year average salary is defined as the greater of the highest consecutive five-year average annual rate of regular compensation and the average annual rate of regular compensation received during the last five years of creditable service prior to retirement.
Section 4: Actuarial Valuation Basis
9181867v2/14008.008 Town of Needham Contributory Retirement System 43
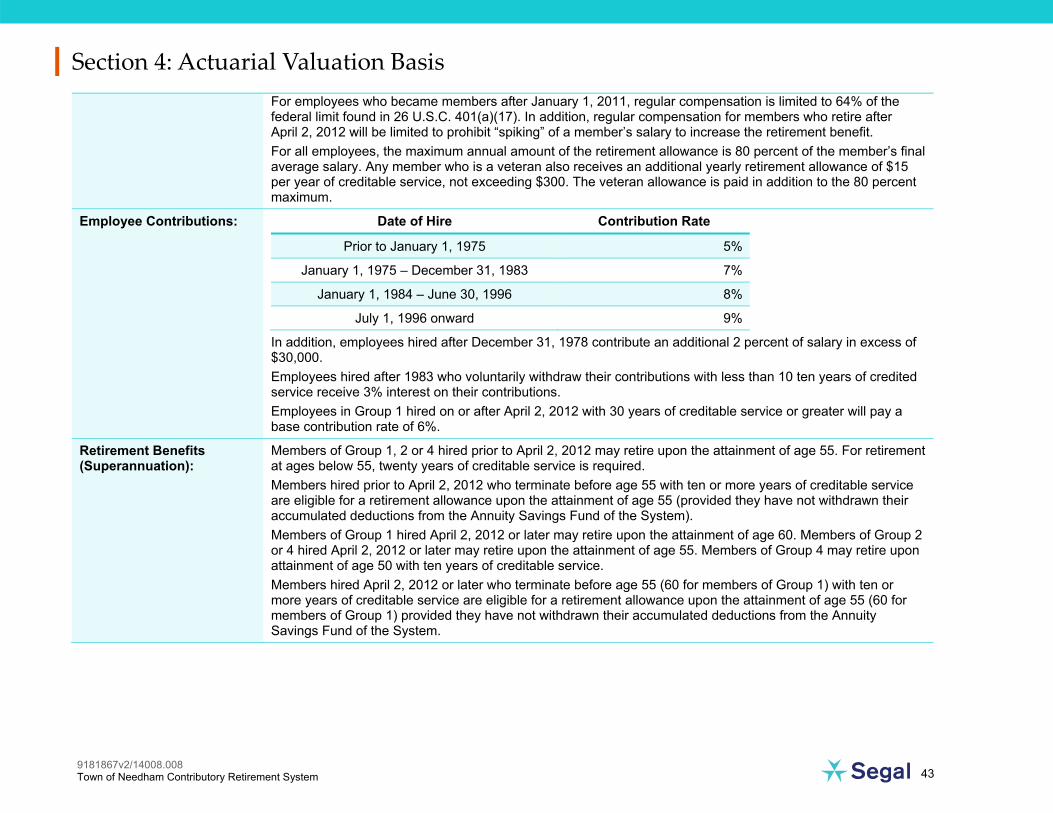
For employees who became members after January 1, 2011, regular compensation is limited to 64% of the federal limit found in 26 U.S.C. 401(a)(17). In addition, regular compensation for members who retire after April 2, 2012 will be limited to prohibit “spiking” of a member’s salary to increase the retirement benefit. For all employees, the maximum annual amount of the retirement allowance is 80 percent of the member’s final average salary. Any member who is a veteran also receives an additional yearly retirement allowance of $15 per year of creditable service, not exceeding $300. The veteran allowance is paid in addition to the 80 percent maximum.
Employee Contributions: Date of Hire Contribution Rate
Prior to January 1, 1975 5%
January 1, 1975 – December 31, 1983 7%
January 1, 1984 – June 30, 1996 8%
July 1, 1996 onward 9%
In addition, employees hired after December 31, 1978 contribute an additional 2 percent of salary in excess of $30,000. Employees hired after 1983 who voluntarily withdraw their contributions with less than 10 ten years of credited service receive 3% interest on their contributions. Employees in Group 1 hired on or after April 2, 2012 with 30 years of creditable service or greater will pay a base contribution rate of 6%.
Retirement Benefits (Superannuation):
Members of Group 1, 2 or 4 hired prior to April 2, 2012 may retire upon the attainment of age 55. For retirement at ages below 55, twenty years of creditable service is required. Members hired prior to April 2, 2012 who terminate before age 55 with ten or more years of creditable service are eligible for a retirement allowance upon the attainment of age 55 (provided they have not withdrawn their accumulated deductions from the Annuity Savings Fund of the System). Members of Group 1 hired April 2, 2012 or later may retire upon the attainment of age 60. Members of Group 2 or 4 hired April 2, 2012 or later may retire upon the attainment of age 55. Members of Group 4 may retire upon attainment of age 50 with ten years of creditable service. Members hired April 2, 2012 or later who terminate before age 55 (60 for members of Group 1) with ten or more years of creditable service are eligible for a retirement allowance upon the attainment of age 55 (60 for members of Group 1) provided they have not withdrawn their accumulated deductions from the Annuity Savings Fund of the System.

Section 4: Actuarial Valuation Basis
9181867v2/14008.008 Town of Needham Contributory Retirement System 44
Ordinary Disability Benefit: A member who is unable to perform his or her job due to a non-occupational disability will receive a retirement allowance if he or she has ten or more years of creditable service and has not reached age 55. The annual amount of such allowance shall be determined as if the member retired for superannuation at age 55 (age 60 for Group 1 members hired on or after April 2, 2012), based on the amount of creditable service at the date of disability. For veterans, there is a minimum benefit of 50 percent of the member’s most recent year’s pay plus an annuity based on his or her own contributions.
Accidental Disability Benefit:
For a job-connected disability, the benefit is 72 percent of the member’s most recent annual pay plus an annuity based on his or her own contributions, plus additional amounts for surviving children. Benefits are capped at 75 percent of annual rate of regular compensation for employees who become members after January 1, 1988.
Death Benefits: In general, the beneficiary of an employee who dies in active service will receive a refund of the employee’s own contributions. Alternatively, if the employee were eligible to retire on the date of death, a spouse’s benefit will be paid equal to the amount the employee would have received under Option C. The surviving spouse of a member who dies with two or more years of credited service has the option of a refund of the employee’s contributions or a monthly benefit regardless of eligibility to retire, if they were married for at least one year. There is also a minimum widow’s pension of $500 per month, and there are additional amounts for surviving children. If an employee’s death is job-connected, the spouse will receive 72 percent of the member’s most recent annual pay, in addition to a refund of the member’s accumulated deductions, plus additional amounts for surviving children. However, in accordance with Section 100 of Chapter 32, the surviving spouse of a police officer, firefighter or corrections officer is killed in the line of duty will be eligible to receive an annual benefit equal to the maximum salary held by the member at the time of death. Upon the death of a job-connected disability retiree who retired prior to November 7, 1996 and could not elect an Option C benefit, a surviving spouse will receive an allowance of $9,000 per year if the member dies for a reason unrelated to cause of disability.
"Heart And Lung Law” And Cancer Presumption:
Any case of hypertension or heart disease resulting in total or partial disability or death to a uniformed fireman, permanent member of a police department, or certain employees of a county correctional facility is presumed to have been suffered in the line of duty, unless the contrary is shown by competent evidence. Any case of disease of the lungs or respiratory tract resulting in total disability or death to a uniformed fireman is presumed to have been suffered in the line of duty, unless the contrary is shown by competent evidence. There is an additional presumption for uniformed firemen that certain types of cancer are job-related if onset occurs while actively employed or within five years of retirement.
Options: Members may elect to receive a full retirement allowance payable for life under Option A. Under Option B a member may elect to receive a lower monthly allowance in exchange for a guarantee that at the time of death any contributions not expended for annuity payments will be refunded to the beneficiary. Option C allows the member to take a lesser retirement allowance in exchange for providing a survivor with two-thirds of the lesser amount. Option C pensioners will have benefits converted from a reduced to a full retirement if the beneficiary predeceases the retiree.

Section 4: Actuarial Valuation Basis
9181867v2/14008.008 Town of Needham Contributory Retirement System 45
Post-Retirement Benefits: The Board has adopted the provisions of Section 51 of Chapter 127 of the Acts of 1999, which provide that the Retirement Board may approve an annual COLA in excess of the Consumer Price Index but not to exceed a 3% COLA on the first $14,000 of a retirement allowance. Cost-of-living increases granted prior to July 1, 1998 are reimbursed by the Commonwealth and not reflected in this report.
Changes in Plan Provisions:
There have been no changes in plan provisions since the last valuation.