When Grammar Instruction Undermines Cohesion in L2 Spanish ...
Upload
albert-calvetCategory
view
243download
3description

Insufficient sleep undermines dietary efforts to reduce adiposity
Arlet V. Nedeltcheva, MD1, Jennifer M. Kilkus, MS2, Jacqueline Imperial, RN2, Dale A.Schoeller, PhD3, and Plamen D. Penev, MD, PhD11Department of Medicine, University of Chicago, Chicago, IL 60637, USA2General Clinical Resource Center, University of Chicago, Chicago, IL 60637, USA3Nutritional Sciences, University of Wisconsin, Madison, WI 53706, USA
AbstractBackground—Sleep loss can modify energy intake and expenditure.
Objective—To determine whether sleep restriction attenuates the effect of reduced-calorie dieton excess adiposity.
Design—Randomized two-period two-condition crossover study.
Setting—University clinical research center and sleep laboratory.
Patients—10 overweight nonsmoking adults (3F/7M); mean (SD) age 41 (5) y; body mass index27.4 (2.0) kg/m2.
Intervention—14 days of moderate caloric restriction with 8.5 or 5.5-hour nighttime sleepopportunity.
Measurements—Primary: loss of fat and fat-free body mass. Secondary: changes in substrateutilization, energy expenditure, hunger, and 24-h metabolic hormone concentrations.
Results—Sleep curtailment decreased the fraction of weight lost as fat by 55% (1.4 vs. 0.6 kgwith 8.5 vs. 5.5-h sleep opportunity, P=0.043) and increased the loss of fat-free body mass by 60%(1.5 vs. 2.4 kg, P=0.002). This was accompanied by markers of enhanced neuroendocrineadaptation to caloric restriction, increased hunger, and a shift in relative substrate utilizationtowards oxidation of less fat.
Limitations—The nature of the study limited its duration and sample size.
Conclusions—The amount of human sleep contributes to the maintenance of fat-free body massat times of decreased energy intake. Lack of sufficient sleep may compromise the efficacy oftypical dietary interventions for weight loss and related metabolic risk reduction.
Address correspondence to: Plamen Penev, MD, PhD, Section of Endocrinology, Diabetes, and Metabolism, Department of Medicine,University of Chicago, 5841 S. Maryland Ave. MC-1027, Chicago, IL 60637, Tel: (773) 702-5125; Fax: (773) 834-0486,[email protected] is the prepublication, author-produced version of a manuscript accepted for publication in Annals of Internal Medicine. Thisversion does not include post-acceptance editing and formatting. The American College of Physicians, the publisher of Annals ofInternal Medicine, is not responsible for the content or presentation of the author-produced accepted version of the manuscript or anyversion that a third party derives from it. Readers who wish to access the definitive published version of this manuscript and anyancillary material related to this manuscript (e.g., correspondence, corrections, editorials, linked articles) should go to www.annals.orgor to the print issue in which the article appears. Those who cite this manuscript should cite the published version, as it is the officialversion of record.
NIH Public AccessAuthor ManuscriptAnn Intern Med. Author manuscript; available in PMC 2011 April 5.
Published in final edited form as:Ann Intern Med. 2010 October 5; 153(7): 435–441. doi:10.1059/0003-4819-153-7-201010050-00006.
NIH
-PA Author Manuscript
NIH
-PA Author Manuscript
NIH
-PA Author Manuscript

IntroductionMammalian sleep is closely integrated with the regulation of energy balance and metabolicsurvival of the organism (1). Compared to the robust catabolic effects of sleep deprivation inrodents (2,3), the increase in energy expenditure in sleep-deprived humans is much smaller(4,5). Nevertheless, emerging data suggest that lack of sufficient sleep may modify thehuman neuroendocrine response to reduced food intake and have an adverse impact on themetabolic effects of caloric restriction. Studies in volunteers who slept short vs. long hoursshow that sleep curtailment was accompanied by increased hunger, higher circulatingconcentrations of the orexigenic hormone, ghrelin, and reduced concentrations of theanorexigenic hormone, leptin, when their caloric intake during the testing period wasrestricted to ~20 kcal/kg/day (5g/kg/24h i.v. glucose infusion) (6), but not when they were inpositive energy balance (5,7).
Many people today are overweight or obese and diet-induced weight loss is a widely usedstrategy to reduce the health risks associated with excess adiposity. The neuroendocrinechanges associated with sleep curtailment in the presence of caloric restriction (6), however,raise the possibility that lack of sufficient sleep may compromise the efficacy of commonlyused dietary interventions in such individuals. For instance, higher ghrelin concentrationsmay facilitate the retention of fat (8–10) and increased hunger could compromise adherenceto caloric restriction. This study tested the hypothesis that recurrent bedtime restriction canattenuate the effect of reduced-calorie diet on excess adiposity, enhance subjective hunger,and modify 24-h serum leptin and acylated ghrelin concentrations in overweight individuals.Since sleep loss may affect multiple neuroendocrine signals involved in the control ofsubstrate utilization, we also examined the changes in circulating cortisol, epinephrine,norepinephrine, thyroid, and growth hormone concentrations.
MethodsStudy participants
Sedentary non-smokers ages 35–49 with body mass index between 25–32 kg/m2 and self-reported sleep between 6.5–8.5 h/day were recruited through local newspaperadvertisements. The study was conducted between July 2003 and July 2008 in parallel withother experiments in our laboratory (5) aimed at exploring the effects of sleep loss on humanenergy metabolism. Individuals were excluded from participation if they had: self-reportedsleep problems (Pittsburgh Sleep Quality Index, PSQI, score >10), night work, variablesleep habits, or habitual daytime naps; physically demanding occupations or regularexercise; depressed mood (Center for Epidemiologic Studies of Depression, CES-D, score>15); excessive intake of alcohol (>14 drinks/week for men; >7 for women) or caffeine(>300 mg/day); smoking; use of prescription medications or over-the-counter drugsaffecting sleep or metabolism; and abnormal findings on medical history, physical exam,and laboratory screening tests (including a 75g oral glucose challenge and one night of fullpolysomnography). Only non-pregnant women were studied and data collection wasscheduled during the first half of their menstrual cycle. Twelve subjects (5 women and 7men) were enrolled and 10 of them (3 women and 7 men; 3 Caucasians, 4 AfricanAmericans, and 3 Hispanics) completed the study. One female dropped out after completingthe first half of the study to start a new job. The participation of a second female subject wasstopped by the research team after she complained of palpitations during the period ofcombined caloric and sleep restriction and her electrocardiogram showed episodic prematureatrial contractions in the absence of any serum electrolyte abnormalities. All volunteers gavewritten informed consent and were paid for their participation. The University of ChicagoInstitutional Review Board approved the study protocol.
Nedeltcheva et al. Page 2
Ann Intern Med. Author manuscript; available in PMC 2011 April 5.
NIH
-PA Author Manuscript
NIH
-PA Author Manuscript
NIH
-PA Author Manuscript

Experimental protocolFigure 1 shows a schematic of the study protocol. Participants spent two 14-day periods inthe laboratory with scheduled time-in-bed of 8.5 or 5.5 h/night in random order at least 3months apart (mean ± SD time between treatments: 7 ± 3 months). To modify overnightsleep duration without changes in circadian phase, the usual going-to-bed and getting-out-of-bed times of the subjects were moved proportionally closer together or further apart.Order of treatment was determined using random number tables. Six subjects were studiedin the 8.5-h time-in-bed condition first and 4 subjects started with the 5.5-h time-in-bedcondition first (see APPENDIX Table I). Sleep was recorded every night (Neurofax-1100,Nihon-Kohden, Foothill Ranch, CA) and no daytime naps were allowed.
Food intake and energy expenditureDuring each 14-day intervention period, participants consumed the same individualized dietwith caloric content restricted to 90% of their resting metabolic rate at the time of screening.Daily calories were divided among breakfast (25%, 8:00–9:00), lunch (30%, 12:30–13:30),dinner (35%, 18:30–19:30) and an evening snack (10%, 21:00). This weight-reducing dietwas supplemented with a daily multivitamin-plus-minerals (Theragran-M, Walgreen Co.,Deerfield, IL) and 325 mg of ferrous sulphate. Food was weighed before and after each mealto determine actual consumption (Nutritionist-IV, Axxya Systems, Stafford, TX).
Participants spent their waking hours indoors engaged in home-office type work or leisureactivities (5). Total energy expenditure plays an important role in the control of energybalance and has 3 principal components: 1) resting metabolic rate under basal conditions(RMR): the energy expenditure of an individual resting in bed awake and in the fasting state;2) thermic effect of food: the energy expenditure associated with the digestion, absorption,metabolism and storage of food equal to approximately 10% of total energy expenditure;and 3) physical activity-related energy expenditure: the energy expended in all volitionaland non-volitional daily activities. In parallel studies with ad libitum food intake (5),exposure to this same laboratory environment was accompanied by sedentary levels ofphysical activity corresponding to total energy expenditure equal to ~1.5 times the restingmetabolic rate of the study participants (i.e. 25th centile physical activity level), irrespectiveof the presence or absence of sleep loss. In the present study, total energy expenditure wasmeasured by doubly labelled water during each 14-day treatment (5) using individualrespiratory quotients (RQ) and total body water changes derived from the individual foodquotients and changes in body composition during the measurement period (11). On the lastday of each dietary intervention, resting metabolic rate and RQ were measured by indirectcalorimetry under fasting conditions and for 4h after breakfast, and the thermic effect offood was calculated as previously described (5). Technical problems caused loss of restingmetabolic rate data from one participant during the 5.5-h time-in-bed condition. The RQvalues of this subject were imputed using the means of the other participants. Hunger wasmeasured daily before each meal and at 22:30 using 10-cm visual analog scales (12). Resultswere averaged to generate individual 24-h hunger scores. Treatment-related changes weredetermined by subtracting the 2-day mean hunger score before each intervention from thedaily hunger scores during the study.
Body weight and composition and hormone measurementsBefore and after each treatment, participants remained at rest for 48h with identical caloricintake including oral and intravenous doses of glucose at 9:00 (the results of these glucosetolerance tests will be reported in a separate report) and the same carbohydrate-rich meals at14:00 and 19:00 (13). Time-in-bed during this 48-hour period was 7 h/night before, and 8.5or 5.5 h/night after each 14-day intervention to match the assigned sleep condition (Figure1). Fasting body weight and adiposity were assessed in the morning of the first day. Fat-free
Nedeltcheva et al. Page 3
Ann Intern Med. Author manuscript; available in PMC 2011 April 5.
NIH
-PA Author Manuscript
NIH
-PA Author Manuscript
NIH
-PA Author Manuscript

body mass was calculated as the difference between body weight measured by scale (Scale-Tronix Inc., Wheaton, IL) and body fat measured by dual X-ray absorptiometry (LunarProdigy, Madison, WI). During the last 24 hours of this 2-day period, blood was sampledevery 30 min starting at 20:00. Serum leptin and acylated ghrelin concentrations weremeasured by radioimmunoassay (Linco Research, St. Charles, MO), and cortisol and growthhormone by chemiluminescent enzyme immunoassay (Immulite, Diagnostic Products, LosAngeles, CA). Plasma epinephrine and norepinephrine were measured by high-pressureliquid chromatography (13). Twenty-four-hour serum thyroid-stimulating hormone (TSH)and free thyroxine (T4) concentrations were analyzed only at the end of each intervention(Immulite, Diagnostic Products, Los Angeles, CA). Serum triiodothyronine (T3) and reverseT3 were measured in 7 of 10 participants who had sufficient residual serum pooled from 3–4fasting morning samples.
Data analysisBody weight and composition before and mean sleep parameters during each interventionwere compared using paired t-tests. To control for differences in baseline body composition,the effect of 5.5-h vs. 8.5-h time-in-bed (a fixed factor) on the loss of fat and fat-free bodymass as main outcome measures of this study was evaluated using mixed linear models withtreatment period as repeated measure, initial fat and fat-free body mass as time-varyingcovariates, and participants as a random factor. Similar mixed model analyses controllingfor order-of-treatment and differences in fat and fat-free body mass were used to explore theeffects of sleep restriction on ancillary measures, such as resting metabolic rate, RQ, hunger,leptin, ghrelin, and other metabolic hormones, that can be influenced by changes in bodycomposition. Statistical analyses were performed using SPSS 17.0 (SPSS Inc., Chicago, IL).Results in the text are reported as mean (SD).
The funding sources played no role in the design of the study, analysis and interpretation ofthe data, writing of the manuscript, or the decision to submit it for publication.
ResultsStudy participants had mean age 41 (5) y, self-reported habitual sleep 7.7 (0.7) h/day, CES-D score 4 (5), PSQI score 3 (2), sleep respiratory disturbance index 3 (3) events/hour, andresting metabolic rate 1624 (210) kcal/day. Mean sleep duration was reduced by 131 (30)min/day from 7h 25min (32 min) during the 8.5-h time-in-bed condition to 5h 14min (6 min)during the 5.5-h time-in-bed condition (P<0.001, Table 1). When time-in-bed was restrictedto 5.5 hours, subjects went to bed later, 0:43 (37 min) vs. 23:23 (43 min), and got out of bedearlier, 6:14 (36 min) vs. 7:52 (45 min). The body weight and composition of theparticipants before each treatment are summarized in Table 1. Participants consumed similarenergy levels (1447 (227) vs. 1450 (236) kcal/day) during the 8.5-h and 5.5-h time-in-bedcondition, which as intended were considerably lower than their corresponding doublylabeled water-based measures of total energy expenditure (2136 (342) vs. 2139 (393) kcal/day). Carbohydrate, fat, and protein contributed 48 (1), 34 (1), and 18 (1) % of energyduring each study period. Both treatments were accompanied by comparable weight loss(approximately 3 kg, Table 1), however, more than half of the weight loss during the 8.5-htime-in-bed condition and only a quarter of the weight loss during the 5.5-h time-in-bedcondition was fat (55% reduction in fat loss, 1.4 (0.9) vs. 0.6 (0.6) kg, 8.5 vs. 5.5-h sleepopportunity, P=0.043, Table 1, Figure 2). Instead, sleep restriction resulted in considerablyincreased loss of fat-free body mass when compared to the 8.5-h time-in-bed condition (60%increase in fat-free weight loss, 1.5 (1.3) vs. 2.4 (1.4) kg, 8.5 vs. 5.5-h sleep opportunity,P=0.002, Table 1, Figure 2).
Nedeltcheva et al. Page 4
Ann Intern Med. Author manuscript; available in PMC 2011 April 5.
NIH
-PA Author Manuscript
NIH
-PA Author Manuscript
NIH
-PA Author Manuscript

The differential loss of fat and fat-free mass between the two sleep conditions wasaccompanied by changes in several secondary endpoints, including increased hunger duringthe period of sleep restriction (−0.1 (1.2) vs. 0.7 (1.2) cm, mixed linear model P=0.043, 8.5vs. 5.5-h sleep opportunity) and higher fasting and postprandial RQ (Table 1, Figure 3) and24-h acylated ghrelin concentrations (APPENDIX Figure I and Table II) at the end of the5.5-h time-in-bed condition (P=0.04 for each measure). In contrast, resting metabolic rate(P=0.01; Table 1) and 24-h plasma epinephrine concentrations (P=0.005; APPENDIX TableII) were lower at the end of the 5.5-h compared to the 8.5-h time-in-bed condition. Leptinconcentrations declined in parallel with the loss of weight and adiposity (P=0.001;APPENDIX Figure I) without a significant independent effect of sleep loss (APPENDIXTable II). There were no differences in the fractional thermic effect of food (10.2 (7.5) vs.12.8 (6.7) %), 24-h norepinephrine, cortisol, growth hormone, and thyroid hormoneconcentrations at the end of the 8.5-h vs. 5.5-h time-in-bed condition (APPENDIX Table II).
DiscussionThis study examined whether experimental sleep restriction, designed to approximate theshort sleep times of a growing number of people in modern society, may compromise theeffect of reduced-calorie diets on excess adiposity. The fraction of body weight lost as fatduring the 8.5-h time-in-bed condition (56%) is consistent with other published short-termobservations (14); however, the combination of energy and sleep restriction in overweightadults resulted in a modified state of negative energy balance characterized by decreasedloss of fat and considerably increased loss of fat-free body mass (Table 1,Figure 2).Although rodent studies have established that sleep deprivation can have considerablecatabolic effects that resemble protein malnutrition (2), so far, the possibility that sleep lossmay have a similar negative impact in humans has not received much attention: a singlereport found that 1–2 nights of total sleep deprivation was accompanied by elevated 24-hurinary nitrogen excretion (15), whereas the effects of reduced sleep duration have not beentested. Our experimental data now indicate that sleep plays an important role in thepreservation of human fat-free body mass during periods of reduced caloric intake.
In addition to its clinically relevant primary outcome measures, this study also examined anancillary set of mostly research oriented metabolic endpoints that have been hypothesized toreflect important mechanistic relationships between sleep and human energy metabolism (6).The difference in RQ (Figure 3) between the two treatments suggests that sleep loss wasaccompanied by changes in substrate utilization, which is in good agreement with theobserved sparing of body fat. Serum concentrations of acylated ghrelin also increased duringthe short-sleep condition (APPENDIX Table II), which resembled the changes in totalghrelin associated with caloric restriction and acute sleep deprivation (6). Acylated ghrelinhas been shown to reduce energy expenditure, stimulate hunger and food intake, promoteretention of fat, and increase hepatic glucose production to support the availability of fuel toglucose-dependent tissues (8–10,16). In our experiment, sleep restriction was accompaniedby a similar pattern of increased hunger and elevated fasting and postprandial RQ valuesconsistent with relatively reduced oxidation of fat (Figure 3). Importantly, sleep restrictionwas not accompanied by higher 24-h concentrations of catabolic hormones such as serumcortisol, T3 and T4, and plasma catecholamines (APPENDIX Table II). Together, theseresults suggest that the loss of sleep at times of limited food intake amplifies the pattern ofghrelin-associated changes in human hunger, glucose and fat utilization, and energymetabolism. Thus, the increased loss of fat-free body mass during the short-sleep conditionof our study may be due to increased conversion of body protein into glucose to support themore prolonged metabolic needs of the waking brain and other glucose-dependent tissues(17). Although this hypothesis is compatible with the energy-saving and restorative
Nedeltcheva et al. Page 5
Ann Intern Med. Author manuscript; available in PMC 2011 April 5.
NIH
-PA Author Manuscript
NIH
-PA Author Manuscript
NIH
-PA Author Manuscript

functions of mammalian sleep (1), it remains untested and requires more detailed humanstudies.
The reduced loss of fat during the short-sleep condition implies a difference in the balanceof energy intake and expenditure between the two treatments. Based on energy conversionfactors of 9.46 and 4.32 kcal/gram of lost fat and protein (11) and 21% protein content offat-free body mass, the estimated energy deficit during the 5.5-h time-in-bed condition was~520 kcal/day compared to ~920 kcal/day during the 8.5-h time-in-bed condition. Sincecaloric intake was nearly identical, these calculations suggest that the energy expenditure ofthe participants during the 5.5-h vs. 8.5-h time-in-bed condition was reduced by ~400 kcal/day. Using doubly labeled water, we were not able to detect a change in total energyexpenditure as suggested by the differential loss of body fat between the two sleepconditions. Unfortunately, the larger than anticipated variance of the total energyexpenditure data makes the interpretation of these results rather difficult. Our initial powercalculations were based on previous work showing that the standard deviation for within-subject change in total energy expenditure by doubly labeled water was 140 kcal/day. Thiswould have given us 80% power to detect a change in total energy expenditure between thetwo sleep conditions of 392 kcal/day. However, the observed standard deviation in our studywas 340 kcal/day. As a result, the confidence intervals for total energy expendituremeasured by doubly labeled water include the change that would be required to explain thedifferences in the composition of weight loss between the two treatments (~400 kcal/day).The high standard deviation may have resulted from the lower total energy expenditureduring this inpatient weight loss study protocol and variation in physical activity betweenvisits. It should also be noted that the strongest difference between treatments was theincreased loss of fat-free mass during the 5.5-h time-in-bed condition (Table 1, Figure 2),which has the weakest relationship to energy balance because lean tissue is mostly water andhas low energy density. Since there is also variation in the measurement of change in bodycomposition, the actual difference in total energy expenditure between the two sleepconditions may lie somewhere between 400 kcal/day suggested by the difference in fat lossand the absence of change in total energy expenditure as measured with doubly labeledwater.
Ongoing depletion of energy stores in humans is accompanied by metabolic,neuroendocrine, and behavioral compensations to produce opposing declines in RMR andnon-resting energy expenditure (18–22). Notably, the resting metabolic rate wassignificantly lower at the end of the 5.5-h vs. 8.5-h time-in-bed condition. This decline inresting metabolic rate was greater than expected based on the observed loss of fat and fat-free body mass alone (Table 1), and could contribute to the decrease in estimated energyexpenditure during the period of combined caloric and sleep restriction (18–20). A greaterdecline in adrenomedullary activity (APPENDIX Table II) (21) and energy expenditure inactivities of daily living (7,19,22) could also enhance the development of a more thriftyphenotype in the presence of sleep loss. The fat-derived hormone, leptin, plays a key role inthe metabolic and neuroendocrine adaptations to weight loss (20) and, in previousexperiments, short-term sleep restriction was accompanied by lower 24-h concentrations ofplasma leptin (6,23). However, this and other controlled studies (5,7,24,25) did not find asignificant independent effect of sleep loss on 24-h leptin levels, suggesting that acuity ofexposure to sleep and caloric restriction may be important determinants of any such change(3).
In a broader context, the results of this study shed new light on the paradoxical associationof human obesity with the loss of the most energy-efficient and sedentary human behavior,which is sleep (26). Our data suggest that insufficient sleep may compromise themaintenance of fat-free body mass and promote the retention of fat when people aim to re-
Nedeltcheva et al. Page 6
Ann Intern Med. Author manuscript; available in PMC 2011 April 5.
NIH
-PA Author Manuscript
NIH
-PA Author Manuscript
NIH
-PA Author Manuscript

establish their usual weight following life events associated with excessive food intake andincreased adiposity. The enhanced metabolic, neuroendocrine, and behavioral compensationin the form of increased hunger and reduced energy expenditure that develop in response tocombined caloric and sleep restriction can disrupt their adherence to a lower-energy diet andpromote efficient weight regain once it is discontinued. However, it should be noted that dueto the high cost and technical difficulty of such experiments, our discussion is based on thedetailed laboratory evaluation of a small number of subjects over a limited period of time.Additional studies will be needed to examine the longer-term effects of sleep loss on bodycomposition, energy metabolism, and substrate utilization in weight-reduced individuals.
In summary, exposure of overweight middle-aged adults to 2 weeks of combined energy andsleep restriction produced a catabolic state characterized by reduced loss of body fat andincreased loss of fat-free body mass, accompanied by increased hunger and changes inenergy expenditure and the neuroendocrine control of substrate utilization. These resultshighlight the importance of human sleep for the maintenance of fat-free body mass duringperiods of reduced energy intake and raise the possibility that insufficient sleep maycompromise multiple factors that contribute to the efficacy of and adherence to dietaryenergy-restriction strategies for metabolic risk reduction.
AcknowledgmentsThis study involved over 250 inpatient days in the University of Chicago Sleep Research Laboratory, which isdirected by Eve Van Cauter. We thank Theodore Karrison for advice with the selection of an appropriate approachfor statistical analysis, Eve Van Cauter for advice during the planning of this study, and the staff of the Universityof Chicago Clinical Resource Center, Sleep Research Laboratory, Endocrinology Clinic, and Diabetes Research andTraining Center for their skilled technical assistance.
Primary Funding Source: This work was supported by NIH grants P01-AG11412, R01-HL089637, CTSA-RR024999 and P60-DK020595.
References1. Siegel JM. Clues to the functions of mammalian sleep. Nature. 2005; 437(7063):1264–1271.
[PubMed: 16251951]2. Everson CA, Wehr TA. Nutritional and metabolic adaptations to prolonged sleep deprivation in the
rat. Am J Physiol. 1993; 264(2 Pt 2):R376–R387. [PubMed: 8447493]3. Everson CA, Szabo A. Recurrent restriction of sleep and inadequate recuperation induce both
adaptive changes and pathological outcomes. Am J Physiol Regul Integr Comp Physiol. 2009;297(5):R1430–R1440. [PubMed: 19692662]
4. Ravussin E, Lillioja S, Anderson TE, Christin L, Bogardus C. Determinants of 24-hour energyexpenditure in man. Methods and results using a respiratory chamber. J Clin Invest. 1986; 78(6):1568–1578. [PubMed: 3782471]
5. Nedeltcheva AV, Kilkus JM, Imperial J, Kasza K, Schoeller DA, Penev PD. Sleep curtailment isaccompanied by increased intake of calories from snacks. Am J Clin Nutr. 2009; 89(1):126–133.[PubMed: 19056602]
6. Spiegel K, Tasali E, Penev P, Van Cauter E. Brief communication: Sleep curtailment in healthyyoung men is associated with decreased leptin levels, elevated ghrelin levels, and increased hungerand appetite. Ann Intern Med. 2004; 141(11):846–850. [PubMed: 15583226]
7. Schmid SM, Hallschmid M, Jauch-Chara K, et al. Short-term sleep loss decreases physical activityunder free-living conditions but does not increase food intake under time-deprived laboratoryconditions in healthy men. Am J Clin Nutr. 2009; 90(6):1476–1482. [PubMed: 19846546]
8. Tschop M, Smiley DL, Heiman ML. Ghrelin induces adiposity in rodents. Nature. 2000; 407(6806):908–913. [PubMed: 11057670]
9. Nogueiras R, Tschop MH, Zigman JM. Central nervous system regulation of energy metabolism:ghrelin versus leptin. Ann N Y Acad Sci. 2008; 1126:14–19. [PubMed: 18448790]
Nedeltcheva et al. Page 7
Ann Intern Med. Author manuscript; available in PMC 2011 April 5.
NIH
-PA Author Manuscript
NIH
-PA Author Manuscript
NIH
-PA Author Manuscript

10. Rodriguez A, Gomez-Ambrosi J, Catalan V, et al. Acylated and desacyl ghrelin stimulate lipidaccumulation in human visceral adipocytes. Int J Obes (Lond). 2009; 33(5):541–552. [PubMed:19238155]
11. Black AE, Prentice AM, Coward WA. Use of food quotients to predict respiratory quotients for thedoubly-labelled water method of measuring energy expenditure. Hum Nutr Clin Nutr. 1986; 40(5):381–391. [PubMed: 3771290]
12. Hill AJ, Blundell JE. Nutrients and behaviour: research strategies for the investigation of tastecharacteristics, food preferences, hunger sensations and eating patterns in man. J Psychiatr Res.1982; 17(2):203–212. [PubMed: 6764938]
13. Penev P, Spiegel K, Marcinkowski T, Van Cauter E. Impact of carbohydrate-rich meals on plasmaepinephrine levels: dysregulation with aging. J Clin Endocrinol Metab. 2005; 90(11):6198–6206.[PubMed: 16091491]
14. Krotkiewski M, Landin K, Mellstrom D, Tolli J. Loss of total body potassium during rapid weightloss does not depend on the decrease of potassium concentration in muscles. Different methods toevaluate body composition during a low energy diet. Int J Obes Relat Metab Disord. 2000; 24(1):101–107. [PubMed: 10702758]
15. Scrimshaw NS, Habicht JP, Pellet P, Piche ML, Cholakos B. Effects of sleep deprivation andreversal of diurnal activity on protein metabolism of young men. Am J Clin Nutr. 1966; 19(5):313–319. [PubMed: 5923588]
16. Dezaki K, Sone H, Yada T. Ghrelin is a physiological regulator of insulin release in pancreaticislets and glucose homeostasis. Pharmacol Ther. 2008; 118(2):239–249. [PubMed: 18433874]
17. Boyle PJ, Scott JC, Krentz AJ, Nagy RJ, Comstock E, Hoffman C. Diminished brain glucosemetabolism is a significant determinant for falling rates of systemic glucose utilization duringsleep in normal humans. J Clin Invest. 1994; 93(2):529–535. [PubMed: 8113391]
18. Ravussin E, Burnand B, Schutz Y, Jequier E. Energy expenditure before and during energyrestriction in obese patients. Am J Clin Nutr. 1985; 41(4):753–759. [PubMed: 3984927]
19. Leibel RL, Rosenbaum M, Hirsch J. Changes in energy expenditure resulting from altered bodyweight. New England Journal of Medicine. 1995; 332(10):621–628. [PubMed: 7632212]
20. Rosenbaum M, Goldsmith R, Bloomfield D, et al. Low-dose leptin reverses skeletal muscle,autonomic, and neuroendocrine adaptations to maintenance of reduced weight. J Clin Invest. 2005;115(12):3579–3586. [PubMed: 16322796]
21. Landsberg L. Feast or famine: the sympathetic nervous system response to nutrient intake. CellMol Neurobiol. 2006; 26(4–6):497–508. [PubMed: 16705481]
22. Redman LM, Heilbronn LK, Martin CK, et al. Metabolic and behavioral compensations inresponse to caloric restriction: implications for the maintenance of weight loss. PLoS One. 2009;4(2):e4377. [PubMed: 19198647]
23. Spiegel K, Leproult R, L'Hermite-Baleriaux M, Copinschi G, Penev PD, Van Cauter E. Leptinlevels are dependent on sleep duration: relationships with sympathovagal balance, carbohydrateregulation, cortisol, and thyrotropin. J Clin Endocrinol Metab. 2004; 89(11):5762–5771. [PubMed:15531540]
24. Shea SA, Hilton MF, Orlova C, Ayers RT, Mantzoros CS. Independent circadian and sleep/wakeregulation of adipokines and glucose in humans. Journal of Clinical Endocrinology & Metabolism.2005; 90(5):2537–2544. [PubMed: 15687326]
25. Littman AJ, Vitiello MV, Foster-Schubert K, et al. Sleep, ghrelin, leptin and changes in bodyweight during a 1-year moderate-intensity physical activity intervention. Int J Obes (Lond). 2007;31(3):466–475. [PubMed: 16909130]
26. Patel SR, Hu FB. Short sleep duration and weight gain: a systematic review. Obesity (SilverSpring). 2008; 16(3):643–653. [PubMed: 18239586]
Nedeltcheva et al. Page 8
Ann Intern Med. Author manuscript; available in PMC 2011 April 5.
NIH
-PA Author Manuscript
NIH
-PA Author Manuscript
NIH
-PA Author Manuscript

AppendixAPPENDIX Table I
Individual changes in body weight and composition
Body weight (kg) Body fat (kg) Fat-free mass (kg)
ID T TIB-8.5h TIB-5.5h TIB-8.5h TIB-5.5h TIB-8.5h TIB-5.5h
Pre Post Δ Pre Post Δ Pre Post Δ Pre Post Δ Pre Post Δ Pre Post Δ
1, M 8.5 83.0 81.1 −1.9 81.4 78.7 −2.7 21.7 20.3 −1.5 20.7 19.0 −1.7 61.3 60.8 −0.4 60.7 59.7 −1.0
2, M 5.5 87.2 85.0 −2.2 87.4 84.2 −3.2 20.8 19.3 −1.5 20.8 20.0 −0.8 66.4 65.7 −0.7 66.6 64.2 −2.4
3, M 8.5 76.9 73.5 −3.4 74.4 71.9 −2.5 17.0 15.5 −1.5 14.9 14.7 −0.2 59.9 58.0 −1.9 59.5 57.2 −2.3
4, F 5.5 73.8 72.1 −1.7 74.0 72.3 −1.7 34.3 32.7 −1.6 34.5 33.5 −1.0 39.5 39.4 −0.1 39.5 38.8 −0.7
5, M 8.5 75.5 73.1 −2.4 72.6 70.4 −2.2 25.9 24.4 −1.5 23.9 23.0 −0.9 49.6 48.7 −0.9 48.7 47.4 −1.3
6, M 8.5 102.1 95.8 −6.3 97.5 92.2 −5.3 31.9 28.7 −3.3 27.5 27.5 0.0 70.2 67.1 −3.0 70.0 64.7 −5.3
7, M 5.5 84.7 81.4 −3.3 85.2 81.3 −3.9 22.1 21.2 −0.9 22.2 21.7 −0.4 62.7 60.2 −2.4 63.0 59.6 −3.5
8, M 5.5 97.4 94.0 −3.4 94.4 91.2 −3.2 35.2 35.6 0.4 32.9 32.9 0.1 62.2 58.4 −3.8 61.5 58.3 −3.3
9, F 8.5 67.2 65.3 −1.9 69.4 67.3 −2.1 30.6 28.5 −2.1 31.0 30.7 −0.3 36.6 36.8 0.2 38.4 36.6 −1.8
10, F 8.5 72.4 69.7 −2.7 69.1 65.6 −3.5 24.9 23.9 −0.9 21.8 20.6 −1.2 47.5 45.7 −1.8 47.3 45.0 −2.3
ID – subject number and gender (F: female; M: male); TIB-8.5h – 8.5-h time-in-bed condition; TIB-5.5h – 5.5-h time-in-bed condition; T – treatment order (8.5: subject completed TIB-8.5h condition first; 5.5: subject completed TIB-5.5hcondition first); Pre – measurement taken before treatment; Post – measurement taken at the end of the treatment period; Δ– change during corresponding treatment calculated as the difference of the Post and Pre measurement.
APPENDIX Table II
Metabolic hormone measurements
Pre-treatment End of treatment
TIB-8.5h TIB-5.5h TIB-8.5 TIB-5.5h
24-h serum leptin (µg/L) 13.1 (10.2) 12.4 (9.5) 9.7 (7.2) 9.1 (9.2)
24-h acylated ghrelin (ng/L) 81 (50) 73 (38) 75 (40) 84 (47)*
24-h serum growth hormone (µg/L) 0.88 (0.49) 0.79 (0.34) 0.81 (0.38) 0.95 (0.47)
24-h plasma epinephrine (pmol/L) 129 (38) 136 (58) 140 (45) 114 (30)**
24-h plasma norepinephrine (pmol/L) 1171 (589) 1291 (829) 1161 (512) 1104 (481)
24-h serum cortisol (nmol/L) 196 (21) 198 (25) 190 (22) 193 (23)
24-h serum TSH (mU/L) 1.2 (0.6) 1.2 (0.5)
24-h serum free T4 (pmol/L) 16.1 (1.2) 16.5 (1.2)
(ng/dL) 1.25 (0.10) 1.28 (0.10)
Serum T3 (nmol/L, n=7) 1.89 (0.18) 1.95 (0.24)
Data are mean (SD) values (n=10 except for T3 where n=7).*P = 0.039,
**P = 0.005: effect of sleep restriction at the end of the 5.5-h vs. 8.5-h time in bed condition based on a mixed linear model
controlling for crossover study design (treatment period) and final body composition.
TSH: thyroid stimulating hormone; T4: thyroxine; T3: triiodothyronin
Nedeltcheva et al. Page 9
Ann Intern Med. Author manuscript; available in PMC 2011 April 5.
NIH
-PA Author Manuscript
NIH
-PA Author Manuscript
NIH
-PA Author Manuscript
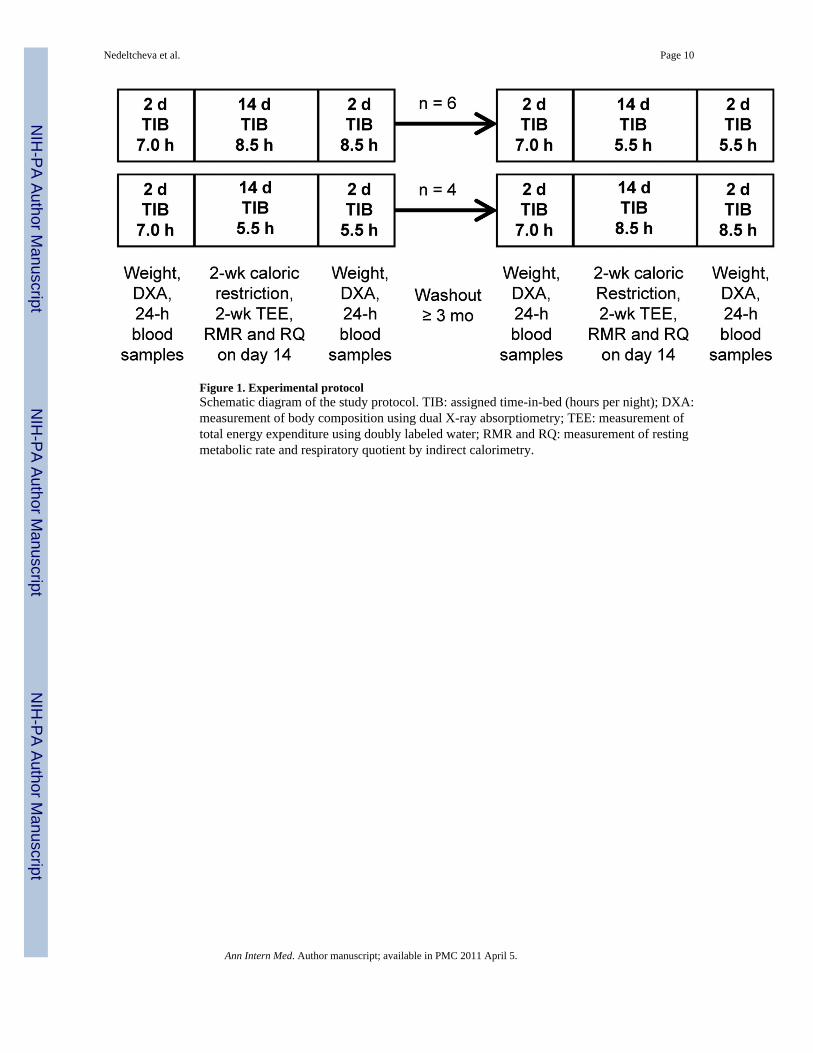
Figure 1. Experimental protocolSchematic diagram of the study protocol. TIB: assigned time-in-bed (hours per night); DXA:measurement of body composition using dual X-ray absorptiometry; TEE: measurement oftotal energy expenditure using doubly labeled water; RMR and RQ: measurement of restingmetabolic rate and respiratory quotient by indirect calorimetry.
Nedeltcheva et al. Page 10
Ann Intern Med. Author manuscript; available in PMC 2011 April 5.
NIH
-PA Author Manuscript
NIH
-PA Author Manuscript
NIH
-PA Author Manuscript

Figure 2. Changes in body weight and compositionBox plots of the weight loss and its composition during the 8.5-h (open circles) and 5.5-h(solid circles) time-in-bed condition (n=10). Asterisk: significant difference in loss of fat(P=0.043) and fat-free body mass (P=0.002) between the two sleep conditions controllingfor study period (initial vs. crossover) and pre-treatment body composition.
Nedeltcheva et al. Page 11
Ann Intern Med. Author manuscript; available in PMC 2011 April 5.
NIH
-PA Author Manuscript
NIH
-PA Author Manuscript
NIH
-PA Author Manuscript

Figure 3. Substrate utilizationMean (±SD) respiratory quotient (RQ) under fasting conditions (time 0) and during fourconsecutive 1-h intervals after breakfast at the end of the 8.5-h (open triangles) and 5.5-h(solid circles) time-in-bed condition (n=10). Asterisk: significant difference in fasting(P=0.042) and 4-h postprandial RQ (P=0.038) controlling for study period and bodycomposition at the end of each intervention.
Nedeltcheva et al. Page 12
Ann Intern Med. Author manuscript; available in PMC 2011 April 5.
NIH
-PA Author Manuscript
NIH
-PA Author Manuscript
NIH
-PA Author Manuscript
APPENDIX Figure I. Selected metabolic hormone profilesA: Mean ± SE (n=10) 24-hour profiles of serum leptin at the beginning (open circles) andthe end (solid circles) of the 8.8-h time-in-bed condition (TIB-8.5h, left panels) and 5.5-htime-in-bed condition (TIB-5.5h, right panels) condition; B: Mean ± SE (n=10) 24-hourprofiles of serum acylated ghrelin at the beginning (open circles) and the end (solid circles)of the TIB-8.5h (left panels) and TIB-5.5h (right panels) condition. Times of controlledidentical calorie intake are marked with vertical dotted bars.
Nedeltcheva et al. Page 13
Ann Intern Med. Author manuscript; available in PMC 2011 April 5.
NIH
-PA Author Manuscript
NIH
-PA Author Manuscript
NIH
-PA Author Manuscript

NIH
-PA Author Manuscript
NIH
-PA Author Manuscript
NIH
-PA Author Manuscript
Nedeltcheva et al. Page 14
Table 1
Sleep and reduction in body weight and adiposity
Baseline characteristics TIB-8.5h TIB-5.5h Differencea P
Body weight (kg) 82.0 (11.2) 80.5 (10.3) −1.5 (2.1) 0.057
Body mass index (BMI, kg/m2) 27.5 (2.2) 27.1 (2.0) −0.5 (0.7) 0.069
Body fat (kg) 26.4 (6.4) 25.0 (6.3) −1.4 (1.6) 0.022
Fat-free body mass (kg) 55.6 (11.5) 55.5 (11.2) −0.1 (0.7) 0.84
14-day mean sleep parameters TIB-8.5h TIB-5.5h Differencea P
Total sleep time (h:min) 7:25 (0:32) 5:14 (0:06) −2:11 (0:30) <.001
Sleep efficiency (%) 87 (6) 95 (2) 8 (5) 0.001
Sleep onset latency (min) 21 (9) 7 (4) −14 (6) <.001
Wake (min) 66 (31) 16 (5) −50 (29) <.001
Stage 1 sleep (min) 29 (10) 12 (3) −17 (9) <.001
Stage 2 sleep (min) 264 (37) 180 (42) −84 (36) <.001
Slow wave sleep (stages 3+4; min) 43 (28) 46 (34) 3 (24) 0.66
REM sleep (min) 108 (22) 76 (13) −32 (16) <.001
End of treatment TIB-8.5h TIB-5.5h B (95% CI) P
Weight loss (kg) 2.9 (1.4) 3.0 (1.0) 0.2 (−0.2, 0.7)b 0.24
Loss of fat-free mass (kg) 1.5 (1.3) 2.4 (1.4) 1.0 (0.4, 1.5)b 0.002
Loss of fat (kg) 1.4 (0.9) 0.6 (0.6) −0.7 (−1.4, −0.03)b 0.043
Fraction of weight loss as fat (%) 56 (35) 25 (24) −31 (−49, −12)b 0.004
Fasting RQ 0.80 (0.04) 0.83 (0.04) 0.03 (0.01, 0.06)c 0.042
Postprandial RQ (4-h mean) 0.80 (0.04) 0.83 (0.05) 0.03 (.002, 0.06)c 0.038
RMR (kcal/day, n=9) 1505 (262) 1391 (180) −147 (−253, −41)c 0.010
Data are mean (SD) values (n=10 except for RMR where n=9). TIB-5.5h and TIB-8.5h: 5.5-h and 8.5-h time-in-bed conditions;
apaired t-test comparisons;
bbeta coefficient (B) for the effect of sleep restriction (TIB-5.5h vs. TIB-8.5h) and its 95% confidence interval (CI) based on a mixed linear model
controlling for crossover study design (treatment period as repeated measure) and baseline fat and fat-free body mass as time-varying covariates;
ceffect of sleep restriction in a mixed linear model controlling for treatment period and body composition at the end of each intervention.
REM: rapid eye movement; RQ: respiratory quotient; RMR: resting metabolic rate
Ann Intern Med. Author manuscript; available in PMC 2011 April 5.