NEBRASKAextensionpublications.unl.edu/assets/pdf/mp105.pdf · Appreciation is expressed to the...
150
Extension is a Division of the Institute of Agriculture and Natural Resources at the University of Nebraska– Lincoln cooperating with the Counties and the United States Department of Agriculture. University of Nebraska–Lincoln Extension educational programs abide with the nondiscrimination policies of the University of Nebraska–Lincoln and the United States Department of Agriculture. Copyright © 2017 e Board of Regents of the University of Nebraska. All rights reserved. Agricultural Research Division University of Nebraska Extension Institute of Agriculture and Natural Resources University of Nebraska–Lincoln NEBRASKA MP105 2018 Beef Cattle Report 2018 Beef Cattle Report MP105
-
Upload
trinhduong -
Category
Documents
-
view
213 -
download
0
Transcript of NEBRASKAextensionpublications.unl.edu/assets/pdf/mp105.pdf · Appreciation is expressed to the...
Extension is a Division of the Institute of Agriculture and Natural Resources at the University of Nebraska–Lincoln cooperating with the Counties and the United States Department of Agriculture.
University of Nebraska–Lincoln Extension educational programs abide with the nondiscrimination policies of the University of Nebraska–Lincoln and the United States Department of Agriculture.
Copyright © 2017 The Board of Regents of the University of Nebraska. All rights reserved.
Agricultural Research DivisionUniversity of Nebraska Extension
Institute of Agriculture and Natural ResourcesUniversity of Nebraska–Lincoln
Non ProfitUS Postage
PAIDUNLP.O. Box 830908
C220 ANSCLincoln, NE 68583-0908 USA
NE
BR
AS
KA
MP105
2018Beef Cattle
Report2018 Beef C
attle Report
MP105
Electronic copies of Nebraska Beef Reports and Summaries available at: http://beef.unl.edu, click on reports.
AcknowledgementsAppreciation is expressed to the following firms, associations, or agencies who provided
grant support for research in the beef cattle program.
Agriculture and Food Research Initiative Competitive Grant/ USDA/NIFA Foundation Program: Animal Reproduction
The Beef Checkoff, Centennial, ColoCargill Corn Milling, Blair, Neb.CSIRO, Commonwealth Scientific and Industrial Research
Organization, Dickson, ACT, AustraliaDr. Kenneth and Caroline McDonald Eng Foundation
San Antonio, Tex.Dow AgroSciences, Indianapolis, INElanco Animal Health, Indianapolis, Ind.Lallemand Animal Nutrition. Montreal, Quebec, CanadaMerck Animal Health, Madison, NJNational Cattlemen’s Beef Association, Centennial, Colo.Nebraska Beef Council, Kearney, Neb.Nebraska Cattlemen Research and Education Foundation,
Lincoln, Neb.Nebraska Center for Energy Sciences Research,
University Of Nebraska, Lincoln, Neb
Nebraska Corn Board, Lincoln, Neb.Nebraska Environmental Trust, Lincoln, Neb.Novus International, Saint Charles, MOPrince Agri Products, Inc. Quincy, ILRamaekers Nutrition, Santa Cruz, CARich Porter. Reading, KSSchaumann Agri International, Mendota Heights, MNSyngenta. Greensboro, NCUSDA MultiState Hatch Funds (Pasture work)USDA NIFA Climate Change (Samodha)USDA NIFA Award 2012 68003–30155USDA grant Award 2012–68002–19823USDA SAREUSDA Multi-State Hatch Funds
(Global Beef Competitiveness and Value Research)USDA-ARS Award 1932–21630–003–06.
Appreciation is also expressed to the following firms who provide products or services
Beefmaster Breeders UnitedBirko Corporation. Henderson, COCargill Corn Milling, Blair, Neb.Cattlemen’s Nutrition Services, LLC, Lincoln, NEElanco Animal Health, Indianapolis, Ind.Florida Food Products , Eustis, FLGreater Omaha Packing Company, Omaha, Neb.Iowa Limestone, Des Moines, Iowa
Novus International, Inc., St. Charles, Mo.Tim Adams & Sons, Scottsbluff, NELeo Hoehn, Scottsbluff, NEBetaSeed, Scottsbluff, NETyson Foods. Springdale, ARUNL Food Processing CenterUS Meat Animal Research Center, Clay Center, Neb.USDA Meat Grading and Certification Branch, Omaha, Neb
Appreciation is also expressed to the following Research Technicians, Unit Managers, and Crew involved in the research Programs at our various locations.
Eastern Nebraska Research and Extension Center, Ithaca
Henry HilscherGene AndersonKerry StohlmannTJ SabatkaBrent TenopirMitch NormanElizabeth SchumackerBrett Melton
Sam CairesKen CejkaTara HarmsBump KraegerAaron LauerMichael LubenBrett MehomAllison Miller
Karl MolineJustin MooreChuck RezacKen RezacBen SchneiderMark SchroederMatt SillivanKeith Street
Department of Animal Science, Lincoln
Jeff BergmanKevin BahrCurt BittnerBethany BlackburnRobby BondurantBradley BoydClay Boyles
Zac CarlsonJana GramkowHannah WilsonBrent JohnsonMelissa JollyTommi JonesScott Kurz
Erin MarotzClyde NaberSamantha PowellKyle ReganCalvin SchrockDarren Strizek
Gumundsen Sandhills Laboratory, Whitman
Andy ApplegarthJacki Musgrave
John NolletteRoger Carpenter
Panhandle Research & Extension Center, Scottsbluff
Brianna Conroy Nabor Guzman
West Central Research & Extension Center, North Platte
Mike KirbyJess Milby
T. L. MeyerJim Teichert
High Plains Ag Laboratory
Jacob Hansen
2018 Nebraska Beef Cattle Report · 3
Table of Contents 2018 Nebraska Beef Cattle Report
Cow/Calf
Analyses of Birthdate and Growth in Beef Heifers Categorized by Puberty and Pregnancy Status .................................................................5Letrozole: A Steroid- Free Estrous Synchronization Method ................................................................................................................................. 9Comparison of Two Alternate Prostaglandin Products in Yearling Beef Heifers .............................................................................................. 12Impact of Pre- and Postpartum Nutrition on March- calving Cow and Progeny Productivity ....................................................................... 15Effects of Late Gestation Supplementation, Synchronization, and Creep Feeding in a Spring Calving Beef Herd in the
Nebraska Sandhills ............................................................................................................................................................................................. 18Effect of Supplementation during the Breeding Season on a May- calving Herd in the Nebraska Sandhills ................................................. 21Impact of Winter Supplementation of May Calving Cows and Heifer Development System in Two Different Breeding Seasons
on Subsequent Growth and Reproduction .................................................................................................................................................... 24Chopped Sugar Beets as a Component of Beef Cow Diets .................................................................................................................................. 28Effects of Production System on Cow and Calf Performance ............................................................................................................................. 30Effect of Injectable Trace Mineral on Reproductive Performance in Beef Heifers ............................................................................................33
Growing
Steer Performance Grazing Corn Residue and Supplemented with Modified Distillers Grains plus Solubles with or without Urea ........35Supplementing Rumen Undegradable Protein to Grazing Cattle ....................................................................................................................... 38Effect of Backgrounding System on Performance and Profitability of Yearling Beef Steers............................................................................ 40Evaluation of Corn Distillers Solubles on Growing Steer Performance ............................................................................................................. 45Evaluation of Brown Midrib Corn Silage for Growing and Backgrounding Beef Steers ................................................................................. 47Nutrient Digestibility and Fermentation of Brown Midrib Corn Fed to Growing Beef Steers ...................................................................... 49Rumen Undegradable Protein Content and Digestibility of Corn Silage and High- moisture Corn ..............................................................52Impact of Intake on Methane Production in Growing Steers ..............................................................................................................................55
Forage and Residue Resource Management
The Effect of Harvest Method and Ammoniation of Corn Residue on Growing Calf Performance ..............................................................57Late Summer Planted Oat- Brassica Forage Quality Change during Winter Grazing ...................................................................................... 60The Effect of Inoculants on Nutrient Losses of Corn Silage and High- moisture Corn Stored in PVC Mini Silos ...................................... 63Effect of Continuous or Rotational Grazing on Growing Steer Performance and Land Production ............................................................ 67Evaluating Methods of Estimating Forage Intake by Grazing Cattle ................................................................................................................. 70
Animal Behavior and Management
Effects of Movement and Activity Behavior in a Pasture System Compared to Time ......................................................................................72Repeated Calm Handling Can Lead to More Docile Cattle..................................................................................................................................75Experience Improves the Reliability of Subjective Measurements of Temperament in Beef Cattle ............................................................... 78Evaluation of Several Insecticide Delivery Methods for Managing Horn Flies (Haematobia irritans, Diptera: Muscidae)
on Nebraska Pastured Cattle .............................................................................................................................................................................81
4 · 2018 Nebraska Beef Cattle Report
Finishing
Evaluation of Corn Silage Hybrids with the Brown Midrib Trait and Silage Inclusion for Finishing Cattle ................................................ 86Effects of Kernel Processing at Harvest of Brown Midrib Corn Silage on Finishing Performance of Steers ................................................ 89Impact of Syngenta Enogen Feed Corn on Finishing Cattle Performance and Carcass Characteristics ....................................................... 92Evaluation of Corn Distillers Solubles on Finishing Steer Performance ........................................................................................................... 95Evaluation of Protein from Distillers Grains in Finishing Diets on Nutrient Digestibility ............................................................................. 98Impact of Corn Oil Removal from Modified Distillers Grains Plus Solubles and Supplemental Corn Oil on Finishing
Cattle Performance .......................................................................................................................................................................................... 102Impact of Feeding Distillers Grains with or without Oil Removal as well as Supplemental Corn Oil on Nutrient Digestibility
by Finishing Cattle ........................................................................................................................................................................................... 105Impact of Ramackers Immune Primer on Finishing Beef Cattle Performance and Liver Abscess Rate ......................................................109Evaluation of Revalor- XH for beef heifers fed different days on feed ................................................................................................................113Effect of Revalor- XR and Revalor- XH on Heifer Performance and Carcass Characteristics ........................................................................ 116Effects of Production System and Post- weaning Management on Finishing Performance and Carcass Characteristics of
Steer and Heifer Calves ...................................................................................................................................................................................120
Beef Products
Production of High- quality Beef– The Nebraska Advantage .............................................................................................................................. 123Shelf Life of Ground Beef from Cattle Fed Distillers Grains Containing Different Amounts of Oil ............................................................ 127Using a Cured Meat Model System to Investigate Factors that Influence Cured Color Development .........................................................129Effect of Myoglobin State on Color Stability of High Pressure Processed Ground Beef ................................................................................ 132Effect of Ingredients and Packaging on Color of High Pressure Processed Ground Beef .............................................................................. 135Antimicrobial Interventions and Application Time Effects on Ground Beef Quality .................................................................................... 139The Relationship between Marbling, Superoxide Dismutase, and Beef Tenderness ....................................................................................... 141Potential Errors in Determination of Longissimus Muscle Area in Carcasses from Heifers Fed with or without
Zilpaterol Hydrochloride ................................................................................................................................................................................ 143Impact of Dietary Fat Source on Beef Display Life .............................................................................................................................................. 145
Explanation of Statistics
Statistics Used in the Nebraska Beef Report and Their Purpose ........................................................................................................................148
2018 Nebraska Beef Cattle Report · 5
© The Board Regents of the University of Nebraska. All rights reserved.
mid- winter, pre- synchronization, AI, first pregnancy diagnosis, and final pregnancy diagnosis. Weaning BW was either a single measure or an average of 2 measures taken within 2 to 3 wk after arriving at WCREC and occurred from mid- October to early November. Mid- winter BW was measured between mid- January to mid- February. Pre- synchronization was averaged from 2 BW taken 10 d apart immediately prior to MGA supplementation and occurred in mid- April. Body weight recorded at AI was measured at PG injection in late May. First pregnancy diagnosis BW occurred in mid- July, approximately 45 d after the last AI date. Final pregnancy diagnosis BW was measured in late September, approximate-ly 45 d after bull removal. From the BW measures, 8 ADG measures were calculated for the database: weaning to mid- winter, mid- winter to pre- synchronization, pre- synchronization to AI, AI to first pregnancy diagnosis, first pregnancy diagnosis to final pregnancy diagnosis, weaning to pre- synchronization, weaning to AI, and AI to final pregnancy diagnosis.
Heifers were categorized by 5 differ-ent approaches: 1) pubertal status prior to estrus synchronization, 2) whether or not detected in estrus and inseminated, 3) heifers impregnated by AI vs all other heifers, 4) final pregnancy status (yes vs no), and 5) a 5- way classification account-ing for AI and pregnancy status. The 5- way classification included heifers conceiving to AI (AIpreg, n=816), heifers subjected to AI that subsequently conceived to bull (AIbull, n=351), heifers not inseminated that were impregnated by bull (notAIpreg, n=150), heifers inseminated that were not pregnant (AIopen, n=93), heifers not inseminated and not pregnant (notAIopen, n=28).
The GLIMMIX procedure of SAS was used to retrospectively evaluate if Julian birthdate, cycling status prior to breeding, and BW measures collected from weaning through final pregnancy diagnosis varied among the categories in the different approaches. The model included birth yr as
Therefore the objective of this study was to retrospectively analyze heifer data to evaluate how growth up to and through the breeding season differed when beef heifers were categorized by puberty and pregnancy status.
Procedure
The University of Nebraska- Lincoln In-stitutional Animal Care and Use Commit-tee approved all procedures and facilities used in this experiment.
Crossbred, Angus- based heifers were purchased and arrived at the West Central Research and Extension Center (WCREC), North Platte, NE, at or shortly after wean-ing. Various development treatments (2005 Nebraska Beef Report, pp.15- 17; 2008 Ne-braska Beef Report, pp. 8- 10; 2010 Nebras-ka Beef Report, pp. 10- 12; 2012 Nebraska Beef Report, pp. 37- 40; 2013 Nebraska Beef Report, pp. 5- 10; 2017 Nebraska Beef Report, pp. 5- 7) were applied overwinter. Prior to estrus synchronization, 2 blood samples were collected 10 d apart via caudal venipuncture to determine pubertal status. Heifers with greater than 1 ng/mL proges-terone at either collection were considered pubertal. Heifers were synchronized using the melengestrol acetate- prostaglandin F2α (MGA- PG) protocol. Heifers received MGA for 14 d. On d 33, PG was injected i.m. Heat detection followed for 5 d after injection. Heifers were observed for standing estrus and AI 12 h later. Heifers not expressing estrus were not inseminated. Ten days after last AI, clean- up bulls were added at a 1:50 bull to heifer ratio for a 60 d breeding season. Pregnancy diagnosis was conducted via transrectal ultrasonography 45 d follow-ing AI and again 45 d after bull removal.
Records from heifers born in 2002 to 2015 (n=1,404) were analyzed. Birthdate was available for a subset of heifers (n=749) and included in the analysis. Pubertal status prior to estrus synchronization was available for all but 2 yr. Six BW measures were recorded for most heifers: weaning,
Aline Gomes da SilvaAndy Roberts
T. L. MeyerRick N. Funston
Summary with Implications
Heifer records were retrospectively evalu-ated to see if Julian birthdate, cycling status prior to breeding, and body weight collected from weaning through final pregnancy diag-nosis differed when heifers were categorized by 5 different approaches: 1) pubertal status prior to estrous synchronization, 2) whether or not detected in estrus at AI, 3) heifers impregnated by AI vs all other heifers, 4) final pregnancy status, and 5) a 5- way clas-sification accounting for AI and pregnancy status (AI pregnant, heifers subjected to AI that subsequently conceived to bull, heifers not AI that were impregnated by bull, heifers subjected to AI that were not pregnant, heif-ers not AI and not pregnant). Collectively, results support the concept that earlier birth in the calving season and greater preweaning growth are associated with desirable repro-ductive response in replacement beef heifers.
Introduction
Numerous studies have reported inverse correlations between postweaning growth rate and age at puberty and pregnancy rates in heifers. Pregnancy rate was greater for heifers achieving puberty prior to breeding, which was influenced by age and BW (2014 Nebraska Beef Report, pp. 5- 7). An increas-ing body of literature (2005 Nebraska Beef Report, pp. 15- 17; 2008 Nebraska Beef Re-port, pp. 8- 10; 2012 Nebraska Beef Report, pp. 37- 40; 2017 Nebraska Beef Report, pp. 5- 7) has also demonstrated postbreeding management can have significant impacts on breeding success. However, limited in-formation exists on which time points prior to or after the breeding season have the greatest impacts on reproductive success.
Analyses of Birthdate and Growth in Beef Heifers Categorized by Puberty and Pregnancy Status
6 · 2018 Nebraska Beef Cattle Report
a random effect and fixed effect of pubertal status/breeding/pregnancy category.
Results
Pubertal Status Prior to Estrus Synchronization
Pubertal heifers prior to estrus synchro-nization were born 3 d earlier (P = 0.04; 83 vs 80 Julian birthdate, non- pubertal vs pubertal, respectively; Table 1). Pubertal heifers were heavier (P < 0.01) at all BW measured. In addition, pubertal heifers gained more (P < 0.01) BW from wean-ing to mid- winter, mid- winter to pre- synchronization, and consequently weaning to pre- synchronization. While pubertal heifers also exhibited greater (P < 0.01) ADG from weaning to AI, non- pubertal heifers tended to gain more (P = 0.06) from pre- synchronization to AI (1.68 vs 1.59 lb/d, non- pubertal vs pubertal, respectively).
Heifers not cycling prior to estrus synchronization did gain more (P < 0.01) from AI to first pregnancy diagnosis and AI to final pregnancy diagnosis. This pattern of gain, where non- pubertal heifers have increased ADG during the breeding season indicates these heifers were possibly later maturing, with greater mature BW or ex-hibiting a compensatory gain due to better quality forage available during synchroniza-tion and breeding periods.
Estrus Detection and Artificial Insemination
Heifers observed in estrus and insem-inated tended to be born earlier, and thus were older than heifers not observed in estrus (P = 0.08, 81 vs 85 Julian birthdate for inseminated vs non- inseminated, respectively; Table 2). Inseminated heifers were heavier (P ≤ 0.04) at weaning and all subsequent BW compared with heifers not inseminated.
Gains were similar between categories, except from first to final pregnancy diagno-sis where inseminated heifers had greater ADG (P < 0.01, 1.50 vs 1.61 lb/d, non- inseminated vs inseminated, respectively).
AI Pregnancy vs All Others
Heifers pregnant by AI were born 3 d earlier (P = 0.02, 80 vs 83 Julian birthdate,
Table 1. Comparison of BW and ADG between cyclic vs non- cyclic heifers prior to estrus synchroniza-tion. Heifers were synchronized with a melengestrol acetate (MGA)- PG protocol
Non- cyclic Cyclic SE P- value
Julian birthdate 83 80 1.5 0.04
BW, lb
Weaning1 509 527 3.5 < 0.01
Mid- winter2 600 624 4.6 < 0.01
Pre- synchronization3 697 745 5.3 < 0.01
AI4 758 807 5.3 < 0.01
First pregnancy diagnosis5 807 838 5.1 < 0.01
Final pregnancy diagnosis6 924 955 5.3 < 0.01
ADG, lb/d
Weaning to mid- winter 0.99 1.10 0.02 < 0.01
Mid- winter to pre- synchronization 1.46 1.59 0.04 < 0.01
Pre- synchronization to AI 1.68 1.59 0.04 0.06
AI to first pregnancy diagnosis 1.01 0.79 0.04 < 0.01
First to final pregnancy diagnosis 1.65 1.59 0.02 0.08
Weaning to pre- synchronization 1.08 1.28 0.02 < 0.01
Weaning to AI 1.19 1.32 0.02 < 0.01
AI to final pregnancy diagnosis 1.15 1.04 0.02 < 0.011Mid- October to early November.2Mid- January to mid- February.3Average of 2 BW measured 10 d apart immediately prior to MGA supplementation.4Late May, measured at PG injection.5Mid- July, approximately 45 d after last AI d.6Late September, approximately 45 d after bull removal from 60- d breeding season.
Table 2. Comparison of BW and ADG between AI and non- AI heifers. Heifers were synchronized with a melengestrol acetate (MGA)- PG protocol and only heifers displaying estrus behavior were inseminated
Not AI AI SE P- value
Julian birthdate 85 81 2.0 0.08
BW, lb
Weaning1 509 518 4.2 0.04
Mid- winter2 602 615 5.3 0.03
Pre- synchronization3 710 725 6.4 0.02
AI4 769 785 6.6 0.01
First pregnancy diagnosis5 816 829 5.7 0.03
Final pregnancy diagnosis6 926 946 6.2 < 0.01
ADG, lb/d
Weaning to mid- winter 1.04 1.06 0.02 0.37
Mid- winter to pre- synchronization 1.50 1.54 0.04 0.44
Pre- synchronization to AI 1.54 1.61 0.04 0.17
AI to first pregnancy diagnosis 1.04 0.99 0.04 0.25
First to final pregnancy diagnosis 1.50 1.61 0.04 < 0.01
Weaning to pre- synchronization 1.19 1.21 0.02 0.24
Weaning to AI 1.23 1.28 0.02 0.11
AI to final pregnancy diagnosis 1.12 1.15 0.02 0.191Mid- October to early November.2Mid- January to mid- February.3Average of 2 BW measured 10 d apart immediately prior to MGA supplementation.4Late May, measured at PG injection.5Mid- July, approximately 45 d after last AI d.6Late September, approximately 45 d after bull removal from 60- d breeding season.
2018 Nebraska Beef Cattle Report · 7
AI pregnant vs not AI pregnant, respective-ly; Table 3) than their counterparts. Body weight was similar between the two catego-ries until final pregnancy diagnosis, where heifers not pregnant by AI weighed less (P < 0.01, 935 vs 950 lb, not AI pregnant vs AI pregnant, respectively). This may be due to the difference in weight of the pregnancy.
Heifers not pregnant by AI did gain more from mid- winter to pre- synchronization (P = 0.04, 1.57 vs 1.50 lb/d, not pregnant by AI vs pregnant by AI, respectively); however, they gained less (P < 0.01) BW from first to final pregnan-cy diagnosis and AI to final pregnancy diagnosis. Again the greater gains for AI pregnant heifer may be due to the weight of the actual pregnancy.
Final Pregnancy Status
Although age was similar between nonpregnant and pregnant heifers (P = 0.15, Table 4), BW was greater (P < 0.01) for pregnant heifers (AI and bull- bred) at all measures.
Nonpregnant heifers tended (P = 0.06) to gain less from mid- winter to pre- synchronization (1.43 vs 1.54 lb/d, nonpreg-nant vs pregnant, respectively). Nonpreg-nant heifers also gained less (P < 0.01) from first to final pregnancy diagnosis and AI to final pregnancy diagnosis.
5- way Classification of AI and Pregnancy Status
Julian date of birth did not differ due to AI and pregnancy classification, although the numeric trend was for AIpreg to be born earlier. The percentage of heifers cycling prior to estrus synchronization differed among the groupings, following the pattern of being greatest in AIpreg (76%), intermediate in AIopen (62%), and least in notAIopen (24%). Percentage cycling in heifers bred by bulls (70% for both AIbull and notAIpreg) was similar to AIpreg and AIopen (76% and 62%, AIpreg and AIopen, respectively). Measures of weaning BW differed due to classification, and these differences persisted through the remaining measurements (Figure 1). The general pattern was for heifers in the AIpreg and AIbull groups to be heavier than AIopen, which tended or were heavier than notAIopen. Heifers in
Table 3. Comparison of BW and ADG between heifers pregnant by AI vs heifers pregnant by natural service or open
Not AI pregnant AI pregnant SE P- value
Julian birthdate 83 80 1.4 0.02
BW, lb
Weaning1 513 518 2.9 0.10
Mid- winter2 608 615 3.7 0.16
Pre- synchronization3 721 725 4.4 0.36
AI4 780 785 4.4 0.37
First pregnancy diagnosis5 825 829 4.0 0.23
Final pregnancy diagnosis6 935 950 4.2 < 0.01
ADG, lb/d
Weaning to mid- winter 1.06 1.06 0.02 0.75
Mid- winter to pre- synchronization 1.57 1.50 0.02 0.04
Pre- synchronization to AI 1.61 1.61 0.02 0.83
AI to first pregnancy diagnosis 0.97 1.01 0.04 0.39
First to final pregnancy diagnosis 1.50 1.65 0.02 < 0.01
Weaning to pre- synchronization 1.21 1.21 0.02 0.85
Weaning to AI 1.28 1.28 0.02 0.87
AI to final pregnancy diagnosis 1.08 1.17 0.02 < 0.011Mid- October to early November.2Mid- January to mid- February.3Average of 2 BW measured 10 d apart immediately prior to MGA supplementation.4Late May, measured at PG injection.5Mid- July, approximately 45 d after last AI d.6Late September, approximately 45 d after bull removal from 60- d breeding season.
Table 4. Comparison of BW and ADG between nonpregnant vs pregnant (includes AI and natural service) heifers
Not Pregnant Pregnant SE P- value
Julian birthdate 85 81 2.3 0.15
BW, lb
Weaning1 500 518 4.9 < 0.01
Mid- winter2 597 613 6.6 0.01
Pre- synchronization3 701 725 7.5 < 0.01
AI4 763 785 7.5 0.01
First pregnancy diagnosis5 805 829 7.1 < 0.01
Final pregnancy diagnosis6 911 946 7.1 < 0.01
ADG, lb/d
Weaning to mid- winter 1.06 1.06 0.04 0.74
Mid- winter to pre- synchronization 1.43 1.54 0.04 0.06
Pre- synchronization to AI 1.63 1.61 0.07 0.69
AI to first pregnancy diagnosis 0.90 0.99 0.07 0.11
First to final pregnancy diagnosis 1.48 1.61 0.04 < 0.01
Weaning to pre- synchronization 1.17 1.21 0.02 0.19
Weaning to AI 1.26 1.28 0.02 0.25
AI to final pregnancy diagnosis 1.06 1.15 0.02 < 0.011Mid- October to early November.2Mid- January to mid- February.3Average of 2 BW measured 10 d apart immediately prior to MGA supplementation.4Late May, measured at PG injection.5Mid- July, approximately 45 d after last AI d.6Late September, approximately 45 d after bull removal from 60- d breeding season.
8 · 2018 Nebraska Beef Cattle Report
Andy Roberts, research scientist, USDA- ARS, Fort Keogh, Miles City, MT.
T. L. Meyer, research technician
Rick N. Funston, professor, University of Nebraska- Lincoln West Central Research and Extension Center, North Platte, Neb.
the breeding season. A greater percentage of heifers becoming pregnant were also cyclical prior to estrus synchronization compared with nonpregnant heifers.
Aline Gomes da Silva, former graduate stu-dent, University of Nebraska- Lincoln West Central Research and Extension Center, North Platte, Neb.
the nonAIpreg group were intermediate, but not statistically different between the AIpreg, AIbull, and AIopen.
Birthdate and weaning BW seem to be the 2 major factors accounting for whether heifers became pregnant or not, as the dif-ferences in BW between pregnant and not pregnant heifers remained similar through
Figure 1. Retrospective comparison of BW at 6 different time points among heifers inseminated but became pregnant by natural service (AIbull), heif-ers pregnant by AI (AIpreg), heifers not inseminated but became pregnant by natural service (notAIpreg), inseminated heifers not becoming pregnant (AIopen), and heifers not inseminated and not becoming pregnant (notAIopen). Bars with different letters differ (P < 0.05). AIopen tended (P < 0.1) to differ from notAIopen.
a a ab bcc
a a a abb
a a ab bcc
a a ab bcc
ab a bccd
d
a ab ab bc
2018 Nebraska Beef Cattle Report · 9
© The Board Regents of the University of Nebraska. All rights reserved.
luteum dimensions were measured along the longest axis and the perpendicular axis (the average of those two dimensions is presented). Ovulation was determined by the absence of the preovulatory follicle. Estrus was detected using Estrotect™ Heat Detector patches on the tail head. Blood samples were collected every other day for the first week then daily, and circulating progesterone was measured with radioim-munoassays performed in duplicate. For this experiment, Day 1 of the reproductive cycle was defined as the day of ovulation detection after the second set of PGF2α in-jections. Treatment (250µg/kg Letrozole in 8- 10 mL of a 1:5 mixture of benzyl alcohol and sesame oil) or control injections (8 mL of 1:5 benzyl alcohol/sesame oil) began on Day 10 of the cycle.
Results
When using Letrozole to inhibit aro-matase activity, an important consideration is the success and degree of circulating estrogen suppression. The purpose of the drug is not to completely prevent all estrogen production but instead to prevent or delay the peak in estrogen production that occurs prior to ovulation. In the three treated cows, there was still a moderate amount of circulating estrogen during and after the treatment period. However, the peak of estrogen from the dominant follicle that must occur before ovulation occurs was delayed in two of the three treated cows (Figure 1, Treated Cows 1 and 2). This sug-gests the possibility that the processing of Letrozole by the liver may vary from animal to animal, thus making the effectiveness of the drug inconsistent.
The effects of Letrozole on the repro-ductive cycle were also variable, with the successful suppression of the estrogen peak corresponding with a delay in ovulation. Of the three control cows that received vehicle injections only, two of the cows had a two- follicular- wave cycle and one of them had a three- wave cycle (Figure 2). The intervals
methods using pharmaceuticals that are not hormone- based but instead control the synthesis of hormones in the treated animal. Having a lower concentration of estrogen within the bloodstream pre-vents the sequence of events that result in ovulation (i.e. loss of the corpus luteum due to luteolysis, decreased circulating progesterone, and a surge in Luteinizing Hormone). Thus, some researchers have proposed Letrozole, an aromatase inhib-itor that decreases estrogen production, as a steroid- free estrous synchronization method. These researchers have had suc-cess in controlling the timing of ovulation. However, having lower concentrations of estrogens inside the dominant ovar-ian follicle is associated with decreased oocyte quality and fertility. Plus, delaying ovulation with a method that changes gonadotropin pulsatility (as with altering circulating estrogen) can potentially cause the development of a persistent follicle and reduced quality of the oocyte within the follicle. To determine whether Letro-zole treatment promotes persistent follicle formation, a pilot trial to test its effects on follicle development and circulating hormone concentrations was performed using a small group of beef cows.
Procedure
All procedures were approved by the Animal Care and Use Committee at the University of Nebraska- Lincoln. Six non- lactating, composite beef cows (25% MARC III [¼ Angus, ¼ Hereford, ¼ Pinzgauer, ¼ Red Poll] and 75% Red Angus) ages 2- 4 yr old from the beef physiology herd at the Eastern Nebraska Research and Extension Center (ENREC) were initially synchro-nized with two injections (25 mg/cow; i.m.; 12 h apart) of prostaglandin F2α (PGF2α) following by a second pair of PGF2α injec-tions 14 d later. Transrectal ultrasound with an Aloka UST- 5541- 7.5 probe was conduct-ed every other day for three weeks then dai-ly for 50 d total, and the follicle and corpus
Sarah M RomereimSarah C Tenley
Mohamed A. Abedal- MajedJeffrey W. Bergman
Scott G KurzJohn S Davis
Jennifer R WoodAndrea S Cupp
Summary and Implications
Most bovine estrous synchronization protocols utilize progesterone plus estrogen to control ovulation timing. A drug that inhibits estrogen production (Letrozole) may be an alternative, steroid- free synchro-nization method (not yet commercially available). However, low estrogen can neg-atively affect the health of follicles/oocytes and impact fertility. To determine its effects, Letrozole was administered intramuscularly while tracking follicle growth and circu-lating hormones. Letrozole response was variable. Two of three cows experienced delayed luteolysis/ovulation and extended progesterone production. This preliminary data indicates that Letrozole treatment allows normal follicle progression but drug response may vary and little is known about effects on oocyte quality.
Introduction
The benefits of reliable estrous syn-chronization for timed artificial insem-ination are well known. Since estrous is controlled primarily by the cyclical nature of steroid hormones, most synchroniza-tion protocols administer steroids such as progesterone and estrogen to prevent ovulation until a desired time. However, there is a public desire to avoid hormone treatments in beef cattle including legal prohibition of estrogen use in some countries. For this reason, some research-ers seek to devise new synchronization
Letrozole: A Steroid- Free Estrous Synchronization Method

10 · 2018 Nebraska Beef Cattle Report
recommended to producers until further research assures the health and quality of the oocyte within the follicle and until larg-er studies show that the animal- to- animal variability is acceptable.
Sarah Romereim, postdoctoral research associate
Sarah Tenley, former graduate student
Mohamed Abedal- Majed, graduate student
Jeffrey Bergman, agriculture research technician III
Scott Kurz, laboratory manager
John Davis, Professor, Department of OBGYN, University of Nebraska Medical Center, Omaha, NE
Jennifer Wood, associate professor Animal Science, Lincoln
Andrea Cupp, professor Animal Science, Lincoln
by inhibiting the animal’s own PGF2α production. Commercial PGF2α can then be administered to trigger luteolysis and the subsequent ovulation event. The results of this study indicate that there is little risk to the developmental progression of the follicle from the Letrozole treatment, since the dominant follicle during the treatment period will either ovulate or undergo atresia rather than becoming a persistent or cystic follicle. However, a follicle that ovulates af-ter being exposed to Letrozole may not con-tain a high quality oocyte. More research is needed to confirm that Letrozole does not adversely affect the health or capacity of the oocyte to be fertilized before it is incor-porated into synchronization protocols. A controlled- release version of this drug (similar to a CIDR) has been patented, but this is not yet commercially available for timed AI purposes. This drug should not be
between ovulation for the control cows were 20 d, 25 d, and 26 d. Comparatively, one Letrozole- treated cow had a two- wave cycle with no delay in ovulation (Cow 3, 21 d), while the other two treated cows had three- wave cycles with ovulation intervals of 27 (Cow 2) and >32 (Cow 1, did not ovulate during the experimental period) (Figure 2). The ovulation delays were ac-companied by an extended period of peak progesterone production and a delay in corpus luteum lysis. This suggests that the way in which Letrozole delays ovulation is by preventing/delaying luteolysis.
Conclusions
Letrozole estrous synchronization is feasible because the decreased circulat-ing estrogen delays luteolysis, possibly
Figure 1. Letrozole aromatase inhibition delays the circulating estrogen peak that occurs prior to estrus and ovulation. The top three graphs depict the daily es-tradiol concentration (ng/mL) of the Control cows, and the bottom three graphs depict estradiol of the Letrozole- treated cows. The day of estrus is shown with a light- gray bar, and the six days of injections are depicted with dark- gray bars. Treated Cows 1 and 2 had delays in the pre- estrus estradiol peaks.

2018 Nebraska Beef Cattle Report · 11
Figure 2. Letrozole- treated cows experience variable delayed ovulation and extended peak progesterone production. For the follicle diameter graphs, each point represents an individual follicle measurement and the tracked follicles are connected by lines. The top three graphs depict the ultrasound- tracked follicle measurements and ovulation (shown as a star- shaped icon) of the Control Cows, while the three graphs immediately below are the ultrasound- tracked corpus luteum diameter (primary vertical axis) and the circulating progesterone (ng/mL; secondary vertical axis) of the Control Cows. The six graphs at the bottom show the follicle measurements, corpus luteum measurements, and circulating progesterone for the Letrozole- treated cows. The day of estrus is shown with a light- gray bar, and the six days of injections are depicted with dark- gray bars. Treated Cows 1 and 2 had delayed luteolysis and extended peak progesterone concentrations.

12 · 2018 Nebraska Beef Cattle Report
© The Board Regents of the University of Nebraska. All rights reserved.
after initial PG injection and placed with 2 bulls. Inseminated heifers were placed in a separate pasture for 10 d before being placed with bulls and heifers not detected in estrus for a 60 d breeding season at a bull to heifer ratio of 1:50. Pregnancy to AI was diagnosed via transrectal ultrasonography (Aloka, Hitachi Aloka Medical America Inc., Wallingford, CT) 51 d after initial PG injection and BW was recorded. Final preg-nancy diagnosis occurred 78 d after initial pregnancy diagnosis via transrectal ultra-sonography to determine final pregnancy rates and record BW.
A second group of yearling, Angus- based crossbred heifers were managed at the Kelly Ranch, Sutherland, NE (n = 90, 719 ± 9 lb; location 2, L2) and were offered a ration containing 1 lb/d wet distillers grains, 5 lb/d grass hay, 7 lb/d corn silage, and 0.4 lb/d balancer pellet on a DM basis. Heifers were synchronized with a similar MGA- PG protocol as L1 and assigned randomly to CONTROL (n = 45) or HiCON (n = 45) treatment groups.
Heifers were AI 12 h after detection of estrus. Heifers not expressing estrus by 96 h were AI and given 2 ml Factrel i.m. (50 μg/mL gonadorelin hydrochloride, Zoetis Ani-mal Health, Parsippany, NJ). Ten d post AI, 2 bulls were placed with heifers for a 40 d breeding season. Pregnancy to AI was diag-nosed via transrectal ultrasonography 57 d after PG injection and BW recorded. A final pregnancy diagnosis and BW measurement followed 50 d after initial pregnancy diag-nosis on heifers not pregnant to AI.
the efficacy of 2 ml s.c. Lutalyse HighCon compared with 5 ml i.m. Lutalyse in estrus response and pregnancy rates in a melenge-strol acetate (MGA)- PG protocol.
Procedure
Yearling, Angus- based heifers managed at 2 locations were utilized to evaluate the efficacy of 2 alternate PG (Lutalyse vs. Lutalyse HighCon) products. Heifers at location 1 (n = 100, 750 ± 7 lb, L1) were maintained at West Central Research and Extension Center (WCREC), North Platte, NE. Heifers were offered a ration consist-ing of 13 lb/hd grass hay, 5 lb/hd wet corn gluten feed, and 1 lb/hd of 1 of 2 mineral supplements, on an DM basis.
Heifers were synchronized using a MGA- PG protocol (Figure 1). Each heifer was offered 0.5 mg/d of melengestrol acetate (MGA, Zoetis Animal Health, Par-sippany, NJ) pellets in their diet (d 1 to 14). On d 33, heifers were blocked by previous mineral treatment and assigned to receive 5 mL Lutalyse i.m. (CONTROL, n = 50) or 2 mL Lutalyse HighCon s.c. (HiCON, n =50). A heat detection patch (Estrotect, Rockway Inc., Spring Valley, WI) was applied at PG injection. Heifers were managed together to observe estrus continuously for 6 d.
Heifers were AI 12 h after estrus was observed. Heifers were considered in estrus when more than 50% of the rub- off coating was removed on the Estrotect patch. Heifers not detected in estrus (n = 16) were given a s.c. injection of Lutalyse HighCon 6 d
Alicia C. LansfordT.L. Meyer
Rick N. Funston
Summary with Implications
Yearling heifers were administered 1 of 2 alternate prostaglandin products (Lutalyse vs. Lutalyse HighCon), which differ in con-centration of active ingredient and admin-istration route. Timing of estrus, pregnancy rate to AI, and final pregnancy rate did not differ between treatments. Body weight and ADG were also not affected by prostaglandin treatment. These results indicate producers can utilize Lutalyse HighCon, administered subcutaneously (s.c.), to avoid injection site blemishes and reduce carcass discounts with no impact on estrus synchronization or pregnancy rates.
Introduction
Estrus synchronization optimizes labor and time, increases calf uniformi-ty, decreases the length of the calving season, and improves the ease of using AI. Prostaglandin F2α (PG), a hormone used in estrus synchronization, is typically injected intramuscularly (i.m.) to regress the corpus luteum, initiate estrus, and ultimately, cause ovulation of the dominant follicle. The Beef Quality Assurance program encourages an-imal pharmaceutical companies to develop s.c. administration of injectable products, decreasing the use of i.m. injections, which can cause injection site lesions. Lutalyse HighCon (12.5 mg/mL dinoprost trometh-amine, Zoetis Animal Health, Parsippany, NJ) has recently received labeling for either s.c. or i.m. injection. It contains a higher concentration of dinoprost tromethamine than Lutalyse (5 mg/mL, Zoetis Animal Health, Parsippany, NJ) and subsequent dosage is decreased from 5 to 2 ml. The ob-jective of the present study was to evaluate
Comparison of Two Alternate Prostaglandin Products in Yearling Beef Heifers
Figure 1. Melengestrol acetate– prostaglandin F2α (MGA- PG) protocol. Melengestrol acetate ( Zoetis Animal Health, Parsippany, NJ) offered to each heifer for 14 d at a rate of 0.5 mg/d. On d 33, heifers were administered either 5 ml i.m. Lutalyse (CONTROL, 5 mg/mL dinoprost tromethamine, Zoetis Animal Health, n = 95) or 2 ml s.c. Lutalyse HighCon (HiCON, 12.5 mg/mL dinoprost tromethamine, Zoetis Animal Health, n = 95).

2018 Nebraska Beef Cattle Report · 13
Statistical Analysis
The PROC GLIMMIX procedure of SAS (SAS Institute, Inc., Cary, N.C) was used for statistical analyses with location and treat-ment in the class statement. Main effects analyzed were estrus detection time points, AI pregnancy rate, final pregnancy rate, BW and ADG. Individual heifer was considered the experimental unit. Means were declared significant for both experiments at P ≤ 0.05 with 0.05 < P < 0.10 considered a tendency.
Results
Initial BW was similar (P = 0.36) be-tween treatments (729 vs. 739 ± 8 lb, CON-TROL vs. HiCON), but differed (P = 0.01) between locations (750 vs. 719 ± 7 lb, L1 vs. L2). Additionally, BW at first pregnancy diagnosis was similar (P = 0.26) between treatments (858 vs. 871 ± 9 lb, CONTROL vs. HiCON), but also differed (P = 0.04) by location (851 vs. 875 ± 9 lb, L1 vs. L2). Heifers at L2 had a greater ADG (P < 0.01) between prebreeding and AI pregnancy diagnosis compared with heifers at L1 (2.0 vs. 2.9 ± 0.07 lb/d). At final pregnancy diagnosis, heifer BW was similar (P = 0.71) between locations (928 vs. 941 ± 31 lb, L1 vs. L2), and treatments (P = 0.85; 939 vs. 933 ± 24 lb, CONTROL vs. HiCON). The discrepancy in BW and ADG by location is caused by L2 heifers starting at a lower BW at initiation of the trial, but due to a higher energy ration fed through the treatment period, compensating to a similar final BW.
Percentage of heifers detected in estrus is summarized in Table 1, and was similar between treatments at ≤ 60 h (P = 0.15), ≤ 72 h (P = 0.51), and at 72 h (P = 0.27). There was a tendency (P > 0.07) for a location effect on estrus response timing at ≤ 60 h (60 vs. 47 ± 5%, L1 vs. L2) and at ≤ 72 h (78 vs. 67 ± 5%, L1 vs. L2). Different manage-ment practices were implemented at each location, and likely caused the tendency for location to have an effect on estrus response times.Total percentage of heifers observed in estrus throughout the detection period was similar between treatments (P = 0.40). Estrus response times for CONTROL, HiCON and 2017 groups is displayed in Figure 2.
There was a location × treatment inter-action (P = 0.03) for AI pregnancy rates at AI pregnancy diagnosis between L1 (44 vs.
Figure 2. Heifers were offered 0.5 mg/d melengestrol acetate (MGA, Zoetis Animal Health, Parsippany, NJ) for 14 d. On d 33, heifers were injected with prostaglandin F2α in the neck region. For 2016, heifers were randomly assigned to 1 of 2 treatments: CONTROL: 5 mL i.m. Lutalyse (5 mg/mL dinoprost tromethamine, Zoetis Animal Health, n = 95) or HiCON: 2 mL s.c. Lutalyse HighCon (12.5 mg/mL dinoprost tromethamine, Zoetis Animal Health, n = 95). In 2017, heifers (n = 98) were administered 2 mL s.c. Lutalyse HighCon (2017).
Table 1. Estrus response times for yearling heifers given 2 alternate prostaglandin F2α injections in a MGA- PG estrus synchronization protocol
Estrus response, %
Treatment1
SEM
P- value2
CONTROL HiCON TRT Location T×L
≤ 60 h 48 59 5.2 0.15 0.07 0.81
72 h 22 16 4.3 0.27 0.69 0.72
≤ 72 h 71 75 4.7 0.51 0.08 0.96
Total Response 82 87 3.9 0.40 0.85 0.401 Heifers administered 1 of 2 alternate PGF2α injections in the neck region on d 33 as part of a MGA- PG protocol. CONTROL:
5 mL i.m. Lutalyse (5 mg/mL dinoprost tromethamine, Zoetis Animal Health, Parsippany, NJ, n = 95) or HiCON: 2 mL s.c. Lutalyse HighCon (12.5 mg/mL dinoprost tromethamine, Zoetis Animal Health, n =95).
2 TRT: PGF2α injection treatment main effect, Location: Location main effect, T×L: PGF2α injection treatment by location inter-action.
Table 2. Pregnancy rates of yearling beef heifers given one of two alternate prostaglandin F2α injections
Treatment1
SEM
P- value2
CONTROL HiCON TRT Location T×L
AI pregnancy3, % 63 60 5.3 0.62 0.06 0.03
Total pregnancy4, % 98 93 2.7 0.11 0.96 0.851 Heifers administered 1 of 2 alternate PGF2α injections in the neck region on d 33 as part of a MGA- PG protocol. CONTROL:
5 mL i.m. Lutalyse (5 mg/mL dinoprost tromethamine, Zoetis Animal Health, Parsippany, NJ, n = 95) or HiCON: 2 mL s.c. Lutalyse HighCon (12.5 mg/mL dinoprost tromethamine, Zoetis Animal Health, n = 95).
2 TRT: PGF2α injection treatment main effect, Location: Location main effect, T×L: PGF2α injection treatment by location inter-action.
3 Pregnancy diagnosed via transrectal ultrasonography a minimum of 51 d after PGF2α injection.4 Final pregnancy diagnosis conducted via transrectal ultrasonography a minimum of 107 d after PGF2α injection.
The following year, in 2017, additional yearling Angus- based heifers located at WCREC (2017, n = 98) were exposed to an MGA- PG protocol. Heifers were managed the same as L1, except all heifers received 2 mL s.c. Lutalyse HighCon. Heifers were
observed for estrus activity for 4 d after PG injection and AI 12 h after detection. Those not detected (n = 13) were given a second injection of Lutalyse HighCon and placed with bulls for a 60 d breeding season.
14 · 2018 Nebraska Beef Cattle Report
to avoid injection site blemishes and reduce carcass discounts without negatively im-pacting estrus synchronization or pregnan-cy rates.
Alicia C. Lansford, graduate student
T.L. Meyer, research technician
Rick N. Funston, professor, University of Nebraska- Lincoln, West Central Research and Extension Center, North Platte, Neb.
a suitable alternative to an i.m. injection of Lutalyse.
Implications/Conclusions
Treatment (Lutalyse vs. Lutalyse High-Con) did not affect estrus timing, preg-nancy to AI, final pregnancy rates, BW or ADG. These results indicate producers can utilize a s.c. injection of Lutalyse HighCon
64 ± 7.0%, CONTROL vs. HiCON) and L2 (73 vs. 62 ± 7.2%, CONTROL vs. HiCON). This is similar to past AI pregnancy rates reported at WCREC (2016 Nebraska Beef Report, pp 5– 7) and those reported at the Kelly Ranch (2017 Nebraska Beef Report, pp 11– 12). Final pregnancy rates were similar between treatments (P > 0.11, Table 2). Results from the present study indicate s.c. administration of Lutalyse HighCon is
2018 Nebraska Beef Cattle Report · 15
© The Board Regents of the University of Nebraska. All rights reserved.
benzoate (EB)) at the beginning of the feed-ing period. Steers were re- implanted with Synovex Plus (200 mg TBA and 24 mg EB) 105 d later (110 d prior to harvest). Steers were weighed at feedlot entry and reim-plant. Steers were on a finishing diet similar to previous research (2009 Nebraska Beef Report, pp. 5– 8). Hot carcass weight was determined at harvest; carcass characteris-tics were evaluated 24 h following harvest. Final BW was calculated from HCW, based on an average dressing percent of 63%.
Results
Cow Variables
Cows on HPRE gained more BW (105 ± 18 lb) and BCS (0.52 ± 0.13) than cows on CPRE during the prepartum period (P < 0.01). Cows on HPRE weighed more and had greater BCS precalving than CPRE cows (P < 0.01; 1,226 vs 1,129 ± 17 lb and 5.78 vs 5.20 ± 0.11 BCS for HPRE and CPRE, respectively). Hay CP and TDN (7.7% CP and 56.8% TDN) were greater than previously reported values for corn residue (2009 Nebraska Beef Report, pp. 5– 8; 5.2% CP and 52.7% TDN), likely ac-counting for much of this difference. Cows on HPRE tended to have a greater BW and maintained a greater BCS prebreeding (P < 0.06; 1,107 vs 1,074 ± 15 lb and 5.40 vs 5.09 ± 0.11 BCS for HPRE and CPRE, respective-ly). However, CPRE cows had greater BW gain and BCS postpartum (May 15 to Nov 1) than HPRE cows (P < 0.01; 46 vs 35 ± 8 lb for SPRE vs HPRE, respectively) likely due to a compensatory gain effect. These data agree with previous research (2006 Nebraska Beef Report, pp. 7– 9) which reported cows receiving a protein supple-ment prepartum had greater BW and BCS at precalving and prebreeding and similarly, nonsupplemented cows had greater BW and BCS gain in the postpartum period. Other research (Freetly et al., 2000 J. Anim. Sci.78: 2790) has reported compensatory
reproduction. Additionally, the interaction of nutrients provided during the pre- and postpartum segments of beef production may also impact calf performance.
Objectives of this study were to evaluate systems that reduced the use of high cost grazed forage in the pre- and postpartum period. The effects of feeding hay or grazing corn residue prepartum and subsequently feeding hay or grazing subirrigated meadow postpartum on cow reproduction and subsequent calf productivity in a March- calving herd were evaluated.
Procedure
March- calving multiparous, Husker Red (5/8 Red Angus, 3/8 Simmental) cows (yr 1, n = 72; yr 2, n = 65; yr 3, n = 64) were blocked by age and allotted to 1 of 2 prepar-tum (Dec 1 to Feb 28) treatments: ad libi-tum hay (7.7% CP and 56.8% TDN, HPRE) or corn residue (1.5 AUM/ac, CPRE). From Feb 28 (precalving) until parturition, cows were managed in a common group and fed grass hay in a drylot. Each of these groups were divided postpartum and half received ad libitum hay (HPOST) or grazed subirri-gated meadow (MPOST). Cows remained on postpartum treatments from parturition through a 45 d breeding season (July 20). After this cows were managed as one group grazing native upland range until calves were weaned Nov 1.
Weight and BCS of all cows were record-ed at the beginning (Dec 1) and end (Feb 28, precalving) of the prepartum period, prebreeding (May 15), and weaning (Nov 1). A veterinarian diagnosed pregnancy via rectal palpation at weaning.
Calves were weighed at birth, prebreed-ing, and weaning. Steer calves remained in drylot on ad libitum hay for 2 weeks post weaning before being shipped 104 miles to a feedlot at the West Central Research and Extension Center, North Platte, NE. Steers received a Synovex Choice (100 mg tren-bolone acetate (TBA) and 14 mg estradiol
Jacki A. MusgraveDevin L. Broadhead
L. Aaron StalkerRick N. Funston
Summary with Implications
March- calving cows were fed hay or grazed corn residue prepartum, and then either fed hay or grazed subirrigated meadow postpartum. Combinations of these different feeding strategies impacted body weight (BW) and body condition score (BCS) during the pre- and postpartum period; however, resulted in similar pregnancy rates. Al-though differences were not observed in cow pregnancy rates, a benefit in pre- weaning growth was observed for calves from the dams in postpartum meadow treatment. A tendency for an improvement in marbling score was observed for steers born to cows fed hay prepartum, perhaps indicating a higher plane of nutrition prepartum may improve quality grade.
Introduction
Feed costs are one of the greatest inputs in beef production systems. High costs of grazed forage have necessitated the evalu-ation of alternative systems. Corn residue can be utilized in many areas as a more economical feed source. Researchers (2009 Nebraska Beef Report, pp. 5– 8) observed increased BW and BCS in cows grazing corn residue in the prepartum period with pregnancy rates similar to cows grazing winter range. Additional research (2006 Nebraska Beef Report, pp. 7– 9) evaluated feeding hay or grazing subirrigated meadow postpartum and observed greater gains in BW and BCS in cows grazing meadow, however, no differences in pregnancy rate.
Cow BCS at calving is a good indicator of the cow’s ability to rebreed, however postpartum nutrition can also influence
Impact of Pre- and Postpartum Nutrition on March- calving Cow and Progeny Productivity
16 · 2018 Nebraska Beef Cattle Report
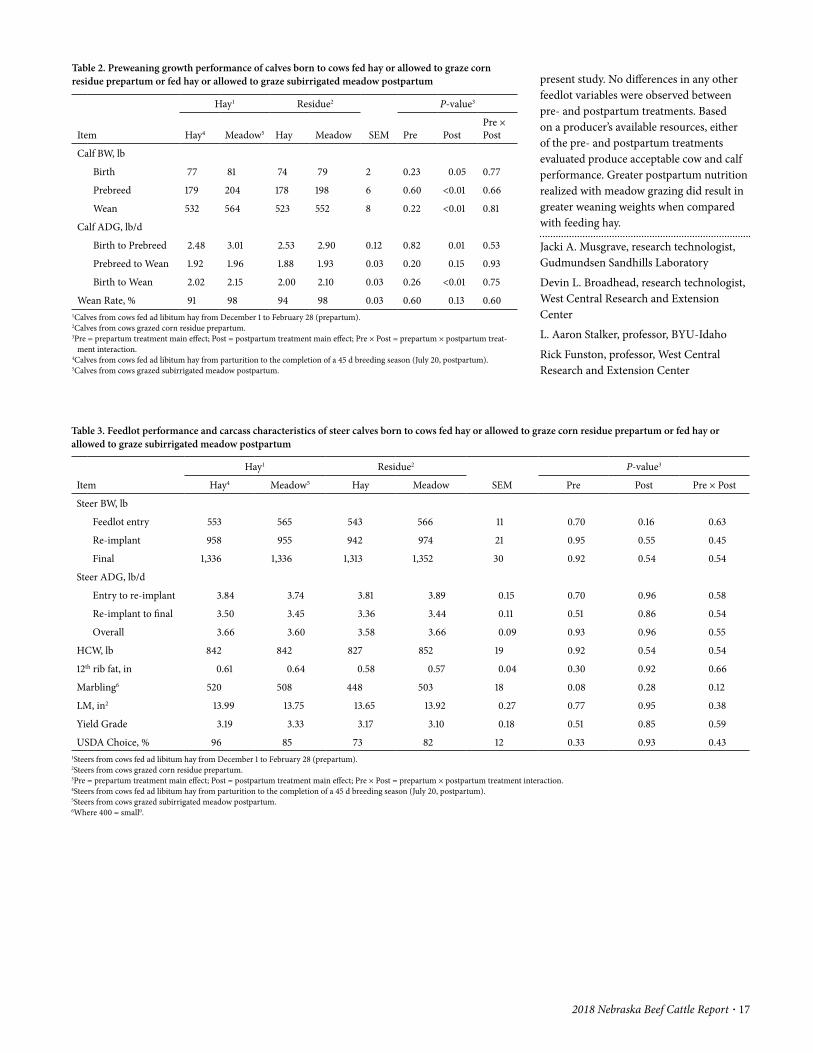
Feedlot Performance
Even though differences (P < 0.01) were observed in weaning BW for MPOST (558 ± 8 lb) vs HPOST (527 ± 8 lb), feedlot entry weights were similar (P = 0.16). This con-trasts other research (2006 Nebraska Beef Report, pp. 7– 9), which reported greater weaning BW and feedlot entry BW for steers on meadow treatment postpartum. Steers from HPRE cows tended to have a greater marbling score than CPRE steers (P = 0.06; 487 vs 437 ± 20 for HPRE vs CPRE, respectively) which is similar to previous research (2009 Nebraska Beef Report, pp. 5– 8) where greater marbling scores were observed in steers from cows receiving pro-tein supplement prepartum than those from unsupplemented dams. Supplemented cows would have been on a higher plane of nutri-tion as would the HPRE cows in the current study. This could explain the tendency for greater marbling scores observed in the
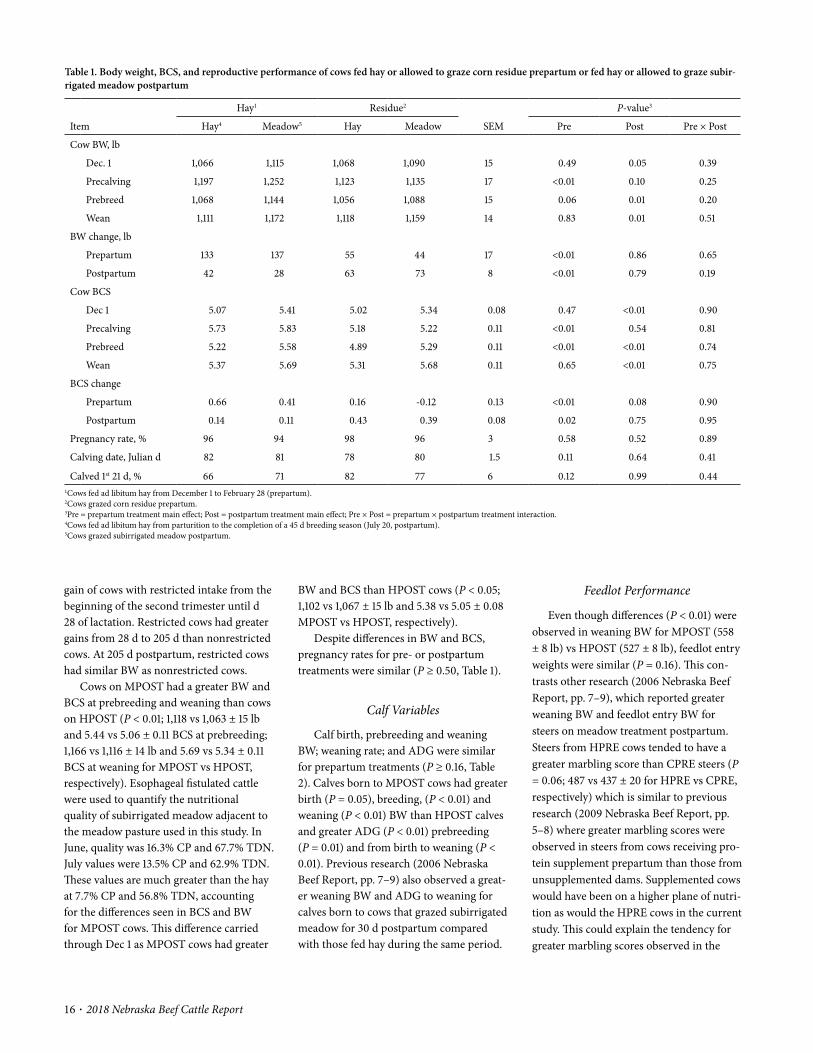
BW and BCS than HPOST cows (P < 0.05; 1,102 vs 1,067 ± 15 lb and 5.38 vs 5.05 ± 0.08 MPOST vs HPOST, respectively).
Despite differences in BW and BCS, pregnancy rates for pre- or postpartum treatments were similar (P ≥ 0.50, Table 1).
Calf Variables
Calf birth, prebreeding and weaning BW; weaning rate; and ADG were similar for prepartum treatments (P ≥ 0.16, Table 2). Calves born to MPOST cows had greater birth (P = 0.05), breeding, (P < 0.01) and weaning (P < 0.01) BW than HPOST calves and greater ADG (P < 0.01) prebreeding (P = 0.01) and from birth to weaning (P < 0.01). Previous research (2006 Nebraska Beef Report, pp. 7– 9) also observed a great-er weaning BW and ADG to weaning for calves born to cows that grazed subirrigated meadow for 30 d postpartum compared with those fed hay during the same period.
gain of cows with restricted intake from the beginning of the second trimester until d 28 of lactation. Restricted cows had greater gains from 28 d to 205 d than nonrestricted cows. At 205 d postpartum, restricted cows had similar BW as nonrestricted cows.
Cows on MPOST had a greater BW and BCS at prebreeding and weaning than cows on HPOST (P < 0.01; 1,118 vs 1,063 ± 15 lb and 5.44 vs 5.06 ± 0.11 BCS at prebreeding; 1,166 vs 1,116 ± 14 lb and 5.69 vs 5.34 ± 0.11 BCS at weaning for MPOST vs HPOST, respectively). Esophageal fistulated cattle were used to quantify the nutritional quality of subirrigated meadow adjacent to the meadow pasture used in this study. In June, quality was 16.3% CP and 67.7% TDN. July values were 13.5% CP and 62.9% TDN. These values are much greater than the hay at 7.7% CP and 56.8% TDN, accounting for the differences seen in BCS and BW for MPOST cows. This difference carried through Dec 1 as MPOST cows had greater
Table 1. Body weight, BCS, and reproductive performance of cows fed hay or allowed to graze corn residue prepartum or fed hay or allowed to graze subir-rigated meadow postpartum
Item
Hay1 Residue2
SEM
P- value3
Hay4 Meadow5 Hay Meadow Pre Post Pre × Post
Cow BW, lb
Dec. 1 1,066 1,115 1,068 1,090 15 0.49 0.05 0.39
Precalving 1,197 1,252 1,123 1,135 17 <0.01 0.10 0.25
Prebreed 1,068 1,144 1,056 1,088 15 0.06 0.01 0.20
Wean 1,111 1,172 1,118 1,159 14 0.83 0.01 0.51
BW change, lb
Prepartum 133 137 55 44 17 <0.01 0.86 0.65
Postpartum 42 28 63 73 8 <0.01 0.79 0.19
Cow BCS
Dec 1 5.07 5.41 5.02 5.34 0.08 0.47 <0.01 0.90
Precalving 5.73 5.83 5.18 5.22 0.11 <0.01 0.54 0.81
Prebreed 5.22 5.58 4.89 5.29 0.11 <0.01 <0.01 0.74
Wean 5.37 5.69 5.31 5.68 0.11 0.65 <0.01 0.75
BCS change
Prepartum 0.66 0.41 0.16 - 0.12 0.13 <0.01 0.08 0.90
Postpartum 0.14 0.11 0.43 0.39 0.08 0.02 0.75 0.95
Pregnancy rate, % 96 94 98 96 3 0.58 0.52 0.89
Calving date, Julian d 82 81 78 80 1.5 0.11 0.64 0.41
Calved 1st 21 d, % 66 71 82 77 6 0.12 0.99 0.441Cows fed ad libitum hay from December 1 to February 28 (prepartum).2Cows grazed corn residue prepartum.3Pre = prepartum treatment main effect; Post = postpartum treatment main effect; Pre × Post = prepartum × postpartum treatment interaction.4Cows fed ad libitum hay from parturition to the completion of a 45 d breeding season (July 20, postpartum).5Cows grazed subirrigated meadow postpartum.
2018 Nebraska Beef Cattle Report · 17
present study. No differences in any other feedlot variables were observed between pre- and postpartum treatments. Based on a producer’s available resources, either of the pre- and postpartum treatments evaluated produce acceptable cow and calf performance. Greater postpartum nutrition realized with meadow grazing did result in greater weaning weights when compared with feeding hay.
Jacki A. Musgrave, research technologist, Gudmundsen Sandhills Laboratory
Devin L. Broadhead, research technologist, West Central Research and Extension Center
L. Aaron Stalker, professor, BYU- Idaho
Rick Funston, professor, West Central Research and Extension Center
Table 2. Preweaning growth performance of calves born to cows fed hay or allowed to graze corn residue prepartum or fed hay or allowed to graze subirrigated meadow postpartum
Item
Hay1 Residue2
SEM
P- value3
Hay4 Meadow5 Hay Meadow Pre PostPre × Post
Calf BW, lb
Birth 77 81 74 79 2 0.23 0.05 0.77
Prebreed 179 204 178 198 6 0.60 <0.01 0.66
Wean 532 564 523 552 8 0.22 <0.01 0.81
Calf ADG, lb/d
Birth to Prebreed 2.48 3.01 2.53 2.90 0.12 0.82 0.01 0.53
Prebreed to Wean 1.92 1.96 1.88 1.93 0.03 0.20 0.15 0.93
Birth to Wean 2.02 2.15 2.00 2.10 0.03 0.26 <0.01 0.75
Wean Rate, % 91 98 94 98 0.03 0.60 0.13 0.601Calves from cows fed ad libitum hay from December 1 to February 28 (prepartum).2Calves from cows grazed corn residue prepartum.3Pre = prepartum treatment main effect; Post = postpartum treatment main effect; Pre × Post = prepartum × postpartum treat-
ment interaction.4Calves from cows fed ad libitum hay from parturition to the completion of a 45 d breeding season (July 20, postpartum).5Calves from cows grazed subirrigated meadow postpartum.
Table 3. Feedlot performance and carcass characteristics of steer calves born to cows fed hay or allowed to graze corn residue prepartum or fed hay or allowed to graze subirrigated meadow postpartum
Item
Hay1 Residue2
SEM
P- value3
Hay4 Meadow5 Hay Meadow Pre Post Pre × Post
Steer BW, lb
Feedlot entry 553 565 543 566 11 0.70 0.16 0.63
Re- implant 958 955 942 974 21 0.95 0.55 0.45
Final 1,336 1,336 1,313 1,352 30 0.92 0.54 0.54
Steer ADG, lb/d
Entry to re- implant 3.84 3.74 3.81 3.89 0.15 0.70 0.96 0.58
Re- implant to final 3.50 3.45 3.36 3.44 0.11 0.51 0.86 0.54
Overall 3.66 3.60 3.58 3.66 0.09 0.93 0.96 0.55
HCW, lb 842 842 827 852 19 0.92 0.54 0.54
12th rib fat, in 0.61 0.64 0.58 0.57 0.04 0.30 0.92 0.66
Marbling6 520 508 448 503 18 0.08 0.28 0.12
LM, in2 13.99 13.75 13.65 13.92 0.27 0.77 0.95 0.38
Yield Grade 3.19 3.33 3.17 3.10 0.18 0.51 0.85 0.59
USDA Choice, % 96 85 73 82 12 0.33 0.93 0.431Steers from cows fed ad libitum hay from December 1 to February 28 (prepartum).2Steers from cows grazed corn residue prepartum.3Pre = prepartum treatment main effect; Post = postpartum treatment main effect; Pre × Post = prepartum × postpartum treatment interaction.4Steers from cows fed ad libitum hay from parturition to the completion of a 45 d breeding season (July 20, postpartum).5Steers from cows grazed subirrigated meadow postpartum.6Where 400 = small0.

18 · 2018 Nebraska Beef Cattle Report
© The Board Regents of the University of Nebraska. All rights reserved.
the end of the calving season. On May 28, CIDR inserts were administered to cows assigned to the CIDR treatment. On June 4, CIDR inserts were removed and cows were administered prostaglandin F2α. All cows were exposed to fertile bulls (1:25 bull:cow ratio) for 45 d, with breeding season ending July 15. The non- creep treatment occupied 1 pasture and creep treatments occupied 2 separate pastures. Creep- treated cattle were introduced into pastures containing creep feeders surrounded by panels with openings sufficient to admit calves but prevent cow entry (8 openings, 38 cm wide).
Cow BW and BCS were measured at the beginning and end of the supplementation period, prebreeding, and weaning. Calf BW was measured at birth, prebreeding, and weaning. Steer calves remained in a drylot on ad libitum hay for 2 weeks postweaning before being shipped 104 mi to a feedlot at the West Central Research and Extension Center, North Platte, NE. Steers received a Synovex Choice (100 mg trenbolone acetate [TBA] and 14 mg estradiol benzoate [EB]) at the beginning of the feeding period. Steers were re- implanted with Synovex Plus (200 mg TBA and 24 mg EB) 105 d later (110 d prior to harvest). Calves were slaughtered on June 14 (Tyson Fresh Meats, Lexington, NE). Carcass data was collected 24 h following slaughter and final BW was calculated from HCW based on average dressing percentage of 63%. Carcass data included HCW, yield grade, LM area, marbling, and 12th rib fat. Market prices for weights at weaning and slaughter were based on the 3 yr average and actual creep feed costs were utilized.
Cows were removed from the study for failure to wean a calf or become pregnant and were not replaced. Therefore, the number of cows decreased throughout the 3 yr study. Year 1 started with 120 cows, yr 2 with 95 and yr 3 with 86. Additional cows external to the experiment were introduced into pastures to maintain constant stocking rates during the experiment.
Cows assigned to the same winter sup-plement, CIDR and creep treatment within winter pasture served as the experimental
mentation directly to the calf significantly affects calf weaning BW (2017 Nebraska Beef Report, pp. 22– 24), but it is not known if this weight advantage will persist at slaughter. Administration of exogenous progesterone can shorten the postpartum interval. If weaning occurs on the same d for all calves, those born to cows with a shorter postpartum interval will be older and therefore weigh more than contempo-raries born to cows that become pregnant later in the breeding season. Thus, the objectives of this study were to determine effects of late- gestation supplementation, postpartum progestin, and creep feeding on cow and calf productivity in a spring- calving herd.
Procedure
A 3- yr experiment utilized 120 crossbred (5/8 Red Angus, 3/8 Simmental), March- calving cows (initial BW = 1096 ± 126 lb) at the Gudmundsen Sandhills Laboratory, Whitman, Nebraska. Cows were strati-fied by BW within age. Treatments were assigned randomly in a 4 × 2 × 2 factorial arrangement in a completely random design. The 4 supplement (45% DDGS, 32% CP; 89% TDN) treatments were: 0 lb / (cow • d) Dec 1 to Mar 1 (DM0), 1 lb DM/ (cow • d) Dec 1 to Mar 1 (DM1), 1 lb DM/ (cow • d) Jan 15 to Mar 1 (JM1), or 2 lb DM/ (cow • d) Jan 15 to Mar 1 (JM2). Administration of exogenous progesterone postpartum via a controlled internal drug release device for 7 d and prostaglandin F2α (5 mL Lutalyse, Zoetis) administered on d 7 (CIDR), or no progesterone (NoCIDR). Unrestricted ac-cess for calf to creep feed which contained 80% Corn and 20% of an intake limiter (Accuration) from July 15 to Nov 1 (Creep) or no access to creep feed (NoCreep). The study began in December when cows were located in 1 of 8 upland range pastures (86 ac) and supplement treatments were delivered on a pasture basis 3 d/wk until March 1. Beginning March 1, cows were managed as a single group and fed hay until
Devin L. BroadheadL. Aaron Stalker
Jacki A. MusgraveRick N. Funston
Summary with Implications
Supplementation during winter grazing increased cow BW and BCS but had no effect on reproduction or calf performance, thus in-creasing production costs without increasing returns. Using a CIDR for estrus synchro-nization in a herd with existing acceptable reproductive performance did not increase cow pregnancy rate or advance calving date. Feeding creep feed to calves is an effective means of increasing weaning BW which resulted in increased live and carcass weight. Under the conditions of this study, when additional feed and price slide for heavier calves was considered, feeding creep feed did not result in added profits.
Introduction
Extending the grazing season to include grazing dormant pasture decreases produc-tion costs, however supplemental rumen degradable protein is necessary to maintain BCS of gestating cows grazing winter range in the Nebraska Sandhills. Feeding supple-ment to cows grazing winter range during the last trimester of gestation can increase calf BW at weaning, but it is not known if the timing of supplementation optimized progeny performance. Undernutrition during gestation causes suboptimal condi-tions in the maternal uterine environment, which translate into depressed progeny performance. Cost savings may be achieved if supplement amount and duration of supplementation were reduced. Further efficiency may be achieved if supplement is delivered directly to the calf and could potentially overcome detrimental effects of undernutrition during gestation. Supple-
Effects of Late Gestation Supplementation, Synchronization, and Creep Feeding in a Spring
Calving Beef Herd in the Nebraska Sandhills

2018 Nebraska Beef Cattle Report · 19
due to a compensatory gain. The greatest loss in BW occurred between precalving (March) to start of breeding (May) for all 4 treatments. Other than calving BW, cows fed supplement maintained or increased in BW. Differences in BW among supple-ment treatments were most evident at the beginning of the breeding season where DM0 cows weighed the least (P < 0.05),
Results
All supplemented groups (DM1, JM1, JM2) increased in BW from beginning of study to calving, whereas DM0 tended to decrease in BW (P = 0.06). Cows as-signed to DM0 treatment had the greatest differences in BW after winter treatment to weaning. Even with this difference, they had similar BW at weaning as the begin-ning of winter treatment. This is most likely
unit. Replicated treatment means within yr were used for analyses of cow and calf response variables and carcass evaluation. Model fixed effects included winter sup-plement treatment, CIDR treatment, creep treatment, and all interactions. Year and residual error were included in the model as random effects. Effects of treatment were considered significant when P < 0.05.
Table 1. Effects of winter supplement1, post- partum progesterone administration2, and calf access to creep feed3 on cow and steer progeny productivity
Supplement Progesterone Calf feed SE4 P- value
DM0 DM1 JM1 JM2 CIDRNo
CIDR CreepNo
Creep Supp Progest Creep
Cow BW, lb
Initial (Dec) 1,056 1,089 1,065 1,056 1,060 1,074 1,063 1,063 9 0.35 0.37 0.63
Calving (Mar) 983b 1,118a 1,067ab 1,078a 1,063 1,060 1,049 1,074 12 0.06 0.95 0.03
Breeding (May) 957b 1,030a 990ab 981ab 990 999 988 1,000 9 0.04 0.49 0.34
Weaning (Nov) 1,058 1,102 1,078 1,074 1,071 1,085 1,085 1,071 10 0.37 0.41 0.42
Cow BCS5
Initial (Dec) 5.0 5.0 5.0 5.0 5.0 5.0 5.0 5.0 0.1 0.88 0.76 0.81
Calving (Mar) 4.6b 5.0a 4.9a 5.1a 5.0 5.0 5.0 5.0 0.1 0.03 0.88 0.76
Breeding (May) 4.5b 4.8a 4.6ab 4.8ab 4.6 4.7 4.6 4.7 0.1 0.09 0.62 0.46
Weaning (Nov) 5.3 5.2 5.3 5.4 5.3 5.3 5.3 5.3 0.1 0.75 0.75 0.53
Calving date6, d 83 86 84 83 83 86 86 83 3 0.79 0.10 0.13
Calved in 21 d7, % 81 74 85 84 82 80 76 86 7 0.45 0.65 0.04
Calving rate8, % 98 98 99 98 99 97 96 100 3 0.96 0.33 0.08
Weaning rate9, % 91 95 93 94 91 95 93 93 4 0.71 0.23 0.85
Pregnancy rate10, % 79 93 93 85 88 87 90 85 7 0.23 0.88 0.11
Calf BW, lb
Birth (Mar) 75 79 75 77 77 77 77 75 1 0.27 0.64 0.16
Breeding (May) 161 163 159 165 163 161 159 165 3 0.75 0.43 0.11
Weaning (Nov) 527 527 527 536 527 531 551 507 7 0.80 0.50 <0.01
Live Weight 1,318 1,307 1,284 1,315 1,312 1,300 1,328 1,284 21 0.65 0.53 0.04
HCW, lb 830 823 809 828 827 819 836 809 13 0.65 0.53 0.04
12th rib fat, in 0.55 0.52 0.57 0.56 0.53 0.57 0.59 0.51 0.03 0.68 0.24 <0.01
Marbling11 459 466 474 475 457 480 474 463 29 0.93 0.25 0.59
LM, in 14 13 14 14 14 14 14 14 .39 0.60 0.34 0.31
USDA Yield Grade 2.9 2.9 3.0 3.1 2.9 3.0 3.1 2.8 0.17 0.69 0.53 0.061DM0: 0 lb/ (cow • d) Dec 1 to Mar 1; DM1: 1 lb DM/ (cow • d) Dec 1 to Mar 1; JM1: 1 lb DM/ (cow • d) Jan 15 to Mar 1; JM2: 2 lb DM/ (cow • d) Jan 15 to Mar 1 supplement (32% CP DM).2CIDR: controlled internal drug release device (containing 1.38 g of progesterone; Zoetis, Parsippany, NJ) for 7d and PGF2α administered on d 7 from May 28 to June 4.3Creep: unrestricted access by the calf to creep feed which contained an intake limiter from July 15 to Nov 1.4Standard error of the least squares mean (SE is the highest of all three treatments).5Scale of 1 (emaciated) to 9 (extremely obese).6Day of yr calving occurred where January 1 = d 1.7Cows calving within 21 d calculated as difference between birth date and breeding date and subtracting from 285.8Calving rate calculated by dividing the number of cows to calve by the number of cows at the beginning of the production yr.9Weaning rate calculated by dividing the number of cows to wean a calf by the number of cows at the beginning of the production yr.10Pregnancy rate calculated by dividing the number of cows determined pregnant by the number of cows at the beginning of the production yr.11Marbling: Small00 = 400, Small50 = 450, Modest00 = 500.abcWithin a row, means lacking a common superscript letter differ (P < 0.05).
20 · 2018 Nebraska Beef Cattle Report
0.01) yield grade and 12th rib fat (P < 0.01) from creep feed. Efficiency of creep feed to added gain was 8.41 lb of creep feed for each additional lb of gain. The total cost of creep feed per calf was $64.09, addition-al value of added weight at weaning was $91.96 and $63.80 at slaughter. When con-sidering the price slide for heavier calves at weaning, the value of added gain realized was similar to the cost of creep feed. Aver-age market prices will have a great effect on the value of creep feed. These prices should be considered in a cost of gain/ benefit analysis. It is important to understand that this analysis is based only on added costs of feeding creep feed and no other additional costs such as labor and added equipment.
Devin L. Broadhead, research technician
L. Aaron Stalker, associate professor
Jacki A. Musgrave, research technician
Rick N. Funston, professor Animal Science, West Central Research and Extension Center, North Platte
of calves born to cows not fed supplement grazing dormant winter range. Further research with a greater number of observa-tions may be necessary to obtain definitive conclusions.
Progestin treatment did not affect (P > 0.13) BW, BCS, reproductive measures, or calf traits. Reproductive measures may not have been affected due to the fact the herd already had acceptable reproductive performance. Exogenous progesterone was not expected to affect cow BW or BCS. Potential increased calf age and therefore, increased weaning BW as a result of earlier conception in the breeding season due to progesterone administration did not occur (P = 0.65). Access to creep feed increased (P < 0.01) calf BW at weaning by 44 lbs. Total average amount of creep that disappeared from feeder was 3.77 lb DM/ (calf • d). Creep feeding calves did not affect (P > 0.06) yield grade, LM area, or marbling. There was still a significant increase on (P < 0.04) live weight, (P < 0.04) HCW, (P <
JM1 and JM2 cows intermediate, with DM1 cows having the greatest BW. Some of the BW loss is due to calving and some of the gain from Dec. to Mar. is concep-tus, therefore BCS is more indicative on nutritional status. Cow BCS was lower (P < 0.03) at the art of the calving season for cows not supplemented compared with DM1 and JM2 cows, with JM1 cows being intermediate. Despite decreased BCS over the winter treatment period for DM0 and loss in BCS for all groups from calving to breeding, all groups had similar weaning BCS. Differences in BW and BCS caused by the supplementation treatment did not affect measures of reproductive efficiency such as calving date, calving rate, weaning rate, or pregnancy rate (P > 0.20). Supple-ment treatments did not affect calf birth, breeding, or weaning BW (P ≤ 0.80).). Late gestation supplementation to cows also did not affect (P > 0.5) steer carcass characteris-tics. Previous research at the same location has demonstrated decreased weaning BW
2018 Nebraska Beef Cattle Report · 21
© The Board Regents of the University of Nebraska. All rights reserved.
continued grazing upland Sandhills range. Pregnancy was diagnosed via transrectal ultrasonography (Aloka, Hitachi Aloka Medical America Inc., Wallingford, CT) and BW and BCS measured in October, a minimum of 45 d following bull removal. Prepartum BW and BCS was measured 14 d prior to an expected calving date of May 2. The first day 2 or more heifers calved was considered the start of the calving season, and was used to calculate percent calved in the first 21 d. A calving ease (CE) score (1 = no assistance to 4 = caesarian section) was assigned at parturition, with a score of 2 or greater considered dystocia. Calf birth weight, sex, and birth date were also record-ed. Heifers were removed from the herd for reproductive failure, calf death, or injury.
Primiparous Cows
In a continuation of the heifer phase, 2- yr- old primiparous cows not previously removed (n = 135) were utilized to evaluate supplementation effects during their second breeding season. Primiparous cows were randomly assigned to either NS (n = 67) or SUP (2 lb/d; 32% CP, DM; n = 68).
Primiparous cows were synchronized with a single PGF2α injection 5 days after being placed with bulls at a 1:20 bull to heifer ratio for 45 d, beginning approxi-mately August 5. Primiparous cows were managed as a single herd prior to and after the breeding season, and as separate herds (NS or SUP) throughout the breeding season. Throughout the year, primiparous cows were maintained on Sandhills upland range. Pregnancy diagnosis was conducted via transrectal ultrasonography at weaning in November, a minimum of 45 d following bull removal. Prepartum primiparous cow BW and BCS was measured prior to an expected calving date of May 15. Percent of cows calving in the first 21 d was calculated similar to heifers. A CE score was assigned at birth, similar to heifers. Primiparous cows were removed from the herd for re-productive failure, calf death or injury.
younger females to physically consume enough low- quality forage, leaving them deficient in key nutrients, that causes a reduction in pregnancy rates. Inadequate protein or energy after calving and during the breeding season extends the postpar-tum interval and decreases pregnancy rates. We hypothesized supplementation of CP during the breeding season would improve pregnancy rates in heifers and primiparous cows by helping to meet nutrient demands. Therefore, the objective of this study was to determine effects of supplementing May- calving heifers and primiparous cows during the breeding season on growth and reproductive response.
Procedure
Heifers
A 4- yr study conducted at Gudmund-sen Sandhills Laboratory, Whitman, NE, utilized May- born, crossbred (5/8 Red Angus, 3/8 Simmental) replacement heifers (n = 257). Heifers were randomly assigned to receive either no supplement (NS) or offered 1 lb/d of a dried distillers grain- based supplement (SUP; 32% CP, DM) beginning 2 wk prior to and throughout a 45- d breeding season while grazing upland range. Supplement was delivered 3 times/wk on a pasture (88 ac.) basis.
Heifers were blocked by development treatment (Springman et al., 2017 Nebras-ka Beef Report, pp. 8– 10) and assigned to breeding treatment. Preceding the breeding season, BW was recorded and blood samples collected at d- 10 and d 0 of the breeding season. A heifer with plasma progesterone concentration of greater than 1 ng/ml at either collection was considered pubertal.
Approximately July 22, bulls were placed with heifers (1:20 bull to cow ratio) for 45 d. Heifers were synchronized using a single PGF2α (Lutalyse, Zoetis, Parsippany, NJ) injection 5 d after bulls were intro-duced. After the supplementation period, heifers were managed as a single herd and
Alicia C. LansfordJacki Musgrave
Rick N. Funston
Summary with Implications
Females in their first and second breeding season received either a 32% crude protein (DM) supplement or no supplement through-out the breeding season. Supplementation did not affect heifer BW, BCS, and pregnancy rate at pregnancy diagnosis. Supplementa-tion impacted primiparous cow BW and BCS at pregnancy diagnosis, but did not affect pregnancy rates. Calf birth weight and dysto-cia rates were unaffected by supplementation for both heifers and primiparous cow. Calves nursing supplemented dams were heavier at weaning. Greater supplementation may be needed to affect pregnancy rate.
Introduction
In the northern Great Plains, early summer calving herds better match forage quality to nutrient requirements than those calving in spring. Early lactation occurs when forage crude protein (CP) and digest-ible energy (DE) are greatest, thus provid-ing abundant energy and requiring fewer harvested feed inputs. Research has shown similar pregnancy rates among mature cows in June vs. March (2001 Nebraska Beef Cat-tle Reports, pp 8– 9); however, May- calving heifers exhibit a decreased pregnancy rate in a May vs March- calving system (70 vs. 89%, respectively; 2017 Nebraska Beef Report, pp 8– 10). As forage matures into late summer, both CP and total digestible nutrient (TDN) content decline, which corresponds with the breeding season of a May- calving herd. Although this breed-ing season occurs during greater ambient temperature, it does not affect pregnancy rates in older beef females in the Nebraska Sandhills. It is more likely the inability of
Effect of Supplementation during the Breeding Season on a May- calving Herd in the Nebraska Sandhills
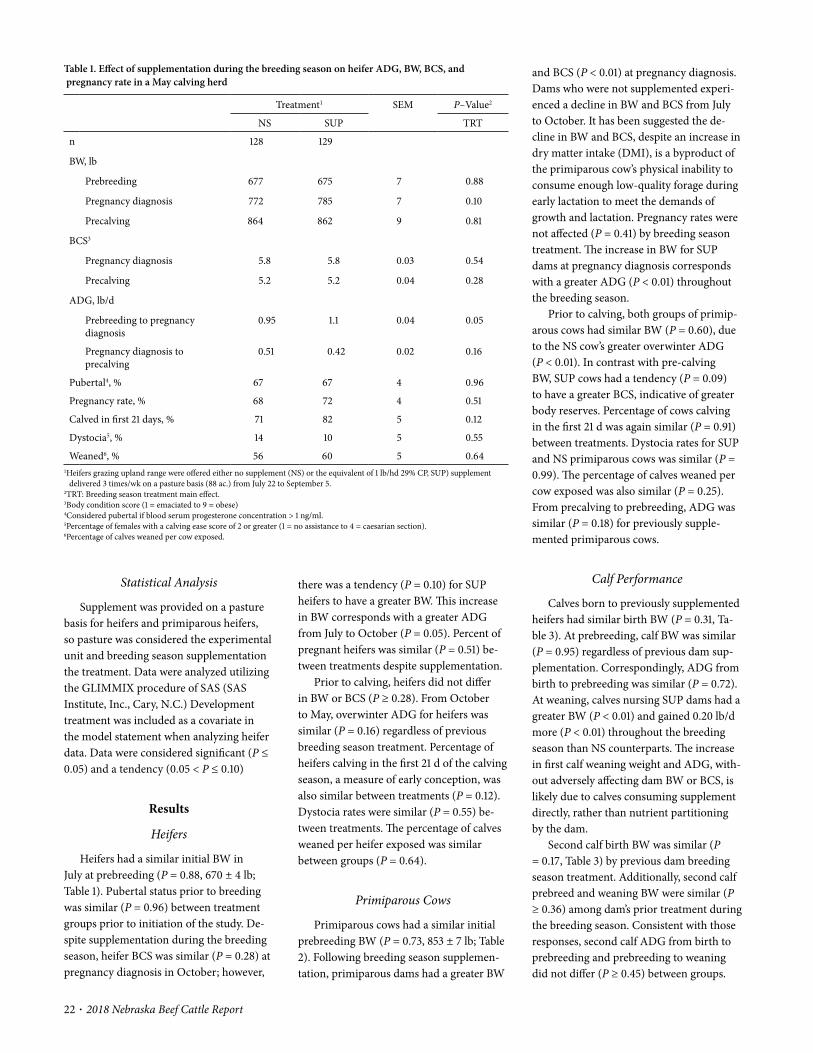
22 · 2018 Nebraska Beef Cattle Report
and BCS (P < 0.01) at pregnancy diagnosis. Dams who were not supplemented experi-enced a decline in BW and BCS from July to October. It has been suggested the de-cline in BW and BCS, despite an increase in dry matter intake (DMI), is a byproduct of the primiparous cow’s physical inability to consume enough low- quality forage during early lactation to meet the demands of growth and lactation. Pregnancy rates were not affected (P = 0.41) by breeding season treatment. The increase in BW for SUP dams at pregnancy diagnosis corresponds with a greater ADG (P < 0.01) throughout the breeding season.
Prior to calving, both groups of primip-arous cows had similar BW (P = 0.60), due to the NS cow’s greater overwinter ADG (P < 0.01). In contrast with pre- calving BW, SUP cows had a tendency (P = 0.09) to have a greater BCS, indicative of greater body reserves. Percentage of cows calving in the first 21 d was again similar (P = 0.91) between treatments. Dystocia rates for SUP and NS primiparous cows was similar (P = 0.99). The percentage of calves weaned per cow exposed was also similar (P = 0.25). From precalving to prebreeding, ADG was similar (P = 0.18) for previously supple-mented primiparous cows.
Calf Performance
Calves born to previously supplemented heifers had similar birth BW (P = 0.31, Ta-ble 3). At prebreeding, calf BW was similar (P = 0.95) regardless of previous dam sup-plementation. Correspondingly, ADG from birth to prebreeding was similar (P = 0.72). At weaning, calves nursing SUP dams had a greater BW (P < 0.01) and gained 0.20 lb/d more (P < 0.01) throughout the breeding season than NS counterparts. The increase in first calf weaning weight and ADG, with-out adversely affecting dam BW or BCS, is likely due to calves consuming supplement directly, rather than nutrient partitioning by the dam.
Second calf birth BW was similar (P = 0.17, Table 3) by previous dam breeding season treatment. Additionally, second calf prebreed and weaning BW were similar (P ≥ 0.36) among dam’s prior treatment during the breeding season. Consistent with those responses, second calf ADG from birth to prebreeding and prebreeding to weaning did not differ (P ≥ 0.45) between groups.
there was a tendency (P = 0.10) for SUP heifers to have a greater BW. This increase in BW corresponds with a greater ADG from July to October (P = 0.05). Percent of pregnant heifers was similar (P = 0.51) be-tween treatments despite supplementation.
Prior to calving, heifers did not differ in BW or BCS (P ≥ 0.28). From October to May, overwinter ADG for heifers was similar (P = 0.16) regardless of previous breeding season treatment. Percentage of heifers calving in the first 21 d of the calving season, a measure of early conception, was also similar between treatments (P = 0.12). Dystocia rates were similar (P = 0.55) be-tween treatments. The percentage of calves weaned per heifer exposed was similar between groups (P = 0.64).
Primiparous Cows
Primiparous cows had a similar initial prebreeding BW (P = 0.73, 853 ± 7 lb; Table 2). Following breeding season supplemen-tation, primiparous dams had a greater BW
Statistical Analysis
Supplement was provided on a pasture basis for heifers and primiparous heifers, so pasture was considered the experimental unit and breeding season supplementation the treatment. Data were analyzed utilizing the GLIMMIX procedure of SAS (SAS Institute, Inc., Cary, N.C.) Development treatment was included as a covariate in the model statement when analyzing heifer data. Data were considered significant (P ≤ 0.05) and a tendency (0.05 < P ≤ 0.10)
Results
Heifers
Heifers had a similar initial BW in July at prebreeding (P = 0.88, 670 ± 4 lb; Table 1). Pubertal status prior to breeding was similar (P = 0.96) between treatment groups prior to initiation of the study. De-spite supplementation during the breeding season, heifer BCS was similar (P = 0.28) at pregnancy diagnosis in October; however,
Table 1. Effect of supplementation during the breeding season on heifer ADG, BW, BCS, and pregnancy rate in a May calving herd
Treatment1 SEM P– Value2
NS SUP TRT
n 128 129
BW, lb
Prebreeding 677 675 7 0.88
Pregnancy diagnosis 772 785 7 0.10
Precalving 864 862 9 0.81
BCS3
Pregnancy diagnosis 5.8 5.8 0.03 0.54
Precalving 5.2 5.2 0.04 0.28
ADG, lb/d
Prebreeding to pregnancy diagnosis
0.95 1.1 0.04 0.05
Pregnancy diagnosis to precalving
0.51 0.42 0.02 0.16
Pubertal4, % 67 67 4 0.96
Pregnancy rate, % 68 72 4 0.51
Calved in first 21 days, % 71 82 5 0.12
Dystocia5, % 14 10 5 0.55
Weaned6, % 56 60 5 0.641Heifers grazing upland range were offered either no supplement (NS) or the equivalent of 1 lb/hd 29% CP, SUP) supplement
delivered 3 times/wk on a pasture basis (88 ac.) from July 22 to September 5.2TRT: Breeding season treatment main effect.3Body condition score (1 = emaciated to 9 = obese)4Considered pubertal if blood serum progesterone concentration > 1 ng/ml.5Percentage of females with a calving ease score of 2 or greater (1 = no assistance to 4 = caesarian section).6Percentage of calves weaned per cow exposed.
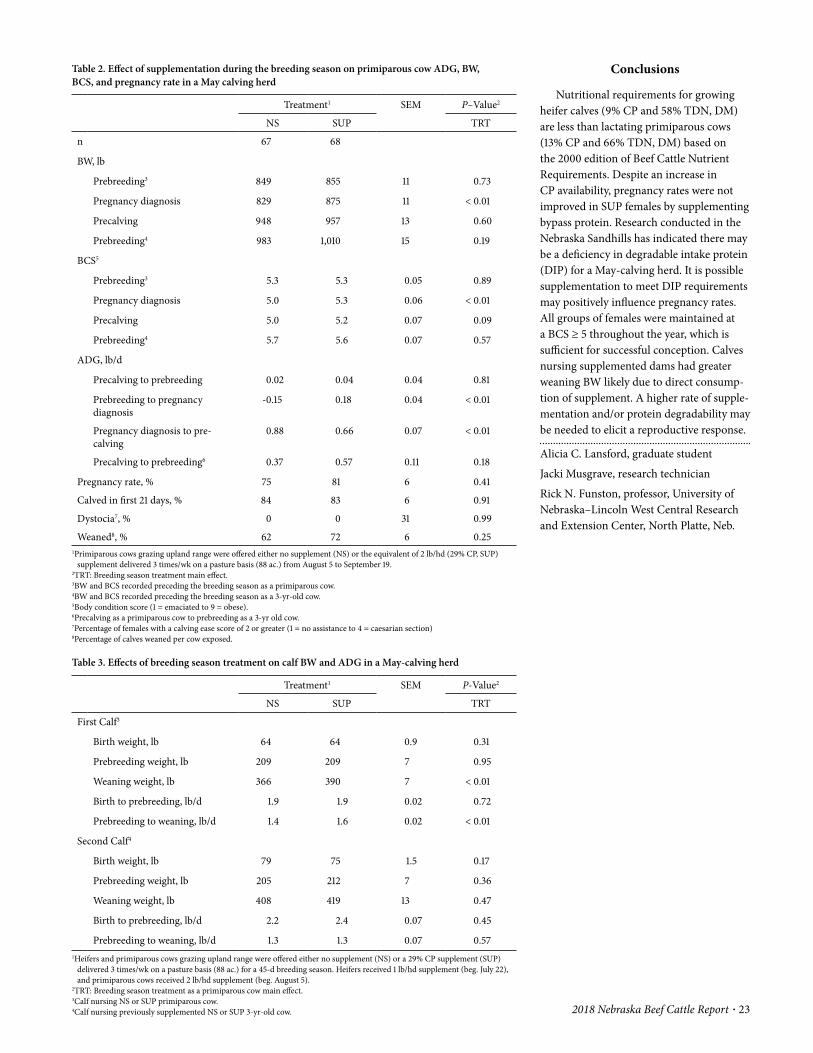
2018 Nebraska Beef Cattle Report · 23
Conclusions
Nutritional requirements for growing heifer calves (9% CP and 58% TDN, DM) are less than lactating primiparous cows (13% CP and 66% TDN, DM) based on the 2000 edition of Beef Cattle Nutrient Requirements. Despite an increase in CP availability, pregnancy rates were not improved in SUP females by supplementing bypass protein. Research conducted in the Nebraska Sandhills has indicated there may be a deficiency in degradable intake protein (DIP) for a May- calving herd. It is possible supplementation to meet DIP requirements may positively influence pregnancy rates. All groups of females were maintained at a BCS ≥ 5 throughout the year, which is sufficient for successful conception. Calves nursing supplemented dams had greater weaning BW likely due to direct consump-tion of supplement. A higher rate of supple-mentation and/or protein degradability may be needed to elicit a reproductive response.
Alicia C. Lansford, graduate student
Jacki Musgrave, research technician
Rick N. Funston, professor, University of Nebraska– Lincoln West Central Research and Extension Center, North Platte, Neb.
Table 2. Effect of supplementation during the breeding season on primiparous cow ADG, BW, BCS, and pregnancy rate in a May calving herd
Treatment1 SEM P– Value2
NS SUP TRT
n 67 68
BW, lb
Prebreeding3 849 855 11 0.73
Pregnancy diagnosis 829 875 11 < 0.01
Precalving 948 957 13 0.60
Prebreeding4 983 1,010 15 0.19
BCS5
Prebreeding3 5.3 5.3 0.05 0.89
Pregnancy diagnosis 5.0 5.3 0.06 < 0.01
Precalving 5.0 5.2 0.07 0.09
Prebreeding4 5.7 5.6 0.07 0.57
ADG, lb/d
Precalving to prebreeding 0.02 0.04 0.04 0.81
Prebreeding to pregnancy diagnosis
- 0.15 0.18 0.04 < 0.01
Pregnancy diagnosis to pre-calving
0.88 0.66 0.07 < 0.01
Precalving to prebreeding6 0.37 0.57 0.11 0.18
Pregnancy rate, % 75 81 6 0.41
Calved in first 21 days, % 84 83 6 0.91
Dystocia7, % 0 0 31 0.99
Weaned8, % 62 72 6 0.251Primiparous cows grazing upland range were offered either no supplement (NS) or the equivalent of 2 lb/hd (29% CP, SUP)
supplement delivered 3 times/wk on a pasture basis (88 ac.) from August 5 to September 19.2TRT: Breeding season treatment main effect.3BW and BCS recorded preceding the breeding season as a primiparous cow.4BW and BCS recorded preceding the breeding season as a 3- yr- old cow.5Body condition score (1 = emaciated to 9 = obese).6Precalving as a primiparous cow to prebreeding as a 3- yr old cow.7Percentage of females with a calving ease score of 2 or greater (1 = no assistance to 4 = caesarian section)8Percentage of calves weaned per cow exposed.
Table 3. Effects of breeding season treatment on calf BW and ADG in a May- calving herd
Treatment1 SEM P- Value2
NS SUP TRT
First Calf3
Birth weight, lb 64 64 0.9 0.31
Prebreeding weight, lb 209 209 7 0.95
Weaning weight, lb 366 390 7 < 0.01
Birth to prebreeding, lb/d 1.9 1.9 0.02 0.72
Prebreeding to weaning, lb/d 1.4 1.6 0.02 < 0.01
Second Calf4
Birth weight, lb 79 75 1.5 0.17
Prebreeding weight, lb 205 212 7 0.36
Weaning weight, lb 408 419 13 0.47
Birth to prebreeding, lb/d 2.2 2.4 0.07 0.45
Prebreeding to weaning, lb/d 1.3 1.3 0.07 0.571Heifers and primiparous cows grazing upland range were offered either no supplement (NS) or a 29% CP supplement (SUP)
delivered 3 times/wk on a pasture basis (88 ac.) for a 45- d breeding season. Heifers received 1 lb/hd supplement (beg. July 22), and primiparous cows received 2 lb/hd supplement (beg. August 5).
2TRT: Breeding season treatment as a primiparous cow main effect.3Calf nursing NS or SUP primiparous cow.4Calf nursing previously supplemented NS or SUP 3- yr- old cow.
24 · 2018 Nebraska Beef Cattle Report
© The Board Regents of the University of Nebraska. All rights reserved.
Traditional recommendations suggest heifers reach 55 to 65% of mature BW at the time of breeding. Due to the cost of retaining replacement heifers, more efforts have been made to devise economical heifer development methods. Previous studies have indicated heifers developed to lower target BW have comparable reproductive performance to heifers developed in higher input systems (2017 Nebraska Beef Report, pp. 5– 7). Furthermore, it has been reported heifers fed to 51 vs. 57% mature BW showed no difference in attaining puberty.
Therefore, objectives of these studies were to evaluate winter supplementation of May- calving cows grazing dormant winter range or meadow on gain and reproduction in addition to its impact on heifer progeny performance, and to determine the impact of heifer development system on subsequent growth and reproductive performance in early and late summer breeding seasons.
Procedure
Experiment 1
Over a 4- yr period, May- calving cows were utilized to evaluate the effects of winter supplementation on cow gain and reproduction in addition to its impact on heifer progeny. Cows grazed either dormant upland winter range with or without supplement (RS, RNS, respectively) or dor-mant meadow with or without supplement (MS, MNS, respectively) from December 1 to March 29 at the Gudmundsen Sandhills Laboratory (GSL), Whitman, NE. Each cow assigned to RS or MS overwinter treatment received the equivalent of 1 lb/d of a 32% CP (DM) supplement cube. Supplement was delivered 3 times/wk on a pasture (35.6 ha) basis. Following treatment, cows were managed as a single group and grazed na-tive upland range the remainder of the year. Fertile bulls were placed with cows (1:20 bull to cow ratio) approximately August 1 for a 45 d breeding season. Five d after bull placement, cows were estrus synchronized with a single injection of PGF2α (Lutalyse,
Shelby A. SpringmanAlicia C. Lansford
Jacqueline A. MusgraveJohn Nollette
Andy ApplegarthRick N. Funston
Summary with Implications
In Exp. 1, May- calving cows were utilized to evaluate the effects of winter supple-mentation on heifer progeny. Cows grazed either dormant upland winter range with or without a protein supplement or grazed dormant meadow with or without a protein supplement. In Exp. 2, replacement heifers from March and May calving herds were offered ad libitum meadow hay and 4 lb/d supplement or grazed meadow and offered 1 lb/d supplement from mid- January to mid- April. Calf weaning BW and ADG from birth to weaning was less for calves from cows grazing winter range with no supplement compared with all other dam treatments. Heifer development system did not impact final pregnancy rates. Therefore, a reduced input winter heifer development system is a viable option in both early and late summer breeding seasons. However, winter supplementation of May-calving dams did influence heifer progeny ADG from birth to weaning.
Introduction
The amount of harvested and purchased feed required to sustain a cow herd in the Nebraska Sandhills can be reduced by a late spring calving date, in which the cow’s nutritional demands better match forage quality and quantity. Protein is commonly supplemented to maintain cow BCS during winter grazing. Supplementing beef cows during late gestation can affect the lifetime productivity of the calf by altering post-weaning growth and heifer fertility.
Impact of Winter Supplementation of May Calving Cows and Heifer Development System in Two Different Breeding Seasons
on Subsequent Growth and Reproduction
Zoetis, Parsippany, NJ). Pregnancy was determined via rectal palpation or ultraso-nography (ReproScan, Beaverton, OR) at weaning in early January.
Experiment 2
A 4- yr study conducted at GSL utilized replacement heifers from 2 calving seasons. March- born (n = 225) and May- born (n = 258), crossbred (5/8 Red Angus, 3/8 Continental) heifers were stratified by BW and randomly assigned to 1 of 2 postweaning nutritional treatments (2 pastures·treatment- 1·year- 1) from mid- January to mid- April. The May- born heifer progeny from Exp. 1 were included in this study. March heifers were weaned in Octo-ber while May heifers were weaned in early January. Heifers were offered ad libitum meadow hay (HAY) and a 4 lb/d (32% CP, DM) supplement cube or allowed to graze meadow (MDW) and offered 1 lb/d of the same supplement. Prior to and following treatment, heifers were managed together within their respective breeding group. Following the treatment period, March- born heifers grazed meadow until June 1 and then grazed upland range. May- born heifers grazed range immediately following the treatment period.
Prior to each breeding season, 2 blood samples were collected via coccygeal veni-puncture 10 d apart to determine pubertal status. Samples were collected in May on March- born heifers and early July on May- born heifers. Heifers with plasma progester-one concentrations greater than 1 ng/mL at either collection were considered pubertal. Heifers were synchronized with a single PGF2α injection 5 d after bull placement (1:20 bull to heifer ratio) for 45 d. Bulls were placed with March heifers May 23 and with May heifers on July 10. Heifers grazed Sandhills upland range through final preg-nancy diagnosis. Pregnancy diagnosis was conducted via transrectal ultrasonography 40 d following bull removal. Forage samples were collected each yr to determine CP and
2018 Nebraska Beef Cattle Report · 25
TDN via esophageally fistulated cows for winter range, winter meadow, June range, July range, and September range (Table 1).
Calving performance of March- born and May- born heifers was measured by recording birth BW, calving ease, calf vigor, and dystocia rate. A calving ease scoring system of 1 to 5 was utilized with 1 repre-senting no assistance and 5 indicating a Caesarean section. Calf vigor was deter-mined with a 1 to 5 scoring system where 1 referred to the calf nursing immediately and 5 signified dead on arrival. Dystocia rate was characterized as a calving ease score of 2 and greater. Furthermore, udder score, proportion of bull calves, and rebreed pregnancy rate was determined on heifers. An udder scoring system of 1 to 5 with 1 representing poor udder quality and 5 signifying a superior udder was used on March- born and May- born heifers.
Statistical Analysis
Data for both experiments were analyzed using the GLIMMIX procedure of SAS (SAS Institute, Inc., Cary, N.C.). The main effect for Exp. 1 was dam treatment, while Exp. 2 main effect was heifer development treat-ment. Pasture was considered a replication as each development treatment occurred in 2 pastures each year. Therefore, pasture × year × treatment is the experimental unit. Pregnancy rate, calving rate, pubertal status, and the proportion of heifers that calved in the first 21 d represent binomial distribution and were analyzed using an odds ratio. Least squared means and SE of the proportion were obtained using the ILINK function. Differences were considered significant when P ≤ 0.05, while differences with 0.05 < P ≤ 0.10 were tendencies.
Results
Experiment 1
Cow Gain and Reproductive Performance
Throughout the winter treatment peri-od, RNS cows gained significantly less BW (P = 0.01) when compared with cows from the other treatments (Table 2). Previous re-search has indicated a loss in BW for cows not fed a protein supplement overwinter when compared with cows fed supplemen-
Table 1. Nutritional composition of range and hay in each development year1
2011 2012 2013 2014
Development period diet
Winter range CP,2 % DM 5.6 5.4 7.8 6.2
Winter range TDN,2 % DM 51.7 52.5 54.4 51.0
Winter meadow CP,2 % DM 7.7 10.7 9.9 12.7
Winter meadow TDN,2 % DM 55.8 60.7 61.2 68.9
Hay CP, 3 % DM 7.3 7.3 6.8 7.7
Hay TDN,3 % DM 54.4 55.9 48.2 58.5
March- calving breeding season
June range CP, % DM 14.0 10.1 19.3 14.1
June range TDN, % DM 64.3 61.5 79.7 61.6
May Calving breeding season
July range CP, % DM 11.1 10.6 14.7 10.1
July range TDN, % DM 61.2 59.6 71.0 59.0
Sept. range CP, % DM 6.9 8.2 9.8 10.4
Sept. range TDN, % DM 61.4 58.5 65.0 60.41 Collected from esophageally fistulated cows.2 Values for the developmental period are obtained from the previous December.3 Hay used during development yr was harvested the previous summer.
Table 2. Effect of winter supplementation on cow BW and reproduction
Item
Dam Treatment1
SEM P- valueMS MNS RS RNS
BW
Jan. BW, lb 930 928 930 928 9 0.94
Overwinter BW change, lb 115a 101a,c 93b,c 49d 7 0.01
Precalving BW, lb 1,045 1,030 1,021 974 11 0.17
Early lactation BW change, lb 57d 62c,d 79b 104a 4 0.04
Prebreeding BW, lb 1,104 1,087 1,100 1,082 11 1.00
Mid- late lactation BW change, lb - 71 - 44 - 46 - 0.9 7 0.15
BCS
Jan. BCS 4.5 4.6 4.6 4.6 0.04 0.43
Overwinter BCS change 0.28 0.22 0.37 0.29 0.05 0.84
Precalving BCS 4.7 4.7 4.7 4.6 0.05 0.26
Early lactation BCS change 0.96 0.96 0.91 1.00 0.05 0.29
Prebreed BCS 5.7 5.6 5.6 5.6 0.04 1.00
Mid- late lactation BCS change - 0.17 - 0.03 - 0.2 0.01 0.05 0.54
Calved in first 21 d, % 73 82 80 81 3 0.26
Rebreed pregnancy rate, % 89 89 87 82 3 0.401MS = dams grazed dormant meadow and received 1 lb as- fed·animal- 1·d- 1 32% CP supplement; MNS = dams grazed meadow and
received no supplementation; RS = dams grazed dormant range and received 1 lb as- fed·animal- 1·d- 1 32% CP supplement; RNS = dams grazed dormant range and received no supplementation.
a,b,c,d For dam treatment, means in a row with different superscripts are different (P ≤ 0.05).
26 · 2018 Nebraska Beef Cattle Report
tal protein prepartum. Body weight at other time points during gestation to lactation, however, did not differ (P > 0.15) among cows, apart from the BW change in early lactation where RNS cows exhibited greater (P = 0.04) BW gain than other treatments, likely due to a compensatory gain effect. Body condition score did not differ (P > 0.26; Table 2) among treatments from gestation through lactation. The proportion of cows that calved in the first 21 d and rebreed pregnancy rate were not different (P > 0.26) among winter supplementation treatments.
Heifer Progeny Performance
Birth BW tended to be lower (P = 0.07) in heifers born to RNS cows (Table 3). Birth to weaning ADG was less (P < 0.01) in daughters born to RNS cows compared with other dam treatments, thus leading to a lower (P < 0.01) weaning BW in RNS heifer progeny. The lower birth to weaning ADG and weaning weights in daughters from RNS cows could potentially be a fetal programming effect where cows on winter range without supplement had the least BW gain over the treatment period. Heifer progeny ADG during the spring and summer period was not affected (P > 0.46) by previous dam treatment. Heifers born to MS cows had greater (P < 0.01) percent of mature BW than heifers from RNS cows. At heifer prebreeding and pregnancy diagno-sis, BW was greater (P < 0.02) in daughters born to MS cows than RNS cows. Pubertal status and pregnancy rate were similar (P > 0.31) among heifer progeny. Furthermore, calving rate and the proportion of heifers calving in the first 21 d did not differ (P > 0.36) among dam treatments.
Experiment 2
March- born Heifer Gain and Reproductive Performance
Heifer BW, ADG, and reproductive performance are summarized in Table 4. Weaning and initial BW was not different (P ≥ 0.52) between over- winter treatments. March- born HAY heifers had greater (P < 0.01) ADG during the treatment period than MDW heifers, leading to a great-er BW following the treatment period. However, spring (April 22 to May 22) ADG was greater (P < 0.01) for March- born MDW heifers compared with HAY heifers.
Table 3. Heifer progeny gain and reproductive performance from May- calving cows
Item
Dam Treatment1
SEM P- valueMS MNS RS RNS
n 54 53 53 54
Birth BW, lb 75x 75x 75x 73y 1 0.07
ADG from birth to weaning, lb
1.57a 1.52a 1.52a 1.48b 0.04 <0.01
Weaning BW, lb 428a 423a 423a 406b 9 <0.01
Spring ADG,2 lb/d 2.25 2.27 2.20 2.09 0.18 0.46
Prebreeding BW,3 lb 697a 697a,b 675a,b 655b 25 <0.01
Summer ADG,4 lb/d 1.15 1.21 1.15 1.12 0.26 0.73
Percent of mature BW,5 % 57a 56a,b 56a,b 54b 1 <0.01
Pregnancy diagnosis BW, lb 789a 778a,b 772a,b 754b 9 0.02
Pubertal,6 % 79 67 64 77 19 0.31
Pregnancy rate, % 72 72 66 64 7 0.73
Calving rate7, % 67 65 64 62 7 0.96
Calved in first 21 d, % 68 63 80 75 8 0.361MS = dams grazed dormant meadow and received 1 lb as- fed·animal- 1·d- 1 32% CP supplement; MNS = dams grazed meadow and
received no supplementation; RS = dams grazed dormant range and received 1 lb as- fed·animal- 1·d- 1 32% CP supplement; RNS = dams grazed dormant range and received no supplementation.
2 May 10 to July 9 (67 d).3 Determined July 9.4 July 9 to Sept 10 (63 d).5Percent of mature BW at breeding based on mature cow BW of 1,218 lb.6Considered pubertal if blood plasma progesterone concentration > 1 ng/mL.7Percentage of heifers that calved.a,b,c For dam treatment, means in a row with different superscripts are different (P ≤ 0.05).x,y,z For dam treatment, means in a row with different superscripts are tendencies (0.05 < P ≤ 0.1).
Table 4. Effect of over- winter treatment on March- born heifer gain and reproductive performance
Item
Heifer Treatment1
SEM P- valueHAY MDW
n 113 112
Weaning BW, lb 443 441 13 0.52
Initial BW, lb 529 529 13 0.89
Post- treatment BW, lb 683 633 15 <0.01
Treatment ADG,2 lb/d 1.72 1.12 0.07 <0.01
Spring ADG,3 lb/d 0.46 1.21 0.42 <0.01
Prebreeding BW,4 lb 705 672 11 <0.01
Summer ADG,5 lb/d 1.12 1.21 0.20 0.09
Percent of mature BW,6 % 58 55 1 <0.01
Pregnancy diagnosis BW, lb 831 809 20 0.02
Pubertal,7 % 64 69 19 0.82
Pregnancy rate, % 87 88 3 0.92
Calving rate8, % 85 83 3 0.61
Calved in 1st 21 d, % 79 74 4 0.331HAY = heifers received ad libitum hay and 4 lb/d supplement (32% CP DM) from Jan 15 to Apr 15; MDW = heifers grazed
meadow and received 1 lb/d supplement (32% CP DM) from Jan 15 to Apr 15.2Jan 16 to Apr 22 (96 d) and includes the treatment period.3Apr 22 to May 22 (30 d).4May 22.5May 22 to Sept 10 (111 d).6Percent of mature BW at breeding based on mature cow BW of 1,218 lb.7Considered pubertal if blood plasma progesterone concentration > 1 ng/mL.8Percentage of heifers that calved.

2018 Nebraska Beef Cattle Report · 27
Pregnancy and calving rates were similar (P ≥ 0.69) between treatments, although, the proportion of heifers calving in the first 21 d was greater (P = 0.02) for MDW compared with HAY. Heifer development system did not impact pregnancy rate in the March or May replacement heifers; however, March heifer pregnancy rate was greater (P < 0.01) than in May (87 vs. 70 ± 3%). The lower pregnancy rate in May heifers may be due to declining forage quality during the later breeding season (Table 1).
May- born Calving Performance
Calf birth BW (64 ± 2 lb) and calf wean-ing BW (368 ± 11 lb) were similar (P > 0.36) for progeny from HAY and MDW dams. The proportion of bull calves born did not differ (P = 0.95) between HAY and MDW heifers. Additionally, calving ease, calf vigor, dystocia rate, and udder score were similar (P > 0.71) between development treatments. Rebreed pregnancy rate was not different (P = 0.60) between development (80 ± 8%) treatments in addition to heifer BW (P = 0.31) at rebreeding.
Implications
In Exp. 1, calf weaning BW and ADG from birth to weaning were less for daugh-ters from cows that grazed winter range without supplementation than daughters from other dam treatments, potentially a result of fetal programming due to lower body weight gain in cows grazing winter range without supplement. However, repro-ductive performance did not differ among heifer progeny from dams that received different overwinter treatments. In Exp. 2, heifer development system did not impact final pregnancy rates; however, March- born heifer pregnancy rate was greater compared with May- born heifers. A reduced input winter heifer development system is a viable option in both early and late summer breeding seasons.
Shelby A. Springman, graduate student
Alicia C. Lansford, graduate student
Jacqueline A. Musgrave, research technician
John Nollette, research technician
Andy Applegarth, operations manager
Rick N. Funston, professor, University of Nebraska- Lincoln West Central Research and Extension Center, North Platte, Neb.
Throughout the summer (May 22 to Sept. 10), ADG tended (P = 0.09) to be greater for the MDW heifers. The greater spring and summer ADG most likely reflects a compensatory gain effect exhibited by the MDW heifers. However, HAY heifer BW at breeding and pregnancy diagnosis continued to be greater than MDW heifers. Percent of mature BW prior to the breeding season was greater (P < 0.01) for HAY compared with MDW. However, pubertal status prior to breeding and pregnancy rate did not differ (P ≥ 0.82) between HAY and MDW heifers. Furthermore, calving rate and the proportion of heifers calving in the first 21 d was not different (P ≥ 0.33) between over- winter treatments.
March- born Calving Performance
Calf birth BW did not differ (P = 0.70) among progeny from different heifer over- winter treatments (66 vs 66 ± 2 lb; HAY vs MDW, respectively). The proportion of bull calves born was not different (P = 0.32) be-tween HAY and MDW heifers. Additional-ly, calving ease, calf vigor, and dystocia rate were similar (P > 0.62) between treatments. Udder score, however, was more desir-able (P = 0.03) for MDW vs. HAY heifers.
Rebreed pregnancy rate was not different (P > 0.52) between HAY and MDW heifers (87 ± 8%) in addition to BW at rebreeding. Furthermore, calf BW at weaning was not affected (P = 0.35) by heifer over- winter treatments (447 ± 9 lb).
May- born Gain and Reproductive Performance
Initial treatment BW was not different (P = 0.99) between treatments (Table 5). Similar to March- born heifers, May- born heifers on HAY had greater (P < 0.01) ADG during the treatment period. Spring ADG did not differ (P = 0.66) between treatments, and summer ADG was greater (P < 0.01) for MDW heifers, likely due to a compensatory gain effect. Post- treatment, prebreeding, and pregnancy diagnosis BW was greater (P < 0.01) for HAY compared with MDW heifers. Therefore, increased growth rates following the treatment period for MDW heifers did not result in similar heifer BW following these time periods. Percent of mature BW prior to the breeding season was greater (P < 0.01) for HAY (58%) compared with MDW (54%). More May- born heifers on HAY were (P = 0.02) pubertal prior to breeding than MDW.
Table 5. Effect of overwinter treatment on May- born heifer gain and reproductive performance
Item
Treatment1
SEM P- valueHAY MDW
n 128 130
Initial treatment BW, lb 419 419 9 0.99
Post- treatment BW, lb 573 507 15 <0.01
Treatment ADG,2 lb/d 1.30 0.77 0.11 <0.01
Spring ADG,3 lb/d 1.96 1.92 0.24 0.66
Prebreeding BW,4 lb 707 652 9 <0.01
Summer ADG,5 lb/d 1.08 1.26 0.24 <0.01
Percent of mature BW,6 % 58 54 1 <0.01
Pregnancy diagnosis BW, lb
789 758 7 <0.01
Pubertal,7 % 79 65 18 0.02
Pregnancy rate, % 72 68 4 0.69
Calving rate8, % 67 65 5 0.88
Calved in first 21 d, % 64 79 6 0.021HAY = heifers received ad libitum hay and 4 lb/d (32% CP DM) supplement from Jan 15 to Apr 15; MDW = heifers grazed
meadow and received 1 lb/d (32% CP DM) supplement from Jan 15 to Apr 15.2 Jan 5 to May 10 (125 d), includes the treatment period.3 May 10 to July 9 (67 d).4 Determined July 9.5 July 9 to Sept 10 (63 d).6Percent of mature BW at breeding based on mature cow BW of 1,218 lb.7Considered pubertal if blood plasma progesterone concentration > 1 ng/mL.8Percentage of heifers that calved.
28 · 2018 Nebraska Beef Cattle Report
© The Board Regents of the University of Nebraska. All rights reserved.
Results
In both years, the beet mixtures were sealed and stored 2– 3 months before being fed and underwent ensiling during storage (Table 2). In both years beet pieces were small and soft after ensiling and did not result in choking issues. The rotting beets in 2015 had lower sugar content than the fresh chipped beets in 2016. A direct comparison of the two types of beets on cattle perfor-mance was not possible. However, there were no treatment by year interactions which suggests the feeding value of the rotting and fresh beets were similar. Initial and ending BW and BCS change were not different (P > 0.50) for CORN or BEETS. There was a tendency for BCS change to be greater for CORN than BEETS (P = 0.08) (Table 3).
These results suggest chopped sugar beets can be mixed with low quality forage or residue and a protein source, such as distillers grains and limit fed to gestating beef cows to maintain body condition.
Karla H. Jenkins, Associate Prof., Scotts-bluff, NE
Jacob A. Hansen, Research Manager, High Plains Ag Lab
can be beneficial to both the sugar beet producer and the beef producer as the sugar beet producer at least receives a salvage value for the beets and the beef producer may be able to buy an energy dense feed at a discounted price. Chopped sugar beets have a neutral detergent fiber (NDF) con-tent of 15.4% as opposed to sugar beet pulp which has 45.4%. Therefore, the objective of this research was to evaluate chopped sugar beets as an energy source compared to corn in beef cow diets.
Procedure
Two months before the initiation of the experiment, the diet containing the sugar beets was mixed and stored in an agricul-tural bag. In yr 1, rotting chipped sugar beets were mixed with wet distillers grains and wheat straw prior to bagging. In yr 2, fresh chipped sugar beets were mixed with wheat straw only and stored in the bag. Wet distillers grains were added to that diet upon feeding. In April of each year, late gestation multiparous crossbred cows (n=40 in yr 1 and 36 in yr 2; initial BW = 1265 lb, SE=36 lb;) were used in a complete randomized design. Cows were randomly assigned to one of eight pens each year (4 or 5 cows/pen). The treatments were chopped sugar beets (BEETS) or corn (CORN) as an energy source in a total mixed ration (Table 1). Cows were limit fed (1.6% BW) either diet to supply 13 lb of TDN. Cows were limit fed 70:30 wheat straw and wet distillers grains at 2% body weight (BW) for 5 d prior to the initiation of the experiment and prior to collecting end BW and body condition score (BCS) to minimize gut fill effects. The experiment was terminated two weeks before calving and lasted an average 50 days. Initial and ending BW, BCS, and BCS change were determined.
Karla H. JenkinsJacob A. Hansen
Summary with Implications
Sugar beets not accepted for human consumption were evaluated as an energy source in a limit fed ration for confined beef cows. Initial and final body weight and body condition score were not different between wheat straw based diets containing wet dis-tillers grains and either chopped sugar beets or corn. Body condition score change tended to be greater for the diet containing corn. However, cows on both treatments finished the study with a body condition score of 5.7. Chopped sugar beets mixed with wheat straw and stored in an agricultural bag underwent ensiling and did not result in choking issues. Sugar beets appear to be similar to corn and are an acceptable energy source for main-taining gestating beef cows.
Introduction
Sugar beets contribute $165 million to the local economy in the Nebraska Panhan-dle. There are approximately 300 western NE farmers who produce 1.3 million tons of sugar beets on about 50,000 acres. This results in 225,000 tons of crystallized sugar. Therefore having a strong sugar beet indus-try is important to Nebraska. Unfortunately, there are times when unfavorable fall and winter weather conditions result in decay of stockpiled sugar beets making them unacceptable for human consumption. Additionally, there are times the amount of sugar beets produced exceeds the contract for beets needed for sugar production. Both scenarios create a supply of sugar beets which will not be used for human consumption. Knowing how to incorporate rejected sugar beets into beef cattle diets
Chopped Sugar Beets as a Component of Beef Cow Diets
Table 1. Diets for evaluating sugar beets for gestating beef cows
Ingredient, % DMSugar
beet dietCorn diet
Sugar beets 20 — —
Corn — — 20
Wet distillers grains 20 20
Wheat straw 60 60
2018 Nebraska Beef Cattle Report · 29
Table 2. Composition of sugar beets and ensiled sugar beet mixtures
Item2015 Rotting sugar
beet mix at bagging1
2015 Rotting sugar beet mix after ensiling
2016 Fresh sugar beet mix at bagging1
2016 Fresh sugar beet mix after ensiling
2015 Rotting sugar beets
2016 Fresh sugar beets
DM, % 43.9 47.2 33.0 40.4 31.2 25.5
Lactic Acid,% 1.34 0.81 0.17 2.45 2.16 0.00
Acetic Acid, % 0.96 5.02 0.19 1.96 2.61 0.09
L/A ratio 1.39 0.16 0.89 1.25 0.83 0.00
pH 4.8 4.2 6.8 4.1 4.3 6.6
Crude protein 10.8 12.4 4.8 5.8 4.6 4.5
WSC2 7.1 1.8 50.7 4.0 26.9 73.0
ESC2 6.1 1.3 49.0 2.9 22.7 69.5
NH3- N 1.56 4.63 1.77 2.80 2.00 0.821Rotting sugar beet mixture was 20% sugar beets, 20% wet distillers grains, and 60% straw on a dry matter basis, fresh sugar beet mixture was 70% straw, 30% sugar beets on a dry matter basis. Wet
distillers grains was added before feeding.2WSC = water soluble carbohydrate, ESC=ether soluble carbohydrate
Table 3. Performance of cows limit fed diets containing sugar beets or corn
Sugar beet diet1 Corn diet SE P value
Initial BW2, lb 1261 1269 36 0.88
Final BW, lb 1341 1318 33 0.61
Initial BCS 5.4 5.2 0.16 0.50
Final BCS 5.7 5.7 0.14 0.71
BCS change 0.27 0.49 0.12 0.081Sugar beet diet was 20% sugar beets, 20% wet distillers grains, 60% wheat straw; corn diet was 20% corn, 20% wet distillers
grains, 60% wheat straw2BW=body weight, BCS = body condition score on a 1– 9 scale
30 · 2018 Nebraska Beef Cattle Report
© The Board Regents of the University of Nebraska. All rights reserved.
fined in a common pen within location during the summer calving season (mean calving date: ENREC=July 14; PREC=July 15). A distillers and crop residue based diet was limit- fed to cow- calf pairs during this time.
The trial was initiated at the beginning of cornstalk grazing within each location (Nov 11 at ENREC and Nov 22 at PREC). Cow- calf pairs in the CS treatment were hauled to irrigated cornstalk fields, while cow- calf pairs assigned to DL treatment remained in dry- lot pens.
Dry- lot pairs within location were limit- fed a diet (Table 1) formulated to maintain a lactating cow in early gestation. Dry matter offered (range of 24.5 lb. to 29.5 lb.) per day increased monthly throughout the study to account for the increasing intake of the growing calves.
Stocking rate for cow- calf pairs grazing corn residue was calculated using estimated residue intakes of the cow and calf (2009 Nebraska Beef Cattle Report, pp. 13– 14) and assuming 8 lb of husk and leaf residue (DM) were consumed per bushel of corn yield. A dried distillers grain based pellet (Table 2) was supplemented in bunks to pairs wintered on cornstalks at a rate of 5.3 lb. (range of 3.7 lb. to 7.1 lb.) DM/pair daily. Estimated DM intake of the cow and calf (2009 Nebraska Beef Cattle Report, pp. 13– 14) and estimated digestibility values
system may reduce production costs (2015 Nebraska Beef Cattle Report pp. 19– 21). However, minimal research is available on the performance of a cow- calf pair grazing corn residue. Therefore, the objective of the current study was to evaluate the effects of winter corn residue grazing in a semi- confined cow- calf production system on cow and calf performance.
Procedure
This study was conducted over three years at the Eastern Nebraska Research and Extension Center (ENREC) and two years at the Panhandle Research and Extension Center (PREC). Lactating, composite (Red Angus x Red Poll X Tarentaise x South Dev-on x Devon) beef cows (n=127 at ENREC; n=56 at PREC) with summer- born calves were utilized in the study. In year one, cow- calf pairs within location were blocked by cow BW (4 blocks at ENREC; 2 blocks at PREC), stratified by calf age, and assigned randomly within strata to one of two winter cow- calf production treatments with four (ENREC) or two (PREC) replications (pens or paddocks) per treatment. Treatments were 1) dry- lot feeding (DL) or 2) cornstalk grazing (CS). In the subsequent years, cows within location were assigned to the same treatment as assigned in year one.
Prior to trial initiation, cows were con-
Effects of Production System on Cow and Calf Performance
Shelby E. GardineJason M. Warner
Robert G. BondurantF. Henry HilscherKarla H. Jenkins
Galen E. EricksonTerry J. Klopfenstein
Summary with Implications
Limited traditional forage resources have prompted interest for alternative cow- calf production systems. This study evaluated the effects of two winter cow- calf production systems (cornstalk grazing and dry- lot feeding) on cow- calf performance in a summer- calving, intensively managed cowherd at two locations. Grazing cow- calf pairs on cornstalks resulted in similar or lower ending BW of cows and lower ADG of calves when compared to cow- calf pairs wintered in the dry- lot. A partial budget of incorporating winter cornstalk grazing into an intensive production system suggests that cows wintered on cornstalks may be $137 more profitable compared to cows wintered in the dry- lot.
Introduction
Diminishing traditional forage resources have stimulated cow- calf producers to seek alternative production systems. Research has shown that intensive management of cows can be utilized as an alternative system to traditional pasture beef produc-tion (2015 Nebraska Beef Cattle Report, pp. 16– 18). Areas that are challenged by limited traditional forage resources will commonly have greater grain crop production, result-ing in greater availability of corn residue for fall/winter grazing with by- product supplementation. An economic analysis of an alternative production system suggests that integrating corn residue grazing in a semi- confined cow- calf production
Table 1. Diets fed to cow- calf pairs from November to April by location and year1,2
Ingredient, %
Year 1 Year 2 Year 3
ENREC3 ENREC3 PREC4 ENREC3 PREC4
Modified wet distillers grains plus solubles
55 55 — 55 —
Wet distillers grains plus solubles — — 58 — 58
Cornstalks — 40 — — —
Wheat straw 40 — 40 40 40
Supplement5 5 5 2 5 21All values presented on a DM basis2Dry matter offered (range of 24.5 lb. to 29.5 lb.) increased monthly throughout the study3ENREC = Eastern Nebraska Research and Extension Center4PREC = Panhandle Research and Extension Center5Supplements included limestone, trace minerals, vitamin A,D,E premix
2018 Nebraska Beef Cattle Report · 31
gest that there is not a treatment difference for pregnancy rates.
Calf performance is presented in Table 4. Similar production effects were observed at both locations. Calves wintered in the dry- lot had greater BW change compared to calves grazing cornstalks (P ≤ 0.04). Likewise, calves wintered in the dry- lot had greater ADG and BW per d of age compared to CS calves (P ≤ 0.03). Weaning weights and ADG for June calves grazed on cornstalks and weaned in April (2010 Nebraska Beef Report, pp. 5– 7) were similar to the performance of calves wintered on cornstalks in the current study. Post- weaning performance of the DL and CS calves was evaluated in a subsequent study (2018 Nebraska Beef Report- Gardine; Post- weaning management).
Numerically, the cows grazing corn-stalks at PREC gained 19 lb. while the cows at ENREC lost 72 lb. Calves at PREC gained 1.54 lb/d while those at ENREC gained 1.32 lb/d. In vitro analysis of the corn residue at each location was conducted to deter-mine if residue quality was related to the apparent differences in performance of the pairs grazing cornstalks. Digestible organic matter of corn residue was 45.9 % and 56.8 % at ENREC (223 bushels/acre) and PREC (230 bushels/acre), respectively. Research (1991 Nebraska Beef Cattle Report, pp. 19– 22) demonstrated that calves gained
Results
Cow- calf pairs at ENREC grazed from Nov 11 to April 10 (152 d). At PREC, the grazing period was 137 days (Nov 22 to April 6). Dry- lot cow- calf pairs were limit- fed 27.2 lb DM (ENREC) or 26.14 lb DM (PREC) on average throughout the trial.
Cow performance is presented in Table 3. Cows that were managed in the dry- lot at ENREC had greater ending BW and BCS compared to cows grazing cornstalks (P < 0.01). Cows wintered on cornstalks at EN-REC lost BW and had a 0.5 unit decrease in BCS, while cows in the dry- lot gained BW and had a 0.2 unit increase in BCS. At PREC, BCS increased for cows wintered in the dry- lot and decreased for cows wintered on cornstalks (P = 0.04). No significant dif-ferences (P > 0.41) were observed between treatments for any other cow performance variables at PREC. The increase in BW and BCS observed in cows managed in the dry- lot over the winter indicates that DL cows were over- fed and not at maintenance.
Reproduction data required that cows had a treatment applied prior to the breeding season; therefore, treatment effect on pregnancy rate was measured for years 2 and 3 at ENREC and year 2 at PREC. There were 61 cows (CS= 33; DL= 28) and 19 (CS=10; DL= 9) cows total from ENREC and PREC, respectively, that met these criteria. Although cow numbers within treatments are minimal, current data sug-
of the cornstalk residue throughout the grazing period (2004 Nebraska Beef Cattle Report, pp. 13– 15) were used to calculate supplementation rate to meet cow- calf requirements. Additional supplemental feed was only fed to grazing pairs if snow cover prevented grazing. In year 2, approximately 170 lb. (DM) of ammoniated cornstalks was fed per cow- calf pair at ENREC.
The trial was completed when winter cornstalk grazing ended on April 10 (EN-REC) or April 6 (PREC), which coincided with weaning time. Cow BW and calf BW were recorded over two consecutive days at trial initiation and completion to determine changes in BW. Body condition score (BCS) of cows was also evaluated at trial initiation and completion to calculate differences in condition score. Prior to being weighed at trial initiation, all pairs were limit- fed for a minimum of 5 consecutive days to reduce weight variation due to gastrointestinal tract fill. At trial completion, cow and calves were separated and limit- fed a minimum of 5 days before being weighed. Cows were exposed to bulls (approximately 1 bull: 10 cows) beginning Sept 25 and September 26 with a 73 and 74 day breeding season at ENREC and PREC, respectively.
Data from ENREC and PREC were analyzed separately. Data were analyzed as a randomized block design using the mixed procedure of SAS. The model included pen or paddock as the experimental unit, cow- calf production system as the fixed effect, and block and year as random effects. Because the proportion of steer and heifer calves varied within pens, proportion of steers was included in the model as a covariate for all calf performance variables. Significance was declared at P < 0.05.
Table 2. Supplement fed to cow- calf pairs grazing cornstalks1,2
Ingredient, %
Dried distillers grains plus solubles 93.28
Limestone 6.23
Pelleting binder (urea formaldehyde polymer and calcium sulfate)
0.21
Vitamin A,D,E 0.11
Trace mineral3 0.171All values presented on a DM basis2Supplemented on average at a rate of 5.3 lb. (range of 3.7 lb.
to 7.1 lb.) DM/pair daily3Trace mineral: 0.4389% Cu, 3.1818% Mn, 2.1511% Zn,
0.0067% Co, 0.0152% I, 94.2064% Limestone carrier
Table 3. Performance of cows by cow- calf production system1
Item
ENREC
SEM P- value
PREC
SEM P- valueCS2 DL3 CS2 DL3
Cow BW, lb
Initial4 1219 1225 60 0.86 1332 1300 133 0.59
Ending5 1147 1313 48 <0.01 1351 1360 96 0.86
Cow BW Change, lb - 72 88 20 <0.01 19 60 37 0.42
Cow BCS6
Initial4 5.49 5.58 0.31 0.62 6.09 5.92 0.71 0.50
Ending5 5.03 5.82 0.18 <0.01 5.83 5.95 0.70 0.41
Cow BCS change4 - 0.46 0.24 0.20 <0.01 - 0.26 0.03 0.08 0.04
Pregnancy7, % 97.5 83.1 8.1 0.24 87.5 89.0 13.2 0.941Three years of data from ENREC and two years of data from PREC2CS= pairs wintered on cornstalks3DL= pairs wintered in dry- lot4Initial date= November 11 at ENREC and November 22 at PREC5Ending date= April 10 at ENREC and April 6 at PREC6BCS on a 1 (emaciated) to 9 (obese) scale7Reproduction data from years 2 and 3 (ENREC) or year 2 (PREC) due to breeding season beginning prior to trial initiation within yr

32 · 2018 Nebraska Beef Cattle Report
than offset reduced performance of calves wintered on cornstalks.
Conclusion
Cow- calf pairs grazing corn residue in the winter may have similar or reduced per-formance compared to pairs fed a complete diet throughout the winter in the dry- lot. Reduced BW and BCS of cows wintered on cornstalks does not appear to impede preg-nancy rates if cows are in adequate body condition score (≥5) prior to the breeding season. Calf ADG may be less than calves wintered in the dry- lot. However, lower winter production inputs may be signif-icant enough to compensate for reduced performance of calves when cow- calf pairs are wintered on cornstalks.
Shelby E. Gardine, graduate student
Jason M. Warner, graduate student
Robert G. Bondurant and F. Henry Hilscher, research technicians, Department of Animal Science, Lincoln
Karla H. Jenkins, associate professor, Panhandle Research and Extension Center, Scottsbluff
Galen E. Erickson and Terry J. Klopfenstein, professors, Department of Animal Science, Lincoln
of corn residue. However, the current study would disagree with this hypothesis as yields were equivalent between locations.
A partial budget (2017 Nebraska Beef Report, pp. 19– 21) was utilized to econom-ically compare reduced performance, as well as decreased winter production cost of the CS wintering system. In that study, incorporating winter cornstalk grazing into an intensive production system resulted in a cost savings of $137 per pair. The decrease in production cost more
0.3 lb./day more grazing dryland compared to irrigated cornstalks, suggesting that the quality of dryland cornstalks was greater than irrigated cornstalks. More recent data (2011 Nebraska Beef Cattle Report, pp. 22– 23) show 8.8% greater digestibility of leaves and husks from corn residue at Scotts-bluff (148 bushels/acre corn) compared to residue from 10 corn plant hybrids grown near Paxton (245 bushels/acre corn). It was hypothesized that lower yields due to envi-ronmental conditions increases the quality
Table 4. Performance of calves by cow- calf production system1
Item
ENREC
SEM P- value
PREC
SEM P- valueCS2 DL3 CS2 DL3
Initial age, d4 121 118 4 0.43 131 129 17 0.62
Calf BW, lb
Initial5 331 312 8 0.08 318 317 29 0.97
Ending6 529 637 12 <0.01 513 595 33 <0.01
Calf BW change 198 326 9 <0.01 211 279 25 0.04
Calf ADG, lb 1.32 2.15 0.06 <0.01 1.54 2.06 0.13 0.03
BW•d- 1 age- 1, lb7 1.93 2.38 0.06 <0.01 1.97 2.28 0.14 0.021Three years of data from ENREC and 2 years of data from PREC2CS= pairs wintered on cornstalks3DL= pairs wintered in dry- lot4Initial age= age at initiation of cornstalk grazing period5Initial date= November 11 at ENREC and November 22 at PREC6Ending date= April 10 at ENREC and April 6 at PREC7Weight per d of age at collecting weights following weaning
2018 Nebraska Beef Cattle Report · 33
© The Board Regents of the University of Nebraska. All rights reserved.
Procedure
Red Angus- based, May- born heifers (n = 799) at 2 locations were utilized to determine the effects of an injectable trace mineral on reproductive performance. Heifers were managed at the Maddux ranch near Wauneta, NE. Following weaning in October, heifers were backgrounded in a feedlot (Table 1) until a body weight (BW) of 650 lb was reached and then moved to graze native range at location 1 (L1, n = 125) or location 2 beginning in early March (L2, n = 286). A subset of heifers (n = 388) grazed corn residue with cows over winter, weaned in April, and backgrounded in a feedlot until target BW of 650 lb was attained and then transported to L1 and L2 finishing in early June. Heifers were offered free-choice mineral at both locations. Initial mineral status was analyzed via liver biopsy prior to mineral treatment (677 lb, n = 22). Initial liver concentrations of copper (146 µg/g), manganese (9.22 µg/g), selenium (1.54 µg/g), and zinc (115 µg/g) were ade-quate and not different (P > 0.26) among heifers managed at the 2 overwinter loca-tions (Table 2). Heifers were synchronized with a 14- d controlled internal drug release (CIDR)- prostaglandin F2α protocol (Figure 1) and either injected with a trace mineral (5 ml, MULTIMIN, n = 399) or received no injection (CON, n = 400) the day of CIDR insertion. Fertile bulls were placed with heifers on range for 60 d following AI (1:17
tation free-choice; however, trace- mineral intake can vary. Furthermore, dietary trace- mineral absorption may be reduced due to negative interactions with other nutrients during digestion. An injectable trace- mineral (ITM) solution used with free-choice trace minerals may be beneficial before breeding to increase mineral status. Heifers given an ITM in conjunction with a free- choice mineral supplement have shown an increase in conception rates to timed embryo transfer. Additionally, conception to fixed- time AI was greater in ITM cows when compared with saline- treated cows. Conversely, a more recent study noted no differences in reproductive performance of feedlot- developed heifers given an ITM 30 d prior to the breeding season when adequate concentrations of trace mineral were provided in the diet. Limited research has been conducted concerning the effects of an injectable trace mineral adminis-tered at CIDR insertion on reproductive performance of extensively- developed beef heifers. Heifers developed extensively represent those managed under dormant or scarce forage conditions, low precipita-tion, undulating terrain, or restricted- gain pen developed. Therefore, the objective of the current study was to determine if an injectable trace mineral at CIDR inser-tion affected reproductive performance of range- developed beef heifers.
Shelby A. SpringmanJohn G. Maddux
Mary E. DrewnoskiRick N. Funston
Summary with Implications
Trace minerals serve an essential role in regulating reproduction. Free-choice trace mineral supplementation is often provided to grazing beef cattle. An injectable trace- mineral solution used with free-choice trace minerals may be beneficial before breeding to improve mineral status. Therefore, Red Angus- based, May- born heifers were utilized to determine the effects of an injectable trace mineral on reproductive performance. Preg-nancy rates did not differ between heifers injected with a trace mineral and heifers that received no injection. Injectable trace mineral at CIDR insertion 33 d before artificial insemination did not influence reproductive performance in heifers with adequate trace mineral status.
Introduction
Trace minerals serve an important role in many biochemical processes, including reproduction. Traditionally, grazing beef cattle are offered trace- mineral supplemen-
Effect of Injectable Trace Mineral on Reproductive Performance in Beef Heifers
Table 1. Composition and nutrient analysis of diet provided to heifers in the feedlot (DM basis)1
Ingredient % of diet
Distillers grains 47.48
Silage 35.00
Straw 11.71
Grower Supplement 5.81
Nutrient Analysis
CP, % 19.39
TDN, % 78.781Diet balanced to meet trace mineral NRC requirements
Table 2. Initial liver mineral concentrations of CON and MULTIMIN beef heifers
ItemAdequate
Status CON MULTIMIN SEM P- value
n 13 9
Initial Mineral
Cu, ug/g 125– 600 163 129 22 0.26
Mn, ug/g1 >8 9.09 9.35 0.13 0.80
Se, ug/g 1.25– 2.50 1.56 1.52 0.38 0.61
Zn, ug/g 25– 200 114 116 11 0.891 Adequate status range not well established (Hansen et al., 2006).

34 · 2018 Nebraska Beef Cattle Report
was not different (P = 0.32, Table 1) nor was proportion pregnant within the first 33 d (P = 0.57). Bulls remained with heifers at initial ultrasound; therefore, a second pregnancy diagnosis was performed 30 d later. Heifer BW at pregnancy diagnosis was 745 lb. Overall pregnancy rates were also similar (P = 0.38) between treatments. Previous research has indicated Cu and Se in the liver to remain elevated through d 30 post- injection. Therefore, if a difference in pregnancy rates transpired, it would most likely occur within the first 21 d of the breeding season. The data described above, however, coincides with a previous study conducted on black Angus heifers admin-istered an ITM 30 d prior to the breeding season. In this particular study, conception rates and overall pregnancy rates did not differ between ITM and control heifers be-ing fed adequate trace minerals in the diet. In summary, injectable trace mineral at CIDR insertion did not influence reproduc-tive performance in heifers with adequate trace mineral status.
Shelby A. Springman, graduate student
John G. Maddux, Maddux Ranches, Wauneta, NE
Mary E. Drewnoski, assistant professor, University of Nebraska- Lincoln
Rick N. Funston, professor, University of Nebraska- Lincoln West Central Research and Extension Center, North Platte, Neb.
represents binomial distribution. Individual heifer was considered the experimental unit. Treatment and location were consid-ered fixed effects. No interactions between treatment and location were observed. A P- value ≤ 0.05 was considered significant.
Results
The proportion of heifers pregnant within the first 21 d of the breeding season
bull to heifer ratio). Pregnancy diagnosis was determined via transrectal ultrasonog-raphy 61 d post- AI and 30 d following first pregnancy diagnosis.
Pregnancy data were analyzed using the GLIMMIX procedure of SAS, while trace- mineral concentrations were evaluated with the MIXED procedure. Least square means and SE of the proportion of pregnant heifers by treatment were obtained using the ILINK function as pregnancy rate
Figure 1. Experimental timeline for heifers. Heifers were administered an injectable trace mineral (ITM) or received no injection at controlled internal drug- releasing device (CIDR) insertion on d 0. On d 14, CIDR was removed, and prostaglandin F2α (PG) was injected d 30. Gonadotropin- releasing hormone (GnRH) was administered concurrently with fixed- time AI on d 33. Pregnancy (Preg) was determined 61 d post- AI and 30 d following first pregnancy diagnosis.
Table 3. CON and MULTIMIN heifer pregnancy rates
Item CON MULTIMIN SEM P- value
n 400 399
Pregnancy rate, %
First 21 d 63 69 3 0.32
First 33 d 86 77 2 0.57
Overall 95 93 1 0.38
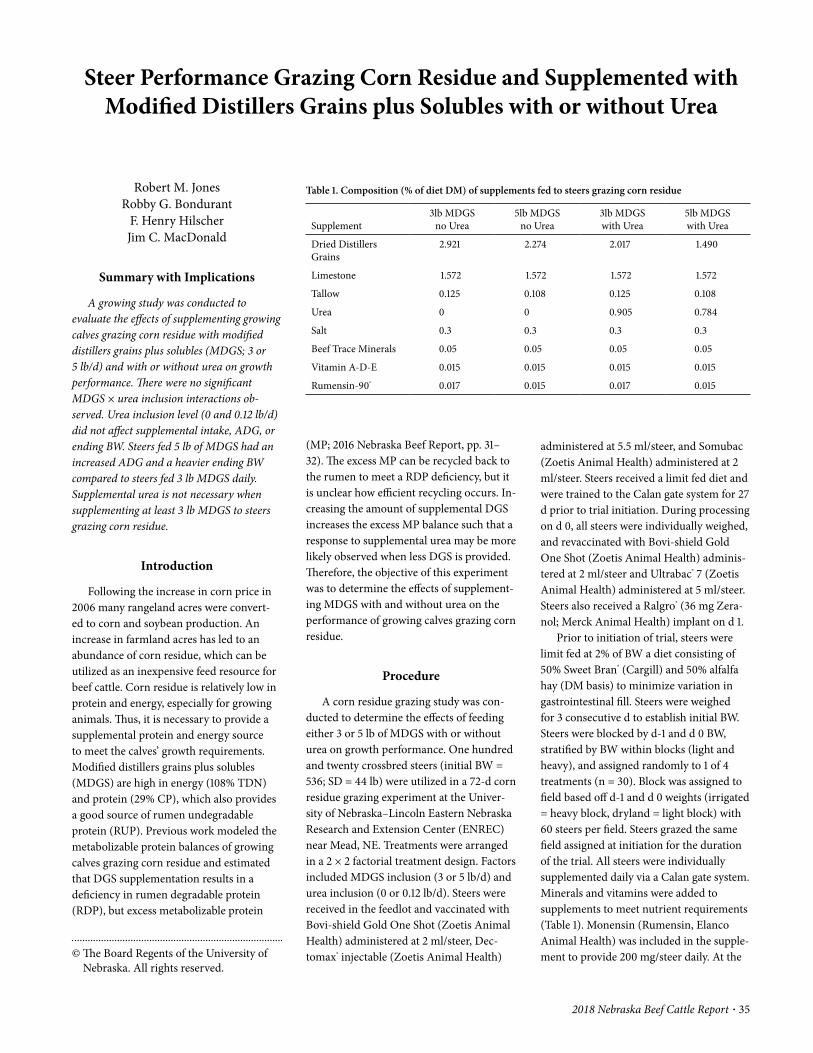
2018 Nebraska Beef Cattle Report · 35
© The Board Regents of the University of Nebraska. All rights reserved.
administered at 5.5 ml/steer, and Somubac (Zoetis Animal Health) administered at 2 ml/steer. Steers received a limit fed diet and were trained to the Calan gate system for 27 d prior to trial initiation. During processing on d 0, all steers were individually weighed, and revaccinated with Bovi- shield Gold One Shot (Zoetis Animal Health) adminis-tered at 2 ml/steer and Ultrabac® 7 (Zoetis Animal Health) administered at 5 ml/steer. Steers also received a Ralgro® (36 mg Zera-nol; Merck Animal Health) implant on d 1.
Prior to initiation of trial, steers were limit fed at 2% of BW a diet consisting of 50% Sweet Bran® (Cargill) and 50% alfalfa hay (DM basis) to minimize variation in gastrointestinal fill. Steers were weighed for 3 consecutive d to establish initial BW. Steers were blocked by d- 1 and d 0 BW, stratified by BW within blocks (light and heavy), and assigned randomly to 1 of 4 treatments (n = 30). Block was assigned to field based off d- 1 and d 0 weights (irrigated = heavy block, dryland = light block) with 60 steers per field. Steers grazed the same field assigned at initiation for the duration of the trial. All steers were individually supplemented daily via a Calan gate system. Minerals and vitamins were added to supplements to meet nutrient requirements (Table 1). Monensin (Rumensin, Elanco Animal Health) was included in the supple-ment to provide 200 mg/steer daily. At the
Steer Performance Grazing Corn Residue and Supplemented with Modified Distillers Grains plus Solubles with or without Urea
Robert M. JonesRobby G. Bondurant
F. Henry HilscherJim C. MacDonald
Summary with Implications
A growing study was conducted to evaluate the effects of supplementing growing calves grazing corn residue with modified distillers grains plus solubles (MDGS; 3 or 5 lb/d) and with or without urea on growth performance. There were no significant MDGS × urea inclusion interactions ob-served. Urea inclusion level (0 and 0.12 lb/d) did not affect supplemental intake, ADG, or ending BW. Steers fed 5 lb of MDGS had an increased ADG and a heavier ending BW compared to steers fed 3 lb MDGS daily. Supplemental urea is not necessary when supplementing at least 3 lb MDGS to steers grazing corn residue.
Introduction
Following the increase in corn price in 2006 many rangeland acres were convert-ed to corn and soybean production. An increase in farmland acres has led to an abundance of corn residue, which can be utilized as an inexpensive feed resource for beef cattle. Corn residue is relatively low in protein and energy, especially for growing animals. Thus, it is necessary to provide a supplemental protein and energy source to meet the calves’ growth requirements. Modified distillers grains plus solubles (MDGS) are high in energy (108% TDN) and protein (29% CP), which also provides a good source of rumen undegradable protein (RUP). Previous work modeled the metabolizable protein balances of growing calves grazing corn residue and estimated that DGS supplementation results in a deficiency in rumen degradable protein (RDP), but excess metabolizable protein
(MP; 2016 Nebraska Beef Report, pp. 31– 32). The excess MP can be recycled back to the rumen to meet a RDP deficiency, but it is unclear how efficient recycling occurs. In-creasing the amount of supplemental DGS increases the excess MP balance such that a response to supplemental urea may be more likely observed when less DGS is provided. Therefore, the objective of this experiment was to determine the effects of supplement-ing MDGS with and without urea on the performance of growing calves grazing corn residue.
Procedure
A corn residue grazing study was con-ducted to determine the effects of feeding either 3 or 5 lb of MDGS with or without urea on growth performance. One hundred and twenty crossbred steers (initial BW = 536; SD = 44 lb) were utilized in a 72- d corn residue grazing experiment at the Univer-sity of Nebraska– Lincoln Eastern Nebraska Research and Extension Center (ENREC) near Mead, NE. Treatments were arranged in a 2 × 2 factorial treatment design. Factors included MDGS inclusion (3 or 5 lb/d) and urea inclusion (0 or 0.12 lb/d). Steers were received in the feedlot and vaccinated with Bovi- shield Gold One Shot (Zoetis Animal Health) administered at 2 ml/steer, Dec-tomax® injectable (Zoetis Animal Health)
Table 1. Composition (% of diet DM) of supplements fed to steers grazing corn residue
Supplement3lb MDGS
no Urea5lb MDGS
no Urea3lb MDGS with Urea
5lb MDGS with Urea
Dried Distillers Grains
2.921 2.274 2.017 1.490
Limestone 1.572 1.572 1.572 1.572
Tallow 0.125 0.108 0.125 0.108
Urea 0 0 0.905 0.784
Salt 0.3 0.3 0.3 0.3
Beef Trace Minerals 0.05 0.05 0.05 0.05
Vitamin A- D- E 0.015 0.015 0.015 0.015
Rumensin- 90® 0.017 0.015 0.017 0.015
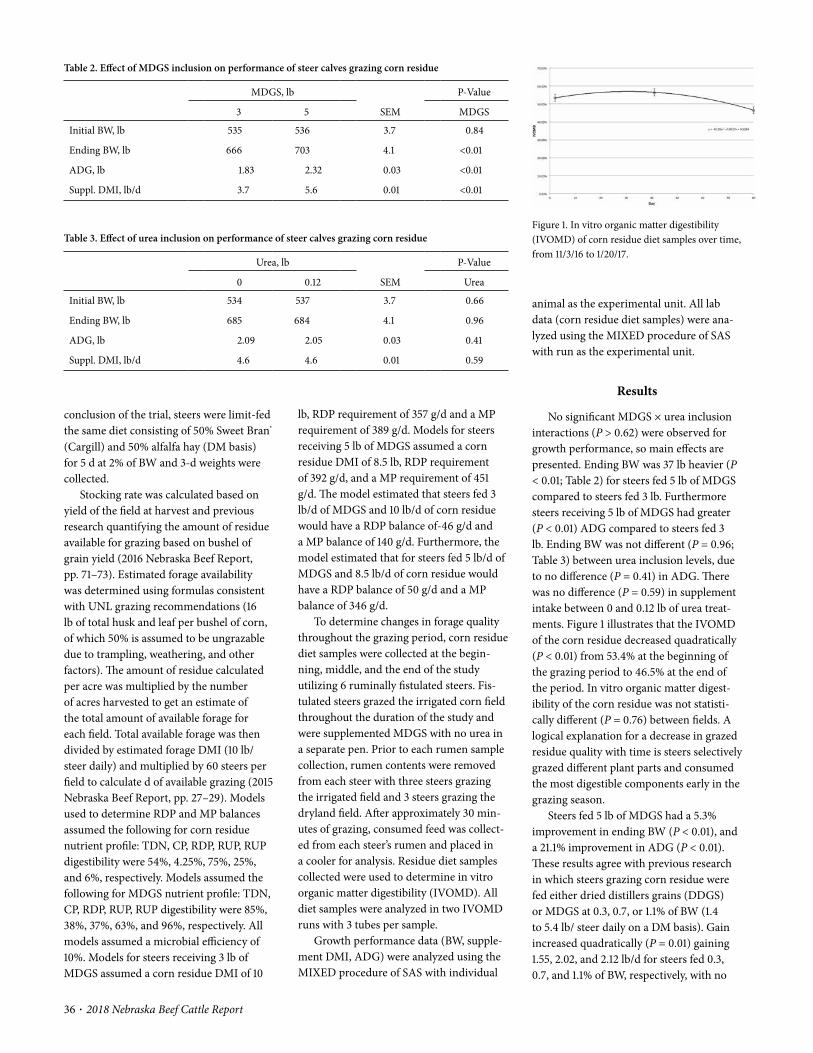
36 · 2018 Nebraska Beef Cattle Report
animal as the experimental unit. All lab data (corn residue diet samples) were ana-lyzed using the MIXED procedure of SAS with run as the experimental unit.
Results
No significant MDGS × urea inclusion interactions (P > 0.62) were observed for growth performance, so main effects are presented. Ending BW was 37 lb heavier (P < 0.01; Table 2) for steers fed 5 lb of MDGS compared to steers fed 3 lb. Furthermore steers receiving 5 lb of MDGS had greater (P < 0.01) ADG compared to steers fed 3 lb. Ending BW was not different (P = 0.96; Table 3) between urea inclusion levels, due to no difference (P = 0.41) in ADG. There was no difference (P = 0.59) in supplement intake between 0 and 0.12 lb of urea treat-ments. Figure 1 illustrates that the IVOMD of the corn residue decreased quadratically (P < 0.01) from 53.4% at the beginning of the grazing period to 46.5% at the end of the period. In vitro organic matter digest-ibility of the corn residue was not statisti-cally different (P = 0.76) between fields. A logical explanation for a decrease in grazed residue quality with time is steers selectively grazed different plant parts and consumed the most digestible components early in the grazing season.
Steers fed 5 lb of MDGS had a 5.3% improvement in ending BW (P < 0.01), and a 21.1% improvement in ADG (P < 0.01). These results agree with previous research in which steers grazing corn residue were fed either dried distillers grains (DDGS) or MDGS at 0.3, 0.7, or 1.1% of BW (1.4 to 5.4 lb/ steer daily on a DM basis). Gain increased quadratically (P = 0.01) gaining 1.55, 2.02, and 2.12 lb/d for steers fed 0.3, 0.7, and 1.1% of BW, respectively, with no
lb, RDP requirement of 357 g/d and a MP requirement of 389 g/d. Models for steers receiving 5 lb of MDGS assumed a corn residue DMI of 8.5 lb, RDP requirement of 392 g/d, and a MP requirement of 451 g/d. The model estimated that steers fed 3 lb/d of MDGS and 10 lb/d of corn residue would have a RDP balance of- 46 g/d and a MP balance of 140 g/d. Furthermore, the model estimated that for steers fed 5 lb/d of MDGS and 8.5 lb/d of corn residue would have a RDP balance of 50 g/d and a MP balance of 346 g/d.
To determine changes in forage quality throughout the grazing period, corn residue diet samples were collected at the begin-ning, middle, and the end of the study utilizing 6 ruminally fistulated steers. Fis-tulated steers grazed the irrigated corn field throughout the duration of the study and were supplemented MDGS with no urea in a separate pen. Prior to each rumen sample collection, rumen contents were removed from each steer with three steers grazing the irrigated field and 3 steers grazing the dryland field. After approximately 30 min-utes of grazing, consumed feed was collect-ed from each steer’s rumen and placed in a cooler for analysis. Residue diet samples collected were used to determine in vitro organic matter digestibility (IVOMD). All diet samples were analyzed in two IVOMD runs with 3 tubes per sample.
Growth performance data (BW, supple-ment DMI, ADG) were analyzed using the MIXED procedure of SAS with individual
conclusion of the trial, steers were limit- fed the same diet consisting of 50% Sweet Bran® (Cargill) and 50% alfalfa hay (DM basis) for 5 d at 2% of BW and 3- d weights were collected.
Stocking rate was calculated based on yield of the field at harvest and previous research quantifying the amount of residue available for grazing based on bushel of grain yield (2016 Nebraska Beef Report, pp. 71– 73). Estimated forage availability was determined using formulas consistent with UNL grazing recommendations (16 lb of total husk and leaf per bushel of corn, of which 50% is assumed to be ungrazable due to trampling, weathering, and other factors). The amount of residue calculated per acre was multiplied by the number of acres harvested to get an estimate of the total amount of available forage for each field. Total available forage was then divided by estimated forage DMI (10 lb/steer daily) and multiplied by 60 steers per field to calculate d of available grazing (2015 Nebraska Beef Report, pp. 27– 29). Models used to determine RDP and MP balances assumed the following for corn residue nutrient profile: TDN, CP, RDP, RUP, RUP digestibility were 54%, 4.25%, 75%, 25%, and 6%, respectively. Models assumed the following for MDGS nutrient profile: TDN, CP, RDP, RUP, RUP digestibility were 85%, 38%, 37%, 63%, and 96%, respectively. All models assumed a microbial efficiency of 10%. Models for steers receiving 3 lb of MDGS assumed a corn residue DMI of 10
Table 2. Effect of MDGS inclusion on performance of steer calves grazing corn residue
MDGS, lb
SEM
P- Value
3 5 MDGS
Initial BW, lb 535 536 3.7 0.84
Ending BW, lb 666 703 4.1 <0.01
ADG, lb 1.83 2.32 0.03 <0.01
Suppl. DMI, lb/d 3.7 5.6 0.01 <0.01
Figure 1. In vitro organic matter digestibility (IVOMD) of corn residue diet samples over time, from 11/3/16 to 1/20/17.
Table 3. Effect of urea inclusion on performance of steer calves grazing corn residue
Urea, lb
SEM
P- Value
0 0.12 Urea
Initial BW, lb 534 537 3.7 0.66
Ending BW, lb 685 684 4.1 0.96
ADG, lb 2.09 2.05 0.03 0.41
Suppl. DMI, lb/d 4.6 4.6 0.01 0.59

2018 Nebraska Beef Cattle Report · 37
of MDGS. Supplementing 5 lb of MDGS increased ADG compared to 3 lb.
Robert M. Jones, graduate student
Robby G. Bondurant, Technical Assistant
F. Henry Hilscher, Feedlot Coordinator
Jim C. MacDonald, professor, Animal Science, Lincoln
clusion did not affect supplemental intake, gain or ending BW, suggesting that the RDP requirements were met in all treatments.
Conclusion
These findings suggest that additional urea is not needed when steers grazing corn residue are supplemented with 3 or 5 lb/d
difference between DDGS and MDGS (2014 Nebraska Beef Report, pp. 48– 49).
NRC models hypothesized that RDP would be deficient in growing steers grazing corn residue fed 3 lb of MDGS. When modeled, steers fed 5 lb of MDGS had a positive RDP balance of 50 g/d and steers supplemented 3 lb of MDGS had a negative RDP balance of- 46 g/d. However, urea in-

38 · 2018 Nebraska Beef Cattle Report
© The Board Regents of the University of Nebraska. All rights reserved.
It has been hypothesized that when cattle graze lush grass some RDP passes through the rumen with the liquid fraction into the small intestine before being degraded. Our objective was to determine if grasses with greater CP content require less RUP supple-mentation due to an increase in undegrad-ed RDP reaching the small intestine and being utilized as RUP.
Results
Looking into the correlation between ADG and amount of RUP supplement rel-ative to type of forage, warm season grasses had the strongest correlation (r2=0.79) and showed an increase of 0.43 lb in ADG for each 1 lb increase in RUP supplementation. Cattle grazing brome grass showed a similar trend (P = 0.93) with 0.63 lb ADG increase with each additional lb of RUP supplemen-tation, however, the correlation was slightly lower (r2=0.65). Summer annuals had no correlation (r2=0.00) and did not show a re-sponse to the RUP supplement (slope of the line was not different from 0; P = 0.84). The differences observed due to type of forage may be due to forage quality, specifically CP content.
The idea to evaluate the relationship be-tween CP of the forage and ADG related to increasing RUP supplement stemmed from the trends observed in the types of grass. The average CP for brome grass was 16.0%, the average CP for warm season grass was 10.4%, and the average CP for summer an-nuals was 18.2%. Based on CP content and the results observed from the forage type groupings the advantage of RUP supple-mentation has a break point in forages that contain between 16.0% and 18.2% CP.
Responses shown here could be due to high intakes and rapid passage of forage through the rumen. This allows undegraded RDP to pass from the rumen in the liquid contents and enter the omasum and even-tually the small intestine. The undegraded
Procedure
Data were collected from 10 previous studies that were published in the Nebraska Beef Cattle Reports ranging from 1987– 1991. These 10 studies included 458 steers and 210 heifers grazing a variety of grasses. Crude protein of the forages varied from 10.4– 21.7% and was measured in diet samples collected over the grazing period from cannulated steers. This method of forage analysis helps mitigate the risk of using an incorrect figure due to selective grazing. Two studies with bromegrass pastures did not measure CP content using diet samples. The RUP supplement came from a variety of sources (blood meal, corn gluten meal, Soy-Pass, feather meal) and ranged from 0– 0.562 lb RUP per head daily. All studies included a control that provided an energy supplement with no RUP. Also each supplemental RUP treatment was formulated to have equiva-lent energy as the control to ensure that any response in ADG was due to RUP and not energy. In order to compare the response across trials, ADG was regressed above the ADG of the control treatment. This allowed the trials to be compared based on the addi-tional ADG the cattle gained from the RUP supplementation.
Studies were divided into three types of forage being grazed. Within this analy-sis five studies evaluated cattle grazing brome grass, three studies evaluated cattle grazing warm season grass, and two studies evaluated cattle grazing summer annuals. The goal was to determine if type of forage affected ADG response to increasing RUP supplementation. Another goal was to de-termine if CP content of the grass affected the response to RUP supplementation. The hypothesis was that grass with lower CP would have a greater response to RUP supplementation. Considerable research has been conducted to determine the RUP content of common forages grazed in Ne-braska. However, those procedures assume that soluble protein in the forage is rapidly and completely degraded in the rumen.
Braden C. TroyerBrad M. Boyd
Andrea K. WatsonTerry J. Klopfenstein
Summary with Implications
A pooled- analysis of previous Nebraska Beef Report Articles examined the impact of rumen undegradable protein (RUP) supple-mentation for cattle grazing different types of forage. Each lb of RUP supplement increased ADG by 0.63 lb/d when cattle were grazing smooth brome and 0.43 lb/d when grazing warm season grasses. Cattle did not respond to RUP when grazing summer annuals which were high (18.2%) in CP.
Introduction
Forages have been widely used to back-ground cattle before entering the feedlot. The energy content of the grass determines the potential cattle gains but protein content of the grass may also limit perfor-mance. Although grass can be relatively high in protein, the protein is almost all rumen undegradable protein (RDP) which means that it provides very little rumen degradable protein (RUP). The low level of RUP supplied from grass leads to less metabolizable protein (MP) for the animal to use and MP requirements are high for growing cattle.
There is a cost to supplementation of RUP and understanding how to maximize gains with minimal RUP supplementation on different types of forage is important. There can be confusion on how much supplement is needed across the growing season because CP content of the forage changes as the forage matures and cattle are selective grazers which can influence the total amount of CP consumed. This pooled analysis was done to determine the gain re-sponse to RUP supplementation while cattle are grazing a variety of different grasses.
Supplementing Rumen Undegradable Protein to Grazing Cattle
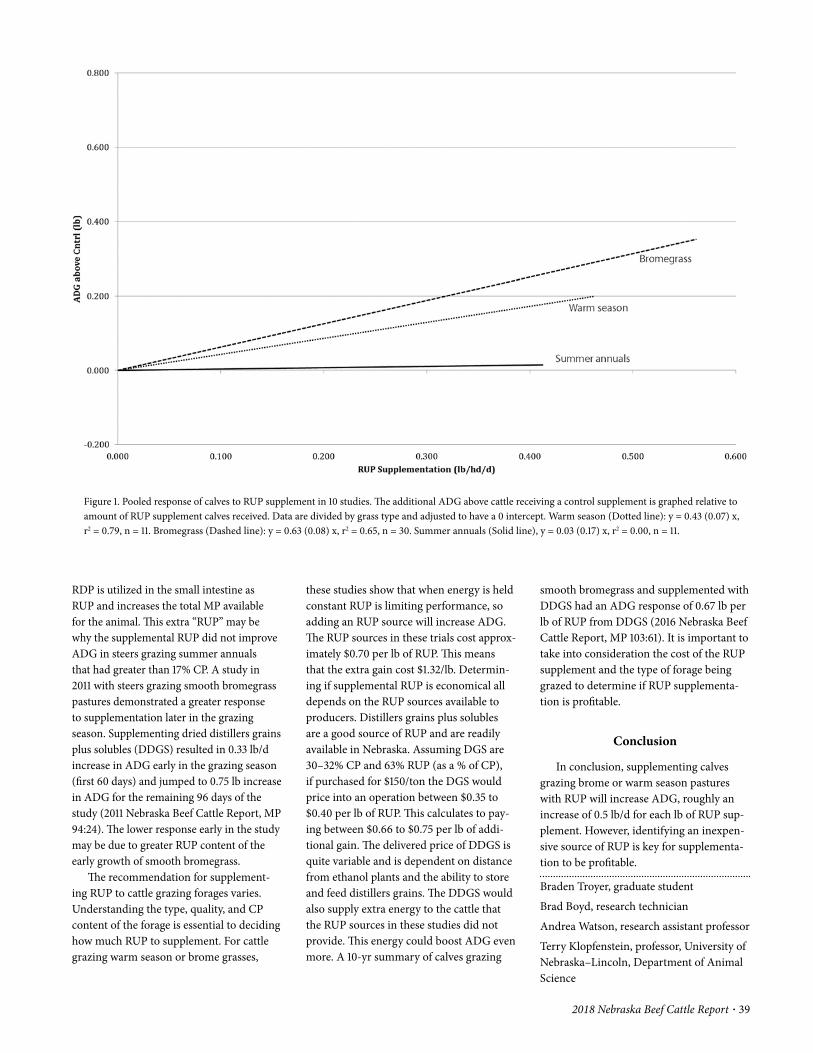
2018 Nebraska Beef Cattle Report · 39
smooth bromegrass and supplemented with DDGS had an ADG response of 0.67 lb per lb of RUP from DDGS (2016 Nebraska Beef Cattle Report, MP 103:61). It is important to take into consideration the cost of the RUP supplement and the type of forage being grazed to determine if RUP supplementa-tion is profitable.
Conclusion
In conclusion, supplementing calves grazing brome or warm season pastures with RUP will increase ADG, roughly an increase of 0.5 lb/d for each lb of RUP sup-plement. However, identifying an inexpen-sive source of RUP is key for supplementa-tion to be profitable.
Braden Troyer, graduate student
Brad Boyd, research technician
Andrea Watson, research assistant professor
Terry Klopfenstein, professor, University of Nebraska– Lincoln, Department of Animal Science
these studies show that when energy is held constant RUP is limiting performance, so adding an RUP source will increase ADG. The RUP sources in these trials cost approx-imately $0.70 per lb of RUP. This means that the extra gain cost $1.32/lb. Determin-ing if supplemental RUP is economical all depends on the RUP sources available to producers. Distillers grains plus solubles are a good source of RUP and are readily available in Nebraska. Assuming DGS are 30– 32% CP and 63% RUP (as a % of CP), if purchased for $150/ton the DGS would price into an operation between $0.35 to $0.40 per lb of RUP. This calculates to pay-ing between $0.66 to $0.75 per lb of addi-tional gain. The delivered price of DDGS is quite variable and is dependent on distance from ethanol plants and the ability to store and feed distillers grains. The DDGS would also supply extra energy to the cattle that the RUP sources in these studies did not provide. This energy could boost ADG even more. A 10- yr summary of calves grazing
RDP is utilized in the small intestine as RUP and increases the total MP available for the animal. This extra “RUP” may be why the supplemental RUP did not improve ADG in steers grazing summer annuals that had greater than 17% CP. A study in 2011 with steers grazing smooth bromegrass pastures demonstrated a greater response to supplementation later in the grazing season. Supplementing dried distillers grains plus solubles (DDGS) resulted in 0.33 lb/d increase in ADG early in the grazing season (first 60 days) and jumped to 0.75 lb increase in ADG for the remaining 96 days of the study (2011 Nebraska Beef Cattle Report, MP 94:24). The lower response early in the study may be due to greater RUP content of the early growth of smooth bromegrass.
The recommendation for supplement-ing RUP to cattle grazing forages varies. Understanding the type, quality, and CP content of the forage is essential to deciding how much RUP to supplement. For cattle grazing warm season or brome grasses,
Figure 1. Pooled response of calves to RUP supplement in 10 studies. The additional ADG above cattle receiving a control supplement is graphed relative to amount of RUP supplement calves received. Data are divided by grass type and adjusted to have a 0 intercept. Warm season (Dotted line): y = 0.43 (0.07) x, r2 = 0.79, n = 11. Bromegrass (Dashed line): y = 0.63 (0.08) x, r2 = 0.65, n = 30. Summer annuals (Solid line), y = 0.03 (0.17) x, r2 = 0.00, n = 11.
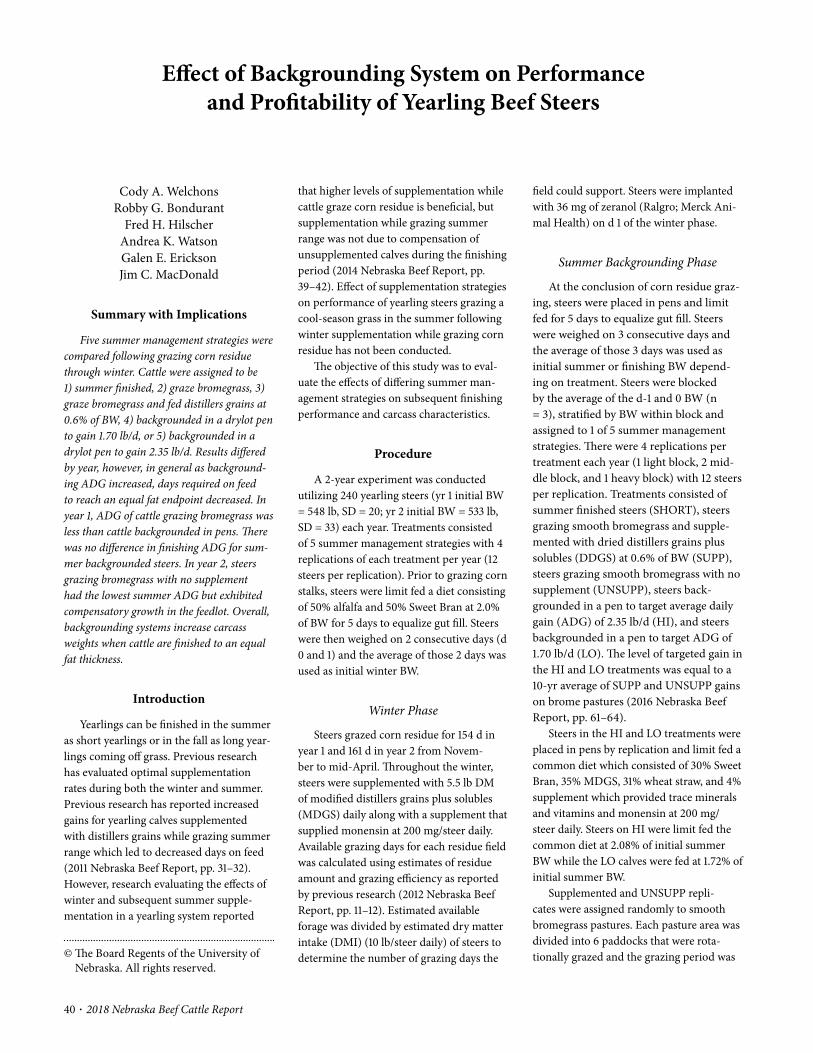
40 · 2018 Nebraska Beef Cattle Report
© The Board Regents of the University of Nebraska. All rights reserved.
field could support. Steers were implanted with 36 mg of zeranol (Ralgro; Merck Ani-mal Health) on d 1 of the winter phase.
Summer Backgrounding Phase
At the conclusion of corn residue graz-ing, steers were placed in pens and limit fed for 5 days to equalize gut fill. Steers were weighed on 3 consecutive days and the average of those 3 days was used as initial summer or finishing BW depend-ing on treatment. Steers were blocked by the average of the d- 1 and 0 BW (n = 3), stratified by BW within block and assigned to 1 of 5 summer management strategies. There were 4 replications per treatment each year (1 light block, 2 mid-dle block, and 1 heavy block) with 12 steers per replication. Treatments consisted of summer finished steers (SHORT), steers grazing smooth bromegrass and supple-mented with dried distillers grains plus solubles (DDGS) at 0.6% of BW (SUPP), steers grazing smooth bromegrass with no supplement (UNSUPP), steers back-grounded in a pen to target average daily gain (ADG) of 2.35 lb/d (HI), and steers backgrounded in a pen to target ADG of 1.70 lb/d (LO). The level of targeted gain in the HI and LO treatments was equal to a 10- yr average of SUPP and UNSUPP gains on brome pastures (2016 Nebraska Beef Report, pp. 61– 64).
Steers in the HI and LO treatments were placed in pens by replication and limit fed a common diet which consisted of 30% Sweet Bran, 35% MDGS, 31% wheat straw, and 4% supplement which provided trace minerals and vitamins and monensin at 200 mg/steer daily. Steers on HI were limit fed the common diet at 2.08% of initial summer BW while the LO calves were fed at 1.72% of initial summer BW.
Supplemented and UNSUPP repli-cates were assigned randomly to smooth bromegrass pastures. Each pasture area was divided into 6 paddocks that were rota-tionally grazed and the grazing period was
Effect of Backgrounding System on Performance and Profitability of Yearling Beef Steers
Cody A. WelchonsRobby G. Bondurant
Fred H. HilscherAndrea K. WatsonGalen E. EricksonJim C. MacDonald
Summary with Implications
Five summer management strategies were compared following grazing corn residue through winter. Cattle were assigned to be 1) summer finished, 2) graze bromegrass, 3) graze bromegrass and fed distillers grains at 0.6% of BW, 4) backgrounded in a drylot pen to gain 1.70 lb/d, or 5) backgrounded in a drylot pen to gain 2.35 lb/d. Results differed by year, however, in general as background-ing ADG increased, days required on feed to reach an equal fat endpoint decreased. In year 1, ADG of cattle grazing bromegrass was less than cattle backgrounded in pens. There was no difference in finishing ADG for sum-mer backgrounded steers. In year 2, steers grazing bromegrass with no supplement had the lowest summer ADG but exhibited compensatory growth in the feedlot. Overall, backgrounding systems increase carcass weights when cattle are finished to an equal fat thickness.
Introduction
Yearlings can be finished in the summer as short yearlings or in the fall as long year-lings coming off grass. Previous research has evaluated optimal supplementation rates during both the winter and summer. Previous research has reported increased gains for yearling calves supplemented with distillers grains while grazing summer range which led to decreased days on feed (2011 Nebraska Beef Report, pp. 31– 32). However, research evaluating the effects of winter and subsequent summer supple-mentation in a yearling system reported
that higher levels of supplementation while cattle graze corn residue is beneficial, but supplementation while grazing summer range was not due to compensation of unsupplemented calves during the finishing period (2014 Nebraska Beef Report, pp. 39– 42). Effect of supplementation strategies on performance of yearling steers grazing a cool- season grass in the summer following winter supplementation while grazing corn residue has not been conducted.
The objective of this study was to eval-uate the effects of differing summer man-agement strategies on subsequent finishing performance and carcass characteristics.
Procedure
A 2- year experiment was conducted utilizing 240 yearling steers (yr 1 initial BW = 548 lb, SD = 20; yr 2 initial BW = 533 lb, SD = 33) each year. Treatments consisted of 5 summer management strategies with 4 replications of each treatment per year (12 steers per replication). Prior to grazing corn stalks, steers were limit fed a diet consisting of 50% alfalfa and 50% Sweet Bran at 2.0% of BW for 5 days to equalize gut fill. Steers were then weighed on 2 consecutive days (d 0 and 1) and the average of those 2 days was used as initial winter BW.
Winter Phase
Steers grazed corn residue for 154 d in year 1 and 161 d in year 2 from Novem-ber to mid- April. Throughout the winter, steers were supplemented with 5.5 lb DM of modified distillers grains plus solubles (MDGS) daily along with a supplement that supplied monensin at 200 mg/steer daily. Available grazing days for each residue field was calculated using estimates of residue amount and grazing efficiency as reported by previous research (2012 Nebraska Beef Report, pp. 11– 12). Estimated available forage was divided by estimated dry matter intake (DMI) (10 lb/steer daily) of steers to determine the number of grazing days the

2018 Nebraska Beef Cattle Report · 41
ment strategy, year, block within year, and summer management × year interaction were included in the model as fixed effects. Replicate within year was the experimental unit. Differences were considered signifi-cant at P < 0.05. Tendencies are discussed at P < 0.10. There were significant treatment × year interactions for most performance and economic measures, therefore results are presented by treatment within year.
Results
Winter Phase
Initial winter BW was similar across all treatments (P = 0.78; Table 3), however, steers were heavier in year 1 (555 lb) than in year 2 (533 lb; P < 0.01). Likewise, by design, ADG of steers when supplemented with 5.5 lb/steer daily of MDGS while grazing corn residue did not differ across treatments (P = 0.95) but was greater in year 1 than in year 2 (1.85 vs. 1.76 lb/d; P < 0.01).
Summer Backgrounding Phase
By design there was no difference in initial BW for the summer backgrounding
ment. Carcass ultrasound was used in order to harvest all cattle at an equal fat endpoint target of 0.55 in of 12th rib fat.
Upon removal from bromegrass in September, SUPP and UNSUPP cattle were placed into pens and limit fed for 5 days to equalize gut fill. All steers were weighed on 3 consecutive days and the average of those 3 days was used as initial finishing BW. Steers on the HI and LO treatments remained in their respective pens and were switched to the limit fed diet the same day the SUPP and UNSUPP steers began limit feeding. Steers were adapted to the same finishing diet fed to SHORT steers. Summer backgrounded treatments were implanted with Component TE- S approximately 90 days from slaughter. On day of harvest HCW was recorded. Final BW was then calculated as HCW divided by a common dressing percent of 63%. Following a 48- hr chill, 12th rib fat, LM area, and marbling score were recorded.
Statistical Analyses
All performance data were analyzed us-ing the GLIMMIX procedure of SAS (SAS Institute Inc., Cary, NC). Summer manage-
divided into 5 cycles with BW measured at the beginning of each cycle.
Pastures were stocked at a rate of 4.0 an-imal unit months (AUM)/ac for SUPP cattle and 2.8 AUM/ha for the UNSUPP cattle. Amount of DDGS delivered to SUPP cattle was 0.6% of BW and updated using interim weights, shrunk 4%.
In both years, SUPP, UNSUPP, HI, and LO calves were implanted with Ralgro (Merck Animal Health) on d 1 of the summer phase and with 200 mg progester-one and 20 mg estradiol (Component E- S, Elanco Animal Health) on d 60 (SUPP and UNSUPP) or d 61 (HI and LO).
Finishing Phase
Summer finished steers (April– September) were fed a finishing ration for 146 d in year 1 and 133 d in year 2 and implanted with Component E- S on d 1 and with 120 mg trenbolone acetate and 24 mg estradiol (Component TE- S, Elanco Animal Health) on d 60 of the finishing phase each year. Summer finished steers were adapted to a finishing diet which consisted of 51% high- moisture corn, 30% Sweet Bran, 10% MDGS, 5% wheat straw, and 4% supple-
Table 1. Effect of growing system on summer performance
Item,
Treatments1
SEM
P- Value
SHORT HI LO SUPP UNSUPP Trt Year Int2
Winter, year 13
Initial BW, lb 547 549 547 551 549 3.67 0.78 < 0.01 0.74
ADG, lb 1.86 1.86 1.87 1.85 1.86 0.03 0.95 < 0.01 0.84
Winter, year 23
Initial BW, lb 535 535 529 530 534 3.67 0.78 < 0.01 0.74
ADG, lb 1.73 1.74 1.76 1.79 1.73 0.03 0.95 < 0.01 0.84
Summer, year 14
Initial BW, lb - 844 843 843 842 3.10 0.71 < 0.01 0.71
ADG, lb - 2.27a 1.79b 1.61c 1.00d 0.050 < 0.01 0.73 < 0.01
F:G - 7.75 7.99 - - - 0.18 0.03 0.87
Summer, year 24
Initial BW, lb - 820 812 822 818 3.10 0.71 < 0.01 0.71
ADG, lb - 2.07a 1.66b 1.98a 1.04c 0.050 < 0.01 0.73 < 0.01
F:G - 8.21 8.49 - - - 0.18 0.03 0.87abcd Means within a row without common superscript are significantly different (P < 0.05).1 Treatments = short yearlings (SHORT), high level of backgrounding gain in pen (HI), low level of backgrounding gain in pen (LO), supplemented with DDGS at 0.6% of BW while grazing smooth
bromegrass (SUPP), grazed smooth bromegrasss with no supplement (UNSUPP).2 Treatment x year interaction.3 Winter = corn stalk residue grazing for 154 days in year 1 and 161 days in year 2.4 Summer = Respective treatment for 156 days in year 1 and 161 days in year 2.

42 · 2018 Nebraska Beef Cattle Report
SUPP treatments did not differ (P = 0.32) but were greater than LO (1089 lb) and UNSUPP (995 lb; P < 0.01). As observed in year 1, due to being placed on the finishing ration in April, the SHORT treatment had the lowest initial feedlot BW (819 lb). There was no treatment × year interaction for DMI (P = 0.84); however, there was a main effect of treatment (P < 0.01). In both years the four summer backgrounding treatments had greater DMI than the SHORT treat-ment (P < 0.01) but did not differ from one another (P > 0.14).
There was a treatment × year interaction for feedlot ADG and F:G (P < 0.01). In year 1 there was no difference in ADG between the HI (3.78 lb/d), LO (3.75 lb/d), SUPP (3.68/d), and UNSUPP (3.87/d; P > 0.23) which were all less than the SHORT treat-ment (4.43 lb/d; P < 0.01). Similarly, in year 1 the SHORT treatment had the lowest F:G during finishing (P < 0.01), while the other
and UNSUPP were managed to have simi-lar ADG. In year 1, the HI and LO treat-ments had gains close to predicted levels, however, ADG of the SUPP and UNSUPP were below predictions from previous years.
Finishing Phase
There was a treatment × year interaction for initial feedlot BW (P < 0.01; Table 4) due to differing ADG during the summer backgrounding phase. In year 1, HI cattle had the greatest initial feedlot body weight (1204 lb; P < 0.01) followed by LO (1129 lb), SUPP (1101 lb), and UNSUPP (1005 lb). The SHORT treatment had the lowest initial feedlot body weight (842 lb), due to the treatment being finished during the summer rather than backgrounded further prior to finishing. In year 2, with similar ADG observed in the summer background-ing phase, initial feedlot BW for the HI and
phase for the HI, LO, SUPP, and UNSUPP treatments (P = 0.71; Table 3), however, steers were lighter in year 2 than in year 1. There was a treatment × year interaction for ADG during the summer background-ing phase (P < 0.01). In year 1, all four treatments had differing rates of gain with HI being the greatest (2.27 lb/d) followed by LO (1.79 lb/d), SUPP (1.61 lb/d), and UNSUPP (1.00 lb/d). In year 2, however, the HI and SUPP treatments had similar rates of ADG (2.07 and 1.98 lb/d, respectively), followed by the LO treatment (1.66 lb/d) and the UNSUPP treatment was lowest (1.04 lb/d). For the HI and LO treatments, feed to gain conversion (F:G) did not differ (P = 0.18), but was lower in year 1 (7.87 lb/lb) than in year 2 (8.35 lb/lb; P = 0.03). At the end of the summer, SUPP cattle were 97 lb heavier than UNSUPP cattle in year 1 and 156 lb heavier in year 2.
By design, the HI and SUPP, and the LO
Table 2. Effect of growing system on finishing performance
Item,
Treatments1
SEM
P- Value
SHORT HI LO SUPP UNSUPP Trt Year Int2
Year 1
Initial BW, lb 842e 1204a 1129b 1101c 1005d 7.94 < 0.01 0.11 < 0.01
Initial 12th Rib fat, in
0.108c 0.208a 0.118bc 0.186a 0.141b 0.007 < 0.01 0.21 < 0.01
Final BW, lb3 1489b 1571a 1571a 1535ab 1462b 27.3 < 0.01 0.37 < 0.01
DMI, lb/d 27.6b 30.6a 30.8a 31.3a 31.7a 0.35 < 0.01 < 0.01 0.84
ADG, lb 4.43a 3.78b 3.75b 3.68b 3.87b 0.11 0.06 0.97 < 0.01
F:G 6.25a 8.06b 8.26b 8.47b 8.20b - < 0.01 < 0.01 < 0.01
DOF4 146 97 118 118 118 - - -
System ADG, lb5 3.06a 2.43b 2.32bc 2.23c 2.07d 0.04 < 0.01 0.12 < 0.01
Year 2
Initial BW, lb 819d 1162a 1089b 1151a 995c 7.94 < 0.01 0.11 < 0.01
Initial 12th Rib fat, in
0.077c 0.207a 0.117b 0.209a 0.112b 0.007 < 0.01 0.21 < 0.01
Final BW, lb3 1324c 1537b 1654a 1514b 1517b 27.3 < 0.01 0.37 < 0.01
DMI, lb/d 25.0b 28.0a 27.4a 27.9a 28.4a 0.35 < 0.01 < 0.01 0.84
ADG, lb 3.79b 3.89b 3.97b 3.82b 4.35a 0.11 0.06 0.97 < 0.01
F:G 6.58a 7.19b 6.90ab 7.04ab 6.54a - < 0.01 < 0.01 < 0.01
DOF4 133 96 142 96 121 - - -
System ADG, lb5 2.55a 2.31b 2.44a 2.29b 2.16c 0.04 < 0.01 0.12 < 0.01abcd Means within a row without common superscript are significantly different (P < 0.05).1 Treatments = short yearlings (SHORT), high level of backgrounding gain in pen (HI), low level of backgrounding gain in pen (LO), supplemented with DDGS at 0.6% of BW while grazing smooth
bromegrass (SUPP), grazed smooth bromegrasss with no supplement (UNSUPP).2 Treatment x year interaction.3 Final BW = HCW ÷ 0.63.4 Treatments were fed to same target 12th rib fat thickness.5 Total BW gain ÷ total days in system.
2018 Nebraska Beef Cattle Report · 43
treatment was not different from the SUPP treatment (P = 0.23) while the UNSUPP treatment tended to be lighter (P = 0.06). In year 2 the LO treatment had the greatest HCW (P < 0.01) followed by the HI, SUPP, and UNSUPP treatments which were all greater than the SHORT treatment (P < 0.01).
In year 1 of the current study, HCW of the SHORT treatment did not differ from every one of the summer backgrounded treatments, however, those cattle were fatter. In year 2, when cattle were fed to more similar fat endpoint, HCW of the SHORT cattle was lowest. Within the summer backgrounded treatments, when fed to equal endpoints, HCW was similar with the exception being the LO treatment in year 2. Increased HCW was a result of increased days on feed (DOF) needed to reach the target fat endpoint. The increased days required to reach a similar 12th rib fat as other treatments combined with the increase in marbling score relative to other treatments may suggest that the LO cattle deposited more fat intramuscularly than subcutaneously
There was a treatment × year interaction
clear why the UNSUPP treatment exhibited compensatory growth during the finishing phase in year 2 but not year 1.
There was a treatment × year interaction for total system ADG (P < 0.01). In year 1 the SHORT treatment had the greatest sys-tem ADG followed by the HI and LO. The SUPP treatment was then lower than the HI (P < 0.01) but not different from the LO (P = 17). The UNSUPP treatment had the lowest system ADG. In year 2, the SHORT and LO treatments had the highest system ADG followed by the HI and SUPP treat-ments (P < 0.05). Once again, the UNSUPP treatment had the lowest system ADG. Differences in system ADG for treatments relative to one another is attributed to differences in the summer backgrounding and/or finishing phases between years.
Carcass Characteristics
There was a treatment × year inter-action for HCW (P < 0.01). In year 1 the HI, LO, and SUPP treatments had the heaviest HCW followed by the UNSUPP and SHORT treatments which were lighter than the HI and LO (P < 0.05). The SHORT
treatments did not differ from one another (P > 0.36). In year 2 however, the UNSUPP treatment had the greatest ADG (4.35 lb/d; P < 0.01) with no difference between the other treatments (P > 0.26). Feed conver-sion was similar for the SHORT, UNSUPP, LO, and SUPP treatments (P > 0.12). Feed conversion for the HI treatment was greater than the SHORT and UNSUPP (P < 0.04) treatment but did not differ from the LO and SUPP treatments (P > 0.36).
In year 1 there was no compensato-ry growth as evidenced by similar ADG among summer backgrounded treatments regardless of restriction and/or degree of restriction. Of note, however, the relative difference in finishing ADG between the SUPP and UNSUPP treatments was 0.19 lb/d which lead to a 25% compensation for the UNSUPP compared to the SUPP treat-ment. Additionally, we hypothesized that the LO treatment would also have increased ADG during the finishing period relative to the HI treatment, but this was not observed.
In year 2, compensatory gain was observed for the UNSUPP treatment. The UNSUPP treatment compensated 103% compared to the SUPP treatment. It is un-
Table 3. Effect of growing system on carcass characteristics
Item,
Treatments1
SEM
P- Value
SHORT HI LO SUPP UNSUPP Trt Year Int2
Year 1
HCW, lb 938b 990a 990a 967ab 921b 17.2 < 0.01 0.31 < 0.01
LM area, in2 13.8a 13.6ab 13.3ab 13.5ab 13.1b 0.18 0.19 0.08 < 0.01
12th Rib fat, in 0.63x 0.55xy 0.54xy 0.58xy 0.52y 0.02 0.02 0.12 0.18
Marbling Score3 481z 484yz 514x 491yz 492xy 10.8 < 0.01 0.94 0.23
Calculated YG4 3.74y 3.80y 3.86x 3.84xy 3.60y 0.07 < 0.05 0.60 0.24
EBF, %5 31.9 31.5 31.8 31.9 30.8 0.42 0.12 0.31 0.08
Year 2
HCW, lb 834c 962b 1042a 954b 956b 17.2 < 0.01 0.31 < 0.01
LM area, in2 12.6c 13.7a 13.6ab 13.2ab 13.1b 0.18 0.19 0.08 < 0.01
12th Rib fat, in 0.56x 0.54xy 0.56xy 0.52xy 0.51y 0.02 0.02 0.12 0.18
Marbling Score3 442z 488yz 538x 483yz 511xy 10.8 < 0.01 0.94 0.23
Calculated YG4 3.6y 3.6y 4.0x 3.7xy 3.7y 0.07 < 0.05 0.60 0.24
EBF, %5 30.4b 31.2b 32.6a 31.0b 31.3b 0.42 0.12 0.31 0.08abcd Means within a row without common superscript are significantly different for treatment × year interaction (P < 0.05).xyz Means within a row without common superscript are significantly different for main effect of treatment (P < 0.05).1 Treatments = short yearlings (SHORT), high level of backgrounding gain in pen (HI), low level of backgrounding gain in pen (LO), supplemented with DDGS at 0.6% of BW while grazing smooth
bromegrass (SUPP), grazed smooth bromegrasss with no supplement (UNSUPP).2 Treatment x year interaction.3 Marbling Score: 400 = Small00, 500 = Modest00.4 Calculated as 2.5 + (2.5 x 12th rib fat) + (0.2 x 2.5 (KPH)) + (0.0038 x HCW)– (0.32 x LM area).5 Calculated as 17.76207 + (4.68142 x 12th rib fat) + (0.01945 x HCW) + (0.81855 x QG)– (0.06754 x LM area).

44 · 2018 Nebraska Beef Cattle Report
grazing bromegrass had greater ADG than unsupplemented steers during the summer. Differences in compensatory growth of the unsupplemented steers between years is supported by variability in previous research evaluating compensatory growth. Growing systems targeting compensato-ry growth then, may not yield consistent results across years.
Cody A. Welchons, graduate student
Robert G. Bondurant, research technician
Fred H. Hilscher, research technician
Andrea K. Watson, assistant professor
Galen E. Erickson, professor
Jim C. MacDonald, associate professor, University of Nebraska- Lincoln Department of Animal Science, Lincoln, Neb.
2, occurrence rate was 31.9, 66.7, 27.3, and 22.7% for the same treatments.
Conclusions
Steers backgrounded through the sum-mer and finished in the fall had increased HCW and typically required fewer days in the feedlot to reach a similar fat endpoint as summer finished steers. Backgrounding yearlings in drylot pens during the summer resulted in more consistent performance across the 2 years than grazing steers on grass. When fed at either a high or low rate of gain in the drylot pens, steers had similar ADG and F:G when finished, although steers backgrounded at a higher rate of gain required fewer DOF. Steers supple-mented with DDGS at 0.6% of BW while
(P < 0.01) for LM area and a main effect of treatment on marbling score (P < 0.01) and calculated YG (P < 0.05). The LO treatment had the highest YG which tended to be greater than the SUPP treatment (P = 0.08) and was greater than the YG of the SHORT, HI, and UNSUPP (P < 0.04) treatments which were all similar to the SUPP (P > 0.27). Increased occurrence of yield grade 4 and above was above 20% for all treatments in both years except for the SHORT treat-ment in year 2. Additionally, occurrence of overweight carcasses (> 1000 lb) was 8.3% and 0% for the SHORT treatment in years 1 and 2, respectively. For the summer back-grounded treatments in year 1, overweight carcasses occurred at a rate of 41.7, 50.0, 27.1, and 6.3% for the HI, LO, SUPP, and UNSUPP treatments, respectively. In year
2018 Nebraska Beef Cattle Report · 45
© The Board Regents of the University of Nebraska. All rights reserved.
29.7% DM, 30.2% CP, 5.4% fat, and 1.4% S. The nutrient profile of WDGS utilized in the study (Abengoa Ethanol, York, NE) contained 30.6% DM, 37.9% CP, 14.4% fat, and 0.8% S. All diets included 50% brome hay, 3% SoyPass® (LignoTech USA), 2% corn gluten meal (CGM), and 5% dry sup-plement. SoyPass® and CGM were blended due to their complementarity in amino acid profiles to ensure rumen undegradable protein was sufficient to meet metabolizable protein (MP) requirement. Supplements were formulated to provide 200 mg/hd Ru-mensin® (Elanco Animal Health). Urea was added at 0.65% diet DM for the control diet and 0.33% diet DM for both 10% inclusion of CDS and WDGS in order to meet rumen degradable protein requirement.
Data were analyzed using the MIXED procedure of SAS as a randomized com-plete block design. Steer was the experi-mental unit and BW block was analyzed as a fixed effect. Similar to previous research (2014 Nebraska Beef Report pp. 64– 66) net energy equations from the NRC (1996) were used to predict energy concentrations of the corn control diet based on observed performance parameters and then replaced using observed performance parameters for each CDS and WDGS diet to determine
as well as wet distillers grains plus solubles being fed in forage- based diets and their effects on growing steer performance.
Procedure
A 96- d growing study utilizing 120 crossbred steers (BW = 807 lb; SD = 66 lb) was conducted at the Eastern Nebraska Research and Extension Center feedlot, Mead, NE. Steers were limit fed a common diet at 2.0% BW for 5 days and weighed for three consecutive days to account for gut fill at the beginning and end of the trial. Steers were individually fed utilizing Calan gates, blocked by BW, and assigned randomly to treatment. Nine treatments were utilized with 13 steers/treatment, except for the basal control diet, which included 16 steers. Steers were implanted with Ralgro® (Merck Animal Health) on day 1.
Treatments consisted of increasing inclusion of CDS (10, 20, 30, and 40% DM) or WDGS (10, 20, 30, and 40% DM) plus a corn control diet with no by- product (Table 1). By- products (WDGS or CDS) replaced corn in the diets. The nutrient profile of CDS utilized in the study (Aurora Pacific Ethanol, Aurora, NE and Green Plains Ethanol, Wood River, NE) contained
Evaluation of Corn Distillers Solubles on Growing Steer Performance
Benjamin H. HansenRobert G. Bondurant
F. Henry HilscherGalen E. EricksonJim C. MacDonald
Summary with Implications
A growing study evaluated increasing inclusions of corn distillers solubles (CDS) at 10, 20, 30, and 40%, or increasing wet distillers grains plus solubles (WDGS) at 10, 20, 30, and 40% compared to a corn control. Corn was replaced by CDS or WDGS in each forage- based diet. Increasing CDS resulted in a quadratic increase for both DMI and F:G. Increasing WDGS linearly increased both DMI and ADG with no effect on F:G. The energy value of CDS is less than that of corn, whereas WDGS had an energy value similar to corn in growing diets with 50% brome hay. A 73.7% TDN value was determined for CDS at 40% inclusion in forage- based diets.
Introduction
Forage- based diets containing corn dis-tillers solubles (CDS) have similar F:G with 93% the feeding value compared to corn (2016 Nebraska Beef Report pp. 29– 30). Whereas, CDS fed in high concentrate diets improve F:G with 147% the feeding value compared to corn (2018 Nebraska Beef Report pp. 94–96). Oil removal from CDS, in forage- based diets, minimally impacts F:G at 20% inclusions, with no effect at 40% inclusions (2013 Nebraska Beef Report pp. 25– 26). Additionally, previous research on forage- based diets containing wet distillers grains plus solubles (WDGS) has suggested a TDN for WDGS of 113%. Using this TDN value, a feeding value was then calculated at 137% the value of corn (2015 Nebraska Beef Report pp. 34– 35). Similar values are need-ed for CDS. Therefore, the objective of this trial was to evaluate corn distillers solubles,
Table 1. Dietary composition (DM basis) of treatments fed to yearling steers1
Ingredient CON
CDS, % Inclusion WDGS, % Inclusion
10 20 30 40 10 20 30 40
DRC 40 30 30 10 - 30 20 10 -
CDS - 10 20 30 40 - - - -
WDGS - - - - - 10 20 30 40
Brome Hay 50 50 50 50 50 50 50 50 50
SoyPass® 3 3 3 3 3 3 3 3 3
CGM 2 2 2 2 2 2 2 2 2
Supplement2 5 5 5 5 5 5 5 5 5
Nutrient Composition, %
CP 13.3 13.8 16.0 18.1 20.3 14.6 17.5 20.4 23.4
Fat 3.16 3.30 3.41 3.51 3.61 4.20 5.20 6.19 7.191DRC=dry- rolled corn, CDS=corn distillers solubles, WDGS=wet distillers grains plus solubles, CGM=corn gluten meal.2Urea was added at 0.65% for CON diet, 0.33% for 10% CDS diet, and 0.33% for 10% WDGS diet.
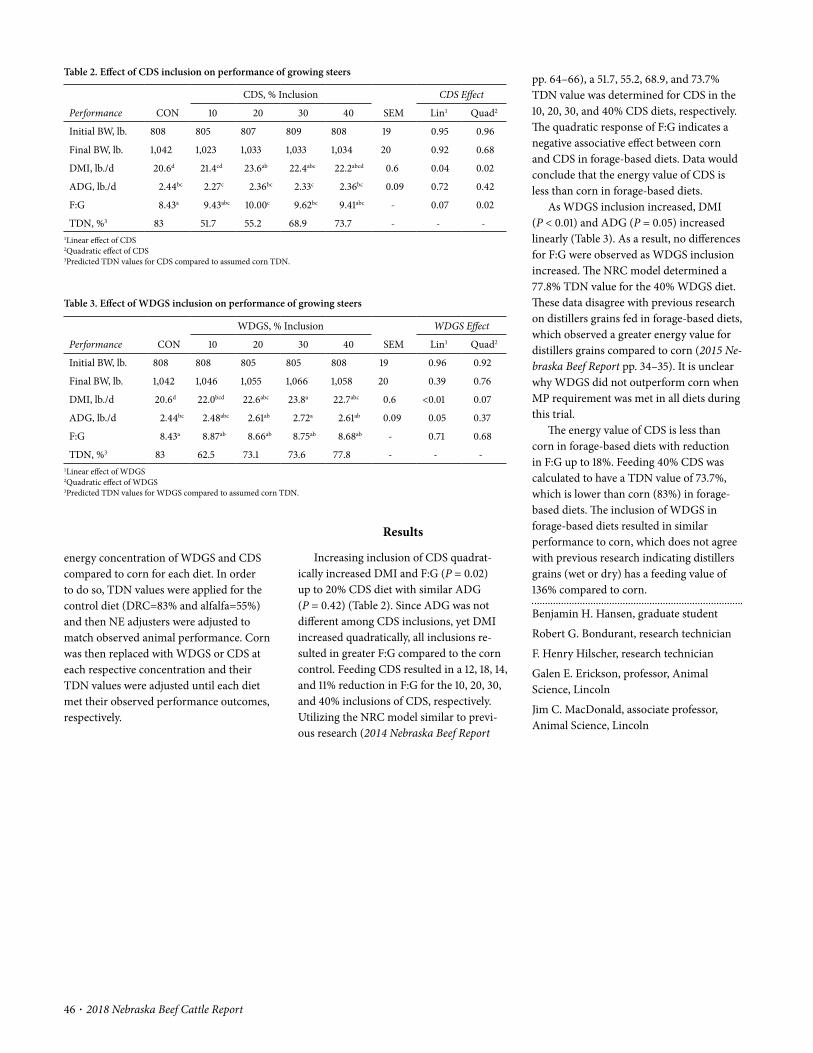
46 · 2018 Nebraska Beef Cattle Report
pp. 64– 66), a 51.7, 55.2, 68.9, and 73.7% TDN value was determined for CDS in the 10, 20, 30, and 40% CDS diets, respectively. The quadratic response of F:G indicates a negative associative effect between corn and CDS in forage- based diets. Data would conclude that the energy value of CDS is less than corn in forage- based diets.
As WDGS inclusion increased, DMI (P < 0.01) and ADG (P = 0.05) increased linearly (Table 3). As a result, no differences for F:G were observed as WDGS inclusion increased. The NRC model determined a 77.8% TDN value for the 40% WDGS diet. These data disagree with previous research on distillers grains fed in forage- based diets, which observed a greater energy value for distillers grains compared to corn (2015 Ne-braska Beef Report pp. 34– 35). It is unclear why WDGS did not outperform corn when MP requirement was met in all diets during this trial.
The energy value of CDS is less than corn in forage- based diets with reduction in F:G up to 18%. Feeding 40% CDS was calculated to have a TDN value of 73.7%, which is lower than corn (83%) in forage- based diets. The inclusion of WDGS in forage- based diets resulted in similar performance to corn, which does not agree with previous research indicating distillers grains (wet or dry) has a feeding value of 136% compared to corn.
Benjamin H. Hansen, graduate student
Robert G. Bondurant, research technician
F. Henry Hilscher, research technician
Galen E. Erickson, professor, Animal Science, Lincoln
Jim C. MacDonald, associate professor, Animal Science, Lincoln
Results
Increasing inclusion of CDS quadrat-ically increased DMI and F:G (P = 0.02) up to 20% CDS diet with similar ADG (P = 0.42) (Table 2). Since ADG was not different among CDS inclusions, yet DMI increased quadratically, all inclusions re-sulted in greater F:G compared to the corn control. Feeding CDS resulted in a 12, 18, 14, and 11% reduction in F:G for the 10, 20, 30, and 40% inclusions of CDS, respectively. Utilizing the NRC model similar to previ-ous research (2014 Nebraska Beef Report
energy concentration of WDGS and CDS compared to corn for each diet. In order to do so, TDN values were applied for the control diet (DRC=83% and alfalfa=55%) and then NE adjusters were adjusted to match observed animal performance. Corn was then replaced with WDGS or CDS at each respective concentration and their TDN values were adjusted until each diet met their observed performance outcomes, respectively.
Table 2. Effect of CDS inclusion on performance of growing steers
Performance CON
CDS, % Inclusion
SEM
CDS Effect
10 20 30 40 Lin1 Quad2
Initial BW, lb. 808 805 807 809 808 19 0.95 0.96
Final BW, lb. 1,042 1,023 1,033 1,033 1,034 20 0.92 0.68
DMI, lb./d 20.6d 21.4cd 23.6ab 22.4abc 22.2abcd 0.6 0.04 0.02
ADG, lb./d 2.44bc 2.27c 2.36bc 2.33c 2.36bc 0.09 0.72 0.42
F:G 8.43a 9.43abc 10.00c 9.62bc 9.41abc - 0.07 0.02
TDN, %3 83 51.7 55.2 68.9 73.7 - - - 1Linear effect of CDS2Quadratic effect of CDS3Predicted TDN values for CDS compared to assumed corn TDN.
Table 3. Effect of WDGS inclusion on performance of growing steers
Performance CON
WDGS, % Inclusion
SEM
WDGS Effect
10 20 30 40 Lin1 Quad2
Initial BW, lb. 808 808 805 805 808 19 0.96 0.92
Final BW, lb. 1,042 1,046 1,055 1,066 1,058 20 0.39 0.76
DMI, lb./d 20.6d 22.0bcd 22.6abc 23.8a 22.7abc 0.6 <0.01 0.07
ADG, lb./d 2.44bc 2.48abc 2.61ab 2.72a 2.61ab 0.09 0.05 0.37
F:G 8.43a 8.87ab 8.66ab 8.75ab 8.68ab - 0.71 0.68
TDN, %3 83 62.5 73.1 73.6 77.8 - - - 1Linear effect of WDGS2Quadratic effect of WDGS3Predicted TDN values for WDGS compared to assumed corn TDN.
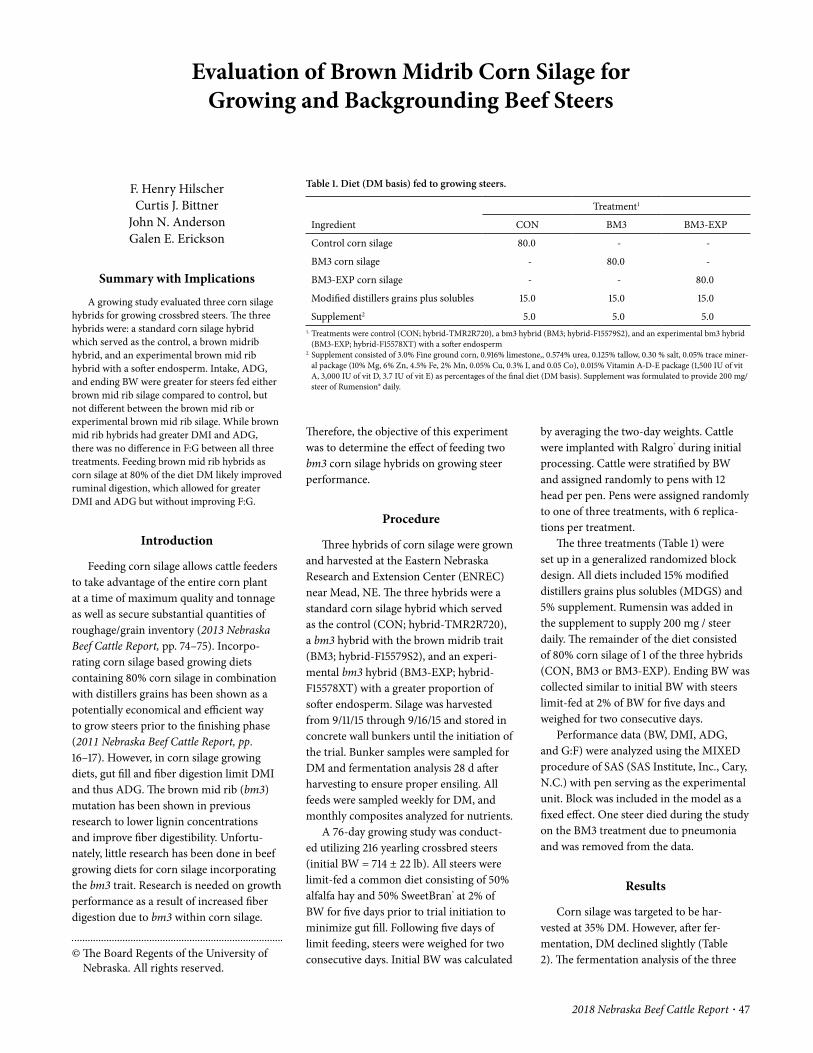
2018 Nebraska Beef Cattle Report · 47
© The Board Regents of the University of Nebraska. All rights reserved.
by averaging the two- day weights. Cattle were implanted with Ralgro® during initial processing. Cattle were stratified by BW and assigned randomly to pens with 12 head per pen. Pens were assigned randomly to one of three treatments, with 6 replica-tions per treatment.
The three treatments (Table 1) were set up in a generalized randomized block design. All diets included 15% modified distillers grains plus solubles (MDGS) and 5% supplement. Rumensin was added in the supplement to supply 200 mg / steer daily. The remainder of the diet consisted of 80% corn silage of 1 of the three hybrids (CON, BM3 or BM3- EXP). Ending BW was collected similar to initial BW with steers limit- fed at 2% of BW for five days and weighed for two consecutive days.
Performance data (BW, DMI, ADG, and G:F) were analyzed using the MIXED procedure of SAS (SAS Institute, Inc., Cary, N.C.) with pen serving as the experimental unit. Block was included in the model as a fixed effect. One steer died during the study on the BM3 treatment due to pneumonia and was removed from the data.
Results
Corn silage was targeted to be har-vested at 35% DM. However, after fer-mentation, DM declined slightly (Table 2). The fermentation analysis of the three
Therefore, the objective of this experiment was to determine the effect of feeding two bm3 corn silage hybrids on growing steer performance.
Procedure
Three hybrids of corn silage were grown and harvested at the Eastern Nebraska Research and Extension Center (ENREC) near Mead, NE. The three hybrids were a standard corn silage hybrid which served as the control (CON; hybrid- TMR2R720), a bm3 hybrid with the brown midrib trait (BM3; hybrid- F15579S2), and an experi-mental bm3 hybrid (BM3- EXP; hybrid- F15578XT) with a greater proportion of softer endosperm. Silage was harvested from 9/11/15 through 9/16/15 and stored in concrete wall bunkers until the initiation of the trial. Bunker samples were sampled for DM and fermentation analysis 28 d after harvesting to ensure proper ensiling. All feeds were sampled weekly for DM, and monthly composites analyzed for nutrients.
A 76- day growing study was conduct-ed utilizing 216 yearling crossbred steers (initial BW = 714 ± 22 lb). All steers were limit- fed a common diet consisting of 50% alfalfa hay and 50% SweetBran® at 2% of BW for five days prior to trial initiation to minimize gut fill. Following five days of limit feeding, steers were weighed for two consecutive days. Initial BW was calculated
F. Henry HilscherCurtis J. Bittner
John N. AndersonGalen E. Erickson
Summary with Implications
A growing study evaluated three corn silage hybrids for growing crossbred steers. The three hybrids were: a standard corn silage hybrid which served as the control, a brown midrib hybrid, and an experimental brown mid rib hybrid with a softer endosperm. Intake, ADG, and ending BW were greater for steers fed either brown mid rib silage compared to control, but not different between the brown mid rib or experimental brown mid rib silage. While brown mid rib hybrids had greater DMI and ADG, there was no difference in F:G between all three treatments. Feeding brown mid rib hybrids as corn silage at 80% of the diet DM likely improved ruminal digestion, which allowed for greater DMI and ADG but without improving F:G.
Introduction
Feeding corn silage allows cattle feeders to take advantage of the entire corn plant at a time of maximum quality and tonnage as well as secure substantial quantities of roughage/grain inventory (2013 Nebraska Beef Cattle Report, pp. 74– 75). Incorpo-rating corn silage based growing diets containing 80% corn silage in combination with distillers grains has been shown as a potentially economical and efficient way to grow steers prior to the finishing phase (2011 Nebraska Beef Cattle Report, pp. 16– 17). However, in corn silage growing diets, gut fill and fiber digestion limit DMI and thus ADG. The brown mid rib (bm3) mutation has been shown in previous research to lower lignin concentrations and improve fiber digestibility. Unfortu-nately, little research has been done in beef growing diets for corn silage incorporating the bm3 trait. Research is needed on growth performance as a result of increased fiber digestion due to bm3 within corn silage.
Evaluation of Brown Midrib Corn Silage for Growing and Backgrounding Beef Steers
Table 1. Diet (DM basis) fed to growing steers.
Ingredient
Treatment1
CON BM3 BM3- EXP
Control corn silage 80.0 - -
BM3 corn silage - 80.0 -
BM3- EXP corn silage - - 80.0
Modified distillers grains plus solubles 15.0 15.0 15.0
Supplement2 5.0 5.0 5.01. Treatments were control (CON; hybrid- TMR2R720), a bm3 hybrid (BM3; hybrid- F15579S2), and an experimental bm3 hybrid
(BM3- EXP; hybrid- F15578XT) with a softer endosperm2. Supplement consisted of 3.0% Fine ground corn, 0.916% limestone,, 0.574% urea, 0.125% tallow, 0.30 % salt, 0.05% trace miner-
al package (10% Mg, 6% Zn, 4.5% Fe, 2% Mn, 0.05% Cu, 0.3% I, and 0.05 Co), 0.015% Vitamin A- D- E package (1,500 IU of vit A, 3,000 IU of vit D, 3.7 IU of vit E) as percentages of the final diet (DM basis). Supplement was formulated to provide 200 mg/steer of Rumension® daily.
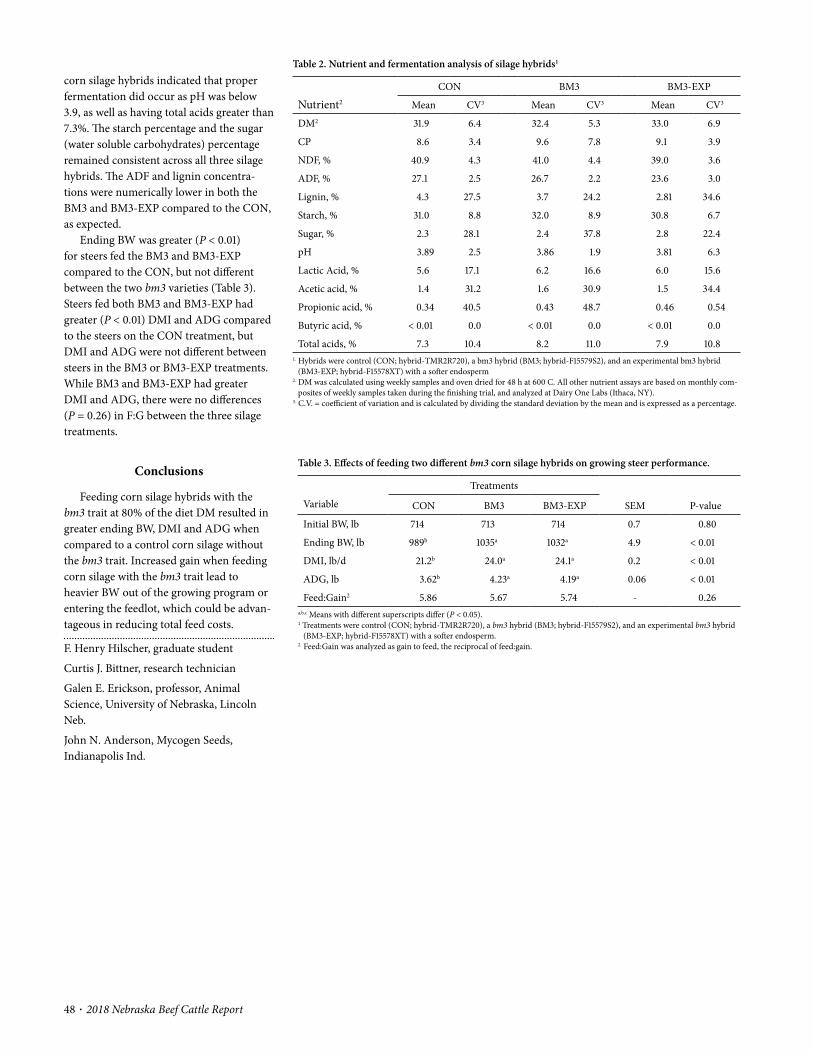
48 · 2018 Nebraska Beef Cattle Report
corn silage hybrids indicated that proper fermentation did occur as pH was below 3.9, as well as having total acids greater than 7.3%. The starch percentage and the sugar (water soluble carbohydrates) percentage remained consistent across all three silage hybrids. The ADF and lignin concentra-tions were numerically lower in both the BM3 and BM3- EXP compared to the CON, as expected.
Ending BW was greater (P < 0.01) for steers fed the BM3 and BM3- EXP compared to the CON, but not different between the two bm3 varieties (Table 3). Steers fed both BM3 and BM3- EXP had greater (P < 0.01) DMI and ADG compared to the steers on the CON treatment, but DMI and ADG were not different between steers in the BM3 or BM3- EXP treatments. While BM3 and BM3- EXP had greater DMI and ADG, there were no differences (P = 0.26) in F:G between the three silage treatments.
Conclusions
Feeding corn silage hybrids with the bm3 trait at 80% of the diet DM resulted in greater ending BW, DMI and ADG when compared to a control corn silage without the bm3 trait. Increased gain when feeding corn silage with the bm3 trait lead to heavier BW out of the growing program or entering the feedlot, which could be advan-tageous in reducing total feed costs.
F. Henry Hilscher, graduate student
Curtis J. Bittner, research technician
Galen E. Erickson, professor, Animal Science, University of Nebraska, Lincoln Neb.
John N. Anderson, Mycogen Seeds, Indianapolis Ind.
Table 2. Nutrient and fermentation analysis of silage hybrids1
Nutrient2
CON BM3 BM3- EXP
Mean CV3 Mean CV3 Mean CV3
DM2 31.9 6.4 32.4 5.3 33.0 6.9
CP 8.6 3.4 9.6 7.8 9.1 3.9
NDF, % 40.9 4.3 41.0 4.4 39.0 3.6
ADF, % 27.1 2.5 26.7 2.2 23.6 3.0
Lignin, % 4.3 27.5 3.7 24.2 2.81 34.6
Starch, % 31.0 8.8 32.0 8.9 30.8 6.7
Sugar, % 2.3 28.1 2.4 37.8 2.8 22.4
pH 3.89 2.5 3.86 1.9 3.81 6.3
Lactic Acid, % 5.6 17.1 6.2 16.6 6.0 15.6
Acetic acid, % 1.4 31.2 1.6 30.9 1.5 34.4
Propionic acid, % 0.34 40.5 0.43 48.7 0.46 0.54
Butyric acid, % < 0.01 0.0 < 0.01 0.0 < 0.01 0.0
Total acids, % 7.3 10.4 8.2 11.0 7.9 10.81. Hybrids were control (CON; hybrid- TMR2R720), a bm3 hybrid (BM3; hybrid- F15579S2), and an experimental bm3 hybrid
(BM3- EXP; hybrid- F15578XT) with a softer endosperm2. DM was calculated using weekly samples and oven dried for 48 h at 600 C. All other nutrient assays are based on monthly com-
posites of weekly samples taken during the finishing trial, and analyzed at Dairy One Labs (Ithaca, NY).3. C.V. = coefficient of variation and is calculated by dividing the standard deviation by the mean and is expressed as a percentage.
Table 3. Effects of feeding two different bm3 corn silage hybrids on growing steer performance.
Treatments
Variable CON BM3 BM3- EXP SEM P- value
Initial BW, lb 714 713 714 0.7 0.80
Ending BW, lb 989b 1035a 1032a 4.9 < 0.01
DMI, lb/d 21.2b 24.0a 24.1a 0.2 < 0.01
ADG, lb 3.62b 4.23a 4.19a 0.06 < 0.01
Feed:Gain2 5.86 5.67 5.74 - 0.26a,b,c Means with different superscripts differ (P < 0.05).1 Treatments were control (CON; hybrid- TMR2R720), a bm3 hybrid (BM3; hybrid- F15579S2), and an experimental bm3 hybrid
(BM3- EXP; hybrid- F15578XT) with a softer endosperm.2. Feed:Gain was analyzed as gain to feed, the reciprocal of feed:gain.
2018 Nebraska Beef Cattle Report · 49
© The Board Regents of the University of Nebraska. All rights reserved.
for six periods (Table 1). All diets included 15% modified distillers grains plus solubles (MDGS) and 5% supplement. Rumensin was added in the supplement to supply 200 mg / steer daily. The remainder of the diet consisted of 80% corn silage of 1 of the three hybrids (CON, BM3 or BM3- EXP: Table 1). Each period was 21 d in length consisting of 16 d adaptation and a 5 d collection. Beginning on day 10 of each period, titanium dioxide was dosed at 5 g/steer twice daily at 0700 and 1500 hours for seven days before and during the collection period. Fecal grab samples were collected at 0700, 1100, 1500, and 1900 hours during day 1– 4 of the collection period. Fecal samples were composited and subsequently analyzed for neutral detergent fiber (NDF), acid detergent fiber (ADF), starch, organic matter (OM), and Ti concentration. Rumi-nal pH was recorded every minute using wireless pH probes from day 1 to 4 of the collection period. Feeds offered and refused were analyzed for dry matter (DM), OM, NDF, ADF, starch, and lignin percentage.
Whole rumen contents were collect-ed on d 5 at 1400 (6 hours post feeding). Rumen samples at 0 h post collection were immediately frozen after collection, and re-mained frozen until VFA concentration was measured. Rumen samples were incubated and stirred for 2, 4, and 6 hr post collection to determine VFA production. At time of analysis, rumen fluid samples were thawed
Nutrient Digestibility and Fermentation of Brown Midrib Corn Fed to Growing Beef Steers
F. Henry HilscherMelissa L. Jolly- Breithaupt
Jana L. GramkowHannah C. WilsonMitch M. NormanJohn N. AndersonGalen E. Erickson
Summary with Implications
A digestion study evaluated three corn si-lage hybrids for growing crossbred steers. The three hybrids were: a standard corn silage hybrid which served as the control, a brown midrib hybrid (bm3), and an experimental bm3 hybrid with a softer endosperm. Both bm3 hybrids had greater organic matter and fiber digestibility compared to the control corn silage. However, no differences were ob-served between the two bm3 hybrids. Rumen pH was reduced for BM3 and BM3- EXP compared to the control suggesting greater rumen fermentation. In vitro gas production was increased for the bm3 hybrids compared to the control further supporting greater rumen fermentation.
Introduction
Feeding corn silage allows cattle feeders to take advantage of the entire corn plant at a time of maximum quality and tonnage as well as secure substantial quantities of roughage/grain inventory (2013 Nebraska Beef Cattle Report, pp. 74– 75). Incorpo-rating corn silage based growing diets containing 80% corn silage in combination with distillers grains has been shown as a potentially economical and efficient way to grow steers prior to the finishing phase (2011 Nebraska Beef Cattle Report, pp. 16– 17). However, in corn silage growing diets, gut fill and fiber digestion limit DMI and thus ADG. The brown mid rib (bm3) mu-tation has been shown in previous research to lower lignin concentrations and improve
fiber digestibility. Unfortunately, little re-search has been done in beef growing diets for corn silage incorporating the bm3 trait. Research is needed on growth performance as a result of increased fiber digestion due to bm3 within corn silage. Therefore, the objective of this experiment was to deter-mine the effect of feeding two bm3 corn silage hybrids on growing steer nutrient digestibility and ruminal fermentation.
Procedure
Three hybrids of corn silage were grown and harvested at the Eastern Nebraska Research and Extension Center (ENREC) near Mead, NE. The three hybrids were a standard corn silage hybrid which served as the control (CON; hybrid- TMR2R720), a bm3 hybrid with the brown midrib trait (BM3; hybrid- F15579S2), and an experi-mental bm3 hybrid (BM3- EXP; hybrid- F15578XT) with a greater proportion of softer endosperm. Silage was harvested from 9/11/15 through 9/16/15 and stored in concrete wall bunkers until the initiation of the trial. Bunker samples were analyzed for DM and fermentation analysis 28 d after harvesting to ensure proper ensiling. All feeds were sampled weekly for DM, and monthly composites analyzed for nutrients.
Six steers (initial BW = 604 ± 60 lb) were used in a replicated 3 × 6 Latin rect-angle with 3 treatments fed each period,
Table 1. Diet (DM basis) fed to growing steers
Ingredient
Treatment1
CON BM3 BM3- EXP
Control corn silage 80.0 - -
BM3 corn silage - 80.0 -
BM3- EXP corn silage - - 80.0
Modified distillers grains plus solubles 15.0 15.0 15.0
Supplement2 5.0 5.0 5.01 Treatments were control (CON; hybrid- TMR2R720), a bm3 hybrid (BM3; hybrid- F15579S2), and an experimental bm3 hybrid
(BM3- EXP; hybrid- F15578XT) with softer endosperm2 Supplement consisted of 3.0% Fine ground corn, 0.916% limestone, 0.574% urea, 0.125% tallow, 0.30 % salt, 0.05% trace mineral
package (10% Mg, 6% Zn, 4.5% Fe, 2% Mn, 0.05% Cu, 0.3% I, and 0.05 Co), 0.015% Vitamin A- D- E package (1,500 IU of vit A, 3,000 IU of vit D, 3.7 IU of vit E) as percentages of the final diet (DM basis). Supplement was formulated to provide 200 mg/steer of Rumension® daily.
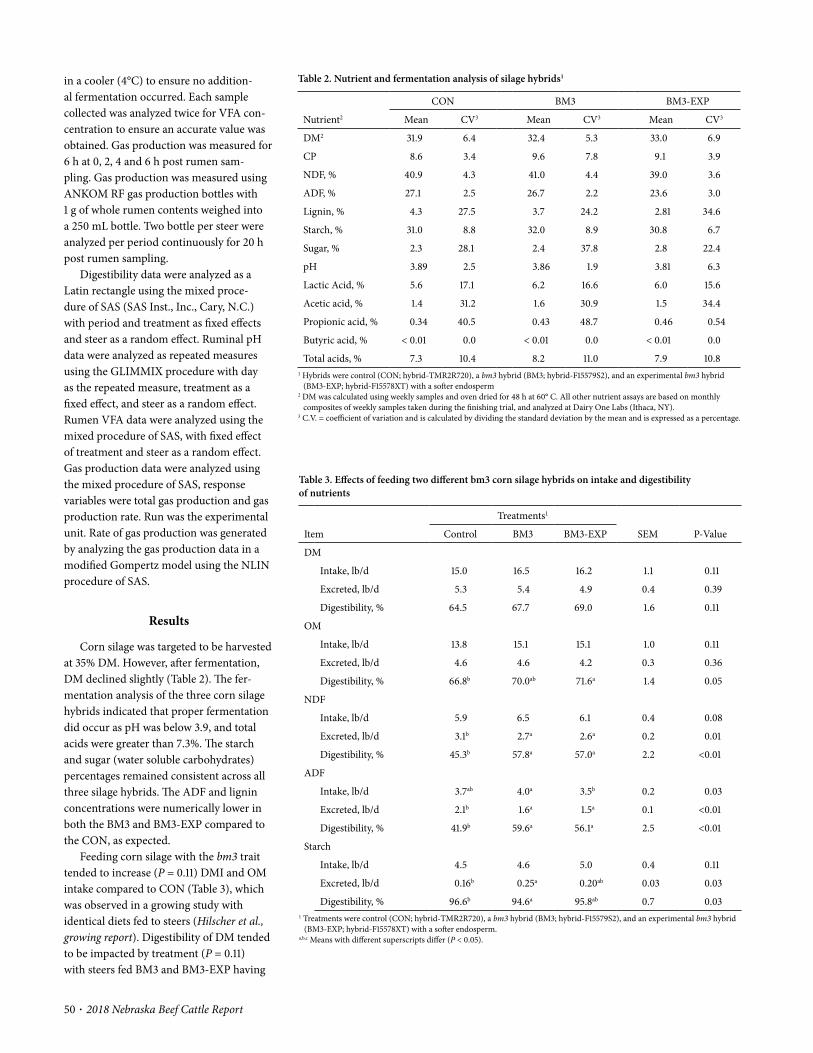
50 · 2018 Nebraska Beef Cattle Report
in a cooler (4°C) to ensure no addition-al fermentation occurred. Each sample collected was analyzed twice for VFA con-centration to ensure an accurate value was obtained. Gas production was measured for 6 h at 0, 2, 4 and 6 h post rumen sam-pling. Gas production was measured using ANKOM RF gas production bottles with 1 g of whole rumen contents weighed into a 250 mL bottle. Two bottle per steer were analyzed per period continuously for 20 h post rumen sampling.
Digestibility data were analyzed as a Latin rectangle using the mixed proce-dure of SAS (SAS Inst., Inc., Cary, N.C.) with period and treatment as fixed effects and steer as a random effect. Ruminal pH data were analyzed as repeated measures using the GLIMMIX procedure with day as the repeated measure, treatment as a fixed effect, and steer as a random effect. Rumen VFA data were analyzed using the mixed procedure of SAS, with fixed effect of treatment and steer as a random effect. Gas production data were analyzed using the mixed procedure of SAS, response variables were total gas production and gas production rate. Run was the experimental unit. Rate of gas production was generated by analyzing the gas production data in a modified Gompertz model using the NLIN procedure of SAS.
Results
Corn silage was targeted to be harvested at 35% DM. However, after fermentation, DM declined slightly (Table 2). The fer-mentation analysis of the three corn silage hybrids indicated that proper fermentation did occur as pH was below 3.9, and total acids were greater than 7.3%. The starch and sugar (water soluble carbohydrates) percentages remained consistent across all three silage hybrids. The ADF and lignin concentrations were numerically lower in both the BM3 and BM3- EXP compared to the CON, as expected.
Feeding corn silage with the bm3 trait tended to increase (P = 0.11) DMI and OM intake compared to CON (Table 3), which was observed in a growing study with identical diets fed to steers (Hilscher et al., growing report). Digestibility of DM tended to be impacted by treatment (P = 0.11) with steers fed BM3 and BM3- EXP having
Table 2. Nutrient and fermentation analysis of silage hybrids1
Nutrient2
CON BM3 BM3- EXP
Mean CV3 Mean CV3 Mean CV3
DM2 31.9 6.4 32.4 5.3 33.0 6.9
CP 8.6 3.4 9.6 7.8 9.1 3.9
NDF, % 40.9 4.3 41.0 4.4 39.0 3.6
ADF, % 27.1 2.5 26.7 2.2 23.6 3.0
Lignin, % 4.3 27.5 3.7 24.2 2.81 34.6
Starch, % 31.0 8.8 32.0 8.9 30.8 6.7
Sugar, % 2.3 28.1 2.4 37.8 2.8 22.4
pH 3.89 2.5 3.86 1.9 3.81 6.3
Lactic Acid, % 5.6 17.1 6.2 16.6 6.0 15.6
Acetic acid, % 1.4 31.2 1.6 30.9 1.5 34.4
Propionic acid, % 0.34 40.5 0.43 48.7 0.46 0.54
Butyric acid, % < 0.01 0.0 < 0.01 0.0 < 0.01 0.0
Total acids, % 7.3 10.4 8.2 11.0 7.9 10.81 Hybrids were control (CON; hybrid- TMR2R720), a bm3 hybrid (BM3; hybrid- F15579S2), and an experimental bm3 hybrid
(BM3- EXP; hybrid- F15578XT) with a softer endosperm2 DM was calculated using weekly samples and oven dried for 48 h at 60° C. All other nutrient assays are based on monthly
composites of weekly samples taken during the finishing trial, and analyzed at Dairy One Labs (Ithaca, NY).3 C.V. = coefficient of variation and is calculated by dividing the standard deviation by the mean and is expressed as a percentage.
Table 3. Effects of feeding two different bm3 corn silage hybrids on intake and digestibility of nutrients
Item
Treatments1
SEM P- ValueControl BM3 BM3- EXP
DM
Intake, lb/d 15.0 16.5 16.2 1.1 0.11
Excreted, lb/d 5.3 5.4 4.9 0.4 0.39
Digestibility, % 64.5 67.7 69.0 1.6 0.11
OM
Intake, lb/d 13.8 15.1 15.1 1.0 0.11
Excreted, lb/d 4.6 4.6 4.2 0.3 0.36
Digestibility, % 66.8b 70.0ab 71.6a 1.4 0.05
NDF
Intake, lb/d 5.9 6.5 6.1 0.4 0.08
Excreted, lb/d 3.1b 2.7a 2.6a 0.2 0.01
Digestibility, % 45.3b 57.8a 57.0a 2.2 <0.01
ADF
Intake, lb/d 3.7ab 4.0a 3.5b 0.2 0.03
Excreted, lb/d 2.1b 1.6a 1.5a 0.1 <0.01
Digestibility, % 41.9b 59.6a 56.1a 2.5 <0.01
Starch
Intake, lb/d 4.5 4.6 5.0 0.4 0.11
Excreted, lb/d 0.16b 0.25a 0.20ab 0.03 0.03
Digestibility, % 96.6b 94.6a 95.8ab 0.7 0.031 Treatments were control (CON; hybrid- TMR2R720), a bm3 hybrid (BM3; hybrid- F15579S2), and an experimental bm3 hybrid
(BM3- EXP; hybrid- F15578XT) with a softer endosperm.a,b,c Means with different superscripts differ (P < 0.05).
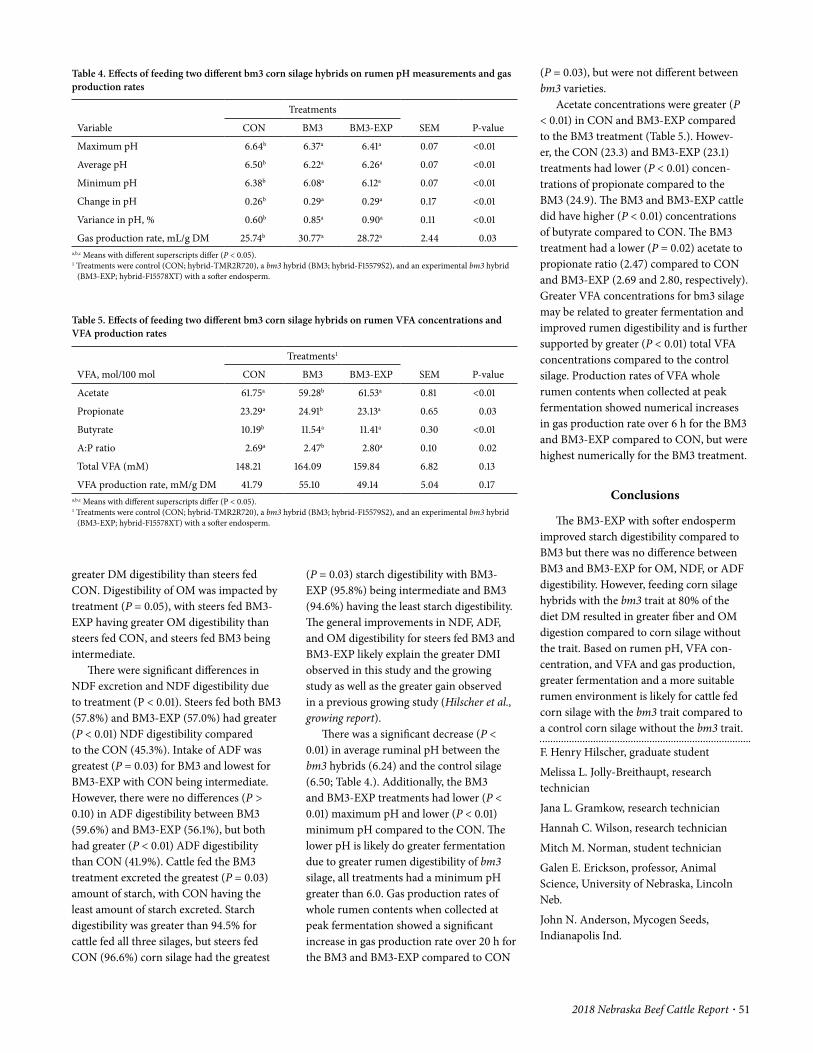
2018 Nebraska Beef Cattle Report · 51
greater DM digestibility than steers fed CON. Digestibility of OM was impacted by treatment (P = 0.05), with steers fed BM3- EXP having greater OM digestibility than steers fed CON, and steers fed BM3 being intermediate.
There were significant differences in NDF excretion and NDF digestibility due to treatment (P < 0.01). Steers fed both BM3 (57.8%) and BM3- EXP (57.0%) had greater (P < 0.01) NDF digestibility compared to the CON (45.3%). Intake of ADF was greatest (P = 0.03) for BM3 and lowest for BM3- EXP with CON being intermediate. However, there were no differences (P > 0.10) in ADF digestibility between BM3 (59.6%) and BM3- EXP (56.1%), but both had greater (P < 0.01) ADF digestibility than CON (41.9%). Cattle fed the BM3 treatment excreted the greatest (P = 0.03) amount of starch, with CON having the least amount of starch excreted. Starch digestibility was greater than 94.5% for cattle fed all three silages, but steers fed CON (96.6%) corn silage had the greatest
Table 4. Effects of feeding two different bm3 corn silage hybrids on rumen pH measurements and gas production rates
Variable
Treatments
SEM P- valueCON BM3 BM3- EXP
Maximum pH 6.64b 6.37a 6.41a 0.07 <0.01
Average pH 6.50b 6.22a 6.26a 0.07 <0.01
Minimum pH 6.38b 6.08a 6.12a 0.07 <0.01
Change in pH 0.26b 0.29a 0.29a 0.17 <0.01
Variance in pH, % 0.60b 0.85a 0.90a 0.11 <0.01
Gas production rate, mL/g DM 25.74b 30.77a 28.72a 2.44 0.03a,b,c Means with different superscripts differ (P < 0.05).1 Treatments were control (CON; hybrid- TMR2R720), a bm3 hybrid (BM3; hybrid- F15579S2), and an experimental bm3 hybrid
(BM3- EXP; hybrid- F15578XT) with a softer endosperm.
Table 5. Effects of feeding two different bm3 corn silage hybrids on rumen VFA concentrations and VFA production rates
VFA, mol/100 mol
Treatments1
SEM P- valueCON BM3 BM3- EXP
Acetate 61.75a 59.28b 61.53a 0.81 <0.01
Propionate 23.29a 24.91b 23.13a 0.65 0.03
Butyrate 10.19b 11.54a 11.41a 0.30 <0.01
A:P ratio 2.69a 2.47b 2.80a 0.10 0.02
Total VFA (mM) 148.21 164.09 159.84 6.82 0.13
VFA production rate, mM/g DM 41.79 55.10 49.14 5.04 0.17a,b,c Means with different superscripts differ (P < 0.05).1 Treatments were control (CON; hybrid- TMR2R720), a bm3 hybrid (BM3; hybrid- F15579S2), and an experimental bm3 hybrid
(BM3- EXP; hybrid- F15578XT) with a softer endosperm.
(P = 0.03) starch digestibility with BM3- EXP (95.8%) being intermediate and BM3 (94.6%) having the least starch digestibility. The general improvements in NDF, ADF, and OM digestibility for steers fed BM3 and BM3- EXP likely explain the greater DMI observed in this study and the growing study as well as the greater gain observed in a previous growing study (Hilscher et al., growing report).
There was a significant decrease (P < 0.01) in average ruminal pH between the bm3 hybrids (6.24) and the control silage (6.50; Table 4.). Additionally, the BM3 and BM3- EXP treatments had lower (P < 0.01) maximum pH and lower (P < 0.01) minimum pH compared to the CON. The lower pH is likely do greater fermentation due to greater rumen digestibility of bm3 silage, all treatments had a minimum pH greater than 6.0. Gas production rates of whole rumen contents when collected at peak fermentation showed a significant increase in gas production rate over 20 h for the BM3 and BM3- EXP compared to CON
(P = 0.03), but were not different between bm3 varieties.
Acetate concentrations were greater (P < 0.01) in CON and BM3- EXP compared to the BM3 treatment (Table 5.). Howev-er, the CON (23.3) and BM3- EXP (23.1) treatments had lower (P < 0.01) concen-trations of propionate compared to the BM3 (24.9). The BM3 and BM3- EXP cattle did have higher (P < 0.01) concentrations of butyrate compared to CON. The BM3 treatment had a lower (P = 0.02) acetate to propionate ratio (2.47) compared to CON and BM3- EXP (2.69 and 2.80, respectively). Greater VFA concentrations for bm3 silage may be related to greater fermentation and improved rumen digestibility and is further supported by greater (P < 0.01) total VFA concentrations compared to the control silage. Production rates of VFA whole rumen contents when collected at peak fermentation showed numerical increases in gas production rate over 6 h for the BM3 and BM3- EXP compared to CON, but were highest numerically for the BM3 treatment.
Conclusions
The BM3- EXP with softer endosperm improved starch digestibility compared to BM3 but there was no difference between BM3 and BM3- EXP for OM, NDF, or ADF digestibility. However, feeding corn silage hybrids with the bm3 trait at 80% of the diet DM resulted in greater fiber and OM digestion compared to corn silage without the trait. Based on rumen pH, VFA con-centration, and VFA and gas production, greater fermentation and a more suitable rumen environment is likely for cattle fed corn silage with the bm3 trait compared to a control corn silage without the bm3 trait.
F. Henry Hilscher, graduate student
Melissa L. Jolly- Breithaupt, research technician
Jana L. Gramkow, research technician
Hannah C. Wilson, research technician
Mitch M. Norman, student technician
Galen E. Erickson, professor, Animal Science, University of Nebraska, Lincoln Neb.
John N. Anderson, Mycogen Seeds, Indianapolis Ind.

52 · 2018 Nebraska Beef Cattle Report
© The Board Regents of the University of Nebraska. All rights reserved.
Rumen Undegradable Protein Content and Digestibility of Corn Silage and High- moisture Corn
Colton R. OneyJana K. GramkowF. Henry Hilscher
Elizabeth SchumacherAndrea K. WatsonGalen E. EricksonJim C. MacDonald
Terry J. Klopfenstein
Summary with Implications
Two studies were conducted to determine rumen undegradable protein (RUP) content and digestibility in corn silage. In Exp. 1, 37 and 42% DM corn silage were incubated in situ with two ruminally and one duodenally cannulated steer to calculate RUP content and RUP digestibility. In Exp. 2, dry rolled corn was reconstituted to 75, 70, 65, and 50% DM and ensiled in mini silos for 30, 90, 180, or 270 days. After ensiling, samples were ruminally incubated to determine RUP con-tent of the grain. The grain within corn silage is less than 50% DM, as moisture content increases and time of ensiling increases, RUP content of this grain decreases. Results from these experiments suggest the RUP content of corn silage is 10% of the CP or the CP within corn silage is 90% rumen degradable protein.
Introduction
Feeding corn silage allows cattle feeders to harvest the entire corn plant at the time of greatest forage quality and provides a large quantity of affordable forage. When formulating rations it is important to cor-rectly account for the CP, rumen degradable protein (RDP), and rumen undegradable protein (RUP) content of corn silage. Be-cause lab techniques designed to measure RUP values of feedstuffs are specific to ei-ther forages or concentrates, and corn silage is a blend of both, quantifying RUP of corn silage is difficult. Furthermore, moisture content and ensiling time probably impact
protein degradability of the corn silage (2005 Nebraska Beef Report, pp 31– 33). At silage harvest, forage is wetter than the grain and during storage the grain absorbs moisture from the forage, becoming very wet high moisture corn (HMC). As the grain absorbs moisture, the protein has a greater degree of rumen degradability. Therefore, the objectives of these experi-ments were to determine the RUP content and RUP digestibility of corn silage.
Procedure
In Exp. 1, corn silage was harvested at the Eastern Nebraska Research and Extension Center (ENREC) near Mead, NE at 37 or 42% DM to mimic traditional corn silage harvest or a delayed harvest. Harvest began when the field was at approximately ¾ milkline for the 37% DM corn silage (9/4/2014), and then delayed two weeks coinciding with black layer formation for the 42% DM corn silage (9/16/2014). After harvesting, silages were stored in sealed Silo bags. After 28 days, approximately 25 lb of corn silage was brought to the University of Nebraska- Lincoln Animal Science building and freeze dried. Both the 37 and 42% corn silages were then analyzed for RUP content using an in situ technique.
Feed samples were ground through a 2- mm screen and 1.25 g of sample was added to Ankom bags, with 16 replicate bags per sample. Bags were ruminally incubated for either 20 or 30 hours in one of two rumi-nally fistulated steers on a 30% concen-trate diet. After the designated incubation time, bags were removed, rinsed, and half of the bags were frozen for duodenal incubation. The remaining bags were divided in half again with half refluxed in neutral detergent (ND) solution using an ANKOM Fiber Analyzer to remove mi-crobial contamination from residue. Bags were dried in a 60°C forced- air oven for 24 hours to dry and weighed to determine DM disappearance.
Four bags of each feed sample were duodenally incubated. Of the bags that were duodenally incubated, half of them (two bags of each feed) were washed in ND solution to remove microbial contamina-tion from residue. The bags were incubated in a duodenally fistulated steer consuming a concentrate diet. Bags were retrieved from fecal matter approximately 12 hours after being placed in the cannula. Once all bags were retrieved, bags were rinsed, oven dried, and then allowed to air equilibrate for 12 hours before being weighed. After all bags (ruminally and duodenally incubated) were weighed, bags were cut open and N analysis was conducted on the remaining feed residue to calculate CP remaining.
In Exp. 2, dry rolled corn (DRC) was retrieved from the feed mill located at the ENREC near Mead, NE and brought to the University of Nebraska- Lincoln Animal Science building. Using a small feed mixer, different proportions of water and corn were mixed to reconstitute DRC to 50, 65, 70, and 75% DM HMC. It is important to note that we attempted to reconstitute corn down to 40% DM; however, we found that this was too much water and the corn was not able to absorb it all. Once corn was re-constituted to its designated DM, wet corn was packed into mini silos (0.08 ft3) using a packing density of 45 lb DM/ft3. Silos were sealed with gas release lids and stored for 30, 90, 180 or 270 days.
On the designated opening day, silos were weighed, emptied and sub- sampled for DM and CP. Within 1 hour of being out of the silo, corn was weighed into Ankom in situ bags. In order to get 5.0 g of DM content in each bag, different as- is amounts of HMC were added to the bags based on the DM at which the corn was ensiled at. There were 4 in situ bags per steer (2) for each incubation time (2), therefore 16 bags / silo were made. Bags were ruminal-ly incubated for 20 or 30 hours, in cattle consuming a 30% concentrate diet. After the designated incubation time, bags were
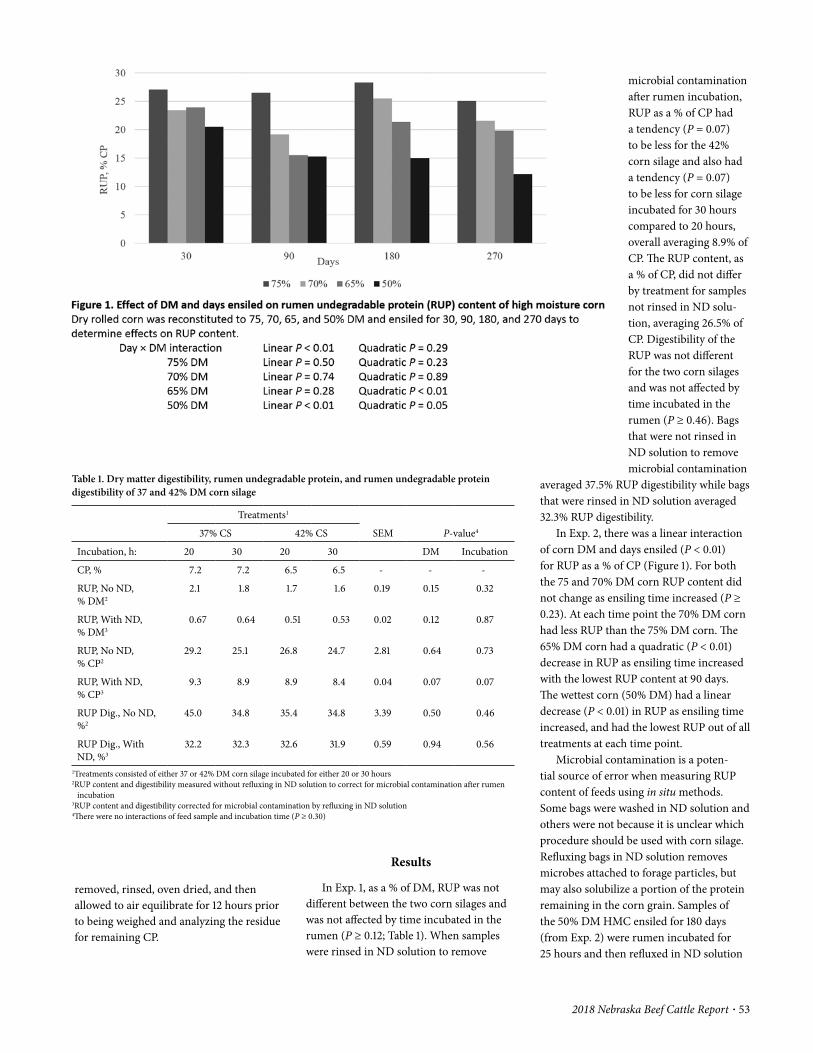
2018 Nebraska Beef Cattle Report · 53
microbial contamination after rumen incubation, RUP as a % of CP had a tendency (P = 0.07) to be less for the 42% corn silage and also had a tendency (P = 0.07) to be less for corn silage incubated for 30 hours compared to 20 hours, overall averaging 8.9% of CP. The RUP content, as a % of CP, did not differ by treatment for samples not rinsed in ND solu-tion, averaging 26.5% of CP. Digestibility of the RUP was not different for the two corn silages and was not affected by time incubated in the rumen (P ≥ 0.46). Bags that were not rinsed in ND solution to remove microbial contamination
averaged 37.5% RUP digestibility while bags that were rinsed in ND solution averaged 32.3% RUP digestibility.
In Exp. 2, there was a linear interaction of corn DM and days ensiled (P < 0.01) for RUP as a % of CP (Figure 1). For both the 75 and 70% DM corn RUP content did not change as ensiling time increased (P ≥ 0.23). At each time point the 70% DM corn had less RUP than the 75% DM corn. The 65% DM corn had a quadratic (P < 0.01) decrease in RUP as ensiling time increased with the lowest RUP content at 90 days. The wettest corn (50% DM) had a linear decrease (P < 0.01) in RUP as ensiling time increased, and had the lowest RUP out of all treatments at each time point.
Microbial contamination is a poten-tial source of error when measuring RUP content of feeds using in situ methods. Some bags were washed in ND solution and others were not because it is unclear which procedure should be used with corn silage. Refluxing bags in ND solution removes microbes attached to forage particles, but may also solubilize a portion of the protein remaining in the corn grain. Samples of the 50% DM HMC ensiled for 180 days (from Exp. 2) were rumen incubated for 25 hours and then refluxed in ND solution
Results
In Exp. 1, as a % of DM, RUP was not different between the two corn silages and was not affected by time incubated in the rumen (P ≥ 0.12; Table 1). When samples were rinsed in ND solution to remove
removed, rinsed, oven dried, and then allowed to air equilibrate for 12 hours prior to being weighed and analyzing the residue for remaining CP.
Table 1. Dry matter digestibility, rumen undegradable protein, and rumen undegradable protein digestibility of 37 and 42% DM corn silage
Treatments1
SEM P- value437% CS 42% CS
Incubation, h: 20 30 20 30 DM Incubation
CP, % 7.2 7.2 6.5 6.5 - - -
RUP, No ND, % DM2
2.1 1.8 1.7 1.6 0.19 0.15 0.32
RUP, With ND, % DM3
0.67 0.64 0.51 0.53 0.02 0.12 0.87
RUP, No ND, % CP2
29.2 25.1 26.8 24.7 2.81 0.64 0.73
RUP, With ND, % CP3
9.3 8.9 8.9 8.4 0.04 0.07 0.07
RUP Dig., No ND, %2
45.0 34.8 35.4 34.8 3.39 0.50 0.46
RUP Dig., With ND, %3
32.2 32.3 32.6 31.9 0.59 0.94 0.56
1Treatments consisted of either 37 or 42% DM corn silage incubated for either 20 or 30 hours2RUP content and digestibility measured without refluxing in ND solution to correct for microbial contamination after rumen
incubation3RUP content and digestibility corrected for microbial contamination by refluxing in ND solution4There were no interactions of feed sample and incubation time (P ≥ 0.30)
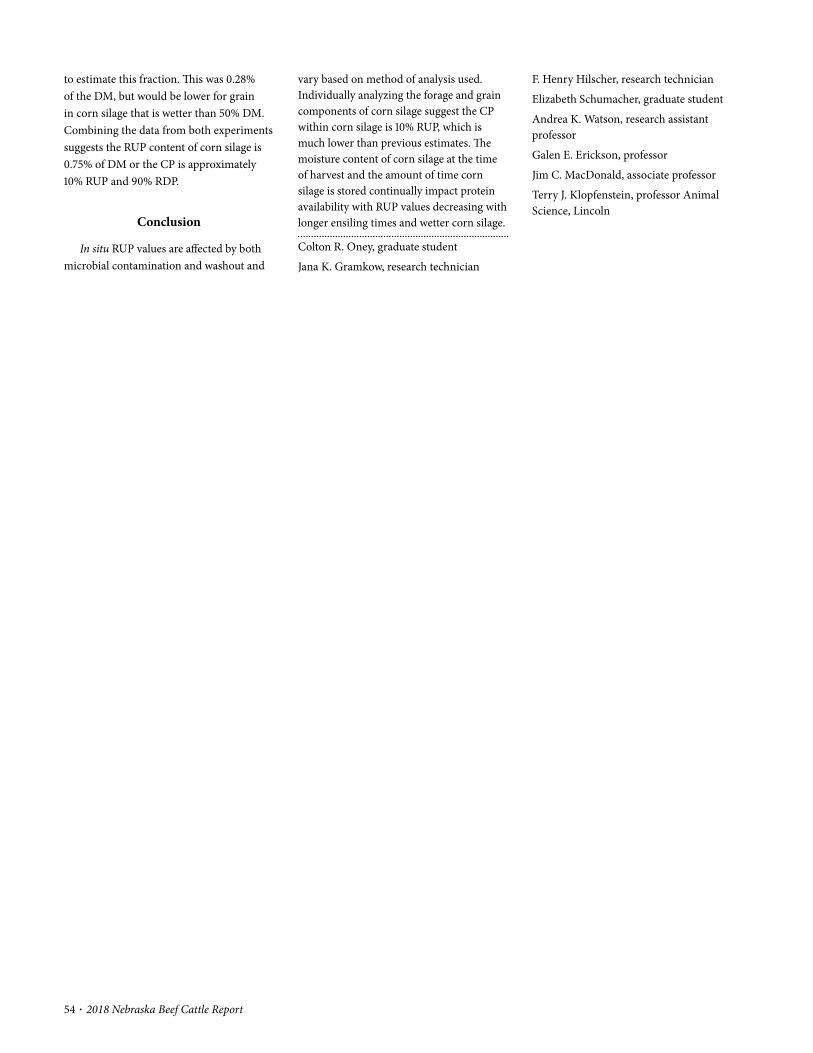
54 · 2018 Nebraska Beef Cattle Report
F. Henry Hilscher, research technician
Elizabeth Schumacher, graduate student
Andrea K. Watson, research assistant professor
Galen E. Erickson, professor
Jim C. MacDonald, associate professor
Terry J. Klopfenstein, professor Animal Science, Lincoln
vary based on method of analysis used. Individually analyzing the forage and grain components of corn silage suggest the CP within corn silage is 10% RUP, which is much lower than previous estimates. The moisture content of corn silage at the time of harvest and the amount of time corn silage is stored continually impact protein availability with RUP values decreasing with longer ensiling times and wetter corn silage.
Colton R. Oney, graduate student
Jana K. Gramkow, research technician
to estimate this fraction. This was 0.28% of the DM, but would be lower for grain in corn silage that is wetter than 50% DM. Combining the data from both experiments suggests the RUP content of corn silage is 0.75% of DM or the CP is approximately 10% RUP and 90% RDP.
Conclusion
In situ RUP values are affected by both microbial contamination and washout and

2018 Nebraska Beef Cattle Report · 55
© The Board Regents of the University of Nebraska. All rights reserved.
or of their paired pen (pen in their block). Steers were implanted with Synovex®- Choice on day 1. Methane and carbon dioxide were monitored in the methane barn through a negative pressure system. The methane barns are a completely en-closed facility using two fans per pen to pull air through at a rate of 79 m3 /min. Near the fan outlets are the sampling ports with pumps that pull air into a sampling line. The air is analyzed using a LI- COR® 7500 for carbon dioxide and a LI- COR® 7700 for methane analyzing The air sampling system cycles between 3 sampling lines; one line in each methane pen (east and west), and one line on the south side of the methane barn to get an ambient supply. Each cycle lasts 20 minutes with 2 minutes in the ambient line, 6 minutes in the west line, 6 minutes in the ambient line, 6 minutes in the east line. This cycles continues non- stop on this 20- minute loop. The ambient line is used in part to flush the system between pen measurements as well as to gather baseline environmental gas measurements.
The 8 pens of steers are rotated through the barn on a weekly basis by block, with two pens in the barn at a time, with both treatments being present in the barn at all times. The steers entered the barn on Thursdays, and were removed on Tuesdays, yielding 5 days of measurements. The barn then sits empty on Tuesday just reading manure gas production without cattle pres-ent. On Wednesday am, pens were scraped
level of intake, which is what was done in this growing trial. The amount of feed consumed is well documented as being highly correlated with amount of methane produced. Most previous methane work has been done in head boxes or calorimetry chambers on individual animals. This study was done in the methane barn, which is two enclosed dry lot pens that hold 10 head per pen. The methane barn is monitored for methane and carbon dioxide production every second that the cattle are in the pens. Therefore this method is closer to a produc-tion level setting whereas other methods commonly used are small- scale methods.
The objective of this study was verify if the newly constructed methane barn was correctly measuring methane production and if the measurements were realistic using steers fed at two levels of intake to create differences in methane production.
Procedure
A 105- day growing study was conduct-ed using 80 steers (initial BW = 603 ± 97 lb.) fed on a rotation between their feedlot pens and the methane monitoring barns. Five days before the trial began, cattle were limit- fed a common diet of 50% alfalfa and 50% Sweet Bran® at 2% of BW. They were weighed 2 consecutive days and the weights were averaged to get an accurate initial BW. Steers were blocked by body weight and assigned to one of two treatments (Table 1), with 40 steers per treatment. There were 4 blocks with 2 pens per block and 2 treat-ments, thus the study design is a random-ized complete block design (RCBD). The two treatments were ad- libitum intake or limit fed steers fed the same diet. Treatment effects were evaluated for methane produc-tion and growth performance. Performance and emissions data were analyzed using the MIXED procedure of SAS (SAS Institute, Inc., Cary, N.C.) with pen being the exper-imental unit.
The limit fed steers were fed 75% of the ad- libitum cattle’s intake from the week pri-
Tom M. WindersBrad M. Boyd
Henry F. HilscherSamodha C. Fernando
Rick R. StowellGalen E. Erickson
Summary
A study was conducted to evaluate the impact that level of intake has on methane and carbon dioxide production by growing steers. Two treatments were evaluated that included ad- libitum intake compared to limit- fed steers. The ad- libitum fed cattle had greater gains, similar feed efficiency and produced more methane and carbon dioxide per day, while the limit fed cattle produced more methane and carbon dioxide per pound of intake than the ad- libitum fed cattle.
Introduction
Methane production through enteric fermentation in the rumen by cattle has received a lot of attention as an envi-ronmental concern. Methane is a potent greenhouse gas with negative impacts on the environment and is an energetic loss to the animal. Methane and carbon dioxide (CO2) are by- products of volatile fatty acid (acetate, butyrate, and propionate) produc-tion created by the microbes in the rumen. Acetate and butyrate formation promotes methane and carbon dioxide production because they produce net H2 in the rumen that needs to be eructated as CH4 or CO2, while propionate, an electron acceptor, does not net any hydrogens during formation and therefore does not contribute to methane production. Favoring propionate production by feeding more concentrates in the diet has been shown to decrease meth-ane production in cattle.
Another way to manipulate meth-ane production is by reducing the steers’
Impact of Intake on Methane Production in Growing Steers
Table 1. Dietary treatment for steers that were either ad- libitum or limit fed (DM basis)
Treatment
Ad- Libitum Limit Fed3
Alfalfa 45 45
Sorghum Silage 30 30
MDGS1 22 22
Supplement2 3 31MDGS = modified distillers grains plus solubes2 Formulated to contain 200 mg/d monensin3Fed 75% of Ad- libitum intake from previous week
56 · 2018 Nebraska Beef Cattle Report
dioxide production was significantly higher (P< 0.01) and methane tended to be higher (P = 0.08) for empty pens with manure than empty pens without manure (Table 3). This occurs because cattle manure, although in small amounts, produces methane and car-bon dioxide due to fermentation of organic matter in the manure. All data reported in tables 2 and 3 have ambient levels of methane and carbon dioxide removed from the levels measured in each pen to get true animal production of gas. Carbon dioxide and methane production are thought to be highly correlated, and therefore one can be determined based on a ratio if the other is known. Many studies have been done using carbon dioxide numbers to estimate methane numbers, but in this study it was found that the ratio was significantly differ-ent between treatments (P = 0.02), implying that intake level can alter the ratio.
All of the gas production results shown in tables 2 and 3 are pen totals divided by ten to get individual totals. Results are presented in grams to be consistent with how other work presents gas production in cattle. This trial accomplished its two goals: verify if ad- libitum cattle produce more carbon dioxide and methane, as well as confirm that the methane barn is robust enough to pick up differing amounts of methane and carbon dioxide produced in each pen. Ad- libitum cattle produced more methane and carbon dioxide per day than limit fed cattle, however the limit fed cattle produced more methane and carbon diox-ide per unit of intake than the Ad- libitum cattle. Producers should feed Ad- libitum rather than restrict intakes to get better growth performance, but will be producing more total methane and carbon dioxide in the process.
Tom M. Winders, graduate student
Brad M. Boyd, research technician
Henry F. Hilscher, feedlot manager
Samodha C. Fernando, assistant professor
Rick R. Stowell, associate professor
Galen E. Erickson, professor, University of Nebraska– Lincoln, Department of Animal Science
gain ratio was not different between treat-ments (P ≥ 0.36).
Emissions
Gas production results (Table 2) show that the ad- libitum cattle produced more grams of carbon dioxide (P= 0.04) and methane (P< 0.01) per head per day than the limit fed cattle. Gas production per pound of DMI was statistically different for carbon dioxide (P = 0.01) and tended to be different for methane (P = 0.06) with the limit fed calves producing more carbon dioxide and methane than the ad- libitum cattle when corrected for DMI amounts. When analyzed as an amount per lb. of gain, no differences for carbon dioxide (P ≥ 0.12) or methane (P ≥ 0.46) production were observed between treatments. Carbon
clean and sit empty, taking measurements on no cattle and no manure. Based on this rotation, 4 weeks are required to monitor all 8 pens through the barn (one turn) to determine emissions. This study lasted 105 days (3 turns) but just one turn of gas mea-surements were usable due to monitoring errors for methane in the first two turns.
Results
Performance
Performance results (Table 2) from this growing period show that the ad- libitum cattle had greater feed intakes and gains (P< 0.01) compared to limit fed cattle. Although not statistically significant, the ad- libitum cattle had numerically heavier ending BW compared to limit fed cattle. The feed to
Table 2. The effect of level of intake in growing steers on performance and methane production
Treatments
Ad- Libitum Limit SEM P- value
Performance
Initial BW, lb 603 602 24.7 0.99
Ending BW, lb 842 786 23.8 0.15
DMI, lb 18.4 13.6 0.32 <0.01
ADG, lb 2.28 1.75 0.04 <0.01
F:G 8.10 7.83 0.18 0.36
Gas Production
C02 g/d 6831 6032 163 0.04
CH4 g/d 156.2 125.6 2.29 <0.01
CO2 g/lb/DMI 370.8 441.9 10.2 0.02
CH4 g/lb/DMI 8.48 9.19 0.17 0.06
CO2 g/lb/ADG 3004 3465 151 0.12
CH4 g/lb/ADG 68.7 72.1 0.06 0.46
CH4:CO2 0.023 0.021 .0003 0.02
Table 3. Gas production from manure vs. no manure
Manure vs. No Manure
Manure No Manure SEM P- value
CO2 g/d 555 456 16.7 <0.01
CH4 g/d 0.34 0.20 0.05 0.08
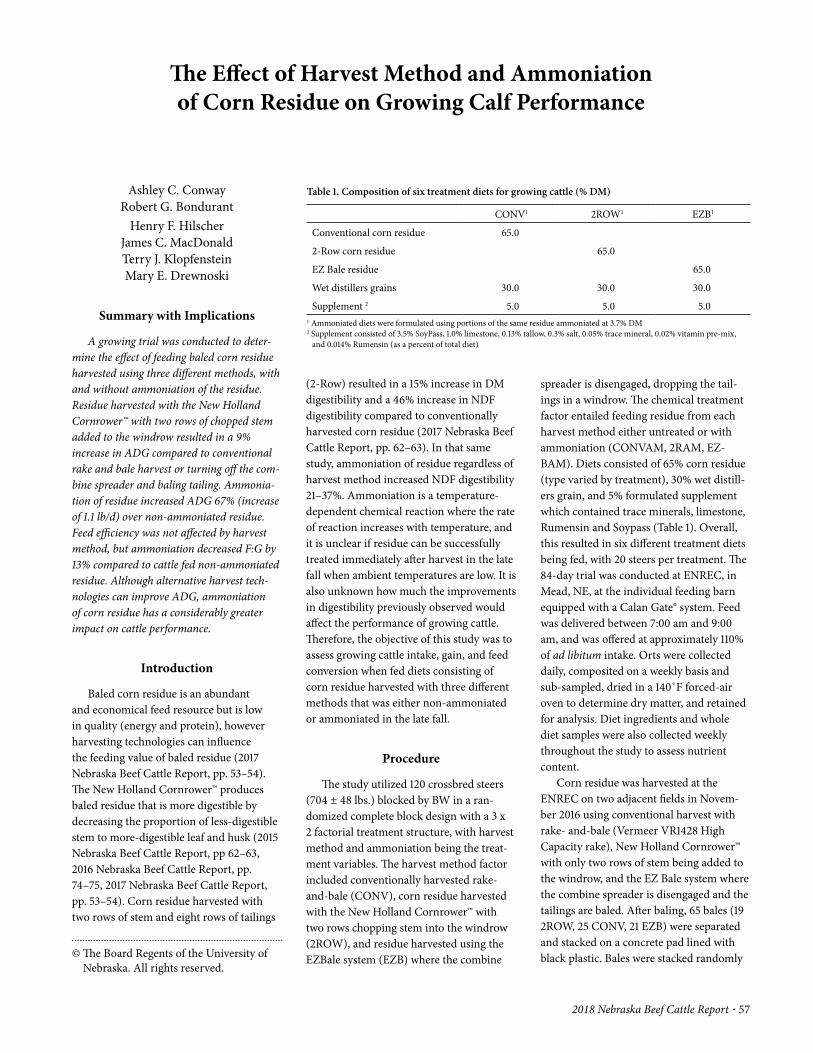
2018 Nebraska Beef Cattle Report · 57
© The Board Regents of the University of Nebraska. All rights reserved.
spreader is disengaged, dropping the tail-ings in a windrow. The chemical treatment factor entailed feeding residue from each harvest method either untreated or with ammoniation (CONVAM, 2RAM, EZ-BAM). Diets consisted of 65% corn residue (type varied by treatment), 30% wet distill-ers grain, and 5% formulated supplement which contained trace minerals, limestone, Rumensin and Soypass (Table 1). Overall, this resulted in six different treatment diets being fed, with 20 steers per treatment. The 84- day trial was conducted at ENREC, in Mead, NE, at the individual feeding barn equipped with a Calan Gate® system. Feed was delivered between 7:00 am and 9:00 am, and was offered at approximately 110% of ad libitum intake. Orts were collected daily, composited on a weekly basis and sub- sampled, dried in a 140˚F forced- air oven to determine dry matter, and retained for analysis. Diet ingredients and whole diet samples were also collected weekly throughout the study to assess nutrient content.
Corn residue was harvested at the ENREC on two adjacent fields in Novem-ber 2016 using conventional harvest with rake- and- bale (Vermeer VR1428 High Capacity rake), New Holland Cornrower™ with only two rows of stem being added to the windrow, and the EZ Bale system where the combine spreader is disengaged and the tailings are baled. After baling, 65 bales (19 2ROW, 25 CONV, 21 EZB) were separated and stacked on a concrete pad lined with black plastic. Bales were stacked randomly
(2- Row) resulted in a 15% increase in DM digestibility and a 46% increase in NDF digestibility compared to conventionally harvested corn residue (2017 Nebraska Beef Cattle Report, pp. 62– 63). In that same study, ammoniation of residue regardless of harvest method increased NDF digestibility 21– 37%. Ammoniation is a temperature- dependent chemical reaction where the rate of reaction increases with temperature, and it is unclear if residue can be successfully treated immediately after harvest in the late fall when ambient temperatures are low. It is also unknown how much the improvements in digestibility previously observed would affect the performance of growing cattle. Therefore, the objective of this study was to assess growing cattle intake, gain, and feed conversion when fed diets consisting of corn residue harvested with three different methods that was either non- ammoniated or ammoniated in the late fall.
Procedure
The study utilized 120 crossbred steers (704 ± 48 lbs.) blocked by BW in a ran-domized complete block design with a 3 x 2 factorial treatment structure, with harvest method and ammoniation being the treat-ment variables. The harvest method factor included conventionally harvested rake- and- bale (CONV), corn residue harvested with the New Holland Cornrower™ with two rows chopping stem into the windrow (2ROW), and residue harvested using the EZBale system (EZB) where the combine
Ashley C. ConwayRobert G. Bondurant
Henry F. HilscherJames C. MacDonaldTerry J. KlopfensteinMary E. Drewnoski
Summary with Implications
A growing trial was conducted to deter-mine the effect of feeding baled corn residue harvested using three different methods, with and without ammoniation of the residue. Residue harvested with the New Holland Cornrower™ with two rows of chopped stem added to the windrow resulted in a 9% increase in ADG compared to conventional rake and bale harvest or turning off the com-bine spreader and baling tailing. Ammonia-tion of residue increased ADG 67% (increase of 1.1 lb/d) over non- ammoniated residue. Feed efficiency was not affected by harvest method, but ammoniation decreased F:G by 13% compared to cattle fed non- ammoniated residue. Although alternative harvest tech-nologies can improve ADG, ammoniation of corn residue has a considerably greater impact on cattle performance.
Introduction
Baled corn residue is an abundant and economical feed resource but is low in quality (energy and protein), however harvesting technologies can influence the feeding value of baled residue (2017 Nebraska Beef Cattle Report, pp. 53– 54). The New Holland Cornrower™ produces baled residue that is more digestible by decreasing the proportion of less- digestible stem to more- digestible leaf and husk (2015 Nebraska Beef Cattle Report, pp 62– 63, 2016 Nebraska Beef Cattle Report, pp. 74– 75, 2017 Nebraska Beef Cattle Report, pp. 53– 54). Corn residue harvested with two rows of stem and eight rows of tailings
The Effect of Harvest Method and Ammoniation of Corn Residue on Growing Calf Performance
Table 1. Composition of six treatment diets for growing cattle (% DM)
CONV1 2ROW1 EZB1
Conventional corn residue 65.0
2- Row corn residue 65.0
EZ Bale residue 65.0
Wet distillers grains 30.0 30.0 30.0
Supplement 2 5.0 5.0 5.01 Ammoniated diets were formulated using portions of the same residue ammoniated at 3.7% DM2 Supplement consisted of 3.5% SoyPass, 1.0% limestone, 0.13% tallow, 0.3% salt, 0.05% trace mineral, 0.02% vitamin pre- mix,
and 0.014% Rumensin (as a percent of total diet)

58 · 2018 Nebraska Beef Cattle Report
sidered leaf (due to excessive leaf shatter), and the remaining chaff was weighed. Each plant part was weighed, and sub- samples from each part were collected and dried in a 140˚F forced- air oven to determine DM. Proportion of each plant part was calculat-ed with DM adjustments for each part.
Data were analyzed using the MIXED procedure in SAS 9.2 and significance was declared at α = 0.05, with tendencies declared at P < 0.10. Block, harvest method and ammoniation and interactions were tested as fixed effects and animal was the experimental unit. Response variables included final BW, ADG, F:G, and intake. Plant part data were analyzed with harvest method as the fixed effect and bale as the experimental unit using the MIXED procedure.
Results
There were no significant interactions between harvest method and ammoniation. Harvest method affected ending BW (P < 0.01), with cattle fed 2ROW having greater ending BW than CONV and EZB (Table 2). Significant effects were observed for ADG due to harvest method (P < 0.01). There was no difference (P = 0.27) in ADG between CONV and EZB, but 2ROW cattle gained more than CONV and EZB (P ≤ 0.03). There was no effect of harvest method on F:G (P = 0.35). Intake as a percent of BW was significantly different between harvest methods (P < 0.01) with cattle eating 2ROW residue consuming a greater (P =0.02) percent of their BW compared to CONV and tending to consume more than EZB (P = 0.10), which did not differ (P = 0.48).
Ending BW, ADG, and intake as percent of BW were greater for steers fed ammoniated residues compared to non- ammoniated residues (P <0.01). There was a significant improvement in F:G due to ammoniation (P < 0.01), where non- ammoniated residue resulted in a F:G of 6.55 and ammoniation decreased this value to 5.66.
Plant parts differed by harvest method (Table 4). There was a tendency for changes in proportions of leaf in the bales (P = 0.065), with no difference between CONV (37.5%) and EZB (32.6%), but 2ROW containing less leaf (25.0%). There was no difference in the proportion of husk due
Animal Health, Inc.) on day 0. At the end of the feeding period, they were limit fed with the same alfalfa/Sweetbran® diet for 5 days before collecting three- day weights to determine ending BW.
Bulk samples from bales of each harvest method were collected at feeding to assess the proportions of each plant part in the bales. Total samples were weighed and residue was hand separated into husk, leaf (with shank), stem and cob. Residual chaff at the bottom of each sample bag was sep-arated through a 0.04” screen. The residue not passing through the screen was con-
in a 4 x 3 bale arrangement, covered with black plastic and sealed, and ammoniated with anhydrous ammonia at 3.7% of DM from 12- Nov- 2016 to 11- Jan- 2017 (60 days). Data- logging temperature probes were placed next to the stack to record ambient temperature during the ammoniation peri-od. At feeding, bales were ground through a 3” screen. Steers were limit- fed at 2% of BW a diet of alfalfa hay and wet corn gluten feed (Sweetbran®, Cargill, Inc.) prior to the start of the trial, and three- day empty body weights were collected on day,- 1, 0 and 1. Steers were implanted with Ralgro® (Merck
Table 2. Summary of cattle performance when fed corn residue harvested conventionally (CONV), EZ baled (EZB), or with two rows selecting for husk and leaf components (2ROW) as affected by harvest method.
CONV 2ROW EZB SEM P- values1
Initial BW, lb 701 703 703 3.42 0.39
Ending BW, lb 879b 901a 887b 11.5 0.01
DMI, lb/d 12.6b 13.6a 12.9b 0.23 0.02
ADG, lb/d 2.11b 2.34a 2.19b 0.049 0.01
F:G 6.25 5.93 6.08 - 0.35
Total Diet DMI, % of BW 1.59b 1.68a 1.62a 0.027 0.051 Means with differing superscripts within row are significantly different (P < 0.05)
Table 3. Summary of cattle performance when fed corn residue harvested conventionally (CONV), EZ baled (EZB), or with two rows selecting for husk and leaf components (2ROW) as affected by ammoniation
Untreated Ammoniated1 SEM P- values
Initial BW, lbs 703 702 3.42 0.66
Ending BW, lbs 842 935 11.5 <0.01
DMI, lb/d 10.5 15.5 0.19 <0.01
ADG, lbs/d 1.66 2.77 0.05 <0.01
F:G 6.52 5.66 - <0.01
Total diet intake, % of BW 1.36 1.90 0.022 <0.011 Corn residue ammoniated at 3.7% DM
Table 4. Average proportions of corn plant parts found in corn residue bales of conventionally baled residue, 2- Row harvested residue, and EZ baled residue.
CONV 2ROW EZB SEM P- value
Husk, % 12.3 14.7 16.3 2.47 0.576
Leaf, % 37.5 25.0 32.6 2.25 0.065
Stem, % 31.6a 13.0c 24.5b 1.13 0.003
Cob, % 6.9b 27.2a 14.5b 2.35 0.020
Chaff1, % 1.80 1.02 1.42 0.684 0.7471 Proportion of sample that was passed through a 0.04 in screen separator, primarily consisting of soil and inseparable plant
material2 Bale sample was experimental unit (n = 2 per harvest method), means with differing superscripts within row are significantly
different (P < 0.05)

2018 Nebraska Beef Cattle Report · 59
to harvest method (P = 0.58), with husk percentage for CONV, 2ROW and EZB averaging 12.3, 14.7 and 16.3% respectively. However, harvest method did change the proportion of both stem and cob in the bales (P = 0.01 and 0.02). The CONV bales contained 31.6% stem, EZB contained 24.5% stem, and 2ROW contained 13.0% stem and all values were significantly different from one another. Conversely, 2ROW contained the most cob proportionally at 27.2%, EZB was less at 14.4%, and CONV tended to be less than (P = 0.06) EZB at 6.9%. In this study, the more digestible plant parts (leaf and husk) were not significantly affected by harvest method, but the less digestible parts (stem and cob) were affected. While the proportion of stem decreased with al-ternative harvest technologies compared to conventional rake and bale, the proportion of cob increased in the bale.
Conclusions
As observed in previous studies, corn residue harvested with the New Holland Cornrower™ with two chopped rows of stem results in a more digestible baled product compared to conventionally harvested residue. This enhanced feeding value lead to a 6% increase in intake and a 9% increase in ADG, but no improvement feed efficiency. There was no difference in gains between the EZ bale residue and the conventional residue and husk. The ammoniation of the corn residue increased ADG by 67% and decreased F:G by 13% across all harvest methods. Ammoniation did not interact with the various harvest methods to have an impact on animal performance, and it appears that the average ambient tem-perature of 36˚F (average low of 27.1˚ and average high of 49.8˚) during the initial 30 days of the ammoniation period did not in-hibit the ammoniation reaction. Increasing the length of exposure time to the ammonia
appears to compensate for the reduction in ambient temperature, indicating that similar responses can be achieved when ammoniating at lower temperatures. In conclusion, ammoniation of corn residue, regardless of harvest method, is a valuable tool to enhance the performance of growing cattle fed corn residue, and can be success-fully done in the late fall after corn harvest.
Ashley C. Conway, graduate student, Lincoln
Robert G. Bondurant, research technician, Lincoln
Henry F. Hilscher, feedlot manager, Mead
James C. MacDonald, associate professor, animal science, Lincoln
Terry J. Klopfenstein, professor, animal science, Lincoln
Mary E. Drewnoski, assistant professor, UNL Department of Animal Science, Lincoln, Neb.

60 · 2018 Nebraska Beef Cattle Report
© The Board Regents of the University of Nebraska. All rights reserved.
leaves did not differ (P ≥ 0.09) in digest-ibility, ranging from 81 to 90% IVOMD and were more (P < 0.01) digestible than oats which ranged from 67 to 79% IVOMD (Figure 1). Within species, the digestibility in November and December did not differ (P ≥ 0.17) but decreased from December to January (P < 0.01). The digestibility of oats appeared to decline more (10% unit decline) than turnip and radish leaves (5% unit decrease) however, the digestibility of oats in January was still high (67 % IVOMD). As a reference, good quality bromegrass hay is typically about 55 to 60% digestible.
There was also a year by species in-teraction for IVOMD. The digestibility of oats was significantly less in year 2 than year 1 (69% vs 80% IVOMD, respectively) when the forage was planted 18 days earlier but digestibility of turnip and radish leaf (85– 87% IVOMD) did not differ (P ≥ 0.25) among year within species.
There was a tendency for a plant species by month interaction (P = 0.07) for NDF content (Figure 1). Over the winter, oats were consistently greater (P < 0.01), ranging from 48– 66% NDF, than both radish leaf and turnip leaf which ranged from 21 to 44 % NDF. The NDF content of the brassicas leaves (radish and turnip) in November and December were quite low (21 to 26 % NDF), being more similar to a concentrate than a forage. For instance, mid- bloom bromegrass hay typically has around 58% NDF and corn grain has about 10% NDF. The NDF content of all species increased (P
how the quality of this forage resource changes throughout the winter.
Procedure
This experiment took place at the Meat Animal Research Center near Clay Center, Nebraska. An oats, turnip, and radish cover crop mix was planted on irrigated pivots. In 2014– 2015, (year 1) these crops were planted September 8th. In 2015– 2016, (year 2) these cover crops were planted August 25th. Oats, turnip tops, and radish tops were collected on November 6, December 9, and January 13, in year 1, and October 22, December 10, and January 14, in year 2. In both years, the first frost occurred on October 29th. In year 1, turnip and radish root samples were not collected, but root samples were success-fully collected in year 2. After collection, samples were immediately put on ice and frozen for a minimum of 24 hours before drying. The samples were freeze dried and subsequently ground to a 1 mm particle size through a Wiley mill. Nutrient analyses were conducted to evaluate crude protein (CP), total ethanol soluble carbohydrates (TES), neutral detergent fiber (NDF), or-ganic matter (OM), in- vitro organic matter digestibility (IVOMD), and sulfur.
Results
The digestibility of the cover crop mix was high throughout the winter for all spe-cies. In each month, the turnip and radish
Mary E. LenzJordan L. Cox
Kristen E. HalesHannah C. WilsonMary E. Drewnoski
Summary with Implications
Oat, radish, and turnip samples were taken on pivots being grazed from November through January in Clay Center, Nebraska. The objective was to determine how the quality changed throughout the winter. The forage was observed to be high- quality (highly digestibility with moderate CP content). Digestibility did decline over this period but minimal changes in CP content were observed. From early November to early January, the digestibility of oats appeared to decline more (10% unit decline) than turnip and radish leaves (5% unit decrease). However, digestibility (67% IVOMD) and CP content (15%) of oats in early January were still as high as a good quality grass hay. Bras-sica (radish and turnip) leaves were more similar to a concentrate (81– 83% IVOMD and 23– 26% CP) even in January. Thus, even though the forage changed color from green to brown after hard freezes, the forage still had good feed value in January.
Introduction
Cover crops are frequently grown for agronomic and conservation benefits, but there is also potential for cattle producers to utilize this forage resource. Late summer planted cover crops are available to graze in the winter, but the quality of these cover crops as a feed, and how the quality of this feed changes after cold temperatures causes growth to cease, has not been well estab-lished. Therefore, the objective of this study was to 1) quantify and better understand the quality of oats and brassicas as a forage resource in the winter; and 2) to evaluate
Late Summer Planted Oat- Brassica Forage Quality Changes during Winter Grazing
Table 1. Year 2 Nutrient Composition Averages
OatsRadish
LeafTurnip
LeafRadish Root
Turnip Root SEM P- value
OM % (DM Basis) 89a 81c 81c 86b 90a 1.1 <0.01
IVOMD % (OM Basis) 69d 86c 88c 92b 95a 1.6 <0.01
NDF % (DM Basis) 58a 35b 29c 22d 16e 1.2 <0.01
TES % (DM Basis) 13c 8d 14c 32b 50a 2.5 <0.01
CP % (DM Basis) 10d 24a 20b 17c 14c 1.4 <0.01
Sulfur % (DM Basis) 0.30e 0.95b 0.82c 1.04a 0.69d 0.035 <0.01a- e Values within row without the same superscript differ.
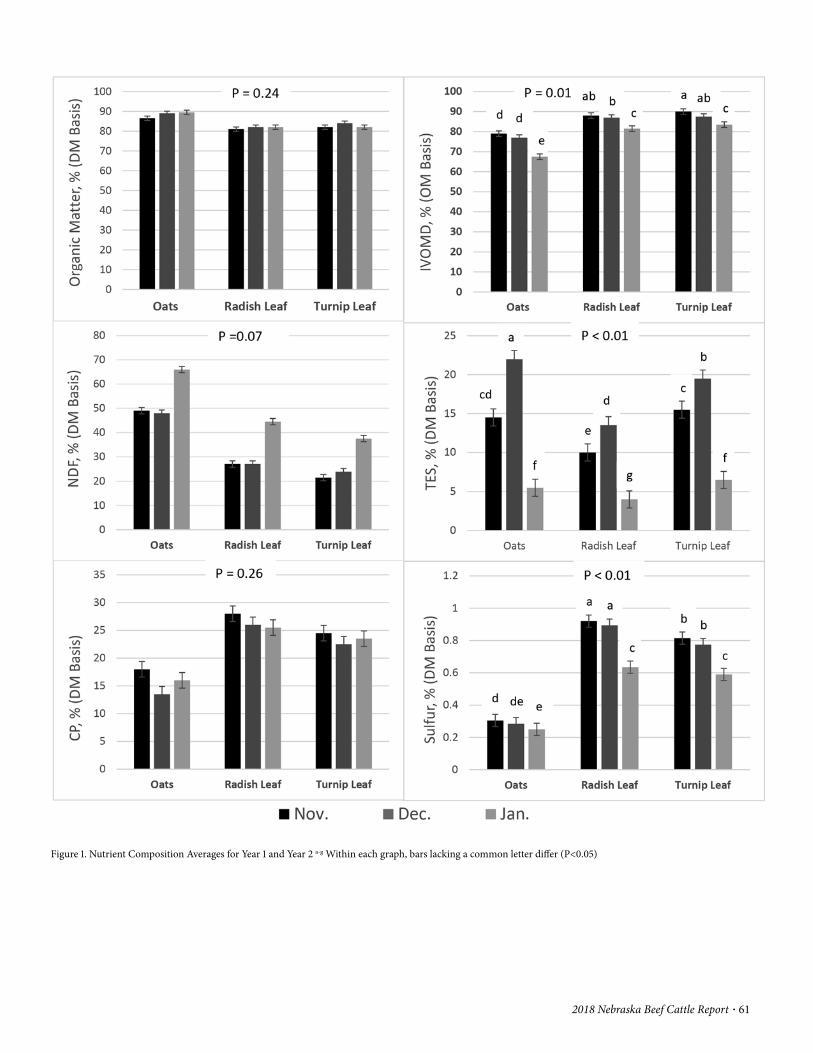
2018 Nebraska Beef Cattle Report · 61
Figure 1. Nutrient Composition Averages for Year 1 and Year 2 a- g Within each graph, bars lacking a common letter differ (P<0.05)

62 · 2018 Nebraska Beef Cattle Report
< 0.01) in January by 14 to 17% units. There was also a species by year interaction (P < 0.01) for NDF. The NDF content of all spe-cies was greater in year 2, due to the earlier planting date, than in year 1 but turnip had less of an increase (2.3% units) than oats (6% units) and radish (5% units).
Total ethanol soluble carbohydrates (TES) had a significant (P < 0.01) plant spe-cies by month by year interaction. Soluble carbohydrates for all species peaked, rang-ing from 17– 22% TES in December in year 1 (P < 0.01), and dramatically decreased (P < 0.01) to 5– 6% in January. In year two, this trend was the same for oats and turnip leaves (P < 0.01), but radish leaves did not differ (P = 0.78) in TES from November (9.1%) to December (10.6 %) although there was a numerical increase. Like year 1, the TES content of all species decreased (P < 0.01) dramatically from December to January in year 2. These data suggest that following initial frost, photosynthe-sis continued and soluble carbohydrates continued to increase through the month of November. Then, weathering in December caused much of the soluble carbohydrates to be lost. The TES content of forage is an indicator of sugar content, which is 100% digestible and is digested rapidly in the rumen. The relatively low NDF and high soluble carbohydrate content of these forag-es explain the high digestibility observed.
There was no date by species interaction (P = 0.26) for CP but there was a significant year by species (P < 0.01) interaction. How-ever, all species had lesser CP content (P < 0.01) in year 2 when the forage was planted earlier (Aug. 25th) than in year 1 (Sept 8th). There was a date by year (P < 0.01) interaction with CP content of all species decreasing from November to December in both years (5% units in year 1 and 2% units in year 2). However, from December to January CP content increased in year 1 (5% units) and continued to decrease in year 2 (2% units). The increase in November in year 2 is likely due to the mild weather and continued plant uptake of N.
There was a significant species by date interaction in S content (P < 0.01). However, across all dates the S content of oats was less than radish and turnip, which were extremely high. Although there was a substantial decrease in S, the brassicas in January still contained extremely high levels of S. The maximum tolerable level of S is suggested to be 0.5%, indicating intake of only brassicas could potentially cause S tox-icity. Given the much lower concentrations of S in the grass (oats) and the higher NDF (greater levels of NDF in the diet have been shown to decrease risk of toxicity) mixing a grass in with brassicas for grazing would be recommended.
When comparing the root and leaf of
brassicas in year 2, the roots were more digestible and were lower in NDF and CP than the leaves (Table 1).
Conclusion
Digestibility and CP content of brassica leaves is greater than oats, although oats were quite digestible and contained mod-erate CP content. The digestibility of all species decreased over the winter with the largest decrease during December. How-ever, all forages were still highly digestible in January. Minimal change in CP content was observed over the winter. Therefore, even though the forage changes color from green to brown over the winter, the forage continues to have good feed value. Turnip and radish leaves and roots are more com-parable to a concentrate than roughage as they were highly digestible and low in fiber and when coupled with the high S content, it is recommended that they are mixed with a grass.
M. E. Lenz, graduate student
J. L. Cox, graduate student
Kristen E. Hales, Meat Animal Research Center, Clay Center, Neb.
Hannah C. Wilson, research technician
Mary E. Drewnoski, assistant professor, University of Nebraska– Lincoln, Department of Animal Science
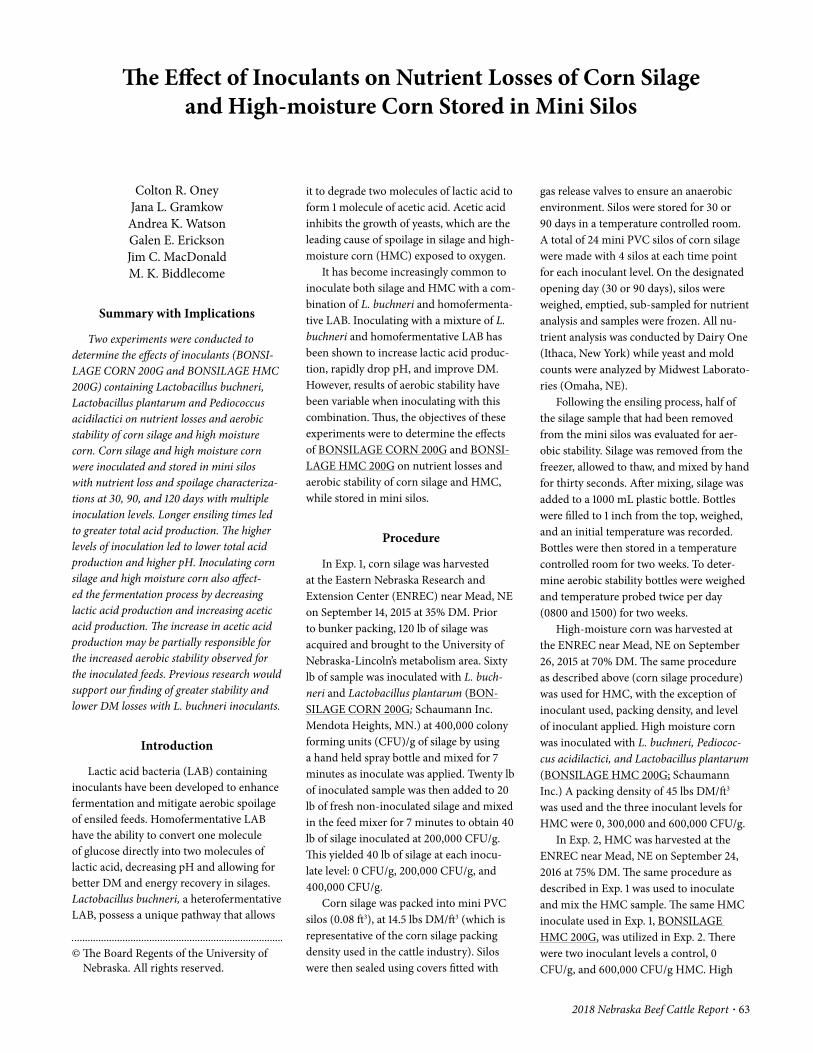
2018 Nebraska Beef Cattle Report · 63
© The Board Regents of the University of Nebraska. All rights reserved.
The Effect of Inoculants on Nutrient Losses of Corn Silage and High- moisture Corn Stored in Mini Silos
Colton R. OneyJana L. GramkowAndrea K. WatsonGalen E. EricksonJim C. MacDonaldM. K. Biddlecome
Summary with Implications
Two experiments were conducted to determine the effects of inoculants (BONSI-LAGE CORN 200G and BONSILAGE HMC 200G) containing Lactobacillus buchneri, Lactobacillus plantarum and Pediococcus acidilactici on nutrient losses and aerobic stability of corn silage and high moisture corn. Corn silage and high moisture corn were inoculated and stored in mini silos with nutrient loss and spoilage characteriza-tions at 30, 90, and 120 days with multiple inoculation levels. Longer ensiling times led to greater total acid production. The higher levels of inoculation led to lower total acid production and higher pH. Inoculating corn silage and high moisture corn also affect-ed the fermentation process by decreasing lactic acid production and increasing acetic acid production. The increase in acetic acid production may be partially responsible for the increased aerobic stability observed for the inoculated feeds. Previous research would support our finding of greater stability and lower DM losses with L. buchneri inoculants.
Introduction
Lactic acid bacteria (LAB) containing inoculants have been developed to enhance fermentation and mitigate aerobic spoilage of ensiled feeds. Homofermentative LAB have the ability to convert one molecule of glucose directly into two molecules of lactic acid, decreasing pH and allowing for better DM and energy recovery in silages. Lactobacillus buchneri, a heterofermentative LAB, possess a unique pathway that allows
it to degrade two molecules of lactic acid to form 1 molecule of acetic acid. Acetic acid inhibits the growth of yeasts, which are the leading cause of spoilage in silage and high- moisture corn (HMC) exposed to oxygen.
It has become increasingly common to inoculate both silage and HMC with a com-bination of L. buchneri and homofermenta-tive LAB. Inoculating with a mixture of L. buchneri and homofermentative LAB has been shown to increase lactic acid produc-tion, rapidly drop pH, and improve DM. However, results of aerobic stability have been variable when inoculating with this combination. Thus, the objectives of these experiments were to determine the effects of BONSILAGE CORN 200G and BONSI-LAGE HMC 200G on nutrient losses and aerobic stability of corn silage and HMC, while stored in mini silos.
Procedure
In Exp. 1, corn silage was harvested at the Eastern Nebraska Research and Extension Center (ENREC) near Mead, NE on September 14, 2015 at 35% DM. Prior to bunker packing, 120 lb of silage was acquired and brought to the University of Nebraska- Lincoln’s metabolism area. Sixty lb of sample was inoculated with L. buch-neri and Lactobacillus plantarum (BON-SILAGE CORN 200G; Schaumann Inc. Mendota Heights, MN.) at 400,000 colony forming units (CFU)/g of silage by using a hand held spray bottle and mixed for 7 minutes as inoculate was applied. Twenty lb of inoculated sample was then added to 20 lb of fresh non- inoculated silage and mixed in the feed mixer for 7 minutes to obtain 40 lb of silage inoculated at 200,000 CFU/g. This yielded 40 lb of silage at each inocu-late level: 0 CFU/g, 200,000 CFU/g, and 400,000 CFU/g.
Corn silage was packed into mini PVC silos (0.08 ft3), at 14.5 lbs DM/ft3 (which is representative of the corn silage packing density used in the cattle industry). Silos were then sealed using covers fitted with
gas release valves to ensure an anaerobic environment. Silos were stored for 30 or 90 days in a temperature controlled room. A total of 24 mini PVC silos of corn silage were made with 4 silos at each time point for each inoculant level. On the designated opening day (30 or 90 days), silos were weighed, emptied, sub- sampled for nutrient analysis and samples were frozen. All nu-trient analysis was conducted by Dairy One (Ithaca, New York) while yeast and mold counts were analyzed by Midwest Laborato-ries (Omaha, NE).
Following the ensiling process, half of the silage sample that had been removed from the mini silos was evaluated for aer-obic stability. Silage was removed from the freezer, allowed to thaw, and mixed by hand for thirty seconds. After mixing, silage was added to a 1000 mL plastic bottle. Bottles were filled to 1 inch from the top, weighed, and an initial temperature was recorded. Bottles were then stored in a temperature controlled room for two weeks. To deter-mine aerobic stability bottles were weighed and temperature probed twice per day (0800 and 1500) for two weeks.
High- moisture corn was harvested at the ENREC near Mead, NE on September 26, 2015 at 70% DM. The same procedure as described above (corn silage procedure) was used for HMC, with the exception of inoculant used, packing density, and level of inoculant applied. High moisture corn was inoculated with L. buchneri, Pediococ-cus acidilactici, and Lactobacillus plantarum (BONSILAGE HMC 200G; Schaumann Inc.) A packing density of 45 lbs DM/ft3 was used and the three inoculant levels for HMC were 0, 300,000 and 600,000 CFU/g.
In Exp. 2, HMC was harvested at the ENREC near Mead, NE on September 24, 2016 at 75% DM. The same procedure as described in Exp. 1 was used to inoculate and mix the HMC sample. The same HMC inoculate used in Exp. 1, BONSILAGE HMC 200G, was utilized in Exp. 2. There were two inoculant levels a control, 0 CFU/g, and 600,000 CFU/g HMC. High
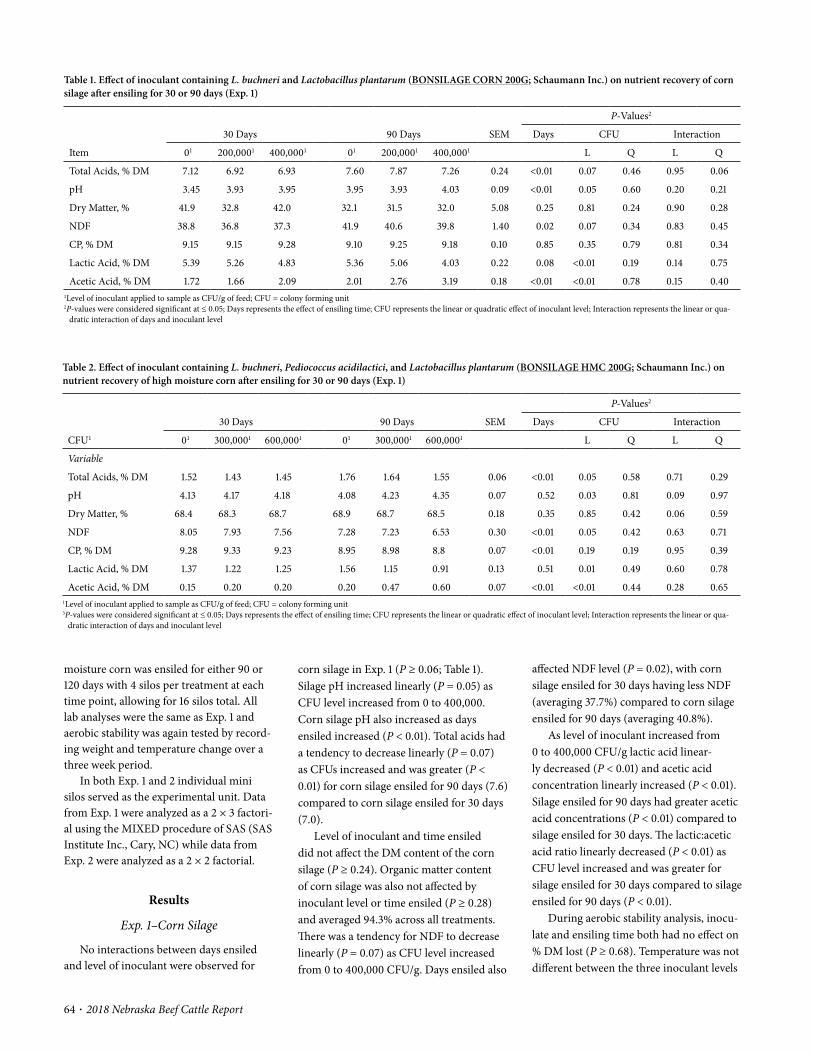
64 · 2018 Nebraska Beef Cattle Report
affected NDF level (P = 0.02), with corn silage ensiled for 30 days having less NDF (averaging 37.7%) compared to corn silage ensiled for 90 days (averaging 40.8%).
As level of inoculant increased from 0 to 400,000 CFU/g lactic acid linear-ly decreased (P < 0.01) and acetic acid concentration linearly increased (P < 0.01). Silage ensiled for 90 days had greater acetic acid concentrations (P < 0.01) compared to silage ensiled for 30 days. The lactic:acetic acid ratio linearly decreased (P < 0.01) as CFU level increased and was greater for silage ensiled for 30 days compared to silage ensiled for 90 days (P < 0.01).
During aerobic stability analysis, inocu-late and ensiling time both had no effect on % DM lost (P ≥ 0.68). Temperature was not different between the three inoculant levels
corn silage in Exp. 1 (P ≥ 0.06; Table 1). Silage pH increased linearly (P = 0.05) as CFU level increased from 0 to 400,000. Corn silage pH also increased as days ensiled increased (P < 0.01). Total acids had a tendency to decrease linearly (P = 0.07) as CFUs increased and was greater (P < 0.01) for corn silage ensiled for 90 days (7.6) compared to corn silage ensiled for 30 days (7.0).
Level of inoculant and time ensiled did not affect the DM content of the corn silage (P ≥ 0.24). Organic matter content of corn silage was also not affected by inoculant level or time ensiled (P ≥ 0.28) and averaged 94.3% across all treatments. There was a tendency for NDF to decrease linearly (P = 0.07) as CFU level increased from 0 to 400,000 CFU/g. Days ensiled also
moisture corn was ensiled for either 90 or 120 days with 4 silos per treatment at each time point, allowing for 16 silos total. All lab analyses were the same as Exp. 1 and aerobic stability was again tested by record-ing weight and temperature change over a three week period.
In both Exp. 1 and 2 individual mini silos served as the experimental unit. Data from Exp. 1 were analyzed as a 2 × 3 factori-al using the MIXED procedure of SAS (SAS Institute Inc., Cary, NC) while data from Exp. 2 were analyzed as a 2 × 2 factorial.
Results
Exp. 1– Corn Silage
No interactions between days ensiled and level of inoculant were observed for
Table 1. Effect of inoculant containing L. buchneri and Lactobacillus plantarum (BONSILAGE CORN 200G; Schaumann Inc.) on nutrient recovery of corn silage after ensiling for 30 or 90 days (Exp. 1)
Item
30 Days 90 Days SEM
P- Values2
Days CFU Interaction
01 200,0001 400,0001 01 200,0001 400,0001 L Q L Q
Total Acids, % DM 7.12 6.92 6.93 7.60 7.87 7.26 0.24 <0.01 0.07 0.46 0.95 0.06
pH 3.45 3.93 3.95 3.95 3.93 4.03 0.09 <0.01 0.05 0.60 0.20 0.21
Dry Matter, % 41.9 32.8 42.0 32.1 31.5 32.0 5.08 0.25 0.81 0.24 0.90 0.28
NDF 38.8 36.8 37.3 41.9 40.6 39.8 1.40 0.02 0.07 0.34 0.83 0.45
CP, % DM 9.15 9.15 9.28 9.10 9.25 9.18 0.10 0.85 0.35 0.79 0.81 0.34
Lactic Acid, % DM 5.39 5.26 4.83 5.36 5.06 4.03 0.22 0.08 <0.01 0.19 0.14 0.75
Acetic Acid, % DM 1.72 1.66 2.09 2.01 2.76 3.19 0.18 <0.01 <0.01 0.78 0.15 0.401Level of inoculant applied to sample as CFU/g of feed; CFU = colony forming unit2P- values were considered significant at ≤ 0.05; Days represents the effect of ensiling time; CFU represents the linear or quadratic effect of inoculant level; Interaction represents the linear or qua-
dratic interaction of days and inoculant level
Table 2. Effect of inoculant containing L. buchneri, Pediococcus acidilactici, and Lactobacillus plantarum (BONSILAGE HMC 200G; Schaumann Inc.) on nutrient recovery of high moisture corn after ensiling for 30 or 90 days (Exp. 1)
CFU1
30 Days 90 Days SEM
P- Values2
Days CFU Interaction
01 300,0001 600,0001 01 300,0001 600,0001 L Q L Q
Variable
Total Acids, % DM 1.52 1.43 1.45 1.76 1.64 1.55 0.06 <0.01 0.05 0.58 0.71 0.29
pH 4.13 4.17 4.18 4.08 4.23 4.35 0.07 0.52 0.03 0.81 0.09 0.97
Dry Matter, % 68.4 68.3 68.7 68.9 68.7 68.5 0.18 0.35 0.85 0.42 0.06 0.59
NDF 8.05 7.93 7.56 7.28 7.23 6.53 0.30 <0.01 0.05 0.42 0.63 0.71
CP, % DM 9.28 9.33 9.23 8.95 8.98 8.8 0.07 <0.01 0.19 0.19 0.95 0.39
Lactic Acid, % DM 1.37 1.22 1.25 1.56 1.15 0.91 0.13 0.51 0.01 0.49 0.60 0.78
Acetic Acid, % DM 0.15 0.20 0.20 0.20 0.47 0.60 0.07 <0.01 <0.01 0.44 0.28 0.651Level of inoculant applied to sample as CFU/g of feed; CFU = colony forming unit3P- values were considered significant at ≤ 0.05; Days represents the effect of ensiling time; CFU represents the linear or quadratic effect of inoculant level; Interaction represents the linear or qua-
dratic interaction of days and inoculant level

2018 Nebraska Beef Cattle Report · 65
acetic acid (P < 0.01). Lactic acid concen-tration was not affected by ensiling time (P = 0.44) while acetic acid concentration increased with the longer ensiling time (P < 0.01).
There was no interaction of days ensiled and inoculant (P = 0.52) on % DM lost during the aerobic stability test. The inocu-lated HMC had lower % DM loss (P = 0.01) compared to HMC that was not inoculated. Days ensiled did not affect (P = 0.46) % DM loss of HMC during the 21 day aerobic stability test. There was an interaction (P < 0.01) for temperature change in HMC sam-ples during the aerobic stability test. After a 90 day ensiling period, the inoculated HMC was 1.1°C cooler (P < 0.01) than the non- inoculated corn and temperature of both increased quadratically (P < 0.01) over the 21 day aerobic stability test. The HMC inoculated and ensiled for 120 days was 3.1°C cooler (P < 0.01) than non- inoculated corn and temperature of both quadratically increased (P < 0.01) over the 21 day aerobic stability test.
Conclusion
The current studies demonstrated that treating corn silage and high moisture corn with L. buchneri combined with other lactic acid bacteria affects the fermentation process and nutrient losses by decreasing lactic acid concentration and increasing acetic acid concentration. Ensiling time and level of inoculant applied both play a role in the proportion of lactic acid and acetic acid
during the aerobic stability test. The HMC stored for 30 days had increased DM losses with increasing inoculant level while HMC ensiled for 90 days had decreasing DM losses as level of inoculant increased. There was also an interaction of days ensiled and inoculant (P < 0.01) for temperature change during the stability test. Non- inoculated corn ensiled for 30 days had a lower temperature (P < 0.01) compared to the inoculated corn while temperature of all three treatments quadratically increased (P < 0.01) over the 13 day aerobic stability test. For HMC ensiled for 90 days, the 600,000 CFU/g inoculation treatment was 1.8°C cooler than corn inoculated at 300,000 CFU/g and 5.2°C cooler than non- inoculated corn.
Exp. 2– High Moisture Corn
The pH was greatest (P < 0.01; Table 3) for inoculated HMC in both the 90 and 120 day ensiling periods. There was no effect of length of ensiling (P = 0.57) on pH. Total acids decreased when HMC was inocu-lated (P < 0.01) and HMC ensiled for 120 days had a greater amount of total acids (P < 0.01) compared to HMC ensiled for 90 days. Dry matter was lower for HMC that was inoculated (P = 0.01). Percent DM lost during ensiling was less for HMC that was inoculated (P < 0.01) compared to the non- inoculated sample. Corn that was ensiled for 120 days had a greater % of DM loss (P < 0.01) compared to HMC that was ensiled for 90 days. Inoculated HMC ensiled for 90 or 120 days had less lactic acid and more
(P = 0.83) in silage stored for 30 days and increased quadratically (P < 0.01) over the 13 day aerobic stability test. Silage ensiled for 90 days and inoculated with 400,000 CFU/g was 1.8°C cooler (P < 0.01) than the non- inoculated treatment and temperature of all three treatments increased quadrat-ically (P <0.01) over the 13 day aerobic stability test.
Exp. 1– High Moisture Corn
No interactions between days ensiled and level of inoculant were observed for HMC in Exp. 1 (P ≥ 0.06; Table 2). As level of inoculant increased from 0 to 600,000 CFU/g pH linearly increased (P = 0.03); time ensiled had no effect (P = 0.52) on pH. Total acids decreased linearly (P = 0.07) as CFUs increased and were greater (P < 0.01) for HMC ensiled for 90 days (1.65) com-pared to HMC ensiled for 30 days (1.47).
As level of inoculant increased from 0 to 600,000 CFU/g, NDF linearly decreased (P = 0.05). Corn ensiled for 30 days had sig-nificantly greater NDF levels compared to HMC ensiled for 90 days (P < 0.01). Lactic acid concentration decreased linearly (P = 0.01) as level of inoculant increased from 0 to 600,000 CFU/g but was not affected by days ensiled (P = 0.51). Concentration of acetic acid increased linearly (P < 0.01) as level of inoculant increased from 0 to 600,000 CFU/g and was greater (P < 0.01) for HMC ensiled for 90 days compared to HMC ensiled for 30 days.
There was an interaction of days ensiled and inoculant (P < 0.01) on % DM lost
Table 3. Effect of inoculant containing L. buchneri, Pediococcus acidilactici, and Lactobacillus plantarum (BONSILAGE HMC 200G; Schaumann Inc.) on nutrient recovery of high moisture corn after ensiling for 90 or 120 days (Exp. 2)
Item
90 Days 120 Days P- Values2
01 600,0001 01 600,0001 SEM Days CFU Days×CFU
Total Acids, % DM 2.19 1.98 2.41 2.16 0.05 <0.01 <0.01 0.65
pH 4.00 4.23 3.93 4.28 0.02 0.57 <0.01 0.01
Dry Matter, % 68.4 67.4 67.7 67.2 0.003 0.14 0.01 0.34
DM lost during ensiling, % 4.49 3.15 5.98 4.93 0.003 <0.01 <0.01 0.68
NDF 8.40 8.15 8.05 7.23 0.48 0.21 0.28 0.56
CP, % DM 8.60 8.78 8.75 8.60 0.08 0.88 0.88 0.06
Lactic Acid, % DM 1.89 0.95 2.07 0.83 0.04 0.44 <0.01 <0.01
Acetic Acid, % DM 0.29 1.03 0.32 1.33 0.05 <0.01 <0.01 0.011Level of inoculant applied to sample as CFU/g of feed; CFU = colony forming unit2P- values were considered significant at ≤ 0.05; Days represented the effect of ensiling time; CFU represented the effect of inoculant level; Days×CFU represents the interaction of ensiling time and
inoculant level
66 · 2018 Nebraska Beef Cattle Report
Colton Oney, graduate student
Jana L. Gramkow, research technician
Andrea K. Watson, research assistant professor
Galen E. Erickson, professor
Jim C. MacDonald, associate professor, Animal Science, Lincoln
M. K. Biddlecome, Schaumann Inc., Mendota Heights, MN
produced, total acids produced and pH. The increase in acetic acid in the later stages of ensiling could be partially responsible for the increased aerobic stability observed when using L. buchneri. Utilizing a combi-nation inoculant containing L. buchneri and lactic acid bacteria on corn silage and high moisture corn may decrease nutrient losses and aerobic spoilage of these feeds.
2018 Nebraska Beef Cattle Report · 67
© The Board Regents of the University of Nebraska. All rights reserved.
each pasture area was divided into 6 pad-docks. Paddocks were rotationally grazed for an average of 156 days each year from April to September. The grazing period was divided into 5 cycles with cycle 1 lasting 24 days and cycles 2, 3, and 4 lasting 36 days. Cycle 5 lasted between 24 and 36 d depend-ing on forage availability. Cattle assigned to the ROT treatment rotated paddocks every 4 d during cycle 1 and 5 and every 6 d during cycles 2, 3, and 4. In all pastures, urea was surface applied as the N source at a rate of 80 lb N/ac in late March or early April, prior to the initiation of grazing. Cattle were implanted with 40 mg trenba-lone acetate and 8 mg estradiol on d 1 of the trial each year (Revalor- G; Merck Animal Health).
Seven to 9 tester animals were main-tained on each pasture, depending on size and treatment grazing intensity, at all times for performance measurements. A variable stocking rate was used in order to main-tain a similar grazing pressure across all 3 treatments by utilizing put and take animals that were added or removed equally across treatments depending on forage produc-tion, which was assessed weekly. In the first year of the experiment, one put animal was added to each treatment pasture on April 29th, June 10th, and June 17th. In the second year, two puts were added to each pasture on April 21st, May 24th, and June 6th. On June 20th, two puts were removed from each pasture. Determination of forage yield was conducted visually to maintain approximately 7 in of standing forage at the conclusion of grazing. By utilizing put and take animals and varying stocking rate, the effects of treatment on animal performance and animal production per acre of land were measured while maintaining similar grazing pressure across treatments. Put and take animals were not used to calculate individual performance but were used to calculate total number of head days. Pas-tures were initially stocked each spring at a rate described above for each treatment. To calculate AUM/ac, total head days for each
rates for the remaining available grazing land. Therefore, with decreased availability of grasslands for grazing and increased rent associated with grazing, optimizing use of land both in terms of animal performance and production per fixed unit of land is im-portant to offset increased costs associated with grazing. A commonly discussed meth-od for optimizing use of land is through the use of rotational grazing. Rotational grazing is a stocking method that has been reported to increase stocking rates while maintaining similar individual animal gain by divid-ing a pasture into separate paddocks that undergo short periods of grazing followed by longer periods of rest. Positive responses to rotational grazing have been reported to be more likely on cool- season forages compared to native range and improved warm- season forages. The objective of this study was to evaluate the effects of rotational grazing compared to continuous grazing, at stocking rates equal to or lesser than the rotational grazing stocking rate, on forage nutritive value, individual animal performance, and animal production per unit of land.
Procedure
Yearling steers grazed smooth brome-grass pastures over the course of 2 grazing seasons in 2015 and 2016. Three treatments were applied consisting of cattle contin-uously grazing bromegrass pastures at an initial stocking rate of 2.8 animal unit months (AUM)/ac (LO), 4.0 AUM/ac (HI), or cattle rotationally grazing smooth bromegrass at an initial stocking rate of 4.0 AUM/ac (ROT).
Pasture and Animal Management
Each year, 71 crossbred steer calves (689 lb, SD = 13) were assigned to 1 of 3 treat-ments with 3 replications per treatment. Prior to the start of the 2 years, treatments were allocated randomly to 1 of 9 pasture areas. For the rotationally grazed pastures
Cody A. WelchonsRobby G. Bondurant
Fred H. HilscherTerry J. KlopfensteinAndrea K. WatsonJim C. MacDonald
Summary with Implications
Individual animal performance and an-imal production per acre were evaluated for steers grazing smooth bromegrass over 2 con-secutive years. Treatments consisted of steers continuously grazing smooth bromegrass and initially stocked at either 4.0 animal unit months (AUM)/ac (HI) or 2.8 AUM/ac (LO) or steers rotationally grazing smooth brome-grass and initially stocked at 4.0 AUM/ac (ROT). Average calculated stocking rate for the LO, HI, and ROT treatments was greater than initial stocking rates due to the use of put and take animals. In vitro organic matter digestibility and crude protein of rotationally grazed pastures was relatively constant as the grazing season progressed, whereas contin-uous grazing showed a decrease in digest-ibility. However, there were no differences in gain between treatments. Treatment pastures grazed at a higher intensity, regardless of grazing method, had greater calculated stocking rate than pastures grazed at a lower intensity. Gain per acre, however, did not differ among treatments. Overall, although there was an increase in diet sample quality associated with rotational grazing compared to continuously grazed pastures, greater em-phasis should likely be placed on managing an appropriate grazing intensity, rather than grazing method.
Introduction
During the period from 2006– 2011, large amounts of grazing land in the Western Corn Belt were converted to crop land. This in turn caused an increase in pasture rental
Effect of Continuous or Rotational Grazing on Growing Steer Performance and Land Production
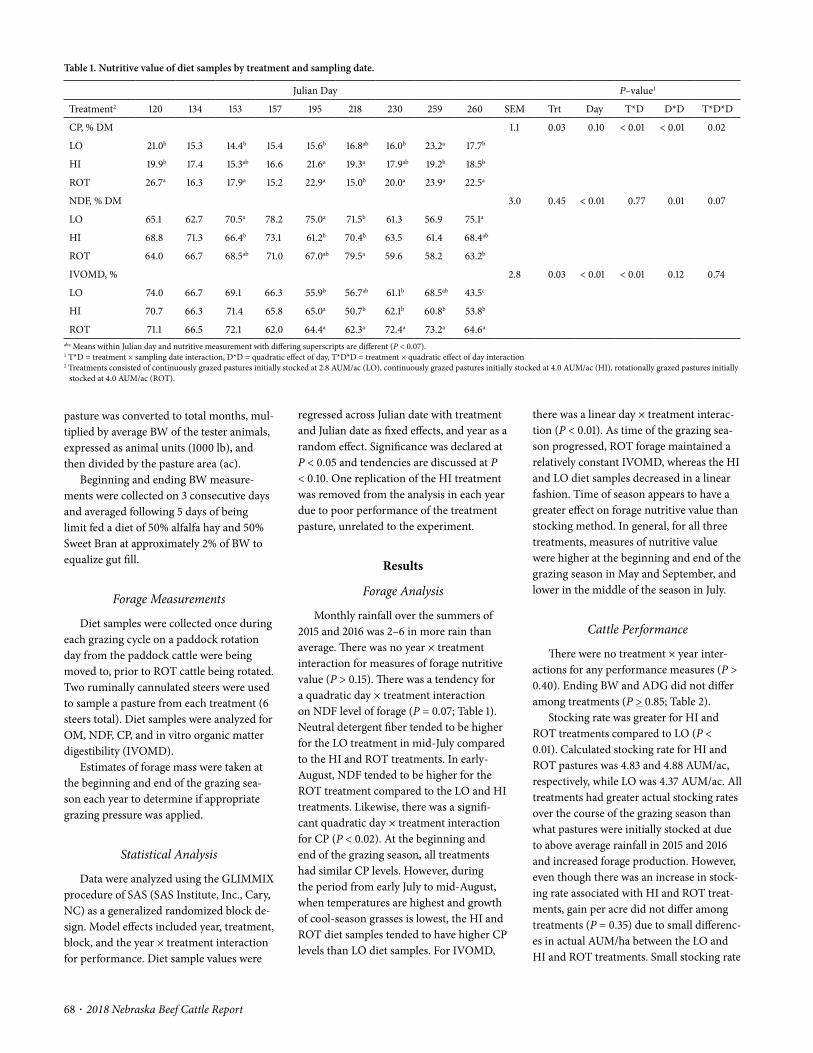
68 · 2018 Nebraska Beef Cattle Report
there was a linear day × treatment interac-tion (P < 0.01). As time of the grazing sea-son progressed, ROT forage maintained a relatively constant IVOMD, whereas the HI and LO diet samples decreased in a linear fashion. Time of season appears to have a greater effect on forage nutritive value than stocking method. In general, for all three treatments, measures of nutritive value were higher at the beginning and end of the grazing season in May and September, and lower in the middle of the season in July.
Cattle Performance
There were no treatment × year inter-actions for any performance measures (P > 0.40). Ending BW and ADG did not differ among treatments (P > 0.85; Table 2).
Stocking rate was greater for HI and ROT treatments compared to LO (P < 0.01). Calculated stocking rate for HI and ROT pastures was 4.83 and 4.88 AUM/ac, respectively, while LO was 4.37 AUM/ac. All treatments had greater actual stocking rates over the course of the grazing season than what pastures were initially stocked at due to above average rainfall in 2015 and 2016 and increased forage production. However, even though there was an increase in stock-ing rate associated with HI and ROT treat-ments, gain per acre did not differ among treatments (P = 0.35) due to small differenc-es in actual AUM/ha between the LO and HI and ROT treatments. Small stocking rate
regressed across Julian date with treatment and Julian date as fixed effects, and year as a random effect. Significance was declared at P < 0.05 and tendencies are discussed at P < 0.10. One replication of the HI treatment was removed from the analysis in each year due to poor performance of the treatment pasture, unrelated to the experiment.
Results
Forage Analysis
Monthly rainfall over the summers of 2015 and 2016 was 2– 6 in more rain than average. There was no year × treatment interaction for measures of forage nutritive value (P > 0.15). There was a tendency for a quadratic day × treatment interaction on NDF level of forage (P = 0.07; Table 1). Neutral detergent fiber tended to be higher for the LO treatment in mid- July compared to the HI and ROT treatments. In early- August, NDF tended to be higher for the ROT treatment compared to the LO and HI treatments. Likewise, there was a signifi-cant quadratic day × treatment interaction for CP (P < 0.02). At the beginning and end of the grazing season, all treatments had similar CP levels. However, during the period from early July to mid- August, when temperatures are highest and growth of cool- season grasses is lowest, the HI and ROT diet samples tended to have higher CP levels than LO diet samples. For IVOMD,
pasture was converted to total months, mul-tiplied by average BW of the tester animals, expressed as animal units (1000 lb), and then divided by the pasture area (ac).
Beginning and ending BW measure-ments were collected on 3 consecutive days and averaged following 5 days of being limit fed a diet of 50% alfalfa hay and 50% Sweet Bran at approximately 2% of BW to equalize gut fill.
Forage Measurements
Diet samples were collected once during each grazing cycle on a paddock rotation day from the paddock cattle were being moved to, prior to ROT cattle being rotated. Two ruminally cannulated steers were used to sample a pasture from each treatment (6 steers total). Diet samples were analyzed for OM, NDF, CP, and in vitro organic matter digestibility (IVOMD).
Estimates of forage mass were taken at the beginning and end of the grazing sea-son each year to determine if appropriate grazing pressure was applied.
Statistical Analysis
Data were analyzed using the GLIMMIX procedure of SAS (SAS Institute, Inc., Cary, NC) as a generalized randomized block de-sign. Model effects included year, treatment, block, and the year × treatment interaction for performance. Diet sample values were
Table 1. Nutritive value of diet samples by treatment and sampling date.
Julian Day P– value1
Treatment2 120 134 153 157 195 218 230 259 260 SEM Trt Day T*D D*D T*D*D
CP, % DM 1.1 0.03 0.10 < 0.01 < 0.01 0.02
LO 21.0b 15.3 14.4b 15.4 15.6b 16.8ab 16.0b 23.2a 17.7b
HI 19.9b 17.4 15.3ab 16.6 21.6a 19.3a 17.9ab 19.2b 18.5b
ROT 26.7a 16.3 17.9a 15.2 22.9a 15.0b 20.0a 23.9a 22.5a
NDF, % DM 3.0 0.45 < 0.01 0.77 0.01 0.07
LO 65.1 62.7 70.5a 78.2 75.0a 71.5b 61.3 56.9 75.1a
HI 68.8 71.3 66.4b 73.1 61.2b 70.4b 63.5 61.4 68.4ab
ROT 64.0 66.7 68.5ab 71.0 67.0ab 79.5a 59.6 58.2 63.2b
IVOMD, % 2.8 0.03 < 0.01 < 0.01 0.12 0.74
LO 74.0 66.7 69.1 66.3 55.9b 56.7ab 61.1b 68.5ab 43.5c
HI 70.7 66.3 71.4 65.8 65.0a 50.7b 62.1b 60.8b 53.8b
ROT 71.1 66.5 72.1 62.0 64.4a 62.3a 72.4a 73.2a 64.6a
abc Means within Julian day and nutritive measurement with differing superscripts are different (P < 0.07).1 T*D = treatment × sampling date interaction, D*D = quadratic effect of day, T*D*D = treatment × quadratic effect of day interaction2 Treatments consisted of continuously grazed pastures initially stocked at 2.8 AUM/ac (LO), continuously grazed pastures initially stocked at 4.0 AUM/ac (HI), rotationally grazed pastures initially
stocked at 4.0 AUM/ac (ROT).
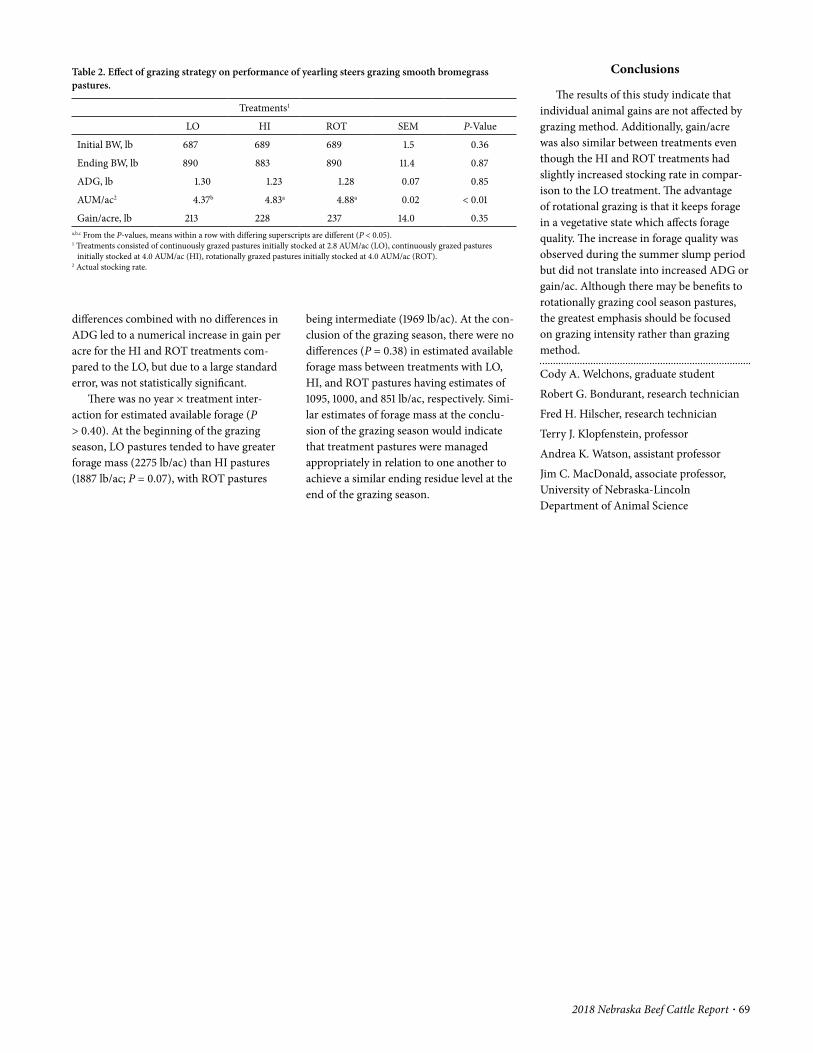
2018 Nebraska Beef Cattle Report · 69
Conclusions
The results of this study indicate that individual animal gains are not affected by grazing method. Additionally, gain/acre was also similar between treatments even though the HI and ROT treatments had slightly increased stocking rate in compar-ison to the LO treatment. The advantage of rotational grazing is that it keeps forage in a vegetative state which affects forage quality. The increase in forage quality was observed during the summer slump period but did not translate into increased ADG or gain/ac. Although there may be benefits to rotationally grazing cool season pastures, the greatest emphasis should be focused on grazing intensity rather than grazing method.
Cody A. Welchons, graduate student
Robert G. Bondurant, research technician
Fred H. Hilscher, research technician
Terry J. Klopfenstein, professor
Andrea K. Watson, assistant professor
Jim C. MacDonald, associate professor, University of Nebraska- Lincoln Department of Animal Science
being intermediate (1969 lb/ac). At the con-clusion of the grazing season, there were no differences (P = 0.38) in estimated available forage mass between treatments with LO, HI, and ROT pastures having estimates of 1095, 1000, and 851 lb/ac, respectively. Simi-lar estimates of forage mass at the conclu-sion of the grazing season would indicate that treatment pastures were managed appropriately in relation to one another to achieve a similar ending residue level at the end of the grazing season.
differences combined with no differences in ADG led to a numerical increase in gain per acre for the HI and ROT treatments com-pared to the LO, but due to a large standard error, was not statistically significant.
There was no year × treatment inter-action for estimated available forage (P > 0.40). At the beginning of the grazing season, LO pastures tended to have greater forage mass (2275 lb/ac) than HI pastures (1887 lb/ac; P = 0.07), with ROT pastures
Table 2. Effect of grazing strategy on performance of yearling steers grazing smooth bromegrass pastures.
Treatments1
LO HI ROT SEM P- Value
Initial BW, lb 687 689 689 1.5 0.36
Ending BW, lb 890 883 890 11.4 0.87
ADG, lb 1.30 1.23 1.28 0.07 0.85
AUM/ac2 4.37b 4.83a 4.88a 0.02 < 0.01
Gain/acre, lb 213 228 237 14.0 0.35a,b,c From the P- values, means within a row with differing superscripts are different (P < 0.05).1 Treatments consisted of continuously grazed pastures initially stocked at 2.8 AUM/ac (LO), continuously grazed pastures
initially stocked at 4.0 AUM/ac (HI), rotationally grazed pastures initially stocked at 4.0 AUM/ac (ROT).2 Actual stocking rate.

70 · 2018 Nebraska Beef Cattle Report
© The Board Regents of the University of Nebraska. All rights reserved.
Forage demand is commonly reported as stocking rate (AU days of forage per acre; AUD/acre) and is calculated based on a ru-minant consuming daily a certain percent-age of its liveweight. There is disagreement among advisors and practitioners alike on the daily intake (AUD) of a grazing rumi-nant. The standard intake amount used by University Extension and the Natural Re-sources Conservation Service (NRCS) has been based on 2.3% of liveweight (23 lbs. DM for a 1,000 lb. animal); more recently, the NRCS has changed to 2.7% of live-weight (27 lbs. DM for a 1,000 lb. animal). A stocking rate based on the 2.7% intake is lower than that of a 2.3% intake and likely results in reduced harvest efficiency and beef production; therefore, identifying and using accurate estimates of intake are important. An approach to assess which predicted intake level is most similar to ac-tual is to estimate forage removal of grazing cattle on a pasture by clipping vegetation before and after a grazing period. The ques-tion then becomes, is the estimate of forage intake by grazing cattle better represented at 2.3 or 2.7% of liveweight? This difference of 0.4% can make a considerable difference in how much forage is consumed and left behind, and significantly affects efficiency of beef production.
Procedure
Research was conducted from 2013 through 2016 on a subirrigated meadow at the University of Nebraska- Lincoln Barta Brothers Ranch in the eastern Sandhills of Nebraska. Vegetation was dominated by exotic, cool- season grasses, sedges, and exotic legumes; warm- season grasses were less common. Forage quality analy-sis was conducted in 2013 and the overall average NDF and crude protein content of the standing live vegetation was 63% and 8.0% respectively. The study site included two replications of two different 4- pasture rotational grazing treatments: a 4 pasture with a single cycle of grazing (4PR1) and a
Evaluating Methods of Estimating Forage Intake by Grazing Cattle
Aaron J. ShropshireWalter SchachtJerry Volesky
Summary with Implications
Two methods of estimating forage intake of grazing cattle were compared to clipped estimates in 4- pasture rotational grazing sys-tems on Sandhills subirrigated meadow from mid- May through early August over a 4- year period. Clipping standing vegetation samples within a pasture before and after cattle grazing provides for an accurate estimate of forage removal during a grazing period. A less laborious method of intake estimation commonly used is based on a percentage of an animal’s liveweight. University Extension and some federal agencies use a 2.3% factor and others such as the Natural Resources Conservation Service use a 2.7% factor. In this study on a Sandhills subirrigated mead-ow, the 2.3% of body weight intake factor appropriately matched the clipping estimates in 63% of the evaluations. In contrast, the 2.7% of body weight factor provided similar estimates to the clipping estimate in only 38% of the evaluations. This implies that the 2.3% estimate more accurately represents forage intake of beef cattle and has less chance of overestimating cattle intake. Allocation of surplus forage to grazing cattle reduces harvest efficiency, reduces beef production per acre, and negatively effects profitability of beef operations
Introduction
Daily forage intake of beef cattle on grazing lands is difficult to estimate and can be variable depending on management, forage quality, plant growth stage, animal charachteristics, and ecological factors. The animal unit (AU) concept is based on forage intake and is used to balance forage supply and demand on grazing lands.
4 pasture with two grazing cycles (4PR2). The 4PR1 replications were grazed for a 60- day grazing season where each 1- acre pasture had a single occupation for 15 days. Nine head of yearling steers were placed in the first pasture of each replication around June 10 of each year. The 4PR2 replications were grazed for an 80- day grazing season from mid- May to early August where each 1.5- acre pasture was occupied twice for 10 days each. Ten head of yearling steers were placed in the first pasture of each replica-tion around May 20 of each year. The av-erage weight of the yearling steers was 844 (± 21) lbs. during the growing season. All pastures were grazed at a stocking rate of 3 AUM/acre, which is a moderate stocking rate for Sandhills meadow.
Prior to moving the steers to a new pas-ture, each of the 4 years of the study (2013– 2016), ten 10.8- ft2 exclosure cages were randomly placed throughout each pasture. At the end of an occupation in a pasture the cages were removed and a quadrat (2.7 ft2) was placed in the middle of each cage area and vegetation was clipped to ground level and sorted into standing live and standing dead components. One quadrat was also placed 3.3 ft directly north of each cage and the vegetation was clipped to ground level, sorted into standing live, standing dead, and trampled. Litter was also collected from all quadrats inside and outside the cages. Trampled vegetation was defined as any tiller that was bent at a 45° angle or greater from the ground. All samples were dried in a forced- air oven at 140°F and then the final weight was recorded. The data used to determine intake was only the current year’s growth or standing live.
Method 1 was an intake estimate based on clipping. Intake was calculated on a per pasture basis by comparing the samples clipped on the inside of the exclosure cages to the samples clipped outside of the exclo-sure cages. The standing live and trampled forage from the outside samples were sub-tracted from the standing live forage from the inside samples and then averaged. The
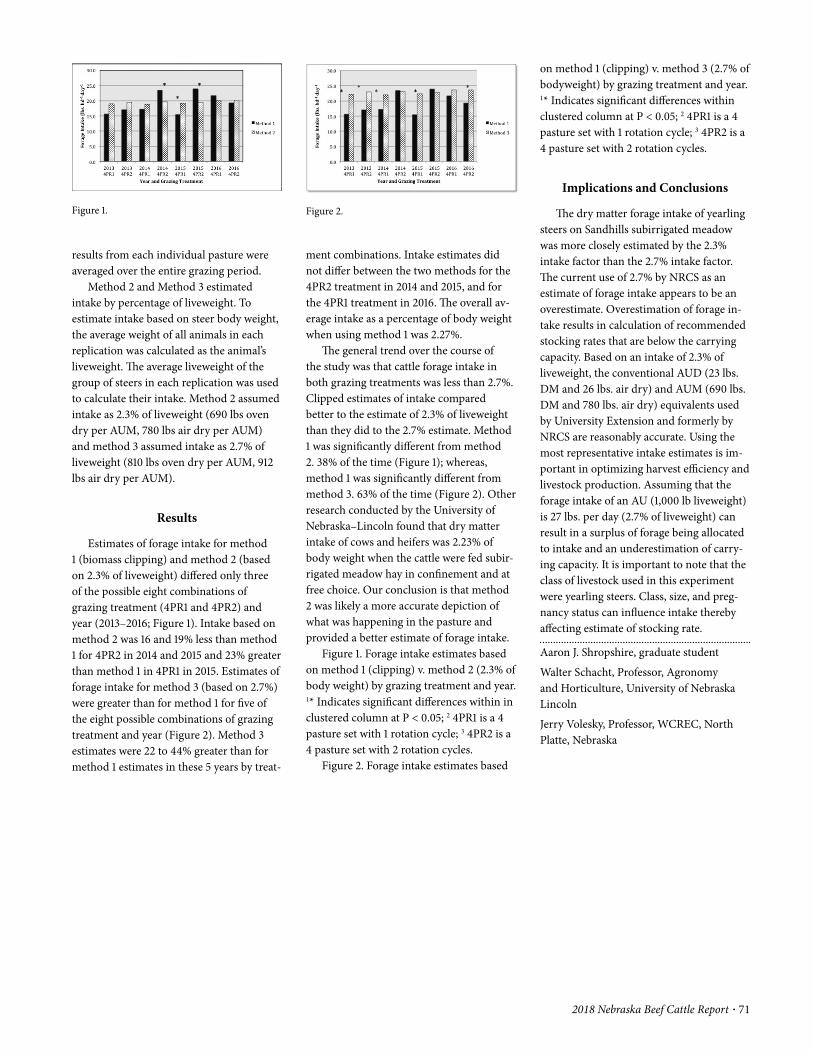
2018 Nebraska Beef Cattle Report · 71
on method 1 (clipping) v. method 3 (2.7% of bodyweight) by grazing treatment and year. 1* Indicates significant differences within clustered column at P < 0.05; 2 4PR1 is a 4 pasture set with 1 rotation cycle; 3 4PR2 is a 4 pasture set with 2 rotation cycles.
Implications and Conclusions
The dry matter forage intake of yearling steers on Sandhills subirrigated meadow was more closely estimated by the 2.3% intake factor than the 2.7% intake factor. The current use of 2.7% by NRCS as an estimate of forage intake appears to be an overestimate. Overestimation of forage in-take results in calculation of recommended stocking rates that are below the carrying capacity. Based on an intake of 2.3% of liveweight, the conventional AUD (23 lbs. DM and 26 lbs. air dry) and AUM (690 lbs. DM and 780 lbs. air dry) equivalents used by University Extension and formerly by NRCS are reasonably accurate. Using the most representative intake estimates is im-portant in optimizing harvest efficiency and livestock production. Assuming that the forage intake of an AU (1,000 lb liveweight) is 27 lbs. per day (2.7% of liveweight) can result in a surplus of forage being allocated to intake and an underestimation of carry-ing capacity. It is important to note that the class of livestock used in this experiment were yearling steers. Class, size, and preg-nancy status can influence intake thereby affecting estimate of stocking rate.
Aaron J. Shropshire, graduate student
Walter Schacht, Professor, Agronomy and Horticulture, University of Nebraska Lincoln
Jerry Volesky, Professor, WCREC, North Platte, Nebraska
ment combinations. Intake estimates did not differ between the two methods for the 4PR2 treatment in 2014 and 2015, and for the 4PR1 treatment in 2016. The overall av-erage intake as a percentage of body weight when using method 1 was 2.27%.
The general trend over the course of the study was that cattle forage intake in both grazing treatments was less than 2.7%. Clipped estimates of intake compared better to the estimate of 2.3% of liveweight than they did to the 2.7% estimate. Method 1 was significantly different from method 2. 38% of the time (Figure 1); whereas, method 1 was significantly different from method 3. 63% of the time (Figure 2). Other research conducted by the University of Nebraska–Lincoln found that dry matter intake of cows and heifers was 2.23% of body weight when the cattle were fed subir-rigated meadow hay in confinement and at free choice. Our conclusion is that method 2 was likely a more accurate depiction of what was happening in the pasture and provided a better estimate of forage intake.
Figure 1. Forage intake estimates based on method 1 (clipping) v. method 2 (2.3% of body weight) by grazing treatment and year. 1* Indicates significant differences within in clustered column at P < 0.05; 2 4PR1 is a 4 pasture set with 1 rotation cycle; 3 4PR2 is a 4 pasture set with 2 rotation cycles.
Figure 2. Forage intake estimates based
results from each individual pasture were averaged over the entire grazing period.
Method 2 and Method 3 estimated intake by percentage of liveweight. To estimate intake based on steer body weight, the average weight of all animals in each replication was calculated as the animal’s liveweight. The average liveweight of the group of steers in each replication was used to calculate their intake. Method 2 assumed intake as 2.3% of liveweight (690 lbs oven dry per AUM, 780 lbs air dry per AUM) and method 3 assumed intake as 2.7% of liveweight (810 lbs oven dry per AUM, 912 lbs air dry per AUM).
Results
Estimates of forage intake for method 1 (biomass clipping) and method 2 (based on 2.3% of liveweight) differed only three of the possible eight combinations of grazing treatment (4PR1 and 4PR2) and year (2013– 2016; Figure 1). Intake based on method 2 was 16 and 19% less than method 1 for 4PR2 in 2014 and 2015 and 23% greater than method 1 in 4PR1 in 2015. Estimates of forage intake for method 3 (based on 2.7%) were greater than for method 1 for five of the eight possible combinations of grazing treatment and year (Figure 2). Method 3 estimates were 22 to 44% greater than for method 1 estimates in these 5 years by treat-
Figure 1. Figure 2.
72 · 2018 Nebraska Beef Cattle Report
© The Board Regents of the University of Nebraska. All rights reserved.
son. It was hypothesized that daily distance traveled, area covered, and the amount of time cattle would be actively grazing would increase as time within the pasture in-creased because cattle would be required to seek out more areas to graze as the available forage decreased.
Procedure
Research was conducted at the Universi-ty of Nebraska’s Barta Brothers Ranch near Rose, NE in the eastern Nebraska Sandhills during the 2016 growing season. Common forage species were a mixture of warm- and cool- season grasses including needle- and- thread, little bluestem, prairie sandreed, kentucky bluegrass, scribner’s panicum, sand dropseed, blue grama, and hairy grama. Seventeen cows with calves in 3 sep-arate herds were fitted with GPS collars (i.e., 5 or 6 cows per herd). Herd sizes were 47 to 82 cow/calf pairs. Each herd was grazed on upland pastures in a 4- pasture deferred rotation from mid- May to mid- October. Rotations were planned so that the herds were typically moved to a new pasture with-in a few days of each other. Stocking rates on pastures varied from 0.72– 0.82 (Animal Unit Months (;AUM/acre) with lower stocking rates in the early pasture because
grazing management on rangelands.Manipulation of grazing behavior and
distribution patterns can only happen if there is an understanding of current patterns. Global Positioning System (GPS) technology provides researchers with a tool to track cattle locations and grazing pat-terns. Advances in GPS technology create a consistent and accurate data source for individual animal locations over extended periods of a grazing season.
Cattle select locations on rangelands based on abiotic (e.g., topography) and biotic (e.g., forage quality) factors. Some of the most important drivers that influence cattle grazing locations are proximity to water, ease of travel, and amount of preferred forages. Producers and manag-ers can improve distribution and grazing locations to more efficiently and uniformly utilize their forage resources by increasing water developments, fencing, mineral/salt/supplement placement, herding, or other distribution practices.
Understanding cattle grazing behavior is an important step in developing strate-gies to improve cattle grazing utilization, efficiency, and production. The objective of this study was to evaluate grazing behaviors of cattle as time progressed within pastures at different times during the growing sea-
Effects of Movement and Activity Behavior in a Pasture System Compared to Time
Jace R. StottMitchell B. Stephenson
Kathryn J. Hanford
Summary with Implications
During the summer of 2016 seventeen cows were fitted with Global Positioning System (GPS) tracking collars to evaluate activity characteristics of cattle on range-lands. Data collected included daily distance traveled, average distance from water, daily time spent at water, daily area covered, and percent of day spent active (traveling or grazing). These variables were analyzed weekly to assess changes in behavior as time within pastures increased during three time periods of the growing season. Based on data collected from mid- May to mid- September, cattle showed little changes throughout the grazing season as to levels of activity through different periods of a 24- hour day. Daily patterns indicate that cattle are most active during mid- morning and evening hours. Periods of greatest inactivity occur during early morning hours and late afternoon prior to an evening grazing bout. Distance traveled showed a general downward trend as week within pasture progressed with the exception of the early grazed pasture. Average distance of cattle from water increased, and average time at water decreased at the end of the growing season. There were no statistical differences in activity levels or average area covered as time within a pasture increased. The greater distance traveled at the beginning of grazing on a pasture suggests that cattle are more selective in their grazing patterns and go to more grazing locations.
Introduction
Understanding how cattle graze, how far they travel, and where they select to graze or rest can help producers better under-stand how cattle behavior may influence
Table 1. Grazing periods, pasture attributes, and stocking rates and densities for herds of cattle grazing at the UNL Barta Brothers Ranch from mid- May to early- September 2016
Grazing Period
Early Middle Late
Mean date in 17- May 15- Jun 19- Jul
Mean date out 15- Jun 19- Jul 1- Sep
Grazing, days 29.7 (1.8) 35.7 (3.3) 45.0 (1.5)
Pasture size, acre 133.4 (21.2) 132.6 (15.0) 170.0 (36.2)
Max water distance, miles 0.47 (0.09) 0.38 (0.03) 0.49 (0.12)
Mean slope, degrees 21.6 (2.6) 14.0 (3.8) 21.1 (4.7)
Mean elevation, feet 2599.1 (45.1) 2580.2 (24.2) 2595.5 (37.8)
Stocking rate, AUM/acre 0.72 (0.03) 0.76 (0.02) 0.82 (0.02)
Stocking density, AU/acre 0.72 (0.02) 0.72 (0.08) 0.58 (0.04)() Indicates standard error
2018 Nebraska Beef Cattle Report · 73
correlate the sensor measurements with the visual observations accurately classified 80 to 85% of collar readings.
Distances traveled, average area covered, average distance cattle were from water, and time spent near water were determined in the spatial analysis program ArcGIS. Distance traveled was calculated by adding all distances between consecutive GPS points for a 24- hour day. Area covered was calculated using a minimum convex polygon procedure that determines the area between the outermost points recorded during the day.
A repeated measures analysis was used to test changes in behavior as time within the early, middle, and late pastures progressed. Diurnal activity patterns, or percent of the day that collared animals were active, was averaged for cattle on the early, middle, and late grazed pastures to evaluate when cattle were most active during the day.
Results
During the early grazed pasture, daily distance cattle traveled exhibited a quadrat-ic response (i.e., P < 0.05) with distances decreasing in the first 3 weeks, but increas-ing in the final week that cattle were in the pastures (Table 2). Daily distance traveled decreased linearly as time within pasture increased during the middle and late grazing pastures (Table 2). Increased travel in the final week on the early pasture may support the hypothesis that cattle needed to travel more because less forage was available as cool season biomass decreased and warm season biomass had yet to reach full production potential in early June. With the exception of the cattle on the early pas-ture, cattle exhibited the opposite response of what we originally hypothesized with distance traveled decreasing as time within pasture increased. This response could be due to cattle’s spatial memory. As time pro-gressed, cattle may have develop a mental map of a pasture including preferred forage locations. Understanding these locations allowed cattle to be more efficient with their movements. Another explanation is a reduction in selectivity of foraging in cattle as the time within a pasture progresses. Reduction in selectivity could be due to uti-lization of preferred forages in the first few
tracked x- and y- axis movements of the col-lar and percent of the time when the cow’s head was in down or upright positions. The sensor measurements were correlated with visual observations to estimate a cow’s daily activity budgets. Collared cows were visu-ally observed for 4.7 ± 0.6 hours and data from sensor measurements on the collars and the visual observations were used to create a model for active (grazing or walk-ing) and non- active (resting, laying down, or standing) periods. The model used to
of limited forage availability earlier in the growing season (Table 1).
Behavioral data were collected using Lotek 3300 GPS collars that recorded cow locations at 10- minute intervals. Battery life on the collars was sufficient to collect data through the first 3 pastures in the deferred rotation from mid- May to early September. These 3 pastures represented the three graz-ing periods in the study that are defined as early, middle, and late (Table 1). In addition to the recorded locations, the GPS collars
Table 2. Distribution behavior results as time within grazing periods (early, middle, and late) pro-gressed by week
Weeks
Linear Quad1 2 3 4 5 6
Distance traveled miles · d- 1 p- value
Early 2.40 (0.06)
2.20 (0.06)
2.04 (0.06)
2.23 (0.06)
- - 0.04 0.03
Middle 2.22 (0.12)
2.20 (0.12)
2.09 (0.12)
1.97 (0.12)
1.95 (0.12)
- 0.04 0.91
Late 1.90 (0.12)
1.79 (0.12)
1.69 (0.06)
1.60 (0.06)
1.52 (0.12)
1.47 (0.12)
0.01 0.63
Average distance from water miles
Early 0.19 (0.03)
0.20 (0.03)
0.20 (0.03)
0.21 (0.03)
- - 0.33 0.99
Middle 0.17 (0.02)
0.16 (0.02)
0.17 (0.02)
0.17 (0.02)
0.17 (0.02)
- 0.86 0.62
Late 0.17 (0.02)
0.18 (0.02)
0.19 (0.02)
0.21 (0.02)
0.21 (0.02)
0.21 (0.02)
0.05 0.31
Time at water hours · d- 1
Early 3.65 (1.1)
2.82 (1.1)
3.18 (1.1)
3.31 (1.1)
- - 0.08 0.18
Middle 2.62 (0.4)
2.57 (0.4)
2.21 (0.4)
2.15 (0.4)
3.00 (0.5)
- 0.99 0.24
Late 4.69 (0.8)
4.58 (0.7)
3.76 (0.7)
2.73 (0.7)
1.99 (0.7)
2.05 (0.8)
0.01 0.85
Area covered acres · d- 1
Early 30.75 (5.68)
32.78 (5.68)
32.01 (5.68)
39.37 (5.68)
- - 0.25 0.37
Middle 29.24 (4.69)
33.32 (4.45)
32.93 (3.95)
32.01 (4.45)
34.53 (5.43)
- 0.61 0.78
Late 34.33 (6.92)
41.30 (6.67)
40.11 (6.42)
36.04 (6.42)
34.23 (6.67)
39.94 (6.92)
0.97 0.86
Activity hours · d- 1
Early 11.38 (0.3)
11.94 (0.3)
12.06 (0.3)
11.92 (0.3)
- - 0.30 0.25
Middle 10.67 (0.6)
10.60 (0.5)
10.85 (0.5)
11.22 (0.5)
11.48 (0.6)
- 0.30 0.65
Late 9.93 (0.8)
10.31 (0.7)
10.35 (0.7)
10.27 (0.7)
10.25 (0.7)
10.49 (0.8)
0.60 0.76
() indicates standard error.
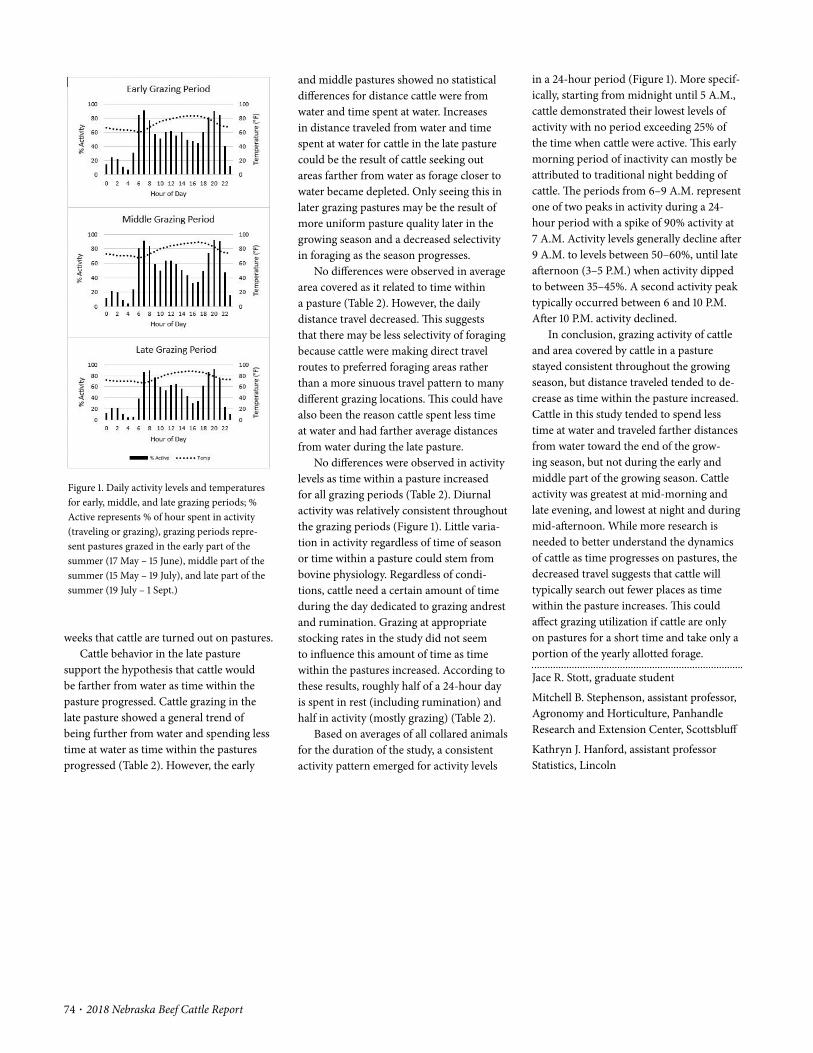
74 · 2018 Nebraska Beef Cattle Report
weeks that cattle are turned out on pastures.Cattle behavior in the late pasture
support the hypothesis that cattle would be farther from water as time within the pasture progressed. Cattle grazing in the late pasture showed a general trend of being further from water and spending less time at water as time within the pastures progressed (Table 2). However, the early
and middle pastures showed no statistical differences for distance cattle were from water and time spent at water. Increases in distance traveled from water and time spent at water for cattle in the late pasture could be the result of cattle seeking out areas farther from water as forage closer to water became depleted. Only seeing this in later grazing pastures may be the result of more uniform pasture quality later in the growing season and a decreased selectivity in foraging as the season progresses.
No differences were observed in average area covered as it related to time within a pasture (Table 2). However, the daily distance travel decreased. This suggests that there may be less selectivity of foraging because cattle were making direct travel routes to preferred foraging areas rather than a more sinuous travel pattern to many different grazing locations. This could have also been the reason cattle spent less time at water and had farther average distances from water during the late pasture.
No differences were observed in activity levels as time within a pasture increased for all grazing periods (Table 2). Diurnal activity was relatively consistent throughout the grazing periods (Figure 1). Little varia-tion in activity regardless of time of season or time within a pasture could stem from bovine physiology. Regardless of condi-tions, cattle need a certain amount of time during the day dedicated to grazing andrest and rumination. Grazing at appropriate stocking rates in the study did not seem to influence this amount of time as time within the pastures increased. According to these results, roughly half of a 24- hour day is spent in rest (including rumination) and half in activity (mostly grazing) (Table 2).
Based on averages of all collared animals for the duration of the study, a consistent activity pattern emerged for activity levels
Figure 1. Daily activity levels and temperatures for early, middle, and late grazing periods; % Active represents % of hour spent in activity (traveling or grazing), grazing periods repre-sent pastures grazed in the early part of the summer (17 May – 15 June), middle part of the summer (15 May – 19 July), and late part of the summer (19 July – 1 Sept.)
in a 24- hour period (Figure 1). More specif-ically, starting from midnight until 5 A.M., cattle demonstrated their lowest levels of activity with no period exceeding 25% of the time when cattle were active. This early morning period of inactivity can mostly be attributed to traditional night bedding of cattle. The periods from 6– 9 A.M. represent one of two peaks in activity during a 24- hour period with a spike of 90% activity at 7 A.M. Activity levels generally decline after 9 A.M. to levels between 50– 60%, until late afternoon (3– 5 P.M.) when activity dipped to between 35– 45%. A second activity peak typically occurred between 6 and 10 P.M. After 10 P.M. activity declined.
In conclusion, grazing activity of cattle and area covered by cattle in a pasture stayed consistent throughout the growing season, but distance traveled tended to de-crease as time within the pasture increased. Cattle in this study tended to spend less time at water and traveled farther distances from water toward the end of the grow-ing season, but not during the early and middle part of the growing season. Cattle activity was greatest at mid- morning and late evening, and lowest at night and during mid- afternoon. While more research is needed to better understand the dynamics of cattle as time progresses on pastures, the decreased travel suggests that cattle will typically search out fewer places as time within the pasture increases. This could affect grazing utilization if cattle are only on pastures for a short time and take only a portion of the yearly allotted forage.
Jace R. Stott, graduate student
Mitchell B. Stephenson, assistant professor, Agronomy and Horticulture, Panhandle Research and Extension Center, Scottsbluff
Kathryn J. Hanford, assistant professor Statistics, Lincoln
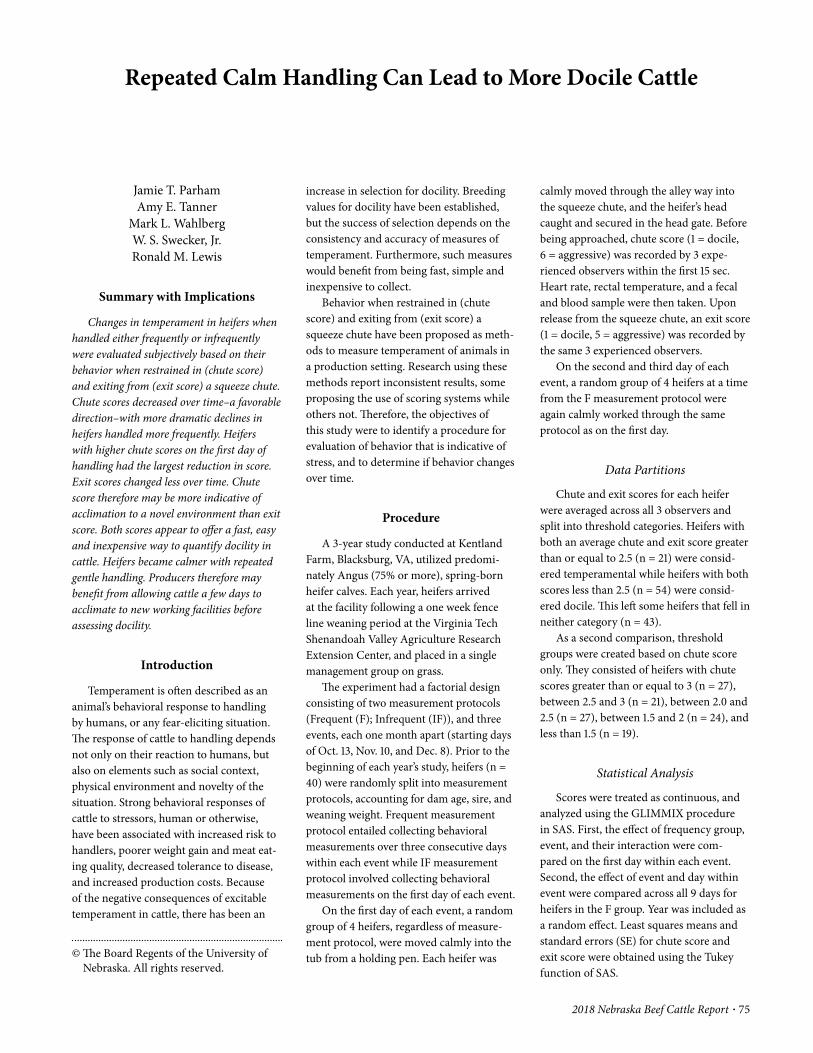
2018 Nebraska Beef Cattle Report · 75
© The Board Regents of the University of Nebraska. All rights reserved.
Repeated Calm Handling Can Lead to More Docile Cattle
Jamie T. ParhamAmy E. Tanner
Mark L. WahlbergW. S. Swecker, Jr.Ronald M. Lewis
Summary with Implications
Changes in temperament in heifers when handled either frequently or infrequently were evaluated subjectively based on their behavior when restrained in (chute score) and exiting from (exit score) a squeeze chute. Chute scores decreased over time– a favorable direction– with more dramatic declines in heifers handled more frequently. Heifers with higher chute scores on the first day of handling had the largest reduction in score. Exit scores changed less over time. Chute score therefore may be more indicative of acclimation to a novel environment than exit score. Both scores appear to offer a fast, easy and inexpensive way to quantify docility in cattle. Heifers became calmer with repeated gentle handling. Producers therefore may benefit from allowing cattle a few days to acclimate to new working facilities before assessing docility.
Introduction
Temperament is often described as an animal’s behavioral response to handling by humans, or any fear- eliciting situation. The response of cattle to handling depends not only on their reaction to humans, but also on elements such as social context, physical environment and novelty of the situation. Strong behavioral responses of cattle to stressors, human or otherwise, have been associated with increased risk to handlers, poorer weight gain and meat eat-ing quality, decreased tolerance to disease, and increased production costs. Because of the negative consequences of excitable temperament in cattle, there has been an
increase in selection for docility. Breeding values for docility have been established, but the success of selection depends on the consistency and accuracy of measures of temperament. Furthermore, such measures would benefit from being fast, simple and inexpensive to collect.
Behavior when restrained in (chute score) and exiting from (exit score) a squeeze chute have been proposed as meth-ods to measure temperament of animals in a production setting. Research using these methods report inconsistent results, some proposing the use of scoring systems while others not. Therefore, the objectives of this study were to identify a procedure for evaluation of behavior that is indicative of stress, and to determine if behavior changes over time.
Procedure
A 3- year study conducted at Kentland Farm, Blacksburg, VA, utilized predomi-nately Angus (75% or more), spring- born heifer calves. Each year, heifers arrived at the facility following a one week fence line weaning period at the Virginia Tech Shenandoah Valley Agriculture Research Extension Center, and placed in a single management group on grass.
The experiment had a factorial design consisting of two measurement protocols (Frequent (F); Infrequent (IF)), and three events, each one month apart (starting days of Oct. 13, Nov. 10, and Dec. 8). Prior to the beginning of each year’s study, heifers (n = 40) were randomly split into measurement protocols, accounting for dam age, sire, and weaning weight. Frequent measurement protocol entailed collecting behavioral measurements over three consecutive days within each event while IF measurement protocol involved collecting behavioral measurements on the first day of each event.
On the first day of each event, a random group of 4 heifers, regardless of measure-ment protocol, were moved calmly into the tub from a holding pen. Each heifer was
calmly moved through the alley way into the squeeze chute, and the heifer’s head caught and secured in the head gate. Before being approached, chute score (1 = docile, 6 = aggressive) was recorded by 3 expe-rienced observers within the first 15 sec. Heart rate, rectal temperature, and a fecal and blood sample were then taken. Upon release from the squeeze chute, an exit score (1 = docile, 5 = aggressive) was recorded by the same 3 experienced observers.
On the second and third day of each event, a random group of 4 heifers at a time from the F measurement protocol were again calmly worked through the same protocol as on the first day.
Data Partitions
Chute and exit scores for each heifer were averaged across all 3 observers and split into threshold categories. Heifers with both an average chute and exit score greater than or equal to 2.5 (n = 21) were consid-ered temperamental while heifers with both scores less than 2.5 (n = 54) were consid-ered docile. This left some heifers that fell in neither category (n = 43).
As a second comparison, threshold groups were created based on chute score only. They consisted of heifers with chute scores greater than or equal to 3 (n = 27), between 2.5 and 3 (n = 21), between 2.0 and 2.5 (n = 27), between 1.5 and 2 (n = 24), and less than 1.5 (n = 19).
Statistical Analysis
Scores were treated as continuous, and analyzed using the GLIMMIX procedure in SAS. First, the effect of frequency group, event, and their interaction were com-pared on the first day within each event. Second, the effect of event and day within event were compared across all 9 days for heifers in the F group. Year was included as a random effect. Least squares means and standard errors (SE) for chute score and exit score were obtained using the Tukey function of SAS.
76 · 2018 Nebraska Beef Cattle Report
Results
Mean chute and exit scores compar-ing temperamental and docile heifers by event can be found in Table 1. There was no effect of event, frequency group, or their interaction on either score for both temperamental and docile heifers. However, there was a larger numerical decrease in the temperamental group from event 1 to 3 for chute score compared to exit score, with no change in chute or exit score for the docile group. As expected, heifers that started with a lower chute score simply had less room to decrease on the scale.
While the effect of frequency group was not significant, there was a stronger decrease in chute and exit scores over time when considering the F group of heifers only. Table 2 shows the change in scores across events for both temperamental and docile heifers. Chute score decreased from event 1 to 2 (P < 0.05), but remained con-stant from event 2 to 3 for both categories (P > 0.34). Temperamental heifers started with a chute score of 3.15 ± 0.17 on event 1, which reduced to 2.48 ± 0.17 on event 2 and 3. Allowing heifers to acclimate to a novel environment may be worthwhile when evaluating their behavior in the chute. Exit score did change in the docile heifers from event 2 to 3 (P < 0.05); however this small of a change is likely not noticeable in prac-tice. More importantly, the temperamental heifers did not significantly change in exit score across events.
Since chute score appeared to be the more sensitive measure, all heifers were separated based on their average chute score on day 1. Results comparing frequen-cy groups across event are given in Table 3. The effects of frequency group, and the interaction of frequency group and event, were not significant for any chute score cat-egory. The effect of event was significant for the two chute score groups with the highest scores, with a decrease from event 1 to 2 (1.08 and 0.66 for ≥ 3.0 and 2.5– 3.0 groups, respectively). These decreases from event 1 to 2 became smaller when the chute score on day 1 was lower, again as expected.
The F group of heifers was again consid-ered separately. Chute scores numerically decreased across events for all heifers, except for the 1.0– 1.5 group which remained constant. Heifers with starting scores greater than or equal to 3.0 and between 2.0
Figure 1. Average chute scores by day for the frequently handled group of heifers, separat-ed by their chute score on their first day of handling.
Table 1. Effect of event on average chute score of temperamental and docile heifers.
Measurement Threshold Category Event SEM P- Value3
1 2 3 Event
Chute Score Temperamental1 3.32 2.51 2.84 0.29 0.212
Docile2 1.69 1.74 1.76 0.14 0.936
Exit Score Temperamental1 3.16 2.95 2.80 0.20 0.277
Docile2 1.57 1.68 1.57 0.15 0.6241Temperamental calves are those with both chute and exit scores ≥ 2.5 (n = 21)2Docile calves are those with both chute and exit scores < 2.5 (n = 54)3 Effect of frequency group and its interaction with threshold category were not significant (P > 0.05)
Table 2. Effect of event, and day within event, on average chute score of temperamental and docile heifers in frequently handled cattle.
Measurement Threshold Category Event SEM P- Value
1 2 3 Event Day
Chute Score Temperamental1 3.15a 2.48b 2.48b 0.17 0.005 0.102
Docile2 1.90a 1.52b 1.40b 0.13 0.003 0.498
Exit Score Temperamental1 3.04 2.97 2.92 0.22 0.580 0.402
Docile2 1.53a 1.55a 1.38b 0.16 0.034 0.1771Temperamental calves are those with both chute and exit scores ≥ 2.5 (n = 10)2Docile calves are those with both chute and exit scores < 2.5 (n = 30)a,b Means in a row with differing superscripts differ (P < 0.05)
Table 3. Effect of event on average chute score of both frequently and infrequently handled cattle
Chute Score n Event SEM P- Value1
1 2 3 Event
≥ 3.0 27 3.57a 2.49b 2.51b 0.22 0.006
2.5– 3.0 21 2.67a 2.01b 1.98b 0.16 0.018
2.0– 2.5 27 2.18 1.91 2.03 0.16 0.463
1.5– 2.0 24 1.58 1.71 1.83 0.13 0.351
1.0– 1.5 19 1.17 1.46 1.46 0.13 0.1481 Effect of frequency group and the interaction not significant (P > 0.05)a,b Means in a row with differing superscripts differ (P < 0.05)
2018 Nebraska Beef Cattle Report · 77
their chute scores decreased substantially and remained relatively constant thereafter. When cattle are excitable during their first handling experience, more than one obser-vation of temperament may be beneficial before making selection decisions.
Jamie T. Parham, graduate student
Amy E. Tanner, research technician, Animal and Poultry Science, Virginia Tech
Mark L. Wahlberg, associate professor emeritus, Animal and Poultry Science, Virginia Tech
William S. Swecker, Jr., professor, Virginia- Maryland College of Veterinary Medicine
Ronald M. Lewis, professor, Animal Science, Lincoln
Interestingly, there was an increase in chute scores from day 1 to 2 in cattle with chute scores between 1.5 and 3.0. This could indicate residual anxiety in these cattle from handling on day 1. However, with calm handling in the following days, they became more docile.
Conclusion
Docility in cattle is becoming a very popular selection criterion due to its impact on growth, carcass quality and well- being. Selection for docility on site requires a measurement that is fast, inexpensive and relatively easy to conduct. Chute and exit scores in cattle appear to be useful measures of docility. Importantly, heifers appear to acclimate to handling in a calm environment. Particularly in the more temperamental cattle, after just a few days,
and 2.5 decreased in score from event 1 to 3 by 0.81 and 0.57 (P ≤ 0.05), respectfully. Heifers with chute scores between 2.5 and 3.0 decreased almost a full point on the scale; however, the small number of animals (n = 9) coincided with a larger SE, and thus the decline in score only tended toward significance (P = 0.073).
The change in chute score across days for the three groups of F heifers with chute scores greater than 2.0 is shown in Figure 1. Overall, there was a decrease in chute score within each event. In the month time span between events, chute scores either slightly increased, or stayed the same as the previous observation. On the final day of the study, regardless of chute score on day 1, each category on average had a chute score less than 2.0. Subjectively, this score is indic-ative of a docile heifer. Thus, heifers appear to acclimate to calm handling in the chute.
78 · 2018 Nebraska Beef Cattle Report
© The Board Regents of the University of Nebraska. All rights reserved.
74–76). Heart rate, temperature, and a fecal and blood sample were then taken. Upon release from the squeeze chute, an exit score (1 = docile, 5 = aggressive) was recorded by the same individuals. The heifers were eval-uated repeatedly over 3 months, with some heifers scored on as many as 9 occasions.
Observers were split into experienced (E) and inexperienced (IN) groups, de-pending on their level of training, and their reliability was compared in two ways. First, 4 observers from the E group were selected within each year and their consistency (reliability) calculated between all pairs, all trios, or the 4 observers for chute and exit score.
There was a single individual who was present across all 3 years and who scored nearly every heifer in the study. This indi-vidual was considered the most experienced observer, and thereby the benchmark for comparison. All other observers, regard-less of experience, were compared to this individual for reliability. Average reliabili-ties of each two way comparison were then reported separately by group (E or IN), depending on the experience level of the second person.
Statistical Analysis
Reliability of each subjective mea-surement was calculated using percent of agreement (PA) and intra- class correlation (ICC) functions in the R statistical package. Percent of agreement was calculated as:
where PA = 0 meant no agreement and PA = 100 meant perfect agreement. The statistic was calculated with a tolerance of zero, where all observers had exactly the same score, or a tolerance of one, where all ob-servers were within one score of each other.
Intra- class correlation was used as a second measure of reliability and described how strongly observations of the same
cattle when restrained in a squeeze chute (chute score), and when exiting the chute (exit score), has been proposed as a method to measure temperament of animals. These measurements are fast, simple and inex-pensive to collect, making them attractive. However, research using these methods report inconsistent results, some propos-ing the use of these scoring systems while others not. Being a subjective measurement, the scores assigned to an animal are based on the opinion of the observer, which can lead to varying conclusions. Consistency of these measurements is crucial to the effec-tiveness of applying them in cattle enter-prises to select for more docile cattle.
Previous research from this group has shown that chute and exit scores are effec-tive methods of measuring temperament (2018 Nebraska Beef Cattle Report 74–76). The objective of this study was to determine the reliability of assessment of these scores, which could impact their value when mak-ing selection decisions.
Procedure
A 3- year study conducted at Kentland Farm, Blacksburg, VA, utilized predomi-nately Angus (75% or more), spring- born heifer calves. Each year, 40 heifers arrived at the facility following a one week fence line weaning period at the Virginia Tech Shenandoah Valley Agriculture Research Extension Center, and placed in a single management group on grass. Details of the experimental design can be found in a previous report (2018 Nebraska Beef Cattle Report 74–76).
On each day of observation, heifers were moved calmly from a holding pen into a tub, through the alley way, and into the squeeze chute. Each heifer’s head was caught and secured in a head gate and chute score (1 = docile, 6 = aggressive) was recorded by as many as 6 individuals, including the experienced observers whose assessments were analyzed in an adjoining article (2018 Nebraska Beef Cattle Report
Jamie T. ParhamAmy E. Tanner
Mark L. WahlbergW. S. Swecker, Jr.Ronald M. Lewis
Summary with Implications
Reliability of experienced and inexperi-enced observers when assessing the behav-ior of cattle when restrained in a squeeze chute (chute score), and when exiting the chute (exit score), was compared. Overall, experienced observers had higher reliability than inexperienced observers. Increasing the number of individuals scoring an animal decreased the degree of agreement. However, within an acceptable tolerance for difference in scores, such disagreement may be benefi-cial; it allows for subtlety in interpretations of temperament, which when averaged, may better reflect docility. Reliabilities were higher for exit score than chute score. This may reflect the complexity of the trait being eval-uated, with fewer behaviors observed when cattle exit as compared to when restrained in a chute. Producers may profitably use chute and exit score to quantify docility in cattle. However, it may be worthwhile to gain experience in using the scoring system before implementing it for selection decisions.
Introduction
There are many negative effects associ-ated with excitable temperament in cattle such as increased risk to handlers, poorer weight gain and meat eating quality, de-creased tolerance to disease, and increased production costs. This has led to an increase in selection for docility. Breeding values for docility are routinely estimated in beef cattle, but the question remains as to how efficient the industry is at quantifying docil-ity when measured subjectively.
Subjective scoring of the behavior of
Experience Improves the Reliability of Subjective Measurements of Temperament in Beef Cattle
Number of agreementsNumber of total observations
PA = × 100
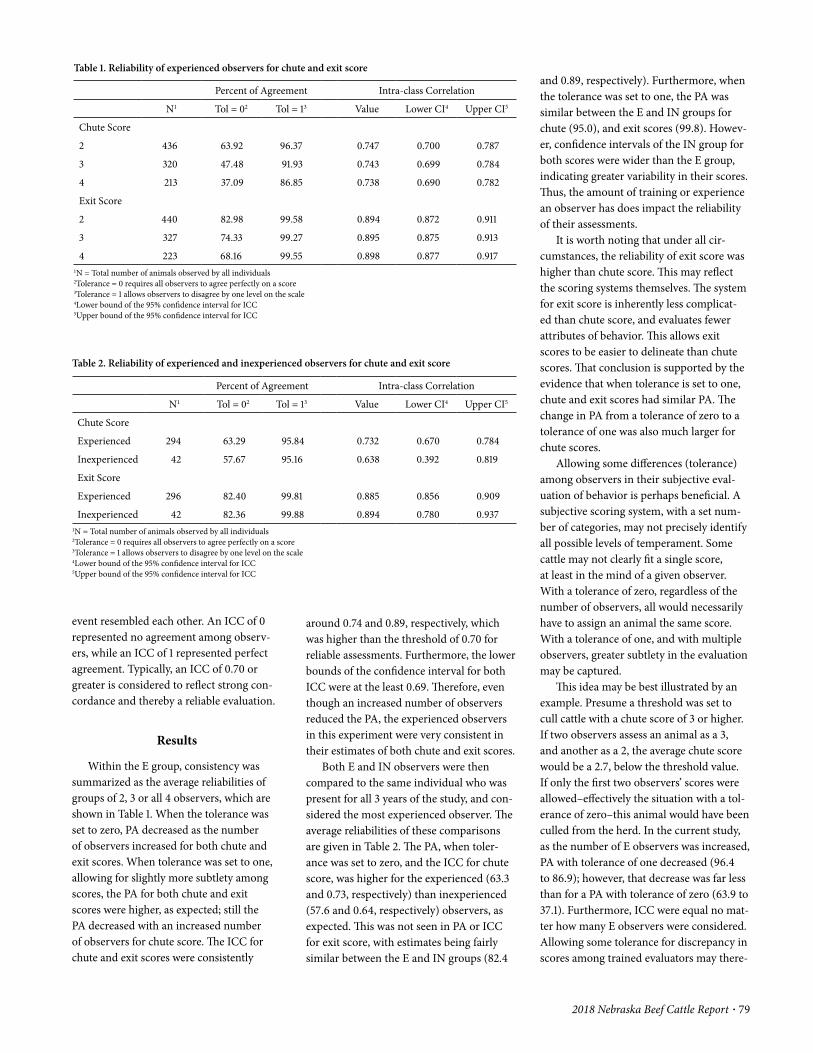
2018 Nebraska Beef Cattle Report · 79
and 0.89, respectively). Furthermore, when the tolerance was set to one, the PA was similar between the E and IN groups for chute (95.0), and exit scores (99.8). Howev-er, confidence intervals of the IN group for both scores were wider than the E group, indicating greater variability in their scores. Thus, the amount of training or experience an observer has does impact the reliability of their assessments.
It is worth noting that under all cir-cumstances, the reliability of exit score was higher than chute score. This may reflect the scoring systems themselves. The system for exit score is inherently less complicat-ed than chute score, and evaluates fewer attributes of behavior. This allows exit scores to be easier to delineate than chute scores. That conclusion is supported by the evidence that when tolerance is set to one, chute and exit scores had similar PA. The change in PA from a tolerance of zero to a tolerance of one was also much larger for chute scores.
Allowing some differences (tolerance) among observers in their subjective eval-uation of behavior is perhaps beneficial. A subjective scoring system, with a set num-ber of categories, may not precisely identify all possible levels of temperament. Some cattle may not clearly fit a single score, at least in the mind of a given observer. With a tolerance of zero, regardless of the number of observers, all would necessarily have to assign an animal the same score. With a tolerance of one, and with multiple observers, greater subtlety in the evaluation may be captured.
This idea may be best illustrated by an example. Presume a threshold was set to cull cattle with a chute score of 3 or higher. If two observers assess an animal as a 3, and another as a 2, the average chute score would be a 2.7, below the threshold value. If only the first two observers’ scores were allowed– effectively the situation with a tol-erance of zero– this animal would have been culled from the herd. In the current study, as the number of E observers was increased, PA with tolerance of one decreased (96.4 to 86.9); however, that decrease was far less than for a PA with tolerance of zero (63.9 to 37.1). Furthermore, ICC were equal no mat-ter how many E observers were considered. Allowing some tolerance for discrepancy in scores among trained evaluators may there-
around 0.74 and 0.89, respectively, which was higher than the threshold of 0.70 for reliable assessments. Furthermore, the lower bounds of the confidence interval for both ICC were at the least 0.69. Therefore, even though an increased number of observers reduced the PA, the experienced observers in this experiment were very consistent in their estimates of both chute and exit scores.
Both E and IN observers were then compared to the same individual who was present for all 3 years of the study, and con-sidered the most experienced observer. The average reliabilities of these comparisons are given in Table 2. The PA, when toler-ance was set to zero, and the ICC for chute score, was higher for the experienced (63.3 and 0.73, respectively) than inexperienced (57.6 and 0.64, respectively) observers, as expected. This was not seen in PA or ICC for exit score, with estimates being fairly similar between the E and IN groups (82.4
event resembled each other. An ICC of 0 represented no agreement among observ-ers, while an ICC of 1 represented perfect agreement. Typically, an ICC of 0.70 or greater is considered to reflect strong con-cordance and thereby a reliable evaluation.
Results
Within the E group, consistency was summarized as the average reliabilities of groups of 2, 3 or all 4 observers, which are shown in Table 1. When the tolerance was set to zero, PA decreased as the number of observers increased for both chute and exit scores. When tolerance was set to one, allowing for slightly more subtlety among scores, the PA for both chute and exit scores were higher, as expected; still the PA decreased with an increased number of observers for chute score. The ICC for chute and exit scores were consistently
Table 1. Reliability of experienced observers for chute and exit score
Percent of Agreement Intra- class Correlation
N1 Tol = 02 Tol = 13 Value Lower CI4 Upper CI5
Chute Score
2 436 63.92 96.37 0.747 0.700 0.787
3 320 47.48 91.93 0.743 0.699 0.784
4 213 37.09 86.85 0.738 0.690 0.782
Exit Score
2 440 82.98 99.58 0.894 0.872 0.911
3 327 74.33 99.27 0.895 0.875 0.913
4 223 68.16 99.55 0.898 0.877 0.9171N = Total number of animals observed by all individuals2Tolerance = 0 requires all observers to agree perfectly on a score3Tolerance = 1 allows observers to disagree by one level on the scale4Lower bound of the 95% confidence interval for ICC5Upper bound of the 95% confidence interval for ICC
Table 2. Reliability of experienced and inexperienced observers for chute and exit score
Percent of Agreement Intra- class Correlation
N1 Tol = 02 Tol = 13 Value Lower CI4 Upper CI5
Chute Score
Experienced 294 63.29 95.84 0.732 0.670 0.784
Inexperienced 42 57.67 95.16 0.638 0.392 0.819
Exit Score
Experienced 296 82.40 99.81 0.885 0.856 0.909
Inexperienced 42 82.36 99.88 0.894 0.780 0.9371N = Total number of animals observed by all individuals2Tolerance = 0 requires all observers to agree perfectly on a score3Tolerance = 1 allows observers to disagree by one level on the scale4Lower bound of the 95% confidence interval for ICC5Upper bound of the 95% confidence interval for ICC

80 · 2018 Nebraska Beef Cattle Report
However, regardless of level of experience, exit scores were consistently evaluated. Exit scores were always more reliably assessed than chute score; this may reflect the increased complexity of delineating among chute scores. With training, the reliability of chute scores became high, and approached that of exit scores. Since both scores can be assessed reliably, their use as measures of temperament could result in positive changes in docility in cattle.
fore allow for a more equitable assessment of temperament.
Conclusion
Chute and exit scores in cattle have been suggested as useful measurements of docility. Experienced observers were more consistent in their assessment of chute score than those who were inexperienced.
Jamie T. Parham, graduate student
Amy E. Tanner, research technician, Animal and Poultry Science, Virginia Tech
Mark L. Wahlberg, associate professor emeritus, Animal and Poultry Science, Virginia Tech
William S. Swecker, Jr., professor, Virginia- Maryland College of Veterinary Medicine
Ronald M. Lewis, professor, Animal Science, Lincoln
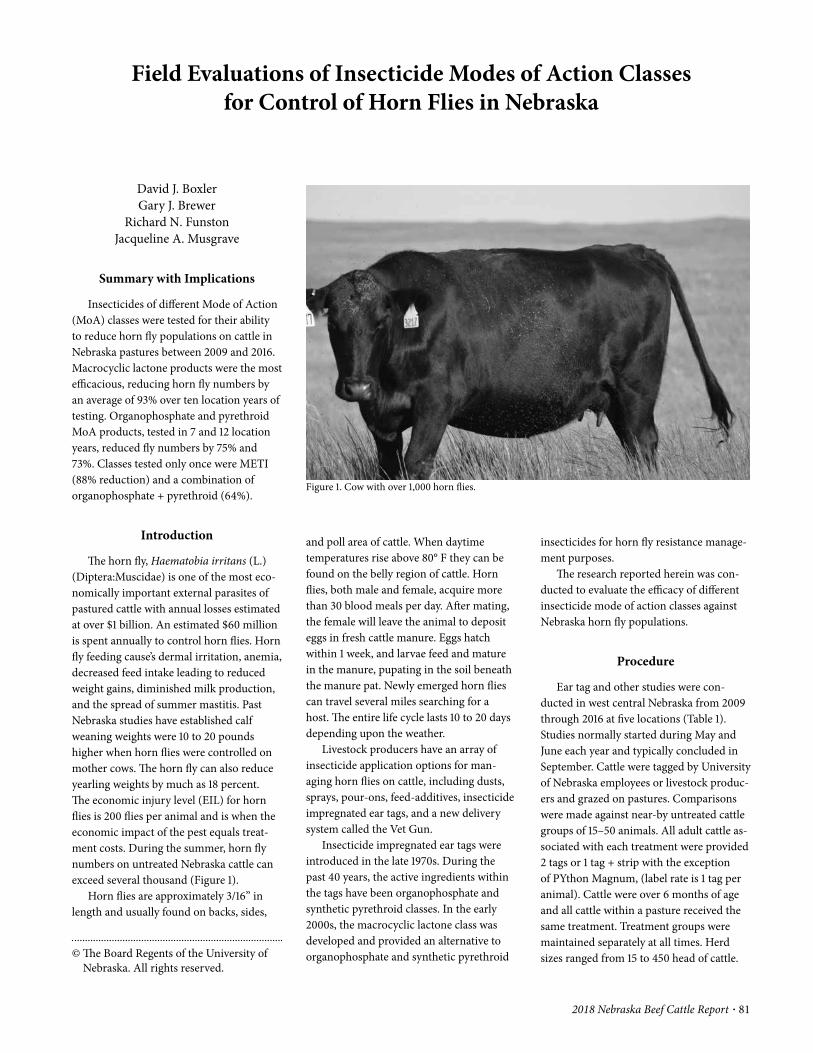
2018 Nebraska Beef Cattle Report · 81
© The Board Regents of the University of Nebraska. All rights reserved.
insecticides for horn fly resistance manage-ment purposes.
The research reported herein was con-ducted to evaluate the efficacy of different insecticide mode of action classes against Nebraska horn fly populations.
Procedure
Ear tag and other studies were con-ducted in west central Nebraska from 2009 through 2016 at five locations (Table 1). Studies normally started during May and June each year and typically concluded in September. Cattle were tagged by University of Nebraska employees or livestock produc-ers and grazed on pastures. Comparisons were made against near- by untreated cattle groups of 15– 50 animals. All adult cattle as-sociated with each treatment were provided 2 tags or 1 tag + strip with the exception of PYthon Magnum, (label rate is 1 tag per animal). Cattle were over 6 months of age and all cattle within a pasture received the same treatment. Treatment groups were maintained separately at all times. Herd sizes ranged from 15 to 450 head of cattle.
and poll area of cattle. When daytime temperatures rise above 80° F they can be found on the belly region of cattle. Horn flies, both male and female, acquire more than 30 blood meals per day. After mating, the female will leave the animal to deposit eggs in fresh cattle manure. Eggs hatch within 1 week, and larvae feed and mature in the manure, pupating in the soil beneath the manure pat. Newly emerged horn flies can travel several miles searching for a host. The entire life cycle lasts 10 to 20 days depending upon the weather.
Livestock producers have an array of insecticide application options for man-aging horn flies on cattle, including dusts, sprays, pour- ons, feed- additives, insecticide impregnated ear tags, and a new delivery system called the Vet Gun.
Insecticide impregnated ear tags were introduced in the late 1970s. During the past 40 years, the active ingredients within the tags have been organophosphate and synthetic pyrethroid classes. In the early 2000s, the macrocyclic lactone class was developed and provided an alternative to organophosphate and synthetic pyrethroid
David J. BoxlerGary J. Brewer
Richard N. FunstonJacqueline A. Musgrave
Summary with Implications
Insecticides of different Mode of Action (MoA) classes were tested for their ability to reduce horn fly populations on cattle in Nebraska pastures between 2009 and 2016. Macrocyclic lactone products were the most efficacious, reducing horn fly numbers by an average of 93% over ten location years of testing. Organophosphate and pyrethroid MoA products, tested in 7 and 12 location years, reduced fly numbers by 75% and 73%. Classes tested only once were METI (88% reduction) and a combination of organophosphate + pyrethroid (64%).
Introduction
The horn fly, Haematobia irritans (L.) (Diptera:Muscidae) is one of the most eco-nomically important external parasites of pastured cattle with annual losses estimated at over $1 billion. An estimated $60 million is spent annually to control horn flies. Horn fly feeding cause’s dermal irritation, anemia, decreased feed intake leading to reduced weight gains, diminished milk production, and the spread of summer mastitis. Past Nebraska studies have established calf weaning weights were 10 to 20 pounds higher when horn flies were controlled on mother cows. The horn fly can also reduce yearling weights by much as 18 percent. The economic injury level (EIL) for horn flies is 200 flies per animal and is when the economic impact of the pest equals treat-ment costs. During the summer, horn fly numbers on untreated Nebraska cattle can exceed several thousand (Figure 1).
Horn flies are approximately 3/16” in length and usually found on backs, sides,
Field Evaluations of Insecticide Modes of Action Classes for Control of Horn Flies in Nebraska
Figure 1. Cow with over 1,000 horn flies.
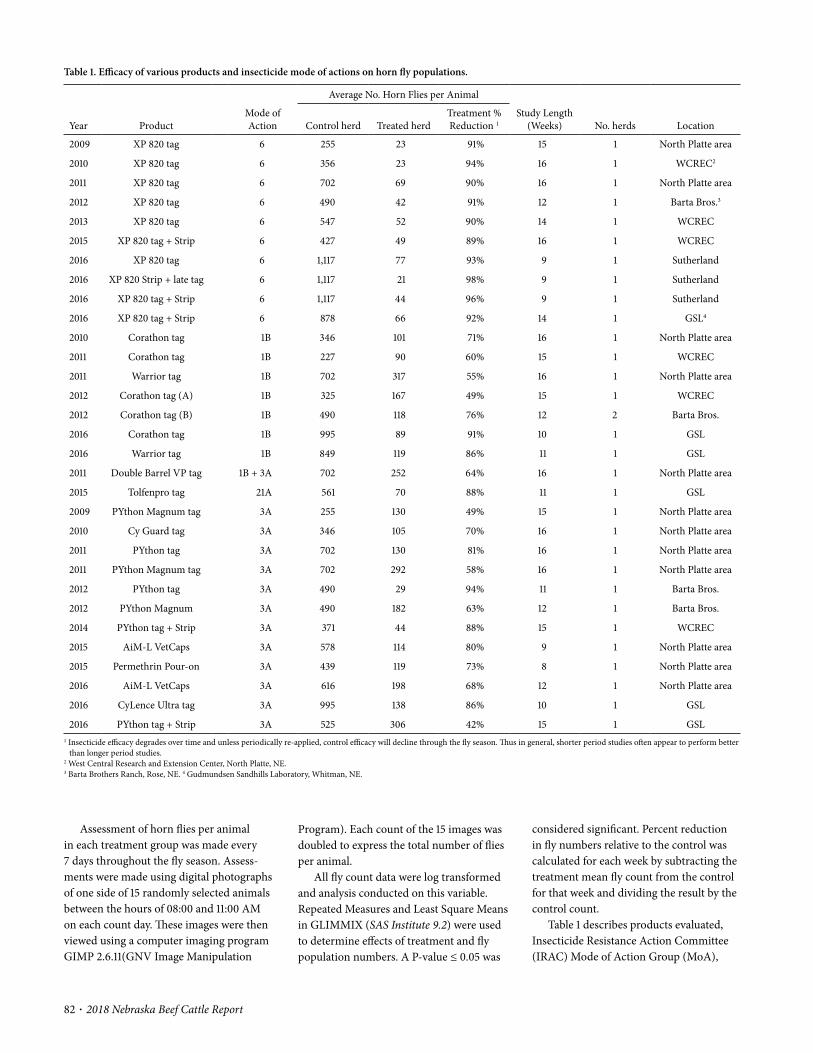
82 · 2018 Nebraska Beef Cattle Report
Table 1. Efficacy of various products and insecticide mode of actions on horn fly populations.
Year ProductMode of Action
Average No. Horn Flies per Animal
Study Length (Weeks) No. herds LocationControl herd Treated herd
Treatment % Reduction 1
2009 XP 820 tag 6 255 23 91% 15 1 North Platte area
2010 XP 820 tag 6 356 23 94% 16 1 WCREC2
2011 XP 820 tag 6 702 69 90% 16 1 North Platte area
2012 XP 820 tag 6 490 42 91% 12 1 Barta Bros.3
2013 XP 820 tag 6 547 52 90% 14 1 WCREC
2015 XP 820 tag + Strip 6 427 49 89% 16 1 WCREC
2016 XP 820 tag 6 1,117 77 93% 9 1 Sutherland
2016 XP 820 Strip + late tag 6 1,117 21 98% 9 1 Sutherland
2016 XP 820 tag + Strip 6 1,117 44 96% 9 1 Sutherland
2016 XP 820 tag + Strip 6 878 66 92% 14 1 GSL4
2010 Corathon tag 1B 346 101 71% 16 1 North Platte area
2011 Corathon tag 1B 227 90 60% 15 1 WCREC
2011 Warrior tag 1B 702 317 55% 16 1 North Platte area
2012 Corathon tag (A) 1B 325 167 49% 15 1 WCREC
2012 Corathon tag (B) 1B 490 118 76% 12 2 Barta Bros.
2016 Corathon tag 1B 995 89 91% 10 1 GSL
2016 Warrior tag 1B 849 119 86% 11 1 GSL
2011 Double Barrel VP tag 1B + 3A 702 252 64% 16 1 North Platte area
2015 Tolfenpro tag 21A 561 70 88% 11 1 GSL
2009 PYthon Magnum tag 3A 255 130 49% 15 1 North Platte area
2010 Cy Guard tag 3A 346 105 70% 16 1 North Platte area
2011 PYthon tag 3A 702 130 81% 16 1 North Platte area
2011 PYthon Magnum tag 3A 702 292 58% 16 1 North Platte area
2012 PYthon tag 3A 490 29 94% 11 1 Barta Bros.
2012 PYthon Magnum 3A 490 182 63% 12 1 Barta Bros.
2014 PYthon tag + Strip 3A 371 44 88% 15 1 WCREC
2015 AiM- L VetCaps 3A 578 114 80% 9 1 North Platte area
2015 Permethrin Pour- on 3A 439 119 73% 8 1 North Platte area
2016 AiM- L VetCaps 3A 616 198 68% 12 1 North Platte area
2016 CyLence Ultra tag 3A 995 138 86% 10 1 GSL
2016 PYthon tag + Strip 3A 525 306 42% 15 1 GSL1 Insecticide efficacy degrades over time and unless periodically re- applied, control efficacy will decline through the fly season. Thus in general, shorter period studies often appear to perform better
than longer period studies.2 West Central Research and Extension Center, North Platte, NE.3 Barta Brothers Ranch, Rose, NE. 4 Gudmundsen Sandhills Laboratory, Whitman, NE.
considered significant. Percent reduction in fly numbers relative to the control was calculated for each week by subtracting the treatment mean fly count from the control for that week and dividing the result by the control count.
Table 1 describes products evaluated, Insecticide Resistance Action Committee (IRAC) Mode of Action Group (MoA),
Program). Each count of the 15 images was doubled to express the total number of flies per animal.
All fly count data were log transformed and analysis conducted on this variable. Repeated Measures and Least Square Means in GLIMMIX (SAS Institute 9.2) were used to determine effects of treatment and fly population numbers. A P- value ≤ 0.05 was
Assessment of horn flies per animal in each treatment group was made every 7 days throughout the fly season. Assess-ments were made using digital photographs of one side of 15 randomly selected animals between the hours of 08:00 and 11:00 AM on each count day. These images were then viewed using a computer imaging program GIMP 2.6.11(GNV Image Manipulation

2018 Nebraska Beef Cattle Report · 83
0.001). There was no significant difference (P > 0.05) in fly numbers between PYthon and XP 820 tags. Horn fly numbers for the untreated herd averaged 702 flies.
2012
Corathon ear tags were evaluated at two locations, North Platte and Barta Brothers. Horn fly numbers on cattle at North Platte exceeded the EIL during week 13 of the 15 week study with study average of 167 flies (P = 0.01) and a 49% change in fly numbers compared to an untreated herd with a study average of 325. Two herds of cattle were treated with Corathon tags at Barta Broth-ers, and counts recorded. Fly counts were averaged from the two herds and expressed as the overall average. Fly numbers held below the EIL for these herds until week 11 of the 12 week study with a study average of 118 (P = 0.02) and a 76 percent change in fly numbers compared to untreated herds with a study average of 490.
Other Barta Brothers studies evaluated PYthon, PYthon Magnum, and XP 820 treatments. Horn fly numbers were held below the EIL by the PYthon treatment, with an average of 29.4 flies (P < 0.001) and a 94% change in fly numbers for the 11 week study. Horn fly numbers on cattle with the PYthon Magnum treatment exceeded the EIL during week 9, with a study average of 181.5 flies (P = 0.07) and a 63% change in fly numbers. Cattle with the XP 820 treatment had horn fly numbers maintained below the EIL until week 12 of the study. Fly numbers were changed by 91% with a study average
numbers averaged 23 (P < 0.001) per animal for the study, providing a 94 percent change in fly numbers compared to 356 flies an untreated herd.
2011
Horn fly numbers on cattle with Co-rathon ear tags remained below the EIL for 13 weeks of a 15 week study with horn fly numbers averaging 90 per animal (P < 0.001) compared to 227 flies on the untreat-ed herd.
In a comparative fly tag study at North Platte, 5 different insecticide ear tags were evaluated for 16 weeks. PYthon Magnum tags kept horn fly numbers below the EIL for 7 weeks, with a study average of 29, providing a 58% change in fly numbers. Warrior tags maintained fly numbers below the EIL for 8 weeks with an overall average of 317 flies per animal providing a 54% change in fly numbers. Double Barrel VP maintained fly numbers below the EIL for 8 weeks with an overall average of 252 flies or a 64% change in fly numbers. Horn fly numbers on PYthon treated cattle were kept below the EIL for 13 weeks with an overall average of 130 flies per animal resulting in season- long, 81% reduction in fly numbers. The XP 820 tags held fly numbers below the EIL for 16 weeks with an overall average of 69 or a 90% change in horn fly numbers. There was no significant difference in horn fly numbers (P = 0.06) between PYthon Magnum, Double Barrel VP, and Warrior ear tags, but were significantly different from PYthon and XP 820 ear tags (P <
average no. horn flies per animal for treated vs untreated, study length, number of herds, and location tested.
Table 2 summarizes the results from 2009 to 2016 studies. Provided are mean results by insecticide class and mode of action, number of trials, and study length.
Results
2009
PYthon Magnum tags maintained horn fly numbers below the EIL of 200 through 9 weeks of a 15 week study, with a study average of 130 flies (P = .032) providing a 49 percent change in fly numbers compared with 255 flies observed on the untreated herd. The XP 820 ear tags kept fly numbers below the EIL of 200 for the entire 15 week study (P < 0.001) with an overall average of 23 flies per animal equating to a 91 percent change in fly numbers compared to 255 flies on the untreated herd.
2010
Corathon tags suppressed horn fly numbers below the EIL for 12 weeks, with an overall average of 101 flies per animal (P < 0.001) providing a 71 percent change in fly numbers for the 16 week study. Cy Guard ear tags sustained horn fly numbers below the EIL for 15 weeks, with an overall average of 105 flies per animal (P < 0.001) providing a 70 percent change in fly numbers. The XP 820 tags kept horn fly numbers below the EIL for the entire 15 week study. Overall, fly
Table 2. Summary of various modes of action classes of insecticides on horn fly populations from 2009 to 2016.
Insecticide ClassMode of Action1 No. Trials 2
Mean Study Length (Weeks) 3
Season Average Horn Flies per Animal
% Reduction in Horn Fly Numbers in Treatment Herds Relative to Control HerdsControl Herds Treated Herds
Macrocyclic lactone
6 10 13 701 47 93%
METI4 21A 1 11 561 70 88%
Organophosphate 1B 7 14 562 143 75%
Organophosphate + Pyrethroid
1B + 3A 1 16 702 252 64%
Pyrethroid 3A 14 13 542 149 73%1 Mode of action classification (Insecticide Resistance Action Committee, http:// www .irac - online .org /modes - of - action/)2 May include multiple locations in a year.3 Ear tag efficacy naturally declines over time. As a result, shorter period studies may appear to perform better than longer period studies.4 Mitochondrial complex III electron transport inhibitor, acaricides and insecticides.

84 · 2018 Nebraska Beef Cattle Report
of 42.15 flies per animal (P = 0.03) com-pared to 490.17 flies for the untreated herd. No significant difference in fly numbers was detected between Python and XP 820 ear tags (P = 0.07).
2013
The XP 820 treatment suppressed horn fly numbers below the EIL for the entire 14 week study with an average of 52 flies (P < 0.001) compared to 547 flies for an untreat-ed herd, a 90% change in fly numbers.
2014
Horn fly numbers on cattle treated with PYthon tags and Insecticide Cattle Strips were held below the EIL for the entire 15 week study with an average of 44 flies (P < 0.001) contrasted to an untreated herd with 371 flies, equating to an 88% change in fly numbers.
2015
The XP 820 ear tags and Insecticide Cattle Strips maintained horn fly numbers below the EIL through week 15 of the 16 week study with fly numbers averaging 49 per animal (P < 0.001) compared to 427 flies on an untreated herd resulting in an 89% change in fly numbers.
Horn fly numbers on cattle treated with Tolfenpro tags a new MoA (Table 1) were held below the EIL through the 11 week study. Horn fly numbers averaged 70 flies per animal (P < 0.001) with 88% reduction in fly numbers. Horn fly numbers on a control herd averaged 561 per animal.
Two non- ear tag studies were completed in 2015. Permethrin 1% pour- on applied twice during an 8 week study maintained horn fly numbers below the EIL for an average of 22 days per appliction. Fly num-bers averaged 119 flies (P < 0.001) with a 73% change in fly numbers compared to an average of 439 on the untreated herd.
VetGun Aim- L VetCaps applied twice during a 9 week period maintained horn fly numbers below the EIL an average of 24 days, and provided an 80% change in fly numbers with an average of 114 flies (P < 0.001) compared to 578 flies for an untreated herd.
2016
Four different insecticide ear tags were evaluated at GSL: Corathon, CyLence Ultra, Warrior, and XP 820 tags and Insecticide Cattle Strips.
Horn fly numbers on Corathon treated cattle kept fly numbers below the EIL for 10 weeks, with a treatment average of 88 (P < 0.001) a 91% change in fly numbers com-pared to 955 flies for the untreated herd.
CyLence Ultra ear tags held horn fly numbers below the EIL for 8 weeks, with a treatment average of 138 (P < 0.001) with an 86% change in fly numbers compared with an untreated herd with a mean of 955 for the 10 week study.
Horn fly numbers on Warrior treated cattle kept fly numbers below the EIL for 11 weeks. The treatment average for the 12 week study was 119 (P < 0.001) with an 86% change in fly numbers compared to an average of 849 for an untreated herd.
The XP 820 ear tags and Insecticide Cattle Strips maintained horn fly numbers below the EIL for 13 weeks with an average of 66 flies (P < 0.001) or a 92% reduction in fly numbers for the 14 week study. In contrast, fly numbers on an untreated herd averaged 878.
Cattle at WCREC were treated with PYthon tags and Insecticide Cattle Strips. Horn fly numbers were held below the EIL for just 6 weeks, with a study average of 306 (P < 0.001) and a 41% change in fly num-bers compared to an untreated herd with an average of 525 for the 15 week study.
VetGun Aim- L VetCaps applied three times over a 12 week period maintained horn fly numbers below the EIL an average of 15 days, providing a 68% change in fly numbers with an average of 198 flies (P < 0.001) compared to 616 flies for an untreat-ed herd.
A study was designed to evaluate XP 820 tags and Insecticide Cattle Strips on horn fly numbers when applied early to yearling beef heifers. Three different treatments were applied; (1) one tag + one strip, (2) one strip + one tag applied mid- season, and (3) two tags. The initial treatments were applied in early May and the late applied ear tags, in late June. The observa-tions were initiated 6/10/17 and continued weekly until the study was ended. Horn fly numbers for weeks 1 through 4 were not significantly different between the three
treatments (P > 0.06) but were significantly different compared with the untreated herd (P < 0.001). During weeks 5 through 9, fly numbers for Treatment 1 (72/animal) were significantly different from Treatment 2 (28 per animal) P = 0.002, but not significantly different from Treatment 3 (114 per animal) P = 0.12. Fly numbers for Treatment 2 were significantly different from Treatment 3 (P < 0.001).
Treatment 1 kept horn fly numbers be-low the EIL for 9 weeks with an average of 43, a 96% change in fly numbers. Treatment 2 held horn fly numbers below the EIL for 9 weeks with a study average of 21 and a 98% change in fly numbers. Treatment 3 maintained fly horn fly numbers below the EIL for 9 weeks with an average of 77 flies, and a 93% change in fly numbers. Overall, a significant difference in fly numbers existed between Treatments 1 and 2 (P = 0.03) and between Treatments 1 and 3 (P < 0.001). A significant difference in fly numbers existed between Treatment 2 and 3 (P < 0.001). The untreated herd had a study average of 1117 flies. Actual time treatments on the animals were as follows: Treatment 1 and 2, 14 weeks, and Treatment 3, 14 weeks for the Insecticide Cattle Strip and 6 weeks for the ear tag.
An overview of Mode of Action class performance against horn fly populations for years 2009 through 2016 is described in (Table 2). Macrocyclic lactone control products delivered a 93% change in horn fly numbers with an average of 47 flies per animal. A METI control product reduced horn fly numbers by 88% with an average of 70 flies per animal. Organophosphate control products reduced horn fly numbers by 75% with an average of 143 flies per ani-mal. Organophosphate + pyrethroid control products reduced horn fly numbers by 64% with an average of 252 flies per animal. Pyrethroid treatments reduced horn fly numbers by 73% with an average of 149 flies per animal.
Conclusion
Field resistance to organophosphate (MoA 1B) and pyrethroid (MoA 3A) insecticides is widespread in horn fly pop-ulations nationally. In Nebraska, concern about potential insecticide resistance and
2018 Nebraska Beef Cattle Report · 85
have to re- tag by mid- summer or switch to an alternative horn fly control method for late season control.
Acknowledgements
We thank Y- Tex Corporation (Cody, WY), Bayer Animal Health AG (Whippany, NJ), SmartVet USA Inc. (Olathe, KS) and Agri Labs (St. Joseph, MO) for providing test products.
David J. Boxler, extension educator, West Central Research and Extension Center
Gary J. Brewer, professor and Department Head, UNL Department of Entomology, Lincoln, NE
Rick N. Funston, professor, UNL West Central Research and Extension Center
Jacqueline A. Musgrave, research technologist, Gudmundsen Sandhills Laboratory, Whitman, NE
Producers should adopt an annual rotation plan among the three mode of action classes (6, 1B, and 3A) labeled for horn fly control in Nebraska (Table 2).
A frequent complaint about insecticide ear tags and strips is they lose efficacy against fly populations late in the summer. To improve and extend horn fly control through the fly season insecticide ear tags and strips should be applied as late as possible before cattle are turned out to pasture, preferably late May or early June. Field studies conducted during the past 10 years indicate maximum length of acceptable control from insecticide ear tags or strips on horn fly numbers would be 15 to 16 weeks depending on the control product used. Livestock producers who turn their cattle out in early May or earlier with insecticide ear tags will most likely
early season loss of control prompted on- going efficacy trials starting in 2009. Our field efficacy trials show horn fly control from organophosphate and pyrethroid products are not as effective as newer mac-rocylic lactone and METI ear tags.
In 2015 and even more so in 2016 we received reports of poor horn fly control from Nebraska producers using pyrethroid ear tags. In 2016 two field populations of horn flies were collected and bioassayed for synthetic pyrethroid resistance. Horn flies collected from GSL had a 288x level of resistance to permethrin, and flies collected from WCREC were found to have a 112x level of resistance to permethrin when com-pared to a susceptible lab strain.
These lines of evidence indicate that ef-fective insecticide resistance management is vital to retain horn fly control in Nebraska.
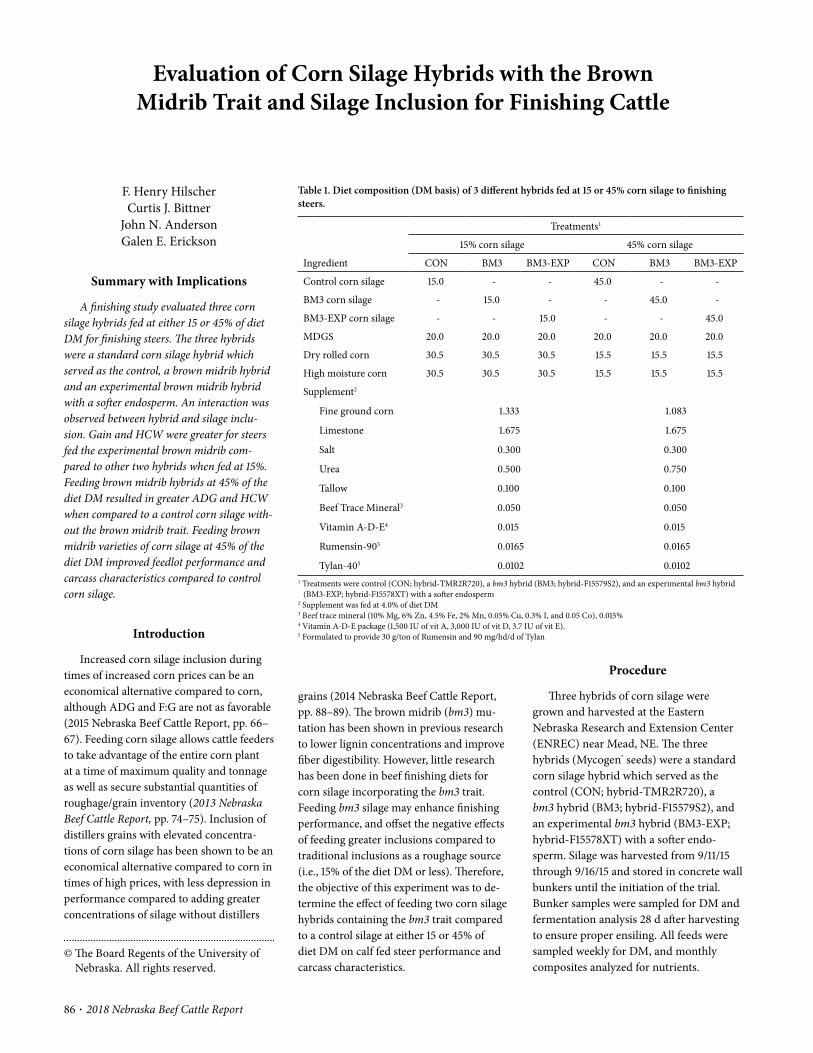
86 · 2018 Nebraska Beef Cattle Report
© The Board Regents of the University of Nebraska. All rights reserved.
Procedure
Three hybrids of corn silage were grown and harvested at the Eastern Nebraska Research and Extension Center (ENREC) near Mead, NE. The three hybrids (Mycogen® seeds) were a standard corn silage hybrid which served as the control (CON; hybrid- TMR2R720), a bm3 hybrid (BM3; hybrid- F15579S2), and an experimental bm3 hybrid (BM3- EXP; hybrid- F15578XT) with a softer endo-sperm. Silage was harvested from 9/11/15 through 9/16/15 and stored in concrete wall bunkers until the initiation of the trial. Bunker samples were sampled for DM and fermentation analysis 28 d after harvesting to ensure proper ensiling. All feeds were sampled weekly for DM, and monthly composites analyzed for nutrients.
grains (2014 Nebraska Beef Cattle Report, pp. 88– 89). The brown midrib (bm3) mu-tation has been shown in previous research to lower lignin concentrations and improve fiber digestibility. However, little research has been done in beef finishing diets for corn silage incorporating the bm3 trait. Feeding bm3 silage may enhance finishing performance, and offset the negative effects of feeding greater inclusions compared to traditional inclusions as a roughage source (i.e., 15% of the diet DM or less). Therefore, the objective of this experiment was to de-termine the effect of feeding two corn silage hybrids containing the bm3 trait compared to a control silage at either 15 or 45% of diet DM on calf fed steer performance and carcass characteristics.
F. Henry HilscherCurtis J. Bittner
John N. AndersonGalen E. Erickson
Summary with Implications
A finishing study evaluated three corn silage hybrids fed at either 15 or 45% of diet DM for finishing steers. The three hybrids were a standard corn silage hybrid which served as the control, a brown midrib hybrid and an experimental brown midrib hybrid with a softer endosperm. An interaction was observed between hybrid and silage inclu-sion. Gain and HCW were greater for steers fed the experimental brown midrib com-pared to other two hybrids when fed at 15%. Feeding brown midrib hybrids at 45% of the diet DM resulted in greater ADG and HCW when compared to a control corn silage with-out the brown midrib trait. Feeding brown midrib varieties of corn silage at 45% of the diet DM improved feedlot performance and carcass characteristics compared to control corn silage.
Introduction
Increased corn silage inclusion during times of increased corn prices can be an economical alternative compared to corn, although ADG and F:G are not as favorable (2015 Nebraska Beef Cattle Report, pp. 66– 67). Feeding corn silage allows cattle feeders to take advantage of the entire corn plant at a time of maximum quality and tonnage as well as secure substantial quantities of roughage/grain inventory (2013 Nebraska Beef Cattle Report, pp. 74– 75). Inclusion of distillers grains with elevated concentra-tions of corn silage has been shown to be an economical alternative compared to corn in times of high prices, with less depression in performance compared to adding greater concentrations of silage without distillers
Evaluation of Corn Silage Hybrids with the Brown Midrib Trait and Silage Inclusion for Finishing Cattle
Table 1. Diet composition (DM basis) of 3 different hybrids fed at 15 or 45% corn silage to finishing steers.
Ingredient
Treatments1
15% corn silage 45% corn silage
CON BM3 BM3- EXP CON BM3 BM3- EXP
Control corn silage 15.0 - - 45.0 - -
BM3 corn silage - 15.0 - - 45.0 -
BM3- EXP corn silage - - 15.0 - - 45.0
MDGS 20.0 20.0 20.0 20.0 20.0 20.0
Dry rolled corn 30.5 30.5 30.5 15.5 15.5 15.5
High moisture corn 30.5 30.5 30.5 15.5 15.5 15.5
Supplement2
Fine ground corn 1.333 1.083
Limestone 1.675 1.675
Salt 0.300 0.300
Urea 0.500 0.750
Tallow 0.100 0.100
Beef Trace Mineral3 0.050 0.050
Vitamin A- D- E4 0.015 0.015
Rumensin- 905 0.0165 0.0165
Tylan- 405 0.0102 0.01021 Treatments were control (CON; hybrid- TMR2R720), a bm3 hybrid (BM3; hybrid- F15579S2), and an experimental bm3 hybrid
(BM3- EXP; hybrid- F15578XT) with a softer endosperm2 Supplement was fed at 4.0% of diet DM3 Beef trace mineral (10% Mg, 6% Zn, 4.5% Fe, 2% Mn, 0.05% Cu, 0.3% I, and 0.05 Co), 0.015%4 Vitamin A- D- E package (1,500 IU of vit A, 3,000 IU of vit D, 3.7 IU of vit E).5 Formulated to provide 30 g/ton of Rumensin and 90 mg/hd/d of Tylan
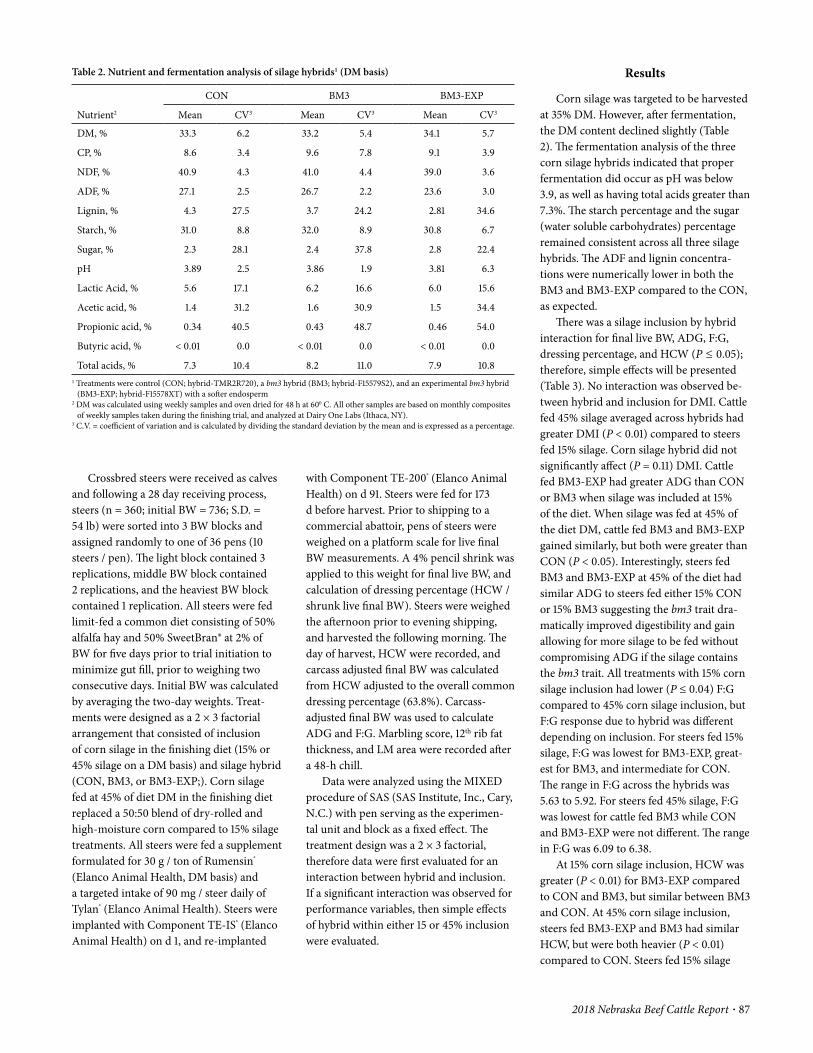
2018 Nebraska Beef Cattle Report · 87
Results
Corn silage was targeted to be harvested at 35% DM. However, after fermentation, the DM content declined slightly (Table 2). The fermentation analysis of the three corn silage hybrids indicated that proper fermentation did occur as pH was below 3.9, as well as having total acids greater than 7.3%. The starch percentage and the sugar (water soluble carbohydrates) percentage remained consistent across all three silage hybrids. The ADF and lignin concentra-tions were numerically lower in both the BM3 and BM3- EXP compared to the CON, as expected.
There was a silage inclusion by hybrid interaction for final live BW, ADG, F:G, dressing percentage, and HCW (P ≤ 0.05); therefore, simple effects will be presented (Table 3). No interaction was observed be-tween hybrid and inclusion for DMI. Cattle fed 45% silage averaged across hybrids had greater DMI (P < 0.01) compared to steers fed 15% silage. Corn silage hybrid did not significantly affect (P = 0.11) DMI. Cattle fed BM3- EXP had greater ADG than CON or BM3 when silage was included at 15% of the diet. When silage was fed at 45% of the diet DM, cattle fed BM3 and BM3- EXP gained similarly, but both were greater than CON (P < 0.05). Interestingly, steers fed BM3 and BM3- EXP at 45% of the diet had similar ADG to steers fed either 15% CON or 15% BM3 suggesting the bm3 trait dra-matically improved digestibility and gain allowing for more silage to be fed without compromising ADG if the silage contains the bm3 trait. All treatments with 15% corn silage inclusion had lower (P ≤ 0.04) F:G compared to 45% corn silage inclusion, but F:G response due to hybrid was different depending on inclusion. For steers fed 15% silage, F:G was lowest for BM3- EXP, great-est for BM3, and intermediate for CON. The range in F:G across the hybrids was 5.63 to 5.92. For steers fed 45% silage, F:G was lowest for cattle fed BM3 while CON and BM3- EXP were not different. The range in F:G was 6.09 to 6.38.
At 15% corn silage inclusion, HCW was greater (P < 0.01) for BM3- EXP compared to CON and BM3, but similar between BM3 and CON. At 45% corn silage inclusion, steers fed BM3- EXP and BM3 had similar HCW, but were both heavier (P < 0.01) compared to CON. Steers fed 15% silage
with Component TE- 200® (Elanco Animal Health) on d 91. Steers were fed for 173 d before harvest. Prior to shipping to a commercial abattoir, pens of steers were weighed on a platform scale for live final BW measurements. A 4% pencil shrink was applied to this weight for final live BW, and calculation of dressing percentage (HCW / shrunk live final BW). Steers were weighed the afternoon prior to evening shipping, and harvested the following morning. The day of harvest, HCW were recorded, and carcass adjusted final BW was calculated from HCW adjusted to the overall common dressing percentage (63.8%). Carcass- adjusted final BW was used to calculate ADG and F:G. Marbling score, 12th rib fat thickness, and LM area were recorded after a 48- h chill.
Data were analyzed using the MIXED procedure of SAS (SAS Institute, Inc., Cary, N.C.) with pen serving as the experimen-tal unit and block as a fixed effect. The treatment design was a 2 × 3 factorial, therefore data were first evaluated for an interaction between hybrid and inclusion. If a significant interaction was observed for performance variables, then simple effects of hybrid within either 15 or 45% inclusion were evaluated.
Crossbred steers were received as calves and following a 28 day receiving process, steers (n = 360; initial BW = 736; S.D. = 54 lb) were sorted into 3 BW blocks and assigned randomly to one of 36 pens (10 steers / pen). The light block contained 3 replications, middle BW block contained 2 replications, and the heaviest BW block contained 1 replication. All steers were fed limit- fed a common diet consisting of 50% alfalfa hay and 50% SweetBran® at 2% of BW for five days prior to trial initiation to minimize gut fill, prior to weighing two consecutive days. Initial BW was calculated by averaging the two- day weights. Treat-ments were designed as a 2 × 3 factorial arrangement that consisted of inclusion of corn silage in the finishing diet (15% or 45% silage on a DM basis) and silage hybrid (CON, BM3, or BM3- EXP;). Corn silage fed at 45% of diet DM in the finishing diet replaced a 50:50 blend of dry- rolled and high- moisture corn compared to 15% silage treatments. All steers were fed a supplement formulated for 30 g / ton of Rumensin® (Elanco Animal Health, DM basis) and a targeted intake of 90 mg / steer daily of Tylan® (Elanco Animal Health). Steers were implanted with Component TE- IS® (Elanco Animal Health) on d 1, and re- implanted
Table 2. Nutrient and fermentation analysis of silage hybrids1 (DM basis)
Nutrient2
CON BM3 BM3- EXP
Mean CV3 Mean CV3 Mean CV3
DM, % 33.3 6.2 33.2 5.4 34.1 5.7
CP, % 8.6 3.4 9.6 7.8 9.1 3.9
NDF, % 40.9 4.3 41.0 4.4 39.0 3.6
ADF, % 27.1 2.5 26.7 2.2 23.6 3.0
Lignin, % 4.3 27.5 3.7 24.2 2.81 34.6
Starch, % 31.0 8.8 32.0 8.9 30.8 6.7
Sugar, % 2.3 28.1 2.4 37.8 2.8 22.4
pH 3.89 2.5 3.86 1.9 3.81 6.3
Lactic Acid, % 5.6 17.1 6.2 16.6 6.0 15.6
Acetic acid, % 1.4 31.2 1.6 30.9 1.5 34.4
Propionic acid, % 0.34 40.5 0.43 48.7 0.46 54.0
Butyric acid, % < 0.01 0.0 < 0.01 0.0 < 0.01 0.0
Total acids, % 7.3 10.4 8.2 11.0 7.9 10.81 Treatments were control (CON; hybrid- TMR2R720), a bm3 hybrid (BM3; hybrid- F15579S2), and an experimental bm3 hybrid
(BM3- EXP; hybrid- F15578XT) with a softer endosperm2 DM was calculated using weekly samples and oven dried for 48 h at 600 C. All other samples are based on monthly composites
of weekly samples taken during the finishing trial, and analyzed at Dairy One Labs (Ithaca, NY).3 C.V. = coefficient of variation and is calculated by dividing the standard deviation by the mean and is expressed as a percentage.
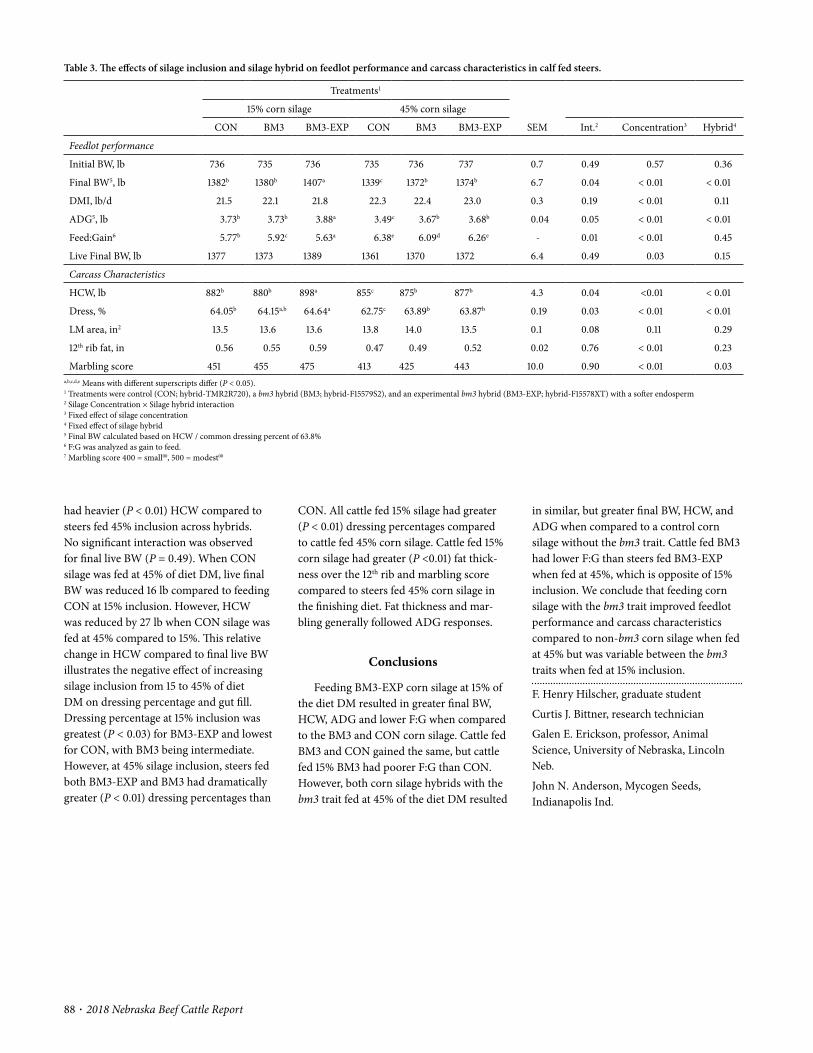
88 · 2018 Nebraska Beef Cattle Report
in similar, but greater final BW, HCW, and ADG when compared to a control corn silage without the bm3 trait. Cattle fed BM3 had lower F:G than steers fed BM3- EXP when fed at 45%, which is opposite of 15% inclusion. We conclude that feeding corn silage with the bm3 trait improved feedlot performance and carcass characteristics compared to non- bm3 corn silage when fed at 45% but was variable between the bm3 traits when fed at 15% inclusion.
F. Henry Hilscher, graduate student
Curtis J. Bittner, research technician
Galen E. Erickson, professor, Animal Science, University of Nebraska, Lincoln Neb.
John N. Anderson, Mycogen Seeds, Indianapolis Ind.
CON. All cattle fed 15% silage had greater (P < 0.01) dressing percentages compared to cattle fed 45% corn silage. Cattle fed 15% corn silage had greater (P <0.01) fat thick-ness over the 12th rib and marbling score compared to steers fed 45% corn silage in the finishing diet. Fat thickness and mar-bling generally followed ADG responses.
Conclusions
Feeding BM3- EXP corn silage at 15% of the diet DM resulted in greater final BW, HCW, ADG and lower F:G when compared to the BM3 and CON corn silage. Cattle fed BM3 and CON gained the same, but cattle fed 15% BM3 had poorer F:G than CON. However, both corn silage hybrids with the bm3 trait fed at 45% of the diet DM resulted
had heavier (P < 0.01) HCW compared to steers fed 45% inclusion across hybrids. No significant interaction was observed for final live BW (P = 0.49). When CON silage was fed at 45% of diet DM, live final BW was reduced 16 lb compared to feeding CON at 15% inclusion. However, HCW was reduced by 27 lb when CON silage was fed at 45% compared to 15%. This relative change in HCW compared to final live BW illustrates the negative effect of increasing silage inclusion from 15 to 45% of diet DM on dressing percentage and gut fill. Dressing percentage at 15% inclusion was greatest (P < 0.03) for BM3- EXP and lowest for CON, with BM3 being intermediate. However, at 45% silage inclusion, steers fed both BM3- EXP and BM3 had dramatically greater (P < 0.01) dressing percentages than
Table 3. The effects of silage inclusion and silage hybrid on feedlot performance and carcass characteristics in calf fed steers.
Treatments1
SEM
15% corn silage 45% corn silage
CON BM3 BM3- EXP CON BM3 BM3- EXP Int.2 Concentration3 Hybrid4
Feedlot performance
Initial BW, lb 736 735 736 735 736 737 0.7 0.49 0.57 0.36
Final BW5, lb 1382b 1380b 1407a 1339c 1372b 1374b 6.7 0.04 < 0.01 < 0.01
DMI, lb/d 21.5 22.1 21.8 22.3 22.4 23.0 0.3 0.19 < 0.01 0.11
ADG5, lb 3.73b 3.73b 3.88a 3.49c 3.67b 3.68b 0.04 0.05 < 0.01 < 0.01
Feed:Gain6 5.77b 5.92c 5.63a 6.38e 6.09d 6.26e - 0.01 < 0.01 0.45
Live Final BW, lb 1377 1373 1389 1361 1370 1372 6.4 0.49 0.03 0.15
Carcass Characteristics
HCW, lb 882b 880b 898a 855c 875b 877b 4.3 0.04 <0.01 < 0.01
Dress, % 64.05b 64.15a,b 64.64a 62.75c 63.89b 63.87b 0.19 0.03 < 0.01 < 0.01
LM area, in2 13.5 13.6 13.6 13.8 14.0 13.5 0.1 0.08 0.11 0.29
12th rib fat, in 0.56 0.55 0.59 0.47 0.49 0.52 0.02 0.76 < 0.01 0.23
Marbling score 451 455 475 413 425 443 10.0 0.90 < 0.01 0.03a,b,c,d,e Means with different superscripts differ (P < 0.05).1 Treatments were control (CON; hybrid- TMR2R720), a bm3 hybrid (BM3; hybrid- F15579S2), and an experimental bm3 hybrid (BM3- EXP; hybrid- F15578XT) with a softer endosperm2 Silage Concentration × Silage hybrid interaction3 Fixed effect of silage concentration4 Fixed effect of silage hybrid5 Final BW calculated based on HCW / common dressing percent of 63.8%6 F:G was analyzed as gain to feed.7 Marbling score 400 = small00, 500 = modest00
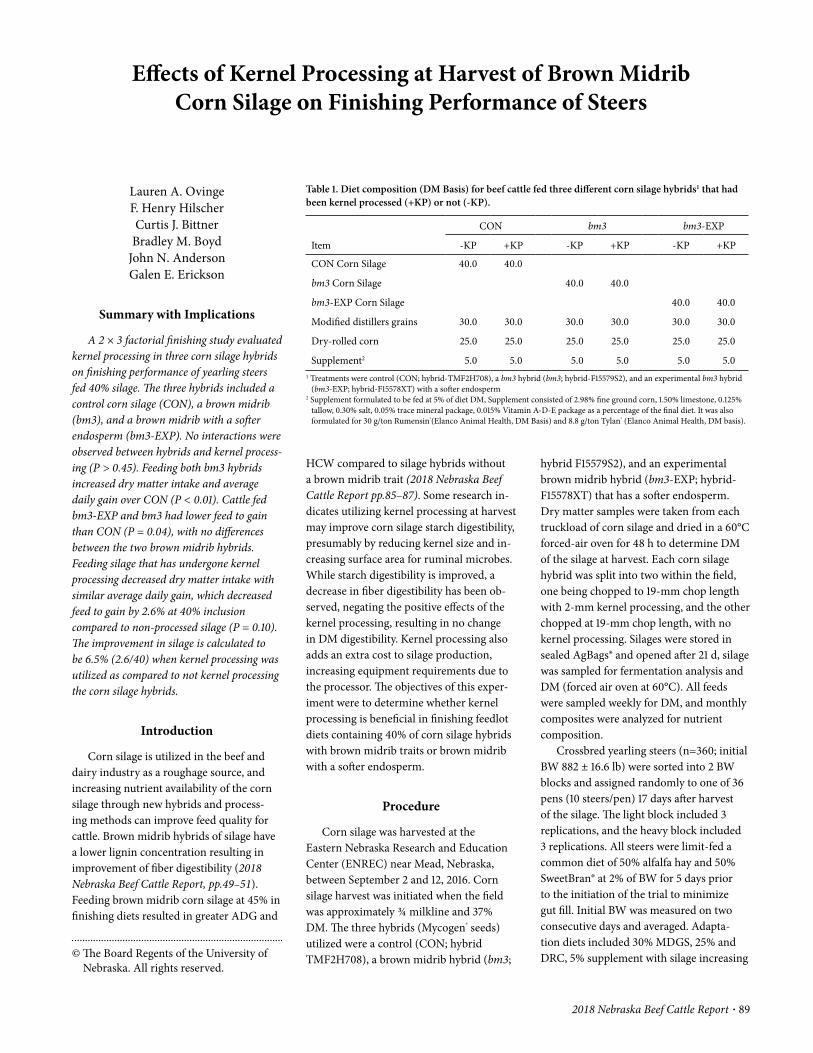
2018 Nebraska Beef Cattle Report · 89
© The Board Regents of the University of Nebraska. All rights reserved.
hybrid F15579S2), and an experimental brown midrib hybrid (bm3- EXP; hybrid- F15578XT) that has a softer endosperm. Dry matter samples were taken from each truckload of corn silage and dried in a 60°C forced- air oven for 48 h to determine DM of the silage at harvest. Each corn silage hybrid was split into two within the field, one being chopped to 19- mm chop length with 2- mm kernel processing, and the other chopped at 19- mm chop length, with no kernel processing. Silages were stored in sealed AgBags® and opened after 21 d, silage was sampled for fermentation analysis and DM (forced air oven at 60°C). All feeds were sampled weekly for DM, and monthly composites were analyzed for nutrient composition.
Crossbred yearling steers (n=360; initial BW 882 ± 16.6 lb) were sorted into 2 BW blocks and assigned randomly to one of 36 pens (10 steers/pen) 17 days after harvest of the silage. The light block included 3 replications, and the heavy block included 3 replications. All steers were limit- fed a common diet of 50% alfalfa hay and 50% SweetBran® at 2% of BW for 5 days prior to the initiation of the trial to minimize gut fill. Initial BW was measured on two consecutive days and averaged. Adapta-tion diets included 30% MDGS, 25% and DRC, 5% supplement with silage increasing
HCW compared to silage hybrids without a brown midrib trait (2018 Nebraska Beef Cattle Report pp.85–87). Some research in-dicates utilizing kernel processing at harvest may improve corn silage starch digestibility, presumably by reducing kernel size and in-creasing surface area for ruminal microbes. While starch digestibility is improved, a decrease in fiber digestibility has been ob-served, negating the positive effects of the kernel processing, resulting in no change in DM digestibility. Kernel processing also adds an extra cost to silage production, increasing equipment requirements due to the processor. The objectives of this exper-iment were to determine whether kernel processing is beneficial in finishing feedlot diets containing 40% of corn silage hybrids with brown midrib traits or brown midrib with a softer endosperm.
Procedure
Corn silage was harvested at the Eastern Nebraska Research and Education Center (ENREC) near Mead, Nebraska, between September 2 and 12, 2016. Corn silage harvest was initiated when the field was approximately ¾ milkline and 37% DM. The three hybrids (Mycogen® seeds) utilized were a control (CON; hybrid TMF2H708), a brown midrib hybrid (bm3;
Effects of Kernel Processing at Harvest of Brown Midrib Corn Silage on Finishing Performance of Steers
Lauren A. OvingeF. Henry HilscherCurtis J. Bittner
Bradley M. BoydJohn N. AndersonGalen E. Erickson
Summary with Implications
A 2 × 3 factorial finishing study evaluated kernel processing in three corn silage hybrids on finishing performance of yearling steers fed 40% silage. The three hybrids included a control corn silage (CON), a brown midrib (bm3), and a brown midrib with a softer endosperm (bm3- EXP). No interactions were observed between hybrids and kernel process-ing (P > 0.45). Feeding both bm3 hybrids increased dry matter intake and average daily gain over CON (P < 0.01). Cattle fed bm3- EXP and bm3 had lower feed to gain than CON (P = 0.04), with no differences between the two brown midrib hybrids. Feeding silage that has undergone kernel processing decreased dry matter intake with similar average daily gain, which decreased feed to gain by 2.6% at 40% inclusion compared to non- processed silage (P = 0.10). The improvement in silage is calculated to be 6.5% (2.6/40) when kernel processing was utilized as compared to not kernel processing the corn silage hybrids.
Introduction
Corn silage is utilized in the beef and dairy industry as a roughage source, and increasing nutrient availability of the corn silage through new hybrids and process-ing methods can improve feed quality for cattle. Brown midrib hybrids of silage have a lower lignin concentration resulting in improvement of fiber digestibility (2018 Nebraska Beef Cattle Report, pp.49–51). Feeding brown midrib corn silage at 45% in finishing diets resulted in greater ADG and
Table 1. Diet composition (DM Basis) for beef cattle fed three different corn silage hybrids1 that had been kernel processed (+KP) or not (- KP).
Item
CON bm3 bm3- EXP
- KP +KP - KP +KP - KP +KP
CON Corn Silage 40.0 40.0
bm3 Corn Silage 40.0 40.0
bm3- EXP Corn Silage 40.0 40.0
Modified distillers grains 30.0 30.0 30.0 30.0 30.0 30.0
Dry- rolled corn 25.0 25.0 25.0 25.0 25.0 25.0
Supplement2 5.0 5.0 5.0 5.0 5.0 5.01 Treatments were control (CON; hybrid- TMF2H708), a bm3 hybrid (bm3; hybrid- F15579S2), and an experimental bm3 hybrid
(bm3- EXP; hybrid- F15578XT) with a softer endosperm2 Supplement formulated to be fed at 5% of diet DM, Supplement consisted of 2.98% fine ground corn, 1.50% limestone, 0.125%
tallow, 0.30% salt, 0.05% trace mineral package, 0.015% Vitamin A- D- E package as a percentage of the final diet. It was also formulated for 30 g/ton Rumensin®(Elanco Animal Health, DM Basis) and 8.8 g/ton Tylan® (Elanco Animal Health, DM basis).
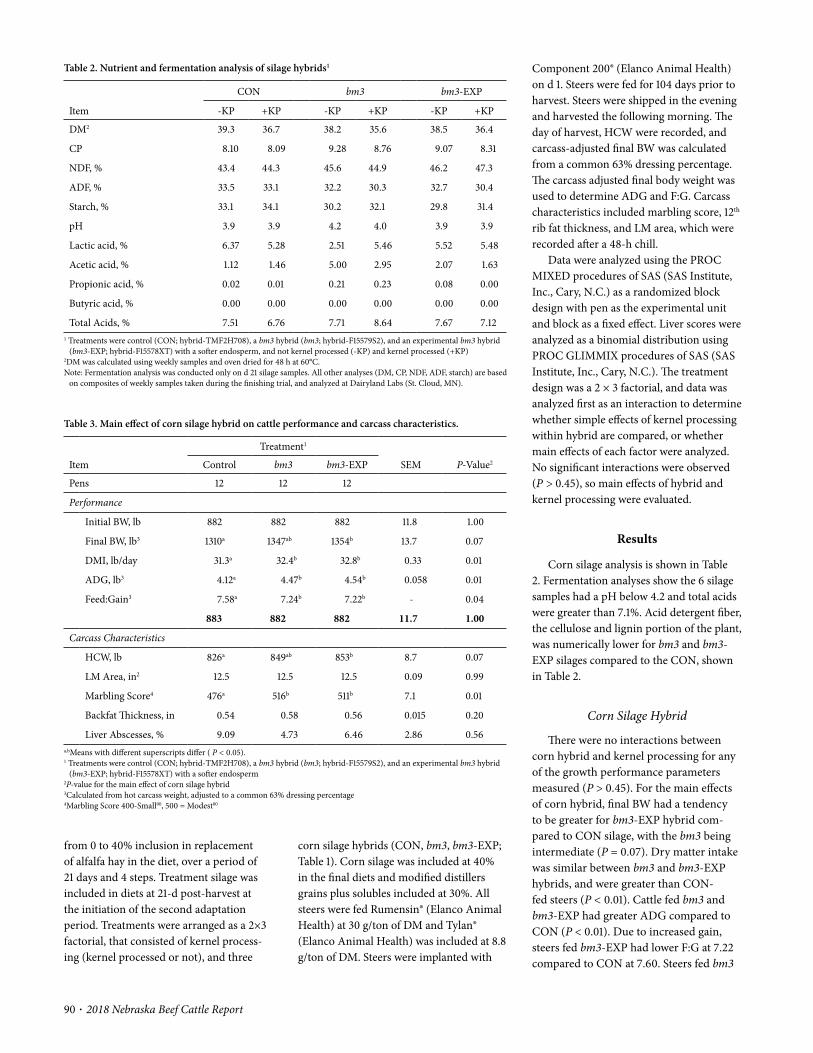
90 · 2018 Nebraska Beef Cattle Report
Component 200® (Elanco Animal Health) on d 1. Steers were fed for 104 days prior to harvest. Steers were shipped in the evening and harvested the following morning. The day of harvest, HCW were recorded, and carcass- adjusted final BW was calculated from a common 63% dressing percentage. The carcass adjusted final body weight was used to determine ADG and F:G. Carcass characteristics included marbling score, 12th rib fat thickness, and LM area, which were recorded after a 48- h chill.
Data were analyzed using the PROC MIXED procedures of SAS (SAS Institute, Inc., Cary, N.C.) as a randomized block design with pen as the experimental unit and block as a fixed effect. Liver scores were analyzed as a binomial distribution using PROC GLIMMIX procedures of SAS (SAS Institute, Inc., Cary, N.C.). The treatment design was a 2 × 3 factorial, and data was analyzed first as an interaction to determine whether simple effects of kernel processing within hybrid are compared, or whether main effects of each factor were analyzed. No significant interactions were observed (P > 0.45), so main effects of hybrid and kernel processing were evaluated.
Results
Corn silage analysis is shown in Table 2. Fermentation analyses show the 6 silage samples had a pH below 4.2 and total acids were greater than 7.1%. Acid detergent fiber, the cellulose and lignin portion of the plant, was numerically lower for bm3 and bm3- EXP silages compared to the CON, shown in Table 2.
Corn Silage Hybrid
There were no interactions between corn hybrid and kernel processing for any of the growth performance parameters measured (P > 0.45). For the main effects of corn hybrid, final BW had a tendency to be greater for bm3- EXP hybrid com-pared to CON silage, with the bm3 being intermediate (P = 0.07). Dry matter intake was similar between bm3 and bm3- EXP hybrids, and were greater than CON- fed steers (P < 0.01). Cattle fed bm3 and bm3- EXP had greater ADG compared to CON (P < 0.01). Due to increased gain, steers fed bm3- EXP had lower F:G at 7.22 compared to CON at 7.60. Steers fed bm3
corn silage hybrids (CON, bm3, bm3- EXP; Table 1). Corn silage was included at 40% in the final diets and modified distillers grains plus solubles included at 30%. All steers were fed Rumensin® (Elanco Animal Health) at 30 g/ton of DM and Tylan® (Elanco Animal Health) was included at 8.8 g/ton of DM. Steers were implanted with
from 0 to 40% inclusion in replacement of alfalfa hay in the diet, over a period of 21 days and 4 steps. Treatment silage was included in diets at 21- d post- harvest at the initiation of the second adaptation period. Treatments were arranged as a 2×3 factorial, that consisted of kernel process-ing (kernel processed or not), and three
Table 2. Nutrient and fermentation analysis of silage hybrids1
Item
CON bm3 bm3- EXP
- KP +KP - KP +KP - KP +KP
DM2 39.3 36.7 38.2 35.6 38.5 36.4
CP 8.10 8.09 9.28 8.76 9.07 8.31
NDF, % 43.4 44.3 45.6 44.9 46.2 47.3
ADF, % 33.5 33.1 32.2 30.3 32.7 30.4
Starch, % 33.1 34.1 30.2 32.1 29.8 31.4
pH 3.9 3.9 4.2 4.0 3.9 3.9
Lactic acid, % 6.37 5.28 2.51 5.46 5.52 5.48
Acetic acid, % 1.12 1.46 5.00 2.95 2.07 1.63
Propionic acid, % 0.02 0.01 0.21 0.23 0.08 0.00
Butyric acid, % 0.00 0.00 0.00 0.00 0.00 0.00
Total Acids, % 7.51 6.76 7.71 8.64 7.67 7.121 Treatments were control (CON; hybrid- TMF2H708), a bm3 hybrid (bm3; hybrid- F15579S2), and an experimental bm3 hybrid
(bm3- EXP; hybrid- F15578XT) with a softer endosperm, and not kernel processed (- KP) and kernel processed (+KP)2DM was calculated using weekly samples and oven dried for 48 h at 60°C.Note: Fermentation analysis was conducted only on d 21 silage samples. All other analyses (DM, CP, NDF, ADF, starch) are based
on composites of weekly samples taken during the finishing trial, and analyzed at Dairyland Labs (St. Cloud, MN).
Table 3. Main effect of corn silage hybrid on cattle performance and carcass characteristics.
Item
Treatment1
SEM P- Value2Control bm3 bm3- EXP
Pens 12 12 12
Performance
Initial BW, lb 882 882 882 11.8 1.00
Final BW, lb3 1310a 1347ab 1354b 13.7 0.07
DMI, lb/day 31.3a 32.4b 32.8b 0.33 0.01
ADG, lb3 4.12a 4.47b 4.54b 0.058 0.01
Feed:Gain3 7.58a 7.24b 7.22b - 0.04
883 882 882 11.7 1.00
Carcass Characteristics
HCW, lb 826a 849ab 853b 8.7 0.07
LM Area, in2 12.5 12.5 12.5 0.09 0.99
Marbling Score4 476a 516b 511b 7.1 0.01
Backfat Thickness, in 0.54 0.58 0.56 0.015 0.20
Liver Abscesses, % 9.09 4.73 6.46 2.86 0.56a,bMeans with different superscripts differ ( P < 0.05).1 Treatments were control (CON; hybrid- TMF2H708), a bm3 hybrid (bm3; hybrid- F15579S2), and an experimental bm3 hybrid
(bm3- EXP; hybrid- F15578XT) with a softer endosperm2P- value for the main effect of corn silage hybrid3Calculated from hot carcass weight, adjusted to a common 63% dressing percentage4Marbling Score 400- Small00, 500 = Modest00

2018 Nebraska Beef Cattle Report · 91
No differences were observed between steers fed processed silage versus not for HCW, marbling score or rib- eye area (P ≥ 0.78). Kernel processing of corn silage when fed at 40% of the diet appeared to have a positive effect on F:G of finishing feedlot steers compared to non- kernel processed silages. Feeding kernel processed silage resulted in a 2.6% improvement in efficiency when diets included 40% silage, suggesting the silage was improved by 6.5% (2.6/0.40) compared to not processing silage.
Conclusion
Feeding finishing cattle brown midrib corn silages improved ADG and F:G over the traditional silage when fed at 40% of the diet. Numerically, feeding bm3- EXP silage with a softer endosperm had the greatest ADG and lowest F:G, but was not statisti-cally different from bm3. Using kernel pro-cessing in corn silage did not interact with hybrid, but improved feed efficiency by 2.6% when fed at 40% of diet DM, suggesting a 6.5% improvement in the silage as a feed.
Lauren A. Ovinge, graduate student
F. Henry Hilscher, research technician
Curtis J. Bittner, research technician
Bradley M. Boyd, research technician
John N. Anderson, Mycogen Seeds, Indianapolis Ind.
Galen E. Erickson, professor, Animal Science, University of Nebraska, Lincoln Neb.
The bm3- EXP with softer endosperm did not have any statistical benefit over bm3.
Kernel Processing
For the main effect of kernel processing, steers fed kernel processed silage had lower DMI (0.82 lb/day less) than steers fed silage that was not processed (P = 0.04; Table 3). With no difference in ADG (P = 0.93), this resulted in a tendency for lower F:G for steers feed kernel processed silage (P = 0.10).
had similar F:G compared to bm3- EXP (P = 0.88), but lower (7.24) than CON (P = 0.04). Likewise, HCW of bm3- EXP steers showed a tendency (P = 0.07) for them to weigh 44 lb more than CON steers, with bm3 steers being intermediate. There were no differences in carcass characteristics or liver scores (P ≥ 0.20), other than marbling scores which were greater for bm3 and bm3- EXP compared to CON fed steers. These results suggest the bm3 and bm3- EXP hybrids improved performance.
Table 4. Main effect of kernel processing on growth performance and carcass characteristics
Item
Treatment1
SEM P- value2- KP +KP
Pens, n 18 18
Performance
Initial BW, lb 882 882 9.6 0.99
Final BW, lb3 1337 1338 11.2 0.96
DMI, lb/day 32.6 31.8 0.27 0.04
ADG, lb3 4.38 4.38 0.047 0.93
Feed:Gain3 7.45 7.24 - 0.10
Carcass Characteristics
HCW, lb 842 843 7.1 0.96
LM Area, in2 12.5 12.5 0.07 0.78
Marbling Score4 501 501 5.9 0.97
Backfat Thickness, in 0.56 0.56 0.012 0.70
Liver Abscesses, % 4.60 9.23 2.32 0.341Treatments were not kernel processed (- KP) or kernel processed (+KP)2P- Value for the main effect of kernel processing3Calculated from hot carcass weight, adjusted to a common 63% dressing percentage4Marbling Score 400 = Small00, 500 = Modest00
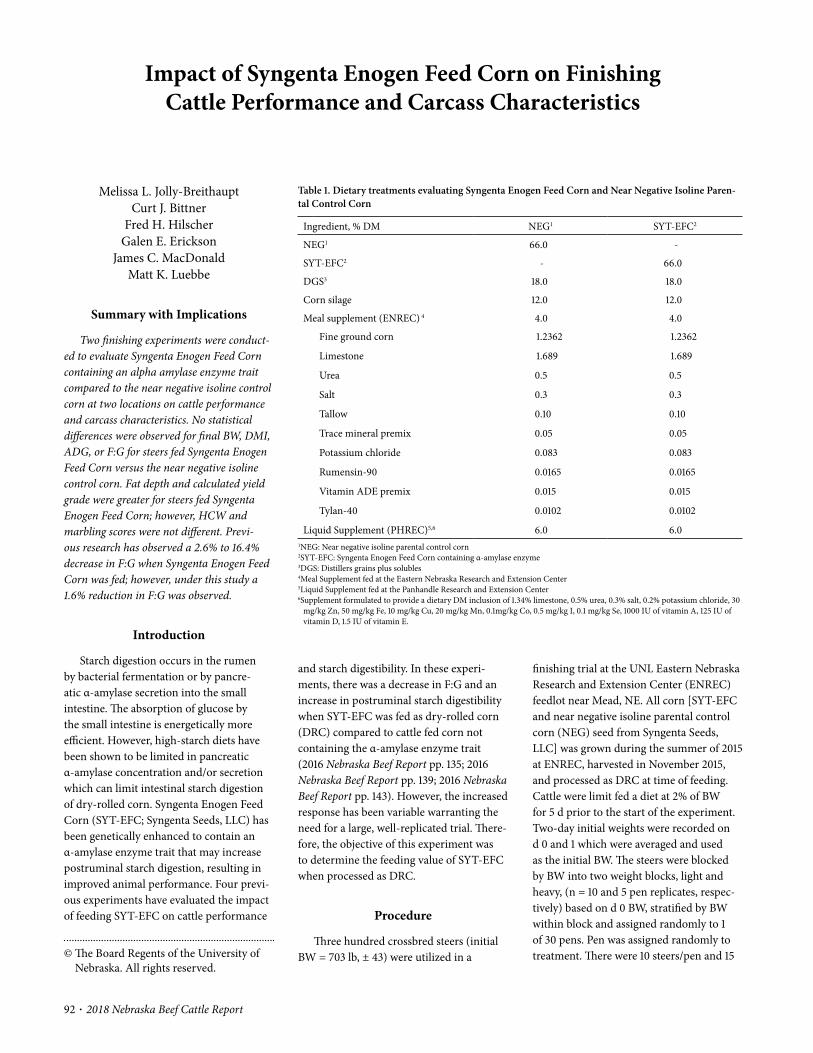
92 · 2018 Nebraska Beef Cattle Report
© The Board Regents of the University of Nebraska. All rights reserved.
finishing trial at the UNL Eastern Nebraska Research and Extension Center (ENREC) feedlot near Mead, NE. All corn [SYT- EFC and near negative isoline parental control corn (NEG) seed from Syngenta Seeds, LLC] was grown during the summer of 2015 at ENREC, harvested in November 2015, and processed as DRC at time of feeding. Cattle were limit fed a diet at 2% of BW for 5 d prior to the start of the experiment. Two- day initial weights were recorded on d 0 and 1 which were averaged and used as the initial BW. The steers were blocked by BW into two weight blocks, light and heavy, (n = 10 and 5 pen replicates, respec-tively) based on d 0 BW, stratified by BW within block and assigned randomly to 1 of 30 pens. Pen was assigned randomly to treatment. There were 10 steers/pen and 15
and starch digestibility. In these experi-ments, there was a decrease in F:G and an increase in postruminal starch digestibility when SYT- EFC was fed as dry- rolled corn (DRC) compared to cattle fed corn not containing the α- amylase enzyme trait (2016 Nebraska Beef Report pp. 135; 2016 Nebraska Beef Report pp. 139; 2016 Nebraska Beef Report pp. 143). However, the increased response has been variable warranting the need for a large, well- replicated trial. There-fore, the objective of this experiment was to determine the feeding value of SYT- EFC when processed as DRC.
Procedure
Three hundred crossbred steers (initial BW = 703 lb, ± 43) were utilized in a
Melissa L. Jolly- BreithauptCurt J. Bittner
Fred H. HilscherGalen E. Erickson
James C. MacDonaldMatt K. Luebbe
Summary with Implications
Two finishing experiments were conduct-ed to evaluate Syngenta Enogen Feed Corn containing an alpha amylase enzyme trait compared to the near negative isoline control corn at two locations on cattle performance and carcass characteristics. No statistical differences were observed for final BW, DMI, ADG, or F:G for steers fed Syngenta Enogen Feed Corn versus the near negative isoline control corn. Fat depth and calculated yield grade were greater for steers fed Syngenta Enogen Feed Corn; however, HCW and marbling scores were not different. Previ-ous research has observed a 2.6% to 16.4% decrease in F:G when Syngenta Enogen Feed Corn was fed; however, under this study a 1.6% reduction in F:G was observed.
Introduction
Starch digestion occurs in the rumen by bacterial fermentation or by pancre-atic α- amylase secretion into the small intestine. The absorption of glucose by the small intestine is energetically more efficient. However, high- starch diets have been shown to be limited in pancreatic α- amylase concentration and/or secretion which can limit intestinal starch digestion of dry- rolled corn. Syngenta Enogen Feed Corn (SYT- EFC; Syngenta Seeds, LLC) has been genetically enhanced to contain an α- amylase enzyme trait that may increase postruminal starch digestion, resulting in improved animal performance. Four previ-ous experiments have evaluated the impact of feeding SYT- EFC on cattle performance
Impact of Syngenta Enogen Feed Corn on Finishing Cattle Performance and Carcass Characteristics
Table 1. Dietary treatments evaluating Syngenta Enogen Feed Corn and Near Negative Isoline Paren-tal Control Corn
Ingredient, % DM NEG1 SYT- EFC2
NEG1 66.0 -
SYT- EFC2 - 66.0
DGS3 18.0 18.0
Corn silage 12.0 12.0
Meal supplement (ENREC) 4 4.0 4.0
Fine ground corn 1.2362 1.2362
Limestone 1.689 1.689
Urea 0.5 0.5
Salt 0.3 0.3
Tallow 0.10 0.10
Trace mineral premix 0.05 0.05
Potassium chloride 0.083 0.083
Rumensin- 90 0.0165 0.0165
Vitamin ADE premix 0.015 0.015
Tylan- 40 0.0102 0.0102
Liquid Supplement (PHREC)5,6 6.0 6.01NEG: Near negative isoline parental control corn2SYT- EFC: Syngenta Enogen Feed Corn containing α- amylase enzyme3DGS: Distillers grains plus solubles4Meal Supplement fed at the Eastern Nebraska Research and Extension Center5Liquid Supplement fed at the Panhandle Research and Extension Center6Supplement formulated to provide a dietary DM inclusion of 1.34% limestone, 0.5% urea, 0.3% salt, 0.2% potassium chloride, 30
mg/kg Zn, 50 mg/kg Fe, 10 mg/kg Cu, 20 mg/kg Mn, 0.1mg/kg Co, 0.5 mg/kg I, 0.1 mg/kg Se, 1000 IU of vitamin A, 125 IU of vitamin D, 1.5 IU of vitamin E.
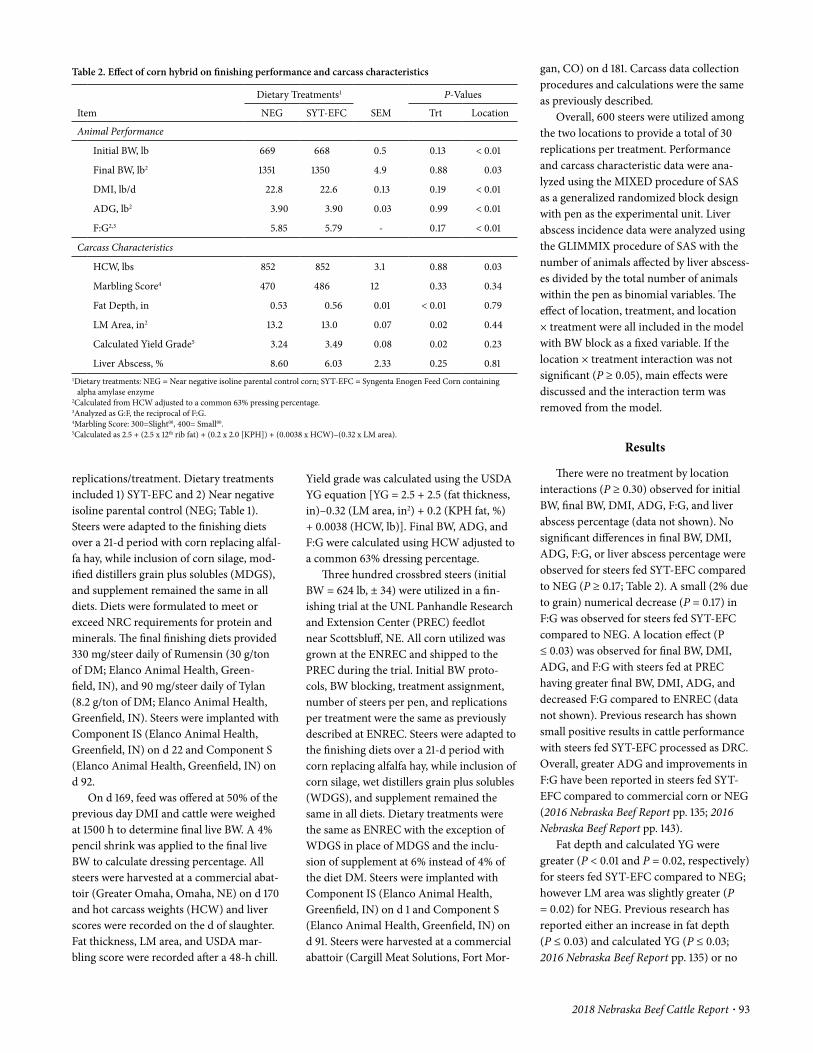
2018 Nebraska Beef Cattle Report · 93
gan, CO) on d 181. Carcass data collection procedures and calculations were the same as previously described.
Overall, 600 steers were utilized among the two locations to provide a total of 30 replications per treatment. Performance and carcass characteristic data were ana-lyzed using the MIXED procedure of SAS as a generalized randomized block design with pen as the experimental unit. Liver abscess incidence data were analyzed using the GLIMMIX procedure of SAS with the number of animals affected by liver abscess-es divided by the total number of animals within the pen as binomial variables. The effect of location, treatment, and location × treatment were all included in the model with BW block as a fixed variable. If the location × treatment interaction was not significant (P ≥ 0.05), main effects were discussed and the interaction term was removed from the model.
Results
There were no treatment by location interactions (P ≥ 0.30) observed for initial BW, final BW, DMI, ADG, F:G, and liver abscess percentage (data not shown). No significant differences in final BW, DMI, ADG, F:G, or liver abscess percentage were observed for steers fed SYT- EFC compared to NEG (P ≥ 0.17; Table 2). A small (2% due to grain) numerical decrease (P = 0.17) in F:G was observed for steers fed SYT- EFC compared to NEG. A location effect (P ≤ 0.03) was observed for final BW, DMI, ADG, and F:G with steers fed at PREC having greater final BW, DMI, ADG, and decreased F:G compared to ENREC (data not shown). Previous research has shown small positive results in cattle performance with steers fed SYT- EFC processed as DRC. Overall, greater ADG and improvements in F:G have been reported in steers fed SYT- EFC compared to commercial corn or NEG (2016 Nebraska Beef Report pp. 135; 2016 Nebraska Beef Report pp. 143).
Fat depth and calculated YG were greater (P < 0.01 and P = 0.02, respectively) for steers fed SYT- EFC compared to NEG; however LM area was slightly greater (P = 0.02) for NEG. Previous research has reported either an increase in fat depth (P ≤ 0.03) and calculated YG (P ≤ 0.03; 2016 Nebraska Beef Report pp. 135) or no
Yield grade was calculated using the USDA YG equation [YG = 2.5 + 2.5 (fat thickness, in)– 0.32 (LM area, in2) + 0.2 (KPH fat, %) + 0.0038 (HCW, lb)]. Final BW, ADG, and F:G were calculated using HCW adjusted to a common 63% dressing percentage.
Three hundred crossbred steers (initial BW = 624 lb, ± 34) were utilized in a fin-ishing trial at the UNL Panhandle Research and Extension Center (PREC) feedlot near Scottsbluff, NE. All corn utilized was grown at the ENREC and shipped to the PREC during the trial. Initial BW proto-cols, BW blocking, treatment assignment, number of steers per pen, and replications per treatment were the same as previously described at ENREC. Steers were adapted to the finishing diets over a 21- d period with corn replacing alfalfa hay, while inclusion of corn silage, wet distillers grain plus solubles (WDGS), and supplement remained the same in all diets. Dietary treatments were the same as ENREC with the exception of WDGS in place of MDGS and the inclu-sion of supplement at 6% instead of 4% of the diet DM. Steers were implanted with Component IS (Elanco Animal Health, Greenfield, IN) on d 1 and Component S (Elanco Animal Health, Greenfield, IN) on d 91. Steers were harvested at a commercial abattoir (Cargill Meat Solutions, Fort Mor-
replications/treatment. Dietary treatments included 1) SYT- EFC and 2) Near negative isoline parental control (NEG; Table 1). Steers were adapted to the finishing diets over a 21- d period with corn replacing alfal-fa hay, while inclusion of corn silage, mod-ified distillers grain plus solubles (MDGS), and supplement remained the same in all diets. Diets were formulated to meet or exceed NRC requirements for protein and minerals. The final finishing diets provided 330 mg/steer daily of Rumensin (30 g/ton of DM; Elanco Animal Health, Green-field, IN), and 90 mg/steer daily of Tylan (8.2 g/ton of DM; Elanco Animal Health, Greenfield, IN). Steers were implanted with Component IS (Elanco Animal Health, Greenfield, IN) on d 22 and Component S (Elanco Animal Health, Greenfield, IN) on d 92.
On d 169, feed was offered at 50% of the previous day DMI and cattle were weighed at 1500 h to determine final live BW. A 4% pencil shrink was applied to the final live BW to calculate dressing percentage. All steers were harvested at a commercial abat-toir (Greater Omaha, Omaha, NE) on d 170 and hot carcass weights (HCW) and liver scores were recorded on the d of slaughter. Fat thickness, LM area, and USDA mar-bling score were recorded after a 48- h chill.
Table 2. Effect of corn hybrid on finishing performance and carcass characteristics
Item
Dietary Treatments1
SEM
P- Values
NEG SYT- EFC Trt Location
Animal Performance
Initial BW, lb 669 668 0.5 0.13 < 0.01
Final BW, lb2 1351 1350 4.9 0.88 0.03
DMI, lb/d 22.8 22.6 0.13 0.19 < 0.01
ADG, lb2 3.90 3.90 0.03 0.99 < 0.01
F:G2,3 5.85 5.79 - 0.17 < 0.01
Carcass Characteristics
HCW, lbs 852 852 3.1 0.88 0.03
Marbling Score4 470 486 12 0.33 0.34
Fat Depth, in 0.53 0.56 0.01 < 0.01 0.79
LM Area, in2 13.2 13.0 0.07 0.02 0.44
Calculated Yield Grade5 3.24 3.49 0.08 0.02 0.23
Liver Abscess, % 8.60 6.03 2.33 0.25 0.811Dietary treatments: NEG = Near negative isoline parental control corn; SYT- EFC = Syngenta Enogen Feed Corn containing
alpha amylase enzyme2Calculated from HCW adjusted to a common 63% pressing percentage.3Analyzed as G:F, the reciprocal of F:G.4Marbling Score: 300=Slight00, 400= Small00.5Calculated as 2.5 + (2.5 x 12th rib fat) + (0.2 x 2.0 [KPH]) + (0.0038 x HCW)– (0.32 x LM area).

94 · 2018 Nebraska Beef Cattle Report
main source of dietary corn grain. However, results from this trial would suggest that there is no significant change in F:G by feeding the Syngenta Enogen Feed Corn hybrid containing an alpha amylase enzyme trait as the response was too small to detect. The change in F:G was only 1% due to diet, which is assumed to be only 1.6% due to corn grain (65% of the diet, average between ENREC and PREC).
Melissa L. Jolly- Breithaupt, research tech-nician
Curt J. Bittner, research technician
F. Henry Hilscher, research technician
Galen E. Erickson, professor, Animal Science, Lincoln
James C. MacDonald, associate professor, Animal Science, Lincoln, NE
Matt K. Luebbe, associate professor, Animal Science, Panhandle Research and Extension Center, Scottsbluff, NE
difference (P ≤ 0.22 and P ≤ 0.17, respec-tively; 2016 Nebraska Beef Report pp. 135; 2016 Nebraska Beef Report pp. 143) when steers were fed SYT- EFC. No significant differences by treatment were observed for HCW or marbling score (P ≥ 0.33). Pre-vious research has reported mixed results for marbling score of steers fed SYT- EFC compared to commercial corn or NEG ei-ther observing an increase (2016 Nebraska Beef Report pp. 135) or no difference (2016 Nebraska Beef Report pp. 143). Differences in cattle response between previous trials and this current trial could be attributed to growing conditions of the corn resulting in a year effect.
Conclusion
In conclusion, previous finishing trials have observed a 2.6% to 16.4% reduction in F:G when SYT- EFC has been fed as the

2018 Nebraska Beef Cattle Report · 95
© The Board Regents of the University of Nebraska. All rights reserved.
and establish initial BW. Steers were blocked by BW (n=3), stratified within block, and as-signed randomly to pen. Pens were assigned randomly to one of the five treatments with 20 steers/pen and 6 pens/treatment.
Treatments consisted of increasing inclusions of CDS 0, 8, 16, and 20% DM dis-placing a dry- rolled corn (DRC) and high- moisture corn blend (HMC) (Table 1). A fifth treatment included 16% CDS with 20% wet distillers grains plus solubles (WDGS) to compare normal industry WDGS inclusions with additional CDS, to the performance of the 16% CDS inclusion alone. Steers were adapted to diets over a 21- d step- up period
trial was conducted to evaluate the feeding value of corn distillers solubles compared to corn on performance and carcass character-istics in finishing diets.
Procedure
A 114- d finishing study was conduct-ed at the Eastern Nebraska Research and Extension Center feedlot in Mead, NE. Six hundred crossbred steers (initial BW = 957 ± 90 lb.) were utilized. Steers were limit fed a common diet at 2.0% of BW for 5 days and weighed for two consecutive days at the beginning of the trial to account for gut fill
Benjamin H. HansenCurtis J. Bittner
Bradley M. BoydF. Henry HilscherJim C. MacDonaldGalen E. Erickson
Summary with Implications
A finishing study was conducted to evaluate the effects of feeding 0, 8, 16, or 20% corn distillers solubles (CDS), as well as the effects of feeding a combination of 16% CDS and 20% wet distillers grains plus solubles (WDGS) to replace a blend of dry- rolled and high- moisture corn on finishing steer perfor-mance. As inclusions of CDS increased, ADG linearly increased and F:G linearly decreased. Feeding value of CDS at 20% inclusion was determined to be 147% compared to the corn blend. The addition of WDGS resulted in a decrease in DMI with similar ADG, resulting in a decrease in F:G. Feeding a combination of CDS and WDGS resulted in a feeding val-ue of 161% compared to corn. Feeding CDS up to 20% or in combination with WDGS displaces corn in finishing diets and improves ADG and F:G.
Introduction
Recent changes to ethanol production, involving the extraction of oil, changes the nutrient profile of corn distillers solubles (CDS). Due to the market value of corn oil, 75% of the ethanol plants are centrifuging and marketing corn oil independently. Previous research with CDS, without oil removal, reported a quadratic decrease in F:G when CDS displaced corn in finishing diets (2012 Nebraska Beef Report, pp. 64– 65). More recent research involving feeding CDS, with oil extraction, has variable results at inclusions below 10% DM in finishing di-ets. Therefore, CDS after oil extraction may not improve F:G in finishing cattle. Thus, a
Evaluation of Corn Distillers Solubles on Finishing Steer Performance
Table 1. Diet composition (DM basis) for varying inclusion of distillers solubles
CDS1, % Inclusion
Ingredient 0 8 16 20 16 + 202
Dry- rolled corn 68 62 55 52 39
High- moisture corn 17 15 14 13 10
Corn distillers solubles - 8 16 20 16
Wet distillers grains plus solubles - - - - 20
Alfalfa hay 10 10 10 10 10
Supplement3 - - - - -
Fine Ground Corn 1.169 1.908 2.255 2.603 2.950
Limestone 1.528 1.519 1.518 1.518 1.517
Tallow 0.125 0.125 0.125 0.125 0.125
Urea 1.403 1.040 0.693 0.347 -
Thiamine - 0.016 0.016 0.016 0.016
Salt 0.300 0.300 0.300 0.300 0.300
Beef Trace Mineral 0.050 0.050 0.050 0.050 0.050
Vitamin A- D- E 0.015 0.015 0.015 0.015 0.015
Rumensin- 90®4 0.017 0.017 0.017 0.017 0.017
Tylan- 40®5 0.010 0.010 0.010 0.010 0.010
Nutrient Composition, % of DM
CP 13.0 13.7 14.4 14.4 18.4
Fat 4.12 4.16 4.24 4.28 6.23
Sulfur 0.13 0.23 0.34 0.39 0.481CDS=Corn distillers solubles216 + 20=16% corn distillers solubles + 20% wet distillers grains plus solubles3 Supplement fed at 5% diet DM.4Formulated to supply Rumensin- 90® (Elanco Animal Health) at 30 g/ton.5Formulated to supply Tylan- 40® (Elanco Animal Health) at 8.8 g/ton.
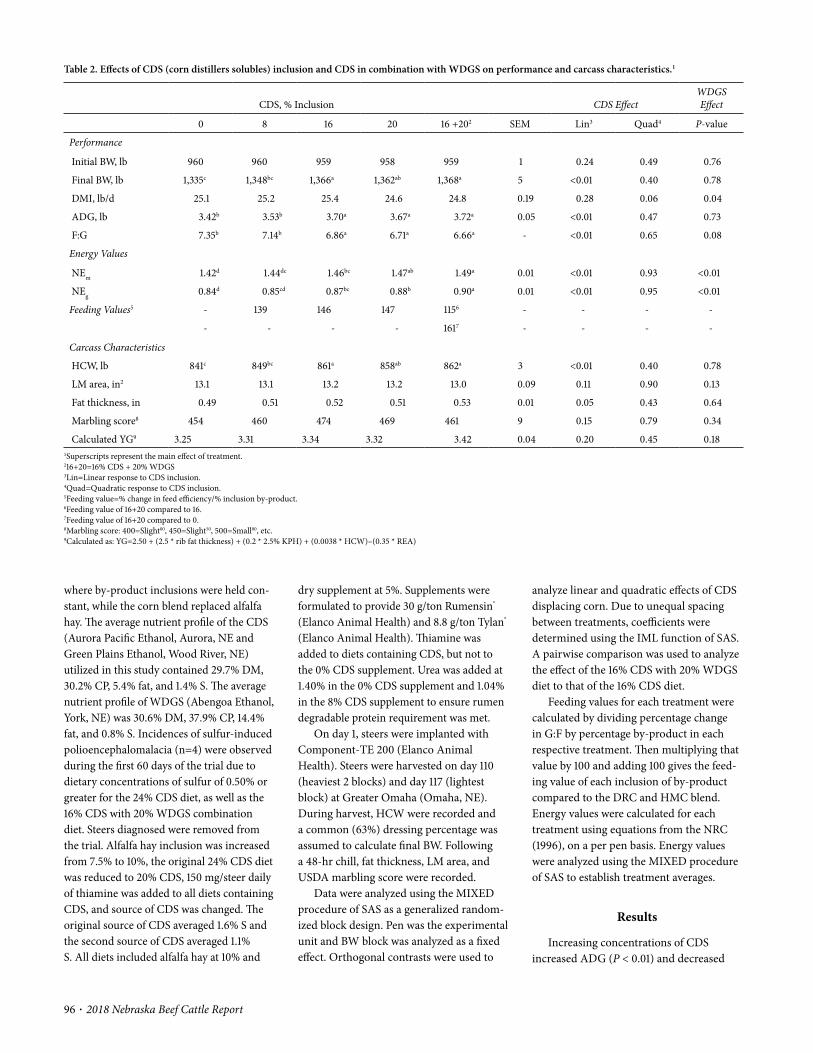
96 · 2018 Nebraska Beef Cattle Report
analyze linear and quadratic effects of CDS displacing corn. Due to unequal spacing between treatments, coefficients were determined using the IML function of SAS. A pairwise comparison was used to analyze the effect of the 16% CDS with 20% WDGS diet to that of the 16% CDS diet.
Feeding values for each treatment were calculated by dividing percentage change in G:F by percentage by- product in each respective treatment. Then multiplying that value by 100 and adding 100 gives the feed-ing value of each inclusion of by- product compared to the DRC and HMC blend. Energy values were calculated for each treatment using equations from the NRC (1996), on a per pen basis. Energy values were analyzed using the MIXED procedure of SAS to establish treatment averages.
Results
Increasing concentrations of CDS increased ADG (P < 0.01) and decreased
dry supplement at 5%. Supplements were formulated to provide 30 g/ton Rumensin® (Elanco Animal Health) and 8.8 g/ton Tylan® (Elanco Animal Health). Thiamine was added to diets containing CDS, but not to the 0% CDS supplement. Urea was added at 1.40% in the 0% CDS supplement and 1.04% in the 8% CDS supplement to ensure rumen degradable protein requirement was met.
On day 1, steers were implanted with Component- TE 200 (Elanco Animal Health). Steers were harvested on day 110 (heaviest 2 blocks) and day 117 (lightest block) at Greater Omaha (Omaha, NE). During harvest, HCW were recorded and a common (63%) dressing percentage was assumed to calculate final BW. Following a 48- hr chill, fat thickness, LM area, and USDA marbling score were recorded.
Data were analyzed using the MIXED procedure of SAS as a generalized random-ized block design. Pen was the experimental unit and BW block was analyzed as a fixed effect. Orthogonal contrasts were used to
where by- product inclusions were held con-stant, while the corn blend replaced alfalfa hay. The average nutrient profile of the CDS (Aurora Pacific Ethanol, Aurora, NE and Green Plains Ethanol, Wood River, NE) utilized in this study contained 29.7% DM, 30.2% CP, 5.4% fat, and 1.4% S. The average nutrient profile of WDGS (Abengoa Ethanol, York, NE) was 30.6% DM, 37.9% CP, 14.4% fat, and 0.8% S. Incidences of sulfur- induced polioencephalomalacia (n=4) were observed during the first 60 days of the trial due to dietary concentrations of sulfur of 0.50% or greater for the 24% CDS diet, as well as the 16% CDS with 20% WDGS combination diet. Steers diagnosed were removed from the trial. Alfalfa hay inclusion was increased from 7.5% to 10%, the original 24% CDS diet was reduced to 20% CDS, 150 mg/steer daily of thiamine was added to all diets containing CDS, and source of CDS was changed. The original source of CDS averaged 1.6% S and the second source of CDS averaged 1.1% S. All diets included alfalfa hay at 10% and
Table 2. Effects of CDS (corn distillers solubles) inclusion and CDS in combination with WDGS on performance and carcass characteristics.1
CDS, % Inclusion CDS EffectWDGS Effect
0 8 16 20 16 +202 SEM Lin3 Quad4 P- value
Performance
Initial BW, lb 960 960 959 958 959 1 0.24 0.49 0.76
Final BW, lb 1,335c 1,348bc 1,366a 1,362ab 1,368a 5 <0.01 0.40 0.78
DMI, lb/d 25.1 25.2 25.4 24.6 24.8 0.19 0.28 0.06 0.04
ADG, lb 3.42b 3.53b 3.70a 3.67a 3.72a 0.05 <0.01 0.47 0.73
F:G 7.35b 7.14b 6.86a 6.71a 6.66a - <0.01 0.65 0.08
Energy Values
NEm 1.42d 1.44dc 1.46bc 1.47ab 1.49a 0.01 <0.01 0.93 <0.01
NEg 0.84d 0.85cd 0.87bc 0.88b 0.90a 0.01 <0.01 0.95 <0.01
Feeding Values5 - 139 146 147 1156 - - - -
- - - - 1617 - - - -
Carcass Characteristics
HCW, lb 841c 849bc 861a 858ab 862a 3 <0.01 0.40 0.78
LM area, in2 13.1 13.1 13.2 13.2 13.0 0.09 0.11 0.90 0.13
Fat thickness, in 0.49 0.51 0.52 0.51 0.53 0.01 0.05 0.43 0.64
Marbling score8 454 460 474 469 461 9 0.15 0.79 0.34
Calculated YG9 3.25 3.31 3.34 3.32 3.42 0.04 0.20 0.45 0.181Superscripts represent the main effect of treatment.216+20=16% CDS + 20% WDGS3Lin=Linear response to CDS inclusion.4Quad=Quadratic response to CDS inclusion.5Feeding value=% change in feed efficiency/% inclusion by- product.6Feeding value of 16+20 compared to 16.7Feeding value of 16+20 compared to 0.8Marbling score: 400=Slight00, 450=Slight50, 500=Small00, etc.9Calculated as: YG=2.50 + (2.5 * rib fat thickness) + (0.2 * 2.5% KPH) + (0.0038 * HCW)– (0.35 * REA)
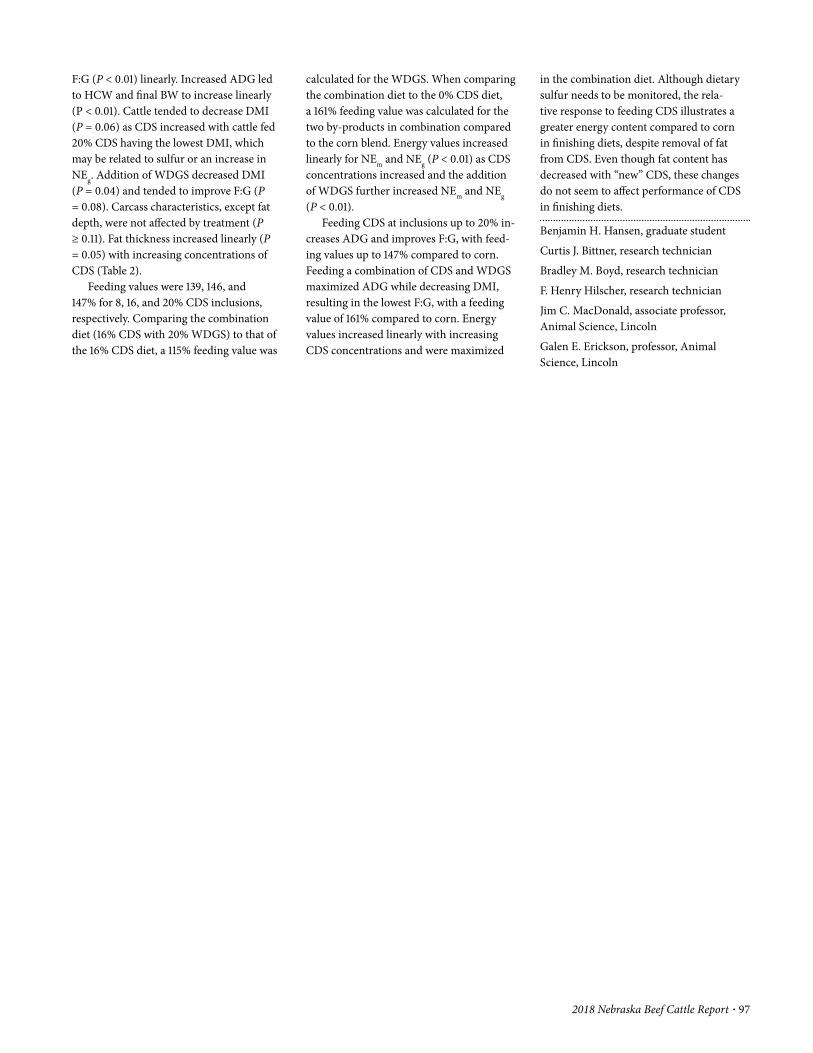
2018 Nebraska Beef Cattle Report · 97
in the combination diet. Although dietary sulfur needs to be monitored, the rela-tive response to feeding CDS illustrates a greater energy content compared to corn in finishing diets, despite removal of fat from CDS. Even though fat content has decreased with “new” CDS, these changes do not seem to affect performance of CDS in finishing diets.
Benjamin H. Hansen, graduate student
Curtis J. Bittner, research technician
Bradley M. Boyd, research technician
F. Henry Hilscher, research technician
Jim C. MacDonald, associate professor, Animal Science, Lincoln
Galen E. Erickson, professor, Animal Science, Lincoln
calculated for the WDGS. When comparing the combination diet to the 0% CDS diet, a 161% feeding value was calculated for the two by- products in combination compared to the corn blend. Energy values increased linearly for NEm and NEg (P < 0.01) as CDS concentrations increased and the addition of WDGS further increased NEm and NEg (P < 0.01).
Feeding CDS at inclusions up to 20% in-creases ADG and improves F:G, with feed-ing values up to 147% compared to corn. Feeding a combination of CDS and WDGS maximized ADG while decreasing DMI, resulting in the lowest F:G, with a feeding value of 161% compared to corn. Energy values increased linearly with increasing CDS concentrations and were maximized
F:G (P < 0.01) linearly. Increased ADG led to HCW and final BW to increase linearly (P < 0.01). Cattle tended to decrease DMI (P = 0.06) as CDS increased with cattle fed 20% CDS having the lowest DMI, which may be related to sulfur or an increase in NEg. Addition of WDGS decreased DMI (P = 0.04) and tended to improve F:G (P = 0.08). Carcass characteristics, except fat depth, were not affected by treatment (P ≥ 0.11). Fat thickness increased linearly (P = 0.05) with increasing concentrations of CDS (Table 2).
Feeding values were 139, 146, and 147% for 8, 16, and 20% CDS inclusions, respectively. Comparing the combination diet (16% CDS with 20% WDGS) to that of the 16% CDS diet, a 115% feeding value was

98 · 2018 Nebraska Beef Cattle Report
© The Board Regents of the University of Nebraska. All rights reserved.
gluten meal (CGM), 15.00% corn silage, and 5.00% supplement. The fourth treatment (CGM- CDS) replaced 10% of DRC from the HIGH- CGM diet with condensed distillers solubles. In the experimental diets, the protein portion of modified distillers grains plus solubles (MDGS) was mim-icked by CGM to provide similar RUP as 40% MDGS. Corn gluten meal is from wet milling of corn grain and is high in protein (65– 75 % CP; 60% of CP is RUP). In addition to CGM, 10% condensed distillers solubles (CDS) was added to HIGH- CGM (CGM- CDS) to compare to 40DGS diet. Diets were formulated to provide 375 mg/steer of Rumensin® (Elanco Animal Health) and 90 mg/steer of Tylan® (Elanco Animal Health) daily.
Steers were individually housed in pens equipped with slatted floors and given ad litbitum access to feed and water. Samples
tive of these experiments were to evaluate protein from DGS on site and extent of nutrient digestibility; and ruminal pH.
Procedure
Experiment 1
Six duodenally fistulated crossbred steers (837 lb initial BW; SE = 110) were utilized in an unbalanced 6 × 6 row- column design, with six periods and four treatments (Table 1). The control (CON) treatment contained 76.50% dry- rolled corn (DRC), 15.00% corn silage, 3.50% soybean meal, 3.55% supplement, and 1.41% urea. Second treatment (40DGS) contained 40.00% DRC, 40.00% modified distillers grains plus solubles, 15.00% corn silage, and 5.00% supplement. The third treatment (HIGH- CGM) contained 62.50% DRC, 17.50% corn
Zachary E. CarlsonJana L. Gramkow
Hannah C. WilsonMelissa L. Jolly- Breithaupt
Galen E. EricksonJim C. MacDonald
Matt K. Luebbe
Summary with Implications
A metabolism trial was conducted to evaluate protein from modified distillers grains plus solubles (MDGS) in finishing diets on nutrient digestibility and ruminal fermentation characteristics. Isolated protein from corn was not different than MDGS for dry matter, organic matter, or neutral detergent fiber digestibility. However, steers fed MDGS tended to have lower total tract organic matter digestibility compared to corn and protein from corn. Protein had greater total tract organic matter and starch digest-ibility than MDGS. Protein from corn did not contribute towards the lower digestibility of MDGS. Protein is more easily digestible than the other components in distillers grains plus solubles.
Introduction
As advances in technology continue in the ethanol industry, isolating and separating components of distillers grains plus solubles (DGS) may become prevalent, which changes potential use of DGS in feedlot diets. Establishing the contributions of individual components (i.e. protein, fiber, fat) of distillers grains will help beef cattle producers determine the value of distillers grains as it changes. The protein component of DGS had a similar feeding value as DGS when included at 40% (2016 Nebraska Beef Cattle Report, pp. 132– 134). No data has been reported on the impact of protein from distiller grains on site and extent of total tract nutrient digestibility. The objec-
Evaluation of Protein from Distillers Grains in Finishing Diets on Nutrient Digestibility
Table 1. Composition of dietary treatments containing protein components of distiller grains fed to steers.
Item1
Treatment
CON2 40DGS HIGH- CGM CGM- CDS
Ingredient, % DM3
DRC 76.5 40.0 62.5 52.5
MDGS - 40.0 - -
Corn Silage 15.0 15.0 15.0 15.0
CGM - - 17.5 17.5
CDS - - - 10.0
SBM 3.5 - - -
Supplement4 5.0 5.0 5.0 5.0
Nutrient Composition, %
CP 12.5 18.5 19.6 22.1
NDF 14.8 26.1 13.6 13.2
Fat 3.6 6.5 3.5 3.8
Starch 55.6 32.6 48.8 42.61All values presented on a DM basis.2Supplemented with urea at 1.405% of diet to meet the RDP requirement.3DRC = dry- rolled corn; MDGS = Modified distillers grains plus solubles; CGM = corn gluten meal; CDS = condensed distillers
solubles; SBM = soybean meal.4Beef trace mineral contained 10%Mg, 6% Zn as ZnO, 4.5% Fe as FeSO4, 2% Mn as MnO, 0.5% Cu as CuSO4, 0.3% I as
Ca(IO3)2(H2O), and 0.05% Co as CoCO3. Vitamin A, D, and E premix contained 1,500 IU vitamin A, 3,000 IU vitamin D, and 3.7 IU vitamin E per g. Rumensin formulated to provide 375 mg∙steer∙d- 1 monensin (Rumensin; Elanco Animal Health, Green-field, IN). Tylan forumated to provide 90 mg∙steer∙d- 1 tylosin (Tylan; Elanco Animal Health).
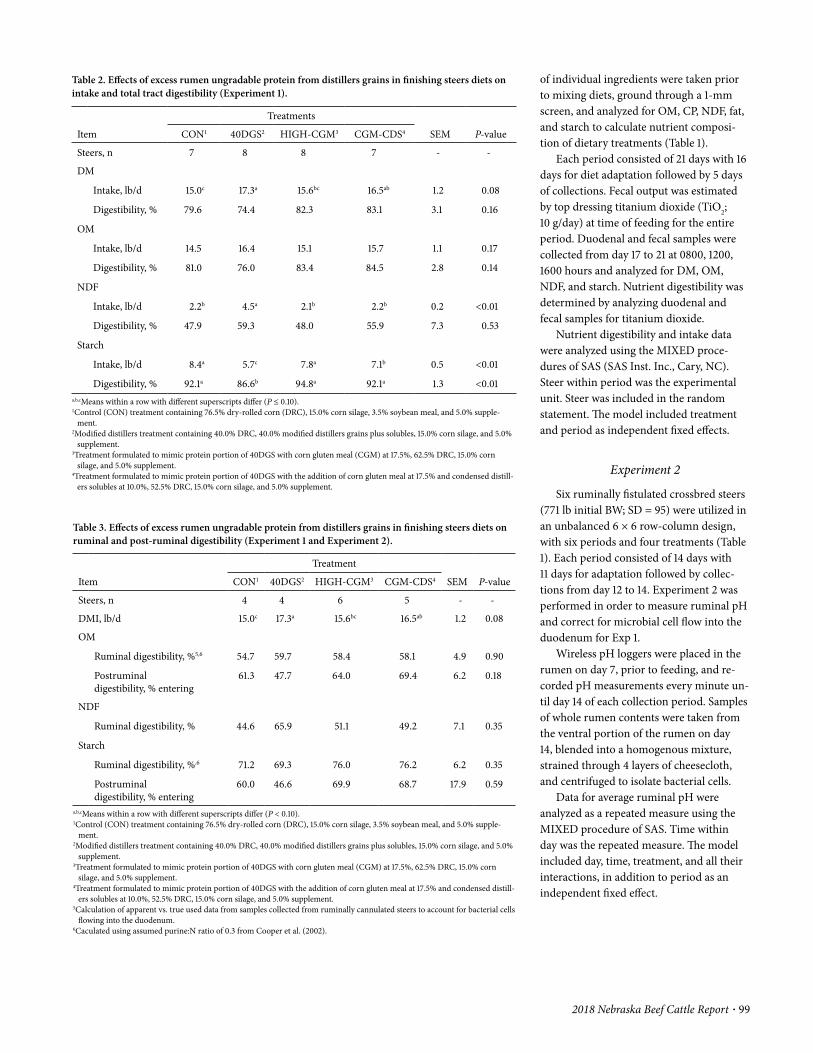
2018 Nebraska Beef Cattle Report · 99
of individual ingredients were taken prior to mixing diets, ground through a 1- mm screen, and analyzed for OM, CP, NDF, fat, and starch to calculate nutrient composi-tion of dietary treatments (Table 1).
Each period consisted of 21 days with 16 days for diet adaptation followed by 5 days of collections. Fecal output was estimated by top dressing titanium dioxide (TiO2; 10 g/day) at time of feeding for the entire period. Duodenal and fecal samples were collected from day 17 to 21 at 0800, 1200, 1600 hours and analyzed for DM, OM, NDF, and starch. Nutrient digestibility was determined by analyzing duodenal and fecal samples for titanium dioxide.
Nutrient digestibility and intake data were analyzed using the MIXED proce-dures of SAS (SAS Inst. Inc., Cary, NC). Steer within period was the experimental unit. Steer was included in the random statement. The model included treatment and period as independent fixed effects.
Experiment 2
Six ruminally fistulated crossbred steers (771 lb initial BW; SD = 95) were utilized in an unbalanced 6 × 6 row- column design, with six periods and four treatments (Table 1). Each period consisted of 14 days with 11 days for adaptation followed by collec-tions from day 12 to 14. Experiment 2 was performed in order to measure ruminal pH and correct for microbial cell flow into the duodenum for Exp 1.
Wireless pH loggers were placed in the rumen on day 7, prior to feeding, and re-corded pH measurements every minute un-til day 14 of each collection period. Samples of whole rumen contents were taken from the ventral portion of the rumen on day 14, blended into a homogenous mixture, strained through 4 layers of cheesecloth, and centrifuged to isolate bacterial cells.
Data for average ruminal pH were analyzed as a repeated measure using the MIXED procedure of SAS. Time within day was the repeated measure. The model included day, time, treatment, and all their interactions, in addition to period as an independent fixed effect.
Table 3. Effects of excess rumen ungradable protein from distillers grains in finishing steers diets on ruminal and post- ruminal digestibility (Experiment 1 and Experiment 2).
Item
Treatment
SEM P- valueCON1 40DGS2 HIGH- CGM3 CGM- CDS4
Steers, n 4 4 6 5 - -
DMI, lb/d 15.0c 17.3a 15.6bc 16.5ab 1.2 0.08
OM
Ruminal digestibility, %5,6 54.7 59.7 58.4 58.1 4.9 0.90
Postruminal digestibility, % entering
61.3 47.7 64.0 69.4 6.2 0.18
NDF
Ruminal digestibility, % 44.6 65.9 51.1 49.2 7.1 0.35
Starch
Ruminal digestibility, %,6 71.2 69.3 76.0 76.2 6.2 0.35
Postruminal digestibility, % entering
60.0 46.6 69.9 68.7 17.9 0.59
a,b,cMeans within a row with different superscripts differ (P < 0.10).1Control (CON) treatment containing 76.5% dry- rolled corn (DRC), 15.0% corn silage, 3.5% soybean meal, and 5.0% supple-
ment.2Modified distillers treatment containing 40.0% DRC, 40.0% modified distillers grains plus solubles, 15.0% corn silage, and 5.0%
supplement.3Treatment formulated to mimic protein portion of 40DGS with corn gluten meal (CGM) at 17.5%, 62.5% DRC, 15.0% corn
silage, and 5.0% supplement.4Treatment formulated to mimic protein portion of 40DGS with the addition of corn gluten meal at 17.5% and condensed distill-
ers solubles at 10.0%, 52.5% DRC, 15.0% corn silage, and 5.0% supplement.5Calculation of apparent vs. true used data from samples collected from ruminally cannulated steers to account for bacterial cells
flowing into the duodenum.6Caculated using assumed purine:N ratio of 0.3 from Cooper et al. (2002).
Table 2. Effects of excess rumen ungradable protein from distillers grains in finishing steers diets on intake and total tract digestibility (Experiment 1).
Item
Treatments
SEM P- valueCON1 40DGS2 HIGH- CGM3 CGM- CDS4
Steers, n 7 8 8 7 - -
DM
Intake, lb/d 15.0c 17.3a 15.6bc 16.5ab 1.2 0.08
Digestibility, % 79.6 74.4 82.3 83.1 3.1 0.16
OM
Intake, lb/d 14.5 16.4 15.1 15.7 1.1 0.17
Digestibility, % 81.0 76.0 83.4 84.5 2.8 0.14
NDF
Intake, lb/d 2.2b 4.5a 2.1b 2.2b 0.2 <0.01
Digestibility, % 47.9 59.3 48.0 55.9 7.3 0.53
Starch
Intake, lb/d 8.4a 5.7c 7.8a 7.1b 0.5 <0.01
Digestibility, % 92.1a 86.6b 94.8a 92.1a 1.3 <0.01a,b,cMeans within a row with different superscripts differ (P ≤ 0.10).1Control (CON) treatment containing 76.5% dry- rolled corn (DRC), 15.0% corn silage, 3.5% soybean meal, and 5.0% supple-
ment.2Modified distillers treatment containing 40.0% DRC, 40.0% modified distillers grains plus solubles, 15.0% corn silage, and 5.0%
supplement.3Treatment formulated to mimic protein portion of 40DGS with corn gluten meal (CGM) at 17.5%, 62.5% DRC, 15.0% corn
silage, and 5.0% supplement.4Treatment formulated to mimic protein portion of 40DGS with the addition of corn gluten meal at 17.5% and condensed distill-
ers solubles at 10.0%, 52.5% DRC, 15.0% corn silage, and 5.0% supplement.
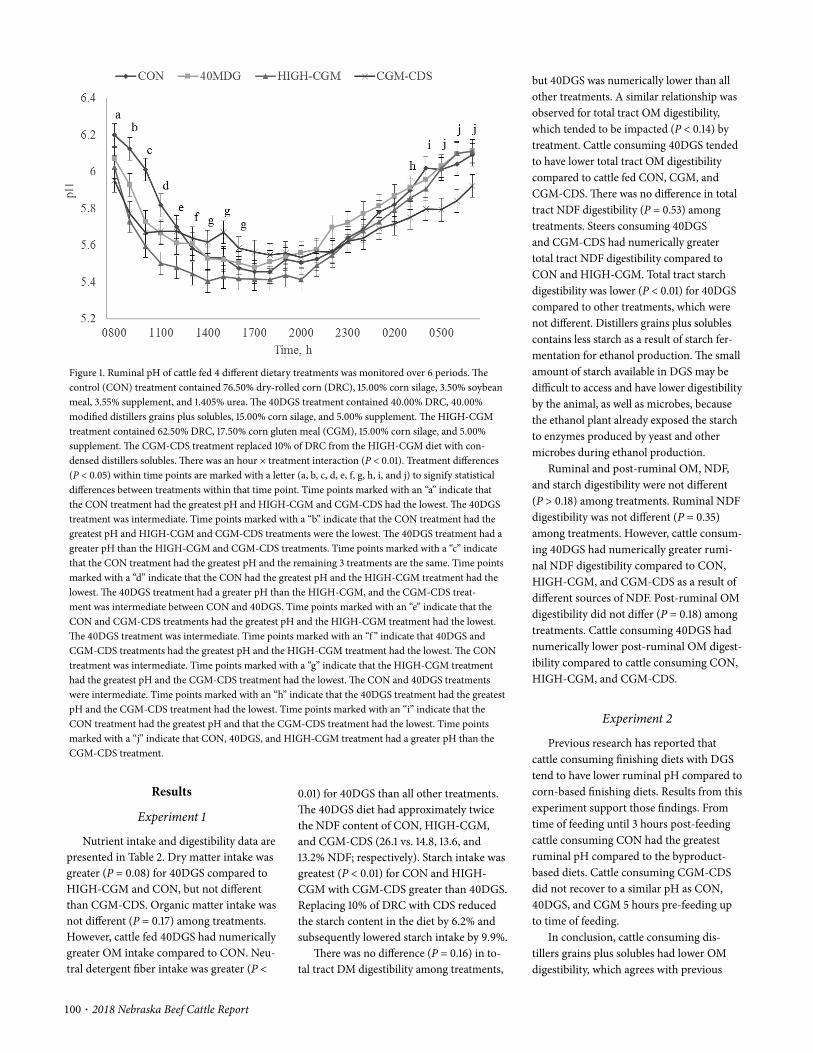
100 · 2018 Nebraska Beef Cattle Report
Results
Experiment 1
Nutrient intake and digestibility data are presented in Table 2. Dry matter intake was greater (P = 0.08) for 40DGS compared to HIGH- CGM and CON, but not different than CGM- CDS. Organic matter intake was not different (P = 0.17) among treatments. However, cattle fed 40DGS had numerically greater OM intake compared to CON. Neu-tral detergent fiber intake was greater (P <
Figure 1. Ruminal pH of cattle fed 4 different dietary treatments was monitored over 6 periods. The control (CON) treatment contained 76.50% dry- rolled corn (DRC), 15.00% corn silage, 3.50% soybean meal, 3.55% supplement, and 1.405% urea. The 40DGS treatment contained 40.00% DRC, 40.00% modified distillers grains plus solubles, 15.00% corn silage, and 5.00% supplement. The HIGH- CGM treatment contained 62.50% DRC, 17.50% corn gluten meal (CGM), 15.00% corn silage, and 5.00% supplement. The CGM- CDS treatment replaced 10% of DRC from the HIGH- CGM diet with con-densed distillers solubles. There was an hour × treatment interaction (P < 0.01). Treatment differences (P < 0.05) within time points are marked with a letter (a, b, c, d, e, f, g, h, i, and j) to signify statistical differences between treatments within that time point. Time points marked with an “a” indicate that the CON treatment had the greatest pH and HIGH- CGM and CGM- CDS had the lowest. The 40DGS treatment was intermediate. Time points marked with a “b” indicate that the CON treatment had the greatest pH and HIGH- CGM and CGM- CDS treatments were the lowest. The 40DGS treatment had a greater pH than the HIGH- CGM and CGM- CDS treatments. Time points marked with a “c” indicate that the CON treatment had the greatest pH and the remaining 3 treatments are the same. Time points marked with a “d” indicate that the CON had the greatest pH and the HIGH- CGM treatment had the lowest. The 40DGS treatment had a greater pH than the HIGH- CGM, and the CGM- CDS treat-ment was intermediate between CON and 40DGS. Time points marked with an “e” indicate that the CON and CGM- CDS treatments had the greatest pH and the HIGH- CGM treatment had the lowest. The 40DGS treatment was intermediate. Time points marked with an “f ” indicate that 40DGS and CGM- CDS treatments had the greatest pH and the HIGH- CGM treatment had the lowest. The CON treatment was intermediate. Time points marked with a “g” indicate that the HIGH- CGM treatment had the greatest pH and the CGM- CDS treatment had the lowest. The CON and 40DGS treatments were intermediate. Time points marked with an “h” indicate that the 40DGS treatment had the greatest pH and the CGM- CDS treatment had the lowest. Time points marked with an “i” indicate that the CON treatment had the greatest pH and that the CGM- CDS treatment had the lowest. Time points marked with a “j” indicate that CON, 40DGS, and HIGH- CGM treatment had a greater pH than the CGM- CDS treatment.
0.01) for 40DGS than all other treatments. The 40DGS diet had approximately twice the NDF content of CON, HIGH- CGM, and CGM- CDS (26.1 vs. 14.8, 13.6, and 13.2% NDF; respectively). Starch intake was greatest (P < 0.01) for CON and HIGH- CGM with CGM- CDS greater than 40DGS. Replacing 10% of DRC with CDS reduced the starch content in the diet by 6.2% and subsequently lowered starch intake by 9.9%.
There was no difference (P = 0.16) in to-tal tract DM digestibility among treatments,
but 40DGS was numerically lower than all other treatments. A similar relationship was observed for total tract OM digestibility, which tended to be impacted (P < 0.14) by treatment. Cattle consuming 40DGS tended to have lower total tract OM digestibility compared to cattle fed CON, CGM, and CGM- CDS. There was no difference in total tract NDF digestibility (P = 0.53) among treatments. Steers consuming 40DGS and CGM- CDS had numerically greater total tract NDF digestibility compared to CON and HIGH- CGM. Total tract starch digestibility was lower (P < 0.01) for 40DGS compared to other treatments, which were not different. Distillers grains plus solubles contains less starch as a result of starch fer-mentation for ethanol production. The small amount of starch available in DGS may be difficult to access and have lower digestibility by the animal, as well as microbes, because the ethanol plant already exposed the starch to enzymes produced by yeast and other microbes during ethanol production.
Ruminal and post- ruminal OM, NDF, and starch digestibility were not different (P > 0.18) among treatments. Ruminal NDF digestibility was not different (P = 0.35) among treatments. However, cattle consum-ing 40DGS had numerically greater rumi-nal NDF digestibility compared to CON, HIGH- CGM, and CGM- CDS as a result of different sources of NDF. Post- ruminal OM digestibility did not differ (P = 0.18) among treatments. Cattle consuming 40DGS had numerically lower post- ruminal OM digest-ibility compared to cattle consuming CON, HIGH- CGM, and CGM- CDS.
Experiment 2
Previous research has reported that cattle consuming finishing diets with DGS tend to have lower ruminal pH compared to corn- based finishing diets. Results from this experiment support those findings. From time of feeding until 3 hours post- feeding cattle consuming CON had the greatest ruminal pH compared to the byproduct- based diets. Cattle consuming CGM- CDS did not recover to a similar pH as CON, 40DGS, and CGM 5 hours pre- feeding up to time of feeding.
In conclusion, cattle consuming dis-tillers grains plus solubles had lower OM digestibility, which agrees with previous
2018 Nebraska Beef Cattle Report · 101
Melissa L. Jolly- Breithaupt, research technician
Galen E. Erickson, professor Animal Science
Jim C. MacDonald, associate professor Animal Science, Lincoln
Matt K. Luebbe, assistant professor Animal Science, Panhandle Research and Extension Center, Scottsbluff
research. The protein from corn did not contribute towards the lower digestibility of MDGS. Protein was more readily digestible than the other components in distillers grains plus solubles.
Zachary E. Carlson, graduate student
Jana L. Gramkow, research technician
Hannah C. Wilson, research technician
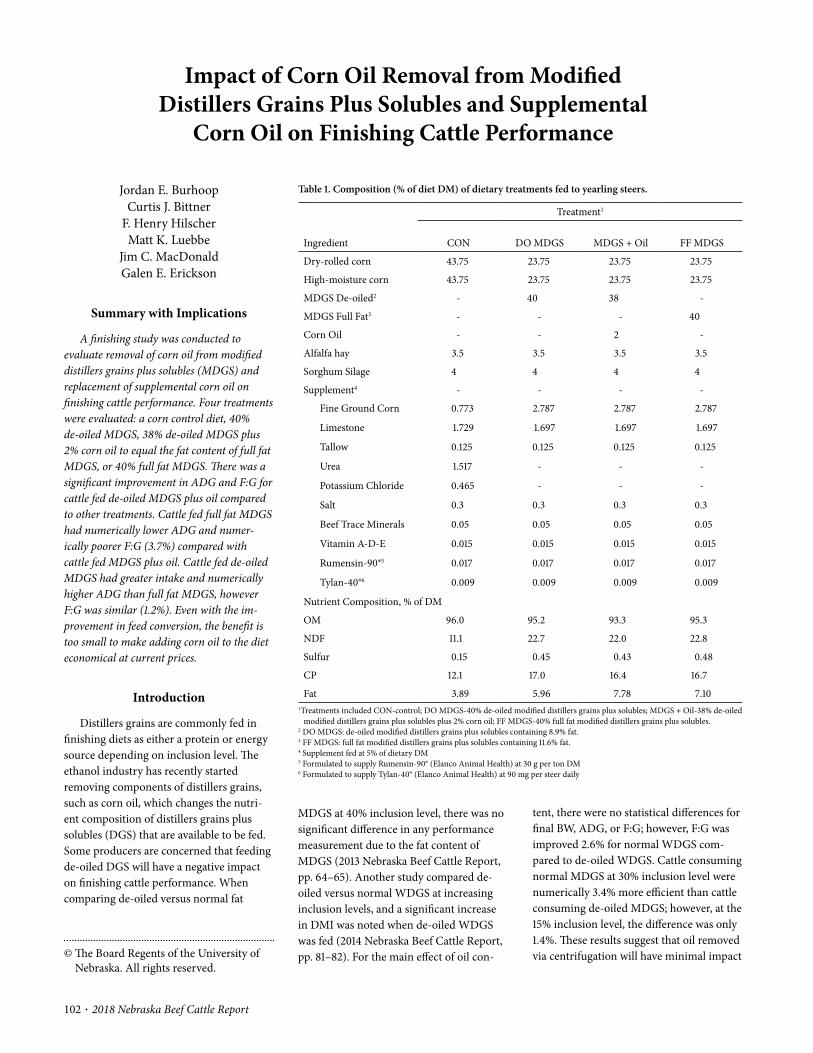
102 · 2018 Nebraska Beef Cattle Report
© The Board Regents of the University of Nebraska. All rights reserved.
tent, there were no statistical differences for final BW, ADG, or F:G; however, F:G was improved 2.6% for normal WDGS com-pared to de- oiled WDGS. Cattle consuming normal MDGS at 30% inclusion level were numerically 3.4% more efficient than cattle consuming de- oiled MDGS; however, at the 15% inclusion level, the difference was only 1.4%. These results suggest that oil removed via centrifugation will have minimal impact
MDGS at 40% inclusion level, there was no significant difference in any performance measurement due to the fat content of MDGS (2013 Nebraska Beef Cattle Report, pp. 64– 65). Another study compared de- oiled versus normal WDGS at increasing inclusion levels, and a significant increase in DMI was noted when de- oiled WDGS was fed (2014 Nebraska Beef Cattle Report, pp. 81– 82). For the main effect of oil con-
Impact of Corn Oil Removal from Modified Distillers Grains Plus Solubles and Supplemental
Corn Oil on Finishing Cattle Performance
Jordan E. BurhoopCurtis J. Bittner
F. Henry HilscherMatt K. Luebbe
Jim C. MacDonaldGalen E. Erickson
Summary with Implications
A finishing study was conducted to evaluate removal of corn oil from modified distillers grains plus solubles (MDGS) and replacement of supplemental corn oil on finishing cattle performance. Four treatments were evaluated: a corn control diet, 40% de- oiled MDGS, 38% de- oiled MDGS plus 2% corn oil to equal the fat content of full fat MDGS, or 40% full fat MDGS. There was a significant improvement in ADG and F:G for cattle fed de- oiled MDGS plus oil compared to other treatments. Cattle fed full fat MDGS had numerically lower ADG and numer-ically poorer F:G (3.7%) compared with cattle fed MDGS plus oil. Cattle fed de- oiled MDGS had greater intake and numerically higher ADG than full fat MDGS, however F:G was similar (1.2%). Even with the im-provement in feed conversion, the benefit is too small to make adding corn oil to the diet economical at current prices.
Introduction
Distillers grains are commonly fed in finishing diets as either a protein or energy source depending on inclusion level. The ethanol industry has recently started removing components of distillers grains, such as corn oil, which changes the nutri-ent composition of distillers grains plus solubles (DGS) that are available to be fed. Some producers are concerned that feeding de- oiled DGS will have a negative impact on finishing cattle performance. When comparing de- oiled versus normal fat
Table 1. Composition (% of diet DM) of dietary treatments fed to yearling steers.
Ingredient
Treatment1
CON DO MDGS MDGS + Oil FF MDGS
Dry- rolled corn 43.75 23.75 23.75 23.75
High- moisture corn 43.75 23.75 23.75 23.75
MDGS De- oiled2 - 40 38 -
MDGS Full Fat3 - - - 40
Corn Oil - - 2 -
Alfalfa hay 3.5 3.5 3.5 3.5
Sorghum Silage 4 4 4 4
Supplement4 - - - -
Fine Ground Corn 0.773 2.787 2.787 2.787
Limestone 1.729 1.697 1.697 1.697
Tallow 0.125 0.125 0.125 0.125
Urea 1.517 - - -
Potassium Chloride 0.465 - - -
Salt 0.3 0.3 0.3 0.3
Beef Trace Minerals 0.05 0.05 0.05 0.05
Vitamin A- D- E 0.015 0.015 0.015 0.015
Rumensin- 90®5 0.017 0.017 0.017 0.017
Tylan- 40®6 0.009 0.009 0.009 0.009
Nutrient Composition, % of DM
OM 96.0 95.2 93.3 95.3
NDF 11.1 22.7 22.0 22.8
Sulfur 0.15 0.45 0.43 0.48
CP 12.1 17.0 16.4 16.7
Fat 3.89 5.96 7.78 7.101Treatments included CON- control; DO MDGS- 40% de- oiled modified distillers grains plus solubles; MDGS + Oil- 38% de- oiled
modified distillers grains plus solubles plus 2% corn oil; FF MDGS- 40% full fat modified distillers grains plus solubles.2 DO MDGS: de- oiled modified distillers grains plus solubles containing 8.9% fat.3 FF MDGS: full fat modified distillers grains plus solubles containing 11.6% fat.4 Supplement fed at 5% of dietary DM5 Formulated to supply Rumensin- 90® (Elanco Animal Health) at 30 g per ton DM6 Formulated to supply Tylan- 40® (Elanco Animal Health) at 90 mg per steer daily
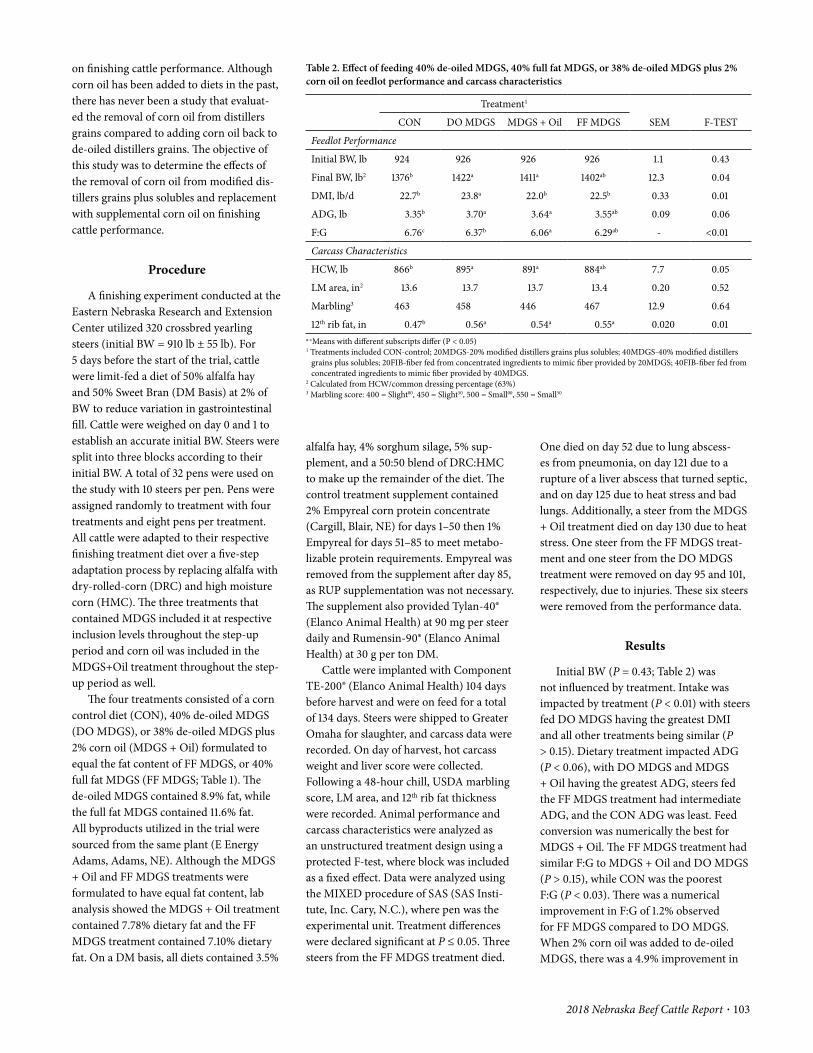
2018 Nebraska Beef Cattle Report · 103
One died on day 52 due to lung abscess-es from pneumonia, on day 121 due to a rupture of a liver abscess that turned septic, and on day 125 due to heat stress and bad lungs. Additionally, a steer from the MDGS + Oil treatment died on day 130 due to heat stress. One steer from the FF MDGS treat-ment and one steer from the DO MDGS treatment were removed on day 95 and 101, respectively, due to injuries. These six steers were removed from the performance data.
Results
Initial BW (P = 0.43; Table 2) was not influenced by treatment. Intake was impacted by treatment (P < 0.01) with steers fed DO MDGS having the greatest DMI and all other treatments being similar (P > 0.15). Dietary treatment impacted ADG (P < 0.06), with DO MDGS and MDGS + Oil having the greatest ADG, steers fed the FF MDGS treatment had intermediate ADG, and the CON ADG was least. Feed conversion was numerically the best for MDGS + Oil. The FF MDGS treatment had similar F:G to MDGS + Oil and DO MDGS (P > 0.15), while CON was the poorest F:G (P < 0.03). There was a numerical improvement in F:G of 1.2% observed for FF MDGS compared to DO MDGS. When 2% corn oil was added to de- oiled MDGS, there was a 4.9% improvement in
alfalfa hay, 4% sorghum silage, 5% sup-plement, and a 50:50 blend of DRC:HMC to make up the remainder of the diet. The control treatment supplement contained 2% Empyreal corn protein concentrate (Cargill, Blair, NE) for days 1– 50 then 1% Empyreal for days 51– 85 to meet metabo-lizable protein requirements. Empyreal was removed from the supplement after day 85, as RUP supplementation was not necessary. The supplement also provided Tylan- 40® (Elanco Animal Health) at 90 mg per steer daily and Rumensin- 90® (Elanco Animal Health) at 30 g per ton DM.
Cattle were implanted with Component TE- 200® (Elanco Animal Health) 104 days before harvest and were on feed for a total of 134 days. Steers were shipped to Greater Omaha for slaughter, and carcass data were recorded. On day of harvest, hot carcass weight and liver score were collected. Following a 48- hour chill, USDA marbling score, LM area, and 12th rib fat thickness were recorded. Animal performance and carcass characteristics were analyzed as an unstructured treatment design using a protected F- test, where block was included as a fixed effect. Data were analyzed using the MIXED procedure of SAS (SAS Insti-tute, Inc. Cary, N.C.), where pen was the experimental unit. Treatment differences were declared significant at P ≤ 0.05. Three steers from the FF MDGS treatment died.
on finishing cattle performance. Although corn oil has been added to diets in the past, there has never been a study that evaluat-ed the removal of corn oil from distillers grains compared to adding corn oil back to de- oiled distillers grains. The objective of this study was to determine the effects of the removal of corn oil from modified dis-tillers grains plus solubles and replacement with supplemental corn oil on finishing cattle performance.
Procedure
A finishing experiment conducted at the Eastern Nebraska Research and Extension Center utilized 320 crossbred yearling steers (initial BW = 910 lb ± 55 lb). For 5 days before the start of the trial, cattle were limit- fed a diet of 50% alfalfa hay and 50% Sweet Bran (DM Basis) at 2% of BW to reduce variation in gastrointestinal fill. Cattle were weighed on day 0 and 1 to establish an accurate initial BW. Steers were split into three blocks according to their initial BW. A total of 32 pens were used on the study with 10 steers per pen. Pens were assigned randomly to treatment with four treatments and eight pens per treatment. All cattle were adapted to their respective finishing treatment diet over a five- step adaptation process by replacing alfalfa with dry- rolled- corn (DRC) and high moisture corn (HMC). The three treatments that contained MDGS included it at respective inclusion levels throughout the step- up period and corn oil was included in the MDGS+Oil treatment throughout the step- up period as well.
The four treatments consisted of a corn control diet (CON), 40% de- oiled MDGS (DO MDGS), or 38% de- oiled MDGS plus 2% corn oil (MDGS + Oil) formulated to equal the fat content of FF MDGS, or 40% full fat MDGS (FF MDGS; Table 1). The de- oiled MDGS contained 8.9% fat, while the full fat MDGS contained 11.6% fat. All byproducts utilized in the trial were sourced from the same plant (E Energy Adams, Adams, NE). Although the MDGS + Oil and FF MDGS treatments were formulated to have equal fat content, lab analysis showed the MDGS + Oil treatment contained 7.78% dietary fat and the FF MDGS treatment contained 7.10% dietary fat. On a DM basis, all diets contained 3.5%
Table 2. Effect of feeding 40% de- oiled MDGS, 40% full fat MDGS, or 38% de- oiled MDGS plus 2% corn oil on feedlot performance and carcass characteristics
Treatment1
SEM F- TESTCON DO MDGS MDGS + Oil FF MDGS
Feedlot Performance
Initial BW, lb 924 926 926 926 1.1 0.43
Final BW, lb2 1376b 1422a 1411a 1402ab 12.3 0.04
DMI, lb/d 22.7b 23.8a 22.0b 22.5b 0.33 0.01
ADG, lb 3.35b 3.70a 3.64a 3.55ab 0.09 0.06
F:G 6.76c 6.37b 6.06a 6.29ab - <0.01
Carcass Characteristics
HCW, lb 866b 895a 891a 884ab 7.7 0.05
LM area, in2 13.6 13.7 13.7 13.4 0.20 0.52
Marbling3 463 458 446 467 12.9 0.64
12th rib fat, in 0.47b 0.56a 0.54a 0.55a 0.020 0.01a- cMeans with different subscripts differ (P < 0.05)1 Treatments included CON- control; 20MDGS- 20% modified distillers grains plus solubles; 40MDGS- 40% modified distillers
grains plus solubles; 20FIB- fiber fed from concentrated ingredients to mimic fiber provided by 20MDGS; 40FIB- fiber fed from concentrated ingredients to mimic fiber provided by 40MDGS.
2 Calculated from HCW/common dressing percentage (63%)3 Marbling score: 400 = Slight00, 450 = Slight50, 500 = Small00, 550 = Small50
104 · 2018 Nebraska Beef Cattle Report
ered free oil, so it may negatively impact fiber digestion in the rumen, while the fat in distillers grains is bound in the germ so it may pass through the rumen and not have a negative impact. Even with the improve-ment in feed conversion, the benefit is too small to make adding corn oil to the diet economical at current prices.
Jordan E. Burhoop, graduate student
Curtis J. Bittner, research technician
F. Henry Hilscher, research technician
Matt K. Luebbe, assistant professor, UNL Panhandle Research and Extension Center, Scottsbluff, Neb.
Jim C. MacDonald, associate professor Animal Science, Lincoln
Galen E. Erickson, professor Animal Science, Lincoln
or corn oil would have to decrease to less than $0.25/lb to make adding corn oil to the diet logical.
Conclusion
There was a numerical improvement in F:G of 1.2% observed for full fat MDGS compared to de- oiled MDGS, which is con-sistent with previous observations. When 2% corn oil was added to de- oiled MDGS, there was a 4.9% improvement in F:G compared to de- oiled MDGS. There was a numerical improvement in F:G by 3.7% for MDGS + Oil compared to FF MDGS. This could be partially due to the fact that the MDGS + Oil treatment contained a higher level of fat in the diet. One would expect F:G to decrease because corn oil is consid-
F:G compared to DO MDGS. There was a numerical improvement in F:G by 3.7% for MDGS + Oil compared to FF MDGS. Steers on the DO MDGS and MDGS + Oil treatments had the greatest HCW (P < 0.05), with FF MDGS being intermediate and CON having the lowest HCW. Cattle on all treatments had similar LM area (P > 0.52) and marbling (P > 0.64). Fat thickness was greatest (P < 0.01) for the MDGS treat-ments, while CON was lowest.
If corn is $3.36/bushel, MDGS is priced at 90% of the price of corn (currently $127/ton), and corn oil is $600/ton, it is not economical to add corn oil to the diet. The improvement in feed efficiency is not large enough to offset the increased cost of the added corn oil. The price of MDGS would have to increase to 118% of the price of corn

2018 Nebraska Beef Cattle Report · 105
© The Board Regents of the University of Nebraska. All rights reserved.
in a 5 × 4 unbalanced rectangle design with five periods and four treatments. Steers were assigned randomly to one of four treatments, with a different one of the four treatments having two steers each period. The four treatments consisted of a corn control diet, 40% de- oiled MDGS, or 38% de- oiled MDGS plus 2% corn oil formulat-ed to equal the fat content of FF MDGS, or 40% full fat MDGS (Table 1). The de- oiled MDGS contained 8.9% fat, while the full fat MDGS contained 11.6% fat. All byproducts utilized in the trial were sourced from the same plant (E Energy Adams, Adams, NE). Although the MDGS + Oil and FF MDGS treatments were formulated to have equal fat content, actual analysis showed the MDGS + Oil treatment contained 7.86% dietary fat and the FF MDGS treatment contained 7.09% dietary fat. On a DM basis, all diets contained 3.5% alfalfa hay, 4% sorghum silage, 5% supplement, and a 50:50 blend of DRC:HMC to make up the remainder of the diet. The control treat-ment supplement contained 1% Empyreal corn protein concentrate (Cargill Corn Milling) to meet metabolizable protein requirements. The supplement was for-mulated to provide 90 mg per steer daily of Tylan- 40® (Elanco Animal Health) and 30 g per ton DM of Rumensin- 90® (Elanco Animal Health).
Steers were housed in individual con-crete slatted pens and allowed ad libitum access to feed and water. Cattle were fed once daily at 0800 with refused feed being removed prior to feeding. Ingredient sam-ples were taken on days nine and 12 of each period and composited by period. Samples were lyophilized, ground through a 1- mm screen of a Wiley Mill, and analyzed for DM, OM, NDF, fat, CP, and gross energy using a bomb calorimetry to calculate nutrient composition of dietary treatments (Table 1).
Each period was 14 d, which consisted of a 10 d adaptation phase and 4 d collection phase. Titanium dioxide, an indigestible marker, was dosed intraruminally twice daily at 0800 and 1600 h throughout the
diets compared to WDGS, control, and control plus oil. A metabolism trial was conducted to evaluate the effects of dietary fat source on the metabolism characteristics of feedlot steers (2010 Nebraska Beef Cattle Report, pp. 80– 82). Cattle fed WDGS had the lowest total tract DM and fat digestibil-ity, while cattle fed corn oil had the lowest total tract NDF digestibility. A third me-tabolism trial was conducted to determine the effects of corn oil removal from MDGS on nutrient digestibility and ruminal pH (2015 Nebraska Beef Cattle Report, pp. 80– 82). Oil removal had no impact on DM, OM, or NDF digestibility. This is the only digestion trial that has evaluated that effects of de- oiled DGS compared to normal DGS, so further data was needed to confirm the results. In addition, there has never been a study that evaluated the removal of corn oil from distillers grains compared to adding corn oil back to de- oiled distillers grains. There was a feedlot trial performed with the same treatments as the current digestion trial to evaluate performance characteristics (2018 Nebraska Beef Cattle Report 102–04).When comparing FF MDGS to MDGS + Oil, steers fed FF MDGS had a numerically lighter final BW, gained less numerically, and in turn had a poorer feed conversion. When 2% corn oil was added to de- oiled MDGS, there was a 4.9% improvement in F:G compared to de- oiled MDGS. There was a numerical improvement in F:G by 3.7% for MDGS + Oil compared to FF MDGS. Economics were completed and it was determined that at current corn prices, the improved performance does not make up for the added cost to be economical to add corn oil back to diets. The objective of this study was to determine the effects of corn oil removal and supplemental corn oil to diets containing MDGS on total tract digestibility of finishing cattle.
Procedure
A 70- day metabolism experiment utilized five ruminally fistulated crossbred yearling steers (initial BW = 1195 lb ± 88 lb)
Jordan E. BurhoopMelissa L. Jolly- Breithaupt
Jana L. GramkowMatt K. Luebbe
Jim C. MacDonaldGalen E. Erickson
Summary with Implications
A digestion trial was conducted to de-termine the effects of the removal of corn oil from modified distillers grains plus solubles (MDGS) and the impact of supplemental corn oil on finishing cattle nutrient diges-tion. Four treatments were evaluated: a corn control diet (CON), 40% de- oiled MDGS (DO MDGS), or 38% de- oiled MDGS plus 2% corn oil (MDGS + Oil) formulated to equal the fat content of FF MDGS, or 40% full fat MDGS (FF MDGS). Treatment differ-ences were observed for digestibility of dry matter, organic matter, and fiber, but not for fat. When oil was added to de- oiled MDGS, digestibility was decreased for dry matter, organic matter, and fiber when compared to de- oiled or full fat MDGS. Digestibility val-ues from feeding DGS relative to corn control diets do not follow the same trend, digestible energy increases with DGS feeding, but OM digestibility decreases with DGS feeding.
Introduction
With ethanol companies removing a portion of corn oil from distillers grains, there has been uncertainty as to what impact there would be on performance and nutrient digestibility of finishing cattle. A metabolism experiment was conducted to evaluate the digestibility of wet distillers grains plus solubles (WDGS) compared with corn fiber and corn oil in finishing diets (2007 Nebraska Beef Cattle Report, pp. 39– 42). Total tract DM, OM, and NDF digestibility were less (P < 0.10) for cattle fed the composite and composite plus oil
Impact of Feeding Distillers Grains With or Without Oil Removal As Well As Supplemental Corn Oil
on Nutrient Digestibility by Finishing Cattle

106 · 2018 Nebraska Beef Cattle Report
mine DM of whole rumen contents.Production of volatile fatty acid was cal-
culated over a six- hour gas production peri-od. Two bottles (0 h) were filled with whole rumen contents when other rumen samples were taken and frozen in liquid nitrogen. After the gas run, contents of ANKOM bottles were emptied into bottles (6 h) and frozen in liquid nitrogen. Concentration of VFA was measured on the zero and six hour bottles, and slope calculated for VFA production rate in mM/hr.
Digestibility and intakes were analyzed using the MIXED procedure of SAS (SAS Institute, Inc. Cary, N.C.). The fixed effects in the model were treatment and period, while steer was a random effect. Ruminal pH data were summarized by hour and analyzed using the GLIMMIX procedure of SAS (SAS Institute, Inc.) to get an overall period treatment average for each parame-ter. Slope of VFA production was analyzed using the MIXED procedure of SAS, with steer being a random effect. Treatment ef-fects were evaluated using the F- test statistic and assessed as significant at P ≤ 0.05. If significant, then treatments were separated and compared using a t- test.
Results
No treatment differences were observed for DMI (P > 0.94; Table 2) with intake ranging from 19.6 to 20.7 lb/d. Dietary treatment had an impact on total tract DM digestibility (P < 0.01). The greatest digestibility was observed for the control treatment, DO MDGS was next, MDGS + Oil was lowest, with FF MDGS being inter-mediate and not differing from both DO MDGS and MDGS + Oil. Results of OM intake and total tract digestibility followed the same trend as DM, with intakes ranging from 19.0 to 19.8 lb/d and treatments impacting OM digestibility similarly to DM digestibility.
A treatment effect was observed for NDF intake (P < 0.01), with MDGS treat-ments having greater NDF intake than the control due to a greater dietary NDF concentration. There was a tendency (P = 0.07) for total tract NDF digestibility to be different between treatments. The greatest NDF digestibility was observed for FF MDGS and lowest for CON and MDGS + Oil, with DO MDGS being intermediate and not differing from all other treatments.
mine DM digestibility and NDF digest-ibility at 20 and 30 hours of incubation. For DM digestibility, DRC was placed in the bag. For NDF digestibility, either dry corn bran or solvent extracted germ meal (SEM) were utilized. Following incubation, samples were immediately frozen and at the end of the trial, bags containing dry corn bran or SEM were analyzed for NDF. After the NDF procedure, bags were dried in a 140°F forced- air oven for 16 hours and weights were used to calculate NDF digest-ibility. The bags that contained DRC were not analyzed for NDF and were only dried in the 140°F forced- air oven for 16 hours to determine DM digestibility. At the time of in- situ bag removal, contents were mixed in the rumen and sampled. A portion was immediately frozen and later used to deter-
entire period to provide a total of 10 g/d for use as an estimate of fecal output. On d 10 to 13, fecal grab samples were collected four times/d at 0800, 1200, 1600, and 2000 h, and immediately frozen. At the end of each period, fecal samples were composited by day (wet basis), lyophilized, and ground through a 1- mm screen of a Wiley Mill, and composited by period. Fecal sample analysis consisted of DM, OM, NDF, fat, energy for calculation of digestible energy, and titanium dioxide.
Submersible wireless pH probes were placed in the rumen for the entire period; however, ruminal pH was only analyzed from d 9 to 12. Measurements for pH include average ruminal pH, minimum and maxi-mum pH, and magnitude of pH change.
Rumen in- situ bags were used to deter-
Table 1. Composition (% of diet DM) of dietary treatments fed to yearling steers.
Ingredient
Treatment1
CON DO MDGS MDGS + Oil FF MDGS
Dry- rolled corn 43.75 23.75 23.75 23.75
High- moisture corn 43.75 23.75 23.75 23.75
MDGS De- oiled2 - 40 38 -
MDGS Full Fat3 - - - 40
Corn Oil - - 2 -
Alfalfa hay 3.5 3.5 3.5 3.5
Sorghum Silage 4 4 4 4
Supplement4
Fine Ground Corn 0.773 2.787 2.787 2.787
Limestone 1.729 1.697 1.697 1.697
Tallow 0.125 0.125 0.125 0.125
Urea 1.517 - - -
Potassium Chloride 0.465 - - -
Salt 0.3 0.3 0.3 0.3
Beef Trace Minerals 0.05 0.05 0.05 0.05
Vitamin A- D- E 0.015 0.015 0.015 0.015
Rumensin- 90®5 0.017 0.017 0.017 0.017
Tylan- 40®6 0.009 0.009 0.009 0.009
Nutrient Composition, % of DM
DM 78.5 67.0 68.0 67.3
NDF 11.0 22.7 22.0 22.6
Sulfur 0.17 0.44 0.44 0.48
CP 12.1 17.0 16.4 16.7
Fat 4.16 6.04 7.86 7.091 Treatments included CON- control; DO MDGS- 40% de- oiled modified distillers grains plus solubles; MDGS + Oil- 38% de-
oiled modified distillers grains plus solubles plus 2% corn oil; FF MDGS- 40% full fat modified distillers grains plus solubles.2 DO MDGS: de- oiled modified distillers grains plus solubles containing 8.9% fat.3 FF MDGS: full fat modified distillers grains plus solubles containing 11.6% fat.4 Supplement fed at 5% of dietary DM5 Formulated to supply Rumensin- 90® (Elanco Animal Health) at 30 g per ton DM6 Formulated to supply Tylan- 40® (Elanco Animal Health) at 90 mg per steer daily

2018 Nebraska Beef Cattle Report · 107
Digestibility of NDF was greater for FF MDGS compared to MDGS + Oil (P = 0.04). These results suggest that free corn oil may have a negative impact on NDF digestibility, which could be because free corn oil is thought to inhibit NDF digestion by coating feed or inhibiting microbes. Free oil is thought to impact fiber digestion in the rumen, while the fat in distillers grains is bound in the germ so it will pass through the rumen without inhibiting digestion. The lower NDF digestibility for MDGS + Oil may also be due to the lower amount of NDF in the diet coming from MDGS. In- situ NDF digestibility values for corn bran were approximately half of what was observed for total tract NDF digestibility of the entire diet (26.6 to 28.6%); however, values for SEM were greater than total tract (60.1 to 64.7%). Cattle fed MDGS + Oil re-sulted numerically in the greatest bran NDF digestion whereas NDF digestion was least in steers fed CON, with DO MDGS and FF MDGS being intermediate and not differing from all other treatments (Table 3). Cattle fed FF MDGS resulted in the greatest SEM NDF digestibility whereas NDF digestion was least in steers fed DO MDGS, with CON being intermediate and MDGS + Oil not differing from both FF MDGS and CON. When corn was incubated in steers fed DO MDGS and FF MDGS, corn DM digestibility was greatest. It was least in steers fed CON and intermediate in steers fed MDGS + Oil.
Fat intake was different among treat-ments (P < 0.01), with MDGS + Oil being numerically greatest, DO MDGS being intermediate, CON being lowest, and FF MDGS not differing from both MDGS + Oil and DO MDGS. There was no treat-ment effect observed for total tract fat digestibility (P = 0.83), with an observed range of 81.1 to 83.3%.
Energy intake (Mcal) and digestible energy (Mcal/d) were not impacted by treatment (P = 0.46 and 0.76, respective-ly). Energy intake ranged from 38.6 to 45.0 Mcal, while DE ranged from 30.97 to 34.31 Mcal/d. There was a tendency for DE concentration (Mcal/lb) to be different among treatments (P = 0.13). The greatest DE (Mcal/lb) was observed for FF MDGS and lowest for CON, with DO MDGS and MDGS + Oil being intermediate. The results of increased supply of DE in diets
Table 2. Effect of feeding 40% de- oiled MDGS, 40% full fat MDGS, or 38% de- oiled MDGS plus 2% corn oil on digestible energy and intake and total tract digestibility of DM, OM, NDF, and fat.
Treatment1
CON DO MDGS MDGS + Oil FF MDGS SEM F- TEST
DM
Intake, lb/d 19.6 20.5 19.8 20.7 1.94 0.94
Total Tract Digestibility, % 81.7a 77.2b 73.8c 75.9bc 1.28 <0.01
OM
Intake, lb/d 19.0 19.4 19.0 19.8 1.85 0.96
Total Tract Digestibility, % 83.6a 79.1b 76.1c 78.1bc 1.43 <0.01
NDF
Intake, lb/d 2.16a 4.72a 4.39a 4.78a 0.384 <0.01
Total Tract Digestibility, % 50.5b 55.3ab 51.3b 57.7a 2.19 0.07
Fat
Intake, lb/d 0.82c 1.23b 1.57a 1.48ab 0.123 <0.01
Total Tract Digestibility, % 82.9 81.1 81.8 83.3 1.91 0.83
Energy
Intake, Mcal 38.6 43.3 43.0 45.0 4.08 0.46
DE, Mcal/d 30.97 33.27 31.7 34.31 2.920 0.76
DE, Mcal/lb 1.59b 1.63ab 1.60ab 1.66a 0.03 0.13abcMeans with different subscripts differ (P < 0.05)1 Treatments included CON- control; DO MDGS- 40% de- oiled MDGS, FF MDGS- 40% full fat MDGS, or MDGS + Oil- 38%
de- oiled MDGS plus 2% corn oil
Table 3. Effect of feeding 40% de- oiled MDGS, 40% full fat MDGS, or 38% de- oiled MDGS plus 2% corn oil on in- situ NDF and DM digestibility.
Treatment1
CON DO MDGS MDGS + Oil FF MDGS SEM Int Trt Sample
NDFD
Corn Bran 26.6e 27.6de 28.6d 27.7de 0.55 <0.01 <0.01 <0.01
Germ Meal 62.2b 60.1c 63.2ab 64.7a
DMD
DRC 49.1c 56.3a 53.4b 56.5a 1.64 - <0.01 - a- cMeans with different subscripts differ (P < 0.05)1 Treatments included CON- control; DO MDGS- 40% de- oiled MDGS, FF MDGS- 40% full fat MDGS, or MDGS + Oil- 38%
de- oiled MDGS plus 2% corn oil
Table 4. Effect of feeding 40% de- oiled MDGS, 40% full fat MDGS, or 38% de- oiled MDGS plus 2% corn oil on ruminal pH.
Treatment1
CON DO MDGS MDGS + Oil FF MDGS SEM Trt
Average pH 5.64 5.70 5.88 5.83 0.138 0.14
Maximum pH 6.46 6.53 6.66 6.66 0.150 0.38
Minimum pH 5.03 5.06 5.22 5.18 0.120 0.36
pH magnitude 1.43 1.47 1.45 1.49 0.112 0.97a- cMeans with different subscripts differ (P < 0.05)1 Treatments included CON- control; DO MDGS- 40% de- oiled MDGS, FF MDGS- 40% full fat MDGS, or MDGS + Oil- 38%
de- oiled MDGS plus 2% corn oil

108 · 2018 Nebraska Beef Cattle Report
(P = 0.57). The A:P molar proportion tend-ed to be greatest for FF MDGS (P = 0.07), least in cattle fed DO MDGS and MDGS + Oil and not differing from each other (P = 0.79), and CON was intermediate and not differing from all other treatments (P > 0.18).
Conclusion
Digestion data from OM and DE are not consistent with observed performance between full fat and adding corn oil back to de- oiled MDGS. Cattle on the FF MDGS treatment had better OM digestibility and greater DE in the diet than MDGS + Oil; however, steers fed FF MDGS had a lighter final BW, gained less, and in turn had a poorer feed conversion (2018 Nebraska Beef Cattle Report 102–04). Digestibility values from feeding DGS relative to corn control diets are not consistent. Digestible energy increases with DGS feeding, but OM digestibility decreases with DGS feeding. Adding corn oil decreased fiber digestibility compared to de- oiled or full fat MDGS; however, this did not impact fiber digestion of bran when incubated in the rumen of cattle.
Jordan E. Burhoop, graduate student
Curtis J. Bittner, research technician
F. Henry Hilscher, research technician
Matt K. Luebbe, assistant professor, UNL Panhandle Research and Extension Center, Scottsbluff, Neb.
Jim C. MacDonald, associate professor Animal Science, Lincoln
Galen E. Erickson, professor Animal Science, Lincoln
for FF MDGS, while MDGS + Oil was not differing from both CON and FF MDGS (P > 0.10). Total VFA production agrees with observed pH data, where MDGS + Oil and FF MDGS had the higher pH and the lower rate of production, while CON and DO MDGS had a lower pH with a higher rate of VFA production. There were no hour × treatment interactions for molar proportion of VFA. Molar proportion of acetate was greatest for FF MDGS (P = 0.01), least in cattle fed DO MDGS and MDGS + Oil and not differing from each other (P = 0.88), and CON was intermediate and not differ-ing from all other treatments (P > 0.09). Molar proportion of propionate tended to be impacted by dietary treatment (P = 0.06). Propionate was similar and greatest (P = 0.70) for DO MDGS and MDGS + Oil, and lowest for FF MDGS, while CON was not differing from all other treatments (P > 0.09). There was no dietary treatment effect observed for molar proportion of butyrate
containing DGS is a new concept and has not been studied heavily. This concept could help explain the increase in perfor-mance due to feeding DGS. Results of DE do not match performance results, where cattle fed MDGS+Oil were numerically the most efficient and had the greatest ADG.
Average, maximum, minimum, and magnitude of change for ruminal pH were not impacted by dietary treatment (Table 4; P > 0.14).
Total VFA production rate (mM/hr) was greatest for DO MDGS (Table 5; P < 0.01). There was a tendency (P = 0.08) for CON and FF MDGS to be different, while MDGS + Oil did not differ between both CON and FF MDGS (P = 0.40 and 0.34, respectively). Production rate of acetate and butyrate were not statistically differ-ent among treatments (P = 0.40 and 0.99, respectively). Propionate production was greatest for steers fed DO MDGS (P < 0.01), intermediate for CON, and lowest
Table 5. Effect of feeding 40% de- oiled MDGS, 40% full fat MDGS, or 38% de- oiled MDGS plus 2% corn oil on VFA production (mM/hr) and VFA molar proportion.
Treatment1
CON DO MDGS MDGS + Oil FF MDGS SEM Trt Hr*Trt
VFA Production
Total 13.6b 17.2a 12.5b 11.2b 1.74 <0.01 -
Acetate 5.4 6.8 5.4 5.1 0.88 0.40 -
Propionate 5.7b 7.7a 4.8bc 3.8c 0.87 <0.01 -
Butyrate 1.7 1.9 1.8 1.8 0.35 0.99 -
VFA molar %
Acetate 48.1ab 45.4b 45.1b 51.6a 1.49 0.01 0.98
Propionate 35.1ab 38.3a 37.0a 29.7b 2.30 0.06 0.99
Butyrate 12.1 12.1 13.9 13.7 1.21 0.57 0.98
A:P 1.6ab 1.3b 1.3b 1.9a 0.23 0.07 0.96a- cMeans with different subscripts differ (P < 0.05)1 Treatments included CON- control; DO MDGS- 40% de- oiled MDGS, FF MDGS- 40% full fat MDGS, or MDGS + Oil- 38%
de- oiled MDGS plus 2% corn oil
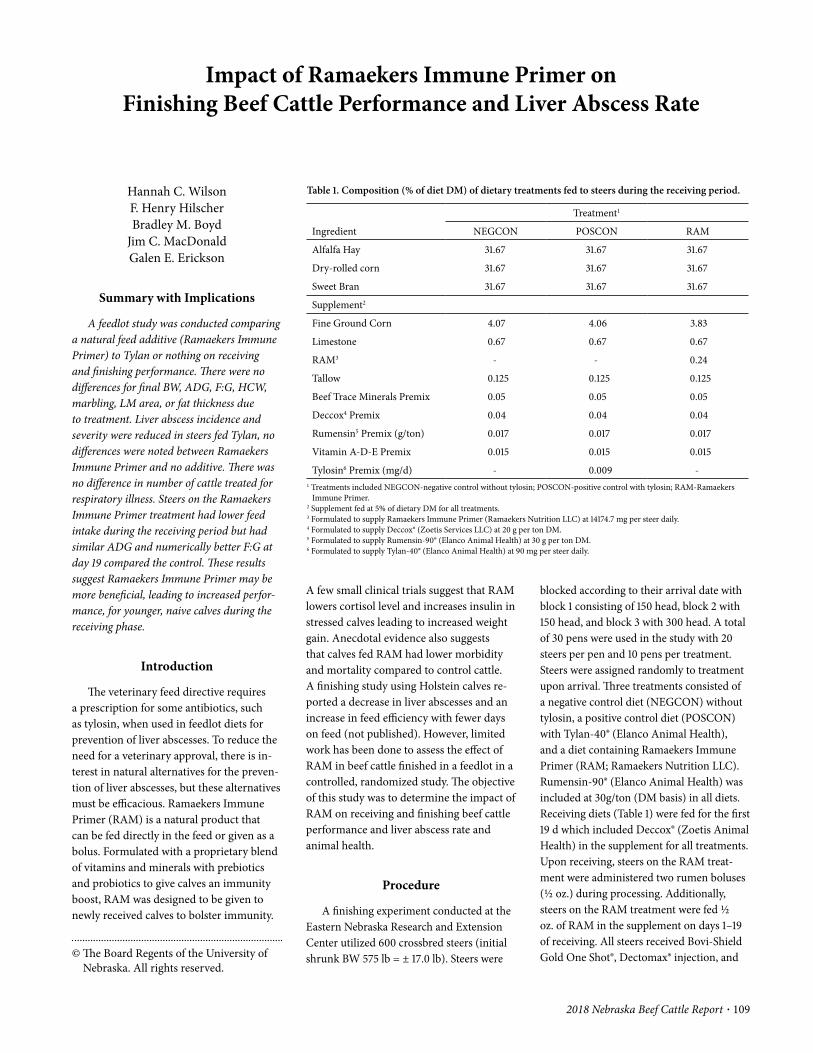
2018 Nebraska Beef Cattle Report · 109
© The Board Regents of the University of Nebraska. All rights reserved.
Impact of Ramaekers Immune Primer on Finishing Beef Cattle Performance and Liver Abscess Rate
Hannah C. WilsonF. Henry HilscherBradley M. Boyd
Jim C. MacDonaldGalen E. Erickson
Summary with Implications
A feedlot study was conducted comparing a natural feed additive (Ramaekers Immune Primer) to Tylan or nothing on receiving and finishing performance. There were no differences for final BW, ADG, F:G, HCW, marbling, LM area, or fat thickness due to treatment. Liver abscess incidence and severity were reduced in steers fed Tylan, no differences were noted between Ramaekers Immune Primer and no additive. There was no difference in number of cattle treated for respiratory illness. Steers on the Ramaekers Immune Primer treatment had lower feed intake during the receiving period but had similar ADG and numerically better F:G at day 19 compared the control. These results suggest Ramaekers Immune Primer may be more beneficial, leading to increased perfor-mance, for younger, naive calves during the receiving phase.
Introduction
The veterinary feed directive requires a prescription for some antibiotics, such as tylosin, when used in feedlot diets for prevention of liver abscesses. To reduce the need for a veterinary approval, there is in-terest in natural alternatives for the preven-tion of liver abscesses, but these alternatives must be efficacious. Ramaekers Immune Primer (RAM) is a natural product that can be fed directly in the feed or given as a bolus. Formulated with a proprietary blend of vitamins and minerals with prebiotics and probiotics to give calves an immunity boost, RAM was designed to be given to newly received calves to bolster immunity.
A few small clinical trials suggest that RAM lowers cortisol level and increases insulin in stressed calves leading to increased weight gain. Anecdotal evidence also suggests that calves fed RAM had lower morbidity and mortality compared to control cattle. A finishing study using Holstein calves re-ported a decrease in liver abscesses and an increase in feed efficiency with fewer days on feed (not published). However, limited work has been done to assess the effect of RAM in beef cattle finished in a feedlot in a controlled, randomized study. The objective of this study was to determine the impact of RAM on receiving and finishing beef cattle performance and liver abscess rate and animal health.
Procedure
A finishing experiment conducted at the Eastern Nebraska Research and Extension Center utilized 600 crossbred steers (initial shrunk BW 575 lb = ± 17.0 lb). Steers were
blocked according to their arrival date with block 1 consisting of 150 head, block 2 with 150 head, and block 3 with 300 head. A total of 30 pens were used in the study with 20 steers per pen and 10 pens per treatment. Steers were assigned randomly to treatment upon arrival. Three treatments consisted of a negative control diet (NEGCON) without tylosin, a positive control diet (POSCON) with Tylan- 40® (Elanco Animal Health), and a diet containing Ramaekers Immune Primer (RAM; Ramaekers Nutrition LLC). Rumensin- 90® (Elanco Animal Health) was included at 30g/ton (DM basis) in all diets. Receiving diets (Table 1) were fed for the first 19 d which included Deccox® (Zoetis Animal Health) in the supplement for all treatments. Upon receiving, steers on the RAM treat-ment were administered two rumen boluses (½ oz.) during processing. Additionally, steers on the RAM treatment were fed ½ oz. of RAM in the supplement on days 1– 19 of receiving. All steers received Bovi- Shield Gold One Shot®, Dectomax® injection, and
Table 1. Composition (% of diet DM) of dietary treatments fed to steers during the receiving period.
Ingredient
Treatment1
NEGCON POSCON RAM
Alfalfa Hay 31.67 31.67 31.67
Dry- rolled corn 31.67 31.67 31.67
Sweet Bran 31.67 31.67 31.67
Supplement2
Fine Ground Corn 4.07 4.06 3.83
Limestone 0.67 0.67 0.67
RAM3 - - 0.24
Tallow 0.125 0.125 0.125
Beef Trace Minerals Premix 0.05 0.05 0.05
Deccox4 Premix 0.04 0.04 0.04
Rumensin5 Premix (g/ton) 0.017 0.017 0.017
Vitamin A- D- E Premix 0.015 0.015 0.015
Tylosin6 Premix (mg/d) - 0.009 - 1 Treatments included NEGCON- negative control without tylosin; POSCON- positive control with tylosin; RAM- Ramaekers
Immune Primer.2 Supplement fed at 5% of dietary DM for all treatments.3 Formulated to supply Ramaekers Immune Primer (Ramaekers Nutrition LLC) at 14174.7 mg per steer daily.4 Formulated to supply Deccox® (Zoetis Services LLC) at 20 g per ton DM.5 Formulated to supply Rumensin- 90® (Elanco Animal Health) at 30 g per ton DM.6 Formulated to supply Tylan- 40® (Elanco Animal Health) at 90 mg per steer daily.

110 · 2018 Nebraska Beef Cattle Report
Somubac® (Zoetis Animal Health).On day 19, during revaccination, indi-
vidual weights were taken and steers were implanted with Revalor- XS (Merck Animal Health). Steers on the RAM treatment were given a second administration of 2 boluses with RAM. After day 19, RAM steers were pulse dosed with Ramaekers Immune Primer once weekly with dosage provided in the supplement which included a food- grade dye for visual inspection of correct delivery. Steers were adapted to their respective finishing diets during a 5- step process over 28 days where Sweet Bran and alfalfa were replaced with high- moisture corn (HMC) and wet distillers grains plus solubles (WDGS; Table 2).
Block 1 and 2 were fed for 221 and 222 days, respectively. Block 3 was fed for 230 days. Steers were shipped to Greater Omaha for slaughter, and carcass data were record-ed. On day of harvest, hot carcass weight and liver score were collected. Following a 48- hour chill, USDA marbling score, lon-gissimus muscle (LM) area, and 12th rib fat thickness were recorded. Carcass- adjusted performance was calculated using final body weight (BW), based on hot carcass weight (HCW) divided by a common dress-ing percentage of 63.
Carcass and performance data were an-alyzed using the MIXED procedure of SAS (SAS Institute, Inc. Cary, N.C.) where pen was the experimental unit. Liver abscess incidence, morbidity, and mortality were analyzed using PROC GLIMMIX of SAS with the outcome of interest as the number of animals affected out of the total number of animals within the pen as binomial variables. Animals treated four times were removed from the study. Yield grade, qual-ity grade, and liver abscess severity were analyzed using PROC GLIMMIX of SAS using a multinomial distribution to evaluate distribution differences due to treatment. Treatment differences were declared signifi-cant for all statistical analysis at P ≤ 0.05.
Results
During the first 19 days (receiving period), there were no differences observed in ending BW, average daily gain (ADG), or feed to gain (F:G; Table 3). However, there was a significant difference for DMI (P ≥ 0.020) where POSCON and RAM treat-ments had lower dry matter intake (DMI)
Table 2. Composition (% of diet DM) of dietary treatments fed to steers during the finishing period.
Ingredient
Treatment1
NEGCON POSCON RAM
Dry- rolled corn 26.4 26.4 26.4
High- moisture corn 39.6 39.6 39.6
WDGS2 25.0 25.0 25.0
Wheat Straw 5.0 5.0 5.0
Supplement3
Limestone 1.71 1.71 1.71
Fine Ground Corn 1.56 1.47 1.33
Salt 0.30 0.30 0.30
Urea 0.25 0.25 0.25
RAM4 - - 0.21
Tallow 0.10 0.10 0.10
Beef Trace Minerals Premix 0.05 0.05 0.05
Water5 - - 0.021
Rumensin Premix (g/ton)6 0.017 0.017 0.017
Vitamin A- D- E Premix 0.015 0.015 0.015
Tylosin Premix (mg/d)7 - 0.009 -
FD & C Blue Dye8 - - 0.0021 Treatments included NEGCON- negative control without tylosin; POSCON- positive control with tylosin; RAM- Ramaekers
Immune Primer.2 WDGS: Wet distillers grains plus solubles.3 Supplement fed at 4% of dietary DM for all treatments.4 Formulated to supply Ramaekers Immune Primer (Ramaekers Nutrition LLC) at 14174.7 mg per steer daily, fed once per week.5 Water added on as- is basis to mix FD & C Blue Dye6 Formulated to supply Rumensin- 90® (Elanco Animal Health) at 30 g per ton DM.7 Formulated to supply Tylan- 40® (Elanco Animal Health) at 90 mg per steer daily.8 FD & C Blue Dye: water- soluble artificial blue dye allowed by the FDA for use in foods was used to identify correct supplement
delivery.
Table 3. Live performance and morbidity of newly received calves during the 19 day receiving period of a feedlot study
Item
Treatment1
SEM P- valueNEGCON POSCON RAM
Live Performance
Initial BW, lb 577 578 571 5.69 0.65
Ending BW, lb2 625 622 623 4.23 0.80
DMI, lb/d 12.4b 11.3a 11.7a 0.26 0.02
ADG, lb 2.56 2.41 2.79 0.23 0.48
F:G 5.13 5.74 4.54 0.72 0.48
Morbidity
Pulls, n 62 54 56 - -
First Pull, %3 30.1 35.3 28.3 8.5 0.37
Second Pull %4 0.05 1.0 4.0 1.4 0.064a,b Means with different superscripts differ (P < 0.05).1 Treatments included NEGCON- negative control without tylosin; POSCON- positive control with tylosin; RAM- Ramaekers
Immune Primer.2 Ending BW is the average pen weight shrunk 4.0%, Subsequent ADG and F:G are calculated from 4.0% shrunk EBW.3 Percentage of steers treated one or more times as a percent of total steers within the pen.4 Percentage of steers treated two or more times as a percent of total steers within the pen.
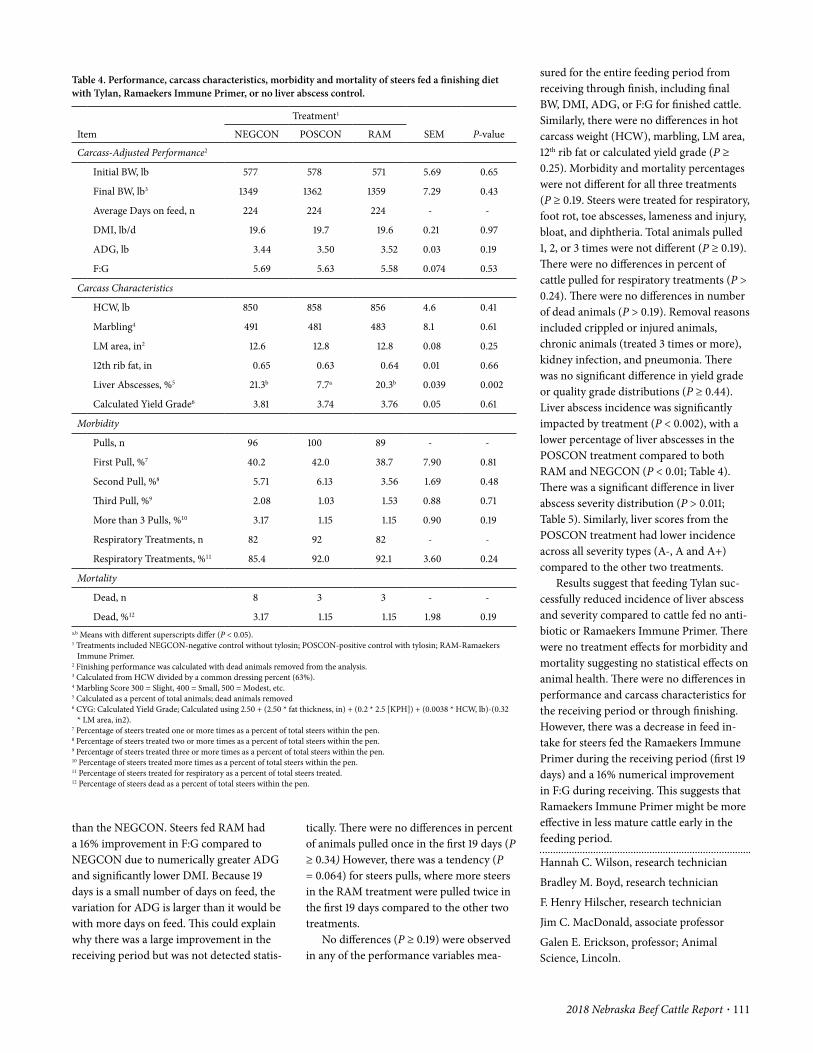
2018 Nebraska Beef Cattle Report · 111
sured for the entire feeding period from receiving through finish, including final BW, DMI, ADG, or F:G for finished cattle. Similarly, there were no differences in hot carcass weight (HCW), marbling, LM area, 12th rib fat or calculated yield grade (P ≥ 0.25). Morbidity and mortality percentages were not different for all three treatments (P ≥ 0.19. Steers were treated for respiratory, foot rot, toe abscesses, lameness and injury, bloat, and diphtheria. Total animals pulled 1, 2, or 3 times were not different (P ≥ 0.19). There were no differences in percent of cattle pulled for respiratory treatments (P > 0.24). There were no differences in number of dead animals (P > 0.19). Removal reasons included crippled or injured animals, chronic animals (treated 3 times or more), kidney infection, and pneumonia. There was no significant difference in yield grade or quality grade distributions (P ≥ 0.44). Liver abscess incidence was significantly impacted by treatment (P < 0.002), with a lower percentage of liver abscesses in the POSCON treatment compared to both RAM and NEGCON (P < 0.01; Table 4). There was a significant difference in liver abscess severity distribution (P > 0.011; Table 5). Similarly, liver scores from the POSCON treatment had lower incidence across all severity types (A- , A and A+) compared to the other two treatments.
Results suggest that feeding Tylan suc-cessfully reduced incidence of liver abscess and severity compared to cattle fed no anti-biotic or Ramaekers Immune Primer. There were no treatment effects for morbidity and mortality suggesting no statistical effects on animal health. There were no differences in performance and carcass characteristics for the receiving period or through finishing. However, there was a decrease in feed in-take for steers fed the Ramaekers Immune Primer during the receiving period (first 19 days) and a 16% numerical improvement in F:G during receiving. This suggests that Ramaekers Immune Primer might be more effective in less mature cattle early in the feeding period.
Hannah C. Wilson, research technician
Bradley M. Boyd, research technician
F. Henry Hilscher, research technician
Jim C. MacDonald, associate professor
Galen E. Erickson, professor; Animal Science, Lincoln.
tically. There were no differences in percent of animals pulled once in the first 19 days (P ≥ 0.34) However, there was a tendency (P = 0.064) for steers pulls, where more steers in the RAM treatment were pulled twice in the first 19 days compared to the other two treatments.
No differences (P ≥ 0.19) were observed in any of the performance variables mea-
than the NEGCON. Steers fed RAM had a 16% improvement in F:G compared to NEGCON due to numerically greater ADG and significantly lower DMI. Because 19 days is a small number of days on feed, the variation for ADG is larger than it would be with more days on feed. This could explain why there was a large improvement in the receiving period but was not detected statis-
Table 4. Performance, carcass characteristics, morbidity and mortality of steers fed a finishing diet with Tylan, Ramaekers Immune Primer, or no liver abscess control.
Item
Treatment1
SEM P- valueNEGCON POSCON RAM
Carcass- Adjusted Performance2
Initial BW, lb 577 578 571 5.69 0.65
Final BW, lb3 1349 1362 1359 7.29 0.43
Average Days on feed, n 224 224 224 - -
DMI, lb/d 19.6 19.7 19.6 0.21 0.97
ADG, lb 3.44 3.50 3.52 0.03 0.19
F:G 5.69 5.63 5.58 0.074 0.53
Carcass Characteristics
HCW, lb 850 858 856 4.6 0.41
Marbling4 491 481 483 8.1 0.61
LM area, in2 12.6 12.8 12.8 0.08 0.25
12th rib fat, in 0.65 0.63 0.64 0.01 0.66
Liver Abscesses, %5 21.3b 7.7a 20.3b 0.039 0.002
Calculated Yield Grade6 3.81 3.74 3.76 0.05 0.61
Morbidity
Pulls, n 96 100 89 - -
First Pull, %7 40.2 42.0 38.7 7.90 0.81
Second Pull, %8 5.71 6.13 3.56 1.69 0.48
Third Pull, %9 2.08 1.03 1.53 0.88 0.71
More than 3 Pulls, %10 3.17 1.15 1.15 0.90 0.19
Respiratory Treatments, n 82 92 82 - -
Respiratory Treatments, %11 85.4 92.0 92.1 3.60 0.24
Mortality
Dead, n 8 3 3 - -
Dead, %12 3.17 1.15 1.15 1.98 0.19a,b Means with different superscripts differ (P < 0.05).1 Treatments included NEGCON- negative control without tylosin; POSCON- positive control with tylosin; RAM- Ramaekers
Immune Primer.2 Finishing performance was calculated with dead animals removed from the analysis.3 Calculated from HCW divided by a common dressing percent (63%).4 Marbling Score 300 = Slight, 400 = Small, 500 = Modest, etc.5 Calculated as a percent of total animals; dead animals removed6 CYG: Calculated Yield Grade; Calculated using 2.50 + (2.50 * fat thickness, in) + (0.2 * 2.5 [KPH]) + (0.0038 * HCW, lb)- (0.32
* LM area, in2).7 Percentage of steers treated one or more times as a percent of total steers within the pen.8 Percentage of steers treated two or more times as a percent of total steers within the pen.9 Percentage of steers treated three or more times as a percent of total steers within the pen.10 Percentage of steers treated more times as a percent of total steers within the pen.11 Percentage of steers treated for respiratory as a percent of total steers treated.12 Percentage of steers dead as a percent of total steers within the pen.
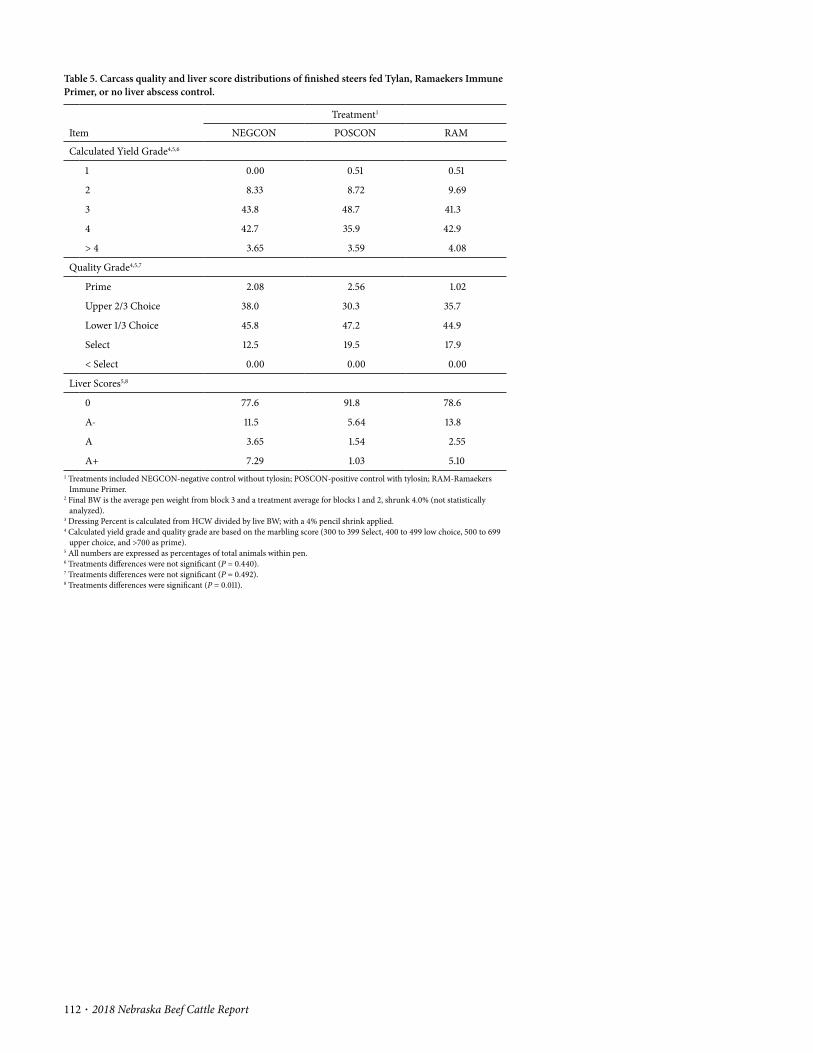
112 · 2018 Nebraska Beef Cattle Report
Table 5. Carcass quality and liver score distributions of finished steers fed Tylan, Ramaekers Immune Primer, or no liver abscess control.
Item
Treatment1
NEGCON POSCON RAM
Calculated Yield Grade4,5,6
1 0.00 0.51 0.51
2 8.33 8.72 9.69
3 43.8 48.7 41.3
4 42.7 35.9 42.9
> 4 3.65 3.59 4.08
Quality Grade4,5,7
Prime 2.08 2.56 1.02
Upper 2/3 Choice 38.0 30.3 35.7
Lower 1/3 Choice 45.8 47.2 44.9
Select 12.5 19.5 17.9
< Select 0.00 0.00 0.00
Liver Scores5,8
0 77.6 91.8 78.6
A- 11.5 5.64 13.8
A 3.65 1.54 2.55
A+ 7.29 1.03 5.101 Treatments included NEGCON- negative control without tylosin; POSCON- positive control with tylosin; RAM- Ramaekers
Immune Primer.2 Final BW is the average pen weight from block 3 and a treatment average for blocks 1 and 2, shrunk 4.0% (not statistically
analyzed).3 Dressing Percent is calculated from HCW divided by live BW; with a 4% pencil shrink applied.4 Calculated yield grade and quality grade are based on the marbling score (300 to 399 Select, 400 to 499 low choice, 500 to 699
upper choice, and >700 as prime).5 All numbers are expressed as percentages of total animals within pen.6 Treatments differences were not significant (P = 0.440).7 Treatments differences were not significant (P = 0.492).8 Treatments differences were significant (P = 0.011).
2018 Nebraska Beef Cattle Report · 113
© The Board Regents of the University of Nebraska. All rights reserved.
Heifers were limit fed at 2% BW per day for 5 consecutive days prior to a 2- d weight collection to minimize variation in gut fill. On d 0 of the trial, individual BW was recorded, carcass ultrasound images were collected, and heifers were assigned randomly to one of twelve treatments with-in three initial start date blocks. Based on treatment assigned, heifers were adminis-tered their respective implant while in the chute on d 0. Each treatment was repre-sented equally within start date block with two replications per block for a total of 24 pens (240 heifers). On d 1 of the trial, a pen weight was recorded to serve as the second d weight collection.
The common finishing ration fed to all heifers consisted of 58% dry- rolled corn, 7% corn silage, 4% wheat straw, 25% wet distillers grains plus solubles, and 6% sup-plement (DM basis). Heifers were fed once daily and provided ad libitum access to feed and water throughout the trial.
All data were analyzed using the GLIMMIX procedure of SAS (SAS Institute, Inc., Cary, N.C.). Pen was the experimental unit and start block was included as a fixed effect. The model included implant treat-ments, serial harvest, and the interaction of implant and serial harvest as fixed effects. Due to a significant difference in initial pen weights among days on feed treatment (P = 0.01), initial pen weight was considered a covariate and included in the model if significant. Orthogonal contrasts were used to test linear, quadratic, and cubic effects of serial harvest for heifers.
Results
During the trial, twelve heifers were removed from the study. Six heifers were re-moved due to death while six were removed due to poor performance, lameness, or ab-scess issues. These heifers were not included in the statistical analyses. Initial start block was not significant (P ≥ 0.24) for feedlot performance or carcass characteristics
have utilized steers whereas this trial will focus on heifers fed in confinement for slaughter. The objective of the trial was to determine the effects of implant strategy (no implant, Revalor 200 on d 1 followed by Revalor 200 on d 100 or Revalor XH on d 1) and days on feed.
Procedure
The experiment was arranged in a 3 x 4 factorial design utilizing 720 crossbred calf- fed heifers (initial BW = 612 ± 56 lb) at the Panhandle Research and Extension Center, Mitchell, NE. Heifers were assigned randomly to one of twelve treatments consisting of three implant strategies and four serial harvest groups. Implant strat-egies included a non- implanted negative control (NON), a re- implant strategy providing an initial implant containing 200 mg trenbolone acetate and 20 mg estra-diol (Revalor- 200, Merck Animal Health, Madison, NJ) followed by another implant containing 200 mg trenbolone acetate and 20 mg estradiol (Revalor- 200) at 100 days on feed (200), and a new, longer acting im-plant containing 200 mg trenbolone acetate and 20 mg estradiol (Revalor- XH) at day 0 (XH). The Revalor- XH implant contained ten pellets each with 20 mg trenbolone acetate and 2 mg estradiol, including four uncoated pellets (immediate release) and six coated pellets that begin to release ap-proximately 70 days after implantation. The four serial harvest groups were determined based on time point at which the heifers reached appropriate market condition, in which serial harvest groups would be marketed at 14 d intervals thereafter. Based on the performance and time at which mar-keting condition was achieved, serial har-vest groups consisted of heifers fed to 151 (NORMAL), 165 (PLUS14), 179 (PLUS28), and 193 (PLUS42) days on feed. The trial utilized 72, 10 head pens allowing for six replications per simple effect treatment (60 heifers per trt).
Robert G. BondurantMarshall N. StreeterGalen E. Erickson
James C. MacDonaldMatt K. Luebbe
Summary with Implications
Heifers were treated with either no implant, an initial implant of Revalor- 200 and re- implanted with Revalor- 200, or Revalor- XH and assigned to one of four serial slaughter harvests at 151, 165, 179, and 193 days on feed to determine the effects on feedlot performance and carcass character-istics. Implanting heifers increased final BW, ADG and HCW while decreasing marbling score and improving feed efficiency compared to non- implanted heifers. Increasing days on feed decreased ADG while increasing feed efficiency, HCW, fat thickness, mar-bling score, and calculated yield grade. By increasing HCW sold, implanting revenue can be maximized, assuming added risk for YG discounts.
IntroductionImplanting beef cattle improves ADG
and feed conversion, while decreasing marbling score and yield grade compared to non- implanted cattle at similar days on feed. Recently, market conditions have re-sulted in cattle finished with additional days on feed resulting in heavier carcass weights. However, as carcass weight increases, the percentage of carcasses discounted due to excess weight and increased yield grade due to fat deposition also increases. This indus-try change has encouraged the use of more aggressive implant strategies to add carcass weight while decreasing the chance of higher yield grade. Implant strategies have become more performance- based by in-creasing the dose of implant given initially, and/or by administering a long acting im-plant with increased payout of the implant. Most implant studies conducted in the past
Evaluation of Revalor- XH for beef heifers fed different days on feed

114 · 2018 Nebraska Beef Cattle Report
to PLUS42 days on feed. Longissimus area also tended (P = 0.09) to increase linearly as days on feed increased from NORMAL to PLUS42 (12.0 to 12.5 in2, respectively). Fat depth, marbling score and calculated yield grade increased linearly (P < 0.01) as days on feed increased. Marbling score was greater (P < 0.01) for non- implanted heifers (NON) compared with heifers implanted with 200 and XH.
These data suggest feeding heifers to longer days on feed decreases ADG but also increases HCW and feed efficiency as fat deposition increases. Implanting heifers reduced marbling score but did not have an impact on fat depth. These results may be due to the fatness of the heifers. While increasing days on feed increases HCW and profit potential, there is also increased risk for YG discounts as heifers deposit fat. Implanting heifers with either 200 or XH increases animal performance and efficiency
NON (P < 0.01). There was a tendency (P = 0.10) for carcass adjusted ADG to decrease linearly from 4.03 to 3.90 lb/d as days on feed increased by 42 d from NORMAL to PLUS42. Heifers implanted with 200 and XH had greater (P ≤ 0.01) carcass adjusted ADG compared to NON heifers (4.07 and 4.04 vs 3.79 lb/d, respectively). There was a tendency (P = 0.10) for days on feed to increase carcass adjusted F:G from 6.40 to 6.64 (NORMAL vs PLUS42, respectively). Heifers implanted with 200 and XH had improved (P = 0.05) carcass adjusted F:G compared with NON heifers (6.34 and 6.46 vs 6.75, respectively). As days on feed in-creased from NORMAL to PLUS42, HCW increased linearly (P < 0.01) from 775 to 865 lb. Heifer HCW was greater for 200 and XH compared to NON (831 and 828 vs 802 lb, respectively). Dressing percent tended (P = 0.06) to increase linearly from 62.3 to 64.0% as heifers were fed from NORMAL
among treatments. There were no signifi-cant (P ≤ 0.26) implant x serial slaughter interactions for feedlot performance and carcass characteristics. Simple effect means are presented in Table 1 to allow calculation of the main effect of implant or days on feed. Dry- matter intake was not different among implant treatments (P ≥ 0.11). Live final BW and ADG increased linearly (P < 0.01) as days on feed increased. Live final BW and live ADG were greater (P = 0.03 and P = 0.05, respectively) for cattle implanted with 200 and XH compared to NON. Feed efficiency calculated from live performance increased linearly (P < 0.01) with days on feed. Live F:G was improved (P = 0.02) when heifers were implanted with 200 or XH compared with NON. Car-cass adjusted final BW increased linearly (P < 0.01) as days on feed increased. Heifers implanted with 200 or XH had heavier carcass adjusted final BW compared to
Table 1. Feedlot and carcass performance for heifers implanted with no implant, Revalor 200 on d 1 and re- implanted with Revalor 200 on d 100, or Revalor XH on d 1 and fed to either 151, 165, 179, or 193 days on feed.
Treatments1
NORMAL PLUS14 PLUS28 PLUS42 P– value2
Item, NON 200 XH NON 200 XH NON 200 XH NON 200 XH SEM Inter Trt Serial
Initial BW, lb 627 610 608 610 620 605 621 623 624 627 637 630 11 0.53 0.58 0.01
DMI, lb/d 25.8 25.6 25.9 25.6 25.8 25.7 25.4 25.9 26.5 25.7 25.8 26.4 0.3 0.70 0.11 0.72
Live final BW, lb3,4 1217 1256 1278 1251 1305 1276 1273 1333 1340 1330 1367 1356 14 0.27 0.03 < 0.01
Live ADG, lb/d4 3.95 4.23 4.35 3.82 4.15 3.98 3.65 3.98 4.02 3.68 3.88 3.81 0.10 0.20 0.05 < 0.01
Live F:G4 6.53 6.05 5.95 6.70 6.22 6.46 6.96 6.51 6.59 6.98 6.65 6.93 - 0.34 0.02 < 0.01
Carcass adjusted final BW, lb4,5
1201 1243 1242 1247 1302 1264 1292 1349 1365 1349 1383 1386 13 0.32 < 0.01
< 0.01
Carcass adjusted ADG, lb/d6
3.84 4.13 4.12 3.79 4.13 3.90 3.75 4.06 4.15 3.78 3.95 3.97 0.08 0.32 < 0.01
0.18
Carcass adjusted F:G4 6.72 6.20 6.29 6.75 6.25 6.59 6.77 6.38 6.39 6.80 6.53 6.65 - 0.56 0.05 0.10
HCW, lb4 757 783 783 786 820 796 815 850 860 850 872 874 8 0.32 < 0.01
< 0.01
Dress, %6 62.2 62.2 62.6 62.7 62.8 62.9 63.9 63.8 64.1 64.0 64.1 64.1 0.4 0.62 0.98 0.29
LM area, in2 6 11.5 12.4 12.1 11.4 12.2 11.6 13.4 12.5 12.4 12.3 12.6 12.8 0.6 0.76 0.81 0.17
12th rib backfat thickness, in4
0.70 0.68 0.70 0.69 0.69 0.70 0.75 0.77 0.81 0.78 0.87 0.82 0.02 0.26 0.25 < 0.01
Marbling score4 570 523 520 531 506 527 579 549 567 588 553 580 13 0.66 < 0.01
< 0.01
Calculated YG4 3.95 3.70 3.83 4.03 3.93 4.03 3.67 4.16 4.30 4.27 4.48 4.28 0.22 0.56 0.71 0.051 NORMAL = 151 days on feed, PLUS14 = 165 days on feed, PLUS28 = 179 days on feed, PLUS42 = 193 days on feed; NON = no implant, 200 = Revalor 200 on d 1, re- implant with Revalor 200 on d
100, XH = Revalor XH implant on d 1.2 P- values for the implant x treatment interaction (Inter), implant (Trt) and days on feed (Serial).3 Final pen BW calculated with a 4% pencil shrink applied.4 Linear effect of days on feed (P < 0.05).5 Carcass adjusted final BW = HCW / (common dressing percent of 0.63).6 Linear effect of days on feed (P ≤ 0.10).7 Marbling: 500 = Small00.8 Calculated yield grade: 2.50 + (2.5 x 12th Rib Fat, in.)– (0.32 x REA, in2) + (0.0038 x HCW, lb).
2018 Nebraska Beef Cattle Report · 115
Jim MacDonald, associate professor
Galen Erickson, professor, University of Nebraska– Lincoln, Department of Animal Science
Matt Luebbe, associate professor, Panhandle Research and Extension Center, Scottsbluff, Neb
while also increasing HCW and thus HCW revenue. Long- term implant strategies coupled with increased days on feed can substantially increase HCW and revenue assuming YG discounts can be overcome.
Robert Bondurant, research technician
Marshall Streeter, Senior Technical Services manger, Merck Animal Health
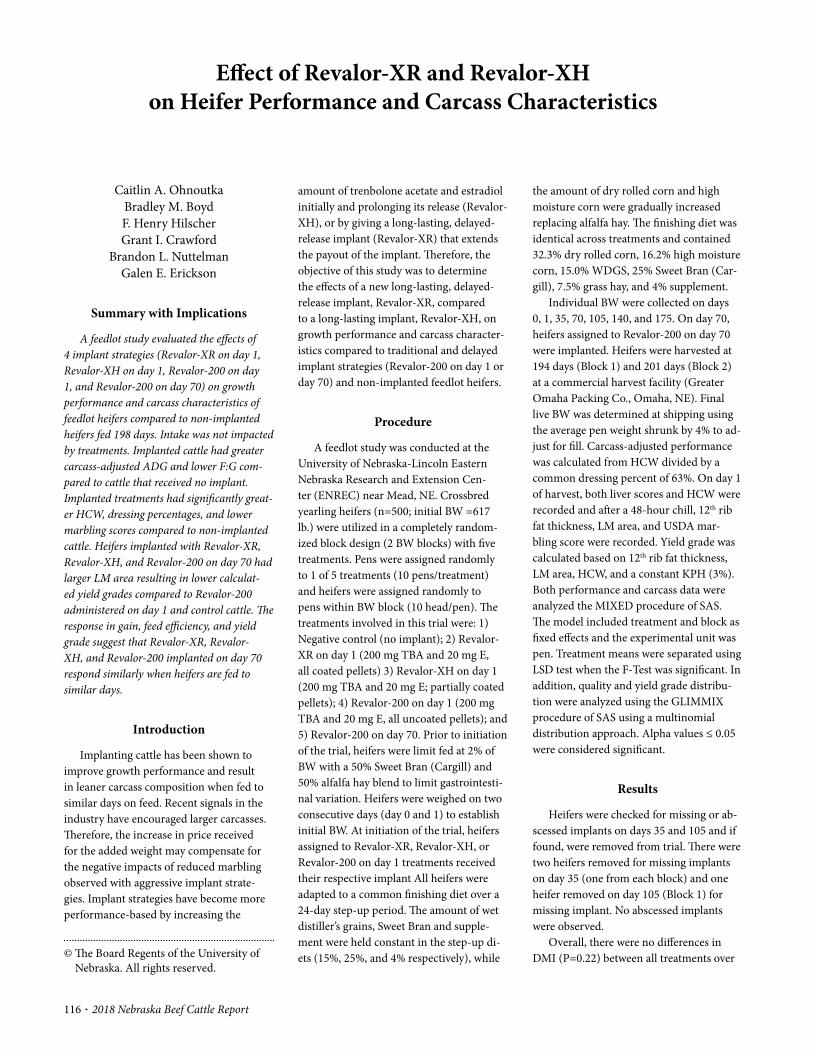
116 · 2018 Nebraska Beef Cattle Report
© The Board Regents of the University of Nebraska. All rights reserved.
the amount of dry rolled corn and high moisture corn were gradually increased replacing alfalfa hay. The finishing diet was identical across treatments and contained 32.3% dry rolled corn, 16.2% high moisture corn, 15.0% WDGS, 25% Sweet Bran (Car-gill), 7.5% grass hay, and 4% supplement.
Individual BW were collected on days 0, 1, 35, 70, 105, 140, and 175. On day 70, heifers assigned to Revalor- 200 on day 70 were implanted. Heifers were harvested at 194 days (Block 1) and 201 days (Block 2) at a commercial harvest facility (Greater Omaha Packing Co., Omaha, NE). Final live BW was determined at shipping using the average pen weight shrunk by 4% to ad-just for fill. Carcass- adjusted performance was calculated from HCW divided by a common dressing percent of 63%. On day 1 of harvest, both liver scores and HCW were recorded and after a 48- hour chill, 12th rib fat thickness, LM area, and USDA mar-bling score were recorded. Yield grade was calculated based on 12th rib fat thickness, LM area, HCW, and a constant KPH (3%). Both performance and carcass data were analyzed the MIXED procedure of SAS. The model included treatment and block as fixed effects and the experimental unit was pen. Treatment means were separated using LSD test when the F- Test was significant. In addition, quality and yield grade distribu-tion were analyzed using the GLIMMIX procedure of SAS using a multinomial distribution approach. Alpha values ≤ 0.05 were considered significant.
Results
Heifers were checked for missing or ab-scessed implants on days 35 and 105 and if found, were removed from trial. There were two heifers removed for missing implants on day 35 (one from each block) and one heifer removed on day 105 (Block 1) for missing implant. No abscessed implants were observed.
Overall, there were no differences in DMI (P=0.22) between all treatments over
Caitlin A. OhnoutkaBradley M. BoydF. Henry HilscherGrant I. Crawford
Brandon L. NuttelmanGalen E. Erickson
Summary with Implications
A feedlot study evaluated the effects of 4 implant strategies (Revalor- XR on day 1, Revalor- XH on day 1, Revalor- 200 on day 1, and Revalor- 200 on day 70) on growth performance and carcass characteristics of feedlot heifers compared to non- implanted heifers fed 198 days. Intake was not impacted by treatments. Implanted cattle had greater carcass- adjusted ADG and lower F:G com-pared to cattle that received no implant. Implanted treatments had significantly great-er HCW, dressing percentages, and lower marbling scores compared to non- implanted cattle. Heifers implanted with Revalor- XR, Revalor- XH, and Revalor- 200 on day 70 had larger LM area resulting in lower calculat-ed yield grades compared to Revalor- 200 administered on day 1 and control cattle. The response in gain, feed efficiency, and yield grade suggest that Revalor- XR, Revalor- XH, and Revalor- 200 implanted on day 70 respond similarly when heifers are fed to similar days.
Introduction
Implanting cattle has been shown to improve growth performance and result in leaner carcass composition when fed to similar days on feed. Recent signals in the industry have encouraged larger carcasses. Therefore, the increase in price received for the added weight may compensate for the negative impacts of reduced marbling observed with aggressive implant strate-gies. Implant strategies have become more performance- based by increasing the
Effect of Revalor- XR and Revalor- XH on Heifer Performance and Carcass Characteristics
amount of trenbolone acetate and estradiol initially and prolonging its release (Revalor- XH), or by giving a long- lasting, delayed- release implant (Revalor- XR) that extends the payout of the implant. Therefore, the objective of this study was to determine the effects of a new long- lasting, delayed- release implant, Revalor- XR, compared to a long- lasting implant, Revalor- XH, on growth performance and carcass character-istics compared to traditional and delayed implant strategies (Revalor- 200 on day 1 or day 70) and non- implanted feedlot heifers.
Procedure
A feedlot study was conducted at the University of Nebraska- Lincoln Eastern Nebraska Research and Extension Cen-ter (ENREC) near Mead, NE. Crossbred yearling heifers (n=500; initial BW =617 lb.) were utilized in a completely random-ized block design (2 BW blocks) with five treatments. Pens were assigned randomly to 1 of 5 treatments (10 pens/treatment) and heifers were assigned randomly to pens within BW block (10 head/pen). The treatments involved in this trial were: 1) Negative control (no implant); 2) Revalor- XR on day 1 (200 mg TBA and 20 mg E, all coated pellets) 3) Revalor- XH on day 1 (200 mg TBA and 20 mg E; partially coated pellets); 4) Revalor- 200 on day 1 (200 mg TBA and 20 mg E, all uncoated pellets); and 5) Revalor- 200 on day 70. Prior to initiation of the trial, heifers were limit fed at 2% of BW with a 50% Sweet Bran (Cargill) and 50% alfalfa hay blend to limit gastrointesti-nal variation. Heifers were weighed on two consecutive days (day 0 and 1) to establish initial BW. At initiation of the trial, heifers assigned to Revalor- XR, Revalor- XH, or Revalor- 200 on day 1 treatments received their respective implant All heifers were adapted to a common finishing diet over a 24- day step- up period. The amount of wet distiller’s grains, Sweet Bran and supple-ment were held constant in the step- up di-ets (15%, 25%, and 4% respectively), while
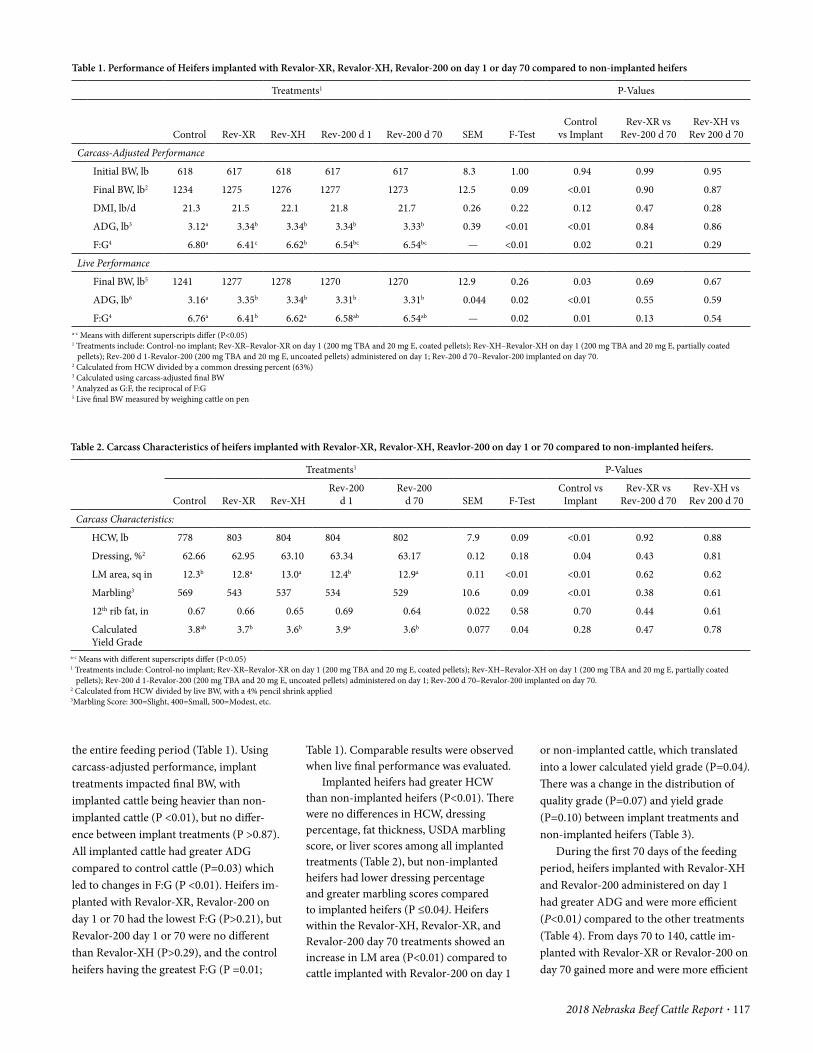
2018 Nebraska Beef Cattle Report · 117
or non- implanted cattle, which translated into a lower calculated yield grade (P=0.04). There was a change in the distribution of quality grade (P=0.07) and yield grade (P=0.10) between implant treatments and non- implanted heifers (Table 3).
During the first 70 days of the feeding period, heifers implanted with Revalor- XH and Revalor- 200 administered on day 1 had greater ADG and were more efficient (P<0.01) compared to the other treatments (Table 4). From days 70 to 140, cattle im-planted with Revalor- XR or Revalor- 200 on day 70 gained more and were more efficient
Table 1). Comparable results were observed when live final performance was evaluated.
Implanted heifers had greater HCW than non- implanted heifers (P<0.01). There were no differences in HCW, dressing percentage, fat thickness, USDA marbling score, or liver scores among all implanted treatments (Table 2), but non- implanted heifers had lower dressing percentage and greater marbling scores compared to implanted heifers (P ≤0.04). Heifers within the Revalor- XH, Revalor- XR, and Revalor- 200 day 70 treatments showed an increase in LM area (P<0.01) compared to cattle implanted with Revalor- 200 on day 1
the entire feeding period (Table 1). Using carcass- adjusted performance, implant treatments impacted final BW, with implanted cattle being heavier than non- implanted cattle (P <0.01), but no differ-ence between implant treatments (P >0.87). All implanted cattle had greater ADG compared to control cattle (P=0.03) which led to changes in F:G (P <0.01). Heifers im-planted with Revalor- XR, Revalor- 200 on day 1 or 70 had the lowest F:G (P>0.21), but Revalor- 200 day 1 or 70 were no different than Revalor- XH (P>0.29), and the control heifers having the greatest F:G (P =0.01;
Table 1. Performance of Heifers implanted with Revalor- XR, Revalor- XH, Revalor- 200 on day 1 or day 70 compared to non- implanted heifers
Treatments1 P- Values
Control Rev- XR Rev- XH Rev- 200 d 1 Rev- 200 d 70 SEM F- TestControl
vs ImplantRev- XR vs
Rev- 200 d 70Rev- XH vs
Rev 200 d 70
Carcass- Adjusted Performance
Initial BW, lb 618 617 618 617 617 8.3 1.00 0.94 0.99 0.95
Final BW, lb2 1234 1275 1276 1277 1273 12.5 0.09 <0.01 0.90 0.87
DMI, lb/d 21.3 21.5 22.1 21.8 21.7 0.26 0.22 0.12 0.47 0.28
ADG, lb3 3.12a 3.34b 3.34b 3.34b 3.33b 0.39 <0.01 <0.01 0.84 0.86
F:G4 6.80a 6.41c 6.62b 6.54bc 6.54bc — <0.01 0.02 0.21 0.29
Live Performance
Final BW, lb5 1241 1277 1278 1270 1270 12.9 0.26 0.03 0.69 0.67
ADG, lb6 3.16a 3.35b 3.34b 3.31b 3.31b 0.044 0.02 <0.01 0.55 0.59
F:G4 6.76a 6.41b 6.62a 6.58ab 6.54ab — 0.02 0.01 0.13 0.54a- c Means with different superscripts differ (P<0.05)1 Treatments include: Control- no implant; Rev- XR– Revalor- XR on day 1 (200 mg TBA and 20 mg E, coated pellets); Rev- XH– Revalor- XH on day 1 (200 mg TBA and 20 mg E, partially coated
pellets); Rev- 200 d 1- Revalor- 200 (200 mg TBA and 20 mg E, uncoated pellets) administered on day 1; Rev- 200 d 70– Revalor- 200 implanted on day 70.2 Calculated from HCW divided by a common dressing percent (63%)3 Calculated using carcass- adjusted final BW3 Analyzed as G:F, the reciprocal of F:G5 Live final BW measured by weighing cattle on pen
Table 2. Carcass Characteristics of heifers implanted with Revalor- XR, Revalor- XH, Reavlor- 200 on day 1 or 70 compared to non- implanted heifers.
Treatments1 P- Values
Control Rev- XR Rev- XHRev- 200
d 1Rev- 200
d 70 SEM F- TestControl vs
ImplantRev- XR vs
Rev- 200 d 70Rev- XH vs
Rev 200 d 70
Carcass Characteristics:
HCW, lb 778 803 804 804 802 7.9 0.09 <0.01 0.92 0.88
Dressing, %2 62.66 62.95 63.10 63.34 63.17 0.12 0.18 0.04 0.43 0.81
LM area, sq in 12.3b 12.8a 13.0a 12.4b 12.9a 0.11 <0.01 <0.01 0.62 0.62
Marbling3 569 543 537 534 529 10.6 0.09 <0.01 0.38 0.61
12th rib fat, in 0.67 0.66 0.65 0.69 0.64 0.022 0.58 0.70 0.44 0.61
Calculated Yield Grade
3.8ab 3.7b 3.6b 3.9a 3.6b 0.077 0.04 0.28 0.47 0.78
a- c Means with different superscripts differ (P<0.05)1 Treatments include: Control- no implant; Rev- XR– Revalor- XR on day 1 (200 mg TBA and 20 mg E, coated pellets); Rev- XH– Revalor- XH on day 1 (200 mg TBA and 20 mg E, partially coated
pellets); Rev- 200 d 1- Revalor- 200 (200 mg TBA and 20 mg E, uncoated pellets) administered on day 1; Rev- 200 d 70– Revalor- 200 implanted on day 70.2 Calculated from HCW divided by live BW, with a 4% pencil shrink applied3Marbling Score: 300=Slight, 400=Small, 500=Modest, etc.
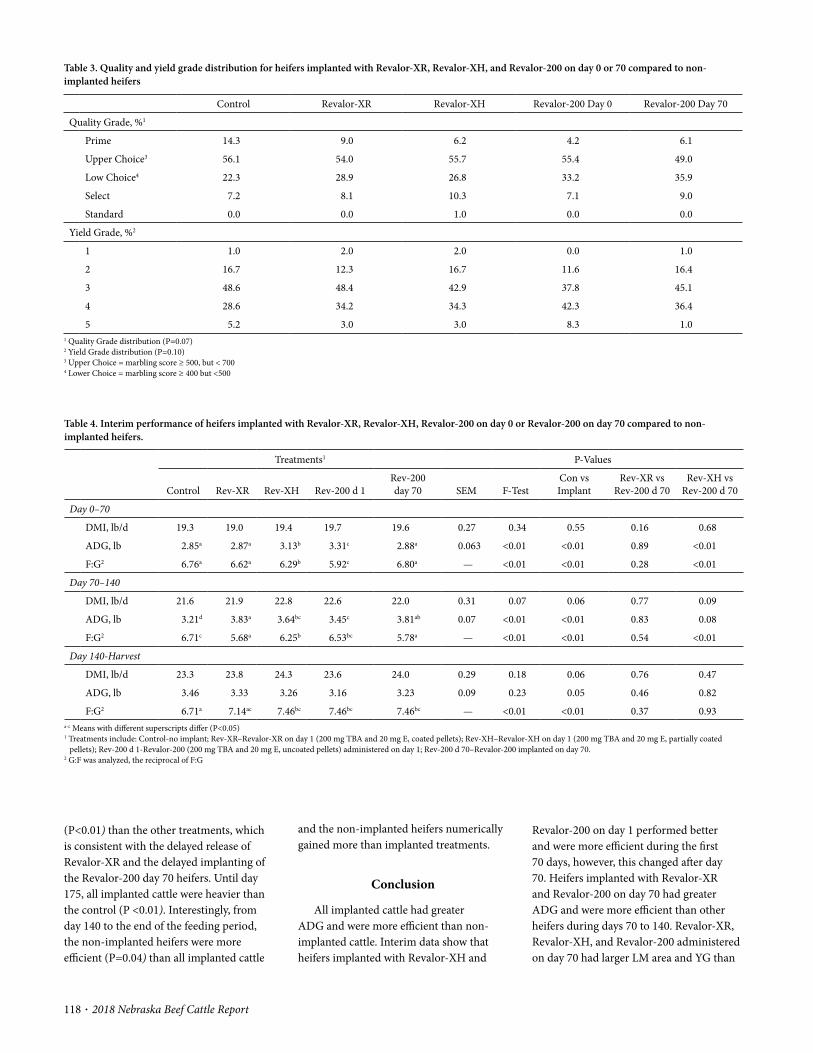
118 · 2018 Nebraska Beef Cattle Report
(P<0.01) than the other treatments, which is consistent with the delayed release of Revalor- XR and the delayed implanting of the Revalor- 200 day 70 heifers. Until day 175, all implanted cattle were heavier than the control (P <0.01). Interestingly, from day 140 to the end of the feeding period, the non- implanted heifers were more efficient (P=0.04) than all implanted cattle
Table 3. Quality and yield grade distribution for heifers implanted with Revalor- XR, Revalor- XH, and Revalor- 200 on day 0 or 70 compared to non- implanted heifers
Control Revalor- XR Revalor- XH Revalor- 200 Day 0 Revalor- 200 Day 70
Quality Grade, %1
Prime 14.3 9.0 6.2 4.2 6.1
Upper Choice3 56.1 54.0 55.7 55.4 49.0
Low Choice4 22.3 28.9 26.8 33.2 35.9
Select 7.2 8.1 10.3 7.1 9.0
Standard 0.0 0.0 1.0 0.0 0.0
Yield Grade, %2
1 1.0 2.0 2.0 0.0 1.0
2 16.7 12.3 16.7 11.6 16.4
3 48.6 48.4 42.9 37.8 45.1
4 28.6 34.2 34.3 42.3 36.4
5 5.2 3.0 3.0 8.3 1.01 Quality Grade distribution (P=0.07)2 Yield Grade distribution (P=0.10)3 Upper Choice = marbling score ≥ 500, but < 7004 Lower Choice = marbling score ≥ 400 but <500
Table 4. Interim performance of heifers implanted with Revalor- XR, Revalor- XH, Revalor- 200 on day 0 or Revalor- 200 on day 70 compared to non- implanted heifers.
Treatments1 P- Values
Control Rev- XR Rev- XH Rev- 200 d 1Rev- 200 day 70 SEM F- Test
Con vs Implant
Rev- XR vs Rev- 200 d 70
Rev- XH vs Rev- 200 d 70
Day 0– 70
DMI, lb/d 19.3 19.0 19.4 19.7 19.6 0.27 0.34 0.55 0.16 0.68
ADG, lb 2.85a 2.87a 3.13b 3.31c 2.88a 0.063 <0.01 <0.01 0.89 <0.01
F:G2 6.76a 6.62a 6.29b 5.92c 6.80a — <0.01 <0.01 0.28 <0.01
Day 70– 140
DMI, lb/d 21.6 21.9 22.8 22.6 22.0 0.31 0.07 0.06 0.77 0.09
ADG, lb 3.21d 3.83a 3.64bc 3.45c 3.81ab 0.07 <0.01 <0.01 0.83 0.08
F:G2 6.71c 5.68a 6.25b 6.53bc 5.78a — <0.01 <0.01 0.54 <0.01
Day 140- Harvest
DMI, lb/d 23.3 23.8 24.3 23.6 24.0 0.29 0.18 0.06 0.76 0.47
ADG, lb 3.46 3.33 3.26 3.16 3.23 0.09 0.23 0.05 0.46 0.82
F:G2 6.71a 7.14ac 7.46bc 7.46bc 7.46bc — <0.01 <0.01 0.37 0.93a- c Means with different superscripts differ (P<0.05)1 Treatments include: Control- no implant; Rev- XR– Revalor- XR on day 1 (200 mg TBA and 20 mg E, coated pellets); Rev- XH– Revalor- XH on day 1 (200 mg TBA and 20 mg E, partially coated
pellets); Rev- 200 d 1- Revalor- 200 (200 mg TBA and 20 mg E, uncoated pellets) administered on day 1; Rev- 200 d 70– Revalor- 200 implanted on day 70.2 G:F was analyzed, the reciprocal of F:G
and the non- implanted heifers numerically gained more than implanted treatments.
Conclusion
All implanted cattle had greater ADG and were more efficient than non- implanted cattle. Interim data show that heifers implanted with Revalor- XH and
Revalor- 200 on day 1 performed better and were more efficient during the first 70 days, however, this changed after day 70. Heifers implanted with Revalor- XR and Revalor- 200 on day 70 had greater ADG and were more efficient than other heifers during days 70 to 140. Revalor- XR, Revalor- XH, and Revalor- 200 administered on day 70 had larger LM area and YG than
2018 Nebraska Beef Cattle Report · 119
Caitlin A. Ohnoutka, graduate student
Bradley M. Boyd, research technician
F. Henry Hilscher, feedlot manager
Grant I. Crawford, Merck Animal Health
Brandon L. Nuttelman, Merck Animal Health
Galen E. Erickson, Professional Animal Science, Lincoln
Revalor- 200 on day 1 and control cattle, but not significantly different marbling scores among implant treatments, showing that the more aggressive and/or delayed implant strategies improved yield grade without having negative effects on marbling com-pared to cattle implanted once on arrival.
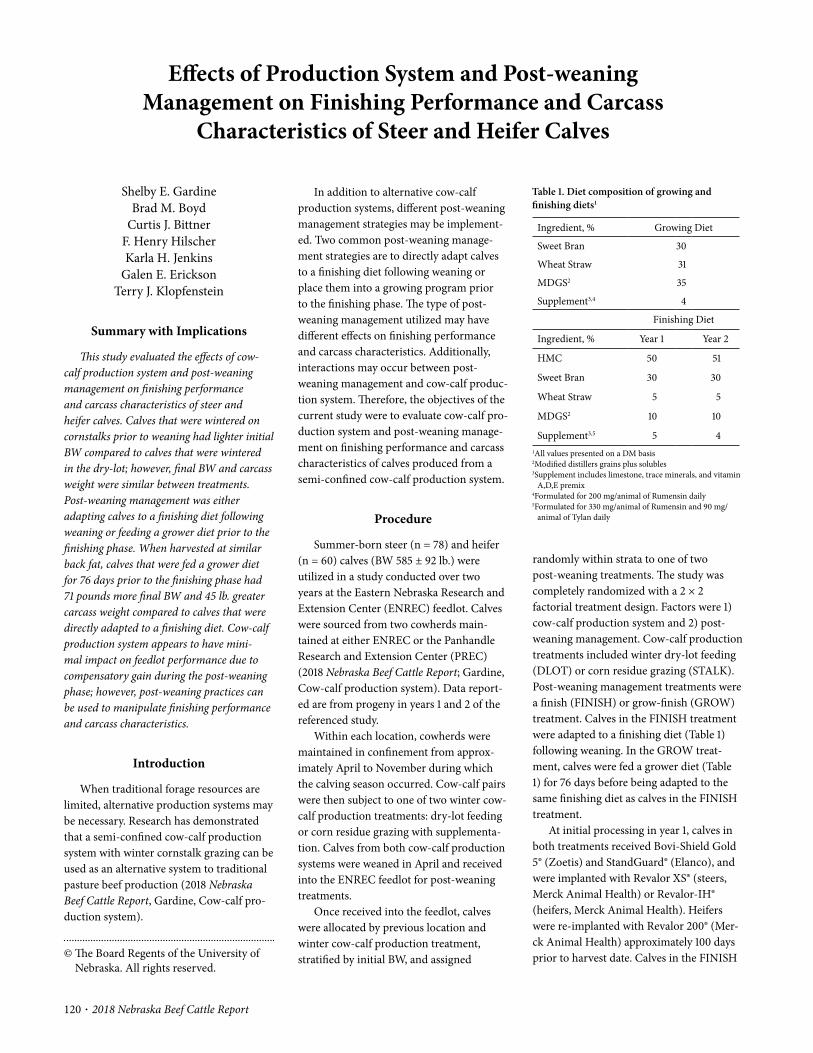
120 · 2018 Nebraska Beef Cattle Report
© The Board Regents of the University of Nebraska. All rights reserved.
randomly within strata to one of two post- weaning treatments. The study was completely randomized with a 2 × 2 factorial treatment design. Factors were 1) cow- calf production system and 2) post- weaning management. Cow- calf production treatments included winter dry- lot feeding (DLOT) or corn residue grazing (STALK). Post- weaning management treatments were a finish (FINISH) or grow- finish (GROW) treatment. Calves in the FINISH treatment were adapted to a finishing diet (Table 1) following weaning. In the GROW treat-ment, calves were fed a grower diet (Table 1) for 76 days before being adapted to the same finishing diet as calves in the FINISH treatment.
At initial processing in year 1, calves in both treatments received Bovi- Shield Gold 5® (Zoetis) and StandGuard® (Elanco), and were implanted with Revalor XS® (steers, Merck Animal Health) or Revalor- IH® (heifers, Merck Animal Health). Heifers were re- implanted with Revalor 200® (Mer-ck Animal Health) approximately 100 days prior to harvest date. Calves in the FINISH
In addition to alternative cow- calf production systems, different post- weaning management strategies may be implement-ed. Two common post- weaning manage-ment strategies are to directly adapt calves to a finishing diet following weaning or place them into a growing program prior to the finishing phase. The type of post- weaning management utilized may have different effects on finishing performance and carcass characteristics. Additionally, interactions may occur between post- weaning management and cow- calf produc-tion system. Therefore, the objectives of the current study were to evaluate cow- calf pro-duction system and post- weaning manage-ment on finishing performance and carcass characteristics of calves produced from a semi- confined cow- calf production system.
Procedure
Summer- born steer (n = 78) and heifer (n = 60) calves (BW 585 ± 92 lb.) were utilized in a study conducted over two years at the Eastern Nebraska Research and Extension Center (ENREC) feedlot. Calves were sourced from two cowherds main-tained at either ENREC or the Panhandle Research and Extension Center (PREC) (2018 Nebraska Beef Cattle Report; Gardine, Cow- calf production system). Data report-ed are from progeny in years 1 and 2 of the referenced study.
Within each location, cowherds were maintained in confinement from approx-imately April to November during which the calving season occurred. Cow- calf pairs were then subject to one of two winter cow- calf production treatments: dry- lot feeding or corn residue grazing with supplementa-tion. Calves from both cow- calf production systems were weaned in April and received into the ENREC feedlot for post- weaning treatments.
Once received into the feedlot, calves were allocated by previous location and winter cow- calf production treatment, stratified by initial BW, and assigned
Shelby E. GardineBrad M. Boyd
Curtis J. BittnerF. Henry HilscherKarla H. Jenkins
Galen E. EricksonTerry J. Klopfenstein
Summary with Implications
This study evaluated the effects of cow- calf production system and post- weaning management on finishing performance and carcass characteristics of steer and heifer calves. Calves that were wintered on cornstalks prior to weaning had lighter initial BW compared to calves that were wintered in the dry- lot; however, final BW and carcass weight were similar between treatments. Post- weaning management was either adapting calves to a finishing diet following weaning or feeding a grower diet prior to the finishing phase. When harvested at similar back fat, calves that were fed a grower diet for 76 days prior to the finishing phase had 71 pounds more final BW and 45 lb. greater carcass weight compared to calves that were directly adapted to a finishing diet. Cow- calf production system appears to have mini-mal impact on feedlot performance due to compensatory gain during the post- weaning phase; however, post- weaning practices can be used to manipulate finishing performance and carcass characteristics.
Introduction
When traditional forage resources are limited, alternative production systems may be necessary. Research has demonstrated that a semi- confined cow- calf production system with winter cornstalk grazing can be used as an alternative system to traditional pasture beef production (2018 Nebraska Beef Cattle Report, Gardine, Cow- calf pro-duction system).
Effects of Production System and Post- weaning Management on Finishing Performance and Carcass
Characteristics of Steer and Heifer Calves
Table 1. Diet composition of growing and finishing diets1
Ingredient, % Growing Diet
Sweet Bran 30
Wheat Straw 31
MDGS2 35
Supplement3,4 4
Finishing Diet
Ingredient, % Year 1 Year 2
HMC 50 51
Sweet Bran 30 30
Wheat Straw 5 5
MDGS2 10 10
Supplement3,5 5 41All values presented on a DM basis2Modified distillers grains plus solubles3Supplement includes limestone, trace minerals, and vitamin
A,D,E premix4Formulated for 200 mg/animal of Rumensin daily5Formulated for 330 mg/animal of Rumensin and 90 mg/
animal of Tylan daily
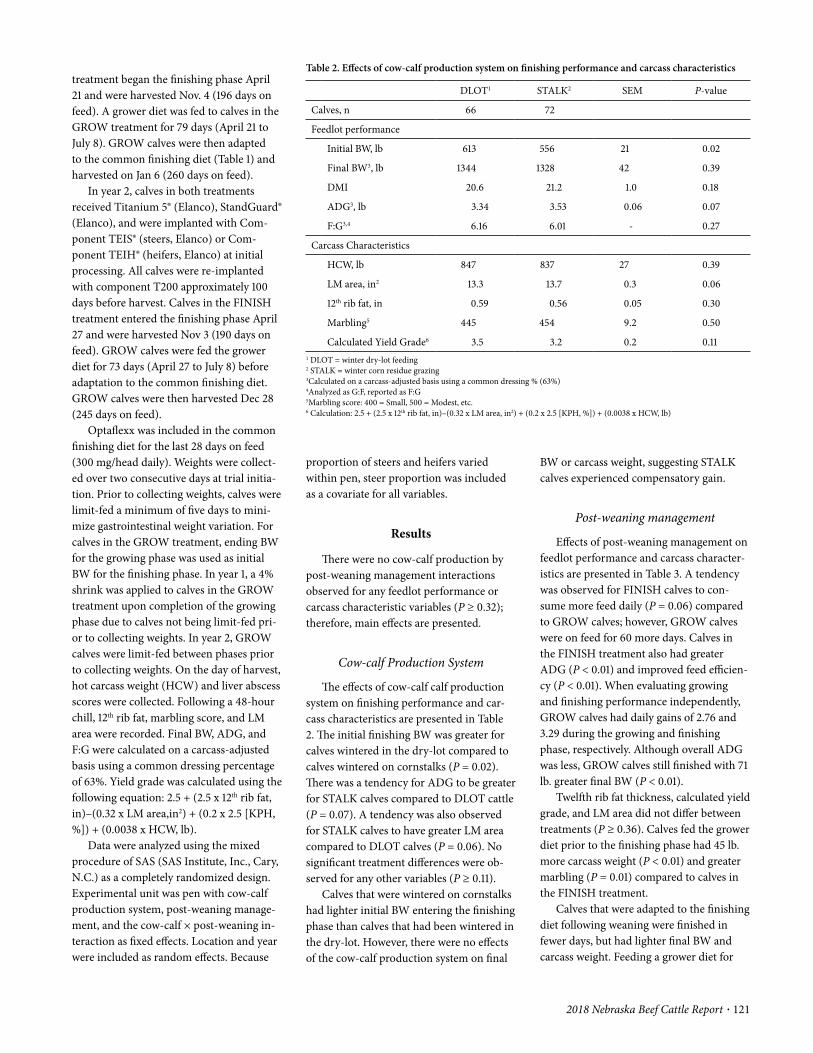
2018 Nebraska Beef Cattle Report · 121
BW or carcass weight, suggesting STALK calves experienced compensatory gain.
Post- weaning management
Effects of post- weaning management on feedlot performance and carcass character-istics are presented in Table 3. A tendency was observed for FINISH calves to con-sume more feed daily (P = 0.06) compared to GROW calves; however, GROW calves were on feed for 60 more days. Calves in the FINISH treatment also had greater ADG (P < 0.01) and improved feed efficien-cy (P < 0.01). When evaluating growing and finishing performance independently, GROW calves had daily gains of 2.76 and 3.29 during the growing and finishing phase, respectively. Although overall ADG was less, GROW calves still finished with 71 lb. greater final BW (P < 0.01).
Twelfth rib fat thickness, calculated yield grade, and LM area did not differ between treatments (P ≥ 0.36). Calves fed the grower diet prior to the finishing phase had 45 lb. more carcass weight (P < 0.01) and greater marbling (P = 0.01) compared to calves in the FINISH treatment.
Calves that were adapted to the finishing diet following weaning were finished in fewer days, but had lighter final BW and carcass weight. Feeding a grower diet for
proportion of steers and heifers varied within pen, steer proportion was included as a covariate for all variables.
Results
There were no cow- calf production by post- weaning management interactions observed for any feedlot performance or carcass characteristic variables (P ≥ 0.32); therefore, main effects are presented.
Cow- calf Production System
The effects of cow- calf calf production system on finishing performance and car-cass characteristics are presented in Table 2. The initial finishing BW was greater for calves wintered in the dry- lot compared to calves wintered on cornstalks (P = 0.02). There was a tendency for ADG to be greater for STALK calves compared to DLOT cattle (P = 0.07). A tendency was also observed for STALK calves to have greater LM area compared to DLOT calves (P = 0.06). No significant treatment differences were ob-served for any other variables (P ≥ 0.11).
Calves that were wintered on cornstalks had lighter initial BW entering the finishing phase than calves that had been wintered in the dry- lot. However, there were no effects of the cow- calf production system on final
treatment began the finishing phase April 21 and were harvested Nov. 4 (196 days on feed). A grower diet was fed to calves in the GROW treatment for 79 days (April 21 to July 8). GROW calves were then adapted to the common finishing diet (Table 1) and harvested on Jan 6 (260 days on feed).
In year 2, calves in both treatments received Titanium 5® (Elanco), StandGuard® (Elanco), and were implanted with Com-ponent TEIS® (steers, Elanco) or Com-ponent TEIH® (heifers, Elanco) at initial processing. All calves were re- implanted with component T200 approximately 100 days before harvest. Calves in the FINISH treatment entered the finishing phase April 27 and were harvested Nov 3 (190 days on feed). GROW calves were fed the grower diet for 73 days (April 27 to July 8) before adaptation to the common finishing diet. GROW calves were then harvested Dec 28 (245 days on feed).
Optaflexx was included in the common finishing diet for the last 28 days on feed (300 mg/head daily). Weights were collect-ed over two consecutive days at trial initia-tion. Prior to collecting weights, calves were limit- fed a minimum of five days to mini-mize gastrointestinal weight variation. For calves in the GROW treatment, ending BW for the growing phase was used as initial BW for the finishing phase. In year 1, a 4% shrink was applied to calves in the GROW treatment upon completion of the growing phase due to calves not being limit- fed pri-or to collecting weights. In year 2, GROW calves were limit- fed between phases prior to collecting weights. On the day of harvest, hot carcass weight (HCW) and liver abscess scores were collected. Following a 48- hour chill, 12th rib fat, marbling score, and LM area were recorded. Final BW, ADG, and F:G were calculated on a carcass- adjusted basis using a common dressing percentage of 63%. Yield grade was calculated using the following equation: 2.5 + (2.5 x 12th rib fat, in)– (0.32 x LM area,in2) + (0.2 x 2.5 [KPH, %]) + (0.0038 x HCW, lb).
Data were analyzed using the mixed procedure of SAS (SAS Institute, Inc., Cary, N.C.) as a completely randomized design. Experimental unit was pen with cow- calf production system, post- weaning manage-ment, and the cow- calf × post- weaning in-teraction as fixed effects. Location and year were included as random effects. Because
Table 2. Effects of cow- calf production system on finishing performance and carcass characteristics
DLOT1 STALK2 SEM P- value
Calves, n 66 72
Feedlot performance
Initial BW, lb 613 556 21 0.02
Final BW3, lb 1344 1328 42 0.39
DMI 20.6 21.2 1.0 0.18
ADG3, lb 3.34 3.53 0.06 0.07
F:G3,4 6.16 6.01 - 0.27
Carcass Characteristics
HCW, lb 847 837 27 0.39
LM area, in2 13.3 13.7 0.3 0.06
12th rib fat, in 0.59 0.56 0.05 0.30
Marbling5 445 454 9.2 0.50
Calculated Yield Grade6 3.5 3.2 0.2 0.111 DLOT = winter dry- lot feeding2 STALK = winter corn residue grazing3Calculated on a carcass- adjusted basis using a common dressing % (63%)4Analyzed as G:F, reported as F:G5Marbling score: 400 = Small, 500 = Modest, etc.6 Calculation: 2.5 + (2.5 x 12th rib fat, in)– (0.32 x LM area, in2) + (0.2 x 2.5 [KPH, %]) + (0.0038 x HCW, lb)
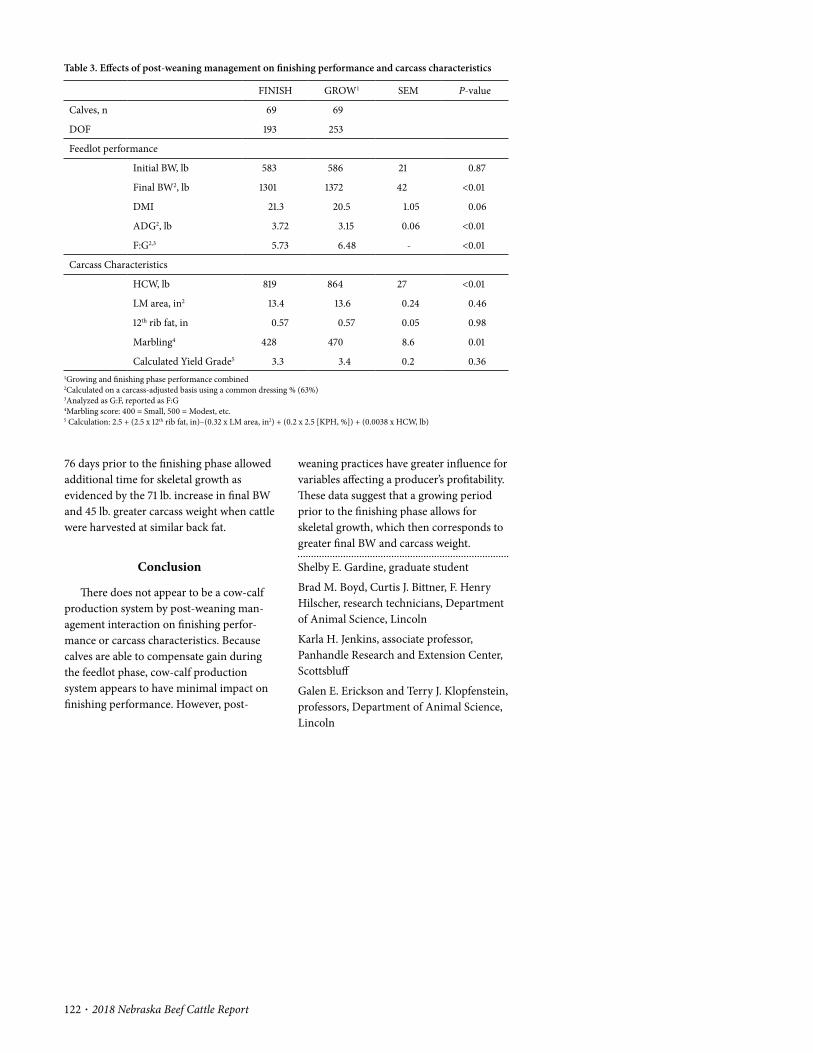
122 · 2018 Nebraska Beef Cattle Report
76 days prior to the finishing phase allowed additional time for skeletal growth as evidenced by the 71 lb. increase in final BW and 45 lb. greater carcass weight when cattle were harvested at similar back fat.
Conclusion
There does not appear to be a cow- calf production system by post- weaning man-agement interaction on finishing perfor-mance or carcass characteristics. Because calves are able to compensate gain during the feedlot phase, cow- calf production system appears to have minimal impact on finishing performance. However, post-
Table 3. Effects of post- weaning management on finishing performance and carcass characteristics
FINISH GROW1 SEM P- value
Calves, n 69 69
DOF 193 253
Feedlot performance
Initial BW, lb 583 586 21 0.87
Final BW2, lb 1301 1372 42 <0.01
DMI 21.3 20.5 1.05 0.06
ADG2, lb 3.72 3.15 0.06 <0.01
F:G2,3 5.73 6.48 - <0.01
Carcass Characteristics
HCW, lb 819 864 27 <0.01
LM area, in2 13.4 13.6 0.24 0.46
12th rib fat, in 0.57 0.57 0.05 0.98
Marbling4 428 470 8.6 0.01
Calculated Yield Grade5 3.3 3.4 0.2 0.361Growing and finishing phase performance combined2Calculated on a carcass- adjusted basis using a common dressing % (63%)3Analyzed as G:F, reported as F:G4Marbling score: 400 = Small, 500 = Modest, etc.5 Calculation: 2.5 + (2.5 x 12th rib fat, in)– (0.32 x LM area, in2) + (0.2 x 2.5 [KPH, %]) + (0.0038 x HCW, lb)
weaning practices have greater influence for variables affecting a producer’s profitability. These data suggest that a growing period prior to the finishing phase allows for skeletal growth, which then corresponds to greater final BW and carcass weight.
Shelby E. Gardine, graduate student
Brad M. Boyd, Curtis J. Bittner, F. Henry Hilscher, research technicians, Department of Animal Science, Lincoln
Karla H. Jenkins, associate professor, Panhandle Research and Extension Center, Scottsbluff
Galen E. Erickson and Terry J. Klopfenstein, professors, Department of Animal Science, Lincoln
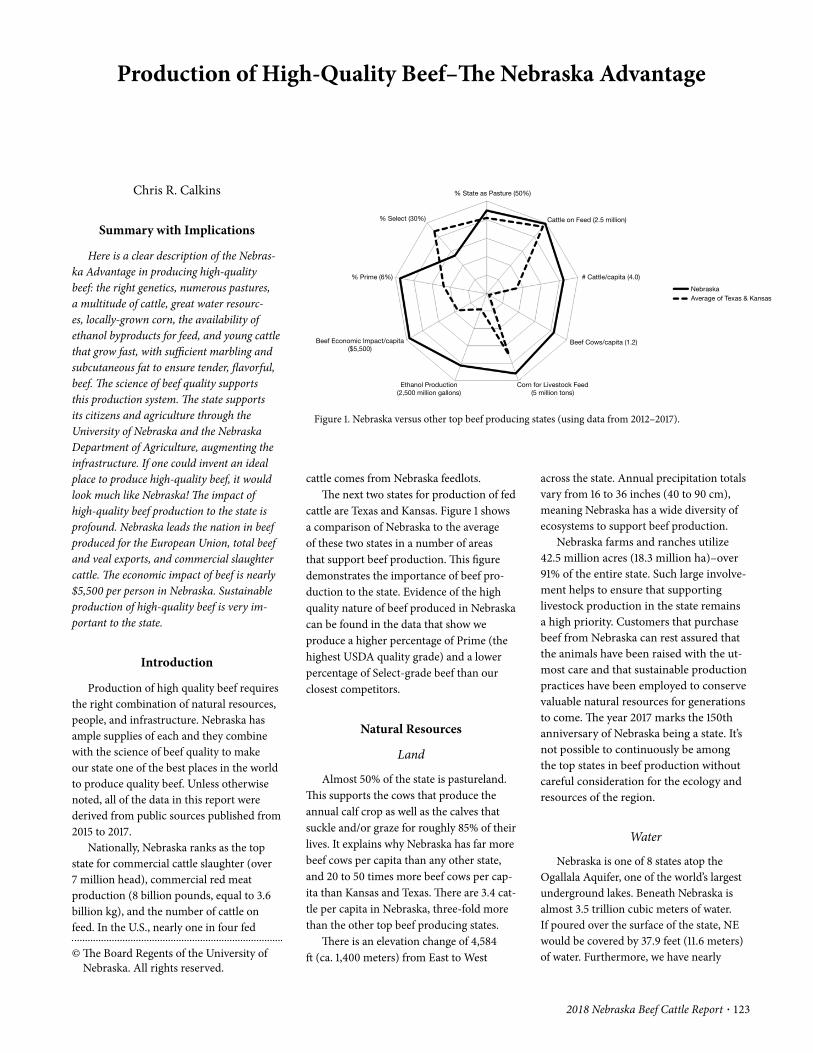
2018 Nebraska Beef Cattle Report · 123
© The Board Regents of the University of Nebraska. All rights reserved.
across the state. Annual precipitation totals vary from 16 to 36 inches (40 to 90 cm), meaning Nebraska has a wide diversity of ecosystems to support beef production.
Nebraska farms and ranches utilize 42.5 million acres (18.3 million ha)– over 91% of the entire state. Such large involve-ment helps to ensure that supporting livestock production in the state remains a high priority. Customers that purchase beef from Nebraska can rest assured that the animals have been raised with the ut-most care and that sustainable production practices have been employed to conserve valuable natural resources for generations to come. The year 2017 marks the 150th anniversary of Nebraska being a state. It’s not possible to continuously be among the top states in beef production without careful consideration for the ecology and resources of the region.
Water
Nebraska is one of 8 states atop the Ogallala Aquifer, one of the world’s largest underground lakes. Beneath Nebraska is almost 3.5 trillion cubic meters of water. If poured over the surface of the state, NE would be covered by 37.9 feet (11.6 meters) of water. Furthermore, we have nearly
Production of High- Quality Beef– The Nebraska Advantage
Chris R. Calkins
Summary with Implications
Here is a clear description of the Nebras-ka Advantage in producing high- quality beef: the right genetics, numerous pastures, a multitude of cattle, great water resourc-es, locally- grown corn, the availability of ethanol byproducts for feed, and young cattle that grow fast, with sufficient marbling and subcutaneous fat to ensure tender, flavorful, beef. The science of beef quality supports this production system. The state supports its citizens and agriculture through the University of Nebraska and the Nebraska Department of Agriculture, augmenting the infrastructure. If one could invent an ideal place to produce high- quality beef, it would look much like Nebraska! The impact of high- quality beef production to the state is profound. Nebraska leads the nation in beef produced for the European Union, total beef and veal exports, and commercial slaughter cattle. The economic impact of beef is nearly $5,500 per person in Nebraska. Sustainable production of high- quality beef is very im-portant to the state.
Introduction
Production of high quality beef requires the right combination of natural resources, people, and infrastructure. Nebraska has ample supplies of each and they combine with the science of beef quality to make our state one of the best places in the world to produce quality beef. Unless otherwise noted, all of the data in this report were derived from public sources published from 2015 to 2017.
Nationally, Nebraska ranks as the top state for commercial cattle slaughter (over 7 million head), commercial red meat production (8 billion pounds, equal to 3.6 billion kg), and the number of cattle on feed. In the U.S., nearly one in four fed
cattle comes from Nebraska feedlots.The next two states for production of fed
cattle are Texas and Kansas. Figure 1 shows a comparison of Nebraska to the average of these two states in a number of areas that support beef production. This figure demonstrates the importance of beef pro-duction to the state. Evidence of the high quality nature of beef produced in Nebraska can be found in the data that show we produce a higher percentage of Prime (the highest USDA quality grade) and a lower percentage of Select- grade beef than our closest competitors.
Natural Resources
Land
Almost 50% of the state is pastureland. This supports the cows that produce the annual calf crop as well as the calves that suckle and/or graze for roughly 85% of their lives. It explains why Nebraska has far more beef cows per capita than any other state, and 20 to 50 times more beef cows per cap-ita than Kansas and Texas. There are 3.4 cat-tle per capita in Nebraska, three- fold more than the other top beef producing states.
There is an elevation change of 4,584 ft (ca. 1,400 meters) from East to West
Figure 1. Nebraska versus other top beef producing states (using data from 2012– 2017).
% State as Pasture (50%)
Cattle on Feed (2.5 million)
# Cattle/capita (4.0)
Beef Cows/capita (1.2)
Corn for Livestock Feed (5 million tons)
Ethanol Production(2,500 million gallons)
Beef Economic Impact/capita($5,500)
% Prime (6%)
% Select (30%)
NebraskaAverage of Texas & Kansas
124 · 2018 Nebraska Beef Cattle Report
Infrastructure
Agriculture is the most important busi-ness enterprise in the state, providing $16 billion in economic activity per year.
University of Nebraska
Residents know that Nebraska is blessed with abundant natural resources. This is complemented by a state investment in infrastructure, including the University of Nebraska and the Nebraska Department of Agriculture. The University has about 3,500 undergraduate and graduate students in the College of Agricultural Science and Natural Resources. Within the Institute of Agriculture and Natural Resources, faculty specialize in Animal Science, Agronomy, Agricultural Economics, Biological Systems Engineering, and Food Science, among other disciplines- many work together to fo-cus on beef. There are almost 300 full- time faculty focused on research with annual research expenditures of $185 M.
A major research and extension ini-tiative is in beef. Educationally, Nebraska is renowned for the Beef Scholars under-graduate program and the post- graduate Beef Feedlot Management Program. An interdisciplinary program in Grazing Livestock Systems is another innovative educational program, as is the Great Plains Veterinary Education Center. In addition, the university has a strong linkage with the U.S. Meat Animal Research Center, where approximately 35,000 acres and 8,000 cows are used in research projects. These exam-ples of research, teaching, and extension programming demonstrate the significant role the University plays in state- wide beef production.
Nebraska Department of Agriculture
Beef from Nebraska is world renowned for its tenderness and flavor.
For example, in 2005, Nebraska pro-duced 5% of the U.S. beef that was exported to the European Union. For the first 3 months of 2017, it produced 52%. Nebras-ka is the number one state in the nation for value of beef and veal exports. State investment in agriculture is a consistent theme and great leadership has resulted in international recognition of the Nebraska Advantage.
Cow- calf operators, who raise cows for production of calves for meat, are support-ed by a seedstock industry that produces the genetic foundation for local producers. Backgrounders take the weaned calves and graze them until they enter feedlots. Relatively mild weather minimizes environ-mental stress on cattle, compared to states with higher temperatures and humidity. Over 1,500 feedlots are dedicated to caring and nurturing cattle for the final 100 to 180 days they eat corn and corn byproducts (distillers grains) before going to market. In addition, three of the nation’s four largest packing plants have operations in the state, as do smaller packing companies.
Breeds
The range in beef tenderness within breeds is almost as large as the range in ten-derness among breeds. That said, cattle of Bos indicus origin are often less tender than other breeds. They are genetically disposed to this condition due to the amount of natu-rally occurring enzyme inhibitors within the cell which suppress postmortem prote-olysis (tenderization). Nebraska’s moderate climate means Bos indicus genetics– which are often used to combat high heat and humidity conditions– are seldom found. In Nebraska, 70% or more of the cattle are Angus or Angus- crossbreds, which are of Bos taurus origin.
People
One in four jobs in Nebraska is related to agriculture. In 2015, Nebraska had 47,800 farms and ranches, with an average size of 928 acres (376 ha). Cash receipts from farm marketings exceeded $23 billion in 2015. Clearly, agriculture (of which beef is the largest segment) is important to Nebraskans.
Cattlemen in Nebraska serve in na-tional leadership positions. The 2016– 2017 President of the National Cattlemen’s Beef Association hails from the state, as did the 2011– 2012 President. One of Nebraska’s cattlewomen is currently Vice Chair of the Federation of State Beef Councils. Ne-braska has, over the years, provided 4 U.S. Secretaries of Agriculture, including the 2005– 2007 Secretary. The nation values the leadership of Nebraska beef producers.
24,000 miles (over 38,600 km) of rivers and streams. This precious resource helps Nebraska to withstand short periods of drought, sustaining beef production.
Corn
Water is critical to support crop and animal production. Judicious use of water allows Nebraska to produce ample corn for livestock feed. In fact, Nebraska ranks 3rd nationally in production of corn for livestock feed. The capability of producing animal feed in the same location that the animals are produced means Nebraska has a low cost of production. It is not necessary to transport feedstuffs or animals long distances– a challenge faced by many other states.
Ethanol byproducts
Corn is often converted to ethanol, producing distillers grains. Nebraska research has shown that, pound- for- pound, distillers grains have more nutritional value in cattle feed than corn alone. Nebraska ranks second nationally in the capacity to produce ethanol. Almost one- third of Nebraska corn is directed toward ethanol production. Further, Nebraska beef produc-ers take advantage of corn production by grazing cattle on corn residue, the remains after the corn is harvested and/or the corn plant is converted to silage. The capability to get even more value from this important crop is another valuable, and sustainable, production strategy.
Given the proximity of cattle feedlots to ethanol plants, Nebraska producers can feed distillers grains in the wet form. It is not necessary to dry the grains to minimize transportation costs. Thus, local distillers grains production means a lower cost of beef production.
The combination of cattle, corn, and ethanol form a golden triangle for cattle production.
Cattle
Nebraska has 1.9 million beef cows, about the same as the number of people who live in the state. All elements of beef production can be found within the state.
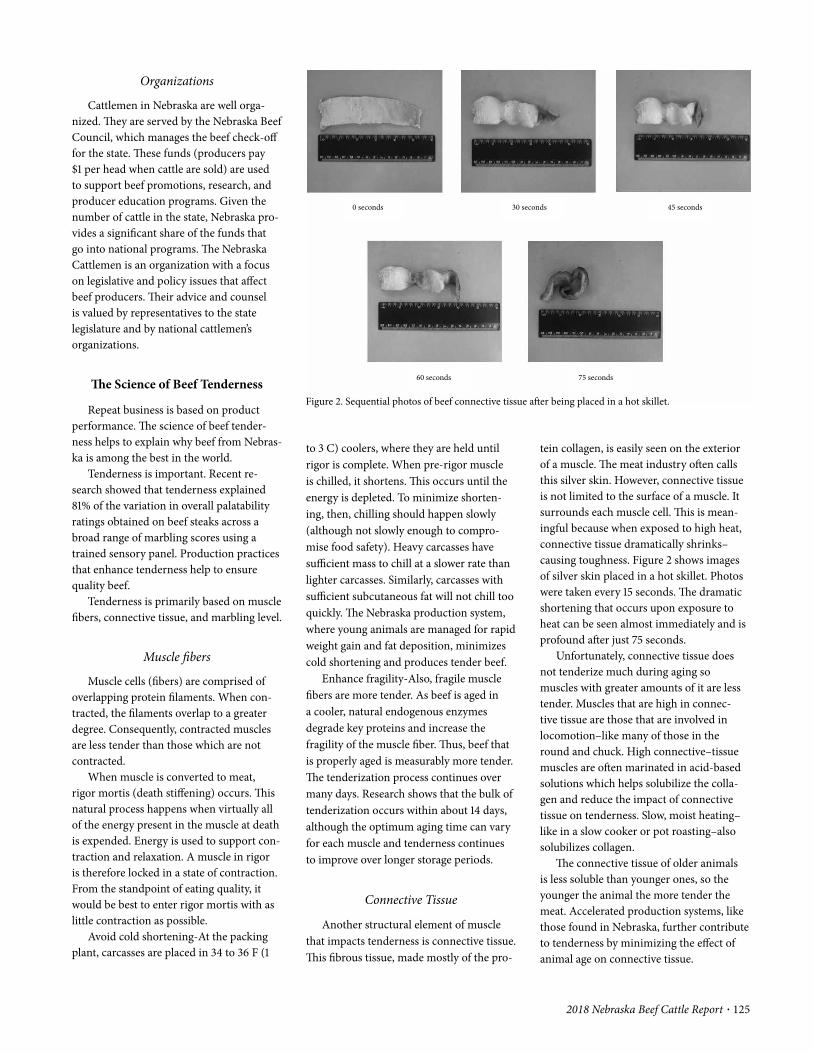
2018 Nebraska Beef Cattle Report · 125
tein collagen, is easily seen on the exterior of a muscle. The meat industry often calls this silver skin. However, connective tissue is not limited to the surface of a muscle. It surrounds each muscle cell. This is mean-ingful because when exposed to high heat, connective tissue dramatically shrinks– causing toughness. Figure 2 shows images of silver skin placed in a hot skillet. Photos were taken every 15 seconds. The dramatic shortening that occurs upon exposure to heat can be seen almost immediately and is profound after just 75 seconds.
Unfortunately, connective tissue does not tenderize much during aging so muscles with greater amounts of it are less tender. Muscles that are high in connec-tive tissue are those that are involved in locomotion– like many of those in the round and chuck. High connective– tissue muscles are often marinated in acid- based solutions which helps solubilize the colla-gen and reduce the impact of connective tissue on tenderness. Slow, moist heating– like in a slow cooker or pot roasting– also solubilizes collagen.
The connective tissue of older animals is less soluble than younger ones, so the younger the animal the more tender the meat. Accelerated production systems, like those found in Nebraska, further contribute to tenderness by minimizing the effect of animal age on connective tissue.
to 3 C) coolers, where they are held until rigor is complete. When pre- rigor muscle is chilled, it shortens. This occurs until the energy is depleted. To minimize shorten-ing, then, chilling should happen slowly (although not slowly enough to compro-mise food safety). Heavy carcasses have sufficient mass to chill at a slower rate than lighter carcasses. Similarly, carcasses with sufficient subcutaneous fat will not chill too quickly. The Nebraska production system, where young animals are managed for rapid weight gain and fat deposition, minimizes cold shortening and produces tender beef.
Enhance fragility- Also, fragile muscle fibers are more tender. As beef is aged in a cooler, natural endogenous enzymes degrade key proteins and increase the fragility of the muscle fiber. Thus, beef that is properly aged is measurably more tender. The tenderization process continues over many days. Research shows that the bulk of tenderization occurs within about 14 days, although the optimum aging time can vary for each muscle and tenderness continues to improve over longer storage periods.
Connective Tissue
Another structural element of muscle that impacts tenderness is connective tissue. This fibrous tissue, made mostly of the pro-
Organizations
Cattlemen in Nebraska are well orga-nized. They are served by the Nebraska Beef Council, which manages the beef check- off for the state. These funds (producers pay $1 per head when cattle are sold) are used to support beef promotions, research, and producer education programs. Given the number of cattle in the state, Nebraska pro-vides a significant share of the funds that go into national programs. The Nebraska Cattlemen is an organization with a focus on legislative and policy issues that affect beef producers. Their advice and counsel is valued by representatives to the state legislature and by national cattlemen’s organizations.
The Science of Beef Tenderness
Repeat business is based on product performance. The science of beef tender-ness helps to explain why beef from Nebras-ka is among the best in the world.
Tenderness is important. Recent re-search showed that tenderness explained 81% of the variation in overall palatability ratings obtained on beef steaks across a broad range of marbling scores using a trained sensory panel. Production practices that enhance tenderness help to ensure quality beef.
Tenderness is primarily based on muscle fibers, connective tissue, and marbling level.
Muscle fibers
Muscle cells (fibers) are comprised of overlapping protein filaments. When con-tracted, the filaments overlap to a greater degree. Consequently, contracted muscles are less tender than those which are not contracted.
When muscle is converted to meat, rigor mortis (death stiffening) occurs. This natural process happens when virtually all of the energy present in the muscle at death is expended. Energy is used to support con-traction and relaxation. A muscle in rigor is therefore locked in a state of contraction. From the standpoint of eating quality, it would be best to enter rigor mortis with as little contraction as possible.
Avoid cold shortening- At the packing plant, carcasses are placed in 34 to 36 F (1
Figure 2. Sequential photos of beef connective tissue after being placed in a hot skillet.
0 seconds 30 seconds 45 seconds
60 seconds 75 seconds

126 · 2018 Nebraska Beef Cattle Report
grade– further evidence of the great job done by Nebraska producers.
Implications/Conclusions
From its natural resources to its people and infrastructure, Nebraska has a compet-itive advantage in producing high- quality beef. The science of beef quality supports this production system.
Chris Calkins, full professor, Animal Sci-ence, Lincoln
Marbling
Marbling is associated with tenderness. A recent study showed a near linear reduction of shear force and increase in tenderness rat-ing as marbling increased. For that trained panel, 62% of low Choice beef received a positive palatability rating while 82% of average Choice and 88% of high Choice beef received the scores. Prime was even higher at 98– 99% positive ratings. Nebraska often leads the nation in the percentage Prime and upper 2/3 Choice. In early 2017, over 80% of the harvest received a Prime or Choice
2018 Nebraska Beef Cattle Report · 127
© The Board Regents of the University of Nebraska. All rights reserved.
patty samples were collected on days 0, 1, 2, 3, 5, and 7 for analysis of lipid oxidation by the thiobarbituric acid reactive substances (TBARS) analysis.
Cooked beef links were produced from each shoulder clod by mixing 10 lbs of raw ground beef with non- meat ingredients (0.75% salt, 0.25% sodium phosphate on a meat block basis) for 1 minute then formed into skinless links using a piston stuffer with a Colisimo Press attachment. Links were placed in parchment- lined aluminum trays, covered with aluminum foil and cooked to an internal temperature of 160°F. Following cooking, links were placed in zip- lock bags in dark refrigerated (37°F) and frozen storage (- 4°F). Lipid oxidation was evaluated on samples taken from refrigerat-ed storage on days 0, 3, 6, 9, 12, and 18, and from frozen storage on days 28, 56, 84, 112, 140, 168, and 196.
Data were analyzed for main effects of diet, and when appropriate, main effects of diet, storage time, and their interaction using GLIMMIX procedure of SAS (v.9.4). Storage time was considered a repeated measure. When significant effects were identified (P ≤ 0.05), means were separated using LSMEANS with Tukey’s adjustment.
Results
Finishing diets that included modified distillers grains increased the content of C18:2 in lean, subcutaneous fat, and ground composite samples, and the concentration of polyunsaturated fatty acids (PUFA) in subcutaneous fat and composite samples (P ≤ 0.01; Figure 1). Similar increases in C18:2 and PUFA in de- oiled distillers grains treat-ments were obtained in previous studies (2016 Nebraska Beef Report, pp.158– 160; 2015 Nebraska Beef Report, pp. 122– 123). There were no differences in fatty acid con-tent, or quality between MDGS treatments despite differences in oil content. This result is likely due to the protection of the remain-ing oil in de- oiled distillers grains from biohydrogenation in the rumen, allowing
lipid oxidation between a control corn diet and diets with dried distillers grains have been shown to occur during storage time. Increases in lipid oxidation can be related to increased concentration of polyunsatu-rated fatty acids.
Technology in ethanol production has evolved to remove a portion of free oil from distillers grain through centrifuga-tion. Generally this process reduces the oil content from 11– 13% to 7– 8% in the final distillers grains. However, feeding “de- oiled” distillers grains still impacts the fatty acid composition and quality characteristics in ground beef (2016 Nebraska Beef Report, pp.158– 160) The purpose of this study was to determine the effects of the oil removal process, and fat content of distillers grains on the quality and shelf life of raw and cooked ground beef products from cattle fed distillers grains.
Procedure
Steers (n = 256; 32 pens with 8 pens per diet) were randomly assigned to one of four finishing diets for 134 days prior to harvest: corn (control), 40% full- fat modified distillers grains with solubles (MDGS; DM Basis), 40% de- oiled MDGS (DM Basis), 40% de- oiled MDGS with oil added back to have the same lipid content as full- fat MDGS (DM Basis). The right shoulder clod (IMPS# 114) from one USDA Choice carcass from each pen was collected for processing (n = 32). The untrimmed, vacuum packaged shoulder clods were held for 2 weeks at 34°F. On day 14 postmortem, a sample of lean, subcutaneous fat and ground composite (lean and fat) was re-moved from each clod. Each shoulder clod was independently ground to 3/16”, and 4 oz. patties were formed, placed on Styro-foam trays and overwrapped for storage in simulated retail display conditions. During simulated retail display, objective color (L*, a*, b*), was evaluated and percentage discoloration was evaluated by panelists (n = 5) on days 0, 1, 2, 3, 4, 5, 6, and 7. Half
Faith D. RasmussenChad G. BowerGary A. Sullivan
Summary with Implications
Beef shoulder clods were collected from steers fed one of four finishing diets: no distillers grains and three with distillers grains containing different amounts of oil. Raw ground beef patties were evaluated for changes in objective color, discoloration, and lipid oxidation during simulated retail display (7 days). Cooked beef links in refrigerated (18 days) and frozen storage (198 days) were analyzed for lipid oxidation throughout shelf life. Fatty acid profiles were evaluated in lean, subcutaneous fat, and ground composite samples. All distillers grain diets increased C18:2 and polyunsaturated fatty acids in beef. There were no dietary differences in lipid oxidation throughout shelf life of raw ground beef and cooked beef links and no differences in color characteristics of raw ground beef. Finishing cattle on distillers grains altered fatty acid composition but did not impact shelf life characteristics of raw or cooked ground beef. The amount of oil in the distillers grains did not result in any signifi-cant differences in fatty acid profile and shelf life measures.
Introduction
Due to the increased production of corn ethanol, most feedlot diets have incorporat-ed the ethanol co- product distillers grains. Previous studies have indicated modified distillers grains, when fed in a finishing diet, have had an impact on the fatty acid profile of raw beef with a general increase in C18:2 and polyunsaturated fatty acid concentration (2009 Nebraska Beef Report, pp. 107– 109 and 110– 112; 2015 Nebraska Beef Report, pp. 122– 123.) When observed in raw ground beef applications, changes in
Shelf Life of Ground Beef from Cattle Fed Distillers Grains Containing Different Amounts of Oil
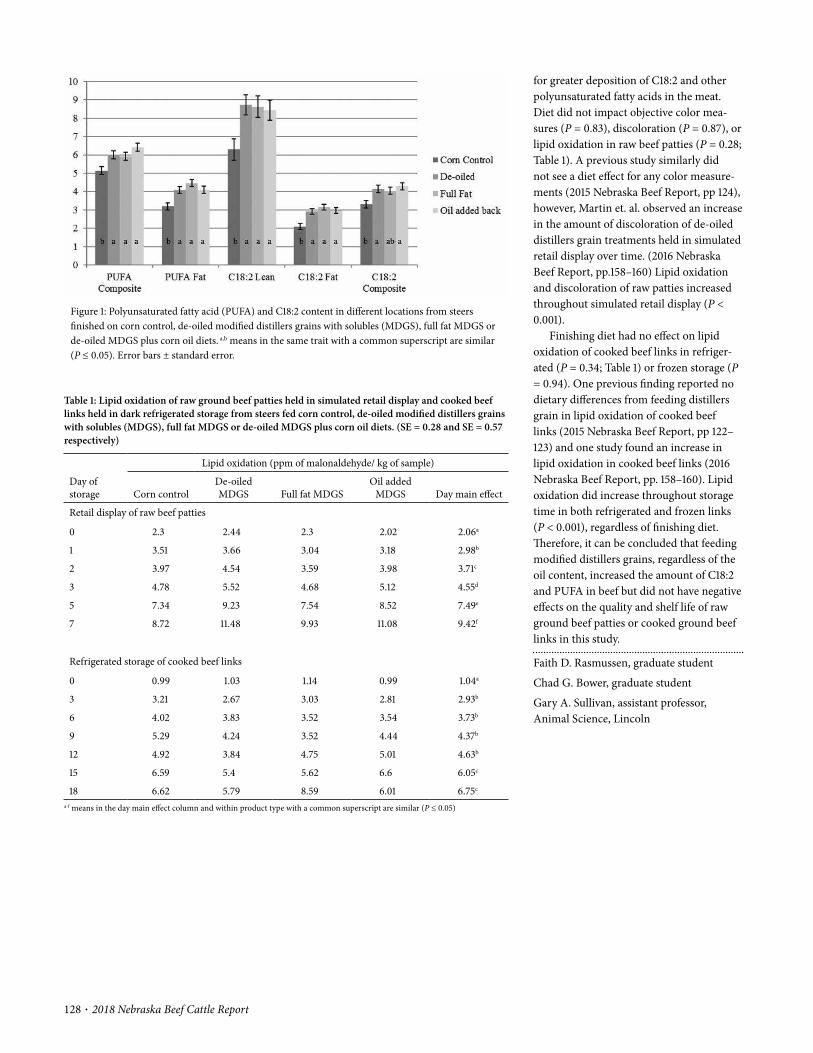
128 · 2018 Nebraska Beef Cattle Report
Figure 1: Polyunsaturated fatty acid (PUFA) and C18:2 content in different locations from steers finished on corn control, de- oiled modified distillers grains with solubles (MDGS), full fat MDGS or de- oiled MDGS plus corn oil diets. a,b means in the same trait with a common superscript are similar (P ≤ 0.05). Error bars ± standard error.
Table 1: Lipid oxidation of raw ground beef patties held in simulated retail display and cooked beef links held in dark refrigerated storage from steers fed corn control, de- oiled modified distillers grains with solubles (MDGS), full fat MDGS or de- oiled MDGS plus corn oil diets. (SE = 0.28 and SE = 0.57 respectively)
Day of storage
Lipid oxidation (ppm of malonaldehyde/ kg of sample)
Corn controlDe- oiled MDGS Full fat MDGS
Oil added MDGS Day main effect
Retail display of raw beef patties
0 2.3 2.44 2.3 2.02 2.06a
1 3.51 3.66 3.04 3.18 2.98b
2 3.97 4.54 3.59 3.98 3.71c
3 4.78 5.52 4.68 5.12 4.55d
5 7.34 9.23 7.54 8.52 7.49e
7 8.72 11.48 9.93 11.08 9.42f
Refrigerated storage of cooked beef links
0 0.99 1.03 1.14 0.99 1.04a
3 3.21 2.67 3.03 2.81 2.93b
6 4.02 3.83 3.52 3.54 3.73b
9 5.29 4.24 3.52 4.44 4.37b
12 4.92 3.84 4.75 5.01 4.63b
15 6.59 5.4 5.62 6.6 6.05c
18 6.62 5.79 8.59 6.01 6.75c
a- f means in the day main effect column and within product type with a common superscript are similar (P ≤ 0.05)
for greater deposition of C18:2 and other polyunsaturated fatty acids in the meat. Diet did not impact objective color mea-sures (P = 0.83), discoloration (P = 0.87), or lipid oxidation in raw beef patties (P = 0.28; Table 1). A previous study similarly did not see a diet effect for any color measure-ments (2015 Nebraska Beef Report, pp 124), however, Martin et. al. observed an increase in the amount of discoloration of de- oiled distillers grain treatments held in simulated retail display over time. (2016 Nebraska Beef Report, pp.158– 160) Lipid oxidation and discoloration of raw patties increased throughout simulated retail display (P < 0.001).
Finishing diet had no effect on lipid oxidation of cooked beef links in refriger-ated (P = 0.34; Table 1) or frozen storage (P = 0.94). One previous finding reported no dietary differences from feeding distillers grain in lipid oxidation of cooked beef links (2015 Nebraska Beef Report, pp 122– 123) and one study found an increase in lipid oxidation in cooked beef links (2016 Nebraska Beef Report, pp. 158– 160). Lipid oxidation did increase throughout storage time in both refrigerated and frozen links (P < 0.001), regardless of finishing diet. Therefore, it can be concluded that feeding modified distillers grains, regardless of the oil content, increased the amount of C18:2 and PUFA in beef but did not have negative effects on the quality and shelf life of raw ground beef patties or cooked ground beef links in this study.
Faith D. Rasmussen, graduate student
Chad G. Bower, graduate student
Gary A. Sullivan, assistant professor, Animal Science, Lincoln
2018 Nebraska Beef Cattle Report · 129
© The Board Regents of the University of Nebraska. All rights reserved.
Jennifer A. PosthumaFaith D. Rasmussen
Gary A. Sullivan
Summary with Implications
Producing cured meats manufactured with natural ingredients could impact cured meat characteristics, including color. The objective of this study was to determine the effects of nitrite source (sodium nitrite or cultured celery juice powder), reducing agents (no reducing compound or sodium er-ythorbate/ascorbic acid), and holding times prior to cooking on cured color development in a meat model system. The addition of reducing compounds had the largest impact on cured color development and reduced re-sidual nitrite in a cured meat model system. Treatments cured with sodium nitrite had slightly greater cured color development than treatments cured with celery juice powder. Holding times prior to cooking had limited impact on cured color development. These findings indicate that processors can produce cured meats with adequate cured meat color using celery juice powder and ascorbic acid from cherry powder without needing to extend holding time prior to cooking.
Introduction
The addition of ingredients that contain nitrite to meat allows for the development of cured meat characteristics including stable cured meat color, cured meat flavor and aroma, reduced lipid oxidation, and reduced growth of some pathogens and spoilage microorganisms. Cured meat color development occurs through the addition of nitric oxide (NO) to the heme- iron of myoglobin, the primary pigment in meat. Ultimately, the reduction of nitrite to nitric oxide occurs via reactions with endogenous compounds or added ingredients, which allow for meat curing to occur.
Using a Cured Meat Model System to Investigate Factors that Influence Cured Color Development
With the evolving consumer demand for natural and clean- label foods, common ingredients used in cured meats are being replaced with natural ingredients to provide similar functions. Sodium nitrite is often replaced with cultured celery juice powder as a natural nitrite source. Similarly, acerola cherry powder is high in ascorbic acid and can be used as an alternative to sodium erythorbate (a reducing compound) to increase the rate of meat curing reactions. The holding time between manufacturing and cooking can also impact the extent of meat curing reactions. The objective of this study was to determine the effects of nitrite source, the addition of reducing agents, and holding times prior to cooking on cured color development in a meat model system.
Procedure
This study was conducted using a 2 x 2 x 5 treatment arrangement to determine the effects of nitrite source (sodium nitrite; or celery juice powder), reducing compounds (no reducing compounds; or addition of a reducing compound), and holding time pri-or to cooking on cured color development and residual nitrite in a meat model system. Emulsified beef sausages were formulated to contain 156 ppm of sodium nitrite or manufactured with 0.44% celery juice pow-der (VegStable 504, Florida Food Products, Inc., Eustis, FL) to provide the equivalent of 100 ppm of sodium nitrite. Previous research has indicated that cultured celery juice powder is limited to this amount due to increased off flavors and reduced product acceptability when greater amounts were used. For treatments containing reducing compounds, the sodium nitrite treatment with reducing compounds had 495 ppm of sodium erythorbate added and the celery juice powder with reducing compounds treatment had 0.4% cherry powder (Veg-Stable 515, Florida Food Products, Inc.) to provide 440 ppm of ascorbic acid. These concentrations of sodium erythorbate and ascorbic acid are molar equivalents to pro-vide similar reducing capacity. Treatments
without reducing compounds contained neither sodium erythorbate nor ascorbic acid from cherry powder. For each treat-ment, ground beef (1.5 lbs), 2% salt, 20% ice (meat block basis) and the treatment specific nitrite sources and reducing agents were chopped for 60 sec at 2000 rpm using a commercial food processor (Blixer 6V, Robot Coupe, Robot Coupe, Ridgeland, MS). From each treatment, the emulsions were placed into five, 100 ml glass beakers, covered in plastic film, and held at ambient room temperature for 5, 15, 30, 60 or 120 minutes prior to cooking. After the specific holding time, sausages were cooked in water baths for 30 min at 104 °F followed by 30 min at 176 °F and cooled for 30 min in an ice bath. After cooling, sausages were re-moved from beakers and sliced horizontally into four pieces. Samples were evaluated for objective color to measure lightness, red-ness, and yellowness, (CIE L*, a*, and b*, respectively), residual nitrite, cured meat pigment, and total meat pigment. Percent cured meat pigment was calculated from the results.
The experiment was conducted as a completely randomized design with facto-rial treatment arrangement. Three indepen-dent replications were produced. Data were analyzed using a PROC Glimmix procedure of SAS. Interactions of effects and main effects of nitrite source (sodium nitrite or celery juice powder), addition of reducing compounds (sodium erythorbate/ascorbic acid or no added reducing compound), and holding time prior to cooking (5, 15, 30, 60, and 120 min) were analyzed. When significant interactions or main effects were identified (P ≤ 0.05), means separation was conducted using a Tukey’s adjustments.
Results
The only significant (P < 0.05) treatment interactions were nitrite source by reducing compounds for residual nitrite, percent cured pigment, and residual nitrite. Main effects were considered for all other traits (Table 1).

130 · 2018 Nebraska Beef Cattle Report
with reducing compounds were similar in producing cured meat pigment.
Objective color
Nitrite source, reducing compounds, and holding times had no impact on the L* value (lightness; P > 0.323). However, sodi-um nitrite treatments were more red (a*, P < 0.001) and less yellow (b*, P = 0.009) than
er ingoing nitrite (156 ppm vs. 100 ppm) which likely explains the greater amount of cured pigment in sodium nitrite treatments than celery juice powder treatments. How-ever, when reducing compounds are added, more cured meat pigment was formed and the differences between nitrite sources was reduced. This is further demonstrated, along with the results of percent cured meat pigment, where either nitrite source
Cured, total, and percent cured meat pigment
A significant nitrite source by reducing compound interaction was identified for amount of cured meat pigment (P < 0.001; Table 2). The sodium nitrite and sodium erythorbate treatment had the greatest amount of cured meat pigment value followed by celery juice powder and cherry powder treatment, sodium nitrite, and celery juice powder where each treatment was different from the others. Total meat pigment was not affected by any treatment interaction (P ≥ 0.96) or main effects (P ≥ 0.06). Similarly, percent cured meat pig-ment had a nitrite source by reducing com-pound interaction (P = 0.006). The greatest percentage was found in the sodium nitrite and sodium erythorbate treatment and celery juice powder and cherry powder treatment, sodium nitrite only was interme-diate, and celery juice powder only had the least percent cured meat pigment.
The sodium nitrite treatment had great-
Table 1. Means for main effects of nitrite sources, the addition of reducing compounds, and holding time on objective color, cured and total meat pigment, and residual nitrite in a cured meat model system
Main effects L* a* b*Cured meat
pigment1 (ppm)Total meat
pigment (ppm)Percent cured meat pigment1
Residual nitrite1 (ppm)
Nitrite source
Sodium nitrite 62.27 13.87a 8.82b 102.77 173.42 59.3 71.12
Celery juice powder 62.44 12.58b 9.17a 88.35 168.88 52.2 45.48
SE 0.17 0.21 0.13 1.85 5.51 1.9 1.65
P– value 0.323 <0.001 0.009 <0.001 0.415 <0.001 <0.001
Reducing compounds
None added 62.39 10.69b 9.15a 63.29 176.32 38.5 69.51
Added2 62.32 15.76a 8.83b 127.82 165.97 73.0 47.10
SE 0.17 0.21 0.13 1.85 3.89 1.9 1.65
P– value 0.697 <0.001 0.016 <0.001 0.068 <0.001 <0.001
Holding time (min)
5 62.61 13.21bc 9.07 94.48 170.78 55.1 58.45
15 62.24 13.02bc 8.96 94.64 168.20 56.6 60.51
30 62.56 12.66c 8.84 92.25 171.62 53.7 57.74
60 62.30 13.37ab 9.03 96.87 174.19 55.6 58.06
120 62.04 13.88a 9.06 99.54 170.94 57.9 56.67
SE 0.28 0.33 0.21 2.92 8.71 3.0 2.60
P- value 0.206 0.011 0.754 0.150 0.974 0.708 0.6721 A significant nitrite source by reducing agent interaction was identified for these traits.2 Contained either 495 ppm of sodium erythorbate or 440 ppm of ascorbic acid from cherry powder.a- c Means in a column and within each main effect with a common superscript are similar (P > 0.05).
Table 2. Means for the interaction of nitrite sources and the addition of reducing compounds on cured meat pigment, cured meat pigment, and residual nitrite in a cured meat model system.
Nitrite sourceReducing
compoundsCured meat
pigment (ppm)Percent cured meat pigment
Residual nitrite (ppm)
Sodium nitrite None added 74.67c 44.8b 79.70a
Added1 130.86a 73.8a 62.55b
Celery juice powder None added 51.91d 32.2c 59.32b
Added2 124.78b 72.3a 31.64c
SE 2.61 2.7 2.33
P- value < 0.001 0.006 0.0031 Contained 495 ppm of sodium erythorbate2 Contained 440 ppm of ascorbic acid from cherry powder.a- c Means within a column with a common superscript are similar (P > 0.05).
2018 Nebraska Beef Cattle Report · 131
unexpected that treatments with sodium nitrite had greater residual nitrite than those with celery juice powder as it had greater ingoing nitrite concentration. Sim-ilarly, the addition of reducing compounds reduced the amount of residual nitrite in the products.
Conclusions
When reducing compounds are added, cured meats with similar cured color characteristics can be manufactured using sodium nitrite or natural nitrite sources. Samples manufactured with sodium nitrite were slightly more red and less yellow than those manufactured with natural nitrite sources. Holding time prior to cooking of up two hours had minimal impact on cured color characteristics.
Jennifer A. Posthuma, undergraduate student
Faith D. Rasmussen, graduate student
Gary A. Sullivan, assistant professor, Animal Science, Lincoln
The only objective color value influ-enced by holding time was redness values (P = 0.011) where 120 minutes holding time were more red (P ≤ 0.05) than 5, 15, and 30 minutes holding time and 60 min holding time samples were more red than 30 min holding samples (Table 1). The increased redness with longer holding times could be an indication of increased cured color but this was not reflected in measures of cured meat pigment.
Residual Nitrite
There was a significant nitrite source by reducing agent interaction for residual nitrite (P = 0.003; Table 2). The sodium nitrite treatment had the greatest amount of residual nitrite (P ≤ 0.05), followed by the sodium nitrite and sodium erythor-bate treatment and celery juice powder treatment, and celery juice powder and cherry powder treatment had the least re-sidual nitrite. Holding time did not impact residual nitrite (P = 0.672; Table 1). It is not
celery juice powder treatments (Table 1). Similar results were identified for internal cured meat color in all- beef frankfurters (2015 Nebraska Beef Report, pp. 120– 121). The greater red color is likely an indication of cured meat color development. The increased yellowness in celery juice powder sausages is likely due to the inherent color of the celery juice powder. However, the difference in yellowness may not be enough to impact consumer acceptability.
The addition of reducing compounds resulted in samples that were more red (P < 0.001) and less yellow (P = 0.016) than the treatments without a reducing compound (Table 1). The increased redness corre-sponds with greater cured meat pigment in samples with reducing compounds. Miller et al. reported that the internal color of beef frankfurters was less yellow in cured treat-ments than those that had no nitrite added (2015 Nebraska Beef Report, pp. 120– 121). The increased yellowness in those without reducing compounds could also be related to less cured meat color development.
132 · 2018 Nebraska Beef Cattle Report
© The Board Regents of the University of Nebraska. All rights reserved.
diately before HPP. Three independent replications were produced.
High pressure processing treatment
Samples were processed using a large scale high pressure processing unit (Hip-erbaric 55, Miami, FL) located in the food grade lab of the Food Processing Cen-ter, University of Nebraska–Lincoln. All samples, except controls, were HPP with three different conditions (pressure and hold time; 600 MPa / 3 minutes, 600 MPa / 6 minutes and 450 MPa / 3 minutes) and were subsequently stored at 39°F through-out the study. The three pressure combina-tions were chosen based on their effective-ness to reduce pathogens.
Colorimetry
Color of the patties was measured (CIE L*, a*, b*) through the vacuum pouch before HPP and on days 3, 7, 12, 14, 19 and 21 after HPP. A colorimeter (CR- 300, MINOLTA, Japan) was used to determine the instrumental color which uses diffuse D65 illumination, 8 mm viewing port, and 0° viewing angle (specular component included). The system was calibrated to the included white calibration plate covered in the vacuum pouch before analyzing. The average of at least three measurements was taken from patty surface. Change in color, with respect to the control samples from the same myoglobin state, was expressed as ΔE, where ΔE = [(Lf- Li)
2 + (af- ai)2 + (bf- bi)
2]1/2
Subscripts i and f represent before and after HPP.
Statistical analyses
Statistical analyses were conducted on color data (L, a*, b*, ΔE) using SAS soft-ware version 9.4 (SAS Cary, NC) to see the main effects of myoglobin states and HPP treatment and their interactions within each day of storage. Treatment interaction and main effects were determined using
Jhinuk GuptaChad Bower
George CavenderGary Sullivan
Summary with Implications
High pressure processing, a non- thermal pasteurization technique, can reduce E. coli in beef but the use is limited due to discolor-ation of raw beef after high pressure process-ing. Different states of myoglobin have inher-ently different color stability. The objective of this study was to determine the impact of myoglobin state on color stability of raw beef patties treated with high pressure process-ing. Modified atmosphere packaging (high oxygen- oxymyoglobin, carbon monoxide- carboxymyoglobin), vacuum packaging (de-oxymyoglobin) or added potassium ferricya-nide (metmyoglobin) treatments were used to prepare patties with desired myoglobin states. Color was measured (CIE L*, a*, b*) before and after high pressure processing over a stor-age period of 21 days. Regardless of pressure and duration, beef patties lost redness after high pressure processing. However, carboxy-myoglobin showed better color retention as compared to deoxymyoglobin, oxymyoglobin and metmyoglobin.
Introduction
High pressure processing (HPP) is a non- thermal pasteurization technique where microorganisms are killed by cell wall or spore coat rupture at high pressure (300 to 800 MPa). However, use of HPP on raw meat products is limited due to the resulting loss of red color and, at times, a “cooked” appearance. High pressure- induced protein denaturation, loss of pig-ment, difficulty in pigment visualization by opaque flesh, and oxidation of myoglobin to metmyoglobin are possible causes.
Meat color is largely decided by the
Effect of Myoglobin State on Color Stability of High Pressure Processed Ground Beef
pigment myoglobin (Mb), where globin is attached to a porphyrin ring with an iron center. The oxidation state of iron (Fe2+/Fe3+) and bound ligands generate different Mb states with different visual color and color stability. The purple red color of the freshly cut beef is due to deoxyMb where Fe2+ is not bound to any ligand. Exposure to air binds oxygen to Fe2+ and develops bright cherry red color (oxyMb), which is accepted by the consumer as fresh meat color. Over time, oxyMb is oxidized to form brown metMb (Fe3+). CarboxyMb, where carbon monoxide is bound to Fe2+ also imparts the desired bright cherry red color and is more stable. The objective of this study was to determine the effect of myoglobin state on color stability in HPP- treated ground beef.
Procedure
Patty preparation
Boneless, denuded USDA Select beef top rounds were ground through 1/2 in and 1/8 in plates, and subdivided into two batches of 5 lbs. One 5 lb portion was mixed with an aqueous solution of potassium ferricya-nide (227 mL of a 0.01% solution) to oxidize myoglobin to metmyoglobin using a com-mercial kneader- mixer (RM- 20, Manica USA, St. Louis, MO) and four patties (113 g) were formed using a 4.3 in diameter hand operated hamburger press. Patties were placed on styrofoam trays, overwrapped with oxygen permeable polyvinyl chloride wrap, and stored at 39°F for two days to form metMb. To prepare patties with the remaining myoglobin states, 12 patties (113 g) were prepared from the other portion of ground beef. Four of those were vacuum packed (deoxyMb), four were packed in an 80% oxygen atmosphere (oxyMb), and four were packed in a 0.4% carbon monoxide anaerobic atmosphere (carboxyMb). All patties were stored at 39°F for 2 days to allow for conversion to desired myoglobin state, vacuum packed, and sealed imme-
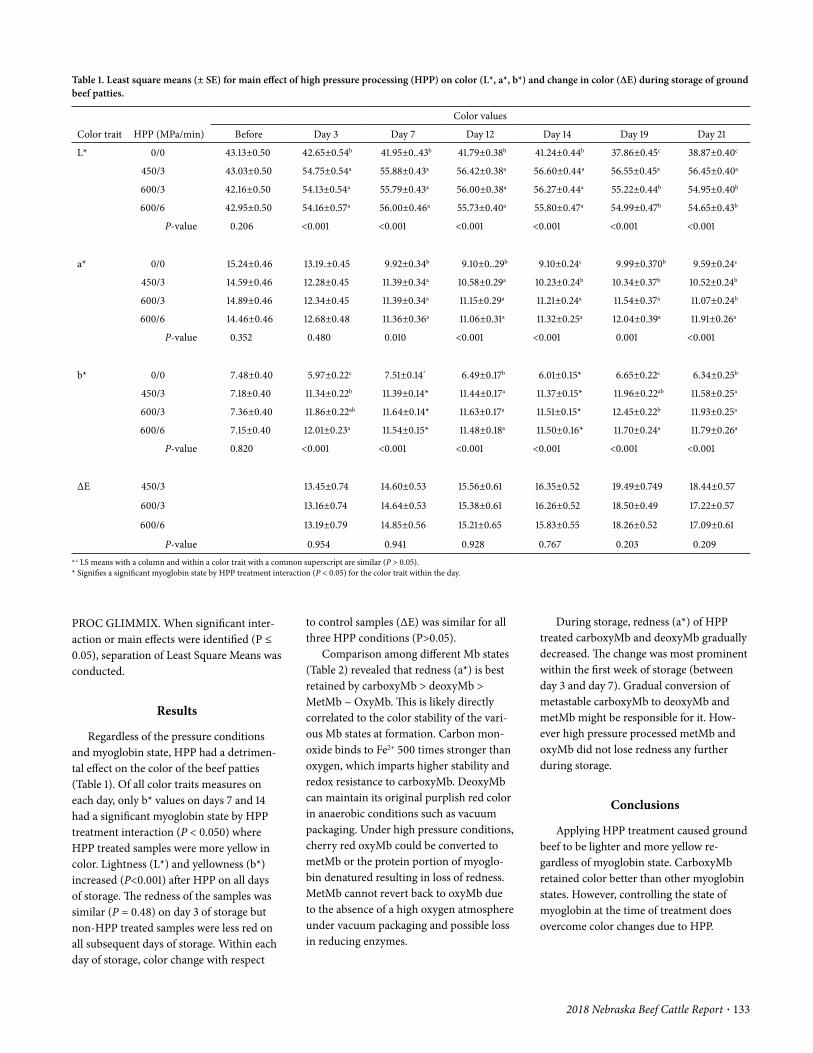
2018 Nebraska Beef Cattle Report · 133
During storage, redness (a*) of HPP treated carboxyMb and deoxyMb gradually decreased. The change was most prominent within the first week of storage (between day 3 and day 7). Gradual conversion of metastable carboxyMb to deoxyMb and metMb might be responsible for it. How-ever high pressure processed metMb and oxyMb did not lose redness any further during storage.
Conclusions
Applying HPP treatment caused ground beef to be lighter and more yellow re-gardless of myoglobin state. CarboxyMb retained color better than other myoglobin states. However, controlling the state of myoglobin at the time of treatment does overcome color changes due to HPP.
to control samples (∆E) was similar for all three HPP conditions (P>0.05).
Comparison among different Mb states (Table 2) revealed that redness (a*) is best retained by carboxyMb > deoxyMb > MetMb ~ OxyMb. This is likely directly correlated to the color stability of the vari-ous Mb states at formation. Carbon mon-oxide binds to Fe2+ 500 times stronger than oxygen, which imparts higher stability and redox resistance to carboxyMb. DeoxyMb can maintain its original purplish red color in anaerobic conditions such as vacuum packaging. Under high pressure conditions, cherry red oxyMb could be converted to metMb or the protein portion of myoglo-bin denatured resulting in loss of redness. MetMb cannot revert back to oxyMb due to the absence of a high oxygen atmosphere under vacuum packaging and possible loss in reducing enzymes.
PROC GLIMMIX. When significant inter-action or main effects were identified (P ≤ 0.05), separation of Least Square Means was conducted.
Results
Regardless of the pressure conditions and myoglobin state, HPP had a detrimen-tal effect on the color of the beef patties (Table 1). Of all color traits measures on each day, only b* values on days 7 and 14 had a significant myoglobin state by HPP treatment interaction (P < 0.050) where HPP treated samples were more yellow in color. Lightness (L*) and yellowness (b*) increased (P<0.001) after HPP on all days of storage. The redness of the samples was similar (P = 0.48) on day 3 of storage but non- HPP treated samples were less red on all subsequent days of storage. Within each day of storage, color change with respect
Table 1. Least square means (± SE) for main effect of high pressure processing (HPP) on color (L*, a*, b*) and change in color (∆E) during storage of ground beef patties.
Color trait HPP (MPa/min)
Color values
Before Day 3 Day 7 Day 12 Day 14 Day 19 Day 21
L* 0/0 43.13±0.50 42.65±0.54b 41.95±0..43b 41.79±0.38b 41.24±0.44b 37.86±0.45c 38.87±0.40c
450/3 43.03±0.50 54.75±0.54a 55.88±0.43a 56.42±0.38a 56.60±0.44a 56.55±0.45a 56.45±0.40a
600/3 42.16±0.50 54.13±0.54a 55.79±0.43a 56.00±0.38a 56.27±0.44a 55.22±0.44b 54.95±0.40b
600/6 42.95±0.50 54.16±0.57a 56.00±0.46a 55.73±0.40a 55.80±0.47a 54.99±0.47b 54.65±0.43b
P- value 0.206 <0.001 <0.001 <0.001 <0.001 <0.001 <0.001
a* 0/0 15.24±0.46 13.19.±0.45 9.92±0.34b 9.10±0..29b 9.10±0.24c 9.99±0.370b 9.59±0.24c
450/3 14.59±0.46 12.28±0.45 11.39±0.34a 10.58±0.29a 10.23±0.24b 10.34±0.37b 10.52±0.24b
600/3 14.89±0.46 12.34±0.45 11.39±0.34a 11.15±0.29a 11.21±0.24a 11.54±0.37a 11.07±0.24b
600/6 14.46±0.46 12.68±0.48 11.36±0.36a 11.06±0.31a 11.32±0.25a 12.04±0.39a 11.91±0.26a
P- value 0.352 0.480 0.010 <0.001 <0.001 0.001 <0.001
b* 0/0 7.48±0.40 5.97±0.22c 7.51±0.14* 6.49±0.17b 6.01±0.15* 6.65±0.22c 6.34±0.25b
450/3 7.18±0.40 11.34±0.22b 11.39±0.14* 11.44±0.17a 11.37±0.15* 11.96±0.22ab 11.58±0.25a
600/3 7.36±0.40 11.86±0.22ab 11.64±0.14* 11.63±0.17a 11.51±0.15* 12.45±0.22b 11.93±0.25a
600/6 7.15±0.40 12.01±0.23a 11.54±0.15* 11.48±0.18a 11.50±0.16* 11.70±0.24a 11.79±0.26a
P- value 0.820 <0.001 <0.001 <0.001 <0.001 <0.001 <0.001
∆E 450/3 13.45±0.74 14.60±0.53 15.56±0.61 16.35±0.52 19.49±0.749 18.44±0.57
600/3 13.16±0.74 14.64±0.53 15.38±0.61 16.26±0.52 18.50±0.49 17.22±0.57
600/6 13.19±0.79 14.85±0.56 15.21±0.65 15.83±0.55 18.26±0.52 17.09±0.61
P- value 0.954 0.941 0.928 0.767 0.203 0.209a- c LS means with a column and within a color trait with a common superscript are similar (P > 0.05).* Signifies a significant myoglobin state by HPP treatment interaction (P < 0.05) for the color trait within the day.

134 · 2018 Nebraska Beef Cattle Report
Table 2. Least square means (± SE) for main effect of myoglobin (Mb) state on color (L*, a*, b*) and change in color (∆E) during storage of ground beef patties.
Color trait Mb state
Color values
Day 3 Day 7 Day 12 Day 14 Day 19 Day 21
L* CarboxyMb 50.53±0.54b 51.58±0.43b 51.02±0.38c 51.50±0.44b 49.82±0.45b 50.09±0.40b
DeoxyMb 51.11±0.57b 52.13±0.46b 52. 40±0.40b 52.16±0.47b 51.94±0.47a 50.79±0.42b
MetMb 52.86±0.54a 54.00±0.43a 53.79±0.38a 53.80±0.44a 52.63±0.45a 53.18±0.40a
OxyMb 51.18±0.54b 51.91±0.43b 52.72±0.38ab 52.45±0.44b 50.25±0.45b 50.86±0.40b
P- value 0.028 0.002 <0.001 0.007 <0.001 <0.001
a* CarboxyMb 17.38±0.45a 14.34±0.34a 13.44±0.29a 13.16±0.24a 13.91±0.37a 13.50±0.24a
DeoxyMb 13.29±0.48b 11.05±0.36b 10.16±0.31b 10.49±0.25b 10.47±0.39b 10.67±0.26b
MetMb 9.92±0.45c 9.59±0.34c 9.61±0.29b 9.71±0.24c 10.19±0.37bc 9.66±0.24c
OxyMb 9.89±0.45c 9.09±0.34c 8.68±0.29c 8.50±0.24d 9.35±0.37c 9.25±0.24c
P- value <0.001 <0.001 <0.001 <0.001 <0.001 <0.001
b* CarboxyMb 9.27±0.22b 9.54±0.14* 9.50±0.17b 9.34±0.15* 10.10±0.22b 9.75±0.25b
DeoxyMb 9.40±0.23b 10.16±0.15* 9.71±0.18b 9.55±0.16* 10.25±0.24b 10.16±0.26ab
MetMb 11.22±0.22a 11.15±0.14* 11.04±0.17a 10.87±0.15* 11.40±0.22a 10.86±0.25a
OxyMb 11.29±0.22a 11.23±0.14* 10.80±0.17a 10.63±0.15* 11.01±0.22a 10.87±0.25a
P- value <0.001 <0.001 <0.001 <0.001 <0.001 0.006
∆E CarboxyMb 12.59±0.86 14.68±0.61 14.40±0.71 15.83±0.60 18.61±0.57 16.41±0.66
DeoxyMb 15.10±0.93 14.57±0.66 16.95±0.76 17.118±0.65 19.22±0.61 17.88±0.71
MetMb 12.17±0.86 13.73±0.61 14.91±0.71 15.34±0.60 18.74±0.57 18.76±0.66
OxyMb 13.20±0.86 15.81±0.61 15.29±0.71 16.31±0.60 18.42±10.57 17.27±0.66
P- value 0.135 0.153 0.117 0.257 0.801 0.109a- c LS means in a column and within a color trait with a common superscript are similar (P > 0.05).* Signifies a significant myoglobin state by HPP treatment interaction (P < 0.05) for the color trait within the day.
Jhinuk Gupta, postdoc, Food Science and Technology
Chad Bower, graduate student
George Cavender, assistant professor, Food Science and Technology, University of Georgia, Athens, GA
Gary Sullivan, assistant professor, Animal Science, Lincoln
2018 Nebraska Beef Cattle Report · 135
© The Board Regents of the University of Nebraska. All rights reserved.
T3: Celery juice powder (VegStable 506, Florida Food Products, Inc., Eustis, FL; to add 100 ppm sodium nitrite equiva-lent) / VP
T4: Celery juice powder (equivalent to 100 ppm nitrite) + 0.43% cherry powder (VegStable 515, Florida Food Products, to add 469 ppm ascorbic acid) / VP
T5: Sodium nitrite 156 ppm/ oxygen per-meable wrap (OPW; aerobic packaging)
T6: Sodium nitrite 156 ppm + Sodium erythorbate 547 ppm / OPW.
Four 113 g patties were prepared from each of the six treatments. Patties were formed using a 4.3 in diameter hand operated hamburger press. All T1, T2, T3 and T4 patties were vacuum packed using the vacuum sealer (Multivac Model C500; Multivac Inc., Kansas City, MO). Treatments T5 and T6 treated patties were placed on foam trays and overwrapped with oxygen permeable polyvinyl chloride. All patties were stored at 39°F for two days to allow for conversion to nitrosylmyo-globin (T1- T4) and nitrosylmetmyoglobn (T5- T6). After 48 hours, T5 and T6 were vacuum packaged just prior to HPP treat-ment. Three independent replications were produced.
High pressure processing treatment
Samples were processed using a large scale high pressure processing unit (Hip-erbaric 55, Miami, FL) located in the food grade lab of the Food Processing Center, University of Nebraska Lincoln. All samples except controls (non- HPP treated) were HPP with three different conditions of pressure and hold time (600 MPa / 3 min-utes, 600 MPa / 6 minutes, and 450 MPa / 3 minutes) and were subsequently stored at 39°F throughout the study.
Colorimetry
Color of the patties was measured (CIE L*a*b*) through the vacuum pouch before
are a greater food safety risk as pathogens can be introduced throughout the prod-uct, rather than just on the surface. High pressure processing (HPP) is a non- thermal pasteurization technique where between 300 and 800 MPa treatment ruptures the cell wall of bacteria. Use of HPP on raw meat products is uncommon due to high pressure- induced protein denaturation and discoloration. Therefore, to develop a HPP based pasteurization technique for raw ground beef products, it is important to find ways to stabilize meat color. The bright red color of nitrosylmyoglobin in anaerobically packaged raw meat is similar in color to oxymyoglobin but more stable and is formed with the addition of nitrite. Reducing agents, such as erythorbate or ascorbic acid, increase the reaction rate during curing and have also been shown to improve color stability in raw ground beef (2016 Nebraska Beef Report pp.158– 160). The objective of this study was to determine the effects of differences in myoglobin state created by ingredient and packaging conditions and HPP treatment on the color stability of ground beef patties.
Procedure
Patty preparation
Boneless, denuded USDA Select beef top rounds were ground through 1/2 in and 1/8 inch grinding plates, and subdivided into 5 lb batches for each of six treatments. The fine ground beef was mixed using a commercial kneader- mixer (RM- 20, Manica USA, St. Louis, MO) with the following ingredients to convert myoglobin to different nitrosylmyoglobin states with or without the addition of reducing com-pounds (sodium erythorbate or ascorbic acid from cherry powder). The treatments (T1- T6) are as follows:
T1: Sodium nitrite 156 ppm/vacuum pack-aging (VP; anaerobic packaging)
T2: Sodium nitrite 156 ppm + Sodium erythorbate 547 ppm / VP
Jhinuk GuptaChad G. Bower
George A. CavenderGary A. Sullivan
Summary with Implications
High pressure processing is a non- thermal pasteurization technique to control patho-gens, like E. coli. However, color changes in raw beef induced by processing restrict high pressure processing’s use within the beef industry. The objectives of this study were to investigate the effects of adding curing agents (nitrite) and packaging with or without reducing compounds (ascorbic acid/erythorbate) on color retention in high pressure processed ground beef. High pressure processing resulted in a detrimental effect on the color of the beef patties for all treatments. Lightness and yellowness increased and red-ness decreased after high pressure processing. The effect remained the same throughout the course of the study (up to 21 days). However, there was less color change in samples treated with reducing compounds. Both inorganic and natural sources of nitrite and ascorbic acid/erythorbate performed similarly in terms of their ability to maintain redness. Treatments leading to formation of nitrosyl-metmyoglobin (Fe3+) had less color change as compared to the treatments leading to the generation of nitrosylmyoglobin (Fe2+).
Introduction
A major challenge faced by the ground beef processors is microbial contamination such as E coli O157:H7 and other Shiga toxin producing E. coli (STEC). Sanitary handling, pre- harvest washing, and spray-ing the carcass with organic acids reduces the risk but does not completely eliminate STEC. In ground beef and other non- intact beef products, STECs are considered an adulterant by the USDA. These products
Effect of Ingredients and Packaging on Color of High Pressure Processed Ground Beef

136 · 2018 Nebraska Beef Cattle Report
different ingredients/packaging on the color parameters. Within a particular day, all six differently treated samples had similar lightness (L*, P > 0.05, except for day 21) and yellowness (b*, P > 0.05, except for day 3 and day 21), but showed differences in redness (a*, P < 0.001). Samples treated with reducing compounds (T2, T4 and T6) showed greater redness (higher a*) than the counterparts without reducing compounds (T1, T3 and T5) and this pattern was main-tained throughout the course of the study. Reduction of oxidized myoglobin (nitrosyl-metmyoglobin) to nitrosylmyoglobin may be responsible for increasing the redness. Among the color parameters evaluated, a* had an interaction of treatment (T1- T6) × HPP effects (P ≤ 0.004) for days 14 and 19 only (data not shown) and b* had an interaction of treatment (T1- T6) × HPP ef-fects (P = 0.012) for days 21. On these days, treatments with reducing compounds had redness values that were more similar to the non- HPP treated control samples than
version 9.4 (SAS Cary, NC) to see the main effects of ingredient/packaging conditions (T1- T6) and HPP treatment and their in-teractions within each day of storage. Treat-ment interaction and main effects were determined using PROC GLIMMIX. When significant interactions or main effects were identified (P ≤ 0.05) , separation of least square means was conducted.
Results
Regardless of the ingredients/pack-aging treatment, HPP had a detrimental effect on the color of the beef patties for all three pressure and time combinations (Table 1). Lightness (L*) and yellowness (b*) increased and redness (a*) decreased (P < 0.001) due to HPP treatment for all days of storage. Within each day, color change with respect to control samples (∆E) was similar (P > 0.05) for all three HPP conditions. Table 2 represents the effect of
HPP and on days 3, 7, 12, 14, 19 and 21 after HPP. A colorimeter (CR- 300, MINOLTA, Japan) was used to determine the instru-mental color which uses diffuse D65 illumi-nation, 8mm viewing port, and 0° viewing angle (specular component included). The system was calibrated to the included white calibration plate covered in the vacuum pouch before analyzing. The average of at least three measurements was taken from the cut surface. Change in color, ΔE, was calculated with respect to the control sam-ples (non- HPP treated) within each of the six treatments, where
ΔE = [(Lf- Li)2 + (af- ai)
2 + (bf- bi)2]1/2
Subscripts i and f represent before and after HPP treatment.
Statistical analyses
Statistical analyses were run on color data (L, a*, b*, ΔE) using SAS software
Table 1. Least square means (± SE) for main effect of high pressure processing on color (L*, a*, b*) and change in color (∆E) during storage of ground beef patties.
Color traits HPP (MPa/ min)
Color values
Day 3 Day 7 Day 12 Day 14 Day 19 Day 21
L* 0/0 40.78±0.48b 42.20±0.34c 43.13±0.30c 43.73±0.38c 42.06±0.43b 43.31±.034c
450/3 53.58±0.50a 54.49±0.36b 54.87±0.31b 55.09±0.39b 55.30±0.45a 55.26±0.36b
600/3 54.53±0.48a 55.62±0.34a 56.66±0.30a 56.2±0.38a 56.45±0.43a 55.61±0.34ab
600/6 53.47±0.48a 55.84±0.34a 55.98±0.30a 56.20±0.38a 56.36±0.43a 56.29±0.34a
P- value <0.001 <0.001 <0.001 <0.001 <0.001 <0.001
a* 0/0 22.50±0.55a 21.98±0.56a 19.46±0.46a 19.33±0.44* 21.04±0.50* 19.39±0.62a
450/3 21.33±0.57ab 18.18±0.58b 16.56±0.48b 14.91±0.46* 16.02±0.52* 16.38±0.64b
600/3 18.17±0.55b 16.35±0.56c 14.31±0.46c 14.67±0.44* 14.62±0.50* 14.68±0.62bc
600/6 20.43±0.55c 15.81±0.56c 14.46±0.46c 14.76±0.44* 13.77±0.50* 13.21±0.62c
P- value <0.001 <0.001 <0.001 <0.001 <0.001 <0.001
b* 0/0 8.95±0.17d 9.50±0.18c 8.70±0.14c 8.34±0.16c 9.20±0.20b 8.90±0.17*
450/3 11.14±0.18c 10.67±0.19b 10.67±0.15b 10.44±0.16b 11.39±0.20a 11.00±0.18*
600/3 11.67±0.17b 11.32±0.18a 11.27±0.14a 11.39±0.16a 11.95±0.20a 11.55±0.17*
600/6 12.34±0.17a 11.12±0.18ab 11.44±0.14a 11.49±0.16a 11.72±0.20a 11.65±0.17*
P- value <0.001 <0.001 <0.001 <0.001 <0.001 <0.001
∆E 450/3 13.14±0.89 13.29±0.54 12.84±0.62 12.95±0.52 15.07±0.73 13.17±0.62
600/3 15.00±0.85 14.90±0.52 14.92±0.59 14.01±0.50 16.54±0.71 13.98±0.60
600/6 13.90±0.85 15.32±0.52 14.34±0.59 14.14±0.50 16.57±0.71 14.94±0.60
P- value 0.322 0.026 0.056 0.209 0.259 0.134a- c LS means in a column and within a color trait with a common superscript are similar (P > 0.05).* Signifies a significant myoglobin state by HPP treatment interaction (P < 0.05) for the color trait within the day.
2018 Nebraska Beef Cattle Report · 137
Table 2. Least square means (± SE) for main effect of myoglobin state (Mb) on color (L*, a*, b*) and change in color (∆E) during storage of ground beef patties.
Color traits Mb state1
Color values
Day 3 Day 7 Day 12 Day 14 Day 19 Day 21
L* T1 50.64±0.62 52.25±0.44 53.55±0.39 53.06±0.49 53.32±0.56 53.40±0.44a
T2 51.17±0.58 52.72±0.42 52.63±0.37 52.83±0.46 51.59±0.53 52.65±0.42a
T3 49.74±0.58 51.61±0.42 52.58±0.37 53.49±0.46 52.49±0.53 52.84±0.42a
T4 50.37±0.58 51.86±0.42 52.09±0.37 52.23±0.46 52.01±0.53 52.28±0.42ab
T5 51.86±0.58 52.08±0.42 53.04±0.37 52.99±0.46 53.63±0.53 53.17±0.42a
T6 49.75±0.58 51.70±0.42 52.07±0.37 52.25±0.46 52.20±0.53 51.37±0.42b
P- value 0.095 0.455 0.065 0.357 0.073 0.023
a* T1 20.51±0.72b 17.28±0.72b 13.42±0.60c 14.49±0.57* 13.99±0.65* 13.88±0.80b
T2 23.29±0.68a 19.94±0.68a 18.34±0.57ab 18.67±0.54* 19.42±0.61* 17.80±0.76a
T3 21.38±0.68ab 17.28±0.68b 14.23±0.57c 13.21±0.54* 14.13±0.61* 14.47±0.76b
T4 23.13±0.68a 20.53±0.68a 19.83±0.57a 19.23±0.54* 18.90±0.61* 18.14±0.76a
T5 14.31±0.68c 14.45±0.68c 13.71±0.57c 12.50±0.54* 13.20±0.61* 13.28±0.76b
T6 21.03±0.68b 19.00±0.68ab 17.65±0.57b 17.42±0.54* 18.52±0.61* 17.93±0.76a
P- value <0.001 <0.001 <0.001 <0.001 <0.001 <0.001
b* T1 11.00±0.23a 10.47±0.24 10.41±0.18 10.60±0.20 11.52±0.25 11.27±0.22*
T2 11.34±0.21a 10.88±0.23 10.58±0.17 10.33±0.19 10.89±0.24 10.10±0.21*
T3 11.45±0.21a 10.72±0.23 10.42±0.17 10.26±0.19 11.51±0.24 10.89±0.21*
T4 11.48±0.21a 10.97±0.23 10.84±0.17 10.59±0.19 10.70±0.24 10.39±0.21*
T5 9.91±0.21b 10.46±0.23 10.39±0.17 10.41±0.19 11.06±0.24 11.42±0.21*
T6 10.96±0.21a 10.41±0.23 10.47±0.17 10.31±0.19 10.71±0.24 10.60±0.21*
P- value <0.001 0.362 0.431 0.724 0.056 <0.001
∆E T1 14.10±1.30 14.03±0.79ab 13.3±0.90bc 14.54±0.76b 18.75±1.08a 16.85±0.91a
T2 12.49±1.20 12.24±0.73b 12.46±0.84c 12.28±0.70c 16.07±1.00ab 13.13±0.84bc
T3 12.65±1.20 15.97±0.73a 15.20±0.84ab 17.60±0.70a 16.63±1.00ab 13.80±0.84b
T4 13.88±1.20 14.17±0.73ab 13.08±0.84bc 11.78±0.70c 15.29±1.00bc 14.25±0.84b
T5 13.36±1.20 15.26±0.73a 16.51±0.84a 13.34±0.70bc 16.56±1.00ab 14.92±0.84ab
T6 17.61±1.20 15.34±0.73a 13.67±0.84bc 12.65±0.70bc 13.05±1.00c 11.24±0.84c
P- value 0.055 0.015 0.015 <0.001 0.015 0.003a- c LS means in a column and within a color trait with a common superscript are similar (P > 0.05).* Signifies a significant myoglobin state by HPP treatment interaction (P < 0.05) for the color trait within the day.1 T1: Sodium nitrite 156 ppm / vacuum packaging (VP; anaerobic packaging); T2: Sodium nitrite 156 ppm + Sodium erythorbate 547 ppm / VP; T3: Celery juice powder to add 100 ppm sodium
nitrite equivalent / VP; T4: Celery juice powder (equivalent to 100 ppm nitrite) + 0.43% cherry powder to add 469 ppm ascorbic acid) / VP; T5: Sodium nitrite 156 ppm/ oxygen permeable wrap (OPW; aerobic packaging); T6: Sodium nitrite 156 ppm + Sodium erythorbate 547 ppm / OPW.
138 · 2018 Nebraska Beef Cattle Report
ed with HPP treatment of ground beef. The use of HPP provides potential to reduce the risk of E. coli O157:H7 and other STECs. These findings may allow processors to progress toward development of technol-ogies that allow for the HPP treatment of raw ground beef without the negative color changes typically associated with the appli-cation of HPP.
Jhinuk Gupta, postdoc, Food Science and Technology, Lincoln
Chad G. Bower, graduate student, Animal Science, Lincoln
George A. Cavender, assistant professor, Food Science and Technology, University of Georgia, Athens, GA
Gary A. Sullivan, assistant professor, Animal Science, Lincoln
fact that nitrosylmetmyoglobin in T5 had already oxidized and it started with less red color. The ∆E of T6 was significantly higher than ∆E of T2 immediately after HPP but gradually decreased during storage. This signifies that T6 changes color after HPP, but color changes lessened during shelf storage. This is most likely due to the reduction of nitrosylmetmyoglobin (brown) to nitrosylmyoglobin (red) by sodium ery-thorbate. In the absence of reducing agents (T1 vs T5), the ∆E was similar throughout the course of the study.
Conclusions
While the addition of nitrite compounds alone did not stabilize ground beef color during HPP treatment, reducing com-pounds decrease the color change associat-
treatments without reducing compounds which matches the significant main effect identified for a* for all other days. On day 21, HPP treated samples were more yellow than non- HPP treated samples. Others have reported that the addition of antioxidants containing cherry powder, a natural source of ascorbic acid, to ground beef resulted in greater red color in patties in simulated retail display (2016 Nebraska Beef Report pp. 158– 160). Similar a* values of T2 and T4 within a particular day signifies that both inorganic and plant based sources of nitrite and reducing compounds had a similar in-fluence on color. T1 had significantly higher a* than T5 on day 3, but the difference became less profound during storage. Al-though immediately after HPP, nitrosylmy-oglobin is more red, it became less red and approached that of T5, likely due to the
2018 Nebraska Beef Cattle Report · 139
© The Board Regents of the University of Nebraska. All rights reserved.
subjective color panel. Ground beef color L*, a*, and b*, was measured daily by reflec-tance with a Konica- Minolta colorimeter.
Statistical Analysis
Data were analyzed using SAS 9.2 PROC GLIMMIX procedures with the model statement including treatment, retail dis-play day, and the interaction between them. Tukey’s adjustment for LSmeans separation with P< 0.05 was applied.
Results
Ground beef quality measures of TPC, lipid oxidation, pH, and percent discolor-ation had a significant interaction between treatment and day of display (P<0.001), therefore LSmeans were separated across treatments and days of display.
On days 0 and 1, all treatments were similar for TPC (total colony forming units/gram (CFU/g). However, on days 3, 5, and 7 of display, the ground beef TPC (CFU/g) for LA3m was lower (P< 0.05) than CON and PA15s (Table 1). In addition, ground beef lipid oxidation (mg malonaldehyde/kg tissue) was higher (P< 0.05) for LA3m than both PA15s and PA3m on day 3, and was also higher (P< 0.05) than CON on day 5, as well as PA15s and PA3m on day 5 and 7 (Table 2). Perhaps TPC and lipid oxidation were impacted by ground beef pH as the meat pH from LA3m was lower (P< 0.05) than ground beef control treatments on days 0, 1, and 3 (pH=5.25 vs 5.81; 5.32 vs 5.76; 5.21 vs 5.58; respectively for LA3m vs CON on d 0, 1, and 3).
Visual percent discoloration increased for all treatments (from 0% to 100%) during retail display, with a rapid change from day 3 to day 5 of display. On days 3, 4, and 5, percent discoloration scores of ground beef from LA3m treatments were higher (P< 0.05) as compared to scores for ground beef from PA3m (Table 3). In addition, ground beef percent discoloration for the PA3m treatment on days 3 and 4 was different
maximum concentrations, to determine the effects on ground beef quality during retail display.
Procedures
Study Design
Two organic acids, lactic acid and peroxyacetic acid, were used to dip beef shoulder clod pieces (approximately 62 in2 surface area). Five beef shoulder clods were fabricated into smaller pieces (approximate-ly 2.5 lbs). Shoulder clod pieces (lean trim) were randomly assigned to one of 5 treat-ments with a target of 12 pounds per treat-ment. Four treatments used shoulder clod pieces dipped for either 15 seconds (15s) or 3 minutes (3m) using either 4.5% lactic acid (LA) or 380 ppm peroxyacetic acid (PA) at 72°F. The fifth treatment (negative con-trol; CON) used shoulder clod pieces not dipped in an organic acid. Shoulder clod pieces from each treatment were ground (0.5 in coarse, 0.25 in fine) and formed into one- pound blocks using a Colosimo press. The ground beef blocks were overwrapped with an oxygen permeable film and placed in retail display (approximately 36.8°F) for 7 days. On days 0, 1, 3, 5, and 7, ground beef samples were collected for each treatment group to determine total aerobic plate count (TPC), pH, and lipid oxidation (TBARS). The ground beef percentage discoloration (% discoloration) and L*, a*, and b* color was evaluated daily during retail display. Six replications were conducted.
Quality Characteristic Analysis
Total aerobic bacteria plate count was determined using standard procedures for Aerobic Count Plate PetrifilmsTM. Ground beef pH was measured with a pH meter us-ing 10g of powdered ground beef combined with 90mL deionized water. Lipid oxidation analysis used procedures for the determina-tion of malonaldehyde content. Percentage discoloration was determined daily with a
Ashley R. McCoyDennis E. BursonGary A. Sullivan
Summary with Implications
Small business meat processors can use organic acid antimicrobial interventions to control Shiga toxin- producing E. coli (STEC) when producing ground beef; however, many small producers are concerned about the impact on ground beef quality. The effects of two commonly used organic acids, lactic acid and peroxyacetic acid, were evaluated at short (15 seconds) or extended (3 minutes) raw material dip times on ground beef quali-ty parameters. Beef trim dipped in lactic acid for 3 minutes had a reduction in total aerobic bacteria plate count, but also increased ground beef discoloration and lipid oxidation during retail display. Use of a shorter dip time showed minimal differences in ground beef quality compared to untreated controls. In addition, dipping lean trim in peroxy-acetic acid for 3 minutes slowed ground beef discoloration during display. Therefore, pro-cessors should consider either type of organic acid, and the length of lean trim exposure to organic acid during dipping, to optimize shelf life quality attributes.
Introduction
Organic acid antimicrobial interventions are used to reduce Shiga toxin- producing E. coli (STEC) in ground beef, however, the use of organic acids can impact ground beef quality during retail display. One appli-cation method is dipping pieces of meat into organic acids for a set length of time. With dipping, processors that do not follow correct operating procedures for interven-tions may impact ground beef quality. The purpose of this study was to compare an abusive dipping time versus a recommend-ed time, using concentrations of acid near
Antimicrobial Interventions and Application Time Effects on Ground Beef Quality
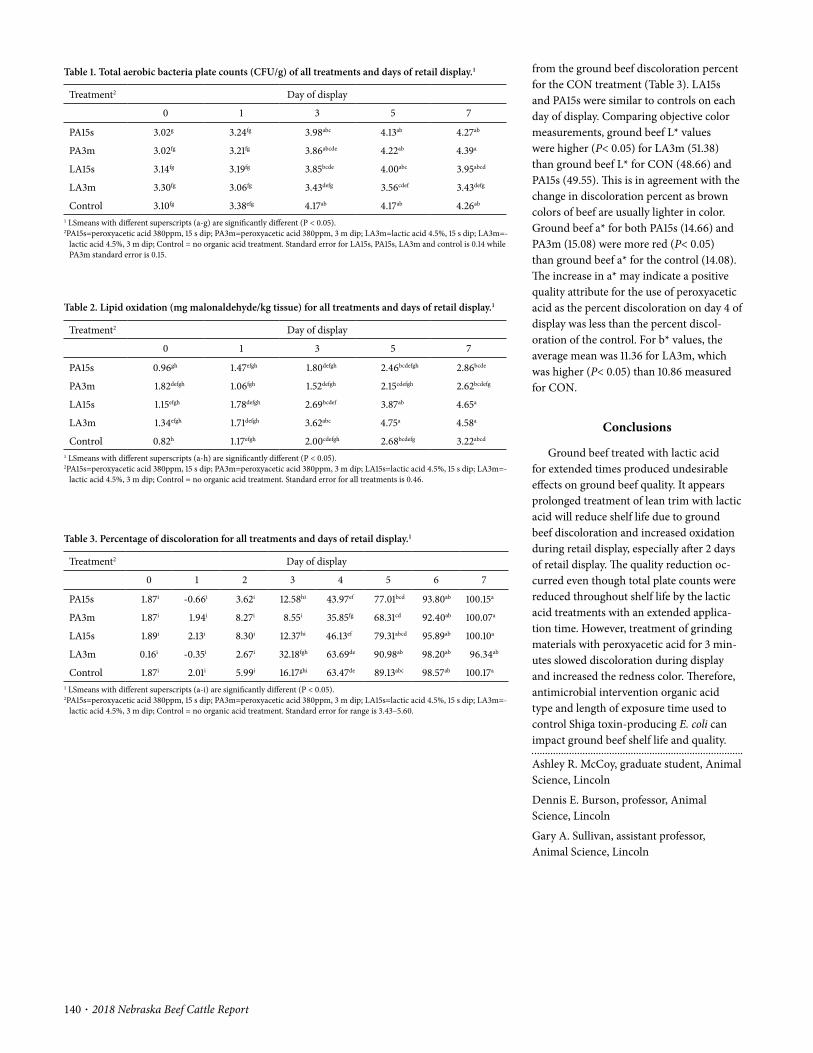
140 · 2018 Nebraska Beef Cattle Report
from the ground beef discoloration percent for the CON treatment (Table 3). LA15s and PA15s were similar to controls on each day of display. Comparing objective color measurements, ground beef L* values were higher (P< 0.05) for LA3m (51.38) than ground beef L* for CON (48.66) and PA15s (49.55). This is in agreement with the change in discoloration percent as brown colors of beef are usually lighter in color. Ground beef a* for both PA15s (14.66) and PA3m (15.08) were more red (P< 0.05) than ground beef a* for the control (14.08). The increase in a* may indicate a positive quality attribute for the use of peroxyacetic acid as the percent discoloration on day 4 of display was less than the percent discol-oration of the control. For b* values, the average mean was 11.36 for LA3m, which was higher (P< 0.05) than 10.86 measured for CON.
Conclusions
Ground beef treated with lactic acid for extended times produced undesirable effects on ground beef quality. It appears prolonged treatment of lean trim with lactic acid will reduce shelf life due to ground beef discoloration and increased oxidation during retail display, especially after 2 days of retail display. The quality reduction oc-curred even though total plate counts were reduced throughout shelf life by the lactic acid treatments with an extended applica-tion time. However, treatment of grinding materials with peroxyacetic acid for 3 min-utes slowed discoloration during display and increased the redness color. Therefore, antimicrobial intervention organic acid type and length of exposure time used to control Shiga toxin- producing E. coli can impact ground beef shelf life and quality.
Ashley R. McCoy, graduate student, Animal Science, Lincoln
Dennis E. Burson, professor, Animal Science, Lincoln
Gary A. Sullivan, assistant professor, Animal Science, Lincoln
Table 1. Total aerobic bacteria plate counts (CFU/g) of all treatments and days of retail display.1
Treatment2 Day of display
0 1 3 5 7
PA15s 3.02g 3.24fg 3.98abc 4.13ab 4.27ab
PA3m 3.02fg 3.21fg 3.86abcde 4.22ab 4.39a
LA15s 3.14fg 3.19fg 3.85bcde 4.00abc 3.95abcd
LA3m 3.30fg 3.06fg 3.43defg 3.56cdef 3.43defg
Control 3.10fg 3.38efg 4.17ab 4.17ab 4.26ab
1 LSmeans with different superscripts (a- g) are significantly different (P < 0.05).2PA15s=peroxyacetic acid 380ppm, 15 s dip; PA3m=peroxyacetic acid 380ppm, 3 m dip; LA3m=lactic acid 4.5%, 15 s dip; LA3m=-
lactic acid 4.5%, 3 m dip; Control = no organic acid treatment. Standard error for LA15s, PA15s, LA3m and control is 0.14 while PA3m standard error is 0.15.
Table 2. Lipid oxidation (mg malonaldehyde/kg tissue) for all treatments and days of retail display.1
Treatment2 Day of display
0 1 3 5 7
PA15s 0.96gh 1.47efgh 1.80defgh 2.46bcdefgh 2.86bcde
PA3m 1.82defgh 1.06fgh 1.52defgh 2.15cdefgh 2.62bcdefg
LA15s 1.15efgh 1.78defgh 2.69bcdef 3.87ab 4.65a
LA3m 1.34efgh 1.71defgh 3.62abc 4.75a 4.58a
Control 0.82h 1.17efgh 2.00cdefgh 2.68bcdefg 3.22abcd
1 LSmeans with different superscripts (a- h) are significantly different (P < 0.05).2PA15s=peroxyacetic acid 380ppm, 15 s dip; PA3m=peroxyacetic acid 380ppm, 3 m dip; LA15s=lactic acid 4.5%, 15 s dip; LA3m=-
lactic acid 4.5%, 3 m dip; Control = no organic acid treatment. Standard error for all treatments is 0.46.
Table 3. Percentage of discoloration for all treatments and days of retail display.1
Treatment2 Day of display
0 1 2 3 4 5 6 7
PA15s 1.87i - 0.66i 3.62i 12.58hi 43.97ef 77.01bcd 93.80ab 100.15a
PA3m 1.87i 1.94i 8.27i 8.55i 35.85fg 68.31cd 92.40ab 100.07a
LA15s 1.89i 2.13i 8.30i 12.37hi 46.13ef 79.31abcd 95.89ab 100.10a
LA3m 0.16i - 0.35i 2.67i 32.18fgh 63.69de 90.98ab 98.20ab 96.34ab
Control 1.87i 2.01i 5.99i 16.17ghi 63.47de 89.13abc 98.57ab 100.17a
1 LSmeans with different superscripts (a- i) are significantly different (P < 0.05).2PA15s=peroxyacetic acid 380ppm, 15 s dip; PA3m=peroxyacetic acid 380ppm, 3 m dip; LA15s=lactic acid 4.5%, 15 s dip; LA3m=-
lactic acid 4.5%, 3 m dip; Control = no organic acid treatment. Standard error for range is 3.43– 5.60.
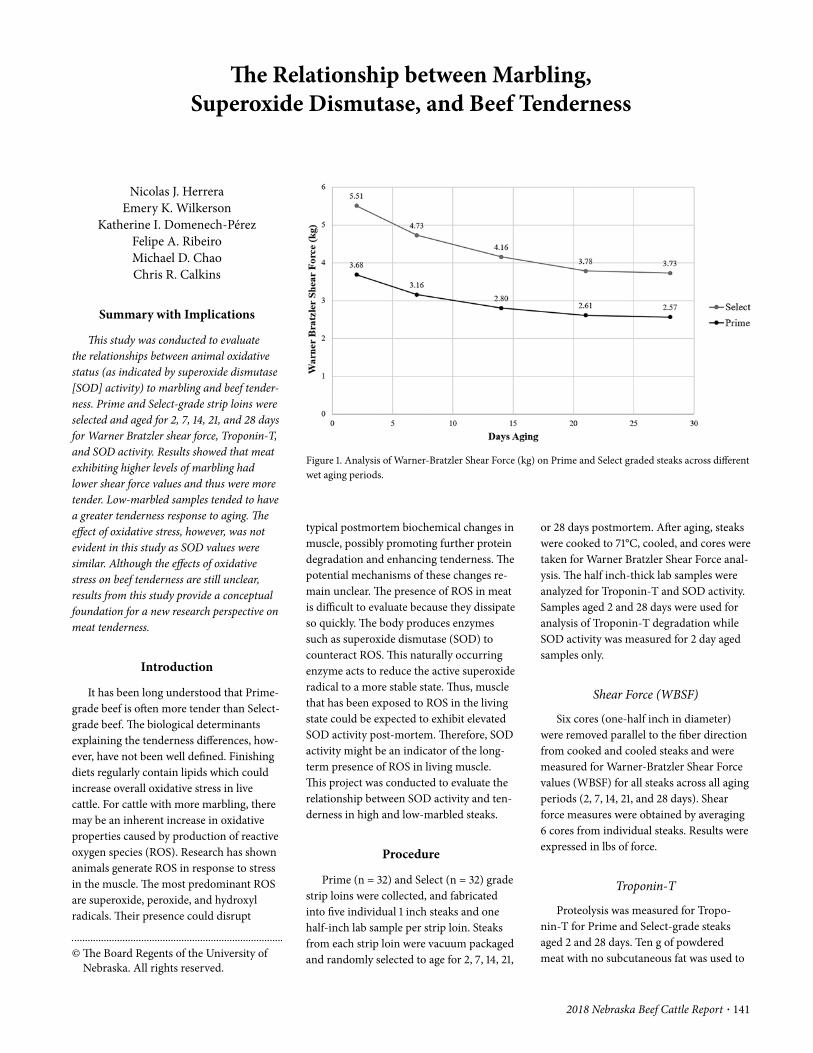
2018 Nebraska Beef Cattle Report · 141
© The Board Regents of the University of Nebraska. All rights reserved.
or 28 days postmortem. After aging, steaks were cooked to 71°C, cooled, and cores were taken for Warner Bratzler Shear Force anal-ysis. The half inch- thick lab samples were analyzed for Troponin- T and SOD activity. Samples aged 2 and 28 days were used for analysis of Troponin- T degradation while SOD activity was measured for 2 day aged samples only.
Shear Force (WBSF)
Six cores (one- half inch in diameter) were removed parallel to the fiber direction from cooked and cooled steaks and were measured for Warner- Bratzler Shear Force values (WBSF) for all steaks across all aging periods (2, 7, 14, 21, and 28 days). Shear force measures were obtained by averaging 6 cores from individual steaks. Results were expressed in lbs of force.
Troponin- T
Proteolysis was measured for Tropo-nin- T for Prime and Select- grade steaks aged 2 and 28 days. Ten g of powdered meat with no subcutaneous fat was used to
typical postmortem biochemical changes in muscle, possibly promoting further protein degradation and enhancing tenderness. The potential mechanisms of these changes re-main unclear. The presence of ROS in meat is difficult to evaluate because they dissipate so quickly. The body produces enzymes such as superoxide dismutase (SOD) to counteract ROS. This naturally occurring enzyme acts to reduce the active superoxide radical to a more stable state. Thus, muscle that has been exposed to ROS in the living state could be expected to exhibit elevated SOD activity post- mortem. Therefore, SOD activity might be an indicator of the long- term presence of ROS in living muscle. This project was conducted to evaluate the relationship between SOD activity and ten-derness in high and low- marbled steaks.
Procedure
Prime (n = 32) and Select (n = 32) grade strip loins were collected, and fabricated into five individual 1 inch steaks and one half- inch lab sample per strip loin. Steaks from each strip loin were vacuum packaged and randomly selected to age for 2, 7, 14, 21,
Nicolas J. HerreraEmery K. Wilkerson
Katherine I. Domenech- PérezFelipe A. RibeiroMichael D. ChaoChris R. Calkins
Summary with Implications
This study was conducted to evaluate the relationships between animal oxidative status (as indicated by superoxide dismutase [SOD] activity) to marbling and beef tender-ness. Prime and Select- grade strip loins were selected and aged for 2, 7, 14, 21, and 28 days for Warner Bratzler shear force, Troponin- T, and SOD activity. Results showed that meat exhibiting higher levels of marbling had lower shear force values and thus were more tender. Low- marbled samples tended to have a greater tenderness response to aging. The effect of oxidative stress, however, was not evident in this study as SOD values were similar. Although the effects of oxidative stress on beef tenderness are still unclear, results from this study provide a conceptual foundation for a new research perspective on meat tenderness.
Introduction
It has been long understood that Prime- grade beef is often more tender than Select- grade beef. The biological determinants explaining the tenderness differences, how-ever, have not been well defined. Finishing diets regularly contain lipids which could increase overall oxidative stress in live cattle. For cattle with more marbling, there may be an inherent increase in oxidative properties caused by production of reactive oxygen species (ROS). Research has shown animals generate ROS in response to stress in the muscle. The most predominant ROS are superoxide, peroxide, and hydroxyl radicals. Their presence could disrupt
The Relationship between Marbling, Superoxide Dismutase, and Beef Tenderness
Figure 1. Analysis of Warner- Bratzler Shear Force (kg) on Prime and Select graded steaks across different wet aging periods.
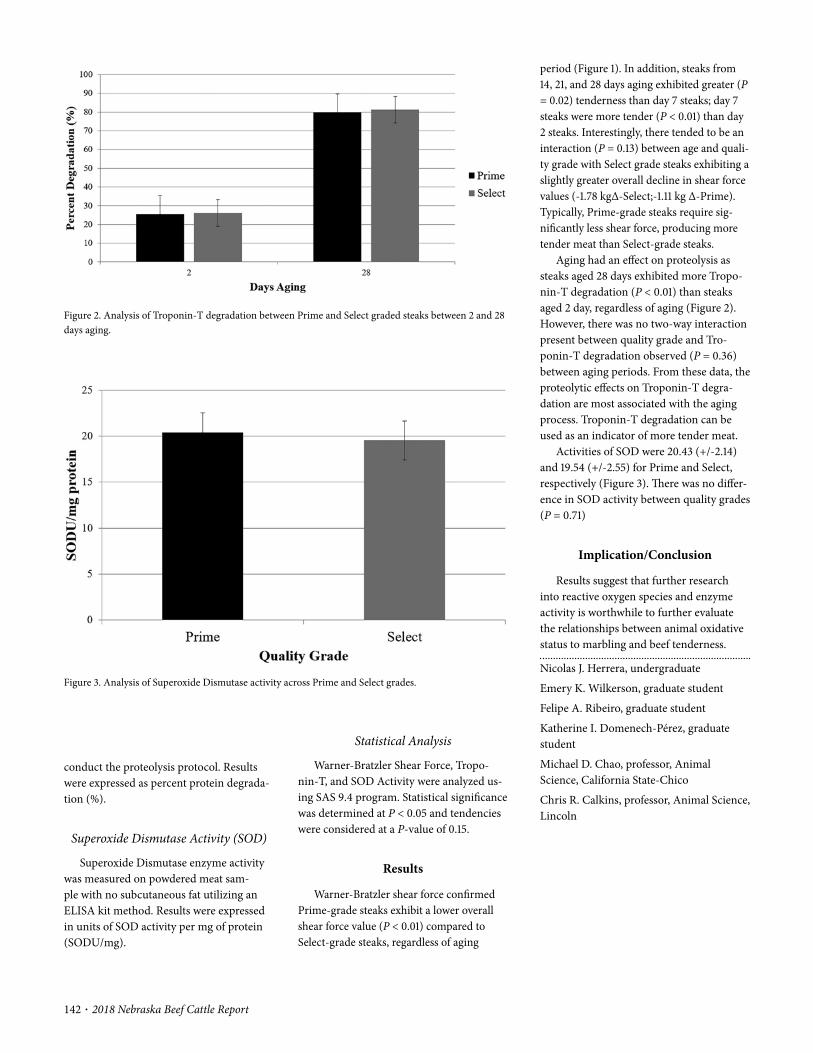
142 · 2018 Nebraska Beef Cattle Report
period (Figure 1). In addition, steaks from 14, 21, and 28 days aging exhibited greater (P = 0.02) tenderness than day 7 steaks; day 7 steaks were more tender (P < 0.01) than day 2 steaks. Interestingly, there tended to be an interaction (P = 0.13) between age and quali-ty grade with Select grade steaks exhibiting a slightly greater overall decline in shear force values (- 1.78 kgΔ- Select;- 1.11 kg Δ- Prime). Typically, Prime- grade steaks require sig-nificantly less shear force, producing more tender meat than Select- grade steaks.
Aging had an effect on proteolysis as steaks aged 28 days exhibited more Tropo-nin- T degradation (P < 0.01) than steaks aged 2 day, regardless of aging (Figure 2). However, there was no two- way interaction present between quality grade and Tro-ponin- T degradation observed (P = 0.36) between aging periods. From these data, the proteolytic effects on Troponin- T degra-dation are most associated with the aging process. Troponin- T degradation can be used as an indicator of more tender meat.
Activities of SOD were 20.43 (+/- 2.14) and 19.54 (+/- 2.55) for Prime and Select, respectively (Figure 3). There was no differ-ence in SOD activity between quality grades (P = 0.71)
Implication/Conclusion
Results suggest that further research into reactive oxygen species and enzyme activity is worthwhile to further evaluate the relationships between animal oxidative status to marbling and beef tenderness.
Nicolas J. Herrera, undergraduate
Emery K. Wilkerson, graduate student
Felipe A. Ribeiro, graduate student
Katherine I. Domenech- Pérez, graduate student
Michael D. Chao, professor, Animal Science, California State- Chico
Chris R. Calkins, professor, Animal Science, Lincoln
Statistical Analysis
Warner- Bratzler Shear Force, Tropo-nin- T, and SOD Activity were analyzed us-ing SAS 9.4 program. Statistical significance was determined at P < 0.05 and tendencies were considered at a P- value of 0.15.
Results
Warner- Bratzler shear force confirmed Prime- grade steaks exhibit a lower overall shear force value (P < 0.01) compared to Select- grade steaks, regardless of aging
conduct the proteolysis protocol. Results were expressed as percent protein degrada-tion (%).
Superoxide Dismutase Activity (SOD)
Superoxide Dismutase enzyme activity was measured on powdered meat sam-ple with no subcutaneous fat utilizing an ELISA kit method. Results were expressed in units of SOD activity per mg of protein (SODU/mg).
Figure 2. Analysis of Troponin- T degradation between Prime and Select graded steaks between 2 and 28 days aging.
Figure 3. Analysis of Superoxide Dismutase activity across Prime and Select grades.
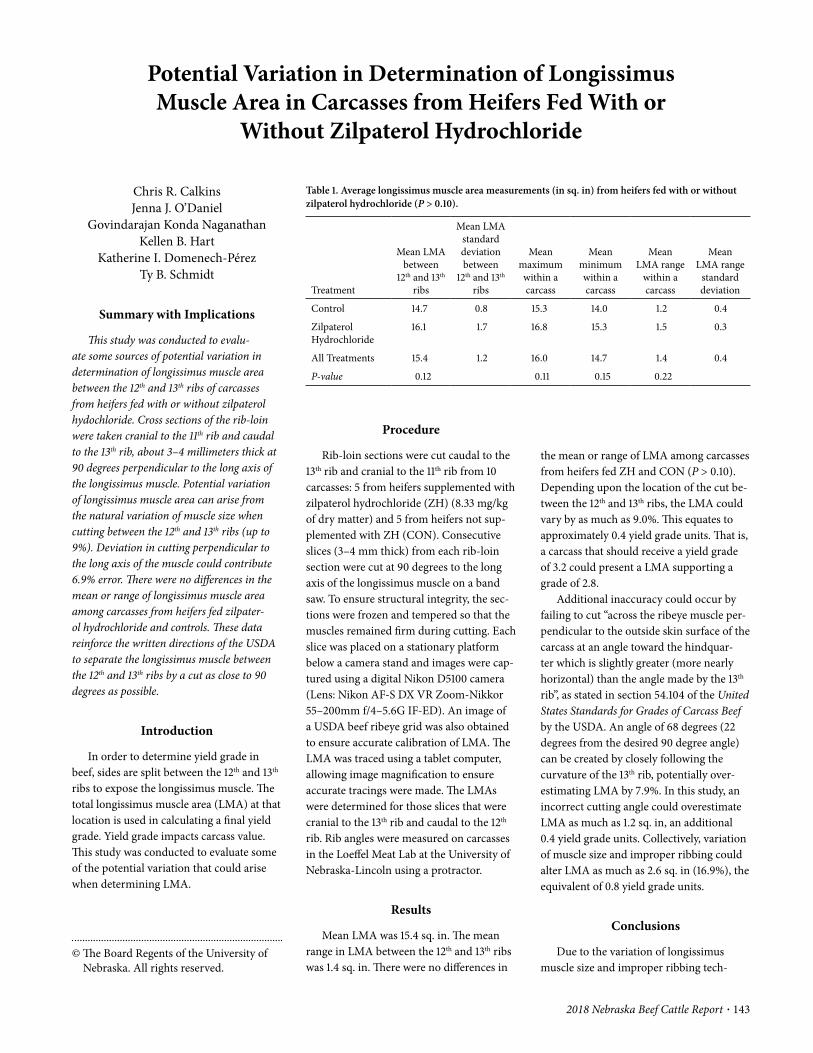
2018 Nebraska Beef Cattle Report · 143
© The Board Regents of the University of Nebraska. All rights reserved.
the mean or range of LMA among carcasses from heifers fed ZH and CON (P > 0.10). Depending upon the location of the cut be-tween the 12th and 13th ribs, the LMA could vary by as much as 9.0%. This equates to approximately 0.4 yield grade units. That is, a carcass that should receive a yield grade of 3.2 could present a LMA supporting a grade of 2.8.
Additional inaccuracy could occur by failing to cut “across the ribeye muscle per-pendicular to the outside skin surface of the carcass at an angle toward the hindquar-ter which is slightly greater (more nearly horizontal) than the angle made by the 13th rib”, as stated in section 54.104 of the United States Standards for Grades of Carcass Beef by the USDA. An angle of 68 degrees (22 degrees from the desired 90 degree angle) can be created by closely following the curvature of the 13th rib, potentially over-estimating LMA by 7.9%. In this study, an incorrect cutting angle could overestimate LMA as much as 1.2 sq. in, an additional 0.4 yield grade units. Collectively, variation of muscle size and improper ribbing could alter LMA as much as 2.6 sq. in (16.9%), the equivalent of 0.8 yield grade units.
Conclusions
Due to the variation of longissimus muscle size and improper ribbing tech-
Procedure
Rib- loin sections were cut caudal to the 13th rib and cranial to the 11th rib from 10 carcasses: 5 from heifers supplemented with zilpaterol hydrochloride (ZH) (8.33 mg/kg of dry matter) and 5 from heifers not sup-plemented with ZH (CON). Consecutive slices (3– 4 mm thick) from each rib- loin section were cut at 90 degrees to the long axis of the longissimus muscle on a band saw. To ensure structural integrity, the sec-tions were frozen and tempered so that the muscles remained firm during cutting. Each slice was placed on a stationary platform below a camera stand and images were cap-tured using a digital Nikon D5100 camera (Lens: Nikon AF- S DX VR Zoom- Nikkor 55– 200mm f/4– 5.6G IF- ED). An image of a USDA beef ribeye grid was also obtained to ensure accurate calibration of LMA. The LMA was traced using a tablet computer, allowing image magnification to ensure accurate tracings were made. The LMAs were determined for those slices that were cranial to the 13th rib and caudal to the 12th rib. Rib angles were measured on carcasses in the Loeffel Meat Lab at the University of Nebraska- Lincoln using a protractor.
Results
Mean LMA was 15.4 sq. in. The mean range in LMA between the 12th and 13th ribs was 1.4 sq. in. There were no differences in
Chris R. CalkinsJenna J. O’Daniel
Govindarajan Konda NaganathanKellen B. Hart
Katherine I. Domenech- PérezTy B. Schmidt
Summary with Implications
This study was conducted to evalu-ate some sources of potential variation in determination of longissimus muscle area between the 12th and 13th ribs of carcasses from heifers fed with or without zilpaterol hydochloride. Cross sections of the rib- loin were taken cranial to the 11th rib and caudal to the 13th rib, about 3– 4 millimeters thick at 90 degrees perpendicular to the long axis of the longissimus muscle. Potential variation of longissimus muscle area can arise from the natural variation of muscle size when cutting between the 12th and 13th ribs (up to 9%). Deviation in cutting perpendicular to the long axis of the muscle could contribute 6.9% error. There were no differences in the mean or range of longissimus muscle area among carcasses from heifers fed zilpater-ol hydrochloride and controls. These data reinforce the written directions of the USDA to separate the longissimus muscle between the 12th and 13th ribs by a cut as close to 90 degrees as possible.
Introduction
In order to determine yield grade in beef, sides are split between the 12th and 13th ribs to expose the longissimus muscle. The total longissimus muscle area (LMA) at that location is used in calculating a final yield grade. Yield grade impacts carcass value. This study was conducted to evaluate some of the potential variation that could arise when determining LMA.
Potential Variation in Determination of Longissimus Muscle Area in Carcasses from Heifers Fed With or
Without Zilpaterol Hydrochloride
Table 1. Average longissimus muscle area measurements (in sq. in) from heifers fed with or without zilpaterol hydrochloride (P > 0.10).
Treatment
Mean LMA between
12th and 13th ribs
Mean LMA standard deviation between
12th and 13th ribs
Mean maximum within a carcass
Mean minimum within a carcass
Mean LMA range
within a carcass
Mean LMA range
standard deviation
Control 14.7 0.8 15.3 14.0 1.2 0.4
Zilpaterol Hydrochloride
16.1 1.7 16.8 15.3 1.5 0.3
All Treatments 15.4 1.2 16.0 14.7 1.4 0.4
P- value 0.12 0.11 0.15 0.22
144 · 2018 Nebraska Beef Cattle Report
Acknowledgment
Chris Calkins has disclosed a significant financial interest in TenderSpec, LLC. The University of Nebraska- Lincoln’s Conflict of Interest in Research Committee had deter-mined that this must be disclosed.
Chris R. Calkins, professor, Animal Science, Lincoln
Jenna J. O’Daniel, TenderSpec, LLC, Lincoln, NE
nique, LMA could vary by as much as 16.9%. These data reinforce the written directions of the USDA to separate the longissimus muscle between the 12th and 13th ribs by a cut as close to 90 degrees as possi-ble. Feeding ZH to heifers had no effect on LMA variation between the 12th and 13th ribs in this study.
Govindarajan Konda Naganathan, courtesy assistant professor, Biological Systems Engineering, Lincoln
Kellen B. Hart, graduate student
Katherine I. Domenech- Pérez, University of Puerto Rico- Mayagüez, Mayagüez, Puerto Rico
Ty B. Schmidt, assistant professor, Animal Science, Lincoln
2018 Nebraska Beef Cattle Report · 145
© The Board Regents of the University of Nebraska. All rights reserved.
Impact of Dietary Fat Source on Beef Display Life
Felipe A. RibeiroKatherine I. Domenech- Pérez
Emery K. WilkersonHope Voegele
Nicolas J. HerreraKellen B. Hart
Chris R. Calkins
Summary with Implications
This study was conducted to evaluate the effects of dietary fat source with modified distillers grains plus solubles (MDGS) on beef display life. Steers were fed either a corn control, full- fat MDGS, de- oiled MDGS, or de- oiled MDGS plus corn oil diet. Strip loins were aged for 2, 9, 16 and 23 days and placed under retail conditions for 7 days. Results suggest that feeding MDGS to cattle increases polyunsaturated fatty acid content of beef and has the potential to reduce beef color and lipid stability in comparison to corn diets. These data indicate that feeding MDGS to cattle may decrease beef display life. Addition of corn oil to de- oiled MDGS decreased redness and increased discolor-ation and lipid oxidation in comparison to corn control diets.
Introduction
Byproducts of ethanol fuel production from corn have provided greater amounts of distillers grains for cattle feeding in Nebraska. Feeding distillers grains to cattle increases the concentration of polyunsatu-rated fatty acids (PUFA) in meat and con-sequently, can increase lipid and myoglobin oxidation. Increased lipid and myoglobin oxidation, can lead to off- flavor develop-ment and discoloration of beef, resulting in reduced display shelf life. As ethanol plants look for ways to extract more value from distillers grains, the feed value of the byproduct is changing. Improved extraction technologies in the ethanol industry have
allowed for the increased removal of corn oil from distillers grains with solubles, reducing its fat content. There is an interest in adding the oil back to de- oiled MDGS when economically feasible. However, the effects of adding corn oil to de- oiled modi-fied distillers grains plus solubles (MDGS) on beef display life are still unknown. A deeper insight of the effects of the corn oil addition could help improve beef shelf- life and the way cattle are fed in Nebraska. Therefore, this study was conducted to determine the effect of feeding different dietary fat sources with MDGS on beef display life.
Procedure
A total of 256 steers were allocated in 32 pens (8 head/pen) and fed for 134 d on either a corn control, 40% full- fat MDGS, 40% de- oiled MDGS, or 38% de- oiled MDGS plus 2% corn oil diet. Strip loins from 24 USDA Choice carcasses (3head/pen) were randomly selected within each dietary treatment and strip loins from both sides were collected. Then, both loins per animal were divided in half, and each of the four sections was randomly assigned to one of the four aging periods (2, 9, 16, or 23 d).. After aging (1°C), loins sections were trimmed of subcutaneous fat, and fabri-cated into three steaks (2.54 cm thickness) for fatty acid profile, objective color, visual discoloration, and lipid oxidation [1 steak for objective color and discoloration, 1 steak was split in half for fatty acid profile and lipid oxidation for 0 d retail display (RD), 1 steak was split in half for 4 and 7 d RD lipid oxidation]. After fabrication, steaks used for color analysis and lipid oxidation were placed on foam trays, overwrapped with oxygen permeable film and placed under retail display conditions for 7 d at 3°C. The same fabrication scheme was used at 9, 16 and 23 d postmortem, with the exception of fatty acids profile, which was analyzed only at d 2 postmortem.
Fatty acid profile
One g of powered strip loin steak with no subcutaneous fat was analyzed using gas chromatography. Fatty acids were separat-ed using a Chrompack CP- Sil 88 capillary column and identified by their retention times in relation to known commercial standards. The percentage of fatty acids was determined by the peak areas in the chromatograph. Then, values were adjusted according to percent fat in the tissue and converted to mg/100 g tissue.
Lipid oxidation (TBARS)
Thiobarbituric acid reactive substance values (TBARS) were measured for all aging periods at 0, 4 and 7 d of display. Five g of powdered strip loin steak with no subcuta-neous fat was used to conduct the TBARS protocol. Results were expressed in mg of malonaldehyde per kg of muscle tissue.
Color measurements
Objective color was measured daily during retail display for 7 d with a Minolta Colorimeter (CR- 400, Minolta Camera Company, Osaka, Japan). Color measures were obtained by averaging 6 readings from different areas of the steak surface. The CIE L*, a*, and b* values correspond to lightness, redness and yellowness, respec-tively. Visual discoloration was evaluated daily by a panel of 5 trained panelists using a percentage scale where 0% meant no discoloration and 100% meant complete surface discoloration.
Statistical Analysis
Fatty acid profile was analyzed as a completely randomized design. The TBARS data were analyzed as a split- split plot design with dietary treatment as the whole- plot, aging period as the split- plot and d of retail display as the split- split plot. Color data were analyzed as a split- split- plot
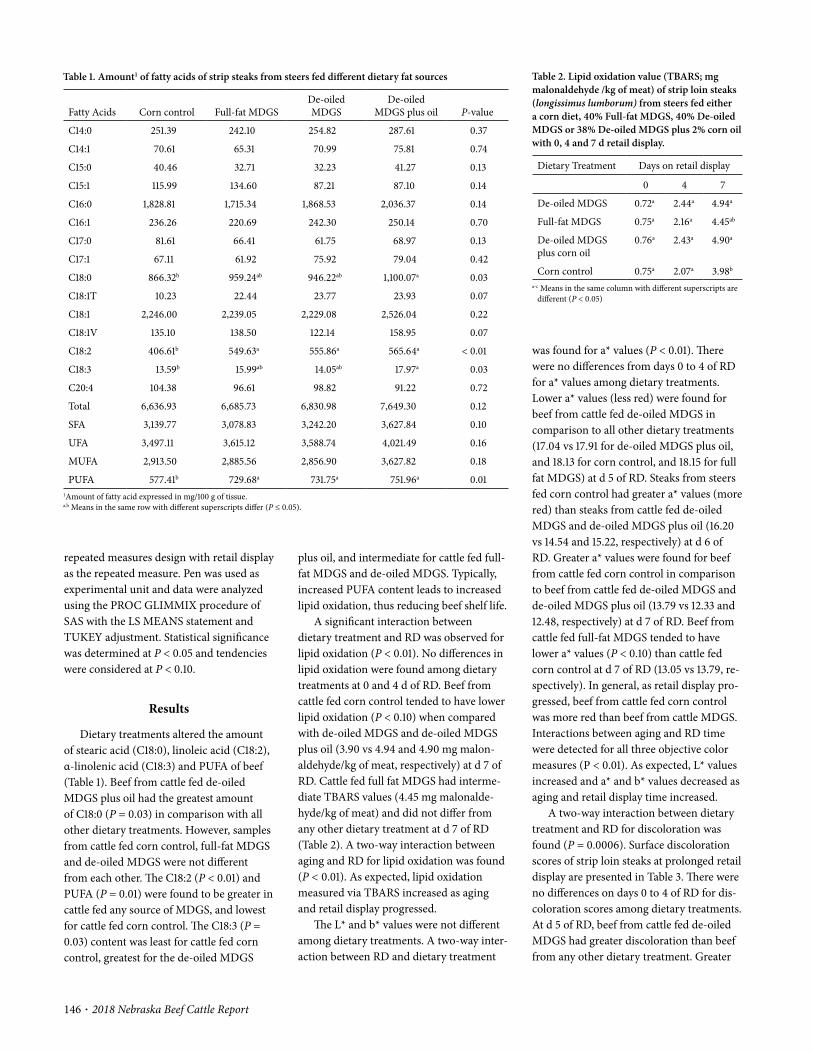
146 · 2018 Nebraska Beef Cattle Report
repeated measures design with retail display as the repeated measure. Pen was used as experimental unit and data were analyzed using the PROC GLIMMIX procedure of SAS with the LS MEANS statement and TUKEY adjustment. Statistical significance was determined at P < 0.05 and tendencies were considered at P < 0.10.
Results
Dietary treatments altered the amount of stearic acid (C18:0), linoleic acid (C18:2), α- linolenic acid (C18:3) and PUFA of beef (Table 1). Beef from cattle fed de- oiled MDGS plus oil had the greatest amount of C18:0 (P = 0.03) in comparison with all other dietary treatments. However, samples from cattle fed corn control, full- fat MDGS and de- oiled MDGS were not different from each other. The C18:2 (P < 0.01) and PUFA (P = 0.01) were found to be greater in cattle fed any source of MDGS, and lowest for cattle fed corn control. The C18:3 (P = 0.03) content was least for cattle fed corn control, greatest for the de- oiled MDGS
plus oil, and intermediate for cattle fed full- fat MDGS and de- oiled MDGS. Typically, increased PUFA content leads to increased lipid oxidation, thus reducing beef shelf life.
A significant interaction between dietary treatment and RD was observed for lipid oxidation (P < 0.01). No differences in lipid oxidation were found among dietary treatments at 0 and 4 d of RD. Beef from cattle fed corn control tended to have lower lipid oxidation (P < 0.10) when compared with de- oiled MDGS and de- oiled MDGS plus oil (3.90 vs 4.94 and 4.90 mg malon-aldehyde/kg of meat, respectively) at d 7 of RD. Cattle fed full fat MDGS had interme-diate TBARS values (4.45 mg malonalde-hyde/kg of meat) and did not differ from any other dietary treatment at d 7 of RD (Table 2). A two- way interaction between aging and RD for lipid oxidation was found (P < 0.01). As expected, lipid oxidation measured via TBARS increased as aging and retail display progressed.
The L* and b* values were not different among dietary treatments. A two- way inter-action between RD and dietary treatment
was found for a* values (P < 0.01). There were no differences from days 0 to 4 of RD for a* values among dietary treatments. Lower a* values (less red) were found for beef from cattle fed de- oiled MDGS in comparison to all other dietary treatments (17.04 vs 17.91 for de- oiled MDGS plus oil, and 18.13 for corn control, and 18.15 for full fat MDGS) at d 5 of RD. Steaks from steers fed corn control had greater a* values (more red) than steaks from cattle fed de- oiled MDGS and de- oiled MDGS plus oil (16.20 vs 14.54 and 15.22, respectively) at d 6 of RD. Greater a* values were found for beef from cattle fed corn control in comparison to beef from cattle fed de- oiled MDGS and de- oiled MDGS plus oil (13.79 vs 12.33 and 12.48, respectively) at d 7 of RD. Beef from cattle fed full- fat MDGS tended to have lower a* values (P < 0.10) than cattle fed corn control at d 7 of RD (13.05 vs 13.79, re-spectively). In general, as retail display pro-gressed, beef from cattle fed corn control was more red than beef from cattle MDGS. Interactions between aging and RD time were detected for all three objective color measures (P < 0.01). As expected, L* values increased and a* and b* values decreased as aging and retail display time increased.
A two- way interaction between dietary treatment and RD for discoloration was found (P = 0.0006). Surface discoloration scores of strip loin steaks at prolonged retail display are presented in Table 3. There were no differences on days 0 to 4 of RD for dis-coloration scores among dietary treatments. At d 5 of RD, beef from cattle fed de- oiled MDGS had greater discoloration than beef from any other dietary treatment. Greater
Table 1. Amount1 of fatty acids of strip steaks from steers fed different dietary fat sources
Fatty Acids Corn control Full- fat MDGSDe- oiled MDGS
De- oiled MDGS plus oil P- value
C14:0 251.39 242.10 254.82 287.61 0.37
C14:1 70.61 65.31 70.99 75.81 0.74
C15:0 40.46 32.71 32.23 41.27 0.13
C15:1 115.99 134.60 87.21 87.10 0.14
C16:0 1,828.81 1,715.34 1,868.53 2,036.37 0.14
C16:1 236.26 220.69 242.30 250.14 0.70
C17:0 81.61 66.41 61.75 68.97 0.13
C17:1 67.11 61.92 75.92 79.04 0.42
C18:0 866.32b 959.24ab 946.22ab 1,100.07a 0.03
C18:1T 10.23 22.44 23.77 23.93 0.07
C18:1 2,246.00 2,239.05 2,229.08 2,526.04 0.22
C18:1V 135.10 138.50 122.14 158.95 0.07
C18:2 406.61b 549.63a 555.86a 565.64a < 0.01
C18:3 13.59b 15.99ab 14.05ab 17.97a 0.03
C20:4 104.38 96.61 98.82 91.22 0.72
Total 6,636.93 6,685.73 6,830.98 7,649.30 0.12
SFA 3,139.77 3,078.83 3,242.20 3,627.84 0.10
UFA 3,497.11 3,615.12 3,588.74 4,021.49 0.16
MUFA 2,913.50 2,885.56 2,856.90 3,627.82 0.18
PUFA 577.41b 729.68a 731.75a 751.96a 0.011Amount of fatty acid expressed in mg/100 g of tissue.a,b Means in the same row with different superscripts differ (P ≤ 0.05).
Table 2. Lipid oxidation value (TBARS; mg malonaldehyde /kg of meat) of strip loin steaks (longissimus lumborum) from steers fed either a corn diet, 40% Full- fat MDGS, 40% De- oiled MDGS or 38% De- oiled MDGS plus 2% corn oil with 0, 4 and 7 d retail display.
Dietary Treatment Days on retail display
0 4 7
De- oiled MDGS 0.72a 2.44a 4.94a
Full- fat MDGS 0.75a 2.16a 4.45ab
De- oiled MDGS plus corn oil
0.76a 2.43a 4.90a
Corn control 0.75a 2.07a 3.98b
a- c Means in the same column with different superscripts are different (P < 0.05)

2018 Nebraska Beef Cattle Report · 147
and thus reduce beef shelf life. Addition of corn oil to de- oiled MDGS decreased redness and increased discoloration and lipid oxida-tion in comparison to corn control diets.
Acknowledgment
This project was funded in part by The Beef Checkoff.
Felipe A. Ribeiro, graduate student
Katherine I. Domenech- Pérez, graduate student
Emery K. Wilkerson, graduate student
Hope Voegele, graduate student
Nicolas J. Herrera, undergraduate student
Kellen B. Hart, graduate student
Chris R. Calkins, professor, Animal Science, Lincoln.
scores at d 6 of RD and did not differ from any other dietary treatment. Discoloration scores were least for cattle fed corn control, intermediate for cattle fed full- fat MDGS and de- oiled MDGS plus oil, and greatest for the de- oiled MDGS at d 7 of RD. As retail display progressed, discoloration pro-gressed at slower rates in beef from cattle fed corn control. A two- way interaction between aging time and RD for discolor-ation was observed (P < 0.01). Discoloration increased as RD time increased, regardless the dietary fat source at all aging periods.
Conclusion
Results suggest that feeding MDGS to cattle has the potential to reduce color and lipid stability compared to corn control diet
discoloration was found for beef from cattle fed de- oiled MDGS when compared to beef from cattle fed de- oiled MDGS plus oil and corn at d 6 of RD. However, cattle fed- full fat MDGS had intermediate discoloration
Table 3. Discoloration (%) of strip loin steaks (L. dorsi) at days 5, 6 & 7 retail display
Dietary Treatment Days on retail display
5 6 7
De- oiled MDGS 14.63a 41.32a 65.16a
Full- fat MDGS 7.13b 35.85ab 58.08b
De- oiled MDGS plus corn oil
7.99b 33.76b 58.64b
Corn control 5.70b 31.39b 49.82c
a- c Means in the same column with different superscripts are different (P < 0.05)

Statistics Used in the Nebraska Beef Report and Their Purpose
The purpose of beef cattle and beef product research at UNL is to provide reference information that rep-resents the various populations (cows, calves, heifers, feeders, carcasses, retail products, etc) of beef pro-duction. Obviously, the researcher cannot apply treatments to every member of a population; therefore he/she must sample the population. The use of statistics allows the researcher and readers of the Nebraska Beef report the opportunity to evaluate separation of random (chance) occurrences and real biological effects of a treatment. Following is a brief description of the major statistics used in the beef report. For a more detailed description of the expectations of authors and parameters used in animal science see Journal of Animal Sci-ence Style and Form at: http:// jas .fass .org /misc /ifora .shtml.
— Mean: Data for individual experimental units (cows, steers, steaks) exposed to the same treatment are generally averaged and reported in the text, tables and figures. The statistical term representing the average of a group of data points is mean.
— Variability: The inconsistency among the individual experimental units used to calculate a mean for the item measured is the variance. For example, if the ADG for all the steers used to calculate the mean for a treatment is 3.5 lb then the variance is zero. But, this situation never happens! However, if ADG for individual steers used to calculate the mean for a treatment range from 1.0 lb to 5.0 lb, then the variance is large. The variance may be reported as standard deviation (square root of the variance) or as standard error of the mean. The standard error is the standard deviation of the mean as if we had done repeated samplings of data to calculate multiple means for a given treatment. In most cases treatment means and their measure of variability will be expressed as follows: 3.5 ± 0.15. This would be a mean of 3.5 followed by the standard error of the mean of 0.15. A helpful step combining both the mean and the variability from an experi-ment to conclude whether the treatment results in a real biological effect is to calculate a 95% confidence interval. This interval would be twice the standard error added to and subtracted from the mean. In the example above, this interval is 3.2– 3.8 lb. If in an experiment, these intervals calculated for treatments of interest overlap, the experiment does not provide satisfactory evidence to conclude that treatments effects are different.
— P Value: Probability (P Value) refers to the likelihood the observed differences among treatment means are due to chance. For example, if the author reports P ≤ 0.05 as the significance level for a test of the differ-ences between treatments as they affect ADG, the reader may conclude there is less than a 5% chance the differences observed between the means are a random occurrence and the treatments do not affect ADG. Hence we conclude that, because this probability of chance occurrence is small, there must be difference between the treatments in their effect on ADG. It is generally accepted among researchers when P values are less than or equal to 0.05, observed differences are deemed due to important treatment effects. Authors occasionally conclude that an effect is significant, hence real, if P values are between 0.05 and 0.10. Further, some authors may include a statement indicating there was a “tendency” or “trend” in the data. Authors often use these statements when P values are between 0.10 and 0.15, because they are not confident the differences among treatment means are real treatment effects. With P values of 0.10 and 0.15 the chance random sampling caused the observed differences is 1 in 10 and 1 in 6.7, respectively.
— Linear & Quadratic Contrasts: Some articles contain linear (L) and quadratic (Q) responses to treat-ments. These parameters are used when the research involves increasing amounts of a factor as treatments. Examples are increasing amounts of a ration ingredient (corn, by- product, or feed additive) or increasing amounts of a nutrient (protein, calcium, or vitamin E). The L and Q contrasts provide information regard-ing the shape of the response. Linear indicates a straight line response and quadratic indicates a curved response. P- values for these contrasts have the same interpretation as described above.
— Correlation (r): Correlation indicates amount of linear relationship of two measurements. The correlation coefficient can range from 1 to 1. Values near zero indicate a weak relationship, values near 1 indicate a strong positive relationship, and a value of 1 indicates a strong negative relationship.

Animal Science http://animalscience.unl.edu
Curriculum: The curriculum of the Animal Science Department at the University of Nebraska– Lincoln is designed so that each student can select from a variety of options oriented to specific career goals in professions ranging from animal production to veterinary medicine. With unique opportunities to double major in Grazing Livestock Systems (http://gls.unl.edu) or complete the Feedlot Management Internship Program (http://feedlot.unl.edu/intern)
Careers:
Animal HealthBanking and FinanceAnimal ManagementConsultant
EducationMarketingTechnical ServiceMeat Processing
Meat SafetyQuality AssuranceResearch and DevelopmentVeterinary Medicine
Scholarships: The Animal Science Department also offers scholarships to incoming freshmen and upperclassmen. The department awards over $30,000 each year to Animal Science students.ABS Global ScholarshipBaltzell- Agri- Products, Inc. ScholarshipMaurice E. Boeckenhauer Memorial ScholarshipMike Cull Judging and Activities ScholarshipDon Geweke Memorial AwardParr Young Senior Merit AwardNebraska Pork Producers Association ScholarshipWaldo Family Farms ScholarshipFrank and Mary Bruning ScholarshipArt and Ruth Raun ScholarshipAnimal Science Department Freshman ScholarshipFeedlot Management ScholarshipRobert Boeckenhauer Memorial ScholarshipBurnell Scholarship FundDoane ScholarshipLincoln Coca- Cola Bottling Company Scholarship.
William J. and Hazel J. Loeffel ScholarshipNutrition Service Associates ScholarshipParr Family Student Support FundChris and Sarah Raun Memorial ScholarshipWalter A. and Alice V. Rockwell ScholarshipStandard Manufacturing Co. ScholarshipMax and Ora Mae Stark ScholarshipD. V. and Ernestine Stephens Memorial ScholarshipDwight F. Stephens ScholarshipArthur W. and Viola Thompson ScholarshipThomas H. Wake, III ScholarshipFrank E. Card ScholarshipDerrick Family ScholarshipG. H. Francke Livestock Judging ScholarshipEric Peterson Memorial AwardWinkler Memorial Livestock Judging Scholarship

Non ProfitUS Postage
PAIDUNLP.O. Box 830908
C220 ANSCLincoln, NE 68583-0908 USA