Nebraska Occupational Health Indicators, 2013dhhs.ne.gov/Reports/Occupational Health Indicators...
13
1 Nebraska Occupational Health Indicator Report, 2013 Occupational Safety and Health Surveillance Program | Nebraska Department of Health and Human Services Web: www.dhhs.ne.gov/publichealth/occhealth/ | Phone: 402-471-2822 December 2013 Introduction A safe and healthy workforce supports Nebraska’s economy and helps Nebraskans live healthier lives. Each year thousands of workers are injured or become ill due to an exposure to a health hazard in the workplace. These events have significant impacts on workers and their families, employers, and the state of Nebraska. In 2010, the Nebraska Occupational Safety and Health Surveillance Program (NOSHP) was established with funding from the National Institute for Occupational Safety and Health (NIOSH), an institute in the Centers for Disease Control and Prevention (CDC). The primary goal of the program is to conduct occupational health surveillance, which is the systematic collection, analysis, and interpretation of data related to occupational health. To enhance assessment and comparison of injury and illness data, NIOSH and the Council of State and Territorial Epidemiologists (CSTE) developed a standardized set of occupational health indicators in 1999 (1). An occupational health indicator is a specific measure of a work-related injury or disease, or a factor associated with occupational health, such as workplace exposures, hazards, or interventions in a specified population. Indicators allow a state to determine the health and risk status of workers, compare data with other states, and evaluate trends over time. Nebraska Occupational Health Indicator Report, 2013 presents a snapshot of 20 occupational health indicators using data from 2010. A comparison of Nebraska occupational health indicators with U.S. data is also included for many indicators. Methods Indicators were calculated using CSTE guidelines (2). Data used to calculate these indicators are drawn from several sources, such as national surveys, census counts, and state-based health records. At the national level, the Bureau of Labor Statistics (BLS) Geographic Profile of Employment, Survey of Occupational Injuries and Illnesses (SOII), and Census of Fatal Occupational Injuries (CFOI) were used. State-based resources include Nebraska hospital discharge data, workers’ compensation records, cancer registry, and death certificate data. Data in this report do not necessarily capture the full spectrum of occupational illnesses and injuries —many such events are not reported by employees. Discussions on methodology and limitations of data sources used for indicator calculation are described in detail in the CSTE occupational health indicator guidance document (2). Limitations exist when comparing indicators between years and when comparing Nebraska and national data, as data collection methods can vary between states and U.S. averages might not include data from all 50 states. Indicators presented here represent data known at the time of publication, and this document might not reflect future revisions in the data.
Transcript of Nebraska Occupational Health Indicators, 2013dhhs.ne.gov/Reports/Occupational Health Indicators...
1
Nebraska Occupational Health Indicator Report, 2013
Occupational Safety and Health Surveillance Program | Nebraska Department of Health and Human Services
Web: www.dhhs.ne.gov/publichealth/occhealth/ | Phone: 402-471-2822
December 2013
Introduction
A safe and healthy workforce supports Nebraska’s economy and helps Nebraskans live healthier lives. Each year
thousands of workers are injured or become ill due to an exposure to a health hazard in the workplace. These
events have significant impacts on workers and their families, employers, and the state of Nebraska.
In 2010, the Nebraska Occupational Safety and Health Surveillance Program (NOSHP) was established with
funding from the National Institute for Occupational Safety and Health (NIOSH), an institute in the Centers for
Disease Control and Prevention (CDC). The primary goal of the program is to conduct occupational health
surveillance, which is the systematic collection, analysis, and interpretation of data related to occupational health.
To enhance assessment and comparison of injury and illness data, NIOSH and the Council of State and
Territorial Epidemiologists (CSTE) developed a standardized set of occupational health indicators in 1999 (1). An
occupational health indicator is a specific measure of a work-related injury or disease, or a factor associated with
occupational health, such as workplace exposures, hazards, or interventions in a specified population. Indicators
allow a state to determine the health and risk status of workers, compare data with other states, and evaluate
trends over time.
Nebraska Occupational Health Indicator Report, 2013 presents a snapshot of 20 occupational health indicators
using data from 2010. A comparison of Nebraska occupational health indicators with U.S. data is also included for
many indicators.
Methods
Indicators were calculated using CSTE guidelines (2). Data used to calculate these indicators are drawn from
several sources, such as national surveys, census counts, and state-based health records. At the national level,
the Bureau of Labor Statistics (BLS) Geographic Profile of Employment, Survey of Occupational Injuries and
Illnesses (SOII), and Census of Fatal Occupational Injuries (CFOI) were used. State-based resources include
Nebraska hospital discharge data, workers’ compensation records, cancer registry, and death certificate data.
Data in this report do not necessarily capture the full spectrum of occupational illnesses and injuries—many such
events are not reported by employees. Discussions on methodology and limitations of data sources used for
indicator calculation are described in detail in the CSTE occupational health indicator guidance document (2).
Limitations exist when comparing indicators between years and when comparing Nebraska and national data, as
data collection methods can vary between states and U.S. averages might not include data from all 50 states.
Indicators presented here represent data known at the time of publication, and this document might not reflect
future revisions in the data.
2
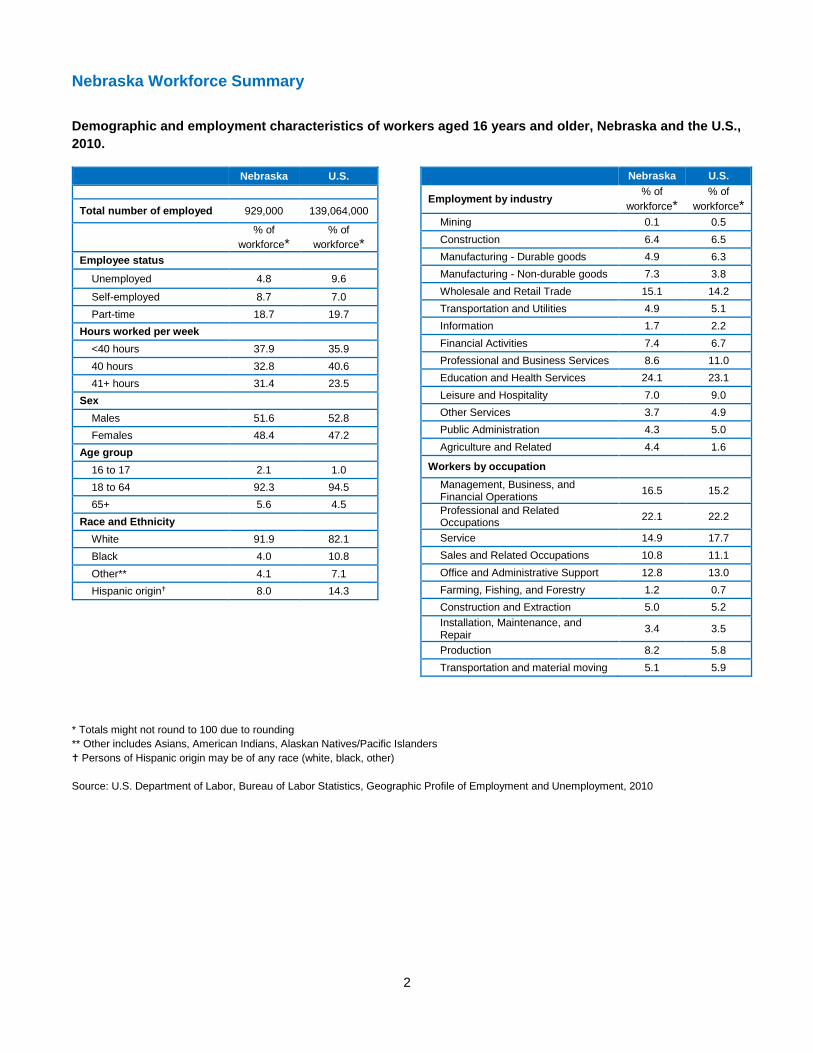
Nebraska Workforce Summary
Demographic and employment characteristics of workers aged 16 years and older, Nebraska and the U.S.,
2010.
Nebraska U.S.
Total number of employed 929,000 139,064,000
% of
workforce*
% of
workforce*
Employee status
Unemployed 4.8 9.6
Self-employed 8.7 7.0
Part-time 18.7 19.7
Hours worked per week
<40 hours 37.9 35.9
40 hours 32.8 40.6
41+ hours 31.4 23.5
Sex
Males 51.6 52.8
Females 48.4 47.2
Age group
16 to 17 2.1 1.0
18 to 64 92.3 94.5
65+ 5.6 4.5
Race and Ethnicity
White 91.9 82.1
Black 4.0 10.8
Other** 4.1 7.1
Hispanic origin 8.0 14.3
Nebraska U.S.
Employment by industry % of
workforce*
% of
workforce*
Mining 0.1 0.5
Construction 6.4 6.5
Manufacturing - Durable goods 4.9 6.3
Manufacturing - Non-durable goods 7.3 3.8
Wholesale and Retail Trade 15.1 14.2
Transportation and Utilities 4.9 5.1
Information 1.7 2.2
Financial Activities 7.4 6.7
Professional and Business Services 8.6 11.0
Education and Health Services 24.1 23.1
Leisure and Hospitality 7.0 9.0
Other Services 3.7 4.9
Public Administration 4.3 5.0
Agriculture and Related 4.4 1.6
Workers by occupation
Management, Business, and Financial Operations
16.5 15.2
Professional and Related Occupations
22.1 22.2
Service 14.9 17.7
Sales and Related Occupations 10.8 11.1
Office and Administrative Support 12.8 13.0
Farming, Fishing, and Forestry 1.2 0.7
Construction and Extraction 5.0 5.2
Installation, Maintenance, and Repair
3.4 3.5
Production 8.2 5.8
Transportation and material moving 5.1 5.9
* Totals might not round to 100 due to rounding
** Other includes Asians, American Indians, Alaskan Natives/Pacific Islanders
Persons of Hispanic origin may be of any race (white, black, other)
Source: U.S. Department of Labor, Bureau of Labor Statistics, Geographic Profile of Employment and Unemployment, 2010
3
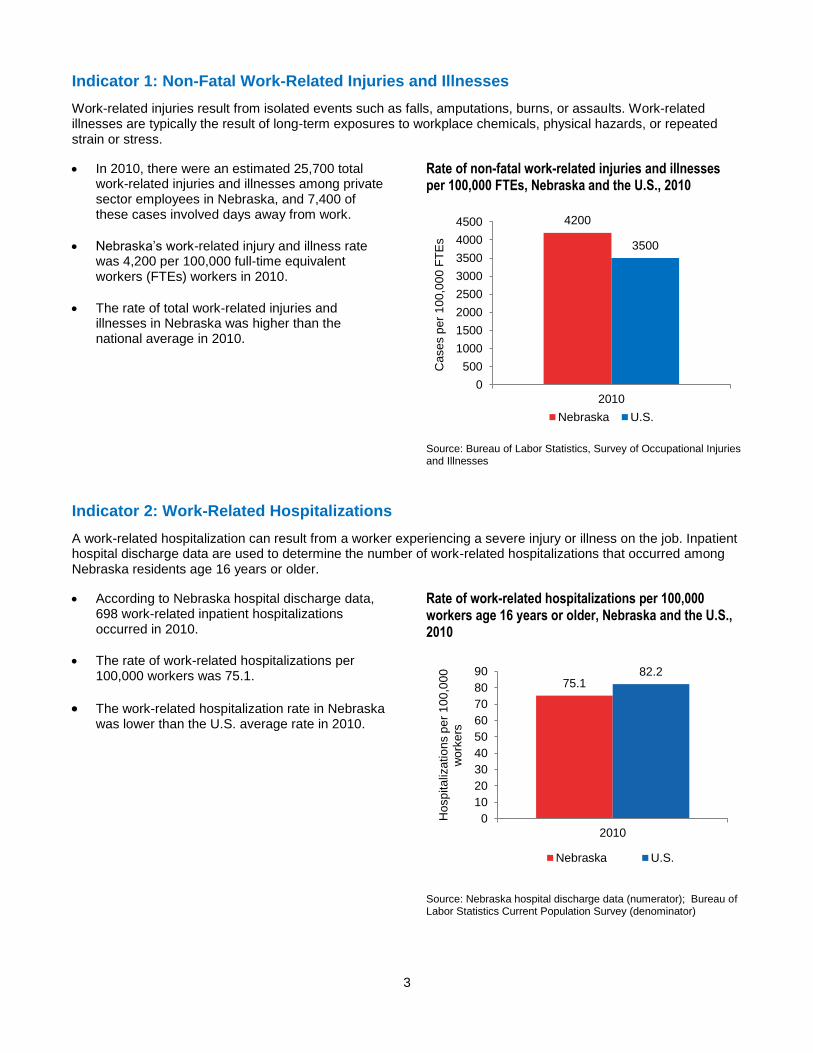
Indicator 1: Non-Fatal Work-Related Injuries and Illnesses
Work-related injuries result from isolated events such as falls, amputations, burns, or assaults. Work-related illnesses are typically the result of long-term exposures to workplace chemicals, physical hazards, or repeated strain or stress.
In 2010, there were an estimated 25,700 total work-related injuries and illnesses among private sector employees in Nebraska, and 7,400 of these cases involved days away from work.
Nebraska’s work-related injury and illness rate was 4,200 per 100,000 full-time equivalent workers (FTEs) workers in 2010.
The rate of total work-related injuries and illnesses in Nebraska was higher than the national average in 2010.
Rate of non-fatal work-related injuries and illnesses per 100,000 FTEs, Nebraska and the U.S., 2010
Source: Bureau of Labor Statistics, Survey of Occupational Injuries and Illnesses
Indicator 2: Work-Related Hospitalizations
A work-related hospitalization can result from a worker experiencing a severe injury or illness on the job. Inpatient hospital discharge data are used to determine the number of work-related hospitalizations that occurred among Nebraska residents age 16 years or older.
According to Nebraska hospital discharge data, 698 work-related inpatient hospitalizations occurred in 2010.
The rate of work-related hospitalizations per 100,000 workers was 75.1.
The work-related hospitalization rate in Nebraska was lower than the U.S. average rate in 2010.
Rate of work-related hospitalizations per 100,000 workers age 16 years or older, Nebraska and the U.S., 2010
Source: Nebraska hospital discharge data (numerator); Bureau of Labor Statistics Current Population Survey (denominator)
4200
3500
0
500
1000
1500
2000
2500
3000
3500
4000
4500
2010
Ca
se
s p
er
10
0,0
00
FT
Es
Nebraska U.S.
75.182.2
0
10
20
30
40
50
60
70
80
90
2010
Ho
sp
ita
liza
tio
ns p
er
10
0,0
00
w
ork
ers
Nebraska U.S.
4
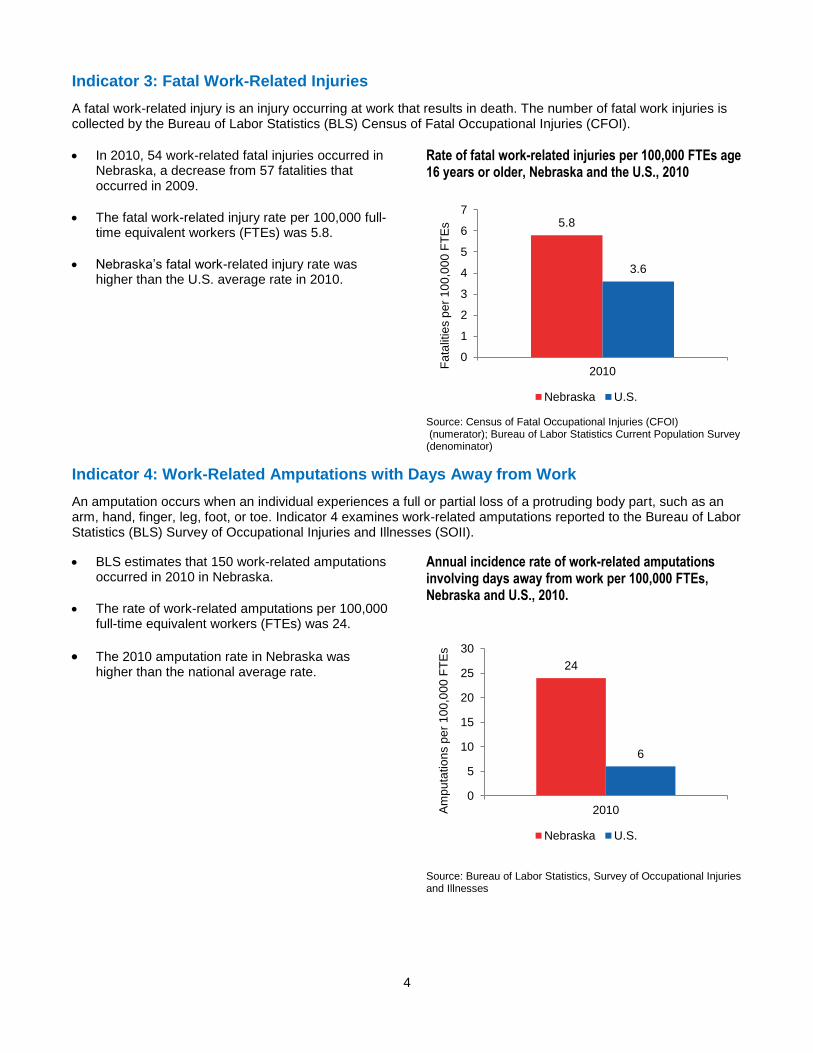
Indicator 3: Fatal Work-Related Injuries
A fatal work-related injury is an injury occurring at work that results in death. The number of fatal work injuries is collected by the Bureau of Labor Statistics (BLS) Census of Fatal Occupational Injuries (CFOI).
In 2010, 54 work-related fatal injuries occurred in Nebraska, a decrease from 57 fatalities that occurred in 2009.
The fatal work-related injury rate per 100,000 full-time equivalent workers (FTEs) was 5.8.
Nebraska’s fatal work-related injury rate was higher than the U.S. average rate in 2010.
Rate of fatal work-related injuries per 100,000 FTEs age 16 years or older, Nebraska and the U.S., 2010
Source: Census of Fatal Occupational Injuries (CFOI) (numerator); Bureau of Labor Statistics Current Population Survey (denominator)
Indicator 4: Work-Related Amputations with Days Away from Work
An amputation occurs when an individual experiences a full or partial loss of a protruding body part, such as an arm, hand, finger, leg, foot, or toe. Indicator 4 examines work-related amputations reported to the Bureau of Labor Statistics (BLS) Survey of Occupational Injuries and Illnesses (SOII).
BLS estimates that 150 work-related amputations occurred in 2010 in Nebraska.
The rate of work-related amputations per 100,000 full-time equivalent workers (FTEs) was 24.
The 2010 amputation rate in Nebraska was higher than the national average rate.
Annual incidence rate of work-related amputations involving days away from work per 100,000 FTEs, Nebraska and U.S., 2010.
Source: Bureau of Labor Statistics, Survey of Occupational Injuries and Illnesses
5.8
3.6
0
1
2
3
4
5
6
7
2010
Fa
talit
ies p
er
10
0,0
00
FT
Es
Nebraska U.S.
24
6
0
5
10
15
20
25
30
2010Am
pu
tatio
ns p
er
10
0,0
00
FT
Es
Nebraska U.S.
5
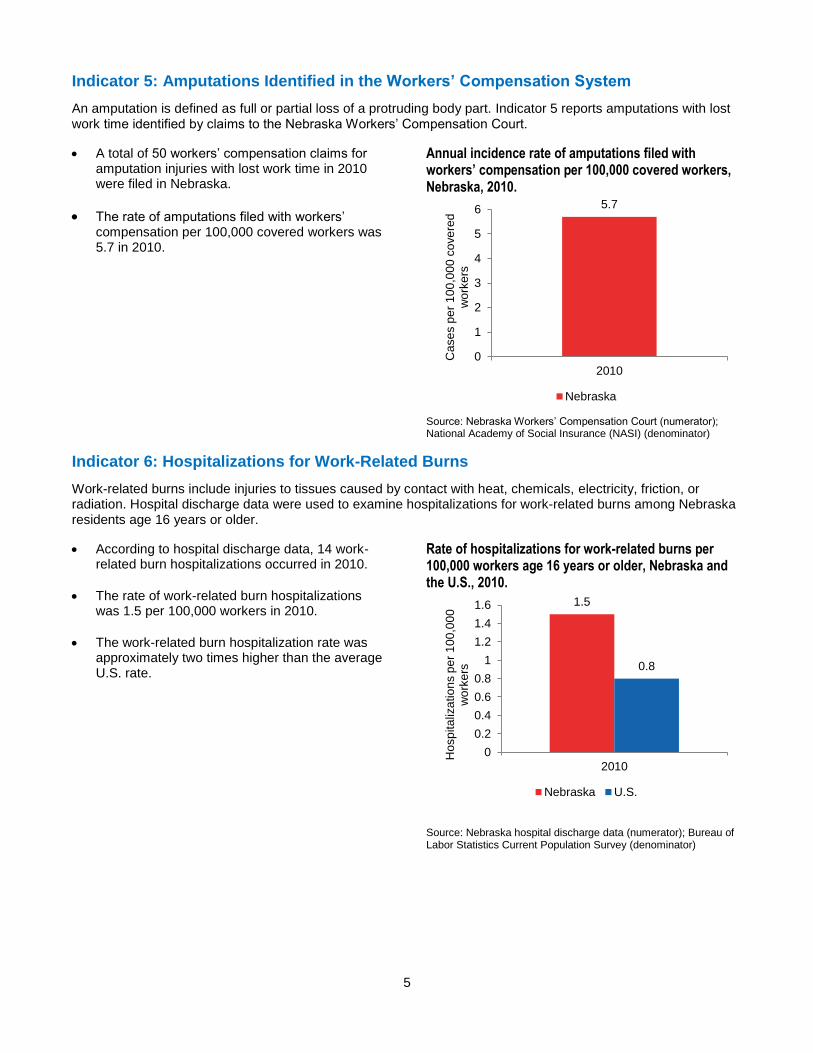
Indicator 5: Amputations Identified in the Workers’ Compensation System
An amputation is defined as full or partial loss of a protruding body part. Indicator 5 reports amputations with lost work time identified by claims to the Nebraska Workers’ Compensation Court.
A total of 50 workers’ compensation claims for amputation injuries with lost work time in 2010 were filed in Nebraska.
The rate of amputations filed with workers’ compensation per 100,000 covered workers was 5.7 in 2010.
Annual incidence rate of amputations filed with workers’ compensation per 100,000 covered workers, Nebraska, 2010.
Source: Nebraska Workers’ Compensation Court (numerator); National Academy of Social Insurance (NASI) (denominator)
Indicator 6: Hospitalizations for Work-Related Burns
Work-related burns include injuries to tissues caused by contact with heat, chemicals, electricity, friction, or radiation. Hospital discharge data were used to examine hospitalizations for work-related burns among Nebraska residents age 16 years or older.
According to hospital discharge data, 14 work-related burn hospitalizations occurred in 2010.
The rate of work-related burn hospitalizations was 1.5 per 100,000 workers in 2010.
The work-related burn hospitalization rate was approximately two times higher than the average U.S. rate.
Rate of hospitalizations for work-related burns per 100,000 workers age 16 years or older, Nebraska and the U.S., 2010.
Source: Nebraska hospital discharge data (numerator); Bureau of Labor Statistics Current Population Survey (denominator)
5.7
0
1
2
3
4
5
6
2010
Ca
se
s p
er
10
0,0
00
co
ve
red
w
ork
ers
Nebraska
1.5
0.8
0
0.2
0.4
0.6
0.8
1
1.2
1.4
1.6
2010
Hosp
ita
liza
tio
ns p
er
10
0,0
00
w
ork
ers
Nebraska U.S.
6
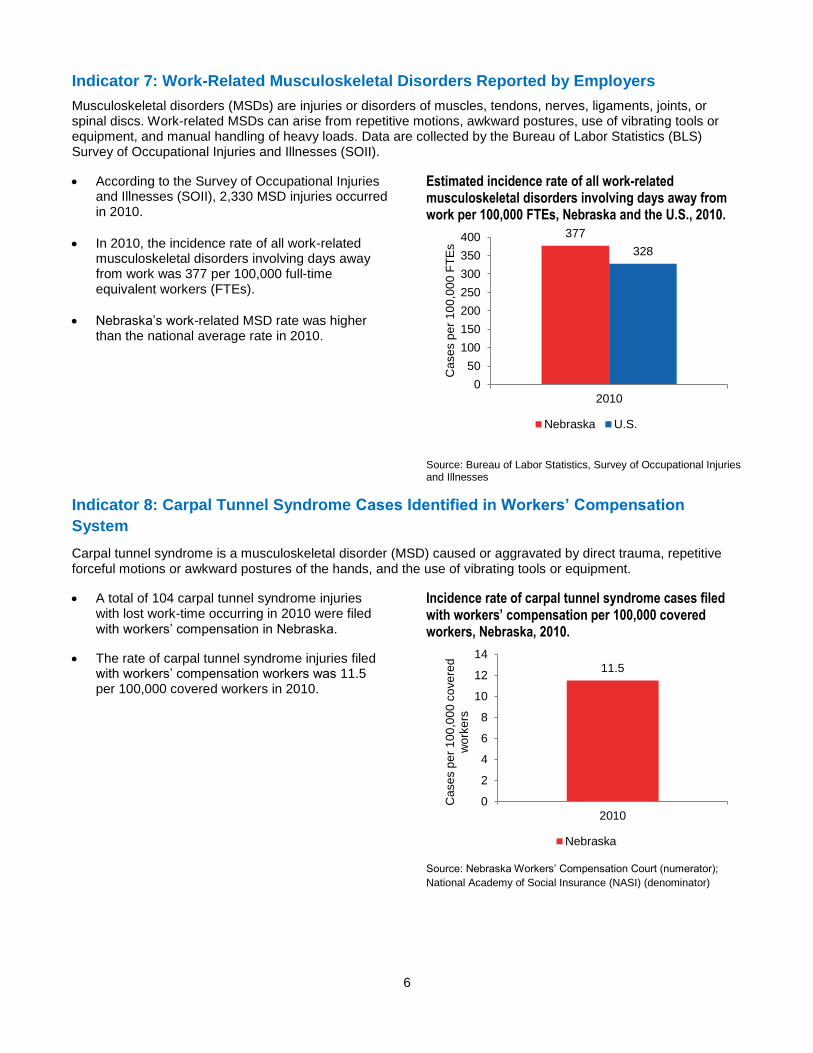
Indicator 7: Work-Related Musculoskeletal Disorders Reported by Employers
Musculoskeletal disorders (MSDs) are injuries or disorders of muscles, tendons, nerves, ligaments, joints, or spinal discs. Work-related MSDs can arise from repetitive motions, awkward postures, use of vibrating tools or equipment, and manual handling of heavy loads. Data are collected by the Bureau of Labor Statistics (BLS) Survey of Occupational Injuries and Illnesses (SOII).
According to the Survey of Occupational Injuries and Illnesses (SOII), 2,330 MSD injuries occurred in 2010.
In 2010, the incidence rate of all work-related musculoskeletal disorders involving days away from work was 377 per 100,000 full-time equivalent workers (FTEs).
Nebraska’s work-related MSD rate was higher than the national average rate in 2010.
Estimated incidence rate of all work-related musculoskeletal disorders involving days away from work per 100,000 FTEs, Nebraska and the U.S., 2010.
Source: Bureau of Labor Statistics, Survey of Occupational Injuries and Illnesses
Indicator 8: Carpal Tunnel Syndrome Cases Identified in Workers’ Compensation
System
Carpal tunnel syndrome is a musculoskeletal disorder (MSD) caused or aggravated by direct trauma, repetitive forceful motions or awkward postures of the hands, and the use of vibrating tools or equipment.
A total of 104 carpal tunnel syndrome injuries with lost work-time occurring in 2010 were filed with workers’ compensation in Nebraska.
The rate of carpal tunnel syndrome injuries filed with workers’ compensation workers was 11.5 per 100,000 covered workers in 2010.
Incidence rate of carpal tunnel syndrome cases filed with workers’ compensation per 100,000 covered workers, Nebraska, 2010.
Source: Nebraska Workers’ Compensation Court (numerator);
National Academy of Social Insurance (NASI) (denominator)
377
328
0
50
100
150
200
250
300
350
400
2010
Ca
se
s p
er
10
0,0
00
FT
Es
Nebraska U.S.
11.5
0
2
4
6
8
10
12
14
2010
Case
s p
er
10
0,0
00
co
ve
red
w
ork
ers
Nebraska

7
Indicator 9: Hospitalizations from or with Pneumoconiosis
Pneumoconiosis is a category of restrictive lung diseases caused by the inhalation of mineral dusts, such as asbestos, silica, and coal. Most cases of pneumoconiosis are the result of occupational exposures. Inpatient hospital discharge data were used to determine the number of pneumoconiosis hospitalizations among Nebraska residents age 15 years or older.
According to hospital discharge data, 57 pneumoconiosis hospital discharges occurred in 2010. Asbestosis cases accounted for the majority of pneumoconiosis hospitalizations (88%, n=50).
The age-standardized rate of pneumoconiosis hospitalizations was 35.4 per million Nebraska residents age 15 years or older in 2010.
The Nebraska age-standardized rate of pneumoconiosis hospitalizations was lower than the U.S. average in 2010.
Age-standardized rates of hospitalizations from or with pneumoconiosis per million residents 15 years or older, Nebraska and the U.S., 2010.
Source: Nebraska hospital discharge data (numerator); State population estimates from the U.S. Census Bureau (denominator)
Indicator 10: Pneumoconiosis Mortality
Indicator 10 examines deaths with pneumoconiosis as an underlying or contributing cause. Death certificate data from DHHS were used to identify pneumoconiosis records among Nebraska residents age 15 years of age or older. In 2010, fewer than five pneumoconiosis deaths occurred in Nebraska. Due to this low number, rates are not shown.
Indicator 11: Acute Work-related Pesticide Poisonings Reported to Poison Control
Centers
A pesticide is a substance or mixture of substances used to prevent or control undesired insects, plants, animals, or fungi. Adverse health effects can occur from human exposures, and agricultural workers and pesticide applicators are at higher risk for pesticide poisonings.
In 2010, 40 work-related pesticide poisoning cases were reported to the Nebraska Regional Poison Center.
The rate of pesticide poisonings per 100,000 Nebraska workers was 4.3.
Nebraska’s pesticide poisoning rate was more than two times higher than the U.S. average rate in 2010.
Incidence rate of reported work-related pesticide poisonings per 100,000 workers age 16 years or older, Nebraska and the U.S., 2010.
Source: American Association of Poison Control Centers (AAPCC) Reported cases of work-related pesticide poisonings (numerator); Employed persons age 16 years or older from the BLS Current Population Survey (denominator).
35.4
41.7
0
10
20
30
40
50
2010
Ho
sp
ita
liza
tio
ns p
er
mill
ion
re
sid
en
ts
Nebraska U.S.
4.3
2.1
0.0
1.0
2.0
3.0
4.0
5.0
2010
Case
s p
er
10
0,0
00
wo
rke
rs
Nebraska U.S.

8
Indicator 12: Incidence of Malignant Mesothelioma
Asbestos exposure is one of the only known causes of malignant mesothelioma, which is a rare but highly fatal cancer of the thin membranes surrounding the chest or abdominal cavity. Malignant mesothelioma typically results from occupational exposure to asbestos.
According to the data from the Nebraska Cancer Registry, 19 malignant mesotheliomas were diagnosed in 2010.
The 2010 age standardized incidence rate for malignant mesothelioma was 12.0 per million Nebraska residents.
The age standardized mesothelioma incidence rate in Nebraska was slightly lower than the U.S. average rate in 2010.
Mesothelioma incidence rate (cases per million residents), Nebraska and the U.S., 2010.
Source: Nebraska Cancer Registry (numerator); State population estimates from the U.S. Census Bureau (denominator)
Indicator 13: Elevated Blood Lead Levels Among Adults
Lead poisoning among adults is primarily due to occupational exposures. Lead poisoning adversely affects multiple organ systems and can cause permanent health damage. The U.S. Department of Health and Human Services recommends that blood lead levels among adults be less than 10 µg/dL.
163 adults had a prevalent (existing) blood lead level ≥ 10 µg/dL in 2010. The number of incidence (new) cases in 2010 was 81.
The prevalence rate of adults with a blood lead level ≥ 10 µg/dL was 17.6 per 100,000 workers in 2010. The incidence rate of adults with a blood lead level ≥ 10 µg/dL was 8.7 per 100,000 workers.
The prevalence and incidence rates of adults with elevated blood lead levels were lower than the U.S. average rate in 2010.
Prevalence and incidence rates of workers age 16 or older with a blood lead level ≥ 10 µg/dL, Nebraska and the U.S., 2010.
Source: Nebraska and CDC/NIOSH ABLES program (numerator); BLS Current Populations Survey (denominator)
12.0 12.5
0.0
2.0
4.0
6.0
8.0
10.0
12.0
14.0
2010
Ca
se
s p
er
mill
ion
re
sid
en
ts
Nebraska U.S.
17.6
8.7
24.8
14.3
0
5
10
15
20
25
30
Prevalence rate Incidence rate
Case
s p
er
10
0,0
00
wo
rke
rs
Nebraska U.S.

9
Indicator 14: Workers Employed in Industries with High Risk for Occupational Morbidity
Workers in certain industries are at a greater risk for sustaining non-fatal injuries and illnesses compared to the overall workforce. Fifty-five high morbidity risk industries were identified and were based on the Bureau of Labor Statistics “total reportable cases incidence rates” for private sector workers. Examples of high morbidity risk industries include animal slaughtering (except poultry), foundries, and nursing and residential care facilities (2). The proportion of workers employed in these high risk industries is an important indicator for occupational health in Nebraska.
In 2010, 77,809 workers in Nebraska were employed in high morbidity risk industries.
The percent of workers employed in high morbidity risk industries was 10.1%.
Nebraska had a higher percent of workers in high morbidity risk industries than the U.S. average in 2010.
Percentage of workers employed in industries with high risk for occupational morbidity, Nebraska and the U.S., 2010.
Source: BLS Current Population Survey
Indicator 15: Workers Employed in Occupations with High Risk for Occupational
Morbidity
Nebraskans working certain occupations are at a greater risk for sustaining a non-fatal an injury or illness. Sixty-one high morbidity risk occupations were identified and were based on Bureau of Labor Statistics “days away from work” cases and employment estimates for private sector workers. Examples of high morbidity risk occupations include construction laborers, nursing, psychiatric, and home health aides, and highway maintenance workers (2). The proportion of workers employed in these high risk occupations is an important indicator for occupational health in Nebraska.
In 2010, 100,051 workers in Nebraska were employed in high morbidity risk occupations.
The percent of workers employed in high morbidity risk occupations was 15.2%.
In 2010, Nebraska had a slightly lower percent of workers in high morbidity risk occupations than the U.S. average.
Percent of workers employed in occupations with high risk for occupational morbidity, Nebraska and the U.S., 2010.
Source: BLS Current Population Survey
10.1
7.2
0
2
4
6
8
10
12
2010
Pe
rce
nt
Nebraska U.S.
15.2 15.4
0.0
5.0
10.0
15.0
20.0
2010
Pe
rce
nt
Nebraska U.S.

10
Indicator 16: Workers Employed in Industries and Occupations with High Risk for
Occupational Mortality
Workers in certain industries and occupations experience fatal injuries at higher rates than the overall workforce. Indicator 16 examines both industries and occupations in which workers are at high risk for occupational mortality. The Bureau of Labor Statistics’ Census of Fatal Occupational Injuries (CFOI) was used to identify 40 high mortality risk industries and 62 high mortality risk occupations (2).
In 2010, 19.1% of Nebraska workers were employed in high mortality risk industries.
14.3% of workers in Nebraska were employed in high mortality risk occupations.
The percent of workers employed in high mortality risk industries and occupations was higher than the U.S. average in 2010.
Percentage of workers in high mortality risk industries and occupations, Nebraska and the U.S., 2010.
Source: BLS Current Population Survey
Indicator 17: Occupational Health and Safety Professionals
Occupational safety and health professionals play a vital role in the prevention and treatment of work-related injuries and illnesses. Determining the occupational health capacity in Nebraska is important in assessing the availability of such professionals to deliver occupational health preventative services.
In Nebraska, the rates of occupational safety and health professionals per 100,000 employees were lower than the U.S. rate among most organizations.
Key
ACOEM: American College of Occupational and Environmental Medicine
AAOHN: American Association of Occupational Health Nurses
AIHA: American Industrial Hygiene Association
ASSE: American Society of Safety Engineers
Number and rate of occupational health and safety professionals and rate per 100,000 employees, Nebraska and the U.S., 2010.
Number (NE)*
Rate (NE)*
Rate (U.S.)
Board certified occupational physicians
9 1.0 2.1
ACOEM members 11 1.2 2.9
Board certified occupational health nurses
49 5.3 3.9
AAOHN members** - - -
Board certified industrial hygienists
22 2.4 5.2
AIHA members 28 3.0 5.6
Board certified safety professionals
51 5.5 8.8
ASSE members 151 16.3 22.5
*NE=Nebraska **2010 data not available Source: Occupational Safety and Health Organizations
19.1
14.315.4
12.3
0
5
10
15
20
25
High Mortality RiskIndustries
High Mortality RiskOccupations
Pe
rce
nt
Nebraska U.S.
11
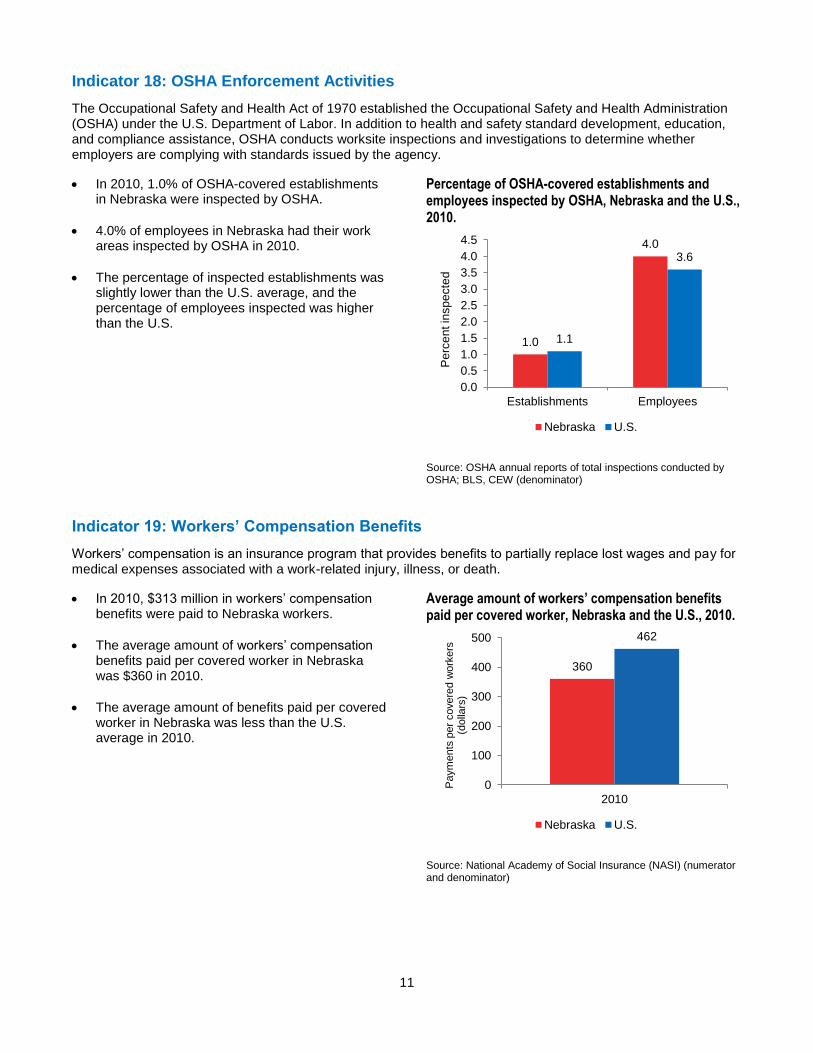
Indicator 18: OSHA Enforcement Activities
The Occupational Safety and Health Act of 1970 established the Occupational Safety and Health Administration (OSHA) under the U.S. Department of Labor. In addition to health and safety standard development, education, and compliance assistance, OSHA conducts worksite inspections and investigations to determine whether employers are complying with standards issued by the agency.
In 2010, 1.0% of OSHA-covered establishments in Nebraska were inspected by OSHA.
4.0% of employees in Nebraska had their work areas inspected by OSHA in 2010.
The percentage of inspected establishments was slightly lower than the U.S. average, and the percentage of employees inspected was higher than the U.S.
Percentage of OSHA-covered establishments and employees inspected by OSHA, Nebraska and the U.S., 2010.
Source: OSHA annual reports of total inspections conducted by OSHA; BLS, CEW (denominator)
Indicator 19: Workers’ Compensation Benefits
Workers’ compensation is an insurance program that provides benefits to partially replace lost wages and pay for medical expenses associated with a work-related injury, illness, or death.
In 2010, $313 million in workers’ compensation benefits were paid to Nebraska workers.
The average amount of workers’ compensation benefits paid per covered worker in Nebraska was $360 in 2010.
The average amount of benefits paid per covered worker in Nebraska was less than the U.S. average in 2010.
Average amount of workers’ compensation benefits paid per covered worker, Nebraska and the U.S., 2010.
Source: National Academy of Social Insurance (NASI) (numerator and denominator)
1.0
4.0
1.1
3.6
0.0
0.5
1.0
1.5
2.0
2.5
3.0
3.5
4.0
4.5
Establishments Employees
Pe
rce
nt in
sp
ecte
d
Nebraska U.S.
360
462
0
100
200
300
400
500
2010
Paym
ents
per
covere
d w
ork
ers
(d
olla
rs)
Nebraska U.S.

12
Indicator 20: Work‐Related Low Back Disorder Hospitalizations
Every year 15 to 20% of Americans report back pain, resulting in over 100 million workdays lost and more than 10 million physician visits. National Health Interview survey data estimates that two-thirds of all low back pain cases are attributable to occupational activities. Hospitalizations for work-related back disorders have serious and costly effects, including high medical costs, lost work time and productivity, and functional impairment and disability.
In 2010, there were 87 surgical work-related low back disorder hospitalizations and 115 total work-related low back disorder hospitalizations among Nebraska workers.
The rate of work-related surgical low back disorder hospitalizations per 100,000 workers was 9.4 in 2010. The rate of work-related all low back disorder hospitalizations per 100,000 workers was 12.4 in 2010.
The work-related surgical low back disorder hospitalization rate and the total low back disorder rate were both lower than the U.S. average in 2010.
Annual crude rate of surgical and all work-related low back disorder hospitalizations per 100,000 workers age 16 years or older, Nebraska and the U.S., 2010.
Source: Source: Nebraska hospital discharge data (numerator); Bureau of Labor Statistics Current Population Survey (denominator)
Conclusion
Work-related injuries and illnesses have significant impacts on a population. In Nebraska, more than 900,000
Nebraskans work, and each year thousands of these workers are injured or become ill due to an exposure to a
health hazard in the workplace. Occupational injuries and illnesses have financial impacts workers and their
families, employers, and the state of Nebraska.
Occupational health indicator data from 2010 show that when compared to the U.S., Nebraska had a higher:
Work-related injuries and illnesses rate
Fatal work-related injuries rate
Rate of work-related amputations with days away from work
Hospitalization rate for work-related burns
Rate of work-related musculoskeletal disorders reported by employers
Rate of acute work-related pesticide poisonings reported to Poison Control Centers
Percent of workers employed in industries with high risk for occupational morbidity
Percent of workers employed in occupations and industries with high risk for occupational mortality
While comparing Nebraska data with U.S. data has some limitations, occupational indicator data suggest
Nebraska workers are at an increased risk for experiencing certain injuries and illnesses. Ongoing collection,
monitoring, and analysis of occupational health data helps the Nebraska Occupational Safety and Health
Surveillance Program establish trends, prioritize resources, and identify emerging issues. Occupational health
surveillance data can also guide the occupational health community in developing prevention and intervention
strategies with an ultimate goal to reduce the number of occupational injuries and illnesses and thereby improve
the health Nebraska workers.
9.4
12.412.514.3
0.0
2.0
4.0
6.0
8.0
10.0
12.0
14.0
16.0
Surgical Low BackDisorder
Hospitalizations
All Low BackDisorder
Hospitalizations
Hosp
ita
liza
tio
ns p
er
10
0,0
0
wo
rke
rs
Nebraska U.S.

13
References
1. Council of State and Territorial Epidemiologists. (CSTE). The Role of the States in a Nationwide, Comprehensive Surveillance System for Work-Related Diseases, Injuries, and Hazards. [Online] 2001. http://c.ymcdn.com/sites/www.cste.org/resource/resmgr/OccupationalHealth/NIOSH.pdf.
2. Council of State and Territorial Epidemiologists (CSTE). Occupational Health Indicators: A Guide for Tracking Occupational Health Conditions and their Determinants. [Online] March 2013. http://www.cste.org/group/OHIndicators/
Acknowledgements
This report was prepared by the Nebraska Department of Health and Human Services Occupational Safety and
Health Surveillance Program. This work was funded in part through a cooperative agreement 5U600OH09859
with the National Institute for Occupational Safety and Health of the Centers for Disease Control and Prevention.
Its contents are solely the responsibility of the authors and do not necessarily represent the official views of
CDC/NIOSH.
Nebraska Department of Health and Human Services
Occupational Safety and Health Surveillance Program
301 Centennial Mall South
Lincoln, NE 68509
Phone: 402-471-2822
Web: http://dhhs.ne.gov/publichealth/occhealth/