Near Real-Time Ground-to-Ground Infrared Remote-Sensing ...
16
HAL Id: hal-02505658 https://hal.archives-ouvertes.fr/hal-02505658 Submitted on 17 Dec 2020 HAL is a multi-disciplinary open access archive for the deposit and dissemination of sci- entific research documents, whether they are pub- lished or not. The documents may come from teaching and research institutions in France or abroad, or from public or private research centers. L’archive ouverte pluridisciplinaire HAL, est destinée au dépôt et à la diffusion de documents scientifiques de niveau recherche, publiés ou non, émanant des établissements d’enseignement et de recherche français ou étrangers, des laboratoires publics ou privés. Near Real-Time Ground-to-Ground Infrared Remote-Sensing Combination and Inexpensive Visible Camera Observations Applied to Tomographic Stack Emission Measurements Philippe de Donato, Odile Barres, Judith Sausse, Delphine Martin To cite this version: Philippe de Donato, Odile Barres, Judith Sausse, Delphine Martin. Near Real-Time Ground-to- Ground Infrared Remote-Sensing Combination and Inexpensive Visible Camera Observations Ap- plied to Tomographic Stack Emission Measurements. Remote Sensing, MDPI, 2018, 10 (5), pp.678. 10.3390/rs10050678. hal-02505658
Transcript of Near Real-Time Ground-to-Ground Infrared Remote-Sensing ...

HAL Id: hal-02505658https://hal.archives-ouvertes.fr/hal-02505658
Submitted on 17 Dec 2020
HAL is a multi-disciplinary open accessarchive for the deposit and dissemination of sci-entific research documents, whether they are pub-lished or not. The documents may come fromteaching and research institutions in France orabroad, or from public or private research centers.
L’archive ouverte pluridisciplinaire HAL, estdestinée au dépôt et à la diffusion de documentsscientifiques de niveau recherche, publiés ou non,émanant des établissements d’enseignement et derecherche français ou étrangers, des laboratoirespublics ou privés.
Near Real-Time Ground-to-Ground InfraredRemote-Sensing Combination and Inexpensive VisibleCamera Observations Applied to Tomographic Stack
Emission MeasurementsPhilippe de Donato, Odile Barres, Judith Sausse, Delphine Martin
To cite this version:Philippe de Donato, Odile Barres, Judith Sausse, Delphine Martin. Near Real-Time Ground-to-Ground Infrared Remote-Sensing Combination and Inexpensive Visible Camera Observations Ap-plied to Tomographic Stack Emission Measurements. Remote Sensing, MDPI, 2018, 10 (5), pp.678.�10.3390/rs10050678�. �hal-02505658�

remote sensing
Article
Near Real-Time Ground-to-Ground InfraredRemote-Sensing Combination and InexpensiveVisible Camera Observations Applied toTomographic Stack Emission Measurements
Philippe de Donato *, Odile Barres, Judith Sausse and Delphine Martin
GeoRessources Laboratory, Université de Lorraine, CNRS, CREGU, BP 70239, F-54506 Vandoeuvre-lès-Nancy,France; [email protected] (O.B.); [email protected] (J.S.);[email protected] (D.M.)* Correspondence: [email protected]
Received: 23 March 2018; Accepted: 24 April 2018; Published: 26 April 2018�����������������
Abstract: Evaluation of the environmental impact of gas plumes from stack emissions at the locallevel requires precise knowledge of the spatial development of the cloud, its evolution over time,and quantitative analysis of each gaseous component. With extensive developments, remote-sensingground-based technologies are becoming increasingly relevant to such an application. The difficultyof determining the exact 3-D thickness of the gas plume in real time has meant that the variousgas components are mainly expressed using correlation coefficients of gas occurrences and pathconcentration (ppm.m). This paper focuses on a synchronous and non-expensive multi-angledapproach combining three high-resolution visible cameras (GoPro-Hero3) and a scanning infrared(IR) gas system (SIGIS, Bruker). Measurements are performed at a NH3 emissive industrial site(NOVACARB Society, Laneuveville-devant-Nancy, France). Visible data images were processed bya first geometrical reconstruction gOcad® protocol to build a 3-D envelope of the gas plume whichallows estimation of the plume’s thickness corresponding to the 2-D infrared grid measurements. NH3
concentration data could thereby be expressed in ppm and have been interpolated using a secondgOcad® interpolation algorithm allowing a precise volume visualization of the NH3 distribution inthe flue gas steam.
Keywords: infrared remote sensing; visible camera; gas plume; stereoscopy; numerical interpolation;3-D reconstruction; gas concentrations
1. Introduction
Several epidemiological studies have found a short-term association between air pollution andmortality. These results were established in French, European and American multicenter studies aswell as through the compilation of numerous studies [1]. This is an obvious and sufficient reasonfor air monitoring to become an essential element in any type of human or industrial activity atthe local level [2,3]. Among the various techniques, ground-based infrared (IR) remote-sensingtechnologies are promising for the large-scale monitoring of atmospheric gas plume detection [4–8].The potentialities of these technologies have been particularly demonstrated in volcanology [9–12].Recently, Reiche et al. [13], by evaluating different techniques of ground-based optical remote sensingin field conditions by a gas tracer experiment, revealed that the passive Open Path–Fourier-transforminfrared (FTIR) spectrometer is a valuable tool for rapid detection and imaging of emission sourcesand spatial tracer gas distribution [14,15]. However, three parameters are essential for imaging andevaluating the environmental impact of any atmospheric gas plume: (i) the exact spatial boundary of
Remote Sens. 2018, 10, 678; doi:10.3390/rs10050678 www.mdpi.com/journal/remotesensing

Remote Sens. 2018, 10, 678 2 of 15
the cloud; (ii) its evolution over time; and (iii) quantitative analysis of each gaseous component presentin the cloud. Determination of gas concentration (ppm) (parts per million) is a challenge because of thedifficulty in determining in real time the exact size of the column density, i.e., the thickness of the cloudin three dimensions, in order to provide gas concentrations in ppm instead of correlation coefficientor path concentration (ppm.m), which are the units used in infrared remote-sensing monitoring [13].Stereoscopic measurements, i.e., multi angle observations, in combination with a 3-D reconstructionmodeler, are the only way to achieve this objective [16–18]. As for hyperspectral imaging [19–22],spectral data must be collected simultaneously by at least three different remote devices combinedwith a specific reconstruction procedure [23–25]. Without such an approach, the spatial distributionof the different gas components can only be expressed in terms of the correlation coefficients of gasoccurrences and path concentration (ppm.m). Numerous papers are related to satellite remote-sensingstudies but a smaller number has been devoted to ground-based infrared remote sensing. As citedearlier, the most advanced 3-D experimental simulation of gas plumes was conducted by [17,18].In their work, the authors used, respectively, (i) two scanning imaging systems (SIGIS, Bruker) in twodifferent locations in combination with a specific discretized model; and (ii) one scanning imagingsystem (SIGIS, Bruker,) quickly and successively located in three different positions in combinationwith a gOcad® reconstruction model (SKUA-GOCAD™—Paradigm® 14.1—http://www.pdgm.com/products/skua-gocad/). Because of ground-based measurements at the local scale, 3-D reconstructionmodels are less complicated than those used for a satellite or aerial data set [26–29].
The present paper has been written taking into account the three following observations:
- from a technical point of view, there must be an inexpensive and quick remote-imagingmonitoring system, easily transportable and adaptable to any type of land configuration;
- from a scientific point of view, one must be able to determine the size of the column density toprovide gas concentrations in ppm;
- from a practical point of view, most mixed gaseous emissions have a visible atmospheric trace.
To do this, the paper presents a new advance in 3-D ground-based chemical monitoring ofgas plumes. The study was mainly conducted on stack emissions with a visible atmospheric trace.Assuming that the atmospheric dispersion is equal for all the gases emitted at the same time bya chimney, the results lead to a new protocol of measurements combining, at the same time, visibleobservations at multiple angles (visible camera GoPro Hero3), scanning imaging IR measurements(SIGIS Bruker) and 3-D geometrical reconstruction of the gas plume using specific gOcad® protocols.The visible data set is used to geometrically reconstruct the volume of the gas plume using a firstspecific gOcad® procedure. This makes it possible to calculate, in the three dimensions, the exactthickness of the column density cut by each pixel measurements of the 2-D infrared grid. Consequently,the infrared grid can be converted to a 2-D matrix of the real gas concentrations in ppm. Finally,the gas concentration property propagates within the whole plume volume using a second gOcad®
interpolation procedure. The volumic distribution of gas concentration can be calculated which allows,for example, determination of the proportions of gas components in the total volume of the gas plume.This methodology is applied to the monitoring of flue streams of an ammonia/water vapor (NH3/H2O)gas mixture (NOVACARB Society, Laneuveville-devant-Nancy, France). Interest in this approach fortomographic gas plumes measurements without any visible trace is also discussed.
2. Material and Methods
2.1. Stereoscopic Measurements (Multi-Angles) in Real Time by Visible Cameras
Real-time monitoring of the visible trace of a gaseous plume is achieved by the use of threevisible cameras of the GoPro Hero3 type located at three different viewing angles. Such simultaneousstereoscopic measurements are necessary for a 3-D reconstruction of the gas plume. The cameras areremotely controlled via a Wi-Fi network using a digital tablet (HP Pro 10 EE GI Hewlett Packard).
Remote Sens. 2018, 10, 678 3 of 15
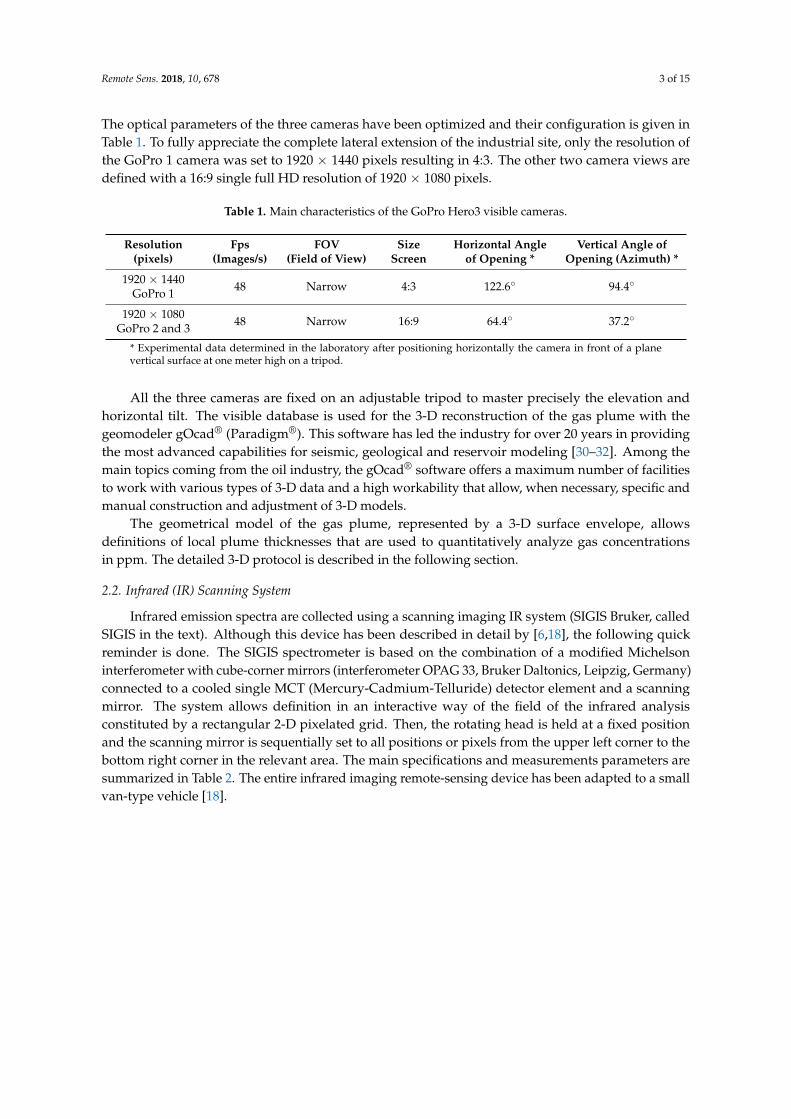
The optical parameters of the three cameras have been optimized and their configuration is given inTable 1. To fully appreciate the complete lateral extension of the industrial site, only the resolution ofthe GoPro 1 camera was set to 1920 × 1440 pixels resulting in 4:3. The other two camera views aredefined with a 16:9 single full HD resolution of 1920 × 1080 pixels.
Table 1. Main characteristics of the GoPro Hero3 visible cameras.
Resolution(pixels)
Fps(Images/s)
FOV(Field of View)
SizeScreen
Horizontal Angleof Opening *
Vertical Angle ofOpening (Azimuth) *
1920 × 1440GoPro 1 48 Narrow 4:3 122.6◦ 94.4◦
1920 × 1080GoPro 2 and 3 48 Narrow 16:9 64.4◦ 37.2◦
* Experimental data determined in the laboratory after positioning horizontally the camera in front of a planevertical surface at one meter high on a tripod.
All the three cameras are fixed on an adjustable tripod to master precisely the elevation andhorizontal tilt. The visible database is used for the 3-D reconstruction of the gas plume with thegeomodeler gOcad® (Paradigm®). This software has led the industry for over 20 years in providingthe most advanced capabilities for seismic, geological and reservoir modeling [30–32]. Among themain topics coming from the oil industry, the gOcad® software offers a maximum number of facilitiesto work with various types of 3-D data and a high workability that allow, when necessary, specific andmanual construction and adjustment of 3-D models.
The geometrical model of the gas plume, represented by a 3-D surface envelope, allowsdefinitions of local plume thicknesses that are used to quantitatively analyze gas concentrationsin ppm. The detailed 3-D protocol is described in the following section.
2.2. Infrared (IR) Scanning System
Infrared emission spectra are collected using a scanning imaging IR system (SIGIS Bruker, calledSIGIS in the text). Although this device has been described in detail by [6,18], the following quickreminder is done. The SIGIS spectrometer is based on the combination of a modified Michelsoninterferometer with cube-corner mirrors (interferometer OPAG 33, Bruker Daltonics, Leipzig, Germany)connected to a cooled single MCT (Mercury-Cadmium-Telluride) detector element and a scanningmirror. The system allows definition in an interactive way of the field of the infrared analysisconstituted by a rectangular 2-D pixelated grid. Then, the rotating head is held at a fixed positionand the scanning mirror is sequentially set to all positions or pixels from the upper left corner to thebottom right corner in the relevant area. The main specifications and measurements parameters aresummarized in Table 2. The entire infrared imaging remote-sensing device has been adapted to a smallvan-type vehicle [18].

Remote Sens. 2018, 10, 678 4 of 15
Table 2. Main characteristics and measurement parameters of scanning imaging scanning infrared gassystem (SIGIS) system applied to NH3 detection.
Parameter Value/Type
Interferometer type Bruker OPAG 33Spectral range 3900–600 cm−1
NH3 detection window 1050–900 cm−1
Spectral resolution 4 cm−1
Apodization function TriangularZero filling 1Phase correction Power spectrumMaximum spectral rate (Resolution: 4 cm−1) 16 spectra/sField of view 10 mradMaximal horizontal field of regard 360◦
Maximal vertical field of regard 60◦
Horizontal field of view (SIGIS visible camera) 46◦
Vertical field of view (SIGIS visible camera) 30◦
Number of pixels in a measurement grid 187 (17 × 11)Acquisition time for one grid (s) 23
The normal analysis mode has been selected, which means that all the pixels of an infrared gridare measured and analyzed. The total analysis time was 15 min starting at 01:40 p.m. (GMT) andending at 01:55 p.m. (GMT), corresponding to 39 analyzed grids.
The internal data-processing algorithm described by [16,33] makes it possible to express thecorrected brightness temperature spectra of each gas in terms of the correlation coefficient (R).The calculation procedure is repeated successively for each pixel of the 2-D projection and can berepeated for all gas compounds of the spectral library. In this paper, we focused on NH3 dispersedin the flue gas streams to illustrate the reliability of the entire procedure. For this purpose, Figure 1shows the measured and theoretical infrared emission (Bruker Gases Library, Opus Software, Ettlingen,Germany) profiles of NH3 corresponding to a correlation coefficient of 0.62 in the spectral detectionwindow used in this study (1000 to 900 cm−1).
Due to the absence of NH3 in normal atmospheric composition, an atmospheric referenceis required.
Figure 1. Comparison of the typical infrared emission profiles of NH3 for a correlation coefficient of0.62 (measured emission spectrum in blue, reference emission spectrum in red).
2.3. Positioning of the Various Devices on the Industrial Site
All experiments were carried out on a chemical industrial site (NOVACARB Society,Laneuveville-devant-Nancy, France) with specific emissions of NH3 in flue gas streams. These gasemissions can potentially come from four different chimneys depending on the upstream industrial process.Figure 2 gives an overview of the positioning of infrared and visible measurement systems on the industrial

Remote Sens. 2018, 10, 678 5 of 15
area. The location of the emissive chimneys is indicated (green oval) as well as the corresponding fields ofview of each device (blue lines for visible cameras, yellow lines for the IR imaging system).
Figure 2. Aerial view of the chemical industrial site (NOVACARB, Laneuveville-devant-Nancy, France)with the location of the potential NH3 emissive chimneys (green oval). The extended French Lambert IIcoordinates of the visible and infrared systems are indicated as well as their corresponding field of view(visible cameras: dark blue lines for tight field of view and light blue for large field of view, Table 1, IRimaging system: yellow lines, for numerical values see Table 1) and their optical axes (bisecting lines).
The vertical and horizontal tilts of the GoPro optical axes are measured, in degrees, withan accurate digital inclinometer at a resolution of 0.1 degrees. The GeDetekt (BRUKER) softwareis related to a user-defined measurement window (see Table 2) that directly controls the locationof the SIGIS infrared system. The positioning parameters are summarized in Table 3 and the mainatmospheric parameters during the measurements in Table 4. The Global Positioning System (GPS)parameters are recorded by a Magellan® eXplorist® 610 (MiTAC Digital Corp, Taipei, Taiwan).
Table 3. Main parameters of positioning of measuring systems.
Type Global Positioning System(GPS) Coordinates
GPS Altitude(m)
Horizontal Tilt(◦)
Tilt of the Optical Axis(◦)
SIGIS BRUKER
N 48◦38’11.1”O 06◦15’04.4”X = 889,749 m
Y = 2,411,443 m
222 0 0
Camera GoProPosition 1
N 48◦38’10.0”O 06◦15’51.1”X = 889,476 m
Y = 2,411,804 m
226 0 2.3
Camera GoProPosition 2
N 48◦38’12.7”O 06◦15’40.8”X = 889,265 m
Y = 2,411,469 m
226 0 1.7

Remote Sens. 2018, 10, 678 6 of 15
Table 3. Cont.
Type Global Positioning System(GPS) Coordinates
GPS Altitude(m)
Horizontal Tilt(◦)
Tilt of the Optical Axis(◦)
Camera GoProPosition 3
N 48◦38’27.6”O 06◦15’35.2”X = 889,127 m
Y = 2,411,923 m
213 −4.6 0.6
Table 4. Main atmospheric parameters during measurements (12 September 2016).
DataStarting Time
1:40 p.m.(GMT)
Ending Time1:55 p.m. (GMT)
Atmospheric CO2 (ppm) 416 396Temperature (◦C) 31 31
Relative humidity (%) 34 33Atmospheric pressure (hPa) 1015 1015
Wind velocity (km/h) 4 15Wind direction (◦) 210 180
Visibility (km) 35 18Precipitation (mm/h) 0 0
2.4. 3-D Modeling Protocol Using the Paradigm gOcad® Software
2.4.1. Gas-Plume Reconstruction
For the 3-D modeling approach, it has been assumed that the visible atmospheric dispersion is thetotal of all gases emitted at the same time by a chimney. The visible trace of the gas plume, mainly dueto H2O vapor, delimits the entire envelope of all the gases emitted with various NH3 concentrations.The 3-D reconstruction is based on the combination of visible GoPro cameras and SIGIS images thatare precisely relocated. The XYZ georeferencing of the images is realized using the geometrical andoptical criteria of the different cameras (see Table 3). Figure 3 schematically shows all the geometricaland angular data, respecting the viewing angles, the heights of the cameras, the XYZ location of thecameras and the point of view of the shot.
Figure 3. Schematic view of shot angles of GoPro or SIGIS cameras. From the origin of the camera (X0,Y0, Z0) an optical axis is defined which respects the tilt and the horizontal and vertical field of viewwhose values are indicated in Tables 3 and 4. Only three pixels (Pixeli), of the infrared measurementgrid have been shown as an example.

Remote Sens. 2018, 10, 678 7 of 15
A rectangular surface is defined and constrained by these angular data and the target of the shot:the NOVACARB chimney (bottom located at X4, Y4, Z4). The visible image is then precisely located,adapted and draped onto this surface using gOcad® abilities [34]. The IR image is also referenced usingthe same geometric and angular constraints. As an example, in Figure 3, 3 pixels of IR measurementsare located (X1-2-3, Y1-2-3, Z1-2-3) and correspond to the concentration in ppm.m in the gas plume.
The 3-D reconstruction is now presented step by step in Figure 4. The first visible GoPro images ofthe gas plume are imported and adapted and draped on 3-D surfaces of specific sizes and orientationsaccording to the position of the camera and the optical parameters (Figure 4a,b). This georeferencing isalso done for the IR image. Then, the GoPro 3D images allow the picking of the gas plume envelope inthe 3 image orientations (Figure 4c,d). An image treatment is done automatically to define the edge ofthe plume using a thresholding. This operation defines a binary image (black, plume; and white, edgeof the plume). The edge picking is then done manually following the defined white line within thegOcad® project. On the basis of this picking a first volume is constructed that respects the three discretesections of the plume. This initial raw volume (Figure 4e) is then defined and geometrically interpolatedusing the discrete smooth interpolation (DSI) algorithm of gOcad® [24] which makes it possible toobtain a smooth, objective and realistic final shape of the gas plume (Figure 4f). The difference ofvolumes between the raw envelop (1416 m3, Figure 4e) and the final interpolated plume envelope(1603 m3, Figure 4f) is equal to 187 m3. The interpolation operation impacts the final volume at an orderof magnitude of 10%. The bounding box of the plume is a parallelepiped with a 19 m × 9.9 m × 19 m(height) size.
Figure 4. Different steps of 3-D reconstruction of the gas plume using gOcad® abilities. See the text formore details.
SIGIS IR measurements define path concentration (ppm.m) value for 11 × 17 pixels relocated in3-D and which intersect or not the 3-D gas plume. For each pixel, a line can be drawn that connectsthe position of the SIGIS camera and one of the 11 × 17 pixels (Figure 4f). However, only lines thatintersect the 3-D gas plume are now taken into account to define the intersecting distance within theplume. The choice of keeping only distances of plume intersections higher than one meter was done(see the black lines that intersect the plume between two red dots in Figure 4f).

Remote Sens. 2018, 10, 678 8 of 15
2.4.2. 3D NH3 Concentrations within the Plume
At this first step, only the 2D SIGIS grid supports the NH3 value of path concentration propertyvalue. However, this discrete property could be extended all along each line that intersects theplume and connects a pixel of the grid. The NH3 path concentration is thus an integrated value thatcharacterizes a segment of specific length (Figure 4f).
In order to visualize the global volume, a regular 3D grid (gOcad® voxet object) is built with the sameresolution as the SIGIS grid (2D-pixel size equivalent to 3D-voxel size). In this grid a volumic region isdelimited using the plume surface envelope. A generic NH3 concentration property is created throughoutthe whole 3D regular grid and is equal to a value without date outside the the envelope area. The voxelswithin the region (gas plume) are then specifically defined with the NH3 property supported by eachprevious intersecting line: a line that intersects a voxel allows the transfer of its property value at the voxelcenter. This propagation of the NH3 properties in the 3D regular grid remains at this step discrete pointswithin voxels, along the intersecting lines. A final DSI interpolation allows propagation (neighborhoodpropagation) and interpolation of the NH3 property within all the voxels within the gas-plume region.
3. Results and Discussion
3.1. Generality
In order to properly visualize all the measuring systems on the industrial site Figure 5 shows thedifferent fields of view recorded by (i) the three visible cameras GoPro Hero3 cameras (Positions 1,2 and 3); and (ii) the scanning infrared system (Figure 5, picture at the bottom right). A zoom of thepicture is proposed for positions 1, 2 and 3 to appreciate and delimit the NH3 plume. The SIGIS imageis presented without any zoom and the red rectangle represents the IR measurement grid. The exactdistances between the images from the target chimney are 278 m, 273 m, 406 m and 380 m for GoPro 1,GoPro 2, GoPro 3 and SIGIS respectively.
Figure 5. The different raw images at the same time of the 3 visible cameras (GoPro Hero3 with zoom)and the scanning imaging system (SIGIS Bruker without zoom) during the measurements. The infraredmeasurement grid is also indicated (red rectangle).

Remote Sens. 2018, 10, 678 9 of 15
Figure 6 shows a typical 2-D measurement plane where the NH3 concentrations are expressedin ppm.m for each of the 187 pixels. The SIGIS measurements (Figure 6) clearly show that severalchimneys have atmospheric releases of ammonia. However, only the most important left-hand chimneyplume was treated for the reconstruction of the 3-D plume (Figure 4f). According to the 3-D modelingprotocol using the Paradigm gOcad® software presented in Figure 4, the final volume of the gas plumewas calculated and is equal to 1603 m3.
Figure 6. Illustration of a two-dimensional distribution of ammonia path concentration (ppm.m). (Date:12 September 2016 at 01:45 p.m. GMT). View from SIGIS position as illustrated in Figures 2 and 5(48◦38′11.1”N and 6◦16′04.4”E).
3.2. Distances within the Gas Plume
The final characteristic distances within the plume (Figure 4f) are summarized in Table 5. The gasconcentrations in the plume are obtained by dividing the concentration in ppm.m by the intersectingdistance (distance between two points of plume intersection, see Figure 4c,d). The results are shown inTable 5, and NH3 gas concentrations are distributed between a minimum value of 35 ppm (pixel F8)and maximum value of 162 ppm (point I8).
The uncertainty concerning the concentration calculations comes from the definition of theintersection distances and these distances are directly related to the shape of the plume. To estimatethe uncertainty linked to this envelope definition, we have calculated intersection distances betweenthe SIGIS lines and the raw envelope without any smoothing and interpolation (see Figure 4e),and compare them to the intersection distances after the DSI interpolation (see Figure 4f). The raw andinterpolated volumes correspond, respectively, to a volume of 1603 m3 and 1416 m3. The differencebetween them is 187 m3 i.e., 11.6% of the plume volume. The intersection distances calculatedfor the raw volume and the interpolated one have been compared and concentrations are thenrecalculated using the two types of values. The main uncertainty could then be described regardingthe concentration amplitudes (max–min) and the results are summarized in Table 6. The ppmconcentrations coming from the raw volume intersections show a minimum value of 40 ppm anda maximum value of 159 ppm that are quite similar to the concentrationd used and finally proposed inTable 5. These extreme values are observed for the same pixel (F8 and I8).

Remote Sens. 2018, 10, 678 10 of 15
Table 5. The SIGIS measurement window showing the path concentration (ppm.m) measured for the11 × 17 pixels. The table mentions the intersection distances between the gas plume and the linesdefined between the location of the SIGIS and the pixel (pixels G7, F7, etc.) in the gas plume (darksquare around pixels on the SIGIS window).
IntersectionDistance (m)
Concentration(ppm)ppm.m
C8 699 6.68 104.61C9 687 9.80 70.08C10 707 8.75 80.79C11 647 8.26 78.33D8 594 7.28 81.61D9 647 11.16 57.99
D10 658 12.14 54.21D11 611 12.91 47.31D12 451 8.34 54.06E8 511 8.01 63.80E9 586 10.54 55.60
E10 598 11.17 53.55F7 469 5.67 82.75F8 351 10.02 35.02F9 452 10.18 44.38F10 567 8.65 65.54G7 299 3.43 87.21G8 364 8.22 44.28G9 385 8.67 44.39G10 319 5.03 63.42H8 192 5.23 36.69H9 316 4.48 70.58I8 305 1.89 161.71
Table 6. Main uncertainties described in terms of distance and concentration amplitudes before andafter interpolation.
Distance (m) Concentration (ppm)
Raw Volume Interpolated Volume Raw Volume Interpolated Volume
mean 8.1 6.9 66.9 81.0standard deviation 2.8 3.0 26.5 36.5
min 1.89 0.8 35.02 39.7max 12.91 12.2 161.71 170.3
3.3. Quantitative Spatial Distribution of NH3 in the Gas Plume
Table 5 shows that the distribution of NH3 concentrations in the visible plume varies from 35 ppmto 162 ppm. At this specific industrial site, the maximum tolerance standard, defined by prefecturalorder (French Republic, Code of Environment, Art. R515-75, Decree n◦2013-374 from 2 May 2013),is equal to 60 ppm. The proximity of other sources (Figure 7, chimneys 1 and 2), where the presence ofsurrounding NH3 plumes is demonstrated (see Figure 6 and Table 5), can easily explain higher NH3
values. Moreover, diffuse emissions are still present on the entire site. All these emissions (channeledand diffuse) combine with the measurement plume leading to a slight overestimation of the actualNH3 concentration in it.
By combining the data in Table 5 and the interpolated volume of the gas plume (Figure 4f),the experimental 3-D NH3 concentrations in the gases emitted from the chimney can be calculated.The result is given in Figure 8. The concentration values are extrapolated within the entire volumeusing gOcad® DSI interpolation and then can be determined in any point of the modeled plume.In order to appreciate the heterogeneity of the NH3 distribution, the right-hand part of Figure 8corresponds to a zoom of three transverse cross-sections made at three different altitudes in the gascloud. On these three sections, the highest NH3 values are mainly located on the right side of the

Remote Sens. 2018, 10, 678 11 of 15
gas plume, which corresponds to partial overlap with other additional emission sources, as shownin Figure 7 for example. Moreover, in the central cross-section, it is clear and logical that the highestemission value of NH3 (161.7 ppm, pixel I8 of Table 5) is detected only at the chimney exit.
Figure 7. Location of other measured sources of ammonia (chimneys 1 and 2) near the measured plume(view from the GoPro camera in position 2).
Figure 8. Experimental 3-D gOcad® modeling of the concentration of NH3 (ppm) in the gases emittedby the chimney. The right part corresponds to a zoom of three transverse cross-sections made at threedifferent depths in the gas cloud.
The data presented in Figure 8 make it possible to calculate the different proportions of NH3 in thetotal volume of the gaseous plume (Figure 9). Figure 9 shows the distribution histogram of the relativeconcentrations of NH3 in the volume of the plume. The two most abundant surface isoconcentrationsare, respectively, 44 ppm and 54 ppm, which represent about 30% (9.8% and 18% respectively) of thetotal gas volume. On the contrary, the gas-plume volume within a surface isoconcentration of 161 ppmrepresents less than 4% of the emitted ammonia. In addition, 94% of the gas plume is characterized byan NH3 concentration below 80 ppm (Figure 9 bottom). Such an analysis is of prime importance for

Remote Sens. 2018, 10, 678 12 of 15
the monitoring of air quality at an emissive industrial site and for the knowledge of the associatedenvironmental impacts, whether in a normal or crisis situation.
Figure 9. Analysis of the spatial distribution of NH3 in the gas plume: (top) relative proportion fordifferent concentrations in the volume of the gas plume, (bottom) cumulative proportion for differentconcentrations in the volume of the gas plume.
4. Applications to Other Types of Gas Plume
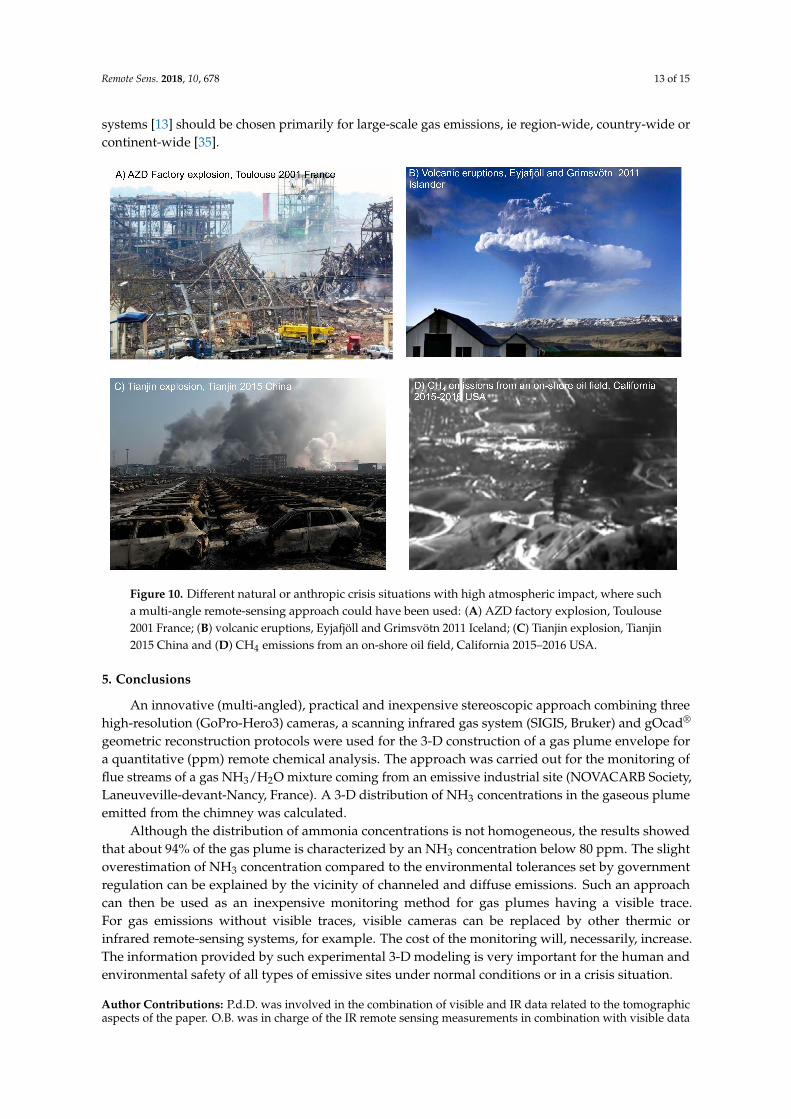
The association of infrared remote-sensing and visible cameras is only available for tomographicmeasurements of gas emissions having a visible trace. This visible trace can be due to the gas itself(for example SO2) or to other gas components (for example, water vapor, organic or mineral particles).By way of illustration, Figure 10 shows some past examples where these tomographic measurementscould have been applied. The different events are related to some natural or anthropogenic crisissituations, respectively:
- AZD Factory explosion, Toulouse 2001 France, where the visible trace is mainly associated withorganic/mineral particles (Figure 10A);
- volcanic eruptions where the visible trace is mainly associated with particles and water vapor,Eyjafjöll and Grimsvötn 2011 Iceland (Figure 10B);
- Tianjin explosion, where the visible trace is a very complex association of particles and gases,Tianjin 2015 China (Figure 10C);
- and CH4 emissions from an on-shore oil field where the visible trace is mainly associated withorganic particles, California 2015–2016 (USA) (Figure 10D).
In the case of gas plumes without a visible trace, visible camera could be replaced by specificthermic cameras or by additional infrared remote-sensing systems [17,18]. In these situations, the costof the measurements will be much higher. But in any case, the gOcad® approach developed inthis paper is still fully transposable both for the 3-D reconstruction of the gas plume and for the3-D modeling of gas concentrations (ppm). Also in economic terms, the use of satellite or airborne
Remote Sens. 2018, 10, 678 13 of 15
systems [13] should be chosen primarily for large-scale gas emissions, ie region-wide, country-wide orcontinent-wide [35].
Figure 10. Different natural or anthropic crisis situations with high atmospheric impact, where sucha multi-angle remote-sensing approach could have been used: (A) AZD factory explosion, Toulouse2001 France; (B) volcanic eruptions, Eyjafjöll and Grimsvötn 2011 Iceland; (C) Tianjin explosion, Tianjin2015 China and (D) CH4 emissions from an on-shore oil field, California 2015–2016 USA.
5. Conclusions
An innovative (multi-angled), practical and inexpensive stereoscopic approach combining threehigh-resolution (GoPro-Hero3) cameras, a scanning infrared gas system (SIGIS, Bruker) and gOcad®
geometric reconstruction protocols were used for the 3-D construction of a gas plume envelope fora quantitative (ppm) remote chemical analysis. The approach was carried out for the monitoring offlue streams of a gas NH3/H2O mixture coming from an emissive industrial site (NOVACARB Society,Laneuveville-devant-Nancy, France). A 3-D distribution of NH3 concentrations in the gaseous plumeemitted from the chimney was calculated.
Although the distribution of ammonia concentrations is not homogeneous, the results showedthat about 94% of the gas plume is characterized by an NH3 concentration below 80 ppm. The slightoverestimation of NH3 concentration compared to the environmental tolerances set by governmentregulation can be explained by the vicinity of channeled and diffuse emissions. Such an approachcan then be used as an inexpensive monitoring method for gas plumes having a visible trace.For gas emissions without visible traces, visible cameras can be replaced by other thermic orinfrared remote-sensing systems, for example. The cost of the monitoring will, necessarily, increase.The information provided by such experimental 3-D modeling is very important for the human andenvironmental safety of all types of emissive sites under normal conditions or in a crisis situation.
Author Contributions: P.d.D. was involved in the combination of visible and IR data related to the tomographicaspects of the paper. O.B. was in charge of the IR remote sensing measurements in combination with visible data

Remote Sens. 2018, 10, 678 14 of 15
acquisition. She was also involved in the IR data treatments (path concentrations and concentrations). J.S. wasin charge of the elaboration of the interpolation algorithms using gOcad® software. D.M. was in charge of thetechnical aspects related to the near real time observations with visible cameras.
Acknowledgments: The authors would like to thank NOVACARB Society (Laneuveville-devant-Nancy, France)for giving them access to their industrial site and Renaud DESCAMPS (NOVACARB) for his scientific contribution.The authors also associate the National French Agency (ANR, Program N◦ ANR-07-PCO2-007-08, SENTINELLE)and the European Fund of Regional Development (FEDER) for their financial support in the acquisition ofthe SIGIS remote-sensing system used in this study. They also thank the industrial and academic membersof the gOcad® Consortium and ASGA for their support, especially Paradigm Geophysical for the supply ofgOcad® software.
Conflicts of Interest: The authors declare no conflicts of interest.
References
1. Pascal, L. Short-term health effects of air pollution on mortality. Rev. Mal. Respir. 2009, 26, 207–219.[CrossRef]
2. Herget, W.F.; Brashers, J.D. Remote Fourier transform infrared air pollution studies. Opt. Eng. 1980, 19,194508–194515. [CrossRef]
3. Marshall, T.L.; Chaffin, C.T.; Hammaker, R.M.; Fately, W.G. An introduction to open-path FT-IR Atmosphericmonitoring. Environ. Sci. Technol. 1994, 28, 224A–232A. [CrossRef] [PubMed]
4. Beil, A.; Daum, R.; Harig, R.; Matz, G. Remote sensing of atmospheric pollution by passive FTIR spectrometry.Proc. SPIE 1998, 3493, 32–43. [CrossRef]
5. Schütze, C.; Lau, S.; Reiche, N.; Sauer, U.; Borsdorf, H.; Diet, P. Ground-based remote sensing withopen-path Fourier-transform infrared (OP-FTIR) spectroscopy for large-scale monitoring of greenhousegases. Energy Procedia 2013, 37, 4276–4282. [CrossRef]
6. Harig, R.; Rusch, P.; Dyer, C.; Jones, A.; Moseley, R.; Truscott, B. Remote measurement of highly toxic vaporsby scanning imaging Fourier-transform spectrometry. Proc. SPIE 2005, 5995, 316–327. [CrossRef]
7. Harig, R.; Matz, G.; Rusch, P.; Gerhard, H.; Gerhard, J.; Schlabs, V. Infrared remote sensing of hazardousvapours: Surveillance of public areas during the FIFA Football World Cup 2006. Proc. SPIE 2007, 6538,65381Z:1–65381Z:10. [CrossRef]
8. Bradley, K.S.; Brooks, K.B.; Hubbard, L.K.; Popp, P.J.; Stedman, D.H. Motor vehicle fleet emissions byOP-FTIR. Environ. Sci. Technol. 2000, 34, 897–899. [CrossRef]
9. Burton, M.R.; Oppenheimer, C.; Horrocks, L.A.; Francis, P.W. Remote sensing of CO2 and H2O emissionrates from Masaya volcano, Nicaragua. Geology 2000, 28, 915–918. [CrossRef]
10. Goff, F.; Love, S.P.; Warren, R.G.; Counce, D.; Obenholzner, J.; Siebe, C.; Schmidt, S.C. Passive infrared remotesensing evidence for large intermittent CO2 emissions at Popocatépetl volcano, Mexico. Chem. Geol. 2001,177, 133–156. [CrossRef]
11. Allard, P.; Burton, M.; Muré, F. Spectroscopic evidence for a lava fountain driven by previously accumulatedmagmatic gas. Nature 2005, 433, 407–410. [CrossRef] [PubMed]
12. Kenji, N.; Mori, T. Chemical monitoring of volcanic gas using remote FT-IR spectroscopy at several activevolcanoes in Japan. Appl. Geochem. 2010, 25, 505–512. [CrossRef]
13. Reiche, N.; Westerkamp, T.; Lau, S.; Borsdorf, H.; Dietrich, P.; Schütze, C. Comparative study to evaluatethree ground-based optical remote sensing techniques under field conditions by a gas tracer experiment.Environ. Earth Sci. 2014, 72, 1435–1441. [CrossRef]
14. La Spina, A.; Burton, M.; Allard, P.; Alparone, S.; Muré, F. Open-path FTIR spectroscopy of magma degassingprocesses during eight lava fountains on Mount Etna. Earth Planet. Sci. Lett. 2015, 413, 123–134. [CrossRef]
15. Schütze, C.; Dietrich, P.; Schossland, A.; Möller, I.; Schlömer, S.; Martens, S.; Liebscher, A.; Möller, F.; Sauer, U.Application of monitoring methods for remote detection of atmospheric CO2-Concentration levels duringa back-production test at the Ketzin Pilot Site. Energy Procedia 2015, 76, 528–535. [CrossRef]
16. Harig, R.; Matz, G. Toxic cloud imaging by infrared spectrometry: A scanning FTIR system for identificationand visualization. Field Anal. Chem. Technol. 2001, 5, 75–90. [CrossRef]
17. Rusch, P.; Harig, R. 3-D reconstruction of gas clouds by scanning imaging IR spectroscopy and tomography.Sensors J. IEEE 2010, 10, 599–603. [CrossRef]

Remote Sens. 2018, 10, 678 15 of 15
18. De Donato, P.; Barres, O.; Sausse, J.; Taquet, N. Advances in 3-D infrared remote sensing gas monitoring.Application to an urban atmospheric environment. Remote Sens. Environ. 2016, 175, 301–309. [CrossRef]
19. Thenkaball, P.S.; Enclona, E.A.; Ashton, M.S.; Legg, C.; De Dieu, M.J. Hyperion, IKONOS, ALI, and ETM+sensors in the study of African rainforests. Remote Sens. Environ. 2004, 90, 23–43. [CrossRef]
20. Plaza, A.; Benediktsson, J.A.; Boardman, J.W.; Brazile, J.; Bruzzone, L.; Camps-Valls, G.; Chanussot, J.;Fauvel, M.; Gamba, P.; Gualtieri, A.; et al. Recent advances in techniques for hyperspectral image processing.Remote Sens. Environ. 2009, 113 (Suppl. 1), S110–S122. [CrossRef]
21. Gao, B.-C.; Li, R.-R.; Shettle, E.P. Cloud remote sensing using midwave IR CO2 and N2O slicing channelsnear 4.5 µm. Remote Sens. 2011, 3, 1006–1013. [CrossRef]
22. Lorenz, S.; Salehi, S.; Kirsch, M.; Zimmermann, R.; Unger, G.; Vest Sørensen, E.; Gloaguen, R. Radiometriccorrection and 3D integration of long-range ground-based hyperspectral imagery for mineral exploration ofvertical outcrops. Remote Sens. 2018, 10, 176. [CrossRef]
23. Todd, L.A.; Ramanathan, M.; Mottus, K.; Katz, R.; Dodson, A.; Mihlan, G. Measuring chemical emissionsusing open-path Fourier transform infrared (OP-FTIR) spectroscopy and computer-assisted tomography.Atmos. Environ. 2001, 35, 1937–1947. [CrossRef]
24. Schowengerdt, R.A. Remote Sensing: Models and Methods for Image Processing, 3rd ed.; Academic Press Elsevier:Burlington, MA, USA, 2007; 560p, ISBN 9780123694072.
25. Brito Junior, A.M.; Neto, A.D.D.; de Melo, J.D.; Goncalves, L.M.G. An adaptive learning approach for 3-Dsurface reconstruction from point clouds. Neural Netw. Council 2008, 19, 1130–1140. [CrossRef] [PubMed]
26. Ricciardelli, E.; Romano, F.; Cuom, V. Physical and statistical approaches for cloud identification usingMeteosat Second Generation-Spinning Enhanced Visible and Infrared Imager Data. Remote Sens. Environ.2008, 112, 2741–2760. [CrossRef]
27. Schneider, A.; Friedl, M.A.; Potere, D. Mapping global urban areas using MODIS 500-m data: New methodsand datasets based on urban ecoregions. Remote Sens. Environ. 2010, 114, 1733–1746. [CrossRef]
28. Liua, B.; Chena, X.G.; Guoa, L.P.; Yub, X.Q. A MPB-based remote sensing image 3-D reconstruction system.Optik 2015, 126, 1994–1998. [CrossRef]
29. Zhang, W.; Sunb, X.; Wangb, H.; Fu, K. A generic discriminative part-based model for geospatial objectdetection in optical remote sensing images. ISPRS J. Photogramm. Remote Sens. 2015, 99, 30–44. [CrossRef]
30. Mallet, J.L. Discrete smooth interpolation in geometric modeling. Comput. Aided Des. 1992, 24, 178–191.[CrossRef]
31. Mallet, J.L. Discrete modeling for natural objects. Math. Geol. 1997, 29, 199–219. [CrossRef]32. Mallet, J.L. Geomodeling. In Applied Geostatistics; Oxford University Press: New York, NY, USA, 2002;
ISBN 0-19-514460.33. Harig, R. Passive remote sensing of pollutants clouds by Fourier transform infrared spectrometry: Signal to
noise ratio as a function of spectral resolution. Appl. Opt. 2004, 43, 4603–4610. [CrossRef] [PubMed]34. Caumon, G.; Collon-Drouaillet, P.; Le Carlier de Veslud, C.; Viseur, S.; Sausse, J. Surface-based 3D modeling
of geological structures. Math. Geosci. 2009, 41, 927–945. [CrossRef]35. Houlton, B.Z.; Morford, S.L.; Dahlgren, R.A. Convergent evidence for widespread rock nitrogen sources in
Earth’s surface environment. Science 2018, 360, 58–62. [CrossRef] [PubMed]
© 2018 by the authors. Licensee MDPI, Basel, Switzerland. This article is an open accessarticle distributed under the terms and conditions of the Creative Commons Attribution(CC BY) license (http://creativecommons.org/licenses/by/4.0/).