NDOR Research Project Number MPM-16 Investigation of F ... · NDOR Research Project Number MPM-16...
49
NDOR Research Project Number MPM-16 Investigation of Asphalt Pavement Analyzer Testing Program in Nebraska Minki Hong, Graduate Student Yong-Rak Kim, Ph.D. Department of Civil Engineering College of Engineering W351 Nebraska Hall Lincoln, Nebraska 68588-0531 Telephone (402) 472-1727 FAX (402) 472-8934 Sponsored By Nebraska Department of Roads June, 2008 F I N A L R E P O R T
Transcript of NDOR Research Project Number MPM-16 Investigation of F ... · NDOR Research Project Number MPM-16...

NDOR Research Project Number MPM-16
Investigation of Asphalt Pavement Analyzer Testing
Program in Nebraska
Minki Hong, Graduate Student
Yong-Rak Kim, Ph.D.
Department of Civil Engineering College of Engineering
W351 Nebraska Hall
Lincoln, Nebraska 68588-0531 Telephone (402) 472-1727
FAX (402) 472-8934
Sponsored By
Nebraska Department of Roads
June, 2008
F I
N A L
R E P O R T
1
Technical Report Documentation Page 1. Report No
MPM-16 2. Government Accession No. 3. Recipient’s Catalog No.
4. Title and Subtitle
Investigation of Asphalt Pavement Analyzer (APA) Testing Program in Nebraska
5. Report Date
March 28, 2008
6. Performing Organization Code
7. Author/s
Minki Hong and Yong-Rak Kim 8. Performing Organization Report No.
MPM-16 9. Performing Organization Name and Address University of Nebraska-Lincoln (Department of Civil Engineering)
10. Work Unit No. (TRAIS)
W351 NH, PO Box 880531, Lincoln, NE 68588 11. Contract or Grant No.
26-1107-0097-001 12. Sponsoring Organization Name and Address Nebraska Department of Roads (NDOR) 1400 Highway 2, PO Box 94759, Lincoln, NE 68509
13. Type of Report and Period Covered
14. Sponsoring Agency Code
15. Supplementary Notes
16. Abstract The asphalt pavement analyzer (APA) has been widely used to evaluate hot-mix asphalt (HMA) rutting potential in mix design and quality control – quality assurance (QC-QA) applications, because the APA testing and its data analyses are relatively simple, rapid, and easy. However, as demonstrated in many studies and also experienced by the state of Nebraska, the APA testing is in question due to its high testing variability and a lack of sufficient correlation with actual filed performance. The primary objective of this research was to find critical materials and/or mixture design factors affecting APA test results so as to eventually improve current APA testing program in Nebraska. In addition to that, development of models to predict APA rut performance with given properties of HMA mixture ingredients and mixture design characteristics were also attempted. To find variables affecting APA rut results and the extent of these variables, SP-4 mixture data from Nebraska and HMA mixture data from Kentucky were statistically analyzed using the multiple linear regression method considering six factors (binder PG, aggregate gradation, nominal maximum aggregate size, aggregate angularity, air voids in mixture, and asphalt content in mixture) as probable candidates significantly affecting APA rut results. For a detailed characterization of gradation effects, three indicators (gradation density, fineness modulus, and restricted zone) were considered and each of them was used for each statistical analysis. Analyses results demonstrated that the binder PG was the only variable that always shows significant impact on APA rut results, which is in a good agreement with other studies. Predicting models developed through the results of multiple linear regression analysis and the artificial neural network technique presented a relatively low level of model adequacy which can be observed by the coefficients of determination and cross-plots between predicted APA rut values and the measured APA rut data. More data would be helpful to confirm the findings from this research and also to develop a better prediction model. 17. Key Words Asphalt Pavement Analyzer (APA), Rutting, Superpave, Hot-Mix Asphalt (HMA), Pavement
18. Distribution Statement
19. Security Classification (of this report)
Unclassified 20. Security Classification (of this page)
Unclassified 21. No. Of Pages
47 22. Price
Form DOT F 1700.7 (8-72) Reproduction of form and completed page is authorized

2
TABLE OF CONTENTS
Page
CHAPTER
1 INTRODUCTION ....................................................................................... 5 Research Objectives ............................................................................... 5 Research Scope ....................................................................................... 6 Organization of the Report ..................................................................... 6
2 LITERATURE REVIEW ............................................................................ 7
3 RESEARCH METHODOLOGY ................................................................ 14 Multiple Linear Regression Analysis ..................................................... 14 Artificial Neural Network Approach ...................................................... 19 APA Data for Analyses .......................................................................... 20
4 ANALYSIS RESULTS AND DISCUSSION ............................................. 25
Analysis of Significance ......................................................................... 25 Development of Prediction Models ........................................................ 30
5 CONCLUDING REMARKS ...................................................................... 38
Conclusions ............................................................................................ 38 Recommended Further Studies ............................................................... 39 NDOR Implementation Plan .................................................................. 39 REFERENCES .......................................................................................................... 40 ACKNOWLEDGMENTS ......................................................................................... 43 APPENDIX A ............................................................................................................ 44 APPENDIX B ............................................................................................................ 47

3
LIST OF FIGURES
FIGURE Page
2.1. Effect of Nominal Maximum Aggregate Size on Rutting (NCHRP 508, 2003).................................................................................. 9
2.2. Relationship between Binder PG and Rutting at Different Asphalt Content (Uzarowski et al., 2004)……………………………………… . 9 2.3. PURWheel Rut Depths at Different FAA Values (Stiady et al., 2001) ... 11
3.1. Basic Structure of the Artificial Neural Network .................................... 20 3.2. Factors Selected for Analyses .................................................................. 21
3.3. A Gradation Curve with Its Density Characteristics on the 0.45 Power Chart ............................................................................................. 22 3.4. Data Sheet Developed for Statistical Analyses ........................................ 24 4.1. Variation of P-Value with Different FAD in Gradation .......................... 27
4.2. A Gradation Curve with FAD Value Greater Than 27 ............................ 28 4.3. Variation of P-Value with Different CAD in Gradation ......................... 29 4.4. Four Gradation Curves with CAD Value Greater Than 25 ..................... 29
4.5. Cross-Plots between Measured and Predicted Using Model 1 ................ 33
4.6. Cross-Plots between Measured and Predicted Using Model 2 ................ 33
4.7. Cross-Plots between Measured and Predicted Using Model 3 ................ 34
4.8. Process of the Artificial Neural Network Modeling ................................ 35
4.9. Cross-Plots between Measured and Predicted (Training Stage) .............. 36
4.10. Cross-Plots between Measured and Predicted (Validation Stage) ........... 36
4.11. Cross-Plots between Measured and Predicted (Testing Stage) ................ 37
4.12. Multiple Linear Regression vs. Artificial Neural Network ..................... 37

4
LIST OF TABLES
TABLE Page
2.1. Average Rut Depths for WesTrack Sections (NCHRP 508, 2003) ......... 8 2.2. Analysis of Variance for Rut Depths of Mixes (Kandhal and Mallick, 2001) ................................................................... 11 2.3. Statistical Results (Tarefder et al., 2003)................................................. 12 3.1. ANOVA Table from the Multiple Linear Regression Analysis .............. 15 3.2. ANOVA Table Resulting from a Real Multiple Regression Analysis .... 17 3.3. Parameter Estimate from the Multiple Linear Regression Analysis ........ 18 3.4. R2 and adj. R2 Values from the Multiple Linear Regression Analysis .... 19 4.1. Statistical Analysis Results ...................................................................... 26 4.2. Prediction Models from the Multiple Linear Regression Analysis ......... 31 A.1. Datasheet of Nebraska SP-4 Mixtures ..................................................... 44 B.1. Datasheet of Kentucky Mixtures ............................................................. 47

5
CHAPTER 1
INTRODUCTION
The asphalt pavement analyzer (APA) has been widely used in many states as a straightforward
method to evaluate hot-mix asphalt (HMA) rutting potential in mix design and quality control
and quality assurance (QC/QA) applications. The APA is more advantageous than other testing
methods that have been proposed from Strategic Highway Research Program (SHRP) studies,
because the APA testing and resulting data analyses are relatively simple, rapid and easy to
perform. However, as demonstrated in many studies including the national study, NCHRP 9-17
(Kandhal and Cooley, 2003), the APA testing is in question due to its high testing variability and
a lack of sufficient correlation with actual field performance. Nebraska Department of Roads
(NDOR) has employed the APA testing for several years as a supplemental tool to validate and
evaluate rutting potential of Superpave mixes paved in Nebraska. NDOR typically found that
the APA testing data were not sufficiently reliable to judge rutting characteristics of a Superpave
mix because of the high testing variability and poor correlations with actual field performance.
In many cases, APA rut depth monitored from a specific Superpave mix was not consistent with
rut depths from other mixes within the same mix design criteria. Due to this fact, most state
highway agencies have tried to find problems and solutions associated with current APA
techniques, so that they can reach the level of confidence needed to utilize the simple APA
testing to accept or reject HMA mixtures. Nebraska has also accumulated, but not fully
investigated yet, APA testing data of each different mixture that has been paved and in service.
Therefore, there is a pressing need for careful investigations of APA testing and resulting data to
better understand why the high testing variability from specimens within the same mix design
criteria has been observed.
1.1 RESEARCH OBJECTIVES
The primary objective of this research was to seek better understanding and potential
improvements of the current APA testing program incorporated with Superpave specifications
implemented in Nebraska. Comprehensive literature review including careful investigations of
APA data available from both Nebraska (approximately 4-year data) and other states was

6
conducted to find critical factors affecting APA test results and to monitor sensitivity of APA
results with mix design variables. This can minimize currently-observed high testing variability.
In addition, development of models to predict APA rut performance with given properties of
HMA mixture ingredients and mixture design characteristics was targeted. Successful research
provides a form of guidelines that direct appropriate scope in use of APA techniques as a
potential rutting performance-predicting indicator.
1.2 RESEARCH SCOPE
To meet the research goals, this report was performed with three phases. Phase 1 consisted of
literature survey to review significant findings from other studies investigating the variability of
APA test results and sensitivity of APA test results to mixture characteristics. Based on findings
from the literature review, Phase 2 employed statistical approaches to determine which factors of
mixture characteristics affect the APA rut performance with a high level of sensitivity. APA test
data from Nebraska and another state, Kentucky were obtained and used to conduct the statistical
sensitivity analysis. In Phase 3, prediction models were developed using multiple linear
regression analysis and artificial neural network technique. Predicted and measured values were
compared with both methods.
1.3 ORGANIZATION OF THE REPORT
This report is composed of five chapters. Following this introduction, Chapter 2 briefly
summarizes findings from several other studies investigating the effects of HMA mixture and
material characteristics on APA rut test results. In Chapter 3, detailed descriptions of APA data
acquisition and implementation to conduct the statistical analysis, which has been employed for
this study, are presented. Chapter 4 presents statistical analysis results of significant factors that
affect APA rut results and the prediction models developed through the multiple linear
regression analysis and the artificial neural network technique. Finally, Chapter 5 provides a
summary of the findings, recommended future research, and implementation plans to the NDOR
of this study.

7
CHAPTER 2
LITERRATURE REVIEW
To seek better understanding of current APA testing program which typically is in question due
to its high testing variability, literature reviews have been conducted by primarily targeting to
investigate the effects of HMA mixture and material characteristics on rut test results from APA
as well as other traditional wheel-loading testers. This chapter briefly introduces some
significant findings from several studies where the relationship between HMA rutting
performance and related materials and/or mixture design factors has been investigated.
Kandhal and Cooley (2003) performed a National Cooperative Highway Research Program
(NCHRP) study, NCHRP 9-17 project, with two objectives: to identify test conditions within the
APA that produced results most related to field rutting performance and to validate the proposed
APA test method as an appropriate QC/QA rut predicting tool. They selected 10 HMA mixes of
known rutting performance to determine the combination of testing conditions for the APA that
best predicted field rutting. These 10 mixes were selected from three full-scale pavement
research projects: WesTrack (Nevada), the Minnesota Road Research (MnRoad), and the FHWA
Accelerated Loading Facility (ALF) at Turner-Fairbank Highway Research Center (Virginia).
Numerous APA tests were performed under different testing conditions by varying specimen
geometry, APA loading hose diameter, test temperature, and air void content in mixtures. APA
test results were then analyzed and correlated to field performance data. Statistical analysis
results demonstrated that 5-percent air voids were more closely related to field rutting
performance than 7-percent air voids, and specimens tested at a temperature corresponding to the
high temperature of the standard performance grade (PG) better predicted field rutting
performance than at 6oC higher of the high temperature of the standard PG. Loading hose
diameter and the specimen geometry (cylinder vs. beam) did not show any significant
dependency on APA rutting performance. Kandhal and Cooley also tried to validate the
proposed APA test method, and they concluded that laboratory rut depths measured by the APA
generally showed good correlations on individual project basis. However, there was a clear
dependency of the APA results on geographic locations and traffic level.

8
Related to this research, some useful findings from the NCHRP study were found and are
presented in Table 2-1 and Figure 2-1. Table 2-1 shows WesTrack results indicating that the
high value of air voids (7%) was generally more susceptible to rutting than low air voids (4%).
It is obvious that the testing temperature affects APA rut performance. Specimens were better
rut-resistant at the lower temperature (64oC) than at the temperature corresponding to the 6oC
higher (i.e., 70oC) of the high temperature of the standard PG. Figure 2-1 presents the effect of
nominal maximum aggregate size (NMAS) on rut depths. The figure demonstrates that the
larger NMAS mixtures (such as the one with 37.5-mm) had a lower laboratory rut depth than the
mixtures designed with a smaller NMAS (19-mm). Therefore, the use of larger NMAS can
reduce rut susceptibility.
Table 2-1. Average Rut Depths for WesTrack Sections (NCHRP 508, 2003)

9
Figure 2-1. Effect of Nominal Maximum Aggregate Size on Rutting (NCHRP 508, 2003)
Uzarowski et al. (2004) tested accelerated performance of Canadian asphalt mixes using three
different wheel rut testers: French laboratory tester, Hamburg wheel tester and APA. They
controlled asphalt content, binder PG, and cycles of wheel on each testing. Despite the different
methods, the test results revealed similar patterns. First of all, every test showed good
correlation between field observation and testing results. Also, the high level of asphalt content
(5.6%) was more susceptible to rutting performance than the low asphalt contents (4.8%).
Figure 2-2 shows how the modified binder resisted to rutting better than neat binder using the
French laboratory wheel-loading tester.
(a) 4.8% asphalt content (b) 5.6% asphalt content
Figure 2-2. Relationship between Binder PG and Rutting at Different Asphalt Content
(Uzarowski et al., 2004)

10
Cross and Purcell (2001) investigated effects of fine aggregate angularity (FAA) on voids in
mineral aggregates (VMA) and rutting in Kansas HMA mixtures. For the evaluation, two
gradations (coarse and fine) using 100% crushed limestone were used. To change the FAA of
the mix, natural sand and chat were used instead of crushed limestone. Among the three
materials, limestone and natural sand showed an increasing trend of FAA with increasing
mixture VMA. However, chat did not show the same increasing pattern. Increasing the FAA
resulted in less rutting in the limestone and natural sand mixtures, but there was no clear
relationship between the FAA of the chat mixes and rutting.
Lee et al. (1999) found relationship between FAA and asphalt mixture performance. They used
PURWheel designed by Purdue University to evaluate HMA rut potential at different FAA
values. They indicated that the specimen with the high value of FAA showed less susceptibility
than the low value in rutting. The mixture with a FAA value of 45 performed better than the
others.
Stiady et al. (2001) studied effects of aggregate properties (NMAS), coarse aggregate type
(granite and limestone), fine aggregate angularity, and gradation types using PURWheel. As
shown in Figure 2-3, there was a significant relationship between FAA and permanent
deformation, but a FAA value too high (greater than 45) did not show better performance in the
mixtures. They also concluded that a NMAS of 9.5-mm and 19-mm had no difference
statistically.

11
Figure 2-3. PURWheel Rut Depths at Different FAA Values (Stiady et al., 2001)
Kandhal and Mallick (2001) evaluated APA testing for HMA mixture design by using the test
data and statistical method. The focus of their study was to find the effect of mix gradations on
HMA rutting performance. They used three aggregates (granite, limestone, and gravel) and three
types of aggregate gradations: above-restricted zone (RZ), through-RZ, and below-RZ.
Permanent deformation was significantly affected by the gradation and the type of the aggregate
as shown in Table 2-2. Analysis of variance (ANOVA) indicates the significant effect of
aggregate type, gradation, and course type as well as interaction of aggregate and gradation.
Table 2-2. Analysis of Variance for Rut Depths of Mixes (Kandhal and Mallick, 2001)
Tarefder et al. (2003) attempted to identify the most significant factors which have been known
to affect rut potential of HMA mixture using APA testing. They tested three sets (set A, B, and

12
C) with seven factors (binder PG, temperature, load, hose pressure, asphalt content, moisture in
test specimen, and type of specimen), six factors (gradation, temperature, load, hose pressure,
asphalt content, and moisture in test specimen), and five factors (gradation, temperature, load,
hose pressure, and moisture in test specimen) and analyzed them using the statistical method.
Table 2-3 summarizes the results of ANOVA indicating that binder’s PG, testing temperature,
moisture in specimen, and aggregate gradation were commonly observed factors affecting
mixtures’ APA rutting performance significantly. Wheel load, asphalt content and loading hose
pressure were less significant.
Table 2-3. Statistical Results (Tarefder et al., 2003)
Mohammad et al. (2001) evaluated aggregate contributions to rutting susceptibility of asphalt
mixtures. Three types of mixtures were used in the research: stone mastic asphalt (SMA), coarse
matrix high binder (CMHB) and dense-graded wearing course. Three types of aggregate
(siliceous limestone, sandstone, and novaculite) were used in SMA, and crushed limestone was
used in the other mixtures. PG 70-22M modified binder was used in all the mixtures. SMA
made of sandstone aggregate was the best-performing mixture, and the dense-graded and the
CMHB generally showed better performance in rutting performance than the other SMA
mixtures.

13
More recently, Shu, et al. (2006) investigated the effects of coarse aggregate angularity (CAA)
and binder PG grade on rutting performance of HMA mixtures. APA was used to evaluate the
rut depth of mixtures. Two types of binder performance grade (64-22 and 76-22) with varying
CAA values were investigated. The test results showed that CAA significantly affected rutting
performance of HMA mixtures when the binder grade was critical to the environment.

14
CHAPTER 3
RESEARCH METHODOLOGY
To accomplish the research objectives, the statistical method based on the multiple linear
regression analysis was selected for this study. NDOR has performed APA testing for four years
and accumulated testing data. Using APA data, it was possible to identify materials and/or
mixture design factors affecting APA rutting and the extent that each factor affects APA rutting
in HMA through statistical analysis. Among many advantages of the use of statistical
approaches, one is easy adaptation of the same approach to other available data. A successfully
developed statistical approach for a set of data from the state of Nebraska can be directly applied
to other data obtained from another state, Kentucky. Another advantage of the statistical
approach is that this method requires much less time and costs than other methods such as
laboratory testing.
The multiple linear regression analysis selected to identify factors significantly affecting APA rut
results can also provide prediction models relating the APA rut depth to materials and/or mixture
design factors considered. The APA rut values predicted by the multiple linear regression
technique were then compared to values from another technique, the artificial neural network,
which has been widely employed in developing prediction models with many variables. This
chapter briefly explains the statistical method (multiple linear regression analysis) and the
artificial neural network technique that were employed for this research. After the brief
introduction to the multiple linear regression analysis and the artificial neural network technique,
target APA data selected for this study are presented. The type of Superpave mix and materials
and/or mixture design factors to be considered for the analyses are determined and also presented
in this chapter.
3.1 MULTIPLE LINEAR REGRESSION ANALYSIS
Linear regression is defined as the method which finds the statistical model that defines the
experimental data (Draper and Smith, 1998). The model consists of one independent variable
and one dependent variable in simple linear regression. Simple linear regression analysis is a

15
method to find a relationship between these two variables. The multiple linear regression
analysis is used when experimental data has several independent variables. The general purpose
of multiple linear regression analysis is to investigate the linear relationship between several
independent (or predictor) variables and a dependent (or response) variable.
The regression result is presented through the analysis of variance (ANOVA) table. ANOVA is
a tool expressing test results based on the F-ratio which is defined as a test of standard deviation
of populations. A typical format and entities in an ANOVA table from the multiple linear
regression analysis with n number of data and p number of independent variables in the model is
presented in Table 3-1.
Table 3-1. ANOVA Table from the Multiple Linear Regression Analysis
Source Degree of Freedom (DF)
Sum of Squares (SS)
Mean Square (MS) F-Ratio
Regression Model p SSR1 MSR4 = SSR/p MSR/MSE Error n-p-1 SSE2 MSE5 = SSE/(n-p-1) Total n-1 SSTO3
Note: SSR1 = regression sum of squares SSE2 = error sum of squares SSTO3 = total sum of squares MSR4 = mean square due to regression, and MSE5 = mean square due to error.
The components in the regression sum-of-squares (SSR, SSE, and SSTO) in the third column can
be defined as follows:
( )�=
−=n
ii YYSSR
1
2ˆ [3.1]
( ) ��==
=−=n
ii
n
iii eYYSSE
1
2
1
2ˆ [3.2]
( )�=
−=n
ii YYSSTO
1
2 [3.3]
where iY = observed values,

16
iY = fitted values,
Y = mean of fitted values, and
ie = residuals.
The mean square due to error (MSE) and the mean square due to regression (MSR) are given in
the fourth column of the ANOVA table. The F-ratio in the fifth column is simply calculated by
dividing MSR by MSE and provides a statistic for testing whether or not the independent
variables explain some of the variation in the response variable (dependent variable). The
significance of the test results is justified by comparing the F-ratio to a significance level (α)
which is typically equal to either 0.01, 0.05, or 0.10. The significance level is decided by the
statistician who performs the analysis. When the calculated F-ratio is equal or greater than F(α;
p, n-p-1), it means that there is at least one independent variable that explains the variation in the
dependent variable. Alternatively, many statistical software calculate the P-value = Probability
[F(p, n-p-1) ≥ F] where F is the calculated F-ratio. If this P-value is small (less than the
significance level α), one can conclude that with the data there is sufficient evidence to say that
at least one independent variable contributes to the variation in the dependent variable. Thus, the
resulting model from the multiple linear regression analysis is considered a significant model
where a meaningful relationship between a dependent variable and independent variables exists.
As an example, an ANOVA table resulting from a real multiple regression analysis was
produced and is shown in Table 3-2. With α level of 0.05 selected, the ANOVA results indicate
that there exists at least one independent variable that contributes to variation in the dependent
variable. There is a significant relationship between variables, because the P-value (i.e., Pr > F
as presented in the table) is less than the specified significance level (α value), 0.05.

17
Table 3-2. ANOVA Table Resulting from a Real Multiple Regression Analysis
If the testing analysis is significant, it is now able to produce a multiple linear regression model
relating variables. Equation [3-4] is the typical form of the model produced from the multiple
linear regression analysis.
iippiioi XXXY εββββ +++++= ...2211 i = 1,2,…,n [3-4]
where Yi = dependent variable,
βο = intercept,
βp = parameters (coefficients) of independent variables,
Xip = independent variables,
p = total number of independent variables,
n = total number of data, and
εi = error.
Table 3-3 presents typical results from the multiple linear regression analysis. The table shows
parameter estimate (βp) of each variable (Xip) and its level of significance based on the t-ratio
values. Similar to the F-ratio, the t-ratio is used to assess the significance of individual
regression coefficient (βp) multiplied to each variable in the model. In the case of t-test,
statistical software calculate the P-value = 2*Probability [t(n-p-1) ≥ |t|] where t is the computed
value of the t-statistic, with the significance level, α. If the P-value is less than or equal to
α, one can conclude that the corresponding independent variable (Xip) has a significant impact on
the response. These t-tests are also called partial t-tests, since they assess the partial (or

18
additional) significance of the variables Xip, over and above the impact of all other variables in
the model. The sign of each parameter estimate in Table 3-3 indicates the trend of relationship
between Yi and Xip. A positive sign in a parameter estimate infers proportionality between the
dependent variable and the independent variable corresponding to the parameter estimate. The
parameters shown in Table 3-3 identify the prediction model (Equation [3-4]).
Table 3-3. Parameter Estimate from the Multiple Linear Regression Analysis
Regression analysis typically provides a measure of the strength of the relationship between
dependent and independent variables. One measure that has been widely used to quantify the
strength of the relationship is called the coefficient of correlation, R-value. The R-value lies
between -1 and +1, therefore R2-value (called coefficient of determination) is more frequently
used to give the proportion of the total variability in the dependent variable that is accounted for
by the independent variables. The R2 can be calculated by the following expression:
SSTOSSE
R −= 12 [3-5]
If the R2 is equal to 1.0, all measured values are predicted by the regression model. In other
words, the developed model explains the relationship among variables perfectly. On the other
hand, R2 value of zero indicates that no measured data agrees with the prediction model.

19
Since R2-value usually can be made larger by including a large number of predictor variables, it
is sometimes suggested that a modified measure be used that adjusts for the number of
independent variables in the model. The adjusted coefficient of determination, denoted by adj.
R2, modifies R2 value by dividing each sum of squares by its associated degrees of freedom:
SSTOSSE
pnn
Radj ���
����
�
−−−−=
11
1. 2 [3-6]
As the number of independent variables increases, the value of R2 also increases. However, the
adj. R2 may actually become smaller when another independent variable is introduced into the
model, because any decrease in SSE may be more than that is offset by the loss of a degree of
freedom in the denominator (n-p) in Equation [3-6]. Therefore, the adj. R2 has been known as a
better indicator than the R2-value to measure the strength of the relationship between variables.
As an example, the values of R2 and adj. R2 from the multiple linear regression analysis are
presented in Table 3-4.
Table 3-4. R2 and adj. R2 Values from the Multiple Linear Regression Analysis
3.2 ARTIFICIAL NEURAL NETWORK APPROACH
The artificial neural network is a kind of statistical, mathematical, or computational methodology.
It was developed from inspiration of biological neurons in the human brain. McCulloch and Pits
(1943) first introduced the concept of artificial neurons. The neural network concept gained
popularity after the development of inexpensive computer emulation. Currently, various fields
such as finance, medicine, environmental science, and transportation engineering often use the
artificial neural network. The advantages of the artificial neural network approach are that it

20
detects trends from complicated data and it can also do prediction and forecasting. Figure 3-1
shows the basic structure of the artificial neural network approach. The components of the
neural network are input variables, one or more output variables, and one or more hidden layers
relating input and output variables through networking. The input variables are transformed by a
special function such as a logistic or sigmoidal function to account for nonlinearity in the model.
Figure 3-1. Basic Structure of the Artificial Neural Network
Among several artificial neural network algorithms, the back-propagation algorithm was
adopted in this study because it has been widely used for prediction. The back-propagation
algorithm was first introduced by Rumelhart et al. (1986). The back-propagation paradigm
usually uses a sigmoidal function for transformation from linearity to nonlinearity.
3.3 APA DATA FOR ANALYSES
To accomplish the research objectives, the APA data of SP-4 mix type were chosen for two
reasons: 1) the number of SP-4 data was the highest in the NDOR APA database (total 91 SP-4
mix APA data), and 2) SP-4 mix type was one of the primary mixes frequently paved in
Nebraska. With the SP-4 mix APA database, materials and/or mixture variables to be considered
as candidates affecting APA rut results needed to be determined. Based on the literature review,
six factors (performance grade of binder, aggregate gradation, nominal maximum aggregate size,

21
aggregate angularity, air voids, and asphalt content) were selected as illustrated in Figure 3-2.
Performance grade (PG) of binder represents the binder mechanical property which clearly
affects mixture rut potential. Size and shape factors of aggregates such as the gradation,
angularity, and the nominal maximum aggregate size (NMAS) were included in the analysis.
For the mixture side, two variables (air voids and asphalt content) were selected as primary
factors because they are crucial indicators identifying mixture volumetric characteristics and
were also expected to affect APA rut depth.
������
��������
�� �����������
��������
��������
� �� ������ ���� �� �
�������������
���������
���������
� ������
�������
Figure 3-2. Factors Selected for Analyses
From the APA test database of the SP-4 mix, it was observed that two nominal maximum
aggregate sizes (0.375 inch and 0.5 inch) and three binder performance grades (PG 64-22, 64-28,
and 70-28) were used. For a more detailed analysis, aggregate angularity factor was categorized
into three variables: coarse aggregate angularity value with one or more fractured faces (denoted
by CAA1), coarse aggregate angularity value with two or more fractured faces (denoted by
CAA2), and fine aggregate angularity (FAA). In the case of aggregate gradation, the gradation
factor needed to be quantified in numbers to be implemented in the statistical analyses (multiple
linear regression analysis and artificial neural network for this study). In an attempt to quantify
the characteristics of gradation, three alternatives were attempted. First, the gradation curve of
each mixture was plotted on the 0.45 power chart as shown in Figure 3-3, and then the gradation

22
curve was divided into a coarse aggregate part and a fine aggregate part based on sieve No.4
(4.75-mm mesh size which is corresponding to 2.016 on the 0.45 power chart). The gradation
curve was compared to the maximum density line which is represented by a straight line on the
0.45 power chart as illustrated in Figure 3-3. Then, the areas formed between the gradation
curve and the maximum density line were calculated to quantify density characteristics (coarse
aggregate density signified by CAD and fine aggregate density signified by FAD) of the
gradation. In other words, when the gradation curve is closer to the maximum density line which
is an indication of denser mix, the calculated area becomes smaller.
0
10
20
30
40
50
60
70
80
90
100
0 0.5 1 1.5 2 2.5 3 3.5 4
� ��������
������������� � !"#$%���$�&'(
����������������� �������
� ������������� �������
Figure 3-3. A Gradation Curve with Its Density Characteristics on the 0.45 Power Chart
The second alternative selected to represent the gradation characteristics was the fineness
modulus (signified by FM). The fineness modulus is defined as an empirical factor obtained by
adding the total percentages of a sample of the aggregate retained on each of a specified series of
sieves and dividing that sum by 100 (Mamlouk and Zaniewski, 2006). As the value of the
fineness modulus increases, the amount of coarse aggregate increases: in other words, a greater
fineness modulus of an aggregate blend means a coarser mix. Therefore, the value of fineness
modulus can be a potentially good indicator that represents gradation characteristics of the mix.

23
The third alternative to represent the gradation characteristics was the use of the restricted zone
(signified by RZ). The restricted zone forms a band residing along the maximum density
gradation between an intermediate sieve and the 0.3-mm sieve as shown in Figure 3-3. There
has been a common belief from the asphalt community that a humped gradation indicates an
over-sanded mixture which often results in compaction problems during construction and
reduced resistance to rutting. However, the concept of the restricted zone related to mixture
rutting potential has been almost discarded from the Superpave specification today as many
studies (Watson et al., 1997; Kandhal and Mallick, 2001; Hand and Epps, 2001; Kandhal and
Cooley, 2002; Sebaaly et al., 2004) demonstrated no clear relationship between the restricted
zone and mixture rutting potential. Nevertheless, the effect of restricted zone as an indicator
representing gradation characteristics was considered in this study, since the research conclusion
supporting elimination of the restricted zone criteria has often been made for mixes with coarse
aggregate angularity of about 100 which is not true for the SP-4 mix.
With all independent variables selected, a data sheet for statistical analyses was developed and is
shown in Figure 3-4 for an illustration purpose. The data sheet including all samples (total 91
samples) from Nebraska can be seen in Appendix A. Similar to the Nebraska data sheet, data
sheets for the state of Kentucky were also generated and are attached in Appendix B. Figure 3-4
presents specific values of independent variables of each mixture and its APA rut result (shown
in the last column in the figure) as the dependent variable. In the case of the variable, NMAS,
the numbers 1 and 2 were used to represent 0.375-inch and 0.5-inch NMAS, respectively for the
purpose of statistical analyses. Similarly, the numbers 1, 2, and 3 were assigned to binder PG (1
for PG 64-22, 2 for PG 64-28, and 3 for PG 70-28) and to the RZ (1 for above-RZ, 2 for through-
RZ, and 3 for below-RZ), respectively. For other variables, real experimental values were used.
Instead of using APA rut depth, the rut ratio was calculated by dividing total rut depth by the
number of loading cycles. This is because the APA test automatically stopped when the wheel
loading reached 8,000 cycles before 12-mm rut depth or when the total rut depth exceeded 12-
mm. To provide an identical measure of mixture rut potential for both cases, the rut ratio was
calculated and used. One more thing to be noted from the figure is that only one alternative
among three on the gradation factors was used for analyses. For example, if the concept of

24
gradation densities (CAD and FAD) was used, the other two gradation-related variables (FM and
RZ) were excluded in the analyses.
Figure 3-4. Data Sheet Developed for Statistical Analyses

25
CHAPTER 4
ANALYSIS RESULTS AND DISCUSSION
To find variables affecting APA rut results and the extent of these variables, SP-4 APA data
from NDOR and data from another state (Kentucky) were analyzed through the Statistical
Analysis Software (SAS) using the multiple linear regression analysis. In addition to the
analysis of significance, prediction models were developed using the results of multiple linear
regression analysis and the artificial neural network technique. The predicted rutting values from
the multiple linear regression analysis were compared to the values from the artificial neural
network.
4.1 ANALYSIS OF SIGNIFICANCE
Table 4-1 presents statistical analysis results. As can be seen, three cases were considered using
the Nebraska data due to the use of different gradation-related alternatives (gradation density
signified by CAD and FAD, fineness modulus (FM), and restricted zone (RZ)). For the data
from Kentucky, the gradation effects were investigated by using the gradation density indicators
(CAD and FAD) only. Table 4-1 shows overall significance of the test results justified by the F-
ratio and P-value of each case. By comparing the P-value (i.e., Pr > F) to a given α value (0.01,
0.05, or 0.10), one can decide if the resulting model from the multiple linear regression analysis
is considered as a model where there is at least one independent variable that affects the variation
of the dependent variable (i.e., APA rut results). Table 4-1 also presents significance of each
individual regression coefficient and its parameter estimate by providing the t–test results which
are useful to assess the significance of each independent variable in the model. As mentioned
previously, if the P-value (i.e., Pr > |t|) is less than the significance level (α value) specified,
then the independent variable considered is a significant factor affecting the APA rut depth. To
maintain consistency of the analysis, the same value of α level (0.05) was applied to all cases.

26
Table 4-1. Statistical Analysis Results
Nebraska Data Kentucky Data Case 1 Case 2 Case 3 Case 4
F-ratio = 2.39 Pr > F = 0.0188
F-ratio = 2.05 Pr > F = 0.0506
F-ratio = 2.02 Pr > F = 0.0539
F-ratio = 6.60 Pr > F = 0.0037
Variables Parameter Estimate
Pr > |t| Parameter Estimate
Pr > |t| Parameter Estimate
Pr > |t| Parameter Estimate
Pr > |t|
Intercept 0.05868 0.0146 0.03953 0.1140 0.05570 0.0290 0.03820 0.0808 NMAS -0.00312 0.0216 -0.00138 0.1182 -0.00106 0.1752 -0.000053 0.8164
PG -0.00191 0.0020 -0.00164 0.0069 -0.00165 0.0066 -0.000258 0.0005 % Air -0.00091 0.1336 -0.000887 0.1522 -0.00096 0.1212 -0.000281 0.6337
% Binder -0.00072 0.4867 -0.000779 0.4619 -0.00127 0.1985 0.000068 0.7084 CAA1 0.00005 0.7499 0.000070 0.6289 0.000061 0.6748 -0.000372 0.0735 CAA2 -0.00002 0.8312 -0.000078 0.4783 -0.00007 0.5263 *** *** FAA -0.00095 0.0948 -0.00648 0.2484 -0.00078 0.1820 0.000017 0.7804 CAD 0.000257 0.0365 *** *** *** *** 0.000008 0.6337 FAD -0.000215 0.0448 *** *** *** *** 0.000005 0.8225 FM *** *** 0.00146 0.3016 *** *** *** *** RZ *** *** *** *** -0.00073 0.3469 *** ***
For Case 1, test statistic infers that there existed a meaningful relationship between the APA rut
results and at least one independent variable, since the P-value (Pr > F) was less than the
specified α value (0.05). Among the nine variables (excluding the intercept), four variables
(NMAS, PG, CAD, and FAD) were found to be significant at the α value of 0.05. By analyzing
the parameter estimate of the four significant variables, the NMAS had the largest effect on
rutting because the absolute quantity of parameter estimate of the NMAS was the largest. The
negative sign of the parameter estimate indicates that 0.5 inch was less susceptible than 0.375
inch of NMAS in rutting performance. The second largest variable affecting APA rutting was
binder performance grade (PG), which was -0.00191 in the analysis. As with the NMAS, the
value of the parameter estimate of PG had a negative sense. Among the three types of PG (62-22,
64-28 and 70-28) used in the analysis, 70-28 was the best in rutting performance followed by 64-
28 and 64-22, respectively. Gradation also affected APA rutting. When compared with
parameter estimate of NMAS and PG, coefficients to gradation were relatively small values
(CAD of 0.000257 and FAD of -0.000215) inferring that the gradation affects rutting
performance in a less significant way. In the case of CAD, the parameter estimate was in
positive sign. The more the value of CAD increased, the more that APA rut depth increased.

27
FAD had a negative value, which implied the more fine aggregate density decreased, the more
the depth of permanent deformation increased.
To investigate the gradation effects in a more detailed way, the same multiple linear regression
analysis was repeated with different data sets where samples in each data set were categorized by
their FAD values. Figure 4-1 presents the analysis results which clearly demonstrated that as the
FAD increased, the P-value tended to decrease. It can be inferred that APA rut depth was more
likely affected by the gradation characteristics such as the FAD. In other words, if the FAD
values of mixtures are less than approximately 27 (as shown in Figure 4-1), APA rut results
among mixtures were expected to produce the same value statistically when the significance
level is 0.05. In fact, there was only one gradation presented in Figure 4-2 where the FAD value
was greater than 27.
0.00
0.05
0.10
0.15
0.20
0.25
0.30
0.35
0.40
0.45
0.50
15 18 21 24 27 30
FAD
P-v
alue
0
5
10
15
20
25
30
35
40
45
50
No.
of S
ampl
es
P-value
No. of Samples
Figure 4-1. Variation of P-Value with Different FAD in Gradation

28
Similar to the case of FAD, the multiple linear regression analysis was also repeated for different
data sets grouped by varying CAD values. As expected and clearly shown in Figure 4-3, the P-
value decreased as the CAD of mixtures increased. From the figure, it can be concluded that
mixtures with the CAD value less than approximately 25 are likely producing the same APA rut
results at the significance level of 0.05, if other variables of the mixture remain constant. Among
the total 91 samples, only four gradations experienced the CAD value greater than 25. The four
gradations are plotted in Figure 4-4. As demonstrated in Figures 4-1 to 4-4, majority of mixtures
were designed with the FAD and CAD less than their critical values, therefore the effect of
gradation may be trivial in practice even if the statistical analysis produced the significance of
gradation characteristics based on its density.
0
10
20
30
40
50
60
70
80
90
100
0.0 0.5 1.0 1.5 2.0 2.5 3.0 3.5 4.0
Sieve Size^0.45
Per
cen
t Pas
sin
g
Maximum Density Line
Control Points (Upper)
Control Points (Lower)
Restricted Zone (Upper)
Restricted Zone (Lower)
Gradation with FAD>27
Figure 4-2. A Gradation Curve with FAD Value Greater Than 27

29
0.00
0.05
0.10
0.15
0.20
0.25
0.30
0.35
0.40
0.45
0.50
15 18 21 24 27 30
CAD
P-v
alue
0
5
10
15
20
25
30
35
40
45
50
No.
of S
ampl
es
P-value
No. of Samples
Figure 4-3. Variation of P-Value with Different CAD in Gradation
0
10
20
30
40
50
60
70
80
90
100
0.0 0.5 1.0 1.5 2.0 2.5 3.0 3.5 4.0
Sieve Size^0.45
Per
cen
t Pas
sin
g
Maximum Density LineControl Points (Upper)Control Points (Lower)Restricted Zone (Upper)Restricted Zone (Lower)Gradation 1 with CAD>25Gradation 2 with CAD>25Gradation 3 with CAD>25Gradation 4 with CAD>25
Figure 4-4. Four Gradation Curves with CAD Value Greater Than 25

30
In Case 2 using the fineness modulus instead of gradation densities, the P-value from the F-test
was 0.0506 which is a little greater than but very close to the α value (0.05). Among the
independent variables included, the fineness modulus did not show significance (Pr > |t|: 0.3016),
and binder PG was the only significant variable (Pr > |t|: 0.0069) found from this analysis.
In Case 3 based on the concept of restricted zone, the statistical analysis results were similar to
the results from Case 2 which are presented in Table 4-1. The P-value (Pr > F) was 0.0539
which is greater than but still close to the specified significance level (α = 0.05). Among the
variables included in the model, only binder PG showed its significance in the APA rutting. The
restricted zone did not show any significant effects on rutting potential, which is in a good
agreement with general findings from many other studies (Watson et al., 1997; Kandhal and
Mallick, 2001; Hand and Epps, 2001; Kandhal and Cooley, 2002; Sebaaly et al., 2004) that have
demonstrated the insignificance of the restricted zone to the HMA rutting potential.
As mentioned earlier, APA data sets were also obtained from Kentucky in an attempt to compare
analysis results from the state of Nebraska to the results from a different state. Table 4-1
includes the analysis results (Case 4) using the Kentucky data (total 21 samples). There were
three binder performance grades (PG 64-22, 70-22 and 76-22), and the values of CAA1 and
CAA2 were identical with the range of 98-100. Due to the redundancy in CAA, the CAA2 was
excluded in the analysis. Test statistic shown in Table 4-1 infers that there exists a meaningful
relationship between the APA rut results and at least one independent variable, since the P-value
(0.0037) is less than the α value (0.05). Among the eight independent variables, binder PG was
the only significant variable (Pr > |t|: 0.0005), which was the same result found from Cases 2
and 3. Binder PG produced a negative effect in performance as observed from all previous cases
(Case 1 to 3) using Nebraska data.
4.2 DEVELOPMENT OF PREDICTION MODELS
Prediction models were developed using the results of the multiple linear regression analysis
and the artificial neural network technique. The predicted APA rutting values from the multiple
linear regression models were compared to the values from the artificial neural network.

31
4.2.1 Prediction Models from the Multiple Linear Regression Analysis
As discussed in Chapter 3, a multiple linear regression model (Equation [3-4]) relates variables
by providing parameter estimate of each independent variable. The strength of relationship
between the dependent variable and independent variables is measured by the R2 and/or adj. R2
values which are defined by Equations [3-5] and [3-6] in the previous chapter. For the
development of multiple regression models to predict APA rut results with given materials and
mixture design variables, Nebraska data were used, and a total of nine independent variables
(NMAS, binder PG, % air voids, % binder content, CAA1, CAA2, FAA, CAD, and FAD) were
considered for the model. Table 4-2 presents resulting model parameters and coefficients of
determination (R2 and adj. R2) of each model.
Table 4-2. Prediction Models from the Multiple Linear Regression Analysis
Nebraska Data Model 1 Model 2 Model 3
F-ratio = 2.39 Pr > F = 0.0188
R2 = 0.21 Adj. R2 = 0.12
F-ratio = 4.41 Pr > F = 0.0001
R2 = 0.33 Adj. R2 = 0.25
F-ratio = 3.26 Pr > F = 0.0020
R2 = 0.27 Adj. R2 = 0.19
Variables Parameter Estimate Pr > |t| Parameter Estimate Pr > |t| Parameter Estimate Pr > |t| Intercept 0.05868 0.0146 22.01186 0.0033 0.04856 0.0097 NMAS -0.00312 0.0216 -0.96337 0.0218 -0.00290 0.0063
PG -0.00191 0.0020 -0.77936 < 0.0001 -0.00192 < 0.0001 % Air -0.00091 0.1336 -0.33716 0.0729 -0.00055 0.2440
% Binder -0.00072 0.4867 -0.34853 0.2756 -0.00081 0.3102 CAA1 0.00005 0.7499 0.00276 0.9500 0.000001 0.9928 CAA2 -0.00002 0.8312 -0.00512 0.8794 0.000016 0.8499 FAA -0.00095 0.0948 -0.48916 0.0062 -0.000740 0.0946 CAD 0.000257 0.0365 0.05383 0.1532 0.000178 0.0622 FAD -0.000215 0.0448 -0.05232 0.1127 -0.000153 0.0673
The first model (Model 1) was developed using all 91 data. As shown in Table 4-2, the value of
the R2 and the adj. R2 was 0.21 and 0.12, respectively. In order to look for more appropriate
models that produce a higher correlation between variables, several attempts such as the data
transformation and the diagnostics of outliers were made. Model 2 was developed through the
data transformation by taking a natural log function (LN function) on the response variable (Y).
Simple transformations of either the response variable (dependent variable), the predictor

32
variables (independent variables), or of both, are often used to make the regression model more
appropriate to the data. In investigating several different transformation functions, such as 1/Y,
log Y, √Y, and other powers of Y, the following transformed model was selected because the
model produced the best performance.
iippiioi XXXYLN εββββ +++++= ...)( 2211 i = 1,2,…,n [4-1]
As a result of the data transformation, the adequacy of the model improved with higher values of
the R2 (0.33) and the adj. R2 (0.25). Another method which typically improves the adequacy of
the fitted model is checking the presence of outliers and removing them from the data. Outliers
are extreme observations that are numerically distant from the rest of the data. When there are
outliers in a data set, a statistical analysis will return values not representing the overall data.
Among various diagnostics for outliers, the Cook’s D technique was employed in this study.
The Cook’s D technique measures precision of estimation and detects influential points that pull
regression towards their direction. Through this analysis, two observations (sample No. 89 and
91) were found as influential points. After two observations were removed from the data set, the
multiple linear regression analysis was performed and resulted in R2 (0.27) and the adj. R2 (0.19).
Figures 4-5 to 4-7 present cross-plots between measured APA rut results and the predicted values
from each model. As the coefficients of determination increased, cross-plots were closer to the
line of equality.

33
-0.005
0.000
0.005
0.010
0.015
0.020
-0.005 0.000 0.005 0.010 0.015 0.020
Measured Rut Ratio (mm/cycle)
Pre
dict
ed R
ut R
atio
(mm
/cyc
le)
Line of Equality
Figure 4-5. Cross-Plots between Measured and Predicted Using Model 1
-0.005
0.000
0.005
0.010
0.015
0.020
-0.005 0.000 0.005 0.010 0.015 0.020
Measured Rut Ratio (mm/cycle)
Pre
dict
ed R
ut R
atio
(mm
/cyc
le)
Line of Equality
Figure 4-6. Cross-Plots between Measured and Predicted Using Model 2

34
4.2.2 Prediction Models from the Artificial Neural Network
As illustrated in Figure 4-8, the artificial neural network consists of three steps (Lacroix et al.,
2008). The first step is the training stage, the second step is the validation stage, and the last step
is the testing stage. The first and second stages are the network developing step and the last stage
is to predict the response variable based on the network developed.
-0.005
0.000
0.005
0.010
0.015
0.020
-0.005 0.000 0.005 0.010 0.015 0.020
Measured Rut Ratio (mm/cycle)
Pre
dict
ed R
ut R
atio
(mm
/cyc
le)
Line of Equality
Figure 4-7. Cross-Plots between Measured and Predicted Using Model 3

35
Figure 4-8. Process of the Artificial Neural Network Modeling
For the artificial neural network modeling, the same set of data (91 samples of the SP-4 mix) was
used to compare predictions from the artificial neural network modeling to the predictions
obtained from the multiple regression modeling (Model 1 in Table 4-2). With the 91 samples, 56
data were used for training, 15 data were used for validation, and 20 data were used for testing.
Cross-plots relating the measured APA rut results to the predictions from each stage are shown
in Figures 4-9 to 4-11. Figure 4-12 was also developed to compare a predicting power between
two methods (the artificial neural network modeling vs. the multiple linear regression analysis)
by plotting both predictions to the measured APA data on the same graph. Even if there is no
equivalent indicator that can be used to quantitatively estimate the predicting power between two
modeling approaches, it can be inferred that there is no huge difference between two methods.
Both methods did not provide a high level of model accuracy, which might be due to a lack of
data involved.
Network Development
Prediction

36
-0.005
0.000
0.005
0.010
0.015
0.020
-0.005 0.000 0.005 0.010 0.015 0.020
Measured Rut Ratio (mm/cycle)
Pre
dict
ed R
ut R
atio
(mm
/cyc
le)
Line of Equality
Figure 4-9. Cross-Plots between Measured and Predicted (Training Stage)
-0.005
0.000
0.005
0.010
0.015
0.020
-0.005 0.000 0.005 0.010 0.015 0.020
Measured Rut Ratio (mm/cycle)
Pre
dict
ed R
ut R
atio
(mm
/cyc
le)
Line of Equality
Figure 4-10. Cross-Plots between Measured and Predicted (Validation Stage)

37
-0.005
0.000
0.005
0.010
0.015
0.020
-0.005 0.000 0.005 0.010 0.015 0.020
Measured Rut Ratio (mm/cycle)
Pre
dic
ted
Rut
Rat
io (m
m/c
ycle
)
Line of Equality
Figure 4-11. Cross-Plots between Measured and Predicted (Testing Stage)
0.000
0.005
0.010
0.015
0.020
0.000 0.005 0.010 0.015 0.020
Measured Rut Ratio (mm/cycle)
Pre
dict
ed R
ut R
atio
(mm
/cyc
le) Multiple Linear Regression
Artificial Neural Network
Line of Equality
Figure 4-12. Multiple Linear Regression vs. Artificial Neural Network

38
CHAPTER 5
CONCLUDING REMARKS
Based on this study, the following conclusions and suggested follow-up studies can be drawn:
5.1 CONCLUSIONS
• To find variables affecting APA rut results and the extent of these variables, a total of 91
SP-4 mixture data from Nebraska and 21 samples from Kentucky were statistically
analyzed using the multiple linear regression method. Based on literature review, six
factors (binder PG, aggregate gradation, nominal maximum aggregate size, aggregate
angularity, air voids in mixture, and asphalt content in mixture) were considered as
probable candidates significantly affecting APA rut results. For characterizing gradation
effects, three indicators (gradation density, fineness modulus, and restricted zone) were
considered and each of them was used for each statistical analysis.
• A common variable found from repeated multiple regression analyses by merely varying
gradation indicators included was the binder PG. The binder PG was the variable that
always shows significant impact on APA rut results from both Nebraska mixtures and
Kentucky data.
• In the case of considering gradation effects by including gradation density factors,
aggregate gradation was the significant factor together with the binder PG and the
nominal maximum aggregate size. However, the effect of gradation is trivial in actual
practice, because the significance of aggregate gradation resulting from the statistical
analysis was because of minor number of mixtures in the data set.
• The trivial effect of aggregate gradation was verified by considering different gradation
indicators (fineness modulus or restricted zone). Neither one showed any significance.
Only binder PG showed its significance in the APA rutting.

39
• Predicting models were also developed using the results of multiple linear regression
analysis and the artificial neural network technique. Adequacy of the models was
investigated by observing coefficients of determination and cross-plotting predicted APA
rut values to the measured APA rut data. Both methods generally did not provide a high
level of model adequacy, which might be from a lack of data involved.
5.2 RECOMMENDED FURTHER STUDIES
• A total of 91 SP-4 data were used for the statistical analyses in this study. Even if the 91
data produced outcomes that were expected and were good agreements with other studies,
more data would be helpful to derive better understanding. With more APA data
gathered, the analyses can be conducted again.
• APA test results have generally shown poor correlations with actual field performance.
Further research investigating the correlations using Nebraska data and finding out any
significant factors of APA tests and results to the field rutting performance would be
recommended. Similar statistical analyses employed for this study can be conducted.�
5.3 NDOR IMPLEMENTATION PLAN
The findings of this research project complement the past findings of NDOR laboratory
personnel following limited years of APA testing of various asphalt mixtures in-house.
Although currently a common mixture characteristic has not been identified to be capable of
predicting in-field performance using APA, NDOR will continue to perform APA testing in 2008.
NDOR has also agreed to become involved in an “Aggregate Imaging System” study sponsored
by FHWA. This new study has the potential to provide aggregate surface texture information
that may bring more meaning to the APA research findings.

40
REFERENCES
Cross, S. A. and Purcell, E. M., (2001). “Effects of Fine Aggregate Angularity on VMA and
Rutting of Kansas HMA Mixtures.” American Society for Testing and Materials, West
Conshohocken, PA.
Draper, N. R. and Smith, H., (1998). “Applied Regression Analysis.” 3rd Edition, John Wiley &
Sons, Inc.
Hand, A. J. and Epps, A. L., (2001). “Impact of Gradation Relative to Superpave Restricted Zone
on Hot-Mix Asphalt Performance.” Transportation Research Record, 1767, pp. 158-166.
Kandhal, P. S. and Mallick, R. B., (2001). “Effect of Mix Gradation on Rutting Potential of
Dense-Graded Asphalt Mixtures.” Transportation Research Record, 1767, pp. 146-151.
Kandhal, P. S. and Cooley, L. A. Jr., (2002). “Coarse- versus Fine-Graded Superpave Mixtures –
Comparative Evaluation of Resistance to Rutting.” Transportation Research Record, 1789, pp.
216-224.
Kandhal, P. S. and Cooley, L. A. Jr., (2003). “Accelerated Laboratory Rutting Tests: Evaluation
of the Asphalt Pavement Analyzer.” NCHRP Report No. 508. National Research Council,
Washington, D.C.
Lacroix, A., Kim, Y. R., and Ranjithan, S. R., (2008). “Backcalculation of the Dynamic Modulus
from the Resilient Modulus of Asphalt Concrete Using an Artificial Neural Network.” Presented
at the 87th Transportation Research Board Annual Meeting, Washington, D.C.
Lee, C., White, T. D., and West, T. R., (1999). “Effect of Fine Aggregate Angularity on Asphalt
Mixture Performance.” Joint Transportation Research Program, FHWA/IN/JTRP-98/20.
41
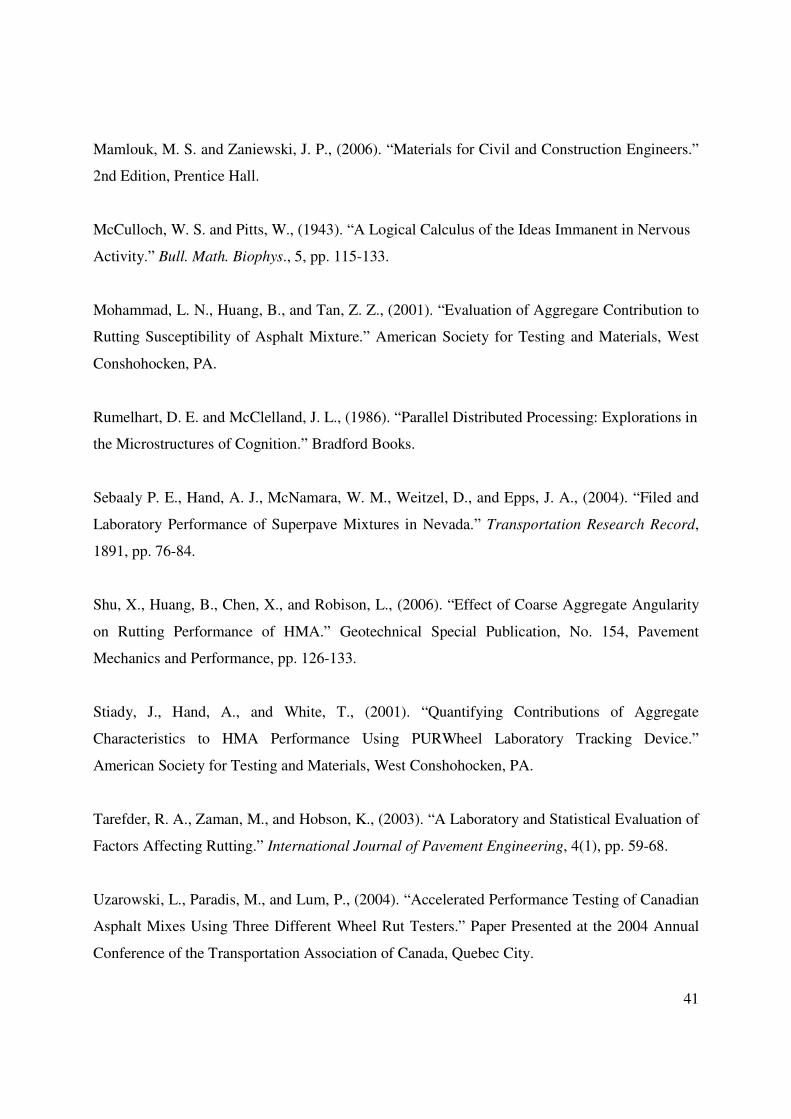
Mamlouk, M. S. and Zaniewski, J. P., (2006). “Materials for Civil and Construction Engineers.”
2nd Edition, Prentice Hall.
McCulloch, W. S. and Pitts, W., (1943). “A Logical Calculus of the Ideas Immanent in Nervous
Activity.” Bull. Math. Biophys., 5, pp. 115-133.
Mohammad, L. N., Huang, B., and Tan, Z. Z., (2001). “Evaluation of Aggregare Contribution to
Rutting Susceptibility of Asphalt Mixture.” American Society for Testing and Materials, West
Conshohocken, PA.
Rumelhart, D. E. and McClelland, J. L., (1986). “Parallel Distributed Processing: Explorations in
the Microstructures of Cognition.” Bradford Books.
Sebaaly P. E., Hand, A. J., McNamara, W. M., Weitzel, D., and Epps, J. A., (2004). “Filed and
Laboratory Performance of Superpave Mixtures in Nevada.” Transportation Research Record,
1891, pp. 76-84.
Shu, X., Huang, B., Chen, X., and Robison, L., (2006). “Effect of Coarse Aggregate Angularity
on Rutting Performance of HMA.” Geotechnical Special Publication, No. 154, Pavement
Mechanics and Performance, pp. 126-133.
Stiady, J., Hand, A., and White, T., (2001). “Quantifying Contributions of Aggregate
Characteristics to HMA Performance Using PURWheel Laboratory Tracking Device.”
American Society for Testing and Materials, West Conshohocken, PA.
Tarefder, R. A., Zaman, M., and Hobson, K., (2003). “A Laboratory and Statistical Evaluation of
Factors Affecting Rutting.” International Journal of Pavement Engineering, 4(1), pp. 59-68.
Uzarowski, L., Paradis, M., and Lum, P., (2004). “Accelerated Performance Testing of Canadian
Asphalt Mixes Using Three Different Wheel Rut Testers.” Paper Presented at the 2004 Annual
Conference of the Transportation Association of Canada, Quebec City.

42
Watson, D. E., Johnson, A., and Jared, D., (1997). “The Superpave Gradation Restricted Zone
and Performance Testing with Georgia Loaded Wheel Tester.” Transportation Research Record,
1583, pp. 106-111.

43
ACKNOWLEDGMENTS
The authors thank the Nebraska Department of Roads (NDOR) for the financial support needed
to complete this study. In particular, the authors thank NDOR Technical Advisory Committee
(TAC) members for their technical support and invaluable comments.

44
APPENDIX A
Table A-1. Datasheet of Nebraska SP-4 Mixtures
No. NMAS PG Air void % Binder CAA1 CAA2 FAA CAD FAD FM RZ Rut ratio
1 2 2 4.2 5.9 94 90 45.7 20.273 11.9 4.28 2 0.000156
2 2 1 3.9 5.14 89 86 45.4 15.941 8.533 4.477 2 0.000222
3 2 2 4.8 5.7 99 94 50.1 24.814 13.903 4.114 1 0.000251
4 1 2 4 6.83 95 90 46.9 10.02 10.707 3.813 2 0.00028
5 2 3 4.2 5.15 91 86 45.2 20.061 9.591 4.501 2 0.000302
6 2 3 4.5 5.6 94 90 45.3 13.094 10.39 4.751 3 0.000324
7 2 2 4.7 5.1 93 86 45.4 26.771 28.263 3.884 2 0.000353
8 2 2 4.1 5.43 98 98 45 18.883 20.515 4.08 2 0.000378
9 1 2 4.3 6.79 93 91 48 12.111 10.908 3.689 1 0.00038
10 2 2 3.8 5.51 94 90 45.5 19.554 13.403 4.235 2 0.00043
11 2 3 5 5.22 92 88 45.3 16.594 9.496 4.4 2 0.000434
12 1 2 3.8 5.36 94 83 45.3 9.002 10.706 4.218 3 0.00044
13 1 2 4.8 6.13 95 88 45.2 14.26 20.737 3.518 2 0.000459
14 2 2 3.7 5.46 93 80 45.4 24.99 16.418 4.046 2 0.000504
15 1 2 5.4 5.3 96 85 45.4 10.679 10.317 3.858 2 0.000509
16 1 2 5.4 5.3 96 85 45.4 10.679 10.579 3.867 2 0.000509
17 1 3 5.4 5.3 96 85 45.4 10.679 10.579 3.867 2 0.000509
18 2 2 4 5.06 96 87 45.3 22.11 10.74 4.278 2 0.000529
19 1 3 5.2 5.83 98 94 45.5 13.699 19.188 3.542 2 0.000549
20 2 2 4 5.28 97 95 45.2 20.588 9.061 4.468 2 0.00056
21 1 2 4.4 6.41 91 81 46.9 13.484 19.575 3.542 2 0.00058
22 1 2 3.9 5.99 98 95 45.3 13.743 14.581 3.74 2 0.000581
23 2 3 4.3 5.45 95 94 45.3 22.925 11.111 4.25 2 0.00059
24 1 2 4.3 5.35 89 85 45.5 7.769 9.089 4.178 2 0.000606
25 2 2 4.1 5.17 87 82 45.5 15.83 8.696 4.495 2 0.000635
26 2 2 4.1 5.19 99 96 45.6 18.48 16.737 4.194 2 0.000718
27 2 2 5.3 5.4 99 96 45 17.517 16.083 4.342 2 0.000774
28 1 2 5 5.67 85 81 45.2 12.231 15.685 3.795 2 0.000775
29 2 2 4.2 5.04 99 94 45.4 20.319 9.794 4.48 2 0.000799
30 2 1 6 5.21 96 94 45.3 19.329 9.437 4.632 3 0.000808
31 2 2 6 5.21 96 94 45.3 19.329 9.437 4.632 3 0.000808
32 1 2 3.9 6.31 86 81 45.5 14.42 16.993 3.592 2 0.000837
33 1 2 3.9 6.31 86 81 45.5 14.42 17.027 3.591 2 0.000837
34 2 1 4.2 5.04 93 84 45.1 24.096 21.629 3.96 2 0.000843
35 2 2 4.1 5.2 96 95 45.2 22.908 18.909 4.037 2 0.000848

45
No. NMAS PG Air void % Binder CAA1 CAA2 FAA CAD FAD FM RZ Rut ratio
36 2 2 5.2 5.42 94 88 45.3 20.232 11.326 4.313 2 0.000876
37 2 2 4 5.41 85 80 45.3 24.295 16.26 4.074 2 0.000906
38 2 2 3.7 5.7 89 86 45.2 21.71 9.824 4.318 2 0.000909
39 1 2 3.5 5.6 92 88 45.1 9.968 13.865 3.809 2 0.000932
40 2 2 3.9 5.4 92 91 45.4 12.149 9.208 4.775 3 0.00097
41 2 2 4.6 5.2 92 89 45.4 22.208 15.653 4.185 2 0.000997
42 1 2 4.2 5.32 87 81 45.5 5.912 13.352 4.418 3 0.00101
43 2 1 4.1 5.1 95 91 45.8 12.599 8.159 4.739 3 0.001059
44 1 2 4.5 5.04 99 92 45.2 3.363 10.645 4.37 3 0.001075
45 2 1 4 5.24 89 87 45.2 20.7 10.831 4.456 2 0.001093
46 2 3 3.8 5.12 96 89 45.1 19.311 10.417 4.307 2 0.001108
47 1 2 3.9 5.42 96 88 45.5 9.002 10.759 4.222 3 0.001119
48 1 1 4.3 6.4 97 96 45.9 14.127 20.838 3.474 2 0.001154
49 1 2 4 5.68 86 83 45.1 8.992 10.605 4.059 2 0.001196
50 2 2 4 5.2 95 83 45.5 20.727 11.112 4.462 2 0.001214
51 2 2 4.3 5.2 85 80 45.3 20.041 12.807 4.31 2 0.001255
52 1 2 5 6.29 92 89 45.2 9.454 14.536 3.79 2 0.001267
53 1 2 4.1 6.3 92 87 45.2 13.718 17.691 3.624 2 0.001286
54 2 1 4.6 5.86 94 90 45.4 20.875 20.479 4.053 2 0.00133
55 2 2 4.2 5.54 92 81 45.1 19.427 14.43 4.277 2 0.001363
56 2 3 3.7 5.12 90 82 45.2 21.088 9.708 4.378 2 0.001425
57 2 2 4 5.25 94 93 45.1 14.672 13.961 4.264 2 0.001497
58 2 1 3.8 5.48 95 91 45.2 21.679 19.623 4.032 2 0.001548
59 1 2 4.2 5.8 87 81 45.9 11.725 11.509 4.126 3 0.001658
60 2 3 3.7 5.23 90 86 45.5 22.422 12.541 4.46 2 0.001879
61 2 2 3.8 5.34 96 89 45.6 20.875 20.479 4.053 2 0.001915
62 2 2 3.5 5.13 93 87 45.2 20.728 9.392 4.415 2 0.002222
63 2 2 4.6 5.56 96 93 45 24.882 18.575 3.993 1 0.00223
64 2 1 4.5 5.6 94 90 45.3 13.094 10.39 4.751 3 0.002627
65 2 2 4.5 5.6 94 90 45.3 13.094 10.39 4.751 3 0.002627
66 2 1 4.5 5.24 94 92 45 12.945 13.6 4.337 2 0.002861
67 1 1 5.1 6 91 83 45.1 15.58 18.348 3.577 2 0.002977
68 1 2 4.4 5.1 85 81 45.1 7.537 10.89 4.221 2 0.003246
69 1 2 3.5 5.4 93 81 45.3 7.079 10.372 4.223 3 0.003329
70 2 1 4.7 4.82 91 80 45.5 21.366 11.786 4.331 2 0.003428
71 1 2 4.2 6.12 88 83 45.1 13.208 12.819 3.908 2 0.003503
72 2 1 4.6 4.6 91 80 45.1 21.697 10.571 4.36 2 0.003707

46
No. NMAS PG Air void % Binder CAA1 CAA2 FAA CAD FAD FM RZ Rut ratio
73 1 1 5.2 6.32 90 87 45.2 12.367 17.933 3.703 2 0.004646
74 2 1 3.7 6 93 89 45.1 11.039 13.934 4.992 3 0.004876
75 1 2 3.5 5.56 99 95 45.2 10.327 10.54 4.15 3 0.005015
76 1 2 4.1 5.31 99 93 45.3 6.851 7.884 4.13 2 0.005025
77 2 1 4.3 5.47 95 92 45 20.212 13.118 4.205 2 0.005272
78 1 2 5 5.39 96 94 45.5 10.107 11.797 4.18 2 0.005374
79 1 2 3.9 5.41 87 83 45.3 9.002 10.664 4.234 3 0.005859
80 2 2 4.2 5.31 96 87 45.5 20.676 10.563 4.543 2 0.006128
81 1 2 4.4 5.63 94 89 45.2 9.573 9.728 4.169 3 0.006239
82 1 2 4.2 5.29 92 90 45.2 10.33 10.98 4.111 2 0.007023
83 1 2 3.9 5.32 92 90 45.1 9.889 10.246 4.11 2 0.007023
84 1 1 4.1 5.13 97 91 45.1 12.335 12.384 3.949 2 0.007506
85 1 2 4.1 5.13 97 94 45.1 12.335 12.384 3.949 2 0.007506
86 2 1 4.2 5.04 93 84 45.1 24.096 21.629 3.96 2 0.00806
87 2 2 3.5 5.49 88 84 45 22.798 13.005 4.471 2 0.009532
88 1 1 4.1 5.53 90 87 45.1 13.112 13.753 3.883 2 0.009756
89 2 2 3.6 5.41 88 80 45.1 24.382 15.456 4.123 2 0.011962
90 2 1 5 5.56 91 82 45.5 21.819 12.669 4.441 2 0.012956
91 2 2 4 5.11 95 89 45.2 19.451 9.234 4.498 2 0.018115

47
APPENDIX B
Table B-1. Datasheet of Kentucky Mixtures
NO. NMAS PG Air void % Binder CAA1 CAA2 FAA CAD FAD Rut ratio
1 1 1 3.8 6.3 100 100 45 4.73103 11.1229 0.00082
2 1 1 4 6.2 98 98 46 3.93326 9.11786 0.00116
3 1 1 4 6.2 98 98 46 3.93326 9.11786 0.00165
4 1 2 4.2 5.9 100 100 46 12.6013 13.8411 0.00046
5 1 3 4 5.4 100 100 45 3.10271 16.4924 0.00027
6 1 3 4.1 6 100 100 46 2.74071 9.78786 0.00018
7 1 3 4.2 5.4 100 100 47 3.03526 6.51035 0.00023
8 1 3 4 5.9 100 100 46 6.53026 10.0281 0.00018
9 1 3 3.9 6 100 100 46 4.85926 11.7491 0.00027
10 1 3 4.1 6.2 100 100 46 6.33526 8.1569 0.00026
11 2 1 4 5.8 99 99 48 15.6455 8.03541 0.00151
12 2 1 4.1 5.6 100 100 45 15.8132 11.4804 0.00063
13 2 1 4 5.5 100 100 45 14.3012 11.4804 0.00057
14 2 3 4.1 5.7 100 100 46 19.4815 8.05308 0.00032
15 2 3 4 5.8 100 100 45 16.8695 14.1575 0.00047
16 2 3 4.3 5.5 100 100 48 22.0185 12.8929 0.00023
17 2 3 4 5.8 99 99 48 15.6455 8.03541 0.00044
18 2 3 4 5.8 99 99 48 15.6455 8.03541 0.00057
19 2 3 4.1 6.3 100 100 45 18.4055 13.0956 0.00032
20 2 3 4.1 5.6 100 100 45 23.1715 11.5372 0.00033
21 2 3 4.1 5.6 100 100 48 13.8955 9.28995 0.00025

48
University of Nebraska–Lincoln Geomaterials Laboratory
Department of Civil Engineering College of Engineering
Lincoln, NE 68588 www.cohesive.unl.edu
The University of Nebraska–Lincoln does not discriminate based on gender, age, disability, race, color, religion, marital status, veteran’s status, national or ethnic origin, or sexual orientation.