NDICATORS OF CLIMATE CHANGE IN IDAHO Report...
15
INDICATORS OF CLIMATE CHANGE IN IDAHO Report Summary Understanding climate change and its impacts through indicators 2011
Transcript of NDICATORS OF CLIMATE CHANGE IN IDAHO Report...
INDICATORS OF CLIMATE CHANGE IN IDAHO Report Summary
Understanding climate change and its impacts through indicators
2011

IndicatorsOfClimateChangeInIdahoJanuary,2011
2
Indicators Of Climate Change
Introduction Changes in Climate Temperature Precipitation
Climate Change Indicators Impacts on Physical Systems Snowpack Streamflow Stream Temperature
Impacts on Biological Systems Phenology Fire Vegetation Dynamics
Authors: Stephen Gillis, Brent Knapp, Jacob Wolf, Jeffrey Izo, Kristin McElligott, Jeffrey Reader, Alexander Peterson, Donovan VanSant, and Nathan Weller. Fall Semester 2010

IndicatorsOfClimateChangeInIdahoJanuary,2011
3
Introduction In 2007, the Intergovernmental Panel on Climate Change reported in their fourth assessment that the Earth’s climate system is unequivocally warming. Their conclusion was based on a suite of scientific observations consistent with a warming planet including increases in global air and ocean temperatures, rising global sea level, decreases in mountain snowpack and Arctic sea ice. Observations of physical, chemical and biological facets of the environment are referred to as environmental indicators. Given that changes in surface temperatures, sea level, and snow and ice cover have occurred on most continents and oceans over the last several decades, they represent an important indicator of global climate change. At regional to local scales indicators of climate change are varied due not only to whether regional changes in climate have occurred, but also whether the area is sensitive to changes in climate. In partnership with its three public universities, Idaho is currently supporting research efforts at understanding the effects of climate change. This undertaking will allow for a better understanding of observed climate change and projected changes for the state as well as implications of climate variability and change on ecological, human, and economic systems. The development of climate indicators for the state can serve as a valuable tool for detecting and understanding the effects of observed changes in climate, as well as understanding the ramifications of projected changes in climate for Idaho. This summary report provides information on indicators of climate change in Idaho, with a focus on describing trends in physical and biological systems. Indicators were selected on the basis of published scientific literature and publically available data libraries. The following points represent key findings from this analysis and synthesis of climate change indicators in Idaho, and are briefly discussed in the subsequent sections of this summary.

IndicatorsOfClimateChangeInIdahoJanuary,2011
4
Changes in Climate
Temperature
• Temperature is an important climate indicator that directly reflects
regional energy balance. Temperature affects agricultural production and energy use, snowmelt and runoff, as well as a host of biological life functions.
• Idaho’s annual temperatures have increased about 1°F over the last century, with the last two decades being the warmest on record.
• Warming has been particularly noted during the spring and summer.
Data Source: Western Regional Climate Center, 2010. Statewide NCDC divisional climate data. http://www.wrcc.dri.edu/cgi-bin/divplot1_form.pl?1004
Statewide Annual Mean Temperature (1895-2009)

IndicatorsOfClimateChangeInIdahoJanuary,2011
5
Changes in Climate
Precipitation
• Precipitation provides the state with water for agricultural, hydroelectric,
recreational and ecological function. • Precipitation statewide has increased slightly over the last century; with
the latter half of the record having seen on average an extra inch of precipitation more than the early portion of the record.
• Prolonged drought conditions throughout the 1920-30’s have not been observed since.
Data Source: Western Regional Climate Center, 2010. Statewide NCDC divisional climate data. http://www.wrcc.dri.edu/cgi-bin/divplot1_form.pl?1004
Statewide Water Year Precipitation (1895-2009)

IndicatorsOfClimateChangeInIdahoJanuary,2011
6
Impacts on Physical Systems
Snowpack
• Snow Water Equivalent (SWE) is a measure of the amount of water in snowpack. Water managers use April SWE to evaluate the water content of peak snowpack prior to spring runoff.
• Observations show a significantly lower in SWE post 1980. These numbers are partially a consequence of reduced precipitation and increasing temperatures.
• Observations show the largest losses in SWE at lower elevations
Data Source: SWE data from the Variable Infiltration Capacity (VIC) model output from the University of Washington. Data was averaged over all land areas within the state boundary. http://www.jisao.washington.edu/data/vic/
Statewide April-1st Snow Water Equivalent (1950-2009)

IndicatorsOfClimateChangeInIdahoJanuary,2011
7
Impacts on Physical Systems
Streamflow
• Streamflow is vital for the survival of numerous aquatic species as well
water quality and quantity for human use. • Streamflow is sensitive to a number of different physical factors,
including precipitation, snowpack, evaporation, and runoff, making it an ideal indicator to synthesize the effects of climate variability and change.
• Observations compiled from 21 USGS unregulated stream gauges across the state show a decrease in the cumulative water year streamflow by nearly two million cubic feet, or 15%, over the last half century.
•
Data Source: Historical streamflow data from 21 gauging stations located on unregulated streams from 1951-2008 within the state of Idaho were obtained from the U.S. Geological Survey National Water Information System (website: http://waterdata.usgs.gov/nwis).
Cumulative Runoff for Water Year from 21 Streams (1951-2008)

IndicatorsOfClimateChangeInIdahoJanuary,2011
8
Impacts on Physical Systems
Peak Streamflow Quantity
• High runoff events can result in flood property damages as well as
erosion and impacts to riparian ecology. • The magnitude of the peak streamflow has also decreased slightly
across the state.
Data Source: Historical streamflow data from 18 gauging stations located on unregulated streams from 1949-2008 within the state of Idaho were obtained from the U.S. Geological Survey National Water Information System (website: http://waterdata.usgs.gov/nwis).
Magnitude of Peak Runoff for 18 Unregulated Streams (1949-2008)

IndicatorsOfClimateChangeInIdahoJanuary,2011
9
Impacts on Physical Systems
Peak Streamflow Timing
• The timing of peak streamflow from 1949-2008 has advanced about a week earlier into the spring.
• Advancement in the timing of peak streamflow is hypothesized to be indicative of changes in the timing of snowmelt and/or phase of precipitation.
Data Source: Historical streamflow data from 18 gauging stations located on unregulated streams from 1949-2008 within the state of Idaho were obtained from the U.S. Geological Survey National Water Information System (website: http://waterdata.usgs.gov/nwis).
Timing of Peak Runoff for 18 Unregulated Streams (1949-2008)

IndicatorsOfClimateChangeInIdahoJanuary,2011
10
Impacts on Physical Systems
Stream Temperature
• The stream temperature gauge at Canyon Ranger Station is one of the
longest records in the Pacific Northwest. • The indicator shows a temperature increase of approximately
0.25 °F per decade, just over a 1°F increase over the 40 year period. • Water temperature is a key aspect of water quality for Salmonids
including the native Westslope Cutthroat Trout, and can be a limiting factor in their distribution, migration, health and performance (Mantua, 2009).
Data Source: Department of Interior, United States Geological Survey, 2010. Idaho Water Data Support Team. http://waterdata.usgs.gov/nwis/uv?13340600
Annual Stream Temperature for N. Fork of Clearwater River (1970-2010)

IndicatorsOfClimateChangeInIdahoJanuary,2011
11
Impacts on Physical Systems
Stream Temperature in the Boise River Basin
• Maximum stream temperatures in the Boise River basin increased by
0.86°F (0.61°F per decade) from 1993-2006 (Isaak et al. 2010). • Warmer air temperatures and reduced stream flows can dramatically
influence stream temperature and a host of ecosystem processes. • Warming was substantially greater in recently burned areas,
suggesting that land-use change can additionally change stream temperature
• Bull trout, a cold water fish native to Northwestern North America and currently listed under the U.S. Endangered Species Act, were estimated to have lost 11% - 20% (8% - 16% per decade) of stream habitat due to warming beyond temperatures cold enough to support adult spawning and juvenile rearing (Isaak et al. 2010).
Data Source: Isaak et al. 2010.
Thermal map for the Boise River basin of mean temperature changes from 1993 to 2006 (adapted from Isaak et al., 2009)
IndicatorsOfClimateChangeInIdahoJanuary,2011
12
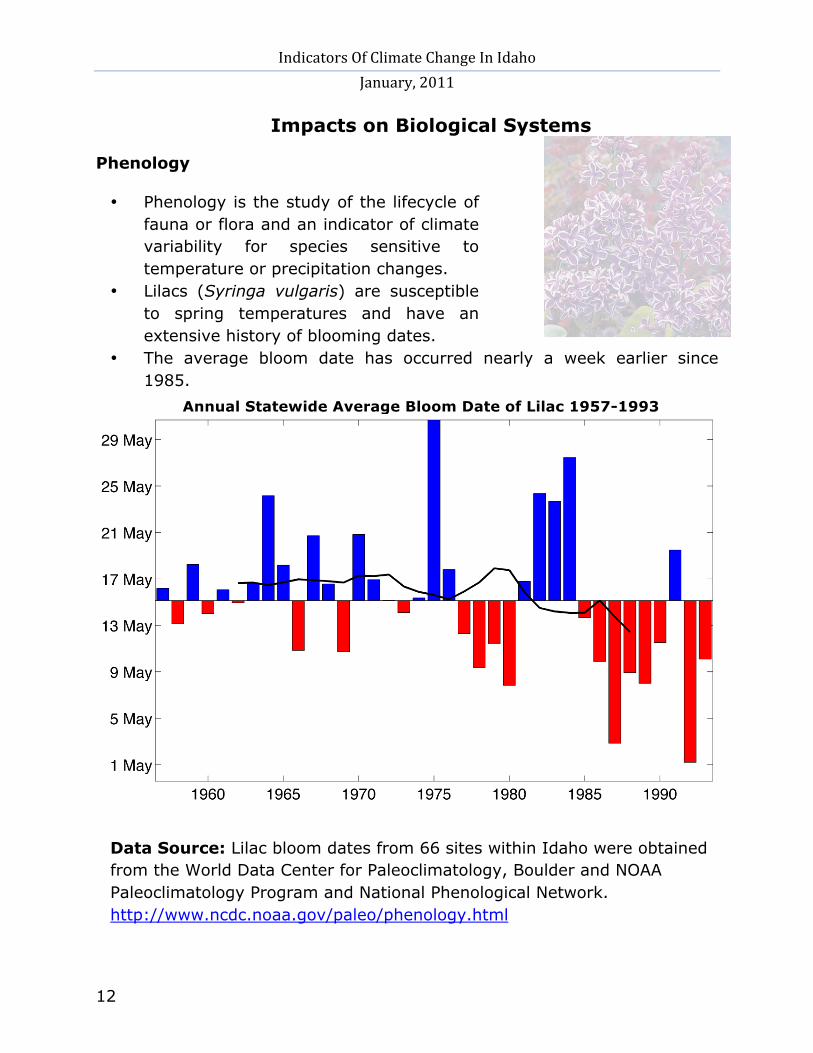
Impacts on Biological Systems
Phenology • Phenology is the study of the lifecycle of
fauna or flora and an indicator of climate variability for species sensitive to temperature or precipitation changes.
• Lilacs (Syringa vulgaris) are susceptible to spring temperatures and have an extensive history of blooming dates.
• The average bloom date has occurred nearly a week earlier since 1985.
Data Source: Lilac bloom dates from 66 sites within Idaho were obtained from the World Data Center for Paleoclimatology, Boulder and NOAA Paleoclimatology Program and National Phenological Network. http://www.ncdc.noaa.gov/paleo/phenology.html
Annual Statewide Average Bloom Date of Lilac 1957-1993

IndicatorsOfClimateChangeInIdahoJanuary,2011
13
Impacts on Biological Systems
Wildfire
• Large wildfire seasons typically occur during unusually warm and dry
summers (Morgan et al., 2008). Increases in spring and summer temperatures in recent decades are hypothesized to have increased the potential for large fire seasons in recent years.
• Large wildfire years in high-altitude coniferous forests are limited to years with abnormally warm and dry conditions. Wildfires in forests ecotypes have increased in recent decades in the Northern Rockies due to an earlier snowmelt and warmer summer temperatures (Westerling et al., 2006).
• The largest wildfire in Idaho in recent decades was the Murphy’s Complex Fire in July 2007 that started during a lightning bust following a 3-6 month period of below normal precipitation and grew as a result of record setting fire danger conditions (Launchbaugh et al., 2008).
Data Source: Atlas of digital polygon fire extents for Idaho and western Montana (1889-2008). http://www.fs.fed.us/rm/data_archive/dataaccess/ID_MT_fire-atlas.shtml
Annual Area Burned in Idaho and Western Montana 1900-2008

IndicatorsOfClimateChangeInIdahoJanuary,2011
14
Impacts on Biological Systems
Vegetation Dynamics
• Climate (energy and moisture) is generally recognized as the primary factor controlling vegetation distributions (Woodward 1987).
• Decreases in Aspen populations have occurred in recent decades. It is hypothesized that prolonged moisture deficits are an additional stressor that has lead to a decline in aspen.
• Increases in tree mortality have been reported throughout the interior west, with high rates reported in Northern Idaho. Van Mantgem et al. (2009) suggest that regional warming and drought stress may be the dominant contributors to increases in tree mortality rates observed throughout the region.

IndicatorsOfClimateChangeInIdahoJanuary,2011
15
References Isaak, D.J., C.H., Luce , B. E. Rieman , D. Nagel, E.E. Peterson, D.L Horan, S. Parkes, and G.L. Chandler (2010), Effects of Climate Change and Wildfire on Stream Temperatures and Salmonid Thermal Habitat in a Mountain River Network. Ecological Applications (20): pp 1350-1371. Launchbaugh, K., B. Brammer, M. Brooks, S. Bunting, P. Clark, J. Davison M. Fleming, R. Kay, M.Pellant, D.A. Pyke and B. Wylie (2008), Interactions along livestock grazing, vegetation type, and fire behavior in the Murphy Wildland Fire Complex in Idaho and Nevada. US Geological Survey Open-File Report 2008-1214. Washington, DC. Mantua, N., A. Hamlet, and I. Tohver (2009), Impacts of Climate Change on Key Aspects of Freshwater Salmon Habitat in Washington State, pp. 214, 223, The Washington Climate Impacts Assessment: Evaluating Washington’s Future in a Changing Climate, Seattle WA, USA. Morgan, P., E.K. Heyerdahl, and C.E. Gibson (2008), Multi-season climate synchronized widespread forest fires throughout the 20th-century, Northern Rocky Mountains. USA Ecology. 89(3):717-728. van Mantgem, P. J., N. L. Stephenson, J. C. Byrne, L. D. Daniels, J. F. Franklin, P. Z. Fulé, M. E. Harmon, A. J. Larson, J. M. Smith, A. H. Taylor, and T. T. Veblen. (2009), Widespread increase of tree mortality rates in the western United States. Science 323: 521-524. Westerling, A.L., H.G. Hidalgo, D.R. Cayan, and T.W. Swetnam (2006) Warming and Earlier Spring Increase Western U.S. Forest Wildfire Activity. Science. Vol. 313, 940-943. Woodward, F. I. (1987), Climate and Plant Distribution, p. 174, Cambridge University Press New York, NY USA. WRCC, (2010) Desert Research Institute, Western Regional Climate Center, Reno, Nevada. http://www.wrcc.dri.edu/.