NDIA Word Template - NDIS · found eligible for the Scheme up to six months in advance of receiving...
66
Transcript of NDIA Word Template - NDIS · found eligible for the Scheme up to six months in advance of receiving...


October 2016 | COAG Disability Reform Council Quarterly Report 2
Executive Summary
Background
1 July 2016 marked the start of the Transition to full scheme for the NDIS, and the conclusion of
the three year trial period of the NDIS.
At the end of the trial, 30,281 participants had approved plans. Comparison between the revenue
received during the trial from both the Commonwealth and State/Territory governments (the
“funding envelope”) and the amount of support used by participants, results in a small surplus
over the three years (approximately 1.5% of the funding envelope).
The NDIA commenced Transition with a new ICT system. Specifically the Department of Human
Services (DHS) SAP solution has replaced the Siebel solution used during trial. The new ICT
system will better meet the needs of the NDIA. However, there were some initial issues with the
ICT system when it went live, in particular, not all payments to service providers could be
processed. The need to respond to provider payment issues meant a delay in commencing the
phasing of participants into the Scheme as outlined in the bilateral agreements between the
Commonwealth and State/Territory governments.
The NDIA agreed a Transition Recovery Plan with the COAG Disability Reform Council (CDRC).
This recovery plan indicated that the NDIA would aim to meet half of the quarter one bilateral
target for 2016-17 (the “revised target”), with the cumulative quarter two target for 2016-17
remaining the same. There are some current limitations to the data available to build this report.
This is due to the data warehouse of the new Customer Relationship Management (CRM)
system being under construction at the time that this report was written. The data warehouse will
be in place prior to the 31 December 2016 report.
October 2016 | COAG Disability Reform Council Quarterly Report 3
Quarter 1, 2016-17
Participants
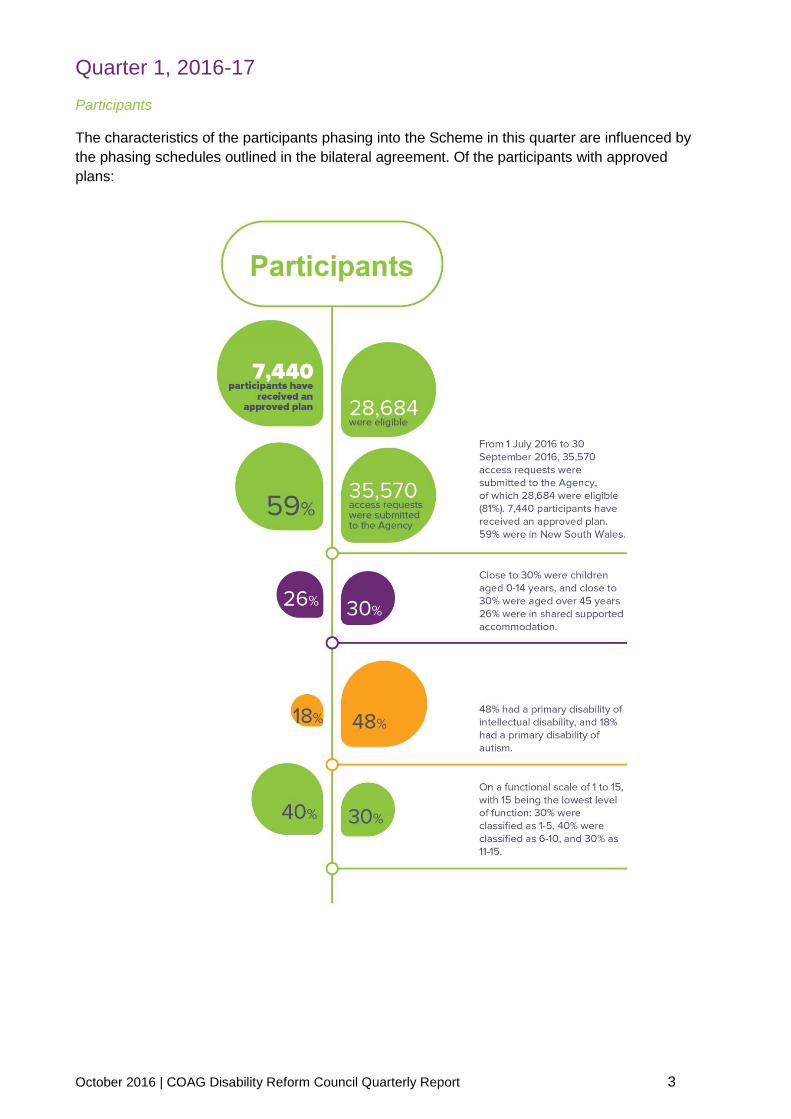
The characteristics of the participants phasing into the Scheme in this quarter are influenced by
the phasing schedules outlined in the bilateral agreement. Of the participants with approved
plans:

October 2016 | COAG Disability Reform Council Quarterly Report 4
Baseline participant and family/carer outcome indicators
Baseline outcome indicator information was collected on 96% of participants who received a first
plan in the quarter. This information will be collected longitudinally to understand how outcomes
change over time. Note: as these indicators are baseline indicators they do not measure the
impact of the NDIS as participants have only just entered the Scheme. The key findings for
participants were:
October 2016 | COAG Disability Reform Council Quarterly Report 5
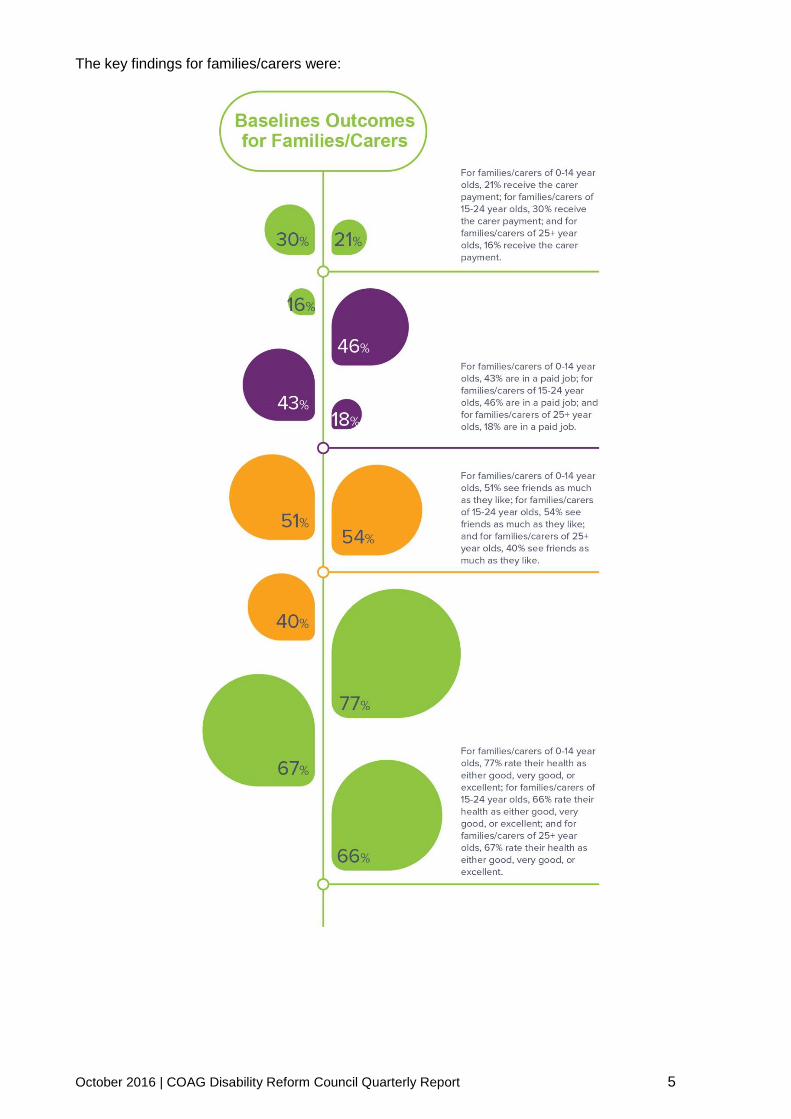
The key findings for families/carers were:

October 2016 | COAG Disability Reform Council Quarterly Report 6
Financial sustainability
At 30 September 2016:
Currently the Productivity Commission estimate is considered the best estimate of the longer-
term cost of the NDIS (approximately 0.9% of GDP for under 65 year olds). The NDIS insurance
approach allows pressures on the Scheme to be identified early and management responses put
in place to respond to these pressures. There are some current pressures which require
management responses, including higher than expected numbers of children entering the
Scheme, increasing package costs, and a mismatch between benchmark package costs and
actual package costs.
Two specific initiatives to address these pressures are the Early Childhood Early Intervention
(ECEI) approach and the first plan approach.
In addition to these two initiatives, NDIA management has put in place a Sustainability and
Liability Review Working Group led by the CEO to oversee the initiatives addressing the cost
pressures identified above.

October 2016 | COAG Disability Reform Council Quarterly Report 7
The NDIS market
NDIA efficiency
During the transition to full scheme, clients transitioning from State/Territory programs will be
found eligible for the Scheme up to six months in advance of receiving an approved plan. This
allows the participant to potentially work with a Local Area Co-ordinator (LAC) or receive other
support to understand the NDIS planning process, and think about how to best use mainstream,
community and funded supports to achieve their goals.

October 2016 | COAG Disability Reform Council Quarterly Report 8
October 2016 | COAG Disability Reform Council Quarterly Report 9
Contents
Executive Summary .................................................................................................................. 2
Contents.................................................................................................................................... 9
Introduction ............................................................................................................................. 11
Introduction .......................................................................................................................... 11
Sections of this report .......................................................................................................... 11
The trial period of the NDIS ..................................................................................................... 12
Background ......................................................................................................................... 12
Participants .......................................................................................................................... 13
Committed supports ............................................................................................................. 14
Actual payments .................................................................................................................. 14
Service providers ................................................................................................................. 15
Summary ............................................................................................................................. 15
1 People with disability lead lives of their choice ................................................................. 16
Introduction .......................................................................................................................... 16
Key findings ......................................................................................................................... 17
1.1 Outcomes for participants and their families/carers ................................................... 21
1.1.1 Proportion of participants, and their families and carers who report improved
economic outcomes and social outcomes (as measured by the NDIA outcomes framework)
21
1.1.2 Proportion of participants who attain the goals outlined in their plans (as
measured by the NDIA’s Goal Attainment Scale) ............................................................. 32
1.1.3 Participant satisfaction ....................................................................................... 32
1.2 Provision of support in response to assessed need................................................... 36
1.2.1 Number of registered service providers by characteristics and market profile .... 36
1.2.2 Access request to receiving support within different timeframes......................... 37
2 NDIS is a financially sustainable, insurance-based NDIS ................................................. 38
Introduction .......................................................................................................................... 38
Key findings ......................................................................................................................... 39
2.1 Participant characteristics and their families/carers ................................................... 40
2.1.1 Access requests made by outcome .................................................................... 40
2.1.2 Participants against bilateral targets, including key characteristics ..................... 41
2.1.3 Participants with approved plans against bilateral targets .................................. 46
2.1.4 Trends in plan approvals .................................................................................... 49
2.1.5 Access request to plan approval within different timeframes .............................. 49
2.1.6 Ineligible people and key characteristics of these people ................................... 50
2.2 Support packages ..................................................................................................... 52
2.2.1 Committed support ............................................................................................. 52
October 2016 | COAG Disability Reform Council Quarterly Report 10
2.2.2 Actual payments ................................................................................................ 53
2.2.3 Average and median package costs by sub-groups of the population and for all
participants compared with the expected averages and medians, including trends .......... 55
2.2.4 Details of participants with second plans, including length and value of supports58
2.2.5 Distribution of package costs ............................................................................. 59
2.3 Projections ................................................................................................................ 60
2.3.1 Cost of the NDIS in dollar terms and as a percentage of GDP (split by participants
aged under 65 and over 65). This measure will include NDIA operating costs ................. 60
3 Greater community inclusion of people with disability ....................................................... 61
3.1 Mainstream services ................................................................................................. 61
3.1.1 Number of participants accessing mainstream services by service type............. 61
3.2 LAC ........................................................................................................................... 62
3.2.1 Number of participants and other people with a disability supported by LACs by
participant characteristics ................................................................................................. 62
3.3 ILC ............................................................................................................................ 63
3.3.1 Number of participants and other people with a disability supported by ILC
activities by participant characteristics .............................................................................. 63
3.3.2 Descriptions of activities undertaken on ILC including dollars spent by regions and
activities 63
Appendix A .............................................................................................................................. 64
Appendix B .............................................................................................................................. 65
October 2016 | COAG Disability Reform Council Quarterly Report 11
Introduction
Introduction
A legislative requirement of the National Disability Insurance Agency (NDIA) in the National
Disability Insurance (NDIS) Act 2013 (Section 174) is:
The Board members must prepare a report on operations of the Agency for each period of 3
months starting on 1 July, 1 October, 1 January or 1 April; and give the report to the Ministerial
Council within 1 month after the end of the period to which the report relates.
The NDIS Performance Reporting Framework in the bilateral agreements between the
Commonwealth and State/Territory governments outlines the NDIS outcomes, key performance
indictors (KPIs), and performance measures against which to report. This Performance
Reporting Framework is included in Appendix A.
This 30 September 2016 report is the first quarterly report of the NDIS Transition period which
commenced on 1 July 2016. Subsequent reports will include quarterly trends and comparisons.
Where possible, data is presented by State/Territory.
There are some current limitations to the data available to build this report. This is due to the
data warehouse of the new Customer Relationship Management (CRM) system being under
construction at the time that this report was written. The data warehouse will be in place prior to
the 31 December 2016 report.
Sections of this report
The sections of this report are as follows:
An executive summary
Trial performance. A brief summary of the trial is provided. Where relevant, trial site
information is also discussed in other sections of the report.
2016-17 Q1 performance split into the three outcomes measures outlined in the bilateral
agreements:
People with disability lead lives of their choice
The NDIS is financially sustainable and based on insurance principles
Greater community inclusion of people with disability.
October 2016 | COAG Disability Reform Council Quarterly Report 12
The trial period of the NDIS
Background
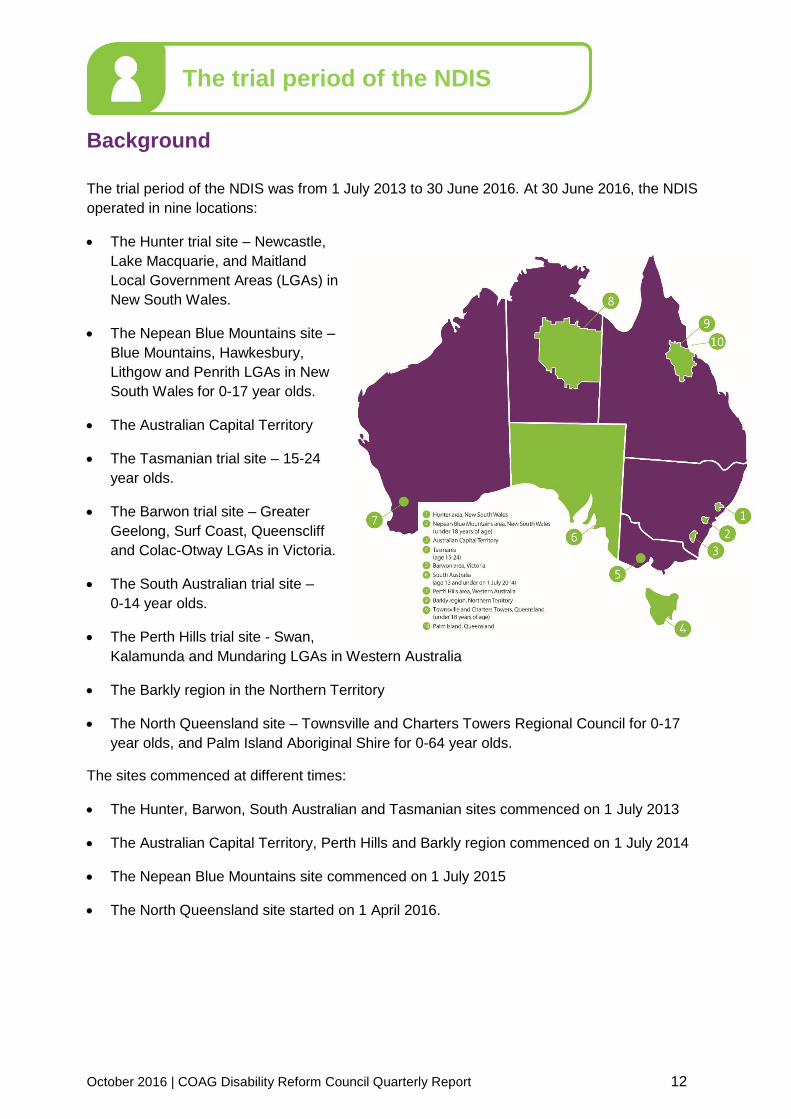
The trial period of the NDIS was from 1 July 2013 to 30 June 2016. At 30 June 2016, the NDIS
operated in nine locations:
The Hunter trial site – Newcastle,
Lake Macquarie, and Maitland
Local Government Areas (LGAs) in
New South Wales.
The Nepean Blue Mountains site –
Blue Mountains, Hawkesbury,
Lithgow and Penrith LGAs in New
South Wales for 0-17 year olds.
The Australian Capital Territory
The Tasmanian trial site – 15-24
year olds.
The Barwon trial site – Greater
Geelong, Surf Coast, Queenscliff
and Colac-Otway LGAs in Victoria.
The South Australian trial site –
0-14 year olds.
The Perth Hills trial site - Swan,
Kalamunda and Mundaring LGAs in Western Australia
The Barkly region in the Northern Territory
The North Queensland site – Townsville and Charters Towers Regional Council for 0-17
year olds, and Palm Island Aboriginal Shire for 0-64 year olds.
The sites commenced at different times:
The Hunter, Barwon, South Australian and Tasmanian sites commenced on 1 July 2013
The Australian Capital Territory, Perth Hills and Barkly region commenced on 1 July 2014
The Nepean Blue Mountains site commenced on 1 July 2015
The North Queensland site started on 1 April 2016.
October 2016 | COAG Disability Reform Council Quarterly Report 13
Participants
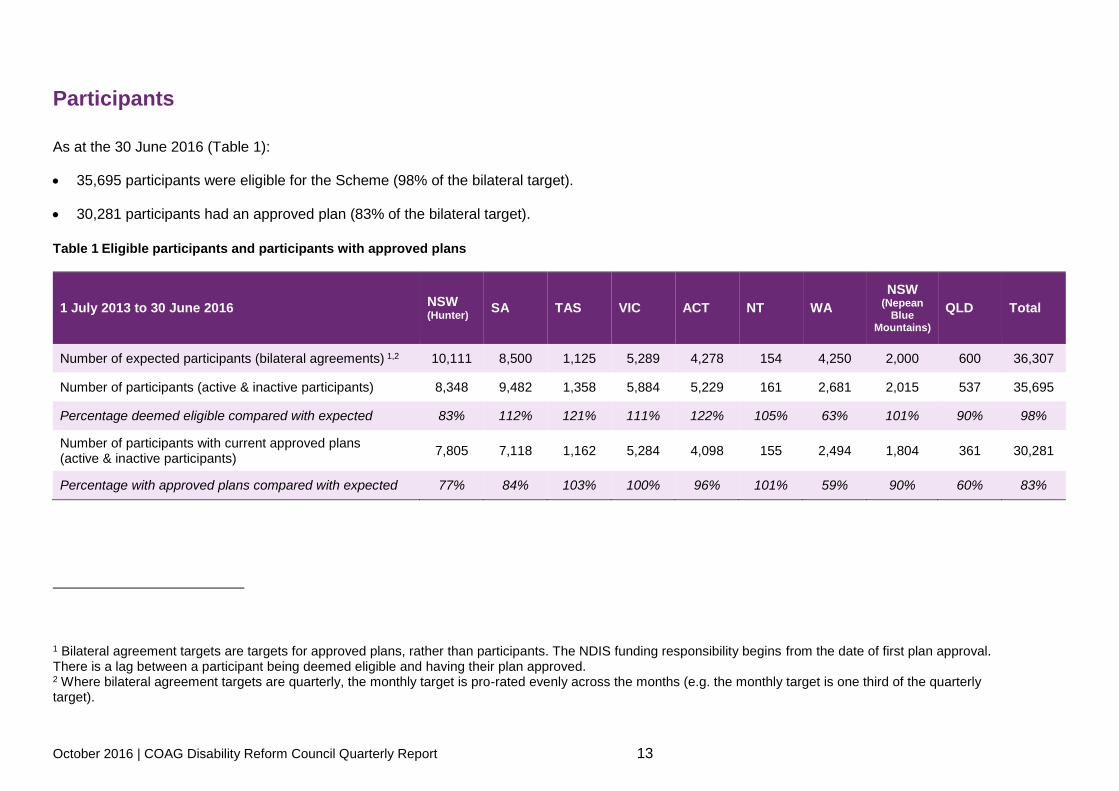
As at the 30 June 2016 (Table 1):
35,695 participants were eligible for the Scheme (98% of the bilateral target).
30,281 participants had an approved plan (83% of the bilateral target).
Table 1 Eligible participants and participants with approved plans
1 July 2013 to 30 June 2016 NSW (Hunter)
SA TAS VIC ACT NT WA
NSW (Nepean
Blue Mountains)
QLD Total
Number of expected participants (bilateral agreements) 1,2 10,111 8,500 1,125 5,289 4,278 154 4,250 2,000 600 36,307
Number of participants (active & inactive participants) 8,348 9,482 1,358 5,884 5,229 161 2,681 2,015 537 35,695
Percentage deemed eligible compared with expected 83% 112% 121% 111% 122% 105% 63% 101% 90% 98%
Number of participants with current approved plans (active & inactive participants)
7,805 7,118 1,162 5,284 4,098 155 2,494 1,804 361 30,281
Percentage with approved plans compared with expected 77% 84% 103% 100% 96% 101% 59% 90% 60% 83%
1 Bilateral agreement targets are targets for approved plans, rather than participants. The NDIS funding responsibility begins from the date of first plan approval. There is a lag between a participant being deemed eligible and having their plan approved. 2 Where bilateral agreement targets are quarterly, the monthly target is pro-rated evenly across the months (e.g. the monthly target is one third of the quarterly target).
October 2016 | COAG Disability Reform Council Quarterly Report 14
Committed supports
As at 30 June 2016, 30,281 participants (active and inactive) have approved plans, and
$2,404.3 million of support has been committed to these participants.
Of this $2,404.3 million:
It is estimated that $141.0 million (6%) was provided in 2013-14 (including actual paid to
date). The funding envelope based on the bilateral agreements for 2013-14 is $148.8
million, including cash and in-kind. Hence, for participants who have entered the Scheme in
the first year, committed support for 2013-14 is around 95% of the funding envelope.
$505.3 million (21%) is estimated to be provided in 2014-15. This compares with the
funding envelope based on the bilateral agreements for 2014-15 of $456.9 million, including
both cash and in-kind. Therefore, for participants who have entered the Scheme to date,
committed support for 2014-15 is around 111% of the funding envelope for 2014-15.
$915.7 million (38%) is estimated to be provided in 2015-16. The funding envelope based
on the bilateral agreements for 2015-16 is $873.1 million, including both cash and in-kind.
Thus, for participants who have entered the Scheme to date, committed support for 2015-
16 is 105% of the funding envelope for 2015-16.
$842.3 million (35%) is expected to be provided in 2016-17 and beyond.
Note: committed support exceeds the funding envelope in 2014-15 and 2015-16. However, as
not all committed support is being utilised, an actual deficit will not arise. Specifically,
comparison between the revenue received during the trial from both the Commonwealth and
State/Territory governments (the “funding envelope”) and the amount of support used by
participants, results in a small surplus over the three years (approximately 1.5% of the funding
envelope).
Further, due to the phasing of participants into the Scheme during the trial period comparing
committed support with the bilateral agreement does not reflect full scheme costs.
Actual payments
Actual payments to service providers and participants who are self-managing their plans as at
30 June 2016 were $1,090.6 million, of which $91.6 million relates to supports provided in
2013-14, $375.7 million relates to supports provided in 2014-15 and $623.2 million relates to
supports provided in 2015-16.
Actual payments to date for supports provided in 2013-14 represent 65% of all committed
supports.
Actual payments to date for supports provided in 2014-15 represent 74% of all committed
supports.
Actual payments to date for supports provided in 2015-16 represent 68% of all committed
supports.
Actual payments to date represents 70% of all committed supports.
Note: payments continue to be made for the 2013-14 and 2014-15 support years, so these
utilisation factors may increase. Further, there is a lag between when support is provided and
when it is paid which effects the utilisation to date figure.

October 2016 | COAG Disability Reform Council Quarterly Report 15
Service providers
As at 30 June 2016, there were 3,519 registered service providers of which 1,252 (36%) were
individual/sole traders and 940 (27%) were private sector companies. The most common
support type registered was allied health supports.
Service providers received 92% of total payments to 30 June 2016 (that is, of the $1,090.6
million). The remaining 8% had been paid to self-managing participants.
Summary
At the end of trial, the NDIS has approximately 30,000 participants with an approved plan. This
is estimated to grow to 460,000 by 30 June 2019.
The scheme was within the funding envelope for the three years of trial when comparing
utilised support to revenue received.

October 2016 | COAG Disability Reform Council Quarterly Report 16
1 People with disability lead lives of
their choice
Introduction
This section presents baseline information on outcomes for participants who received an
approved plan in Quarter 1 of 2016-17, and their families/carers. The NDIS outcomes
framework is used as the basis for this reporting, and is described below. The NDIS
outcomes framework will be collected on participants over time. Only baseline information
is presented in this report as participants have only just entered the NDIS.
Over time, data on individual goal attainment will be include in this report – that is, an
assessment of the extent to which participants are meeting the individual goals outlined in
their plan will be included.
Participant satisfaction with the Agency during the planning process has been captured and
compared to previous quarters in the trial period. Furthermore, cases with the
Administrative Appeals Tribunal (AAT) are also documented.
This section also includes information on the service providers currently registered with the
NDIA and the supports they are registered to provide.
It is important to note that the participants who received an approved plan in Quarter 1 of
2016-17 will not be representative of all participants in the NDIS, this is due to the phasing
schedule outlined in the bilateral agreements. These agreements specify the different
cohorts of participants entering the Scheme each quarter.

October 2016 | COAG Disability Reform Council Quarterly Report 17
1.1 Key findings
Outcomes for participants
Some of the key findings on the baseline outcomes information were:

October 2016 | COAG Disability Reform Council Quarterly Report 18
Outcomes for families/carers

October 2016 | COAG Disability Reform Council Quarterly Report 19
Participant satisfaction with the NDIA
October 2016 | COAG Disability Reform Council Quarterly Report 20
Service providers

October 2016 | COAG Disability Reform Council Quarterly Report 21
1.2 Outcomes for participants and their families/carers
1.2.1 Proportion of participants, and their families and carers who
report improved economic outcomes and social outcomes (as
measured by the NDIA outcomes framework)
Background
The NDIS Outcomes Framework collects information from participants and
families/carers on how they are progressing in different areas (domains) of their lives.
Building on research commissioned by the Independent Advisory Council, the outcomes
framework adopts a lifespan approach to measuring outcomes, recognising that
different outcomes will be important at different stages of life. Questionnaires have been
developed for four different participant age groups. There are also three different
family/carer questionnaires, depending on the age of the participant.
The domains for each cohort are included in Appendix B.
Two versions of the questionnaires have been developed: a short form (SF) and a long
form (LF). The SF contains questions relevant to planning and a small number of key
indicators, and is being collected for all participants. The LF contains a broader range of
questions relevant to Scheme monitoring and will be collected for a sample of
participants. Both forms will be collected longitudinally over time.
This report includes results from the SF questionnaires collected during the quarter
ended 30 September 2016. At this stage only a cross-sectional (baseline) analysis is
possible since no longitudinal history has been built up yet. As this history accumulates,
it will be possible to measure and report on within-individual change over time.
October 2016 | COAG Disability Reform Council Quarterly Report 22
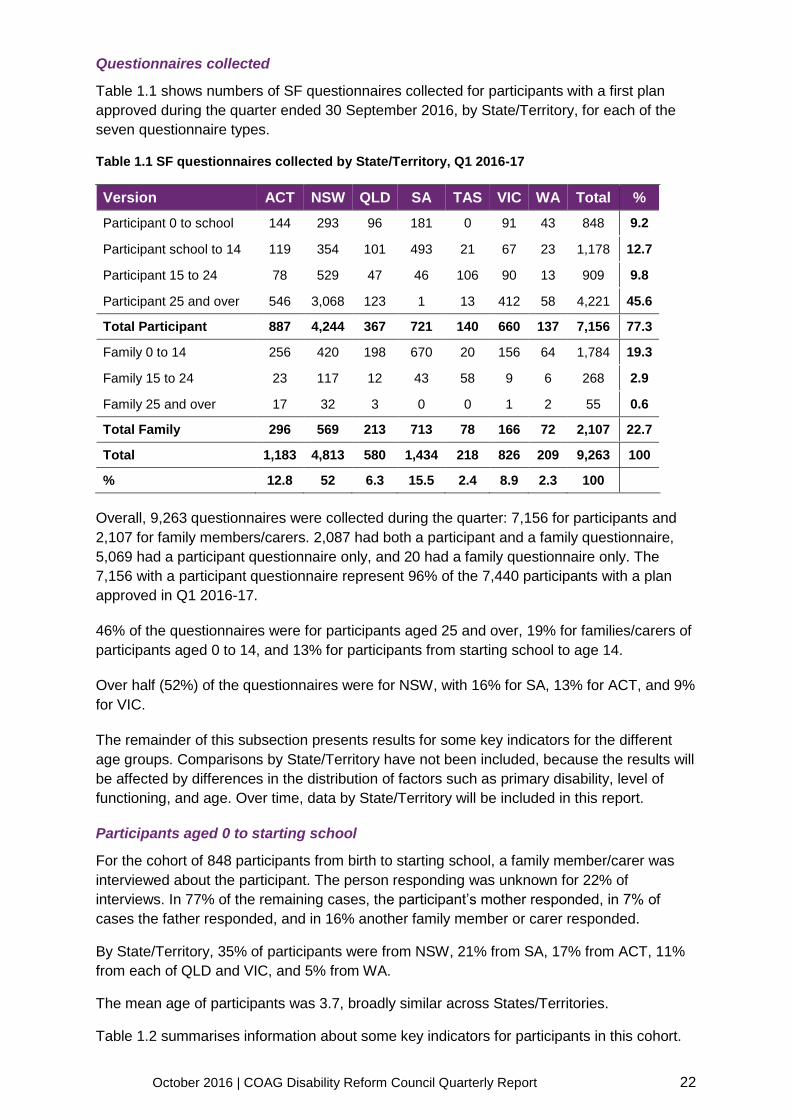
Questionnaires collected
Table 1.1 shows numbers of SF questionnaires collected for participants with a first plan
approved during the quarter ended 30 September 2016, by State/Territory, for each of the
seven questionnaire types.
Table 1.1 SF questionnaires collected by State/Territory, Q1 2016-17
Version ACT NSW QLD SA TAS VIC WA Total %
Participant 0 to school 144 293 96 181 0 91 43 848 9.2
Participant school to 14 119 354 101 493 21 67 23 1,178 12.7
Participant 15 to 24 78 529 47 46 106 90 13 909 9.8
Participant 25 and over 546 3,068 123 1 13 412 58 4,221 45.6
Total Participant 887 4,244 367 721 140 660 137 7,156 77.3
Family 0 to 14 256 420 198 670 20 156 64 1,784 19.3
Family 15 to 24 23 117 12 43 58 9 6 268 2.9
Family 25 and over 17 32 3 0 0 1 2 55 0.6
Total Family 296 569 213 713 78 166 72 2,107 22.7
Total 1,183 4,813 580 1,434 218 826 209 9,263 100
% 12.8 52 6.3 15.5 2.4 8.9 2.3 100
Overall, 9,263 questionnaires were collected during the quarter: 7,156 for participants and
2,107 for family members/carers. 2,087 had both a participant and a family questionnaire,
5,069 had a participant questionnaire only, and 20 had a family questionnaire only. The
7,156 with a participant questionnaire represent 96% of the 7,440 participants with a plan
approved in Q1 2016-17.
46% of the questionnaires were for participants aged 25 and over, 19% for families/carers of
participants aged 0 to 14, and 13% for participants from starting school to age 14.
Over half (52%) of the questionnaires were for NSW, with 16% for SA, 13% for ACT, and 9%
for VIC.
The remainder of this subsection presents results for some key indicators for the different
age groups. Comparisons by State/Territory have not been included, because the results will
be affected by differences in the distribution of factors such as primary disability, level of
functioning, and age. Over time, data by State/Territory will be included in this report.
Participants aged 0 to starting school
For the cohort of 848 participants from birth to starting school, a family member/carer was
interviewed about the participant. The person responding was unknown for 22% of
interviews. In 77% of the remaining cases, the participant’s mother responded, in 7% of
cases the father responded, and in 16% another family member or carer responded.
By State/Territory, 35% of participants were from NSW, 21% from SA, 17% from ACT, 11%
from each of QLD and VIC, and 5% from WA.
The mean age of participants was 3.7, broadly similar across States/Territories.
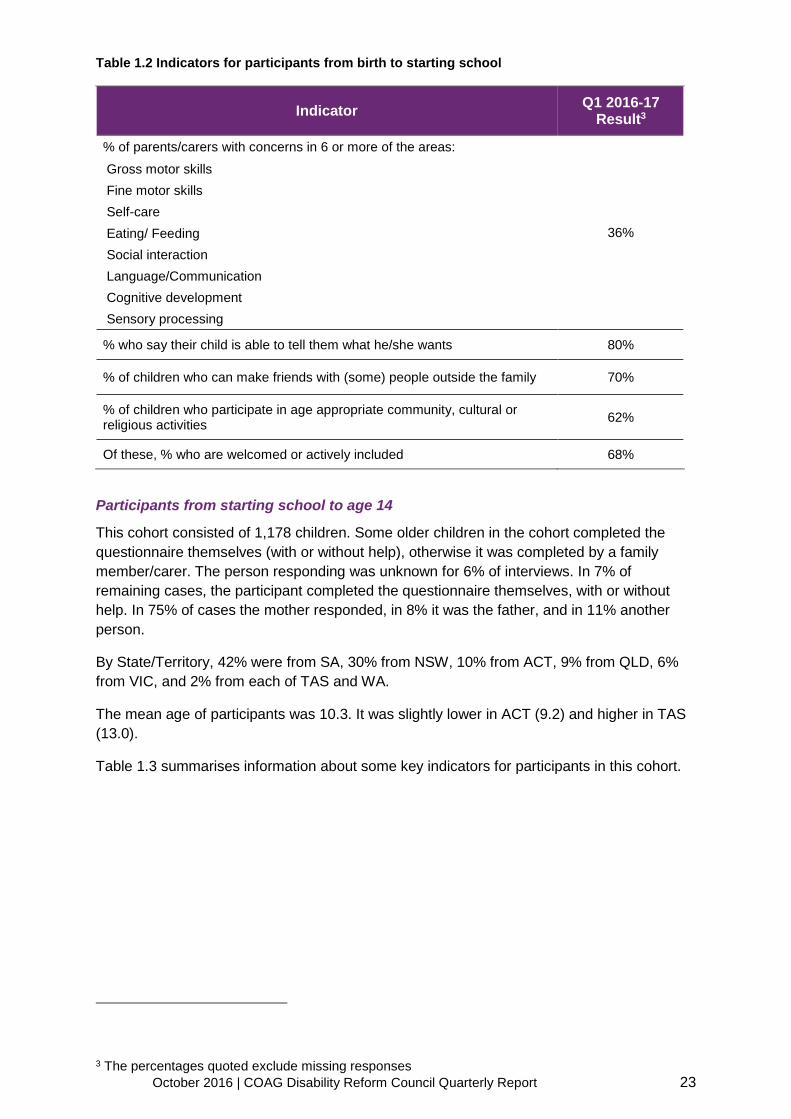
Table 1.2 summarises information about some key indicators for participants in this cohort.
October 2016 | COAG Disability Reform Council Quarterly Report 23
Table 1.2 Indicators for participants from birth to starting school
Indicator Q1 2016-17
Result3
% of parents/carers with concerns in 6 or more of the areas:
36%
Gross motor skills
Fine motor skills
Self-care
Eating/ Feeding
Social interaction
Language/Communication
Cognitive development
Sensory processing
% who say their child is able to tell them what he/she wants 80%
% of children who can make friends with (some) people outside the family 70%
% of children who participate in age appropriate community, cultural or religious activities
62%
Of these, % who are welcomed or actively included 68%
Participants from starting school to age 14
This cohort consisted of 1,178 children. Some older children in the cohort completed the
questionnaire themselves (with or without help), otherwise it was completed by a family
member/carer. The person responding was unknown for 6% of interviews. In 7% of
remaining cases, the participant completed the questionnaire themselves, with or without
help. In 75% of cases the mother responded, in 8% it was the father, and in 11% another
person.
By State/Territory, 42% were from SA, 30% from NSW, 10% from ACT, 9% from QLD, 6%
from VIC, and 2% from each of TAS and WA.
The mean age of participants was 10.3. It was slightly lower in ACT (9.2) and higher in TAS
(13.0).
Table 1.3 summarises information about some key indicators for participants in this cohort.
3 The percentages quoted exclude missing responses

October 2016 | COAG Disability Reform Council Quarterly Report 24
Table 1.3 Indicators for participants from starting school to age 14
Indicator Q1 2016-17
Result4
% of children developing functional, learning and coping skills appropriate to their ability and circumstances (either pretty well or very well)
33%
% who say their child is becoming more independent 49%
% of children who spend time with friends without an adult present (either frequently or occasionally)
18%
% of children who have a genuine say in decisions about themselves (most or some decisions)
73%
% of children attending school in a mainstream class 61%
% of children who can make friends with (some) people outside the family 69%
% of children who spend time after school and on weekends with friends and/or in mainstream programs
39%
Of these, % who are welcomed or actively included 78%
Participants aged 15 to 24
There were 909 young adults in this cohort. The person responding was unknown for 4% of
interviews. In 39% of remaining cases the participant responded, in 41% the participant’s
mother responded, in 7% the father responded, and in 14% another person responded. Over
time, the intention is to collect more data from the participant, rather than family or friends
supporting the participant.
Over half (58%) of the participants in this cohort were from NSW, with 12% from TAS, 10%
from VIC, 9% from ACT, 5% from each of QLD and SA, and 1% from WA.
The mean age of participants was 19.1. It was lower in SA (15.2) and TAS (17.6) and higher
in ACT and VIC (19.8).
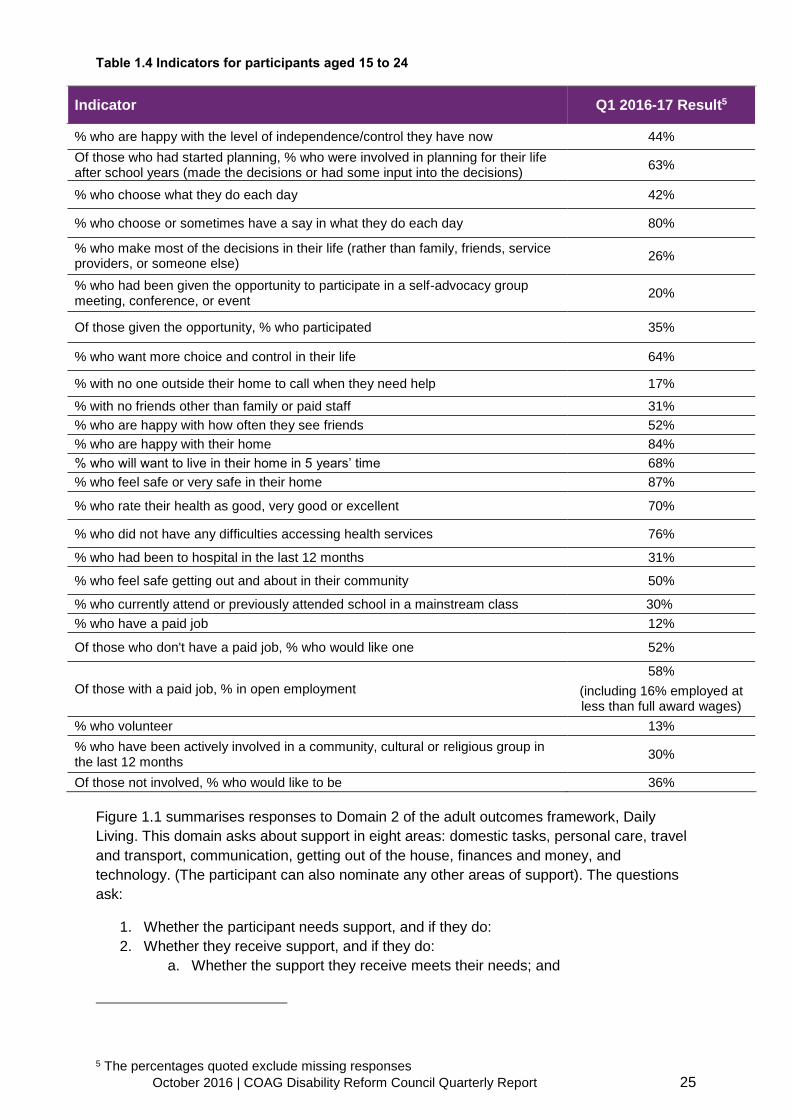
Table 1.4 summarises information about some key indicators for participants in this cohort.
4 The percentages quoted exclude missing responses
October 2016 | COAG Disability Reform Council Quarterly Report 25
Table 1.4 Indicators for participants aged 15 to 24
Indicator Q1 2016-17 Result5
% who are happy with the level of independence/control they have now 44%
Of those who had started planning, % who were involved in planning for their life after school years (made the decisions or had some input into the decisions)
63%
% who choose what they do each day 42%
% who choose or sometimes have a say in what they do each day 80%
% who make most of the decisions in their life (rather than family, friends, service providers, or someone else)
26%
% who had been given the opportunity to participate in a self-advocacy group meeting, conference, or event
20%
Of those given the opportunity, % who participated 35%
% who want more choice and control in their life 64%
% with no one outside their home to call when they need help 17%
% with no friends other than family or paid staff 31%
% who are happy with how often they see friends 52%
% who are happy with their home 84%
% who will want to live in their home in 5 years’ time 68%
% who feel safe or very safe in their home 87%
% who rate their health as good, very good or excellent 70%
% who did not have any difficulties accessing health services 76%
% who had been to hospital in the last 12 months 31%
% who feel safe getting out and about in their community 50%
% who currently attend or previously attended school in a mainstream class 30%
% who have a paid job 12%
Of those who don't have a paid job, % who would like one 52%
Of those with a paid job, % in open employment
58%
(including 16% employed at less than full award wages)
% who volunteer 13%
% who have been actively involved in a community, cultural or religious group in the last 12 months
30%
Of those not involved, % who would like to be 36%
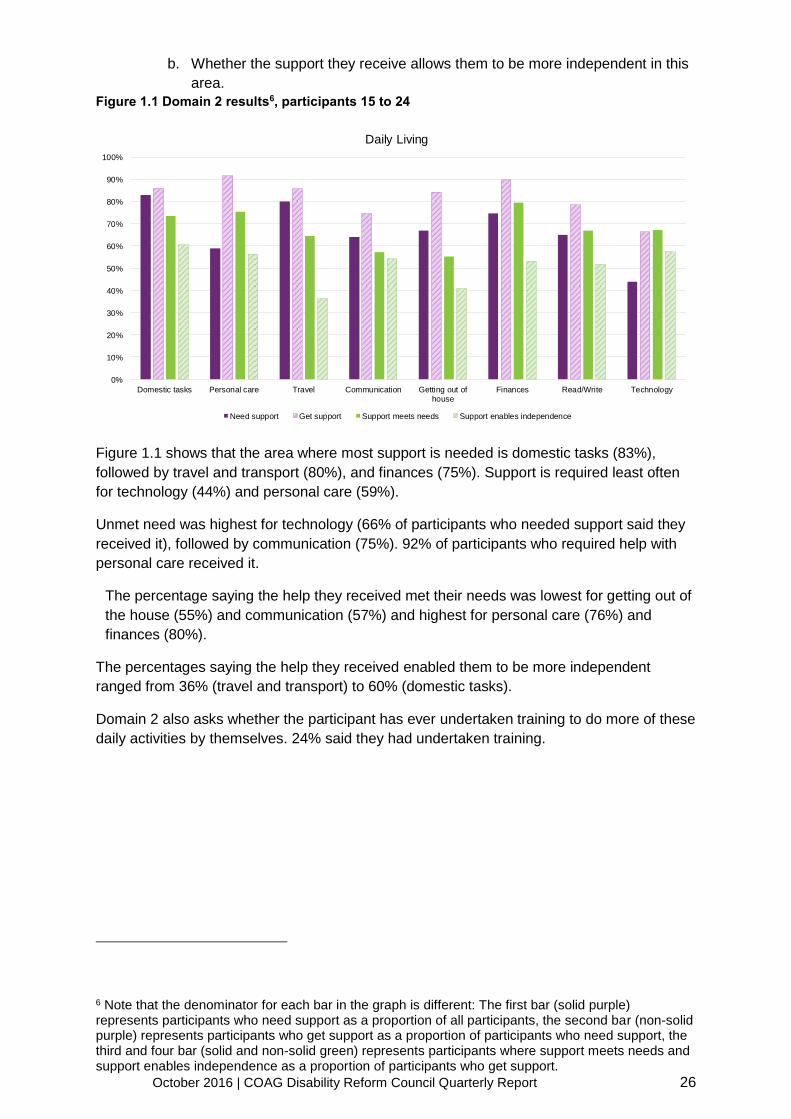
Figure 1.1 summarises responses to Domain 2 of the adult outcomes framework, Daily
Living. This domain asks about support in eight areas: domestic tasks, personal care, travel
and transport, communication, getting out of the house, finances and money, and
technology. (The participant can also nominate any other areas of support). The questions
ask:
1. Whether the participant needs support, and if they do:
2. Whether they receive support, and if they do:
a. Whether the support they receive meets their needs; and
5 The percentages quoted exclude missing responses
October 2016 | COAG Disability Reform Council Quarterly Report 26
b. Whether the support they receive allows them to be more independent in this
area.
Figure 1.1 Domain 2 results6, participants 15 to 24
Figure 1.1 shows that the area where most support is needed is domestic tasks (83%),
followed by travel and transport (80%), and finances (75%). Support is required least often
for technology (44%) and personal care (59%).
Unmet need was highest for technology (66% of participants who needed support said they
received it), followed by communication (75%). 92% of participants who required help with
personal care received it.
The percentage saying the help they received met their needs was lowest for getting out of
the house (55%) and communication (57%) and highest for personal care (76%) and
finances (80%).
The percentages saying the help they received enabled them to be more independent
ranged from 36% (travel and transport) to 60% (domestic tasks).
Domain 2 also asks whether the participant has ever undertaken training to do more of these
daily activities by themselves. 24% said they had undertaken training.
6 Note that the denominator for each bar in the graph is different: The first bar (solid purple) represents participants who need support as a proportion of all participants, the second bar (non-solid purple) represents participants who get support as a proportion of participants who need support, the third and four bar (solid and non-solid green) represents participants where support meets needs and support enables independence as a proportion of participants who get support.
0%
10%
20%
30%
40%
50%
60%
70%
80%
90%
100%
Domestic tasks Personal care Travel Communication Getting out ofhouse
Finances Read/Write Technology
Daily Living
Need support Get support Support meets needs Support enables independence
October 2016 | COAG Disability Reform Council Quarterly Report 27
Participants aged 25 and over
This was the largest cohort, with 4,221 adult participants. The person responding was
unknown for 5% of interviews. In 40% of remaining cases the participant responded, in 18%
the participant’s mother responded, in 14% the father, another family member or a
spouse/partner responded, in 9% a carer responded, and in 18% another person responded.
Over time, the intention is to collect more data from the participant, rather than family or
friends supporting the participant.
Almost three-quarters (73%) of the participants in this cohort were from NSW, with 13% from
ACT, 10% from VIC, 3% from QLD, 1% from WA, 0.3% from TAS, and there was one
participant from SA.
The mean age of participants was 45.0.
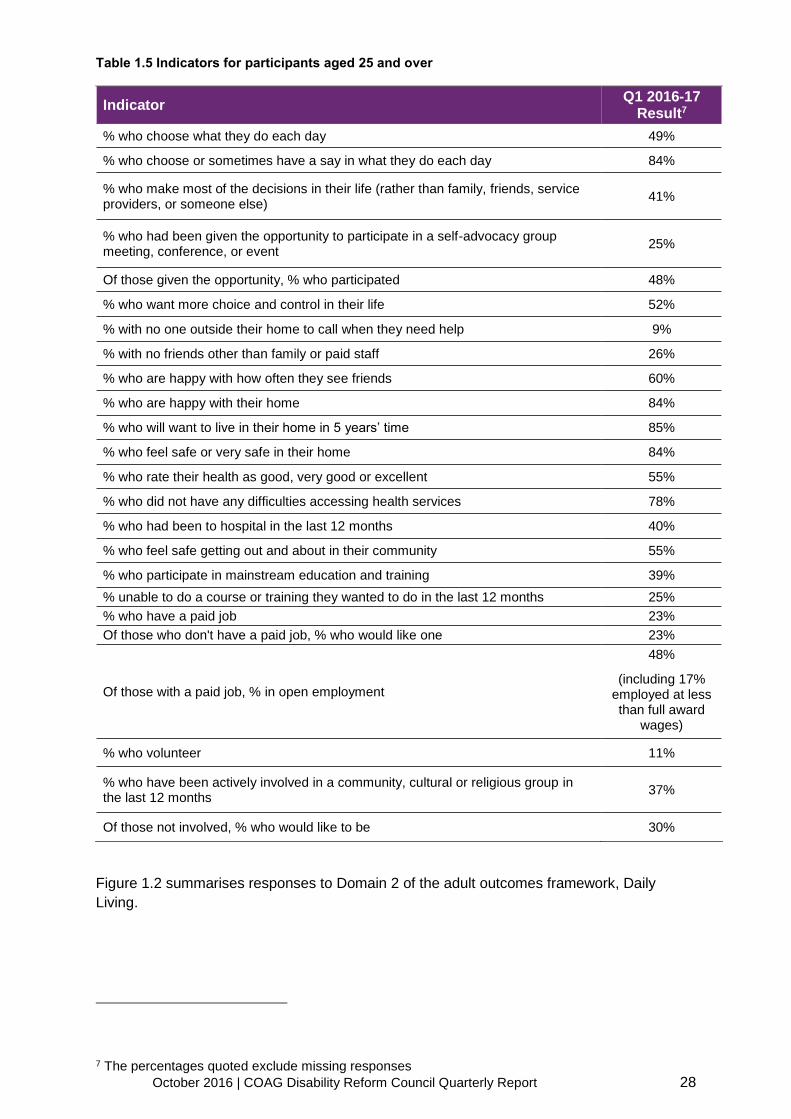
Table 1.5 summarises information about some key indicators for participants in this cohort.
October 2016 | COAG Disability Reform Council Quarterly Report 28
Table 1.5 Indicators for participants aged 25 and over
Indicator Q1 2016-17
Result7
% who choose what they do each day 49%
% who choose or sometimes have a say in what they do each day 84%
% who make most of the decisions in their life (rather than family, friends, service providers, or someone else)
41%
% who had been given the opportunity to participate in a self-advocacy group meeting, conference, or event
25%
Of those given the opportunity, % who participated 48%
% who want more choice and control in their life 52%
% with no one outside their home to call when they need help 9%
% with no friends other than family or paid staff 26%
% who are happy with how often they see friends 60%
% who are happy with their home 84%
% who will want to live in their home in 5 years’ time 85%
% who feel safe or very safe in their home 84%
% who rate their health as good, very good or excellent 55%
% who did not have any difficulties accessing health services 78%
% who had been to hospital in the last 12 months 40%
% who feel safe getting out and about in their community 55%
% who participate in mainstream education and training 39%
% unable to do a course or training they wanted to do in the last 12 months 25%
% who have a paid job 23%
Of those who don't have a paid job, % who would like one 23%
Of those with a paid job, % in open employment
48%
(including 17% employed at less than full award
wages)
% who volunteer 11%
% who have been actively involved in a community, cultural or religious group in the last 12 months
37%
Of those not involved, % who would like to be 30%
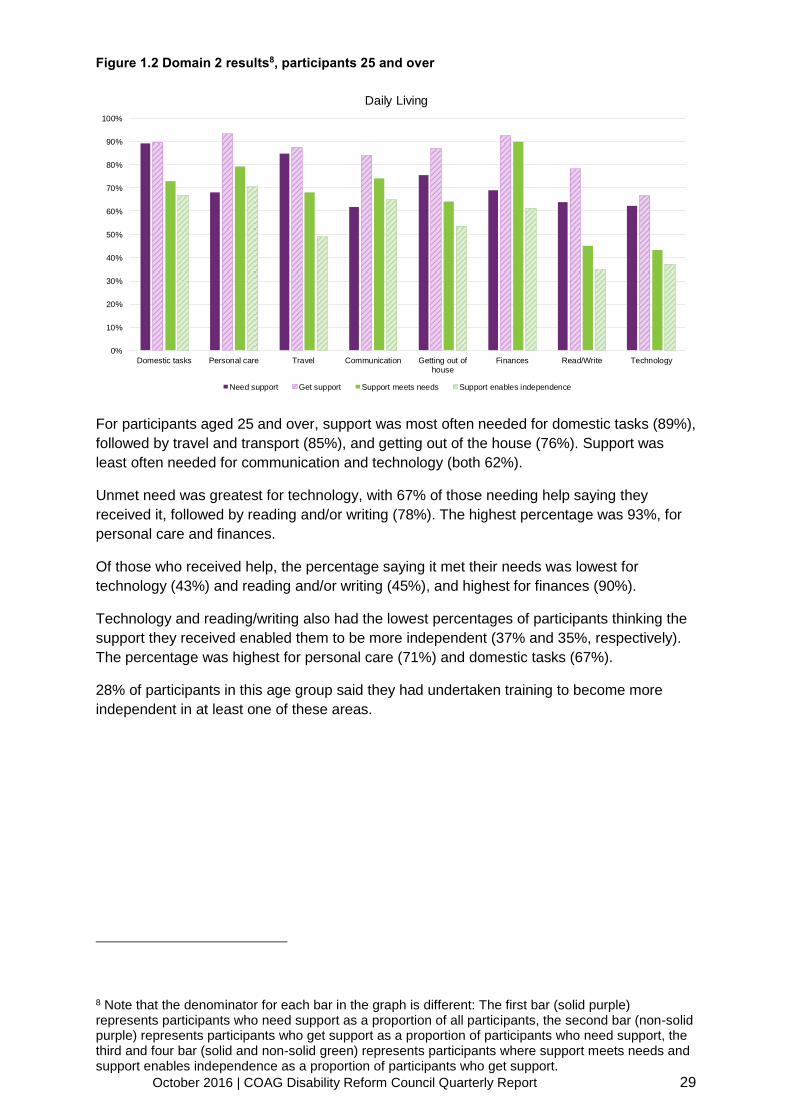
Figure 1.2 summarises responses to Domain 2 of the adult outcomes framework, Daily
Living.
7 The percentages quoted exclude missing responses
October 2016 | COAG Disability Reform Council Quarterly Report 29
Figure 1.2 Domain 2 results8, participants 25 and over
For participants aged 25 and over, support was most often needed for domestic tasks (89%),
followed by travel and transport (85%), and getting out of the house (76%). Support was
least often needed for communication and technology (both 62%).
Unmet need was greatest for technology, with 67% of those needing help saying they
received it, followed by reading and/or writing (78%). The highest percentage was 93%, for
personal care and finances.
Of those who received help, the percentage saying it met their needs was lowest for
technology (43%) and reading and/or writing (45%), and highest for finances (90%).
Technology and reading/writing also had the lowest percentages of participants thinking the
support they received enabled them to be more independent (37% and 35%, respectively).
The percentage was highest for personal care (71%) and domestic tasks (67%).
28% of participants in this age group said they had undertaken training to become more
independent in at least one of these areas.
8 Note that the denominator for each bar in the graph is different: The first bar (solid purple) represents participants who need support as a proportion of all participants, the second bar (non-solid purple) represents participants who get support as a proportion of participants who need support, the third and four bar (solid and non-solid green) represents participants where support meets needs and support enables independence as a proportion of participants who get support.
0%
10%
20%
30%
40%
50%
60%
70%
80%
90%
100%
Domestic tasks Personal care Travel Communication Getting out ofhouse
Finances Read/Write Technology
Daily Living
Need support Get support Support meets needs Support enables independence
October 2016 | COAG Disability Reform Council Quarterly Report 30
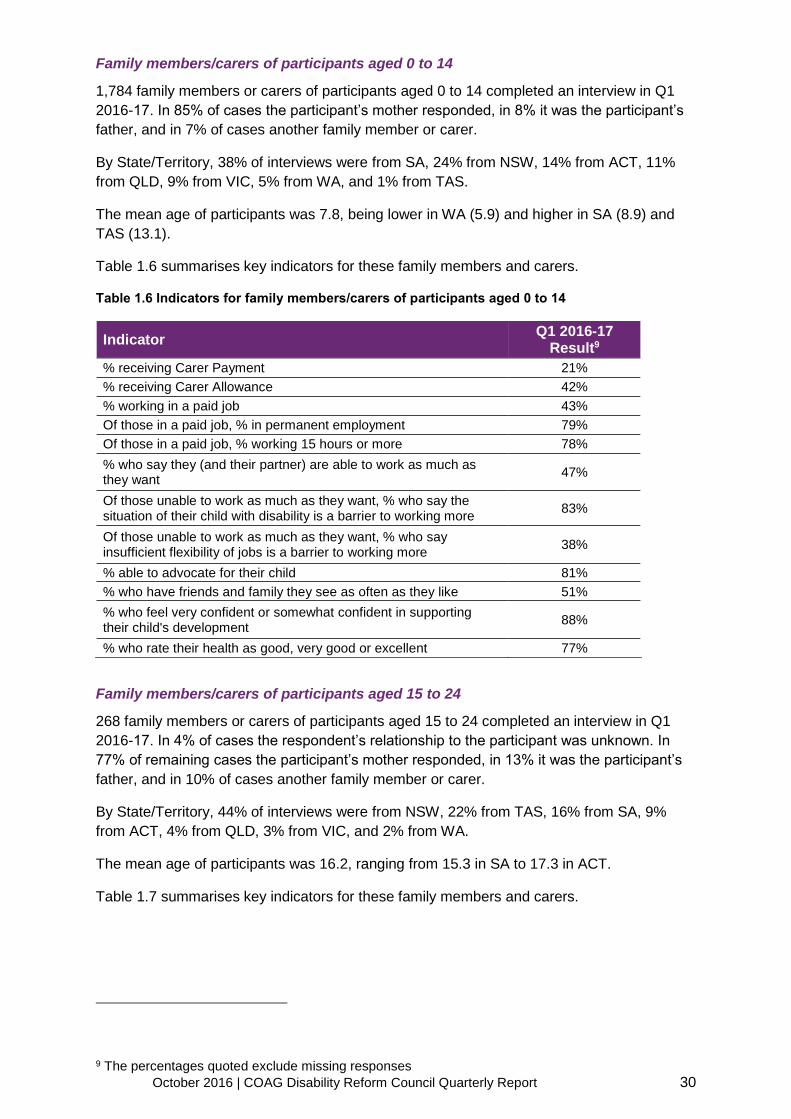
Family members/carers of participants aged 0 to 14
1,784 family members or carers of participants aged 0 to 14 completed an interview in Q1
2016-17. In 85% of cases the participant’s mother responded, in 8% it was the participant’s
father, and in 7% of cases another family member or carer.
By State/Territory, 38% of interviews were from SA, 24% from NSW, 14% from ACT, 11%
from QLD, 9% from VIC, 5% from WA, and 1% from TAS.
The mean age of participants was 7.8, being lower in WA (5.9) and higher in SA (8.9) and
TAS (13.1).
Table 1.6 summarises key indicators for these family members and carers.
Table 1.6 Indicators for family members/carers of participants aged 0 to 14
Indicator Q1 2016-17
Result9
% receiving Carer Payment 21%
% receiving Carer Allowance 42%
% working in a paid job 43%
Of those in a paid job, % in permanent employment 79%
Of those in a paid job, % working 15 hours or more 78%
% who say they (and their partner) are able to work as much as they want
47%
Of those unable to work as much as they want, % who say the situation of their child with disability is a barrier to working more
83%
Of those unable to work as much as they want, % who say insufficient flexibility of jobs is a barrier to working more
38%
% able to advocate for their child 81%
% who have friends and family they see as often as they like 51%
% who feel very confident or somewhat confident in supporting their child's development
88%
% who rate their health as good, very good or excellent 77%
Family members/carers of participants aged 15 to 24
268 family members or carers of participants aged 15 to 24 completed an interview in Q1
2016-17. In 4% of cases the respondent’s relationship to the participant was unknown. In
77% of remaining cases the participant’s mother responded, in 13% it was the participant’s
father, and in 10% of cases another family member or carer.
By State/Territory, 44% of interviews were from NSW, 22% from TAS, 16% from SA, 9%
from ACT, 4% from QLD, 3% from VIC, and 2% from WA.
The mean age of participants was 16.2, ranging from 15.3 in SA to 17.3 in ACT.
Table 1.7 summarises key indicators for these family members and carers.
9 The percentages quoted exclude missing responses

October 2016 | COAG Disability Reform Council Quarterly Report 31
Table 1.7 Indicators for family members/carers of participants aged 15 to 24
Indicator Q1 2016-17
Result10
% receiving Carer Payment 30%
% receiving Carer Allowance 46%
% working in a paid job 46%
Of those in a paid job, % in permanent employment 73%
Of those in a paid job, % working 15 hours or more 82%
% who say that family who provide informal care to their family member with disability are able to work as much as they want
51%
Of those unable to work as much as they want, % who say the situation of their family member with disability is a barrier to working more
92%
Of those unable to work as much as they want, % who say insufficient flexibility of jobs is a barrier to working more
33%
% able to advocate for their family member 76%
% who have friends and family they see as often as they like 54%
% who feel in control selecting services 42%
% who know what their family can do to enable their family member with disability to become as independent as possible
47%
% who rate their health as good, very good or excellent 66%
Family members/carers of participants aged 25 and over
Only 55 interviews were conducted with family members/carers of participants aged 25 and
over. In 25 cases the relationship of the respondent to the participant was unknown, in 15
the mother responded, in 10 another family member or spouse/partner responded, and in
five cases another person responded.
58% of the participants were from NSW and 31% from ACT. The mean age of participants
was 45.
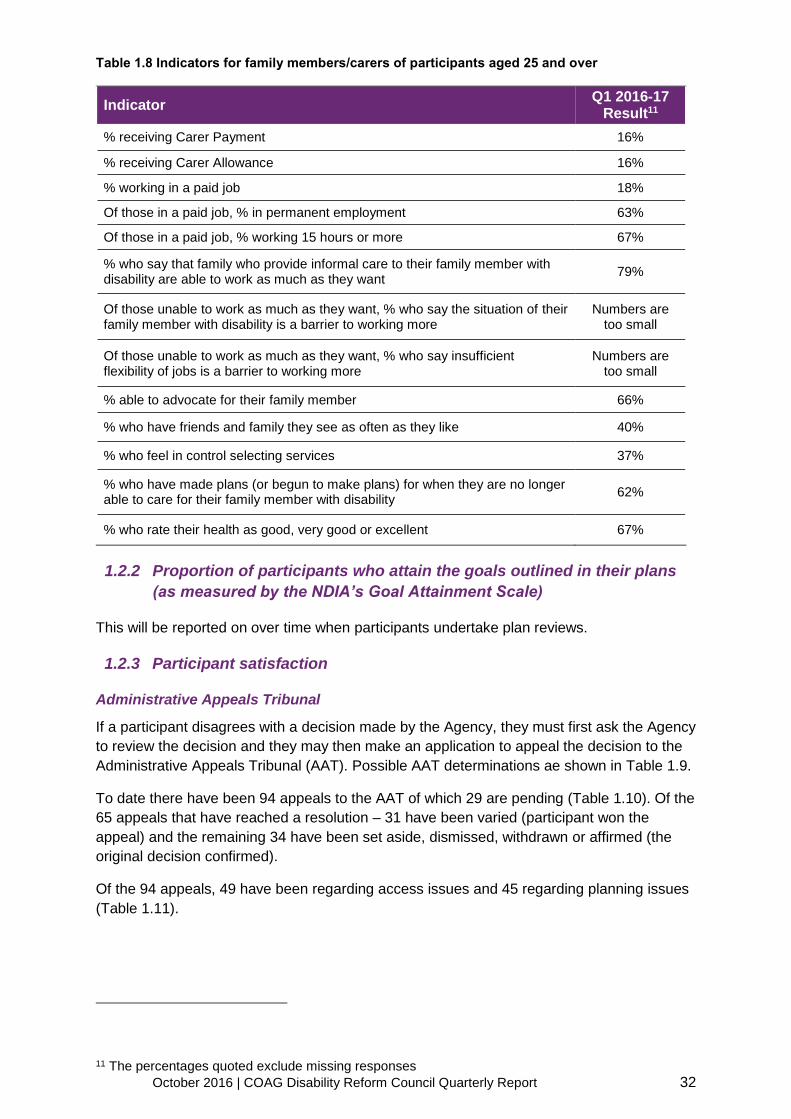
Table 1.8 summarises key indicators for these family members and carers. Due to the small
numbers, these percentages should be interpreted with caution.
10 The percentages quoted exclude missing responses
October 2016 | COAG Disability Reform Council Quarterly Report 32
Table 1.8 Indicators for family members/carers of participants aged 25 and over
Indicator Q1 2016-17
Result11
% receiving Carer Payment 16%
% receiving Carer Allowance 16%
% working in a paid job 18%
Of those in a paid job, % in permanent employment 63%
Of those in a paid job, % working 15 hours or more 67%
% who say that family who provide informal care to their family member with disability are able to work as much as they want
79%
Of those unable to work as much as they want, % who say the situation of their family member with disability is a barrier to working more
Numbers are too small
Of those unable to work as much as they want, % who say insufficient flexibility of jobs is a barrier to working more
Numbers are too small
% able to advocate for their family member 66%
% who have friends and family they see as often as they like 40%
% who feel in control selecting services 37%
% who have made plans (or begun to make plans) for when they are no longer able to care for their family member with disability
62%
% who rate their health as good, very good or excellent 67%
1.2.2 Proportion of participants who attain the goals outlined in their plans
(as measured by the NDIA’s Goal Attainment Scale)
This will be reported on over time when participants undertake plan reviews.
1.2.3 Participant satisfaction
Administrative Appeals Tribunal
If a participant disagrees with a decision made by the Agency, they must first ask the Agency
to review the decision and they may then make an application to appeal the decision to the
Administrative Appeals Tribunal (AAT). Possible AAT determinations ae shown in Table 1.9.
To date there have been 94 appeals to the AAT of which 29 are pending (Table 1.10). Of the
65 appeals that have reached a resolution – 31 have been varied (participant won the
appeal) and the remaining 34 have been set aside, dismissed, withdrawn or affirmed (the
original decision confirmed).
Of the 94 appeals, 49 have been regarding access issues and 45 regarding planning issues
(Table 1.11).
11 The percentages quoted exclude missing responses

October 2016 | COAG Disability Reform Council Quarterly Report 33
Table 1.9 Administrative Appeals Tribunal (AAT) determinations
Determination Definition
Affirmed Participant loses appeal
Set aside Participant wins appeal
Pending Appeal is still underway
Varied Participant wins appeal
Dismissed Appeal is dismissed
Withdrawn Participant withdraws appeal prior to determination
Table 1.10 Total appeals by outcome with the AAT
State/Territory Affirmed Set
aside Pending Varied Dismissed Withdrawn Total
NSW 2 0 10 7 4 1 24
SA 1 0 2 4 3 5 15
TAS 0 0 0 1 0 0 1
VIC 3 2 9 14 3 6 37
ACT 0 0 7 2 1 2 12
NT 0 0 0 0 0 0 0
WA 0 0 1 3 1 0 5
QLD 0 0 0 0 0 0 0
Total 6 2 29 31 12 14 94
Table 1.11 Total appeals by category with the AAT
State/Territory Access issues
Plan issues
Total
NSW 16 8 23
SA 5 10 15
TAS 1 0 1
VIC 16 21 36
ACT 9 3 12
NT 0 0 0
WA 2 3 4
QLD 0 0 0
Total 49 45 94

October 2016 | COAG Disability Reform Council Quarterly Report 34
Participant satisfaction survey
Since 1 July 2013, of the 2,295 participants surveyed for their satisfaction, the majority are
highly satisfied with the Agency, with an overall rating of 1.59 on a scale of -2 (very poor) to
+2 (very good), with slightly lower levels of satisfaction in South Australia, the Australian
Capital Territory, and Western Australia (Table 1.12). The overall satisfaction rating is
calculated as an average of the satisfaction ratings of each participant surveyed. Participants
are contacted by a member of the engagement team after their plan is agreed with their
planner; not all participants choose to complete and submit their survey. The participant’s
responses remain anonymous to the NDIA.
Table 1.12 Participant/ Carer/ Family satisfaction with the Agency – 1 July 2013 to date
State/Territory Participant/family/ carer satisfaction
NSW 1.68
SA 1.52
TAS 1.68
VIC 1.76
ACT 1.51
NT -
WA 1.33
Total 1.59
Considering these responses quarter by quarter, there has been a reduction in overall
satisfaction with the Agency in the most recent quarter (Table 1.13). This corresponds to the
first quarter of transition and some changes in the Agency’s planning process. Overall,
satisfaction with the Agency and the planning process remains high.
The response rate to the survey was also lower in the September 2016 quarter. The Agency
is exploring options to increase the response rate to this survey in future quarters.
Table 1.13 Participant/ Carer/ Family satisfaction with the Agency – Quarter by quarter results
Participant/Family/Carer Satisfaction - by quarter
State/Territory Q3 14-15 Q4 14-15 Q1 15-16 Q2 15-16 Q3 15-16 Q4 15-16 Q1 16-17
NSW 1.51 1.58 1.65 1.59 1.64 1.06 1.00
SA 1.49 1.66 1.79 2.00 1.91 1.56 1.02
TAS 1.67 1.67 1.94 1.28 1.50 1.60 -
VIC 1.62 1.50 2.00 1.73 - 1.88 1.50
ACT 1.69 1.42 1.54 1.36 1.83 1.60 1.48
NT - - - - - - -
WA 1.43 1.48 1.00 1.31 1.63 1.29 1.31
Total 1.54 1.57 1.65 1.50 1.73 1.51 1.22
Since 1 July 2013, 95% have rated their satisfaction with the Agency and the planning
process as either ‘good’ or ‘very good’ (Table 1.14). This proportion is slightly lower in South
Australia (91%) and Western Australia (89%).

October 2016 | COAG Disability Reform Council Quarterly Report 35
Table 1.14 Distribution of Participant/ Carer/ Family satisfaction with the Agency – 1 July 2013
to date
State/Territory Very good Good Neutral Poor Very Poor
Total
NSW 72% 26% 1% 1% 0% 100%
SA 64% 27% 5% 3% 1% 100%
TAS 73% 24% 3% 0% 1% 100%
VIC 81% 16% 3% 1% 0% 100%
ACT 57% 38% 5% 0% 0% 100%
NT - - - - - -
WA 51% 38% 7% 2% 3% 100%
Total 68% 27% 4% 1% 1% 100%
Considering only the period since 1 July 2016, 85% of participants with a plan approved in
this quarter have rated their satisfaction with the Agency and the planning process as either
‘good’ or ‘very good’ (Table 1.15). This was lowest in South Australia.
Table 1.15 Distribution of Participant/ Carer/ Family satisfaction with the Agency – July-
September 2016 quarter
State/Territory Very good Good Neutral Poor Very Poor
Total
NSW 27% 62% 0% 8% 4% 100%
SA 39% 35% 16% 10% 0% 100%
TAS - - - - - -
VIC 50% 50% 0% 0% 0% 100%
ACT 56% 37% 8% 0% 0% 100%
NT - - - - - -
WA 38% 54% 8% 0% 0% 100%
Total 43% 42% 9% 5% 1% 100%
The chart below shows how this proportion has changed quarter by quarter over the last six
quarters.
Figure 1.3 Proportion of participants describing satisfaction with the Agency as good or very
good – by quarter
0%
10%
20%
30%
40%
50%
60%
70%
80%
90%
100%
Q3 14-15 Q4 14-15 Q1 15-16 Q2 15-16 Q3 15-16 Q4 15-16 Q1 16-17

October 2016 | COAG Disability Reform Council Quarterly Report 36
1.3 Provision of support in response to assessed need
1.3.1 Number of registered service providers by characteristics and market
profile
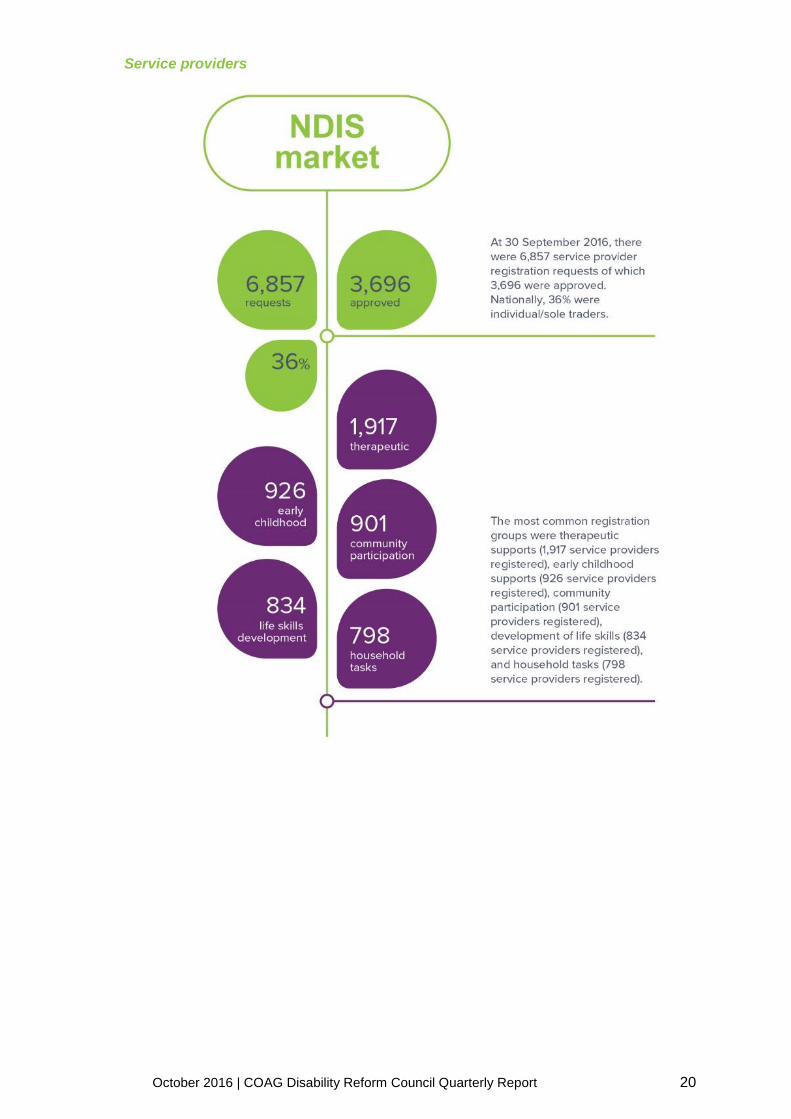
As at 30 September 2016, there were 6,857 service provider registration requests of which
3,696 were approved.
Figure 1.4 shows the number of approved service providers by State/Territory. Providers can
be registered to provide services in more than one State/Territory and therefore the total
number of approved service providers nationally will not equal the sum of approved service
providers in each State/Territory. New South Wales and Victoria have the highest number of
approved service providers, with 1,547 and 1,001 service providers respectively.
Figure 1.4 Number of approved service providers by State/Territory
A significant proportion of approved service providers are individual/sole traders. As shown
in Figure 1.5, 36% of approved service providers nationally are individual/sole traders. This
proportion varies by State/Territory, with South Australia having the highest proportion (40%)
and Queensland having the lowest proportion (14%).
Figure 1.5 Distribution of approved service providers by individual/sole trader and
company/organisation
321
1,547
111591
324
1,001
332230
ACT NSW NT SA TAS VIC WA QLD
3,696
providers approved
nationally
80, 25%536, 35%
17, 15%
238, 40%
79, 24%
358, 36%
65, 20%32, 14%
1,325, 36%
241, 75%1,011, 65%
94, 85%
353, 60%
245, 76%
643, 64%
267, 80%198, 86%
2,371, 64%
0%
10%
20%
30%
40%
50%
60%
70%
80%
90%
100%
ACT NSW NT SA TAS VIC WA QLD National
Individual / Sole Trader Company / Organisation

October 2016 | COAG Disability Reform Council Quarterly Report 37
Service providers are approved to provide services in one or more of the below 36
registration groups. Table 1.16 shows the number of providers approved for each
registration group nationally. The registration group with the highest number of service
providers is therapeutic supports with 1,917 approved service providers, followed by early
childhood supports, community participation, life development skills, and household tasks.
Note: a new support catalogue has been introduced since full scheme transition to
encourage outcome-focused support provision and hence the support types providers are
approved to provide have changed since the trial period. The support groups providers were
previously approved for have been mapped to the new registration groups.
Table 1.16 Number of approved service providers by registration group
Registration Group Number
of providers
Registration Group Number
of providers
Therapeutic Supports 1,917 Custom Prosthetics 344
Early Childhood Supports 926 Support Coordination 303
Participate Community 901 Ex Phys Pers Training 288
Development-Life Skills 834 Assistive Prod-Household Task 272
Household Tasks 798 Assistive Equip-Recreation 257
Assist-Life Stage, Transition 770 Specialised Hearing Services 253
Behaviour Support 748 Specialised Driver Training 243
Assist Personal Activities 747 Community Nursing Care 235
Assist-Travel/Transport 734 Comms & Info Equipment 234
Daily Tasks/Shared Living 614 Hearing Equipment 186
Assist Prod-Pers Care/Safety 601 Spec Support Employ 161
Personal Activities High 579 Vision Equipment 145
Group/Centre Activities 499 Innov Community Participation 82
Personal Mobility Equipment 475 Interpret/Translate 73
Accommodation/Tenancy 428 Vehicle modifications 58
Home Modification 399 Hearing Services 55
Assist Access/Maintain Employ 373 Assistance Animals 22
Plan Management 359 Specialised Disability Accommodation
12
1.3.2 Access request to receiving support within different timeframes
During the transition to full scheme, clients transitioning from State/Territory programs will be
found eligible for the Scheme up to six months in advance of receiving an approved plan.
This allows the participant to potentially work with a Local Area Co-ordinator (LAC) or
receive other support to understand the NDIS planning process, and think about how to best
use mainstream, community and funded supports to achieve their goals. As this is the first
quarterly report during Transition limited data has been accumulated on payments for
participants who received an approved plan in this current quarter. This measure will be
reported on in future reports.
October 2016 | COAG Disability Reform Council Quarterly Report 38
2 NDIS is a financially sustainable,
insurance-based NDIS
Introduction
This section includes information on the financial sustainability of the NDIS. In particular,
information is provided on participant plan costs compared with the revenue received, and a
discussion on the longer-term cost of the NDIS is included. Further, information on the
characteristics of participants entering the Scheme in the current quarter, as well as
information on people who made an access request is also included.
This section also includes data on NDIA efficiency. In particular, progress against bilateral
targets and elapsed time between key dates.

October 2016 | COAG Disability Reform Council Quarterly Report 39
Key findings
From 1 July 2016 to 30 September 2016:
October 2016 | COAG Disability Reform Council Quarterly Report 40
2.1 Participant characteristics and their families/carers
2.1.1 Access requests made by outcome
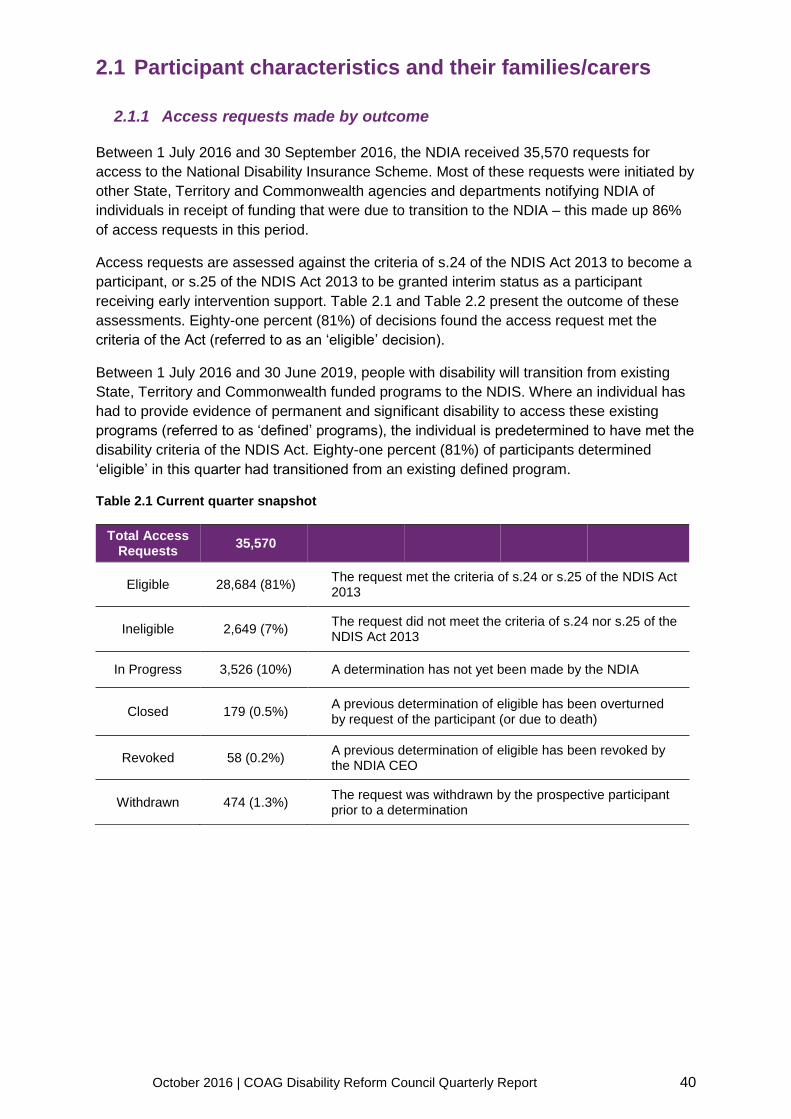
Between 1 July 2016 and 30 September 2016, the NDIA received 35,570 requests for
access to the National Disability Insurance Scheme. Most of these requests were initiated by
other State, Territory and Commonwealth agencies and departments notifying NDIA of
individuals in receipt of funding that were due to transition to the NDIA – this made up 86%
of access requests in this period.
Access requests are assessed against the criteria of s.24 of the NDIS Act 2013 to become a
participant, or s.25 of the NDIS Act 2013 to be granted interim status as a participant
receiving early intervention support. Table 2.1 and Table 2.2 present the outcome of these
assessments. Eighty-one percent (81%) of decisions found the access request met the
criteria of the Act (referred to as an ‘eligible’ decision).
Between 1 July 2016 and 30 June 2019, people with disability will transition from existing
State, Territory and Commonwealth funded programs to the NDIS. Where an individual has
had to provide evidence of permanent and significant disability to access these existing
programs (referred to as ‘defined’ programs), the individual is predetermined to have met the
disability criteria of the NDIS Act. Eighty-one percent (81%) of participants determined
‘eligible’ in this quarter had transitioned from an existing defined program.
Table 2.1 Current quarter snapshot
Total Access Requests
35,570
Eligible 28,684 (81%) The request met the criteria of s.24 or s.25 of the NDIS Act 2013
Ineligible 2,649 (7%) The request did not meet the criteria of s.24 nor s.25 of the NDIS Act 2013
In Progress 3,526 (10%) A determination has not yet been made by the NDIA
Closed 179 (0.5%) A previous determination of eligible has been overturned by request of the participant (or due to death)
Revoked 58 (0.2%) A previous determination of eligible has been revoked by the NDIA CEO
Withdrawn 474 (1.3%) The request was withdrawn by the prospective participant prior to a determination

October 2016 | COAG Disability Reform Council Quarterly Report 41
Table 2.2 Current quarter by jurisdiction
Jurisdiction Total Access
Requests In
Progress Eligible Closed Revoked Ineligible Withdrawn
ACT 2,020 97 1,447 12 17 390 57
NSW 22,752 1,635 19,614 128 25 1,068 282
NT 39 13 7 - 1 9 9
QLD 2,327 1,163 1,082 8 3 51 20
SA 3,489 154 2,904 2 3 406 20
TAS 558 76 400 - - 65 17
VIC 3,525 247 2,794 20 5 427 32
WA 762 92 424 9 4 206 27
Missing 98 49 12 - - 27 10
National 35,570 3,526 28,684 179 58 2,649 474
2.1.2 Participants against bilateral targets, including key characteristics
The NDIS is transitioning to full-scheme in line with phasing schedules bilaterally agreed by
State, Territory and Commonwealth governments. Figure 2.1 shows that there are 28,684
participants determined eligible in the first quarter of 2016-17, of which 7,440 have an
approved plan against a target of 10,529. This does not include plans that were approved
during the three-year trial of the NDIS.
Note: there is no bilateral target specifically for eligibility decisions, as funding liabilities do
not transfer to the NDIS until a participant has an approved NDIS plan.
Figure 2.1 Current quarter performance against bilateral target
Figure 2.2 compares access decisions with the quarterly bilateral targets for approved plans
during transition. This provides a lead indicator of whether sufficient participants are
transitioning to the NDIS to meet plan targets. It can be seen that as at 30 September 2016,
there were sufficient participants who had met access criteria to achieve plan targets. A
large increase in access decisions and plan approvals is required to meet 31 December

October 2016 | COAG Disability Reform Council Quarterly Report 42
2016 targets. The NDIA has implemented a recovery plan to meet the 31 December 2016
target.
Figure 2.2 Quarterly performance
Between 1 July 2016 and 30 September 2016, the NDIA determined that 30,078 access
requests met the criteria in s.24 or s.25 of the NDIS Act 2013. Table 2.3 shows the
distribution of participants across jurisdictions. The majority of eligible decisions relate to
participants residing in NSW, and NSW also has the highest rate of access criteria being
met. This reflects the phasing schedule agreed between NSW and Commonwealth
governments, where a number of NSW’s defined programs transition between July and
December 2016.
Table 2.3 Participants by State/Territory
State / Territory Total access
determinations Participants
Participants as a % of total
access determinations
Distribution by State / Territory
ACT 1,866 1,447 77.5% 5.0%
NSW 20,835 19,614 94.1% 68.4%
NT 17 7 41.2% 0.0%
QLD 1,144 1,082 94.6% 3.8%
SA 3,315 2,904 87.6% 10.1%
TAS 465 400 86.0% 1.4%
VIC 3,246 2,794 86.1% 9.7%
WA 643 424 65.9% 1.5%
Missing 39 12 30.8% 0.0%
National 31,570 28,684 90.9% 100%
October 2016 | COAG Disability Reform Council Quarterly Report 43
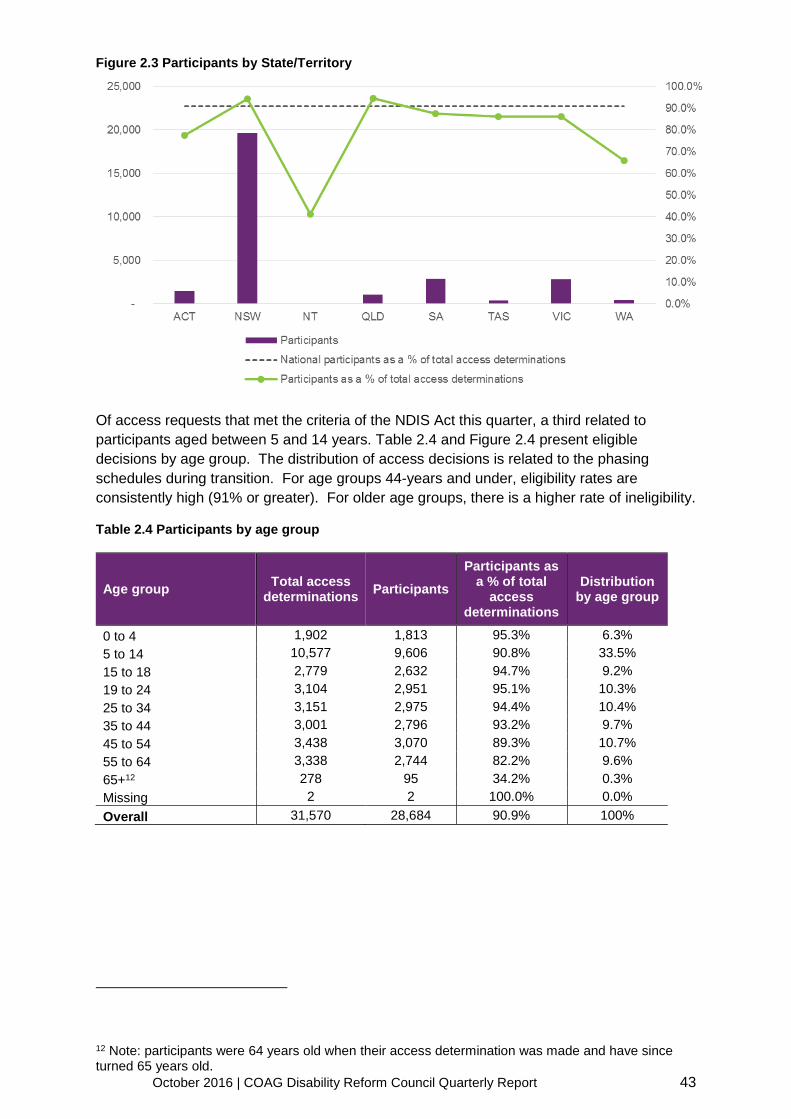
Figure 2.3 Participants by State/Territory
Of access requests that met the criteria of the NDIS Act this quarter, a third related to
participants aged between 5 and 14 years. Table 2.4 and Figure 2.4 present eligible
decisions by age group. The distribution of access decisions is related to the phasing
schedules during transition. For age groups 44-years and under, eligibility rates are
consistently high (91% or greater). For older age groups, there is a higher rate of ineligibility.
Table 2.4 Participants by age group
Age group Total access
determinations Participants
Participants as a % of total
access determinations
Distribution by age group
0 to 4 1,902 1,813 95.3% 6.3%
5 to 14 10,577 9,606 90.8% 33.5%
15 to 18 2,779 2,632 94.7% 9.2%
19 to 24 3,104 2,951 95.1% 10.3%
25 to 34 3,151 2,975 94.4% 10.4%
35 to 44 3,001 2,796 93.2% 9.7%
45 to 54 3,438 3,070 89.3% 10.7%
55 to 64 3,338 2,744 82.2% 9.6%
65+12 278 95 34.2% 0.3%
Missing 2 2 100.0% 0.0%
Overall 31,570 28,684 90.9% 100%
12 Note: participants were 64 years old when their access determination was made and have since turned 65 years old.
October 2016 | COAG Disability Reform Council Quarterly Report 44
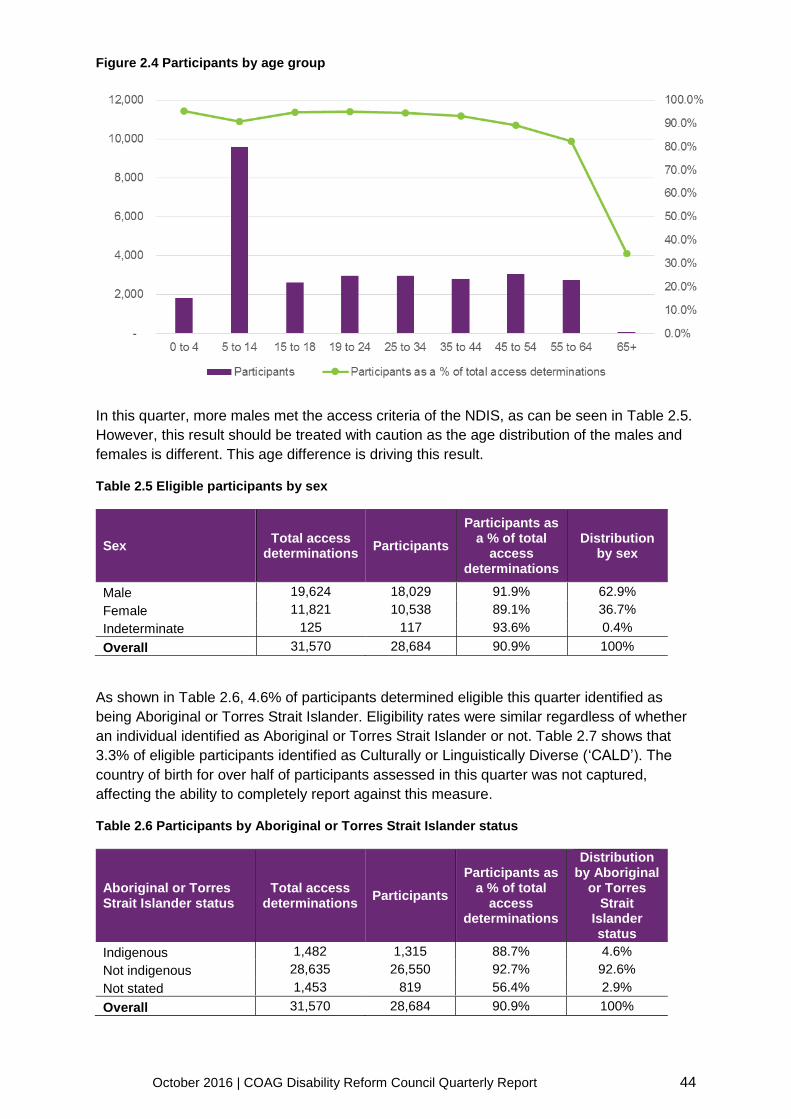
Figure 2.4 Participants by age group
In this quarter, more males met the access criteria of the NDIS, as can be seen in Table 2.5.
However, this result should be treated with caution as the age distribution of the males and
females is different. This age difference is driving this result.
Table 2.5 Eligible participants by sex
Sex Total access
determinations Participants
Participants as a % of total
access determinations
Distribution by sex
Male 19,624 18,029 91.9% 62.9%
Female 11,821 10,538 89.1% 36.7%
Indeterminate 125 117 93.6% 0.4%
Overall 31,570 28,684 90.9% 100%
As shown in Table 2.6, 4.6% of participants determined eligible this quarter identified as
being Aboriginal or Torres Strait Islander. Eligibility rates were similar regardless of whether
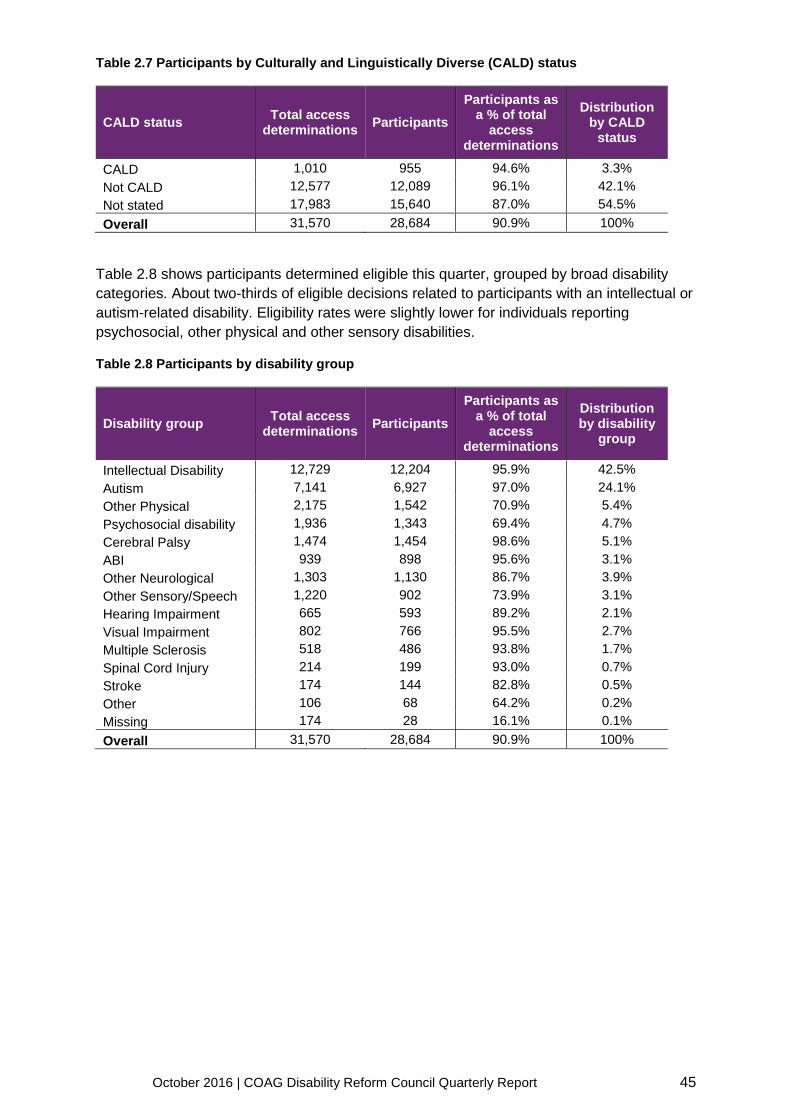
an individual identified as Aboriginal or Torres Strait Islander or not. Table 2.7 shows that
3.3% of eligible participants identified as Culturally or Linguistically Diverse (‘CALD’). The
country of birth for over half of participants assessed in this quarter was not captured,
affecting the ability to completely report against this measure.
Table 2.6 Participants by Aboriginal or Torres Strait Islander status
Aboriginal or Torres Strait Islander status
Total access determinations
Participants
Participants as a % of total
access determinations
Distribution by Aboriginal
or Torres Strait
Islander status
Indigenous 1,482 1,315 88.7% 4.6%
Not indigenous 28,635 26,550 92.7% 92.6%
Not stated 1,453 819 56.4% 2.9%
Overall 31,570 28,684 90.9% 100%
October 2016 | COAG Disability Reform Council Quarterly Report 45
Table 2.7 Participants by Culturally and Linguistically Diverse (CALD) status
CALD status Total access
determinations Participants
Participants as a % of total
access determinations
Distribution by CALD
status
CALD 1,010 955 94.6% 3.3%
Not CALD 12,577 12,089 96.1% 42.1%
Not stated 17,983 15,640 87.0% 54.5%
Overall 31,570 28,684 90.9% 100%
Table 2.8 shows participants determined eligible this quarter, grouped by broad disability
categories. About two-thirds of eligible decisions related to participants with an intellectual or
autism-related disability. Eligibility rates were slightly lower for individuals reporting
psychosocial, other physical and other sensory disabilities.
Table 2.8 Participants by disability group
Disability group Total access
determinations Participants
Participants as a % of total
access determinations
Distribution by disability
group
Intellectual Disability 12,729 12,204 95.9% 42.5%
Autism 7,141 6,927 97.0% 24.1%
Other Physical 2,175 1,542 70.9% 5.4%
Psychosocial disability 1,936 1,343 69.4% 4.7%
Cerebral Palsy 1,474 1,454 98.6% 5.1%
ABI 939 898 95.6% 3.1%
Other Neurological 1,303 1,130 86.7% 3.9%
Other Sensory/Speech 1,220 902 73.9% 3.1%
Hearing Impairment 665 593 89.2% 2.1%
Visual Impairment 802 766 95.5% 2.7%
Multiple Sclerosis 518 486 93.8% 1.7%
Spinal Cord Injury 214 199 93.0% 0.7%
Stroke 174 144 82.8% 0.5%
Other 106 68 64.2% 0.2%
Missing 174 28 16.1% 0.1%
Overall 31,570 28,684 90.9% 100%

October 2016 | COAG Disability Reform Council Quarterly Report 46
Figure 2.5 Participants by disability group
2.1.3 Participants with approved plans against bilateral targets
7,440 plans were approved in the quarter, of which the majority were in NSW (59%). The
original bilateral target for Quarter 1 of 2016-17 was halved as part of the Agency Recovery
plan. The cumulative Quarter 2 2016-17 target remains the same.
Table 2.9 Current quarter snapshot
State / Territory 2016-17 Q1
Approved Plans
2016-17 Q1 Bilateral target
(revised)
2016-17 Q1 Bilateral target
(original)
ACT 948 797 797
NSW 4,397 7,459 14,919
NT - - -
QLD 376 500 1,000
SA 751 386 772
TAS 142 127 255
VIC 670 1,062 2,125
WA 156 198 396
National 7,440 10,529 20,264
76% of the revised bilateral target was met nationally. The revised bilateral target was
achieved in the ACT, TAS, QLD, and SA. Furthermore, children are beginning to be
supported in the Early Childhood Early Intervention (ECEI) gateway. Including these children
and comparing with the revised bilateral target results in close to 100% of the target being
achieved.

October 2016 | COAG Disability Reform Council Quarterly Report 47
Figure 2.6 Current quarter snapshot
This age distribution of participants with approved plans in the current quarter is influenced
by the phasing schedule in each State/Territory. Close to 30% of participants entering in the
current quarter are children aged 0-14 years, and close to 30% are over 45 years.
Table 2.10 Participants with an approved plan by age group
Age group 2016-17 Q1
Approved Plans Distribution
0 to 4 618 8.3%
5 to 14 1,501 20.2%
15 to 18 440 5.9%
19 to 24 605 8.1%
25 to 34 919 12.4%
35 to 44 1,051 14.1%
45 to 54 1,203 16.2%
55 to 64 1,054 14.2%
65+ 49 0.7%
Overall 7,440 100%
More males entered the Scheme in the current quarter compared with females (61.6%
compared with 38.1%). This is reflective of some disabilities being more prevalent in males
than females.
Table 2.11 Participants with an approved plan by sex
Sex 2016-17 Q1
Approved Plans Distribution
Male 4,582 61.6%
Female 2,836 38.1%
Indeterminate 22 0.3%
Overall 7,440 100%
5.5% of participants entering the Scheme are Aboriginal and Torres Strait Islander, with the
data not captured for 3.8% of participants.

October 2016 | COAG Disability Reform Council Quarterly Report 48
Table 2.12 Participants with an approved plan by Aboriginal and Torres Strait Islander status
Aboriginal and Torres Strait Islander status
2016-17 Q1 Approved Plans
Distribution
Aboriginal and Torres Strait Islander 410 5.5%
Not Aboriginal and Torres Strait Islander
6,749 90.7%
Not stated 281 3.8%
Overall 7,440 100%
2.7% of participants entering the Scheme are CALD. However, as mentioned above, data
was missing on country of birth for a large number of participants (52.6%), so this figure
should be treated with caution.
Table 2.13 Participants with an approved plan by Culturally and Linguistically Diverse (CALD)
status
Indigenous status 2016-17 Q1
Approved Plans Distribution
CALD 202 2.7%
Not CALD 3,327 44.7%
Not stated 3,911 52.6%
Overall 7,440 100%
Of the participants with plan approvals in the current quarter, 20.2% have a level of function
12, followed by 16.9% with level 5.
Figure 2.7 Distribution of participants with an approved plan by level of function
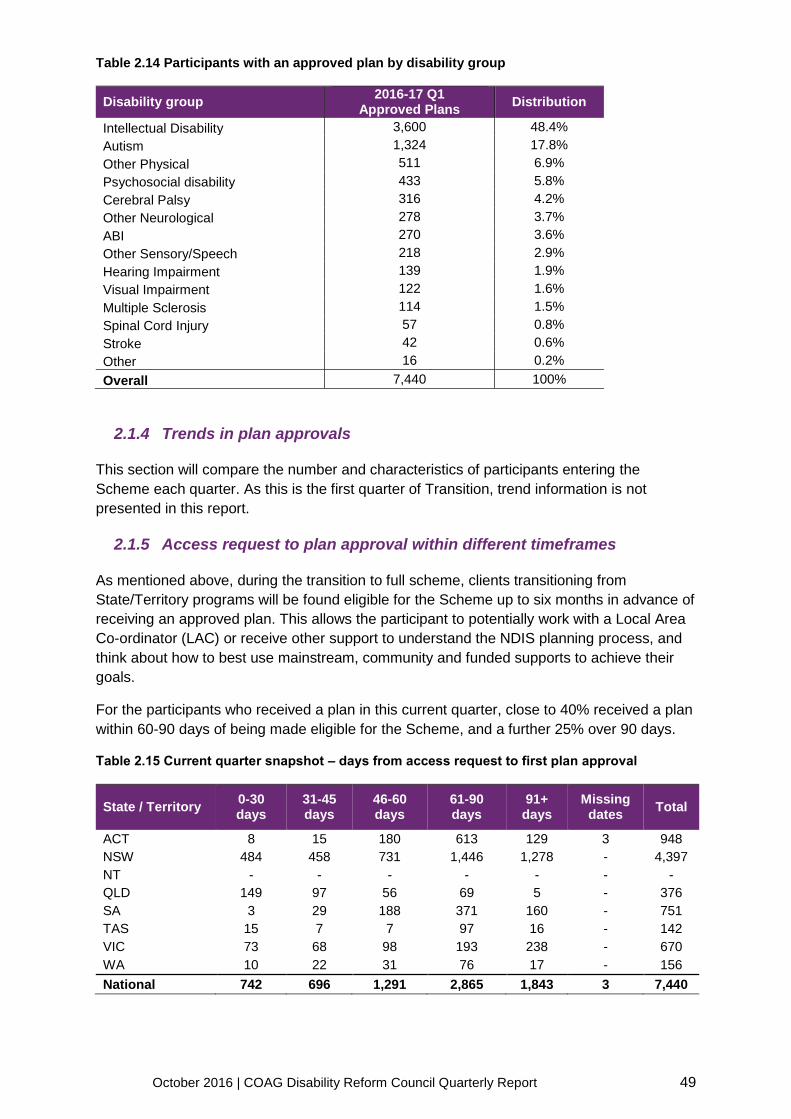
Of the participants with plan approvals in the current quarter, 48.4% had a primary
intellectual disability, followed by 17.8% with autism.
0.0%
5.0%
10.0%
15.0%
20.0%
25.0%
01 02 03 04 05 06 07 08 09 10 11 12 13 14 15
Dis
trib
uti
on
Level of function
October 2016 | COAG Disability Reform Council Quarterly Report 49
Table 2.14 Participants with an approved plan by disability group
Disability group 2016-17 Q1
Approved Plans Distribution
Intellectual Disability 3,600 48.4%
Autism 1,324 17.8%
Other Physical 511 6.9%
Psychosocial disability 433 5.8%
Cerebral Palsy 316 4.2%
Other Neurological 278 3.7%
ABI 270 3.6%
Other Sensory/Speech 218 2.9%
Hearing Impairment 139 1.9%
Visual Impairment 122 1.6%
Multiple Sclerosis 114 1.5%
Spinal Cord Injury 57 0.8%
Stroke 42 0.6%
Other 16 0.2%
Overall 7,440 100%
2.1.4 Trends in plan approvals
This section will compare the number and characteristics of participants entering the
Scheme each quarter. As this is the first quarter of Transition, trend information is not
presented in this report.
2.1.5 Access request to plan approval within different timeframes
As mentioned above, during the transition to full scheme, clients transitioning from
State/Territory programs will be found eligible for the Scheme up to six months in advance of
receiving an approved plan. This allows the participant to potentially work with a Local Area
Co-ordinator (LAC) or receive other support to understand the NDIS planning process, and
think about how to best use mainstream, community and funded supports to achieve their
goals.
For the participants who received a plan in this current quarter, close to 40% received a plan
within 60-90 days of being made eligible for the Scheme, and a further 25% over 90 days.
Table 2.15 Current quarter snapshot – days from access request to first plan approval
State / Territory 0-30 days
31-45 days
46-60 days
61-90 days
91+ days
Missing dates
Total
ACT 8 15 180 613 129 3 948
NSW 484 458 731 1,446 1,278 - 4,397
NT - - - - - - -
QLD 149 97 56 69 5 - 376
SA 3 29 188 371 160 - 751
TAS 15 7 7 97 16 - 142
VIC 73 68 98 193 238 - 670
WA 10 22 31 76 17 - 156
National 742 696 1,291 2,865 1,843 3 7,440

October 2016 | COAG Disability Reform Council Quarterly Report 50
Figure 2.8 Days from access request to first plan approval
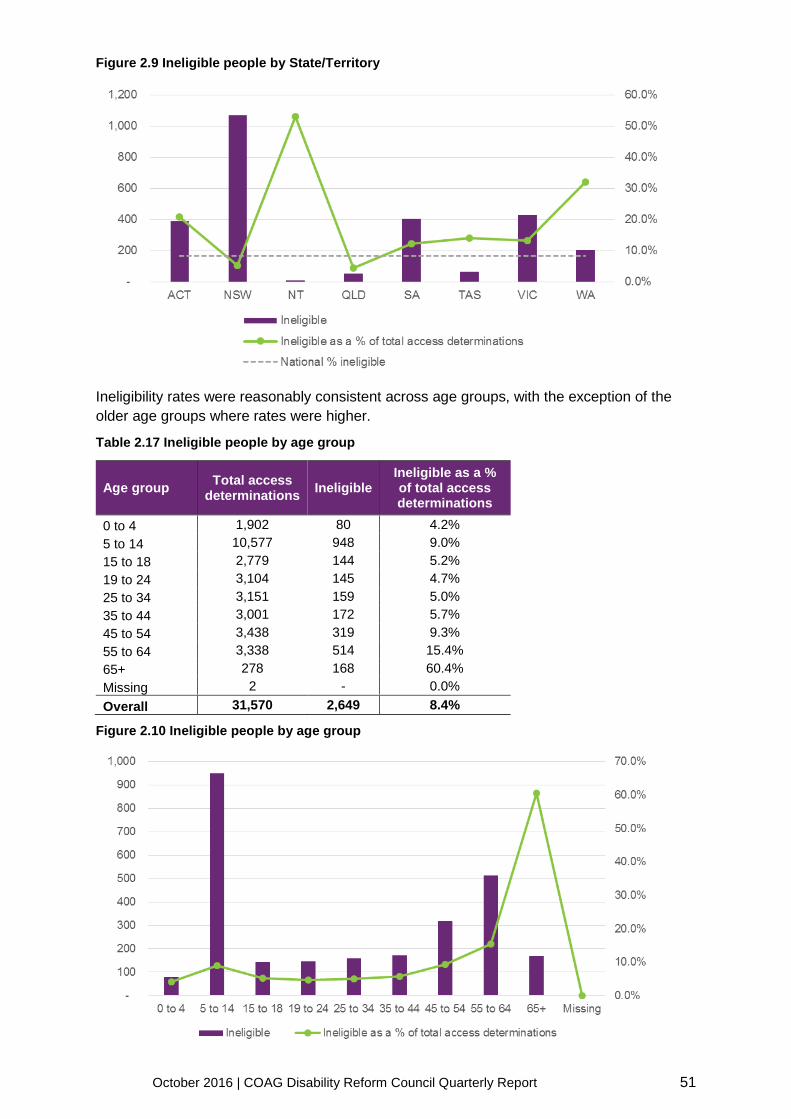
2.1.6 Ineligible people and key characteristics of these people
The national ineligibility rate was 8.4% for access determinations made in the current
quarter. This varies by State/Territory. In particular, for some State/Territories which
predominantly had participants entering sites that commenced during the trial period of the
NDIS, the ineligibility rates were high – for example, the ACT, NT, and WA.
Table 2.16 Ineligible people by State/Territory
State / Territory
Total access determinations
Ineligible Ineligible as a % of total access determinations
ACT 1,866 390 20.9%
NSW 20,835 1,068 5.1%
NT 17 9 52.9%
QLD 1,144 51 4.5%
SA 3,315 406 12.2%
TAS 465 65 14.0%
VIC 3,246 427 13.2%
WA 643 206 32.0%
National 31,570 2,649 8.4%
0% 10% 20% 30% 40% 50% 60% 70% 80% 90% 100%
ACT
NSW
NT
QLD
SA
TAS
VIC
WA
National
0-30 days 31-45 days 46-60 days 61-90 days 91+ days
October 2016 | COAG Disability Reform Council Quarterly Report 51
Figure 2.9 Ineligible people by State/Territory
Ineligibility rates were reasonably consistent across age groups, with the exception of the
older age groups where rates were higher.
Table 2.17 Ineligible people by age group
Age group Total access
determinations Ineligible
Ineligible as a % of total access determinations
0 to 4 1,902 80 4.2%
5 to 14 10,577 948 9.0%
15 to 18 2,779 144 5.2%
19 to 24 3,104 145 4.7%
25 to 34 3,151 159 5.0%
35 to 44 3,001 172 5.7%
45 to 54 3,438 319 9.3%
55 to 64 3,338 514 15.4%
65+ 278 168 60.4%
Missing 2 - 0.0%
Overall 31,570 2,649 8.4%
Figure 2.10 Ineligible people by age group

October 2016 | COAG Disability Reform Council Quarterly Report 52
2.2 Support packages
2.2.1 Committed support
As at 30 September 2016, 37,721 participants have had approved plans, and $3.3 billion of
support has been committed to these participants.
Of this $3.3 billion:
It is estimated that $141.0 million (4%) was provided in 2013-14 (including actual paid to
date). The funding envelope based on the bilateral agreements for 2013-14 is
$148.8 million, including cash and in-kind. Hence, for participants who have entered the
Scheme in the first year, committed support for 2013-14 is around 95% of the funding
envelope.
$506.0 million (15%) was provided in 2014-15. This compares with the funding envelope
based on the bilateral agreements for 2014-15 of $456.9 million, including both cash
and in-kind. Therefore, for participants who have entered the Scheme to date,
committed support for 2014-15 is around 111% of the funding envelope for 2014-15.
$934.3 million (28%) was provided in 2015-16. The funding envelope based on the
bilateral agreements for 2015-16 is $873.1 million, including both cash and in-kind.
Thus, for participants who have entered the Scheme to date, committed support for
2015-16 is 107% of the funding envelope for 2015-16.
$1.4 billion (43%) is estimated to be provided in 2016-17.
$310.2 million (9%) is expected to be provided in 2017-18 and beyond.
Note: committed support exceeds the funding envelope in 2014-15 and 2015-16. However,
as not all committed support is being utilised, an actual deficit will not arise. That is, the
Scheme will be within the budget for the three years of trial.
The funding mechanism for the Transition period is different from the Trial period, the NDIA
is funded based on the number of participants who enter each quarter rather than a pre-
determined amount. Analysis of the funding received and package costs is discussed later in
this report.
Figure 2.11 shows a breakdown of total committed supports by support type, with 72% of
committed supports expected to be provided for core supports, 24% for capacity building,
and 4% for capital supports. Assistance with daily activities is the most common support
type, accounting for 67% of total committed supports. Note: a new support catalogue has
been introduced since full scheme transition to encourage outcome-focused support
provision and alignment of supports with the higher level purposes of core, capacity building
and capital support provision. Supports in historical plans have been mapped to the new
support catalogue.
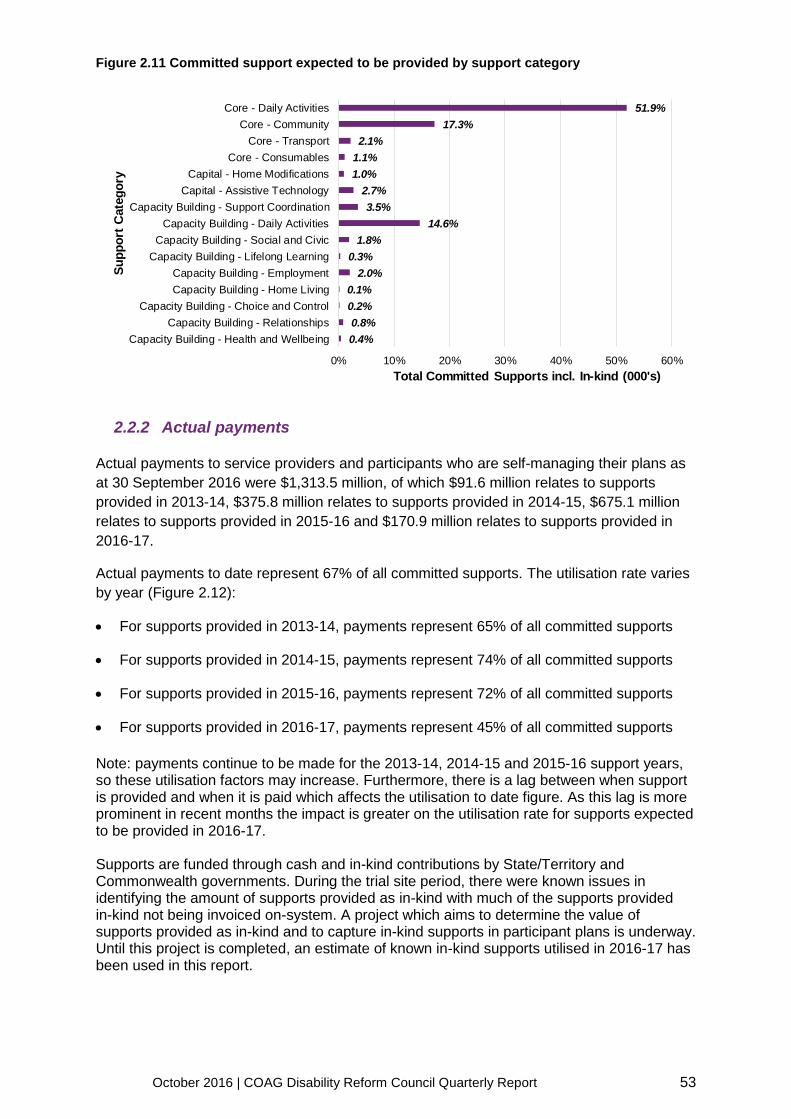
October 2016 | COAG Disability Reform Council Quarterly Report 53
Figure 2.11 Committed support expected to be provided by support category
2.2.2 Actual payments
Actual payments to service providers and participants who are self-managing their plans as
at 30 September 2016 were $1,313.5 million, of which $91.6 million relates to supports
provided in 2013-14, $375.8 million relates to supports provided in 2014-15, $675.1 million
relates to supports provided in 2015-16 and $170.9 million relates to supports provided in
2016-17.
Actual payments to date represent 67% of all committed supports. The utilisation rate varies
by year (Figure 2.12):
For supports provided in 2013-14, payments represent 65% of all committed supports
For supports provided in 2014-15, payments represent 74% of all committed supports
For supports provided in 2015-16, payments represent 72% of all committed supports
For supports provided in 2016-17, payments represent 45% of all committed supports
Note: payments continue to be made for the 2013-14, 2014-15 and 2015-16 support years, so these utilisation factors may increase. Furthermore, there is a lag between when support is provided and when it is paid which affects the utilisation to date figure. As this lag is more prominent in recent months the impact is greater on the utilisation rate for supports expected to be provided in 2016-17. Supports are funded through cash and in-kind contributions by State/Territory and Commonwealth governments. During the trial site period, there were known issues in identifying the amount of supports provided as in-kind with much of the supports provided in-kind not being invoiced on-system. A project which aims to determine the value of supports provided as in-kind and to capture in-kind supports in participant plans is underway. Until this project is completed, an estimate of known in-kind supports utilised in 2016-17 has been used in this report.
51.9%
17.3%
2.1%
1.1%
1.0%
2.7%
3.5%
14.6%
1.8%
0.3%
2.0%
0.1%
0.2%
0.8%
0.4%
0% 10% 20% 30% 40% 50% 60%
Core - Daily Activities
Core - Community
Core - Transport
Core - Consumables
Capital - Home Modifications
Capital - Assistive Technology
Capacity Building - Support Coordination
Capacity Building - Daily Activities
Capacity Building - Social and Civic
Capacity Building - Lifelong Learning
Capacity Building - Employment
Capacity Building - Home Living
Capacity Building - Choice and Control
Capacity Building - Relationships
Capacity Building - Health and Wellbeing
Total Committed Supports incl. In-kind (000's)
Su
pp
ort
Cate
go
ry
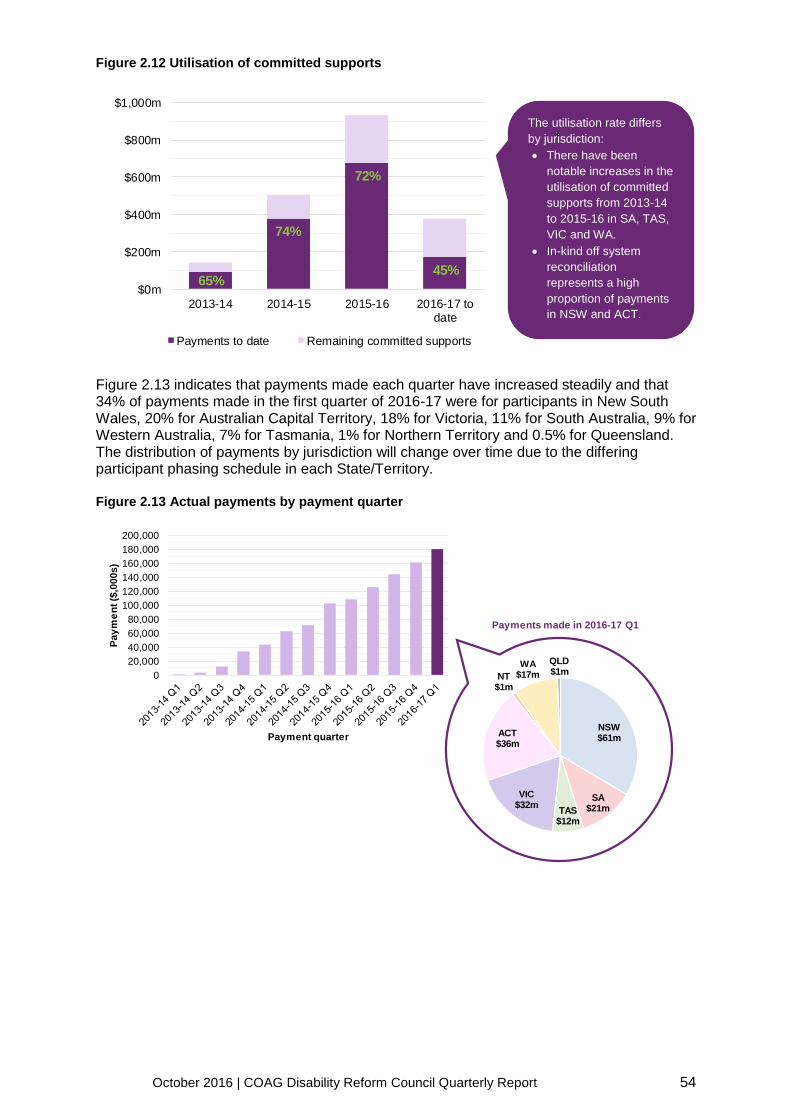
October 2016 | COAG Disability Reform Council Quarterly Report 54
Figure 2.12 Utilisation of committed supports
Figure 2.13 indicates that payments made each quarter have increased steadily and that 34% of payments made in the first quarter of 2016-17 were for participants in New South Wales, 20% for Australian Capital Territory, 18% for Victoria, 11% for South Australia, 9% for Western Australia, 7% for Tasmania, 1% for Northern Territory and 0.5% for Queensland. The distribution of payments by jurisdiction will change over time due to the differing participant phasing schedule in each State/Territory. Figure 2.13 Actual payments by payment quarter
65%
74%
72%
45%
$0m
$200m
$400m
$600m
$800m
$1,000m
2013-14 2014-15 2015-16 2016-17 todate
Payments to date Remaining committed supports
0
20,000
40,000
60,000
80,000
100,000
120,000
140,000
160,000
180,000
200,000
Pa
ym
en
t ($
,00
0s
)
Payment quarter NSW$61m
SA$21mTAS
$12m
VIC$32m
ACT$36m
NT$1m
WA$17m
QLD$1m
Payments made in 2016-17 Q1
The utilisation rate differs
by jurisdiction:
There have been
notable increases in the
utilisation of committed
supports from 2013-14
to 2015-16 in SA, TAS,
VIC and WA.
In-kind off system
reconciliation
represents a high
proportion of payments
in NSW and ACT.

October 2016 | COAG Disability Reform Council Quarterly Report 55
2.2.3 Average and median package costs by sub-groups of the population
and for all participants compared with the expected averages and
medians, including trends
From 1 July 2016, 7,440 first plans were approved and the average annualised cost is
$84,254 including participants with shared supported accommodation supports, and $43,251
excluding participants with shared supported accommodation supports. The median
annualised cost is $24,751 excluding participants with shared supported accommodation
supports. In the first quarter of 2016-17, the phasing schedule included a large number of
participants living in shared supported accommodation. It is important to note that average
and median annualised cost is not an appropriate measure of Scheme performance when
considered in isolation, and should be considered in combination with the number of
Scheme participants, the distribution of packages committed to these participants, and
actual payments for supports provided.
This section compares actual with expected for this first quarter of Transition. Trend analysis
will be included in future reports.
Figure 2.14, Figure 2.15, Figure 2.16, Figure 2.17 and Figure 2.18 show the actual and expected13, average and median annualised cost of first plans approved in 2016-17 by State/Territory, age group, level of function and primary disability:
The average annualised cost when excluding participants with shared supported
accommodation supports is higher in the Western Australian site at $54,434, and is
lowest in South Australia at $17,759. The median annualised cost when excluding
participants with shared supported accommodation supports is higher in the Victorian
site at $42,345, and is lowest in South Australia at $13,363. These differences are
driven by the phasing schedule in each site.
The average and median annualised cost when excluding participants with shared
supported accommodation supports is significantly lower for younger participants
aged under 14 years old.
The average and median annualised cost when excluding participants with shared
supported accommodation supports generally increases for participants with a lower
level of function. This ranges from $11,479 for level of function 1 to $126,080 for level
of function 14.
The average and median annualised cost when excluding participants with shared
supported accommodation supports is significantly higher for participants with a
primary disability of spinal cord injury. However, level of function may result in
variations in average annualised cost within a disability type.
Package costs are higher than the revenue received for the current quarter. This will be
monitored and data checked to make sure the correct revenue is being reached for each
participant.
13 The expected average and median annualised costs are based on the revenue received for each participant
according to their phasing cohort.

October 2016 | COAG Disability Reform Council Quarterly Report 56
Figure 2.14 Average and median annualised cost by jurisdiction (excluding participants with
shared supported accommodation supports) – participants with first plan approvals from
1 July 2016
Figure 2.15 Average and median annualised cost by age group (excluding participants with
shared supported accommodation supports) – participants with first plan approvals from
1 July 2016
$0
$10,000
$20,000
$30,000
$40,000
$50,000
$60,000
$70,000
$80,000
$90,000
$100,000
ACT NSW QLD SA TAS VIC WA
An
nu
alised
co
st
Actual average annualised package cost
Expected average annualised package cost (based on revenue)
Actual median annualised package cost
Expected median annualised package cost (based on revenue)
$0
$10,000
$20,000
$30,000
$40,000
$50,000
$60,000
$70,000
$80,000
$90,000
$100,000
0 to 4 5 to 14 15 to 18 19 to 24 25 to 34 35 to 44 45 to 54 55 to 64 65+
An
nu
alised
co
st
Age group
Actual average annualised package cost
Expected average annualised package cost (based on revenue)
Actual median annualised package cost
Expected median annualised package cost (based on revenue)
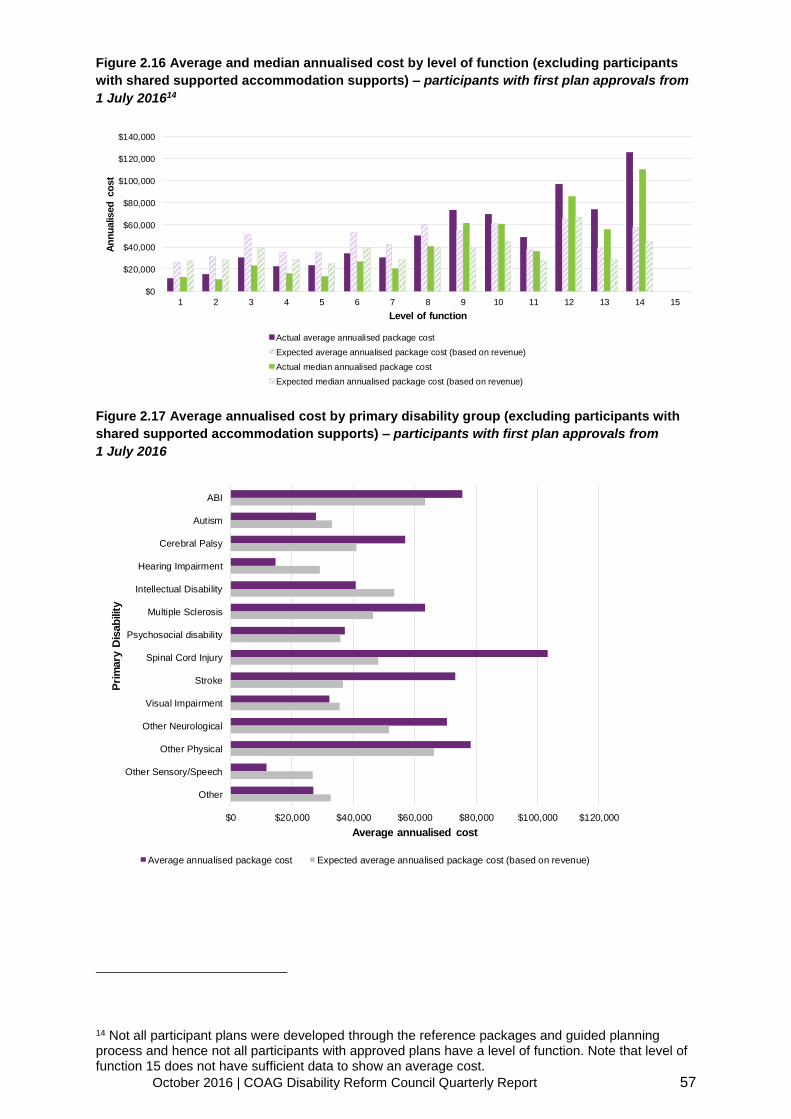
October 2016 | COAG Disability Reform Council Quarterly Report 57
Figure 2.16 Average and median annualised cost by level of function (excluding participants
with shared supported accommodation supports) – participants with first plan approvals from
1 July 201614
Figure 2.17 Average annualised cost by primary disability group (excluding participants with
shared supported accommodation supports) – participants with first plan approvals from
1 July 2016
14 Not all participant plans were developed through the reference packages and guided planning process and hence not all participants with approved plans have a level of function. Note that level of function 15 does not have sufficient data to show an average cost.
$0
$20,000
$40,000
$60,000
$80,000
$100,000
$120,000
$140,000
1 2 3 4 5 6 7 8 9 10 11 12 13 14 15
An
nu
alised
co
st
Level of function
Actual average annualised package cost
Expected average annualised package cost (based on revenue)
Actual median annualised package cost
Expected median annualised package cost (based on revenue)
$0 $20,000 $40,000 $60,000 $80,000 $100,000 $120,000
ABI
Autism
Cerebral Palsy
Hearing Impairment
Intellectual Disability
Multiple Sclerosis
Psychosocial disability
Spinal Cord Injury
Stroke
Visual Impairment
Other Neurological
Other Physical
Other Sensory/Speech
Other
Average annualised cost
Pri
mary
Dis
ab
ilit
y
Average annualised package cost Expected average annualised package cost (based on revenue)

October 2016 | COAG Disability Reform Council Quarterly Report 58
Figure 2.18 Median annualised cost by primary disability group (excluding participants with
shared supported accommodation supports) – participants with first plan approvals from
1 July 2016
2.2.4 Details of participants with second plans, including length and value
of supports
This section of the report focuses on participants with first plan approvals from 1 July 2016
onwards and these participants have not yet had second plans due to the short time that
they have been in the Scheme. Therefore, there is no data available for analysis of
participants with first plan approvals from 1 July 2016 and have had more than one plan.
Details of participants with subsequent plans will be monitored going forward in future
reports.
$0 $20,000 $40,000 $60,000 $80,000 $100,000 $120,000
ABI
Autism
Cerebral Palsy
Hearing Impairment
Intellectual Disability
Multiple Sclerosis
Psychosocial disability
Spinal Cord Injury
Stroke
Visual Impairment
Other Neurological
Other Physical
Other Sensory/Speech
Other
Median annualised cost
Pri
mary
Dis
ab
ilit
y
Actual median annualised package cost Expected median annualised package cost (based on revenue)
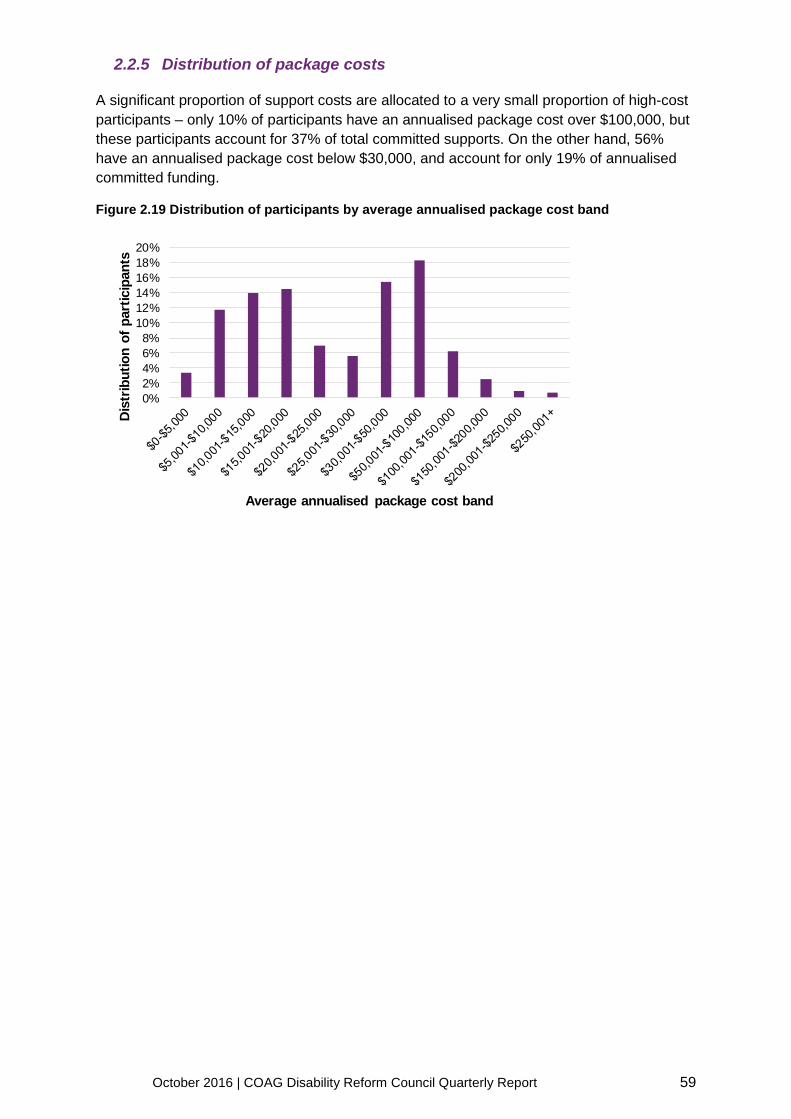
October 2016 | COAG Disability Reform Council Quarterly Report 59
2.2.5 Distribution of package costs
A significant proportion of support costs are allocated to a very small proportion of high-cost
participants – only 10% of participants have an annualised package cost over $100,000, but
these participants account for 37% of total committed supports. On the other hand, 56%
have an annualised package cost below $30,000, and account for only 19% of annualised
committed funding.
Figure 2.19 Distribution of participants by average annualised package cost band
0%
2%
4%
6%
8%
10%
12%
14%
16%
18%
20%
Dis
trib
uti
on
of
part
icip
an
ts
Average annualised package cost band
October 2016 | COAG Disability Reform Council Quarterly Report 60
2.3 Projections
2.3.1 Cost of the NDIS in dollar terms and as a percentage of GDP (split by
participants aged under 65 and over 65). This measure will include
NDIA operating costs
Currently the Productivity Commission estimate is considered the best estimate of the
longer-term cost of the NDIS (approximately 0.9% of GDP for under 65 year olds). The NDIS
insurance approach allows pressures on the Scheme to be identified early and management
responses put in place to respond to these pressures. Specifically, data is collected on
participants (including the characteristics of the participants, costs and outcomes), and this
actual experience is compared with the baseline projection. This actuarial monitoring occurs
continuously and allows management to put in place strategies as required.
There are some current pressures which require management responses. These pressures
are:
Higher than expected numbers of children entering the Scheme
Increasing package costs over and above the impacts of inflation and ageing (“super-
imposed” inflation)
Potential participants continuing to approach the Scheme
Lower than expected participants exiting the Scheme
A mismatch between benchmark package costs and actual package costs.
Two specific initiatives are the Early Childhood Early Intervention (ECEI) approach and the
first plan approach.
The ECEI approach is being progressively rolled out. The ECEI approach provides a
gateway to the NDIS for children 0-6 years, which aims to ensure only children meeting
the eligibly criteria for the NDIS enter as a participant. The gateway also provides
support for children to access mainstream and community services when they do not
meet the criteria, but need some support to access these services.
The first plan process is a method for better aligning the level of function and need with
support packages for participants when they first enter the Scheme. This process is now
underway, but ongoing refinement of this process to ensure the right assessment tools
and questions are used is critical. This method for allocating funds should also be a
focus at plan review. Importantly, this process assists in determining the reasonable and
necessary support package from which participants can then plan their supports to be
meet their goals.
In addition to these two initiatives, NDIA management has put in place a Sustainability and
Liability Review Working Group led by the CEO to oversee the initiatives addressing the cost
pressures identified above.
These cost pressures and management responses will be monitored closely and updates
provided in subsequent quarterly reports.
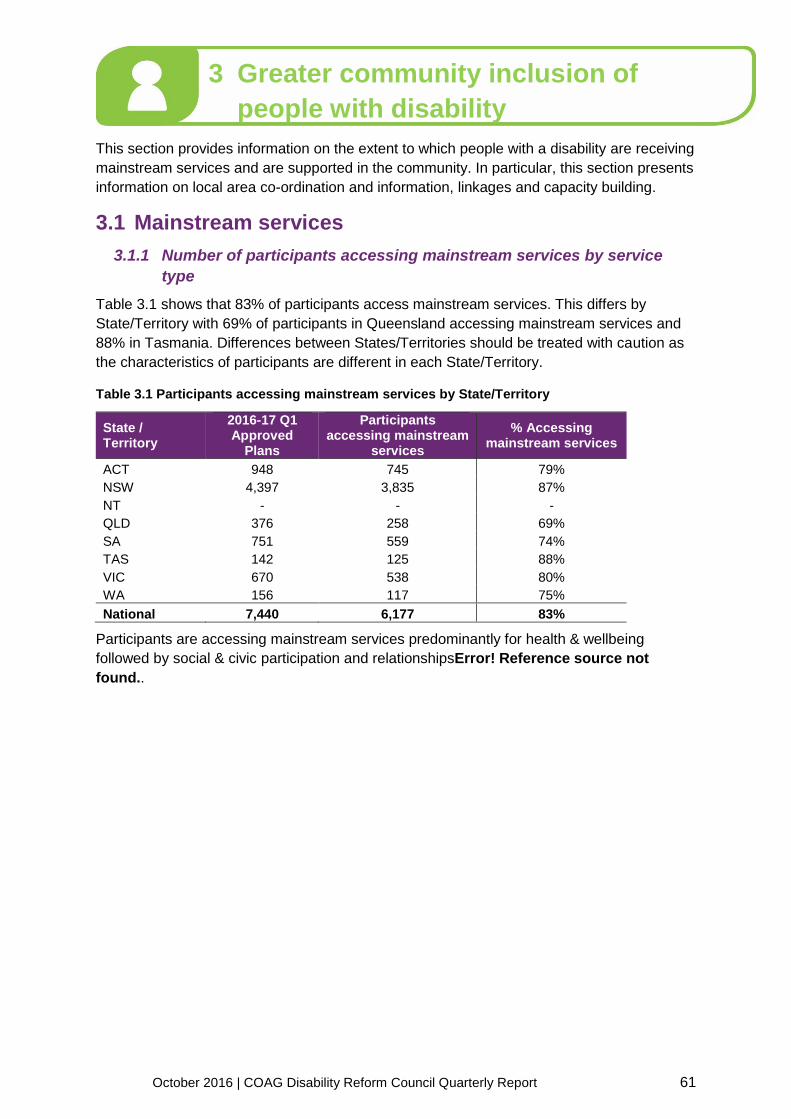
October 2016 | COAG Disability Reform Council Quarterly Report 61
3 Greater community inclusion of
people with disability
This section provides information on the extent to which people with a disability are receiving
mainstream services and are supported in the community. In particular, this section presents
information on local area co-ordination and information, linkages and capacity building.
3.1 Mainstream services
3.1.1 Number of participants accessing mainstream services by service
type
Table 3.1 shows that 83% of participants access mainstream services. This differs by
State/Territory with 69% of participants in Queensland accessing mainstream services and
88% in Tasmania. Differences between States/Territories should be treated with caution as
the characteristics of participants are different in each State/Territory.
Table 3.1 Participants accessing mainstream services by State/Territory
State / Territory
2016-17 Q1 Approved
Plans
Participants accessing mainstream
services
% Accessing mainstream services
ACT 948 745 79%
NSW 4,397 3,835 87%
NT - - -
QLD 376 258 69%
SA 751 559 74%
TAS 142 125 88%
VIC 670 538 80%
WA 156 117 75%
National 7,440 6,177 83%
Participants are accessing mainstream services predominantly for health & wellbeing
followed by social & civic participation and relationshipsError! Reference source not
found..
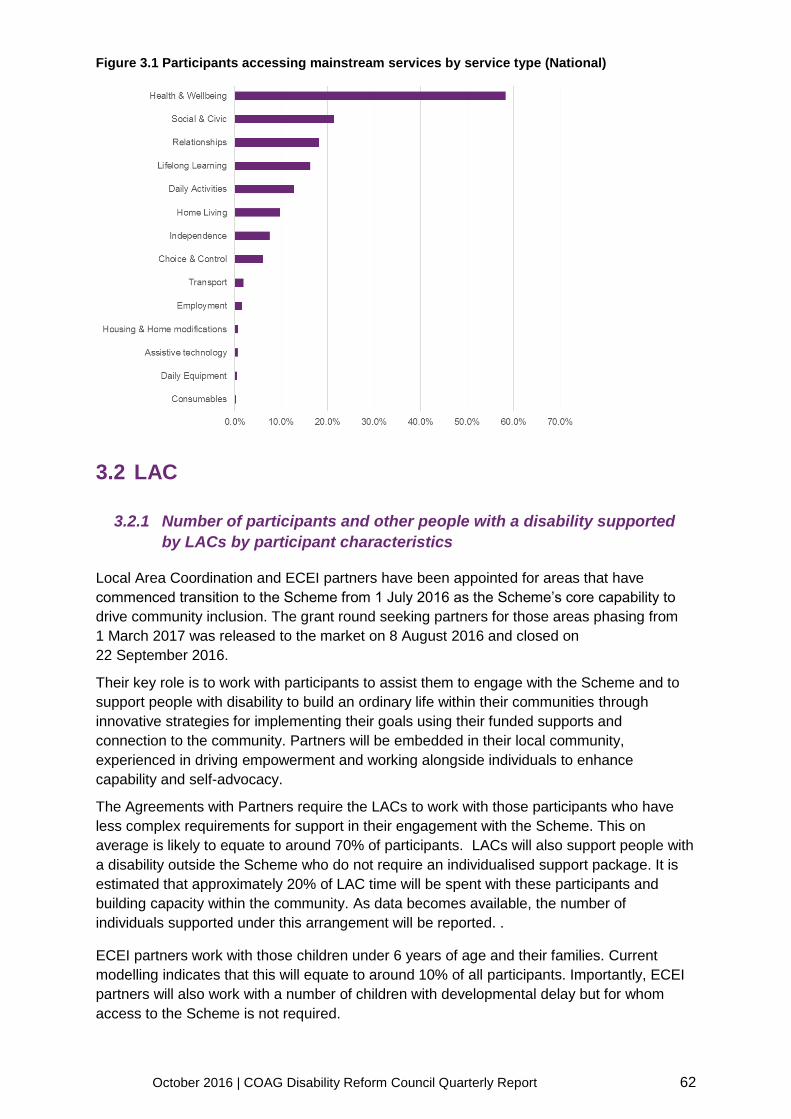
October 2016 | COAG Disability Reform Council Quarterly Report 62
Figure 3.1 Participants accessing mainstream services by service type (National)
3.2 LAC
3.2.1 Number of participants and other people with a disability supported
by LACs by participant characteristics
Local Area Coordination and ECEI partners have been appointed for areas that have
commenced transition to the Scheme from 1 July 2016 as the Scheme’s core capability to
drive community inclusion. The grant round seeking partners for those areas phasing from
1 March 2017 was released to the market on 8 August 2016 and closed on
22 September 2016.
Their key role is to work with participants to assist them to engage with the Scheme and to
support people with disability to build an ordinary life within their communities through
innovative strategies for implementing their goals using their funded supports and
connection to the community. Partners will be embedded in their local community,
experienced in driving empowerment and working alongside individuals to enhance
capability and self-advocacy.
The Agreements with Partners require the LACs to work with those participants who have
less complex requirements for support in their engagement with the Scheme. This on
average is likely to equate to around 70% of participants. LACs will also support people with
a disability outside the Scheme who do not require an individualised support package. It is
estimated that approximately 20% of LAC time will be spent with these participants and
building capacity within the community. As data becomes available, the number of
individuals supported under this arrangement will be reported. .
ECEI partners work with those children under 6 years of age and their families. Current
modelling indicates that this will equate to around 10% of all participants. Importantly, ECEI
partners will also work with a number of children with developmental delay but for whom
access to the Scheme is not required.

October 2016 | COAG Disability Reform Council Quarterly Report 63
In the future we expect to be able to provide data and insight into the challenges and
success of interventions deployed by the LACs and the effectiveness of the early
intervention support to reduce need for access to the Scheme by the ECEI Partners.

October 2016 | COAG Disability Reform Council Quarterly Report 64
3.3 ILC
3.3.1 Number of participants and other people with a disability supported
by ILC activities by participant characteristics
The role of these partners will be complemented by the implementation of the ILC policy
agreed by all governments. This policy can be summarised as a commitment to connect
people with disability, their families and carers to the wider community by:
1. Capacity Building - Making sure people with disability have the skills, confidence and information they need to get involved in the community
2. Community Inclusion - Building the capacity of the community to include people with disability.
Consistent with the ILC Policy, the focus of effort in ILC will be to ensure that people with
disability:
• Have the information they need to make decisions and choices
• Are connected to appropriate disability, community and mainstream supports
• Have the skills and confidence to participate and contribute to the community and protect their rights
• Use and benefit from the same mainstream services as everyone else
• Use and benefit from the same community activities as everyone else.
3.3.2 Descriptions of activities undertaken on ILC including dollars spent
by regions and activities
ILC Policy will be implemented through an open grant round in each jurisdiction as that
jurisdiction reaches full scheme. Detailed transition plans have been agreed with all
jurisdictions (excluding WA) outlining funding and activities that will be retained by the
respective jurisdictions to build and align current activities to the future ILC policy. These
plans acknowledge the importance of commencing the capture of data on use and demand
and commit to the adoption of the measurement of outcomes from the activities in a manner
consistent with the ILC outcomes framework as it evolves between now and full scheme.
ILC activities have commenced in the ACT through a funding arrangement with the ACT
government to enable current ILC type activities to continue during transition. The open
grant round in the ACT is scheduled to provide ILC activities from July 2017. This will be the
first opportunity for the Scheme to measure activities against the agreed ILC policy.
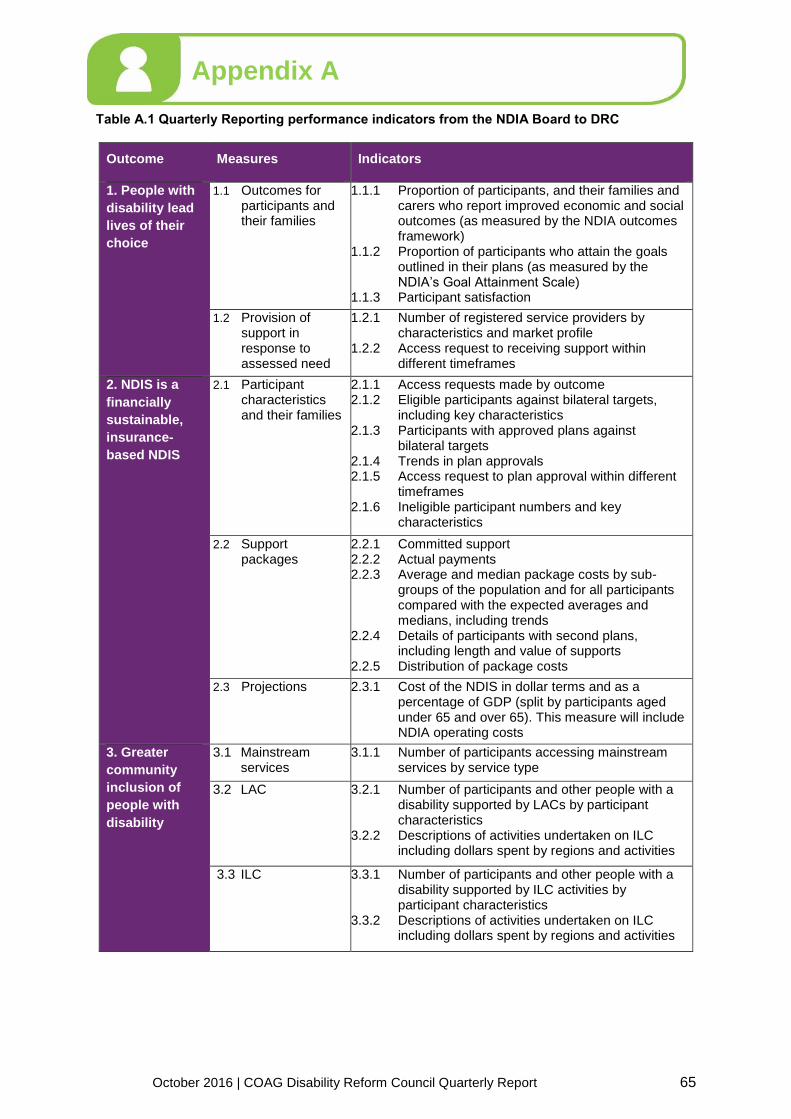
October 2016 | COAG Disability Reform Council Quarterly Report 65
Appendix A
Table A.1 Quarterly Reporting performance indicators from the NDIA Board to DRC
Outcome Measures Indicators
1. People with
disability lead
lives of their
choice
1.1 Outcomes for participants and their families
1.1.1 Proportion of participants, and their families and carers who report improved economic and social outcomes (as measured by the NDIA outcomes framework)
1.1.2 Proportion of participants who attain the goals outlined in their plans (as measured by the NDIA’s Goal Attainment Scale)
1.1.3 Participant satisfaction
1.2 Provision of support in response to assessed need
1.2.1 Number of registered service providers by characteristics and market profile
1.2.2 Access request to receiving support within different timeframes
2. NDIS is a
financially
sustainable,
insurance-
based NDIS
2.1 Participant characteristics and their families
2.1.1 Access requests made by outcome 2.1.2 Eligible participants against bilateral targets,
including key characteristics 2.1.3 Participants with approved plans against
bilateral targets 2.1.4 Trends in plan approvals 2.1.5 Access request to plan approval within different
timeframes 2.1.6 Ineligible participant numbers and key
characteristics
2.2 Support packages
2.2.1 Committed support 2.2.2 Actual payments 2.2.3 Average and median package costs by sub-
groups of the population and for all participants compared with the expected averages and medians, including trends
2.2.4 Details of participants with second plans, including length and value of supports
2.2.5 Distribution of package costs
2.3 Projections 2.3.1 Cost of the NDIS in dollar terms and as a percentage of GDP (split by participants aged under 65 and over 65). This measure will include NDIA operating costs
3. Greater
community
inclusion of
people with
disability
3.1 Mainstream services
3.1.1 Number of participants accessing mainstream services by service type
3.2 LAC 3.2.1 Number of participants and other people with a disability supported by LACs by participant characteristics
3.2.2 Descriptions of activities undertaken on ILC including dollars spent by regions and activities
3.3 ILC 3.3.1 Number of participants and other people with a disability supported by ILC activities by participant characteristics
3.3.2 Descriptions of activities undertaken on ILC including dollars spent by regions and activities

October 2016 | COAG Disability Reform Council Quarterly Report 66
Appendix B
Table B.1 Quarterly Reporting performance indicators from the NDIA Board to DRC
Participant version Family version, for participant aged
Domain
Children from 0 to before starting school
Children from starting school to age 14
Young adults 15 to 24
Adults 25 and over
0 to 14 15 to 24 25 and over
1 Daily living Daily living Choice and control
Choice and control
Families know their rights and advocate effectively for their child with disability
Families know their rights and advocate effectively for their family member with disability
Families know their rights and advocate effectively for their family member with disability
2 Choice and control
Lifelong learning
Daily living Daily living Families feel supported
Families have the support they need to care
Families have the support they need to care
3 Relationships Relationships Relationships Relationships
Families are able to gain access to desired services, programs, and activities in their community
Families are able to gain access to desired services, programs, and activities in their community
Families are able to gain access to desired services, programs, and activities in their community
4
Social, community and civic participation
Social, community and civic participation
Home Home
Families help their children develop and learn
Families help their young person become independent
Families have succession plans
5 Health and wellbeing
Health and wellbeing
Families enjoy health and wellbeing
Families enjoy health and wellbeing
Families enjoy health and wellbeing
6 Lifelong learning
Lifelong learning
7 Work Work
8
Social, community and civic participation
Social, community and civic participation