nd Quarter Greenwich Market Report€¦ · Greenwich Market Report. Presented By ......
23
�nd Quarter ���� Greenwich Market Report
Transcript of nd Quarter Greenwich Market Report€¦ · Greenwich Market Report. Presented By ......

�nd Quarter ���� Greenwich Market Report
Presented By
CHRIS MEYERSPresident
Houlihan Lawrence
HOULIHANLAWRENCE.COM

SEARCH HOMES THE WAY YOU WANTWITH THE HOULIHAN LAWRENCE MOBILE APP
THE MOST INNOVATIVE REAL ESTATE APP POWERING BUYERS �NORTHOFNYC

There’s an old joke about economists. If you put 10 of them in a room, you will get 11 opinions. Don’t worry, the real estate market isn’t quite at that point. But there are some notable trends in the broader metrics that impact the real estate market. They don’t always follow the path expected and predicted by the so-called experts, and are open to interpretation.
For example, heading into the quarter, there was a lot of concern that because the Trump administration had not yet been able to deliver on the president’s economic campaign promises, like tax cuts, that would negatively impact the stock market. And yet, on June 30th when the quarter closed, the stock market had turned in the best quarter in years. The Nasdaq rose 14 percent, with the Dow and S&P 500 notching gains of 8 percent. Reality defies expectations.
For our real estate market, sometimes things appear one way at first, but a broader view tells a more thoughtful and complete story. For example, one way to look at the market is that it has tempered a bit in the second quarter compared to the beginning of 2017. But taking a broader view, the Greenwich market still experienced gains in the first half compared to the same period a year ago. We feel the long-term perspective is the more indicative view.
Also of note: average prices are on the rise, up nearly 4 percent. We believe that number is a vote of confidence. When buyers decide to commit to a well-priced property, they will be willing to pay up at least a little. But here’s the reality check. The number of homes sold declined by 6 percent. We interpret that to mean that only homes that are priced right, get the serious buyers who appreciate value and complete the purchase at a good price. Sellers must strategically price their homes when they first come to market and not fish for an unrealistic price.
Here are some trends we are seeing this summer:
More millennials will likely be able to get mortgages. High student debt has kept many young people from qualifying for a mortgage, preventing them from buying their first home. Starting in July, Fannie Mae and Freddie Mac are going to allow buyers to have higher levels of debt and still qualify for a home loan. Specifically, they are raising their debt-to-income ratio to 50 percent of pretax income from 45 percent. Some experts worry about the risk, but as a practical matter, financing will be more available.
Demand continues to be highest at the more affordable price points. Homes under $1 million dollars showed the most demand in the first half of the year. Those under $2 million were not far behind.
Banks are getting more eager to lend. Higher interest rates have meant a downward trend in mortgage refinancing. And as we noted above, home prices are higher and sales are down. That means less demand for new mortgages. Expect the banks to be at least a little more open-minded when it comes to issuing loans.
Time remains on the buyer’s side. Days on market continues to expand. It now takes 220 days on average to sell a home in Greenwich, CT. There is a lot of inventory to choose from, and buyers are aware of the options. They demand value.
Dream homes are seeing more interest and may be reaching a tipping point. As the quarter ended, while overall deal activity declined, there was a pickup in high-end deals which had been a slower price point. For example, in the
SECOND QUARTER 2017
EXECUTIVE SUMMARY

EXECUTIVE SUMMARY
first half of 2017 sales of homes in the $6 million to $8 million range doubled from the same period a year ago. This could serve as a catalyst for buyers on the sidelines to start getting more serious about locking in the home they have had their eye on. We’re closely watching this trend for more signs of a pickup.
Some regional statistics we’d like to share:
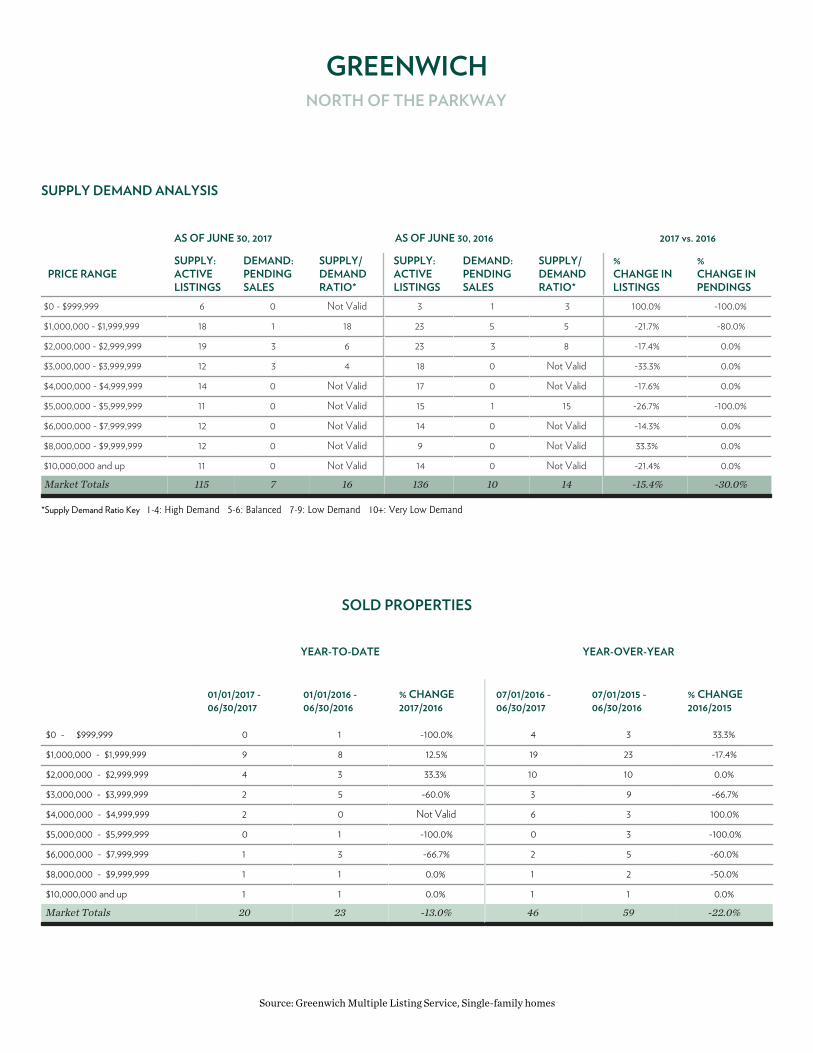
Greenwich North of the Parkway continues to be a place where buyers can find value. Sales declined significantly, and when they did occur sales prices were only 86 percent of the asking price. Homes have been on the market an average of about 450 days. Buyers who want privacy and convenience to the Merritt Parkway will find attractive options.
Prices are also lower in Greenwich South of the Parkway. But the lower prices are driving sales, which were up more than 20 percent this past quarter compared to the second quarter of 2016. Days on market, at 221, is less than half the time of Greenwich North of the Parkway. The larger lot sizes and private schools, along with convenience to Greenwich avenue give it an edge. Buyers will find value but do need to move faster.
We are seeing pricing strength in Greenwich South of the Post Road. Sales, however, declined in the second quarter, and it took longer to sell homes. A large portion of this area is waterfront where big deals continue to happen. The strongest demand year-to-date has been in the $1 million to $3 million price range. Prices are also rising in Cos Cob. However, sales declined more than 40 percent in the second quarter.
After struggling a year ago, Riverside is showing strong gains in both sales and prices. Homes are selling faster, signaling buyers recognize value. The most affordable price points are seeing the most demand.
The quaint village of Old Greenwich remains a favorite of NYC buyers. They love the walkability to the train and the proximity to the beach, shopping and dining. While sales and prices did move lower in the second quarter, annualized year-over-year prices did rise. The Condominium market is up modestly so far in 2017, and prices are on the rise.
Newbies no more! Houlihan Lawrence participated in seven of the top 10 sales this year. It’s hard to believe we only opened our Greenwich office in 2013. We feel so firmly rooted in the community. Thank you for embracing us and making us part of one of the most important family decisions of your life.
Stephen MeyersCEO
Chris MeyersPresident
SECOND QUARTER 2017

TABLE OF CONTENTSSECOND QUARTER 2017
GREATER GREENWICHSingle Family Home Overview
GREENWICHNorth of the Parkway
GREENWICHSouth of the Parkway
GREENWICHSouth of the Post Road
COS COB
RIVERSIDE
OLD GREENWICH
GREATER GREENWICHCondominium Overview
HOULIHANLAWRENCE.COM

GREATER GREENWICH
QUARTERLY MARKET OVERVIEW
Q22017
Q22016
%CHANGE
YTD2017
YTD2016
%CHANGE
HOMES SOLD 162 170 -4.7% 288 268 7.5%
AVERAGE SALE PRICE $2,340,158 $2,231,847 4.9% $2,414,552 $2,267,414 6.5%
MEDIAN SALE PRICE $1,742,250 $1,746,000 -0.2% $1,817,500 $1,712,250 6.1%
AVERAGE PRICE PER SQUARE FOOT $556 $566 -1.8% $567 $565 0.4%
AVERAGE DAYS ON MARKET 199 185 7.6% 220 191 15.2%
% SALE PRICE TO LIST PRICE 94.1% 94.5% -0.4% 93.2% 93.8% -0.6%
TEN-YEAR MARKET HISTORY
Average Sale Price $2,818,933 $2,664,991 $2,518,862 $2,429,922 $2,381,680 $2,245,168 $2,688,907 $2,421,486 $2,203,756 $2,414,552 Average Sale Price
Average Price/SqFt $627 $545 $544 $539 $555 $555 $610 $591 $564 $567 Average Price/SqFt
Days On Market 144 187 184 180 173 156 166 177 189 220 Days On Market
%Sale Price to List Price 92.1 87.5 90.2 91.8 91.9 94.1 93.7 94.4 94.1 93.2 %Sale Price to List Price
* Homes sold for 2017 are annualized based on actual sales year-to-date.

GREATER GREENWICH
SUPPLY DEMAND ANALYSIS
AS OF JUNE 30, 2017 AS OF JUNE 30, 2016 2017 vs. 2016
PRICE RANGESUPPLY:ACTIVELISTINGS
DEMAND:PENDINGSALES
SUPPLY/DEMANDRATIO*
SUPPLY:ACTIVELISTINGS
DEMAND:PENDINGSALES
SUPPLY/DEMANDRATIO*
%CHANGE INLISTINGS
%CHANGE INPENDINGS
$0 - $999,999 40 15 3 72 15 5 -44.4% 0.0%
$1,000,000 - $1,999,999 149 33 5 165 48 3 -9.7% -31.3%
$2,000,000 - $2,999,999 147 17 9 126 29 4 16.7% -41.4%
$3,000,000 - $3,999,999 89 13 7 101 17 6 -11.9% -23.5%
$4,000,000 - $4,999,999 65 6 11 66 4 17 -1.5% 50.0%
$5,000,000 - $5,999,999 46 3 15 58 6 10 -20.7% -50.0%
$6,000,000 - $7,999,999 49 5 10 47 4 12 4.3% 25.0%
$8,000,000 - $9,999,999 24 1 24 25 2 13 -4.0% -50.0%
$10,000,000 and up 39 2 20 41 0 Not Valid -4.9% 0.0%
Market Totals 648 95 7 701 125 6 -7.6% -24.0%
*Supply Demand Ratio Key 1-4: High Demand 5-6: Balanced 7-9: Low Demand 10+: Very Low Demand
SOLD PROPERTIES
YEAR-TO-DATE YEAR-OVER-YEAR
01/01/2017 -06/30/2017
01/01/2016 -06/30/2016
% CHANGE2017/2016
07/01/2016 -06/30/2017
07/01/2015 -06/30/2016
% CHANGE2016/2015
$0 - $999,999 58 55 5.5% 120 118 1.7%
$1,000,000 - $1,999,999 102 103 -1.0% 233 213 9.4%
$2,000,000 - $2,999,999 54 48 12.5% 107 103 3.9%
$3,000,000 - $3,999,999 32 28 14.3% 63 61 3.3%
$4,000,000 - $4,999,999 13 14 -7.1% 28 30 -6.7%
$5,000,000 - $5,999,999 14 9 55.6% 21 20 5.0%
$6,000,000 - $7,999,999 10 5 100.0% 15 14 7.1%
$8,000,000 - $9,999,999 3 3 0.0% 4 8 -50.0%
$10,000,000 and up 2 3 -33.3% 4 5 -20.0%
Market Totals 288 268 7.5% 595 572 4.0%
Source: Greenwich Multiple Listing Service, Single-family homes

GREENWICHNORTH OF THE PARKWAY
QUARTERLY MARKET OVERVIEW
Q22017
Q22016
%CHANGE
YTD2017
YTD2016
%CHANGE
HOMES SOLD 7 12 -41.7% 20 23 -13.0%
AVERAGE SALE PRICE $3,143,578 $4,052,290 -22.4% $3,367,740 $3,621,895 -7.0%
MEDIAN SALE PRICE $2,100,000 $2,400,000 -12.5% $2,247,500 $2,600,000 -13.6%
AVERAGE PRICE PER SQUARE FOOT $444 $500 -11.2% $468 $497 -5.8%
AVERAGE DAYS ON MARKET 358 435 -17.7% 456 386 18.1%
% SALE PRICE TO LIST PRICE 90.6% 90.5% 0.1% 87.9% 91.1% -3.5%
TEN-YEAR MARKET HISTORY
Average Sale Price $5,046,500 $5,855,000 $4,552,510 $3,887,759 $3,548,310 $3,106,132 $4,136,921 $2,834,463 $2,939,222 $3,367,740 Average Sale Price
Average Price/SqFt $578 $682 $609 $557 $504 $524 $558 $524 $470 $468 Average Price/SqFt
Days On Market 223 268 333 251 286 286 349 282 361 456 Days On Market
%Sale Price to List Price 84.0 86.3 82.9 91.0 89.3 91.5 90.5 92.7 91.8 87.9 %Sale Price to List Price
* Homes sold for 2017 are annualized based on actual sales year-to-date.
GREENWICHNORTH OF THE PARKWAY
SUPPLY DEMAND ANALYSIS
AS OF JUNE 30, 2017 AS OF JUNE 30, 2016 2017 vs. 2016
PRICE RANGESUPPLY:ACTIVELISTINGS
DEMAND:PENDINGSALES
SUPPLY/DEMANDRATIO*
SUPPLY:ACTIVELISTINGS
DEMAND:PENDINGSALES
SUPPLY/DEMANDRATIO*
%CHANGE INLISTINGS
%CHANGE INPENDINGS
$0 - $999,999 6 0 Not Valid 3 1 3 100.0% -100.0%
$1,000,000 - $1,999,999 18 1 18 23 5 5 -21.7% -80.0%
$2,000,000 - $2,999,999 19 3 6 23 3 8 -17.4% 0.0%
$3,000,000 - $3,999,999 12 3 4 18 0 Not Valid -33.3% 0.0%
$4,000,000 - $4,999,999 14 0 Not Valid 17 0 Not Valid -17.6% 0.0%
$5,000,000 - $5,999,999 11 0 Not Valid 15 1 15 -26.7% -100.0%
$6,000,000 - $7,999,999 12 0 Not Valid 14 0 Not Valid -14.3% 0.0%
$8,000,000 - $9,999,999 12 0 Not Valid 9 0 Not Valid 33.3% 0.0%
$10,000,000 and up 11 0 Not Valid 14 0 Not Valid -21.4% 0.0%
Market Totals 115 7 16 136 10 14 -15.4% -30.0%
*Supply Demand Ratio Key 1-4: High Demand 5-6: Balanced 7-9: Low Demand 10+: Very Low Demand
SOLD PROPERTIES
YEAR-TO-DATE YEAR-OVER-YEAR
01/01/2017 -06/30/2017
01/01/2016 -06/30/2016
% CHANGE2017/2016
07/01/2016 -06/30/2017
07/01/2015 -06/30/2016
% CHANGE2016/2015
$0 - $999,999 0 1 -100.0% 4 3 33.3%
$1,000,000 - $1,999,999 9 8 12.5% 19 23 -17.4%
$2,000,000 - $2,999,999 4 3 33.3% 10 10 0.0%
$3,000,000 - $3,999,999 2 5 -60.0% 3 9 -66.7%
$4,000,000 - $4,999,999 2 0 Not Valid 6 3 100.0%
$5,000,000 - $5,999,999 0 1 -100.0% 0 3 -100.0%
$6,000,000 - $7,999,999 1 3 -66.7% 2 5 -60.0%
$8,000,000 - $9,999,999 1 1 0.0% 1 2 -50.0%
$10,000,000 and up 1 1 0.0% 1 1 0.0%
Market Totals 20 23 -13.0% 46 59 -22.0%
Source: Greenwich Multiple Listing Service, Single-family homes

GREENWICHSOUTH OF THE PARKWAY
QUARTERLY MARKET OVERVIEW
Q22017
Q22016
%CHANGE
YTD2017
YTD2016
%CHANGE
HOMES SOLD 63 52 21.2% 112 77 45.5%
AVERAGE SALE PRICE $2,462,968 $2,484,330 -0.9% $2,507,631 $2,317,801 8.2%
MEDIAN SALE PRICE $1,690,000 $2,112,500 -20.0% $1,900,000 $1,665,000 14.1%
AVERAGE PRICE PER SQUARE FOOT $532 $545 -2.4% $546 $534 2.2%
AVERAGE DAYS ON MARKET 203 187 8.6% 221 184 20.1%
% SALE PRICE TO LIST PRICE 94.1% 94.6% -0.5% 93.3% 94.3% -1.1%
TEN-YEAR MARKET HISTORY
Average Sale Price $3,389,186 $3,306,936 $3,098,527 $2,764,965 $2,788,964 $2,774,982 $2,698,854 $3,075,190 $2,403,016 $2,507,631 Average Sale Price
Average Price/SqFt $653 $545 $552 $529 $569 $536 $566 $586 $534 $546 Average Price/SqFt
Days On Market 163 208 208 214 176 169 187 192 211 221 Days On Market
%Sale Price to List Price 93.1 87.0 91.9 90.5 91.7 94.0 93.8 93.7 94.0 93.3 %Sale Price to List Price
* Homes sold for 2017 are annualized based on actual sales year-to-date.

GREENWICHSOUTH OF THE PARKWAY
SUPPLY DEMAND ANALYSIS
AS OF JUNE 30, 2017 AS OF JUNE 30, 2016 2017 vs. 2016
PRICE RANGESUPPLY:ACTIVELISTINGS
DEMAND:PENDINGSALES
SUPPLY/DEMANDRATIO*
SUPPLY:ACTIVELISTINGS
DEMAND:PENDINGSALES
SUPPLY/DEMANDRATIO*
%CHANGE INLISTINGS
%CHANGE INPENDINGS
$0 - $999,999 19 8 2 23 3 8 -17.4% 166.7%
$1,000,000 - $1,999,999 51 10 5 48 13 4 6.3% -23.1%
$2,000,000 - $2,999,999 60 6 10 51 10 5 17.6% -40.0%
$3,000,000 - $3,999,999 40 7 6 54 11 5 -25.9% -36.4%
$4,000,000 - $4,999,999 27 1 27 32 3 11 -15.6% -66.7%
$5,000,000 - $5,999,999 21 2 11 23 3 8 -8.7% -33.3%
$6,000,000 - $7,999,999 21 1 21 14 3 5 50.0% -66.7%
$8,000,000 - $9,999,999 10 1 10 9 1 9 11.1% 0.0%
$10,000,000 and up 18 1 18 19 0 Not Valid -5.3% 0.0%
Market Totals 267 37 7 273 47 6 -2.2% -21.3%
*Supply Demand Ratio Key 1-4: High Demand 5-6: Balanced 7-9: Low Demand 10+: Very Low Demand
SOLD PROPERTIES
YEAR-TO-DATE YEAR-OVER-YEAR
01/01/2017 -06/30/2017
01/01/2016 -06/30/2016
% CHANGE2017/2016
07/01/2016 -06/30/2017
07/01/2015 -06/30/2016
% CHANGE2016/2015
$0 - $999,999 25 14 78.6% 43 28 53.6%
$1,000,000 - $1,999,999 33 29 13.8% 64 58 10.3%
$2,000,000 - $2,999,999 17 13 30.8% 39 28 39.3%
$3,000,000 - $3,999,999 16 6 166.7% 36 21 71.4%
$4,000,000 - $4,999,999 7 7 0.0% 14 16 -12.5%
$5,000,000 - $5,999,999 10 6 66.7% 14 9 55.6%
$6,000,000 - $7,999,999 3 2 50.0% 6 8 -25.0%
$8,000,000 - $9,999,999 1 0 Not Valid 1 3 -66.7%
$10,000,000 and up 0 0 Not Valid 0 2 -100.0%
Market Totals 112 77 45.5% 217 173 25.4%
Source: Greenwich Multiple Listing Service, Single-family homes

GREENWICHSOUTH OF THE POST ROAD
QUARTERLY MARKET OVERVIEW
Q22017
Q22016
%CHANGE
YTD2017
YTD2016
%CHANGE
HOMES SOLD 16 21 -23.8% 30 39 -23.1%
AVERAGE SALE PRICE $2,454,953 $1,943,904 26.3% $2,913,843 $2,704,484 7.7%
MEDIAN SALE PRICE $1,900,000 $1,635,000 16.2% $1,580,275 $2,050,000 -22.9%
AVERAGE PRICE PER SQUARE FOOT $623 $566 10.1% $643 $649 -0.9%
AVERAGE DAYS ON MARKET 289 156 85.3% 222 148 50.0%
% SALE PRICE TO LIST PRICE 92.4% 94.8% -2.5% 91.8% 90.8% 1.1%
TEN-YEAR MARKET HISTORY
Average Sale Price $2,291,158 $2,658,088 $3,101,381 $3,239,191 $2,486,569 $2,219,081 $4,083,817 $2,043,325 $2,545,622 $2,913,843 Average Sale Price
Average Price/SqFt $617 $558 $575 $570 $574 $577 $726 $597 $622 $643 Average Price/SqFt
Days On Market 146 213 220 212 215 160 172 191 149 222 Days On Market
%Sale Price to List Price 95.5 83.9 87.6 91.5 89.0 92.6 93.4 96.2 92.3 91.8 %Sale Price to List Price
* Homes sold for 2017 are annualized based on actual sales year-to-date.

GREENWICHSOUTH OF THE POST ROAD
SUPPLY DEMAND ANALYSIS
AS OF JUNE 30, 2017 AS OF JUNE 30, 2016 2017 vs. 2016
PRICE RANGESUPPLY:ACTIVELISTINGS
DEMAND:PENDINGSALES
SUPPLY/DEMANDRATIO*
SUPPLY:ACTIVELISTINGS
DEMAND:PENDINGSALES
SUPPLY/DEMANDRATIO*
%CHANGE INLISTINGS
%CHANGE INPENDINGS
$0 - $999,999 7 1 7 12 3 4 -41.7% -66.7%
$1,000,000 - $1,999,999 9 5 2 11 6 2 -18.2% -16.7%
$2,000,000 - $2,999,999 7 4 2 9 4 2 -22.2% 0.0%
$3,000,000 - $3,999,999 10 1 10 4 0 Not Valid 150.0% 0.0%
$4,000,000 - $4,999,999 6 0 Not Valid 8 0 Not Valid -25.0% 0.0%
$5,000,000 - $5,999,999 5 0 Not Valid 8 0 Not Valid -37.5% 0.0%
$6,000,000 - $7,999,999 5 2 3 7 1 7 -28.6% 100.0%
$8,000,000 - $9,999,999 1 0 Not Valid 4 1 4 -75.0% -100.0%
$10,000,000 and up 6 1 6 5 0 Not Valid 20.0% 0.0%
Market Totals 56 14 4 68 15 5 -17.6% -6.7%
*Supply Demand Ratio Key 1-4: High Demand 5-6: Balanced 7-9: Low Demand 10+: Very Low Demand
SOLD PROPERTIES
YEAR-TO-DATE YEAR-OVER-YEAR
01/01/2017 -06/30/2017
01/01/2016 -06/30/2016
% CHANGE2017/2016
07/01/2016 -06/30/2017
07/01/2015 -06/30/2016
% CHANGE2016/2015
$0 - $999,999 9 9 0.0% 17 25 -32.0%
$1,000,000 - $1,999,999 10 10 0.0% 26 18 44.4%
$2,000,000 - $2,999,999 2 10 -80.0% 9 14 -35.7%
$3,000,000 - $3,999,999 3 4 -25.0% 3 6 -50.0%
$4,000,000 - $4,999,999 1 1 0.0% 1 2 -50.0%
$5,000,000 - $5,999,999 2 2 0.0% 3 6 -50.0%
$6,000,000 - $7,999,999 1 0 Not Valid 2 0 Not Valid
$8,000,000 - $9,999,999 1 1 0.0% 2 2 0.0%
$10,000,000 and up 1 2 -50.0% 2 2 0.0%
Market Totals 30 39 -23.1% 65 75 -13.3%
Source: Greenwich Multiple Listing Service, Single-family homes

COS COB
QUARTERLY MARKET OVERVIEW
Q22017
Q22016
%CHANGE
YTD2017
YTD2016
%CHANGE
HOMES SOLD 17 29 -41.4% 35 44 -20.5%
AVERAGE SALE PRICE $1,346,970 $1,463,224 -7.9% $1,315,414 $1,408,522 -6.6%
MEDIAN SALE PRICE $1,350,000 $1,310,000 3.1% $1,280,000 $1,242,500 3.0%
AVERAGE PRICE PER SQUARE FOOT $495 $500 -1.0% $456 $483 -5.6%
AVERAGE DAYS ON MARKET 127 104 22.1% 187 161 16.1%
% SALE PRICE TO LIST PRICE 94.5% 98.1% -3.7% 94.1% 97.3% -3.3%
TEN-YEAR MARKET HISTORY
Average Sale Price $1,429,370 $1,254,122 $1,128,900 $1,116,709 $1,224,821 $1,241,224 $1,254,598 $1,365,294 $1,321,116 $1,315,414 Average Sale Price
Average Price/SqFt $468 $418 $405 $431 $414 $471 $465 $506 $489 $456 Average Price/SqFt
Days On Market 106 165 145 141 153 131 103 143 162 187 Days On Market
%Sale Price to List Price 94.3 90.7 93.1 92.7 94.0 95.0 96.1 96.2 96.0 94.1 %Sale Price to List Price
* Homes sold for 2017 are annualized based on actual sales year-to-date.

COS COB
SUPPLY DEMAND ANALYSIS
AS OF JUNE 30, 2017 AS OF JUNE 30, 2016 2017 vs. 2016
PRICE RANGESUPPLY:ACTIVELISTINGS
DEMAND:PENDINGSALES
SUPPLY/DEMANDRATIO*
SUPPLY:ACTIVELISTINGS
DEMAND:PENDINGSALES
SUPPLY/DEMANDRATIO*
%CHANGE INLISTINGS
%CHANGE INPENDINGS
$0 - $999,999 2 3 1 15 5 3 -86.7% -40.0%
$1,000,000 - $1,999,999 29 5 6 39 6 7 -25.6% -16.7%
$2,000,000 - $2,999,999 8 0 Not Valid 7 3 2 14.3% -100.0%
$3,000,000 - $3,999,999 4 0 Not Valid 7 0 Not Valid -42.9% 0.0%
$4,000,000 - $4,999,999 3 0 Not Valid 0 0 0 0.0% 0.0%
$5,000,000 - $5,999,999 0 0 0 1 0 Not Valid -100.0% 0.0%
$6,000,000 - $7,999,999 0 0 0 0 0 0 0.0% 0.0%
$8,000,000 - $9,999,999 0 0 0 0 0 0 0.0% 0.0%
$10,000,000 and up 0 0 0 0 0 0 0.0% 0.0%
Market Totals 46 8 6 69 14 5 -33.3% -42.9%
*Supply Demand Ratio Key 1-4: High Demand 5-6: Balanced 7-9: Low Demand 10+: Very Low Demand
SOLD PROPERTIES
YEAR-TO-DATE YEAR-OVER-YEAR
01/01/2017 -06/30/2017
01/01/2016 -06/30/2016
% CHANGE2017/2016
07/01/2016 -06/30/2017
07/01/2015 -06/30/2016
% CHANGE2016/2015
$0 - $999,999 14 15 -6.7% 29 26 11.5%
$1,000,000 - $1,999,999 16 24 -33.3% 32 33 -3.0%
$2,000,000 - $2,999,999 5 5 0.0% 9 9 0.0%
$3,000,000 - $3,999,999 0 0 Not Valid 0 2 -100.0%
$4,000,000 - $4,999,999 0 0 Not Valid 0 0 Not Valid
$5,000,000 - $5,999,999 0 0 Not Valid 0 0 Not Valid
$6,000,000 - $7,999,999 0 0 Not Valid 0 0 Not Valid
$8,000,000 - $9,999,999 0 0 Not Valid 0 0 Not Valid
$10,000,000 and up 0 0 Not Valid 0 0 Not Valid
Market Totals 35 44 -20.5% 70 70 0.0%
Source: Greenwich Multiple Listing Service, Single-family homes

RIVERSIDE
QUARTERLY MARKET OVERVIEW
Q22017
Q22016
%CHANGE
YTD2017
YTD2016
%CHANGE
HOMES SOLD 38 31 22.6% 56 45 24.4%
AVERAGE SALE PRICE $2,515,705 $2,049,220 22.8% $2,433,583 $2,034,629 19.6%
MEDIAN SALE PRICE $1,970,750 $1,690,000 16.6% $1,970,750 $1,690,000 16.6%
AVERAGE PRICE PER SQUARE FOOT $581 $628 -7.5% $608 $596 2.0%
AVERAGE DAYS ON MARKET 161 163 -1.2% 156 168 -7.1%
% SALE PRICE TO LIST PRICE 95.2% 93.1% 2.3% 95.5% 93.9% 1.7%
TEN-YEAR MARKET HISTORY
Average Sale Price $2,734,694 $2,049,817 $1,825,869 $1,856,569 $2,135,381 $1,962,380 $2,000,919 $2,275,811 $2,121,616 $2,433,583 Average Sale Price
Average Price/SqFt $682 $573 $535 $539 $588 $582 $598 $634 $600 $608 Average Price/SqFt
Days On Market 117 149 142 155 122 132 110 123 155 156 Days On Market
%Sale Price to List Price 93.4 88.4 91.8 93.3 93.6 96.1 96.6 94.6 93.9 95.5 %Sale Price to List Price
* Homes sold for 2017 are annualized based on actual sales year-to-date.

RIVERSIDE
SUPPLY DEMAND ANALYSIS
AS OF JUNE 30, 2017 AS OF JUNE 30, 2016 2017 vs. 2016
PRICE RANGESUPPLY:ACTIVELISTINGS
DEMAND:PENDINGSALES
SUPPLY/DEMANDRATIO*
SUPPLY:ACTIVELISTINGS
DEMAND:PENDINGSALES
SUPPLY/DEMANDRATIO*
%CHANGE INLISTINGS
%CHANGE INPENDINGS
$0 - $999,999 6 3 2 11 2 6 -45.5% 50.0%
$1,000,000 - $1,999,999 20 6 3 23 9 3 -13.0% -33.3%
$2,000,000 - $2,999,999 24 2 12 18 6 3 33.3% -66.7%
$3,000,000 - $3,999,999 11 2 6 10 4 3 10.0% -50.0%
$4,000,000 - $4,999,999 6 2 3 5 1 5 20.0% 100.0%
$5,000,000 - $5,999,999 4 1 4 3 1 3 33.3% 0.0%
$6,000,000 - $7,999,999 6 1 6 7 0 Not Valid -14.3% 0.0%
$8,000,000 - $9,999,999 1 0 Not Valid 2 0 Not Valid -50.0% 0.0%
$10,000,000 and up 4 0 Not Valid 2 0 Not Valid 100.0% 0.0%
Market Totals 82 17 5 81 23 4 1.2% -26.1%
*Supply Demand Ratio Key 1-4: High Demand 5-6: Balanced 7-9: Low Demand 10+: Very Low Demand
SOLD PROPERTIES
YEAR-TO-DATE YEAR-OVER-YEAR
01/01/2017 -06/30/2017
01/01/2016 -06/30/2016
% CHANGE2017/2016
07/01/2016 -06/30/2017
07/01/2015 -06/30/2016
% CHANGE2016/2015
$0 - $999,999 7 8 -12.5% 16 21 -23.8%
$1,000,000 - $1,999,999 21 20 5.0% 45 43 4.7%
$2,000,000 - $2,999,999 13 8 62.5% 19 22 -13.6%
$3,000,000 - $3,999,999 7 4 75.0% 12 10 20.0%
$4,000,000 - $4,999,999 3 4 -25.0% 5 4 25.0%
$5,000,000 - $5,999,999 1 0 Not Valid 2 0 Not Valid
$6,000,000 - $7,999,999 4 0 Not Valid 4 1 300.0%
$8,000,000 - $9,999,999 0 1 -100.0% 0 1 -100.0%
$10,000,000 and up 0 0 Not Valid 1 0 Not Valid
Market Totals 56 45 24.4% 104 102 2.0%
Source: Greenwich Multiple Listing Service, Single-family homes

OLD GREENWICH
QUARTERLY MARKET OVERVIEW
Q22017
Q22016
%CHANGE
YTD2017
YTD2016
%CHANGE
HOMES SOLD 20 25 -20.0% 34 40 -15.0%
AVERAGE SALE PRICE $2,161,200 $2,192,800 -1.4% $2,250,323 $2,172,112 3.6%
MEDIAN SALE PRICE $2,095,000 $2,285,000 -8.3% $2,137,500 $2,021,250 5.8%
AVERAGE PRICE PER SQUARE FOOT $646 $640 0.9% $684 $629 8.7%
AVERAGE DAYS ON MARKET 198 210 -5.7% 222 195 13.8%
% SALE PRICE TO LIST PRICE 95.2% 96.7% -1.6% 94.7% 96.5% -1.9%
TEN-YEAR MARKET HISTORY
Average Sale Price $2,041,162 $1,785,979 $1,736,841 $1,905,612 $2,271,283 $1,753,566 $2,564,436 $2,017,057 $1,997,289 $2,250,323 Average Sale Price
Average Price/SqFt $664 $565 $575 $588 $617 $615 $749 $644 $646 $684 Average Price/SqFt
Days On Market 125 147 115 105 165 103 116 157 149 222 Days On Market
%Sale Price to List Price 95.5 91.4 94.4 94.8 93.8 95.0 94.1 96.2 96.9 94.7 %Sale Price to List Price
* Homes sold for 2017 are annualized based on actual sales year-to-date.

OLD GREENWICH
SUPPLY DEMAND ANALYSIS
AS OF JUNE 30, 2017 AS OF JUNE 30, 2016 2017 vs. 2016
PRICE RANGESUPPLY:ACTIVELISTINGS
DEMAND:PENDINGSALES
SUPPLY/DEMANDRATIO*
SUPPLY:ACTIVELISTINGS
DEMAND:PENDINGSALES
SUPPLY/DEMANDRATIO*
%CHANGE INLISTINGS
%CHANGE INPENDINGS
$0 - $999,999 0 0 0 8 1 8 -100.0% -100.0%
$1,000,000 - $1,999,999 21 5 4 21 9 2 0.0% -44.4%
$2,000,000 - $2,999,999 29 2 15 18 3 6 61.1% -33.3%
$3,000,000 - $3,999,999 11 0 Not Valid 8 2 4 37.5% -100.0%
$4,000,000 - $4,999,999 8 3 3 4 0 Not Valid 100.0% 0.0%
$5,000,000 - $5,999,999 5 0 Not Valid 8 1 8 -37.5% -100.0%
$6,000,000 - $7,999,999 5 1 5 5 0 Not Valid 0.0% 0.0%
$8,000,000 - $9,999,999 0 0 0 1 0 Not Valid -100.0% 0.0%
$10,000,000 and up 0 0 0 1 0 Not Valid -100.0% 0.0%
Market Totals 79 11 7 74 16 5 6.8% -31.3%
*Supply Demand Ratio Key 1-4: High Demand 5-6: Balanced 7-9: Low Demand 10+: Very Low Demand
SOLD PROPERTIES
YEAR-TO-DATE YEAR-OVER-YEAR
01/01/2017 -06/30/2017
01/01/2016 -06/30/2016
% CHANGE2017/2016
07/01/2016 -06/30/2017
07/01/2015 -06/30/2016
% CHANGE2016/2015
$0 - $999,999 2 8 -75.0% 10 15 -33.3%
$1,000,000 - $1,999,999 13 12 8.3% 47 38 23.7%
$2,000,000 - $2,999,999 13 9 44.4% 21 20 5.0%
$3,000,000 - $3,999,999 4 9 -55.6% 9 13 -30.8%
$4,000,000 - $4,999,999 0 2 -100.0% 2 5 -60.0%
$5,000,000 - $5,999,999 1 0 Not Valid 2 2 0.0%
$6,000,000 - $7,999,999 1 0 Not Valid 1 0 Not Valid
$8,000,000 - $9,999,999 0 0 Not Valid 0 0 Not Valid
$10,000,000 and up 0 0 Not Valid 0 0 Not Valid
Market Totals 34 40 -15.0% 92 93 -1.1%
Source: Greenwich Multiple Listing Service, Single-family homes

GREATER GREENWICHCONDOMINIUMS
QUARTERLY MARKET OVERVIEW
Q22017
Q22016
%CHANGE
YTD2017
YTD2016
%CHANGE
UNITS SOLD 39 39 0.0% 78 74 5.4%
AVERAGE SALE PRICE $1,097,219 $743,326 47.6% $1,047,480 $822,466 27.4%
MEDIAN SALE PRICE $760,000 $680,000 11.8% $755,000 $711,500 6.1%
AVERAGE PRICE PER SQUARE FOOT $503 $471 6.8% $506 $471 7.4%
AVERAGE DAYS ON MARKET 157 95 65.3% 153 118 29.7%
% SALE PRICE TO LIST PRICE 97.1% 96.7% 0.4% 96.7% 96.7% 0.0%
TEN-YEAR MARKET HISTORY
Average Sale Price $953,834 $888,920 $819,813 $878,893 $852,428 $842,525 $901,903 $1,028,489 $981,069 $1,047,480 Average Sale Price
Average Price/SqFt $490 $440 $413 $436 $422 $436 $456 $495 $488 $506 Average Price/SqFt
Days On Market 169 251 216 204 227 186 154 139 133 153 Days On Market
%Sale Price to List Price 94.2 92.6 90.6 92.8 93.4 95.0 95.6 96.2 96.5 96.7 %Sale Price to List Price
* Homes sold for 2017 are annualized based on actual sales year-to-date.

GREATER GREENWICHCONDOMINIUMS
SUPPLY DEMAND ANALYSIS
AS OF JUNE 30, 2017 AS OF JUNE 30, 2016 2017 vs. 2016
PRICE RANGESUPPLY:ACTIVELISTINGS
DEMAND:PENDINGSALES
SUPPLY/DEMANDRATIO*
SUPPLY:ACTIVELISTINGS
DEMAND:PENDINGSALES
SUPPLY/DEMANDRATIO*
%CHANGE INLISTINGS
%CHANGE INPENDINGS
$0 - $999,999 72 16 5 69 18 4 4.3% -11.1%
$1,000,000 - $1,999,999 34 7 5 32 1 32 6.3% 600.0%
$2,000,000 - $2,999,999 10 1 10 25 3 8 -60.0% -66.7%
$3,000,000 - $3,999,999 6 1 6 8 5 2 -25.0% -80.0%
$4,000,000 - $4,999,999 3 0 Not Valid 1 2 1 200.0% -100.0%
$5,000,000 - $5,999,999 0 0 0 0 0 0 0.0% 0.0%
$6,000,000 - $7,999,999 0 0 0 0 0 0 0.0% 0.0%
$8,000,000 - $9,999,999 0 0 0 0 0 0 0.0% 0.0%
$10,000,000 and up 0 0 0 0 0 0 0.0% 0.0%
Market Totals 125 25 5 135 29 5 -7.4% -13.8%
*Supply Demand Ratio Key 1-4: High Demand 5-6: Balanced 7-9: Low Demand 10+: Very Low Demand
SOLD PROPERTIES
YEAR-TO-DATE YEAR-OVER-YEAR
01/01/2017 -06/30/2017
01/01/2016 -06/30/2016
% CHANGE2017/2016
07/01/2016 -06/30/2017
07/01/2015 -06/30/2016
% CHANGE2016/2015
$0 - $999,999 52 58 -10.3% 110 137 -19.7%
$1,000,000 - $1,999,999 17 13 30.8% 25 35 -28.6%
$2,000,000 - $2,999,999 6 2 200.0% 16 6 166.7%
$3,000,000 - $3,999,999 3 0 Not Valid 5 1 400.0%
$4,000,000 - $4,999,999 0 1 -100.0% 2 2 0.0%
$5,000,000 - $5,999,999 0 0 Not Valid 0 0 Not Valid
$6,000,000 - $7,999,999 0 0 Not Valid 0 0 Not Valid
$8,000,000 - $9,999,999 0 0 Not Valid 0 0 Not Valid
$10,000,000 and up 0 0 Not Valid 0 0 Not Valid
Market Totals 78 74 5.4% 158 181 -12.7%
Source: Greenwich Multiple Listing Service, Condominium

AREA’S MOST POWERFUL GLOBAL NETWORK
Leading Real Estates Companies of the World | Luxury Portfolio InternationalMayfair International Realty | Board of Regents Luxury Real Estate