nd QUARTER FOR CPS ENERGY FISCAL YEAR 2012 Prepared …
13
CPS ENERGY Quarterly STEP Report to the CITY OF SAN ANTONIO 2 nd QUARTER FOR CPS ENERGY FISCAL YEAR 2012 Prepared August 2011
Transcript of nd QUARTER FOR CPS ENERGY FISCAL YEAR 2012 Prepared …

CPS ENERGY Quarterly STEP Report to the CITY OF SAN ANTONIO 2nd QUARTER FOR CPS ENERGY FISCAL YEAR 2012 Prepared August 2011

Executive Summary Ordinance 2009-05-21-0399 authorizes the funding of the CPS Energy conservation and sustainability STEP (Save for Tomorrow Energy Plan) program. The STEP Program is a demand management program designed to encourage customers to improve the energy efficiency of their homes, buildings and processes, thereby saving electricity and reducing system demand. The goal of the program is to save 771 megawatts (MW) of demand between 2009 and 2020. The 771 MW is equivalent to the amount of energy produced by a large power plant on an annual basis. To put this into perspective, the CPS Energy Spruce 1 power plant generates 575 MW and the newest Spruce 2 generates 750 MW of electricity. In the short term, customers enjoy the benefits of a reduction in overall system fuel costs, which will produce savings for all customers. Those participating proactively in the programs like installing high-efficiency air conditioning/heating units, installing a Peak Saver programmable thermostat, and home efficiency updates will lower their energy use and monthly bills. In the long term, customers will benefit from a delay in the need for additional generation capacity and the rate increases to support the additional capacity. In addition, approximately 111 contracting firms have participated in our commercial and industrial rebate programs, 665 contracting firms have participated in our residential rebate programs, and 24 contracting firms have participated in our solar rebate programs. For the purpose of accountability and transparency, specific procedures have been outlined and noted in the City Ordinance. The quarterly reports are part of the accountability procedures used to assist City staff in evaluating the program in savings and total costs, which are estimated at $849 million. The annual cost ranges from $12.3 million to over $77 million, with approximately $8 million of which is currently recovered in the base rates and the remaining amount would be recovered through an adjustment in the fuel surcharge. Since inception in CPS FY2009, CPS has a cumulative reduction of approximately 257 MW or 257,800 kilowatts (kW) of energy demand. Program Expectations The use of demand side management energy programs such as STEP enables customers who participate directly in the program to lower their utility bills almost immediately. Those customers who do not directly participate still benefit in the short run because lower kilowatt per hour system usage will reduce overall system fuel costs and produces fuel savings to all customers. All customers benefit in the long term as CPS will be able to postpone the need for building additional generation capacity and raising utility rates to finance the construction of new generation. For FY2012 the goal is to reduce the demand by 58 MW (58,000 kilowatts).

Another program expectation exhibited in the City Ordinance is the STEP Funding Accountability Procedures CPS must follow. The procedures are listed below:
• All funds collected for STEP programs, either from base rates or through the fuel adjustment, must be accounted for separately.
• CPS Energy shall provide an annual report, prepared by an independent third party consultant, to the City which quantifies the kilowatt savings from STEP expenditures by customer class and other measures deemed necessary by the City.
• Based on the report provided and the amount of STEP expenditures determined to be eligible for recovery through the fuel adjustment, CPS Energy will calculate the annual kilowatt per hour charge. It will be reviewed and approved by City staff before implementation of the kilowatt per hour charge.
• City staff will monitor the recovery through the fuel adjustment on a monthly basis. Annually, the amount of under or over recovery, if any, will be determined and the fuel adjustment will be adjusted accordingly to ensure that only the amount of eligible STEP expenditures are recovered.
• CPS Energy must maintain documentation of all STEP expenditures, by customer class and other measures deemed necessary by the City.
• CPS Energy shall provide quarterly reports to the City staff which show year to date STEP expenditures by program and customer class, funds accumulated and estimated kilowatt savings and other measures deemed necessary by the City.
• Examples of detailed quarterly report information include but are not limited to the following: number of kilowatt saved by customer class and program type; the number of participants and contractors; geographic area and council district program activity; and, total costs/expenditures by program type.
• CPS Energy shall provide an annual report to the City which shows the incentive payments made as a result of the Commercial Demand Response program for the prior twelve months and other measures deemed necessary by the City.
• A quarterly report detailing information shall be made available to the public with sufficient protection regarding confidential information as deemed necessary by the City.
Funding Recovery The total cost of the STEP Program during the 2009 to 2020 time period is estimated at $849 million with an annual cost ranging from $12.3 million to over $77 million, of which approximately $8 million annually is to be recovered in base rates. The remaining annual amount would be recovered through an adjustment in the fuel surcharge. The cost recovery would occur in the following fiscal year and be subject to third party review and verification of incremental kilowatt reduction. Customers could offset the additional costs of these fuel surcharges by implementing some of the STEP energy efficiency measures.

The CPS Energy fiscal year runs from February 1st through January 31st, and the fiscal year is denoted by the year in which the fiscal year ends. For example, CPS FY 2012 would be the period from February 1, 2011 through January 31, 2012. Following is a synopsis of STEP recovery to date and the recoverable amounts for the recovery that started in August of 2011 for fiscal year ending in 2011 (FY2011):
Table 1: Fiscal Year
Recoverable Amounts
Actual Recovery
Cumulative Over/Under
2009 $3,489,514 $4,060,315 ($570,801) 2010 $11,671,707 $13,810,905* ($2,158,962) 2011 $17,429,956 TBD (Aug11-
Jun12) TBD
*July 2011 recovery was estimated since numbers were not yet available
For the calculations of the adjustments to the fuel surcharge listed below, a majority of the Over Recovery was taken into account, and the remaining amounts will be taken into account when the FY 2011 fuel surcharge adjustment is calculated.
*Note: Recovery Period for FY 2009, originally Jul09-Jun10, was extended thru Jul10 while City staff evaluated FY 2010 expenses.
**Note: Recovery Period for FY 2010, originally Aug10-Jun11, was extended thru Jul11 while City staff evaluated FY 2011 expenses.
As noted in table 1 above, a new STEP recovery factor was implemented in August 2011, with recovery going through June 2012. This recovery factor was based on the CPS FY2011 STEP expenditures of $27,879,024, and once the base rate recovery and the previous years over recovery was removed, this left $17,429,956 to be recovered in the adjustment to the fuel surcharge. Residential Programs HVAC Program –offers incentives for the purchase of eligible high efficiency central air conditioners, heat pumps and room air conditioners. Home Efficiency Program – targets a wide range of energy efficiency measures that save cooling and heating energy in existing homes.
Incremental RecoveryFY STEP Cost Period
2009 $3.5M Jul09-Jul10*2010 $11.7M Aug10-Jul11**2011 $17.4M Aug11-Jun12
Residential Impact per1,000 kWh
STEP
$0.21$0.77$1.09

Air Flow Program – offers incentives for repair and/or replacement of duct work to improve the overall efficiency of heating and cooling system. Peak Saver Program – a residential air-conditioner demand response control program. CPS Energy will install a free Honeywell programmable thermostat in participating customers’ homes when they enroll in the program. The thermostat is used by CPS to cycle off the compressor of participating air conditioners during periods of peak demand throughout the summer (May – September). Solar Photovoltaic & Water Heaters – offers incentives for the installation of both solar photovoltaic systems and solar water heaters. New Residential Construction – offers incentives to developers to build at least 15% more energy efficient than current CoSA building codes. Refrigerator Recycling – offers incentives to homeowners to recycle old/extra refrigerators and freezers to remove inefficient appliances from use. Compact Fluorescent Lamps (CFL) Program – The CFL program has been phased out; however CPS Energy continues to distribute 10,000 to 15,000 CFL bulbs annually through various customer events like National Night Out and Earth Day Celebrations. Additionally, upon request CPS Energy will donate a small number of CFL bulbs to organizations that will utilize them to promote energy efficiency within our customer service area. Commercial Programs Lighting – offers incentives to customers who install efficient lighting in their facilities. Incentives are offered for both retrofit and new construction projects. HVAC Program – offers incentives for the installation of high efficiency unitary AC equipment, heat pump and chillers. Roof Coating Programs – offers incentives for the installation of reflective roofing. Lean Clean Energy – offers incentives for industrial customers to evaluate their energy use and make efficiency upgrades. New Commercial Construction – offers incentives to developers to build at least 15% more energy efficient than current CoSA building codes. Commercial Kitchen Equipment – offers incentives for upgrades to more efficient cooling equipment including ice makers. Other Commercial Programs – includes incentives for the installation of custom projects.

CPS FY 2012 2nd Quarter STEP Report Attachment A illustrates the kW reduction and dollars expended for the various commercial and residential efficiency and demand response programs. This data is presented for the 2nd Quarter only. Since the fiscal year for CPS Energy runs from February 1 to January 31, the 2nd Quarter covers May 1, 2011 through July 31, 2011. Attachment B shows the 2nd Quarter rebate dollars broken down by City Council District. The table shows the numerical data, and the charts are a graphical representation of the numerical data. This attachment does not include Peak Saver, Demand Response installations, as these are demand response programs and not energy efficiency per se, nor does it include New Construction installations as these rebates are provided directly to home builders and not to individual customer accounts. Attachment C shows the 2nd Quarter number of rebates broken down by City Council District. The table shows the numerical values, and the charts are a graphical representation of the numerical data. This attachment does not include Peak Saver, Demand Response installations, as these are demand response programs and not energy efficiency per se, nor does it include New Construction installations as these rebates are provided directly to home builders and not to individual customer accounts. Attachment D shows the cumulative rebate dollars broken down by City Council District. The table shows the numerical data, and the charts are a graphical representation of the numerical data. This attachment does not include Peak Saver, Demand Response installations, as these are demand response programs and not energy efficiency per se, nor does it include New Construction installations as these rebates are provided directly to home builders and not to individual customer accounts. Attachment E shows the cumulative number of rebates broken down by City Council District. The table shows the numerical values, and the charts are a graphical representation of the numerical data. This attachment does not include Peak Saver, Demand Response installations, as these are demand response programs and not energy efficiency per se, nor does it include New Construction installations as these rebates are provided directly to home builders and not to individual customer accounts. Attachment F illustrates the cumulative rebate locations overlaid on a map of Bexar County and the City Council Districts. As with Attachments A – E, Peak Saver installations are not included in the data, as Peak Saver is a demand response and not an energy rebate program. Attachment G illustrates the cumulative rebate locations overlaid on the various census tract income segments.
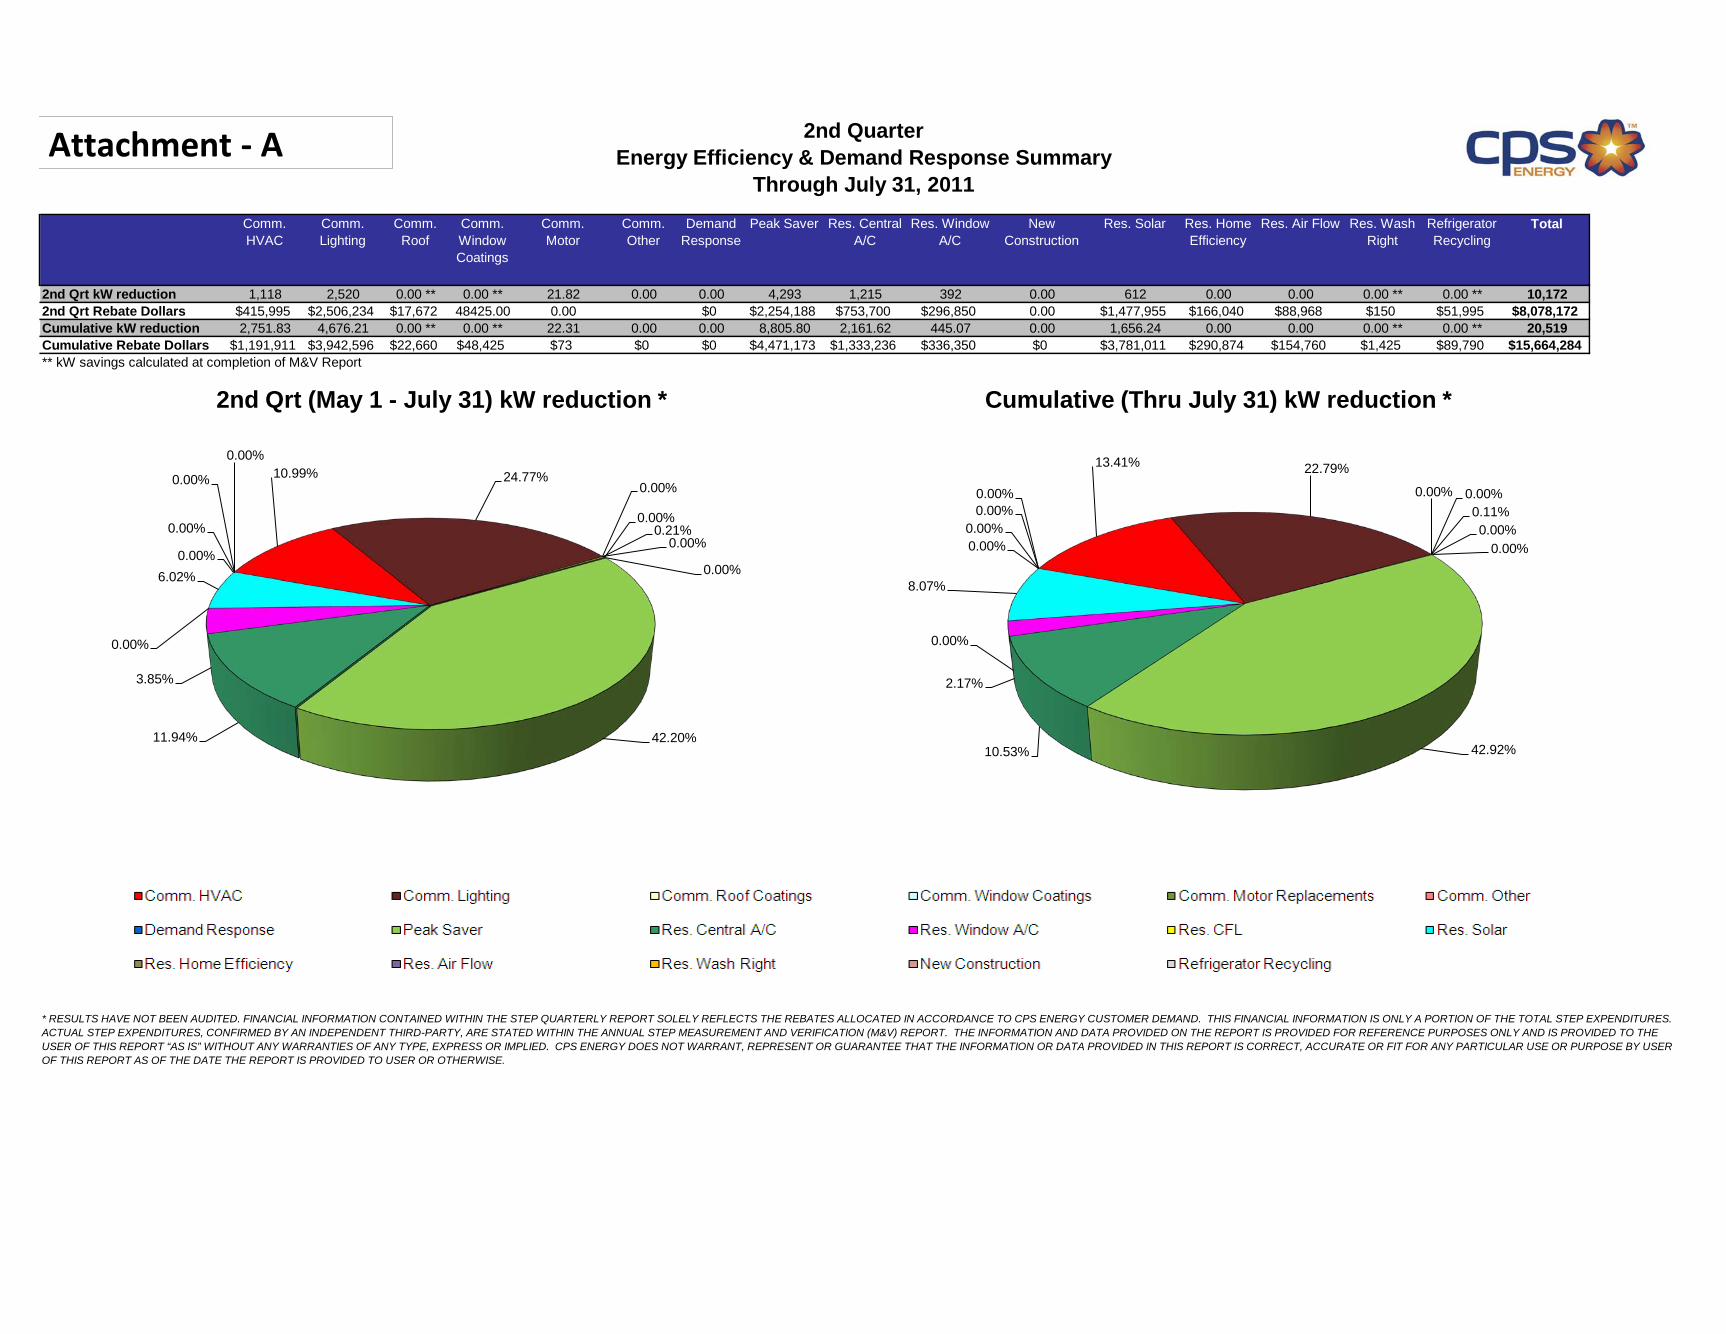
Through July 31, 2011
Comm. HVAC
Comm. Lighting
Comm. Roof
Comm. Window Coatings
Comm. Motor
Comm. Other
Demand Response
Peak Saver Res. Central A/C
Res. Window A/C
NewConstruction
Res. Solar Res. Home Efficiency
Res. Air Flow Res. Wash Right
Refrigerator Recycling
Total
2nd Qrt kW reduction 1,118 2,520 0.00 ** 0.00 ** 21.82 0.00 0.00 4,293 1,215 392 0.00 612 0.00 0.00 0.00 ** 0.00 ** 10,1722nd Qrt Rebate Dollars $415,995 $2,506,234 $17,672 48425.00 0.00 $0 $2,254,188 $753,700 $296,850 0.00 $1,477,955 $166,040 $88,968 $150 $51,995 $8,078,172Cumulative kW reduction 2,751.83 4,676.21 0.00 ** 0.00 ** 22.31 0.00 0.00 8,805.80 2,161.62 445.07 0.00 1,656.24 0.00 0.00 0.00 ** 0.00 ** 20,519Cumulative Rebate Dollars $1,191,911 $3,942,596 $22,660 $48,425 $73 $0 $0 $4,471,173 $1,333,236 $336,350 $0 $3,781,011 $290,874 $154,760 $1,425 $89,790 $15,664,284** kW savings calculated at completion of M&V Report
* RESULTS HAVE NOT BEEN AUDITED. FINANCIAL INFORMATION CONTAINED WITHIN THE STEP QUARTERLY REPORT SOLELY REFLECTS THE REBATES ALLOCATED IN ACCORDANCE TO CPS ENERGY CUSTOMER DEMAND. THIS FINANCIAL INFORMATION IS ONLY A PORTION OF THE TOTAL STEP EXPENDITURES. ACTUAL STEP EXPENDITURES, CONFIRMED BY AN INDEPENDENT THIRD-PARTY, ARE STATED WITHIN THE ANNUAL STEP MEASUREMENT AND VERIFICATION (M&V) REPORT. THE INFORMATION AND DATA PROVIDED ON THE REPORT IS PROVIDED FOR REFERENCE PURPOSES ONLY AND IS PROVIDED TO THE USER OF THIS REPORT “AS IS” WITHOUT ANY WARRANTIES OF ANY TYPE, EXPRESS OR IMPLIED. CPS ENERGY DOES NOT WARRANT, REPRESENT OR GUARANTEE THAT THE INFORMATION OR DATA PROVIDED IN THIS REPORT IS CORRECT, ACCURATE OR FIT FOR ANY PARTICULAR USE OR PURPOSE BY USER OF THIS REPORT AS OF THE DATE THE REPORT IS PROVIDED TO USER OR OTHERWISE.
2nd QuarterEnergy Efficiency & Demand Response Summary
10.99% 24.77%
0.00%
0.00%
0.21%
0.00%
0.00%
42.20%11.94%
3.85%
0.00%
6.02%
0.00%
0.00%
0.00%
0.00%
2nd Qrt (May 1 - July 31) kW reduction *
13.41% 22.79%
0.00%0.00%0.11%0.00%
0.00%
42.92%10.53%
2.17%
0.00%
8.07%
0.00%
0.00%
0.00%
0.00%
Cumulative (Thru July 31) kW reduction *
Attachment - A

Rebate Dollars ($) District 1 District 2 District 3 District 4 District 5 District 6 District 7 District 8 District 9 District 10 Other Total
HVAC $108,750 $28,980 $23,850 $0 $0 $0 $2,600 $51,000 $41,238 $30,945 $128,633 $415,996LIGHTING $177,000 $466,342 $29,292 $155,134 $930,440 $27,275 $181,246 $51,102 $237,412 $68,292 $182,696 $2,506,231MOTOR $48,425 $0 $0 $0 $0 $0 $0 $0 $0 $0 $0 $48,425OTHER $0 $0 $0 $0 $0 $0 $0 $0 $0 $0 $0 $0ROOF $2,230 $3,230 $701 $0 $0 $10,661 $0 $0 $0 $0 $850 $17,672
$0 $0 $0 $0 $0 $0 $0 $0 $0 $0 $0 $0Commercial Total $336,405 $498,552 $53,843 $155,134 $930,440 $37,936 $183,846 $102,102 $278,650 $99,237 $312,179 $2,988,324
Residential - AC Central $20,403 $21,883 $10,125 $15,025 $5,410 $55,215 $67,176 $90,155 $153,543 $96,495 $218,271 $753,701Residential - AC Window $42,350 $30,600 $50,850 $25,900 $54,400 $16,900 $24,150 $5,100 $5,450 $6,700 $34,550 $296,950Residential - Airflow $6,363 $4,026 $1,922 $6,725 $0 $11,078 $9,900 $5,132 $21,092 $13,886 $8,847 $88,971Residential - Home Eff. $6,027 $6,302 $4,411 $3,971 $2,147 $12,930 $8,523 $18,377 $33,282 $20,780 $49,290 $166,040Residential - Refrigerator $2,500 $1,900 $2,040 $2,865 $700 $4,360 $5,490 $4,535 $6,880 $6,690 $14,035 $51,995Solar - H20 $0 $0 $0 $0 $0 $4,356 $1,452 $1,452 $5,808 $2,904 $8,712 $24,684Solar - PV $0 $127,455 $33,146 $34,214 $0 $20,153 $30,000 $336,321 $95,691 $95,943 $680,347 $1,453,270Wash Right $0 $0 $0 $0 $0 $75 $0 $75 $0 $0 $0 $150
Residential Total $77,643 $192,166 $102,494 $88,700 $62,657 $125,067 $146,691 $461,147 $321,746 $243,398 $1,014,052 $2,835,761Total $414,048 $690,718 $156,337 $243,834 $993,097 $163,003 $330,537 $563,249 $600,396 $342,635 $1,326,231 $5,824,085
% of Grand TotalDistrict 1 District 2 District 3 District 4 District 5 District 6 District 7 District 8 District 9 District 10 Other Total
HVAC 3.6% 1.0% 0.8% 0.0% 0.0% 0.0% 0.1% 1.7% 1.4% 1.0% 4.3% 13.9%LIGHTING 5.9% 15.6% 1.0% 5.2% 31.1% 0.9% 6.1% 1.7% 7.9% 2.3% 6.1% 83.9%MOTOR 1.6% 0.0% 0.0% 0.0% 0.0% 0.0% 0.0% 0.0% 0.0% 0.0% 0.0% 1.6%OTHER 0.0% 0.0% 0.0% 0.0% 0.0% 0.0% 0.0% 0.0% 0.0% 0.0% 0.0% 0.0%ROOF 0.1% 0.1% 0.0% 0.0% 0.0% 0.4% 0.0% 0.0% 0.0% 0.0% 0.0% 0.6%WINDOW COATING 0.0% 0.0% 0.0% 0.0% 0.0% 0.0% 0.0% 0.0% 0.0% 0.0% 0.0% 0.0%Commercial Total 5.8% 8.6% 0.9% 2.7% 16.0% 0.7% 3.2% 1.8% 4.8% 1.7% 5.4% 51.3%Residential AC - Central 0.4% 0.4% 0.2% 0.3% 0.1% 0.9% 1.2% 1.5% 2.6% 1.7% 3.7% 12.9%Residential AC Window 0.7% 0.5% 0.9% 0.4% 0.9% 0.3% 0.4% 0.1% 0.1% 0.1% 0.6% 5.1%Residential Airflow 0.1% 0.1% 0.0% 0.1% 0.0% 0.2% 0.2% 0.1% 0.4% 0.2% 0.2% 1.5%Residential Home Eff. 0.1% 0.1% 0.1% 0.1% 0.0% 0.2% 0.1% 0.3% 0.6% 0.4% 0.8% 2.9%Residential Refrigerator 0.0% 0.0% 0.0% 0.0% 0.0% 0.1% 0.1% 0.1% 0.1% 0.1% 0.2% 0.9%Solar H2O 0.0% 0.0% 0.0% 0.0% 0.0% 0.1% 0.0% 0.0% 0.1% 0.0% 0.1% 0.4%Solar PV 0.0% 2.2% 0.6% 0.6% 0.0% 0.3% 0.5% 5.8% 1.6% 1.6% 11.7% 25.0%Wash Right 0.0% 0.0% 0.0% 0.0% 0.0% 0.0% 0.0% 0.0% 0.0% 0.0% 0.0% 0.0%
Total 7.1% 11.9% 2.7% 4.2% 17.1% 2.8% 5.7% 9.7% 10.3% 5.9% 22.8% 100.0%
2nd QuarterMay 1, 2011 - July 31, 2011
Rebates $ by Council District
RESULTS HAVE NOT BEEN AUDITED. FINANCIAL INFORMATION CONTAINED WITHIN THE STEP QUARTERLY REPORT SOLELY REFLECTS THE REBATES ALLOCATED IN ACCORDANCE TO CPS ENERGY CUSTOMER DEMAND. THIS FINANCIAL INFORMATION IS ONLY A PORTION OF THE TOTAL STEP EXPENDITURES. ACTUAL STEP EXPENDITURES, CONFIRMED BY AN INDEPENDENT THIRD-PARTY, ARE STATED WITHIN THE ANNUAL STEP MEASUREMENT AND VERIFICATION (M&V) REPORT. THE INFORMATION AND DATA PROVIDED ON THE REPORT IS PROVIDED FOR REFERENCE PURPOSES ONLY AND IS PROVIDED TO THE USER OF THIS REPORT “AS IS” WITHOUT ANY WARRANTIES OF ANY TYPE, EXPRESS OR IMPLIED. CPS ENERGY DOES NOT WARRANT, REPRESENT OR GUARANTEE THAT THE INFORMATION OR DATA PROVIDED IN THIS REPORT IS CORRECT, ACCURATE OR FIT FOR ANY PARTICULAR USE OR PURPOSE BY USER OF THIS REPORT AS OF THE DATE THE REPORT IS PROVIDED TO USER OR OTHERWISE.
0%
5%
10%
15%
20%
25%
30%
35%
District 1 District 2 District 3 District 4 District 5 District 6 District 7 District 8 District 9 District 10 Other
Commercial Rebates ($) by Council District
HVAC LIGHTING MOTOR OTHER ROOF WINDOW COATING
Attachment - B
0%
2%
4%
6%
8%
10%
12%
14%
16%
18%
20%
District 1 District 2 District 3 District 4 District 5 District 6 District 7 District 8 District 9 District 10 Other
Residential Rebates ($) by Council District
Residential AC - Central Residential AC Window Residential Airflow Residential Home Eff. Residential Refrigerator Solar H2O Solar PV Wash Right

2nd QuarterRebates by Council District Summary
May 1, 2011 - July 31, 20112nd Qrt Total District
1District
2District
3District
4District
5District
6District
7District
8District
9District
10Bexar Other
CountiesTotal
HVAC 2 19 2 0 0 0 1 1 6 9 4 10 54LIGHTING 9 14 4 6 5 2 7 2 13 3 4 10 79MOTOR 1 0 0 0 0 0 0 0 0 0 0 0 1OTHER 0 0 0 0 0 0 0 0 0 0 0 0 0ROOF 2 1 1 0 0 1 0 0 0 0 0 1 6
0 0 0 0 0 0 0 0 0 0 0 0 0Commercial 14 34 7 6 5 3 8 3 19 12 8 21 140
Residential - AC Central 41 44 19 30 9 105 117 160 270 170 346 60 1371Residential - AC Window 494 353 581 304 624 205 286 60 66 81 335 70 3459Residential - Airflow 3 2 1 3 0 6 5 4 9 9 6 0 48Residential - Home Eff. 22 23 17 16 7 34 33 50 88 60 130 17 497Residential - Refrigerator 50 38 42 57 14 86 108 91 134 132 223 52 1027Solar - H2O 0 0 0 0 0 3 1 1 4 2 6 0 17Solar - PV 0 3 2 3 0 3 1 5 8 8 22 5 60Wash Right 0 0 0 0 0 1 0 1 0 0 0 0 2
Residential Total 610 463 662 413 654 443 551 372 579 462 1,068 204 6,4812nd Qrt Total 624 497 669 419 659 446 559 375 598 474 1076 225 6621
HVAC 1.4% 13.6% 1.4% 0.0% 0.0% 0.0% 0.7% 0.7% 4.3% 6.4% 2.9% 7.1% 38.6%LIGHTING 6.4% 10.0% 2.9% 4.3% 3.6% 1.4% 5.0% 1.4% 9.3% 2.1% 2.9% 7.1% 56.4%MOTOR 0.7% 0.0% 0.0% 0.0% 0.0% 0.0% 0.0% 0.0% 0.0% 0.0% 0.0% 0.0% 0.7%OTHER 0.0% 0.0% 0.0% 0.0% 0.0% 0.0% 0.0% 0.0% 0.0% 0.0% 0.0% 0.0% 0.0%ROOF 1.4% 0.7% 0.7% 0.0% 0.0% 0.7% 0.0% 0.0% 0.0% 0.0% 0.0% 0.7% 4.3%WINDOW COATING 0.0% 0.0% 0.0% 0.0% 0.0% 0.0% 0.0% 0.0% 0.0% 0.0% 0.0% 0.0% 0.0%
Commercial 0.21% 0.51% 0.11% 0.09% 0.08% 0.05% 0.12% 0.05% 0.29% 0.18% 0.12% 0.32% 2.1%Residential AC - Central 0.62% 0.66% 0.29% 0.45% 0.14% 1.59% 1.77% 2.42% 4.08% 2.57% 5.23% 0.91% 20.7%Residential AC Window 7.46% 5.33% 8.78% 4.59% 9.42% 3.10% 4.32% 0.91% 1.00% 1.22% 5.06% 1.06% 52.2%
Residential Airflow 0.05% 0.03% 0.02% 0.05% 0.00% 0.09% 0.08% 0.06% 0.14% 0.14% 0.09% 0.00% 0.7%Residential Home Eff. 0.33% 0.35% 0.26% 0.24% 0.11% 0.51% 0.50% 0.76% 1.33% 0.91% 1.96% 0.26% 7.5%
Residential Refrigerator 0.76% 0.57% 0.63% 0.86% 0.21% 1.30% 1.63% 1.37% 2.02% 1.99% 3.37% 0.79% 15.5%Solar H2O 0.00% 0.00% 0.00% 0.00% 0.00% 0.05% 0.02% 0.02% 0.06% 0.03% 0.09% 0.00% 0.3%
Solar PV 0.00% 0.05% 0.03% 0.05% 0.00% 0.05% 0.02% 0.08% 0.12% 0.12% 0.33% 0.08% 0.9%Wash Right 0.00% 0.00% 0.00% 0.00% 0.00% 0.02% 0.00% 0.02% 0.00% 0.00% 0.00% 0.00% 0.0%
Total 9.42% 7.51% 10.10% 6.33% 9.95% 6.74% 8.44% 5.66% 9.03% 7.16% 16.25% 3.40% 100.00%
RESULTS HAVE NOT BEEN AUDITED. FINANCIAL INFORMATION CONTAINED WITHIN THE STEP QUARTERLY REPORT SOLELY REFLECTS THE REBATES ALLOCATED IN ACCORDANCE TO CPS ENERGY CUSTOMER DEMAND. THIS FINANCIAL INFORMATION IS ONLY A PORTION OF THE TOTAL STEP EXPENDITURES. ACTUAL STEP EXPENDITURES, CONFIRMED BY AN INDEPENDENT THIRD-PARTY, ARE STATED WITHIN THE ANNUAL STEP MEASUREMENT AND VERIFICATION (M&V) REPORT. THE INFORMATION AND DATA PROVIDED ON THE REPORT IS PROVIDED FOR REFERENCE PURPOSES ONLY AND IS PROVIDED TO THE USER OF THIS REPORT “AS IS” WITHOUT ANY WARRANTIES OF ANY TYPE, EXPRESS OR IMPLIED. CPS ENERGY DOES NOT WARRANT, REPRESENT OR GUARANTEE THAT THE INFORMATION OR DATA PROVIDED IN THIS REPORT IS CORRECT, ACCURATE OR FIT FOR ANY PARTICULAR USE OR PURPOSE BY USER OF THIS REPORT AS OF THE DATE THE REPORT IS PROVIDED TO USER OR OTHERWISE.
0%
5%
10%
15%
20%
25%
30%
District 1 District 2 District 3 District 4 District 5 District 6 District 7 District 8 District 9 District 10 Bexar Other Counties
Quarter 2: Commercial Rebates per Council District
WINDOW COATING ROOF OTHER MOTOR LIGHTING HVAC
Attachment - C
0%
2%
4%
6%
8%
10%
12%
14%
16%
18%
District 1 District 2 District 3 District 4 District 5 District 6 District 7 District 8 District 9 District 10 Bexar Other Counties
Quarter 2: Residential Rebates per Council District
Residential AC - Central Residential AC Window Residential Airflow Residential Home Eff. Residential Refrigerator Solar H2O Solar PV Wash Right

Rebate Dollars ($) District 1 District 2 District 3 District 4 District 5 District 6 District 7 District 8 District 9 District 10 Bexar Other Total
HVAC $109,563 $29,468 $32,888 $56,775 $47,250 $60,764 $11,150 $529,988 $146,228 $33,682 $16,438 $117,720 $1,191,914LIGHTING $467,882 $947,129 $39,870 $214,281 $1,009,568 $55,435 $182,250 $59,249 $270,098 $151,366 $313,540 $231,928 $3,942,596MOTOR $48,425 $0 $0 $0 $0 $0 $0 $0 $73 $0 $0 $0 $48,498OTHER $0 $0 $0 $0 $0 $0 $0 $0 $0 $0 $0 $0 $0ROOF $2,230 $5,230 $971 $0 $0 $10,661 $0 $0 $702 $1,184 $0 $1,682 $22,660
$0 $0 $0 $0 $0 $0 $0 $0 $0 $0 $0 $0 $0Commercial Total $628,100 $981,827 $73,729 $271,056 $1,056,818 $126,860 $193,400 $589,237 $417,101 $186,232 $329,978 $351,330 $5,205,668
Residential - AC Central $40,325 $39,490 $19,098 $26,880 $9,070 $101,745 $112,170 $159,173 $275,491 $154,788 $346,628 $48,380 $1,333,238Residential - AC Window $47,950 $34,400 $57,350 $29,050 $61,250 $18,850 $28,650 $5,350 $6,600 $7,250 $32,150 $7,600 $336,450Residential - Airflow $13,824 $6,101 $4,268 $6,725 $0 $15,032 $20,090 $13,214 $33,964 $18,058 $18,875 $4,610 $154,761Residential - Home Eff. $13,104 $10,962 $7,705 $5,546 $2,710 $20,704 $15,613 $28,511 $61,037 $37,743 $73,998 $13,242 $290,875Residential - Refrigerator $4,860 $3,035 $4,515 $4,765 $1,895 $6,940 $8,435 $7,660 $12,475 $10,540 $20,280 $4,390 $89,790Solar - H2O $0 $0 $4,356 $0 $0 $13,068 $5,782 $1,452 $15,851 $10,219 $30,522 $6,065 $87,315Solar - PV $35,890 $142,289 $60,650 $54,341 $289,410 $61,585 $75,114 $552,236 $358,559 $352,262 $1,229,306 $482,053 $3,693,695Wash Right $225 $0 $0 $0 $0 $150 $225 $225 $300 $0 $300 $0 $1,425
Residential Total $156,178 $236,277 $157,942 $127,307 $364,335 $238,074 $266,079 $767,821 $764,277 $590,860 $1,752,059 $566,340 $5,987,549Total $784,278 $1,218,104 $231,671 $398,363 $1,421,153 $364,934 $459,479 $1,357,058 $1,181,378 $777,092 $2,082,037 $917,670 $11,193,217
CumulativeFeb 1, 2011 - Jan 31, 2012
Rebates $ by Council District
RESULTS HAVE NOT BEEN AUDITED. FINANCIAL INFORMATION CONTAINED WITHIN THE STEP QUARTERLY REPORT SOLELY REFLECTS THE REBATES ALLOCATED IN ACCORDANCE TO CPS ENERGY CUSTOMER DEMAND. THIS FINANCIAL INFORMATION IS ONLY A PORTION OF THE TOTAL STEP EXPENDITURES. ACTUAL STEP EXPENDITURES, CONFIRMED BY AN INDEPENDENT THIRD-PARTY, ARE STATED WITHIN THE ANNUAL STEP MEASUREMENT AND VERIFICATION (M&V) REPORT. THE INFORMATION AND DATA PROVIDED ON THE REPORT IS PROVIDED FOR REFERENCE PURPOSES ONLY AND IS PROVIDED TO THE USER OF THIS REPORT “AS IS” WITHOUT ANY WARRANTIES OF ANY TYPE, EXPRESS OR IMPLIED. CPS ENERGY DOES NOT WARRANT, REPRESENT OR GUARANTEE THAT THE INFORMATION OR DATA PROVIDED IN THIS REPORT IS CORRECT, ACCURATE OR FIT FOR ANY PARTICULAR USE OR PURPOSE BY USER OF THIS REPORT AS OF THE DATE THE REPORT IS PROVIDED TO USER OR OTHERWISE.
0%
5%
10%
15%
20%
25%
District 1 District 2 District 3 District 4 District 5 District 6 District 7 District 8 District 9 District 10 Bexar Other
Commercial Rebates ($) by Council District
WINDOW COATING ROOF OTHER MOTOR LIGHTING HVAC
Attachment - D
0%
5%
10%
15%
20%
25%
30%
35%
District 1 District 2 District 3 District 4 District 5 District 6 District 7 District 8 District 9 District 10 Bexar Other
Residential Rebates ($) by Council District
Solar PV Solar H2O Residential Refrigerator Residential Home Eff. Residential AC Window Residential AC - Central

Cumulative
Cumulative Total District 1
District 2
District 3
District 4
District 5
District 6
District 7
District 8
District 9
District 10
Bexar Other Counties
Total
HVAC 3 20 8 14 3 2 3 4 12 12 5 11 97LIGHTING 16 27 6 18 7 5 8 9 26 9 19 14 164MOTOR 1 0 0 0 0 0 0 0 1 0 0 0 2OTHER 0 0 0 0 0 0 0 0 0 0 0 0 0ROOF 2 2 2 0 0 1 0 0 1 1 0 5 14
0 0 0 0 0 0 0 0 0 0 0 0 0Commercial 22 49 16 32 10 8 11 13 40 22 24 30 277
Residential - AC Central 74 79 36 53 16 195 198 280 486 279 641 86 2423Residential - AC Window 557 396 656 340 704 228 340 64 84 89 379 90 3927Residential - Airflow 6 3 2 3 0 8 11 10 14 11 10 2 80Residential - Home Eff. 42 39 26 23 11 56 55 75 156 108 223 28 842Residential - Refrigerator 96 61 92 94 37 139 169 157 250 211 400 86 1792Solar - H2O 0 0 3 0 0 9 4 1 11 7 20 4 59Solar - PV 3 5 4 5 3 7 5 15 17 17 56 16 153Wash Right 3 0 0 0 0 2 3 3 4 0 4 0 19
Cumulative Total 803 632 835 550 781 652 796 618 1,062 744 1,757 342 9,572
HVAC 1.1% 7.2% 2.9% 5.1% 1.1% 0.7% 1.1% 1.4% 4.3% 4.3% 1.8% 4.0% 35.0%LIGHTING 5.8% 9.7% 2.2% 6.5% 2.5% 1.8% 2.9% 3.2% 9.4% 3.2% 6.9% 5.1% 59.2%MOTOR 0.4% 0.0% 0.0% 0.0% 0.0% 0.0% 0.0% 0.0% 0.4% 0.0% 0.0% 0.0% 0.7%OTHER 0.0% 0.0% 0.0% 0.0% 0.0% 0.0% 0.0% 0.0% 0.0% 0.0% 0.0% 0.0% 0.0%ROOF 0.7% 0.7% 0.7% 0.0% 0.0% 0.4% 0.0% 0.0% 0.4% 0.4% 0.0% 1.8% 5.1%WINDOW COATING 0.0% 0.0% 0.0% 0.0% 0.0% 0.0% 0.0% 0.0% 0.0% 0.0% 0.0% 0.0% 0.0%
Commercial 0.23% 0.51% 0.17% 0.33% 0.10% 0.08% 0.11% 0.14% 0.42% 0.23% 0.25% 0.31% 2.9%Residential AC Central 0.77% 0.83% 0.38% 0.55% 0.17% 2.04% 2.07% 2.93% 5.08% 2.91% 6.70% 0.90% 25.3%
Residential AC Window 5.82% 4.14% 6.85% 3.55% 7.35% 2.38% 3.55% 0.67% 0.88% 0.93% 3.96% 0.94% 41.0%Residential Airflow 0.06% 0.03% 0.02% 0.03% 0.00% 0.08% 0.11% 0.10% 0.15% 0.11% 0.10% 0.02% 0.8%
Residential Home Eff. 0.44% 0.41% 0.27% 0.24% 0.11% 0.59% 0.57% 0.78% 1.63% 1.13% 2.33% 0.29% 8.8%Residential Refrigerator 1.00% 0.64% 0.96% 0.98% 0.39% 1.45% 1.77% 1.64% 2.61% 2.20% 4.18% 0.90% 18.7%
Solar H2O 0.00% 0.00% 0.03% 0.00% 0.00% 0.09% 0.04% 0.01% 0.11% 0.07% 0.21% 0.04% 0.6%Solar PV 0.03% 0.05% 0.04% 0.05% 0.03% 0.07% 0.05% 0.16% 0.18% 0.18% 0.59% 0.17% 1.6%
Wash Right 0.03% 0.00% 0.00% 0.00% 0.00% 0.02% 0.03% 0.03% 0.04% 0.00% 0.04% 0.00% 0.2%Total 8.4% 6.6% 8.7% 5.7% 8.2% 6.8% 8.3% 6.5% 11.1% 7.8% 18.4% 3.6% 100.0%
Rebates by Council District SummaryFeb 1, 2011 - Jan 31, 2012
RESULTS HAVE NOT BEEN AUDITED. FINANCIAL INFORMATION CONTAINED WITHIN THE STEP QUARTERLY REPORT SOLELY REFLECTS THE REBATES ALLOCATED IN ACCORDANCE TO CPS ENERGY CUSTOMER DEMAND. THIS FINANCIAL INFORMATION IS ONLY A PORTION OF THE TOTAL STEP EXPENDITURES. ACTUAL STEP EXPENDITURES, CONFIRMED BY AN INDEPENDENT THIRD-PARTY, ARE STATED WITHIN THE ANNUAL STEP MEASUREMENT AND VERIFICATION (M&V) REPORT. THE INFORMATION AND DATA PROVIDED ON THE REPORT IS PROVIDED FOR REFERENCE PURPOSES ONLY AND IS PROVIDED TO THE USER OF THIS REPORT “AS IS” WITHOUT ANY WARRANTIES OF ANY TYPE, EXPRESS OR IMPLIED. CPS ENERGY DOES NOT WARRANT, REPRESENT OR GUARANTEE THAT THE INFORMATION OR DATA PROVIDED IN THIS REPORT IS CORRECT, ACCURATE OR FIT FOR ANY PARTICULAR USE OR PURPOSE BY USER OF THIS REPORT AS OF THE DATE THE REPORT IS PROVIDED TO USER OR OTHERWISE.
0%
2%
4%
6%
8%
10%
12%
14%
16%
18%
20%
District 1 District 2 District 3 District 4 District 5 District 6 District 7 District 8 District 9 District 10 Bexar Other Counties
Cumulative Total: Commercial Rebates per Council District
WINDOW COATING ROOF OTHER MOTOR LIGHTING HVAC
Attachment - E
0%
2%
4%
6%
8%
10%
12%
14%
16%
18%
20%
District 1 District 2 District 3 District 4 District 5 District 6 District 7 District 8 District 9 District 10 Bexar Other Counties
CumulativeTotal: Residential Rebates per Council District
Residential AC Central Residential AC Window Residential Airflow Residential Home Eff. Residential Refrigerator Solar H2O Solar PV

IH 37
LOOP 1604
FM 77
5
HWY 181
FM 1863
CR 101
SH 16
FM 1957 FM 1346
IH 35 S
FM 78
SH 46
HWY 90
FM 47
6
HWY 2
81
FM 30
09
W LOOP 1604 SLOOP 410
FM 3175
FM 1535
IH 10
FM 15
16
IH 35
SH 21
1
FM 1937
IH 35 N
FM 33
51
HWY 87
FM 1283
FM 536
HWY 81
FM 26
96
FM 2538
PRESA
FM 3487
FM 2790
FM 1518
E FM
1518
NNW LOOP 410
BEANE
FM 471
FM 15
60
LOOP 337
IH 10 W
FM 2537
OLD HWY 90
SH 16
S
FM 2252
AUSTIN HWY FM 1976
LOOP
1604 IH 35 N
LOOP
410 FM 1346
FM 2252FM 3009
IH 10
FM 2696FM 2696
FM 27
90
FM 471 LOOP
1604
SH 46
IH 10
LOOP 410
FM 78
LOOP
1604
HWY 90
FM 78
IH 35 S
IH 35
N
HWY 281
HWY 2
81
IH 35
S
IH 10
SH 16
LOOP
1604
HWY 87
SH 16
FM 1518
IH 10
FM 471
SH 211
LOOP 1
604
IH 37
SH 46
LOOP
410
IH 35 S
HWY 2
81
IH 10IH 35 N
FM 33
51
IH 10
IH 35 N
FM 476
SH 211IH 35 S
IH 35 S
HWY 281
SH 16
SH 16
03 JENNIFER V RAMOS
06 RAY LOPEZ
09 ELISA CHAN
02 IVY R TAYLOR
04 PHILLIP A CORTEZ
10 JOHN G CLAMP08 W. REED WILLIAMS
05 DAVID MEDINA JR
4
Council District Rebate Locations 2011Q2
LegendComm HVACComm LightingComm MotorComm RoofRes - Air FlowRes - Central AC/Heat PumpRes - Home EfficiencyRes - Refrigerator Recycling RebateRes - Solar H2ORes - Solar PVRes - Window AC
City Council District01020304050607080910
This information and data provided on this map are provided "AS IS" and without any warranties of any type, expressed or implied, by CPS Energy. CPS does not warrant, representor guarantee that the information or data provided on this map is correct, accurate or fit for any particular purposes.

IH 37
LOOP 1604
FM 77
5
FM 1346
HWY 181
FM 1957
CR 101
IH 35 S
IH 35 N
FM 78
FM 1863
SH 46
HWY 90
FM 47
6
SH 16
SH 21
1
FM 3009
W LOOP 1604 SLOOP 410
FM 3175
FM 1535
IH 10
FM 15
16
IH 35
FM 1937
FM 33
51
HWY 2
81
HWY 87
FM 1283
FM 536
HWY 81
FM 26
96
FM 3487
FM 2790
FM 1518
E FM
1518
N
NW LOOP 410
BEANE
FM 471
FM 2538
FM 15
60
LOOP 337
IH 10 WOLD HWY 90
SH 16
S
FM 2252
PRESA
AUSTIN HWY
FM 2536
FM 1976
FM 3009
SH 16
HWY 90
IH 35 N
IH 35 S
SH 211
IH 10
HWY 2
81
IH 10
LOOP
410
FM 2696
LOOP
1604
HWY 87
HWY 2
81
LOOP
1604
HWY 181
LOOP 1
604
IH 10 FM 2252
HWY 90
SH 46
FM 33
51SH 46
IH 35 S
LOOP 410
IH 35 S
LOOP 1604
FM 471
IH 37
IH 10
SH 16
FM 78
LOOP 410 LOOP
1604
IH 35 N
IH 10
IH 35
S
IH 10IH 10
SH 16
HWY 2
81
IH 35 S
IH 35
N
FM 1863
LOOP
410
HWY 87
FM 27
90
SH 16
IH 10 FM 2696FM
471
4
Median Income Rebate Locations 2011Q2
LegendComm HVACComm LightingComm MotorComm RoofRes - Air FlowRes - Central AC/Heat PumpRes - Home EfficiencyRes - Refrigerator Recycling RebateRes - Solar H2ORes - Solar PVRes - Window AC
Median Income> $50,000$40,001 - $50,000$30,001 - $40,000$25,000 - $30,000< $25,000No Data
The information and data provided on this map are provided "AS IS" and without warranties of any type, expressed or implied, by CPS Energy. CPS does notwarrant, represent or guarantee that the information or data provided on this map is correct, accurate or fit for any particular purpose.