NCTM 2017 - Our Algebra 1 Gradebooks Hold the Key to...
19
Our Algebra 1 Gradebooks Hold the Key to Equity & Access: Assessing Proficiency without Percentages Dr. Tim Hudson, DreamBox Learning VP of Learning [email protected] @DocHudsonMath NCTM, April 6, 2017, San Antonio, TX 1 Our Algebra 1 Gradebooks Hold the Key to Equity & Access: Assessing Proficiency without Percentages Tim Hudson, PhD Vice President of Learning @DocHudsonMath NCTM 2017 Grading policies are overlooked as a leading cause of inequity because the ways they disadvantage students are unintentional and hard to detect. We’ll discuss ways to: • Report proficiency without percentages • Improve achievement and differentiation Access & Equity The final exam for Math 96 [“developmental math”] would make up 35 percent of the total grade, and as the day of the test approached, Mr. de Jesus knew that with the demerits he would face for his poor attendance and his unfinished homework, there was little chance he would pass. On the morning of the exam, he didn’t show up, and he failed the class for the third time. As it happened, more than 40 percent of the students in the class also failed. Community College Students Face a Very Long Road to Graduation by Ginia Bellafonte, NY Times, October 5, 2014 Meet your Neighbor 1.To what extent do these features of the grading system limit opportunity, equity, and access? 2. What’s the worst assessment practice you experienced as a student? Was it unfair? Inequitable? Demotivating? Why?
Transcript of NCTM 2017 - Our Algebra 1 Gradebooks Hold the Key to...

Our Algebra 1 Gradebooks Hold the Key to Equity & Access: Assessing Proficiency without Percentages
Dr. Tim Hudson, DreamBox Learning VP of Learning [email protected]
@DocHudsonMath
NCTM, April 6, 2017, San Antonio, TX 1
Our Algebra 1 Gradebooks Hold the Key to Equity & Access:
Assessing Proficiency without Percentages
Tim Hudson, PhD Vice President of Learning
@DocHudsonMath
NCTM 2017
Grading policies are overlooked as a leading cause of inequity because the ways they disadvantage students are unintentional and hard to detect. We’ll discuss ways to: • Report proficiency without percentages • Improve achievement and differentiation
Access & Equity
The final exam for Math 96 [“developmental math”] would make up 35 percent of the total grade, and as the day of the test approached, Mr. de Jesus knew that
with the demerits he would face for his poor attendance and his unfinished homework, there was
little chance he would pass. On the morning of the exam, he didn’t show up, and he failed the class for the third time. As it happened, more than 40 percent
of the students in the class also failed. Community College Students Face a Very Long Road to Graduation by Ginia Bellafonte, NY Times, October 5, 2014
Meet your Neighbor 1. To what extent do these features of the grading system
limit opportunity, equity, and access? 2. What’s the worst assessment practice you experienced
as a student? Was it unfair? Inequitable? Demotivating? Why?

Our Algebra 1 Gradebooks Hold the Key to Equity & Access: Assessing Proficiency without Percentages
Dr. Tim Hudson, DreamBox Learning VP of Learning [email protected]
@DocHudsonMath
NCTM, April 6, 2017, San Antonio, TX 2
• Over-weighted final exam. • Likely use of arithmetic mean. • Penalties unrelated to content achievement
• Attendance is not a proxy for understanding • A zero means evidence of learning was not collected
• 1 student failing 3 times • 40% of students failing in a single term
Failure by Design “Collegiate level developmental math is truly
where dreams go to die.” – Paul LaMahieu
• Especially at the MS and HS levels, grading policies impact access to challenging courses and equitable learning opportunities.
• At a time when large numbers of students are failing both high school and community college mathematics courses, many teachers use inequitable grading practices such as:
• using arithmetic means, • disallowing test retakes, • and including non-math related factors into student grades.
• Better reporting ensures better progress monitoring and more strategic, targeted differentiation.
Access & Equity
I have an 89.4%. Can I do some extra work
to get an 89.5% so it’ll round up to an A?
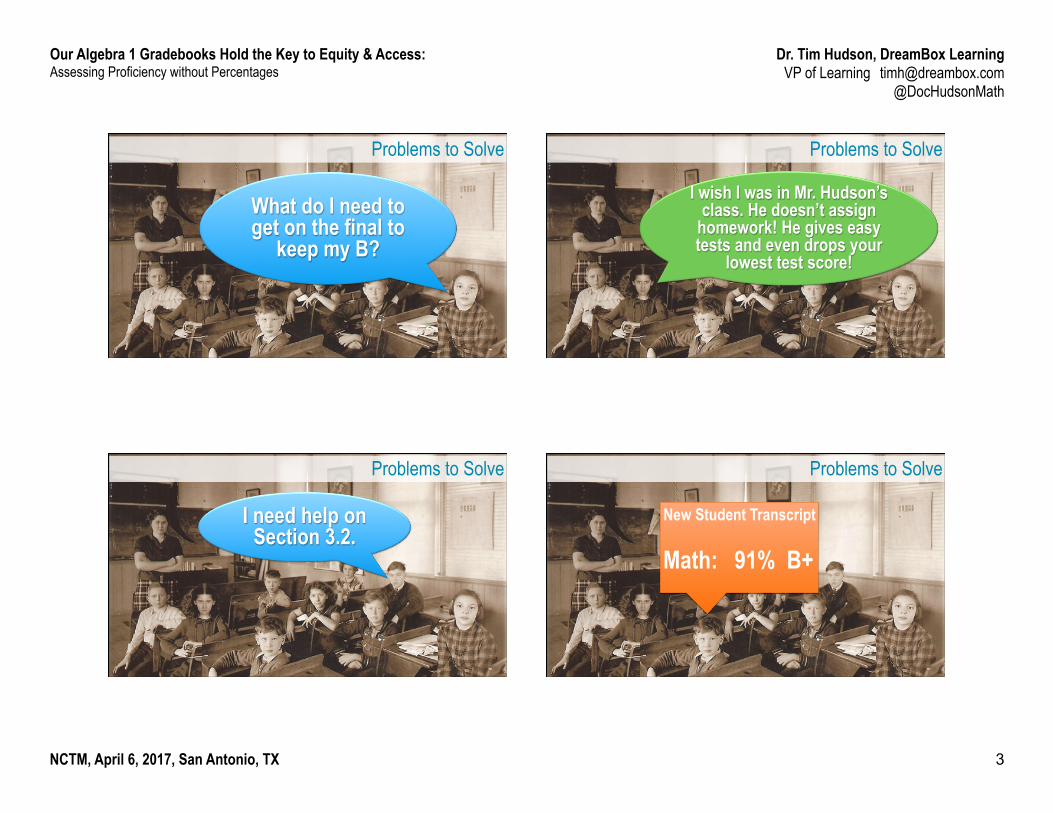
Problems to Solve
Our Algebra 1 Gradebooks Hold the Key to Equity & Access: Assessing Proficiency without Percentages
Dr. Tim Hudson, DreamBox Learning VP of Learning [email protected]
@DocHudsonMath
NCTM, April 6, 2017, San Antonio, TX 3
What do I need to get on the final to
keep my B?
Problems to Solve
I wish I was in Mr. Hudson’s class. He doesn’t assign
homework! He gives easy tests and even drops your
lowest test score!
Problems to Solve
I need help on Section 3.2.
Problems to Solve Problems to Solve
New Student Transcript Math: 91% B+
Our Algebra 1 Gradebooks Hold the Key to Equity & Access: Assessing Proficiency without Percentages
Dr. Tim Hudson, DreamBox Learning VP of Learning [email protected]
@DocHudsonMath
NCTM, April 6, 2017, San Antonio, TX 4
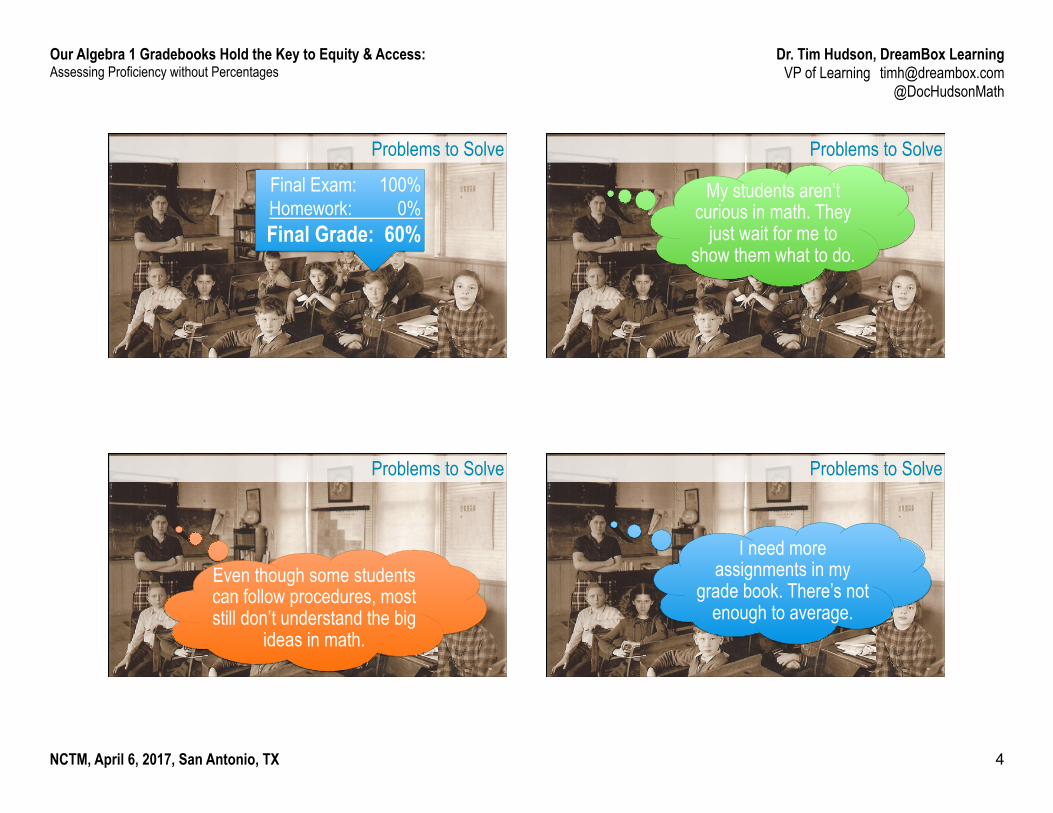
Problems to Solve
Final Exam: 100% Homework: 0% Final Grade: 60%
Problems to Solve
My students aren’t curious in math. They
just wait for me to show them what to do.
Problems to Solve
Even though some students can follow procedures, most still don’t understand the big
ideas in math.
Problems to Solve
I need more assignments in my
grade book. There’s not enough to average.

Our Algebra 1 Gradebooks Hold the Key to Equity & Access: Assessing Proficiency without Percentages
Dr. Tim Hudson, DreamBox Learning VP of Learning [email protected]
@DocHudsonMath
NCTM, April 6, 2017, San Antonio, TX 5
We assess and report the
Wrong Goals for students in math
What are the RIGHT Goals? What is mathematics?
What are a mathematician’s habits of mind and dispositions?
What is a school math program “in business” to accomplish?
We give
Poor Feedback to students in math
What is QUALITY Feedback?
What percentage did your doctor give you at your most recent
routine check-up?

Our Algebra 1 Gradebooks Hold the Key to Equity & Access: Assessing Proficiency without Percentages
Dr. Tim Hudson, DreamBox Learning VP of Learning [email protected]
@DocHudsonMath
NCTM, April 6, 2017, San Antonio, TX 6
Wrong Goals + Poor Feedback Low Achievement
Math gradebooks are recording & reporting
the wrong things.
xkcd.com/937 h/t @fnoschese
Gradebooks Reporting the Wrong Thing
Comparing Course Grades to End of Course Exams Below Basic Basic Proficient Advanced
Algebra
1A Grade
7 1%
94 18%
303 58%
118 23%
A 0 0 57 49 B 1 20 116 40 C 1 31 83 20 D 3 32 33 8 F 2 11 14 1
Below Basic Basic Proficient Advanced
Algebra
1B Grade
68 18%
220 59%
84 23%
2 0.5%
A 2 18 23 1 B 6 61 28 0 C 16 60 22 1 D 23 63 6 0 F 21 18 5 0
Our Algebra 1 Gradebooks Hold the Key to Equity & Access: Assessing Proficiency without Percentages
Dr. Tim Hudson, DreamBox Learning VP of Learning [email protected]
@DocHudsonMath
NCTM, April 6, 2017, San Antonio, TX 7
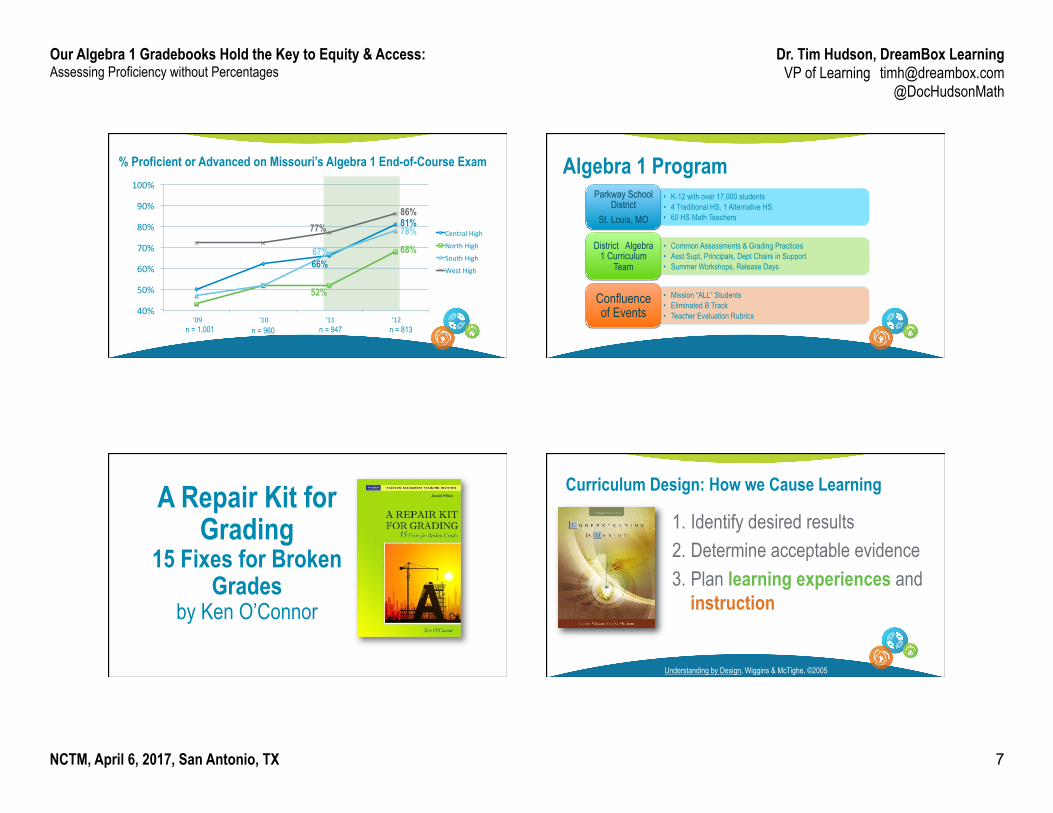
66%
81%
52%
68% 67%
78% 77% 86%
40%
50%
60%
70%
80%
90%
100%
'09 '10 '11 '12
Central High
North High
South High
West High
% Proficient or Advanced on Missouri’s Algebra 1 End-of-Course Exam
n = 1,001 n = 960 n = 947 n = 813
Algebra 1 Program • K-12 with over 17,000 students • 4 Traditional HS, 1 Alternative HS • 60 HS Math Teachers
Parkway School District
St. Louis, MO
• Common Assessments & Grading Practices • Asst Supt, Principals, Dept Chairs in Support • Summer Workshops, Release Days
District Algebra 1 Curriculum
Team
• Mission “ALL” Students • Eliminated B Track • Teacher Evaluation Rubrics
Confluence of Events
A Repair Kit for Grading
15 Fixes for Broken Grades
by Ken O’Connor
1. Identify desired results 2. Determine acceptable evidence 3. Plan learning experiences and
instruction
Curriculum Design: How we Cause Learning
Understanding by Design, Wiggins & McTighe, ©2005

Our Algebra 1 Gradebooks Hold the Key to Equity & Access: Assessing Proficiency without Percentages
Dr. Tim Hudson, DreamBox Learning VP of Learning [email protected]
@DocHudsonMath
NCTM, April 6, 2017, San Antonio, TX 8
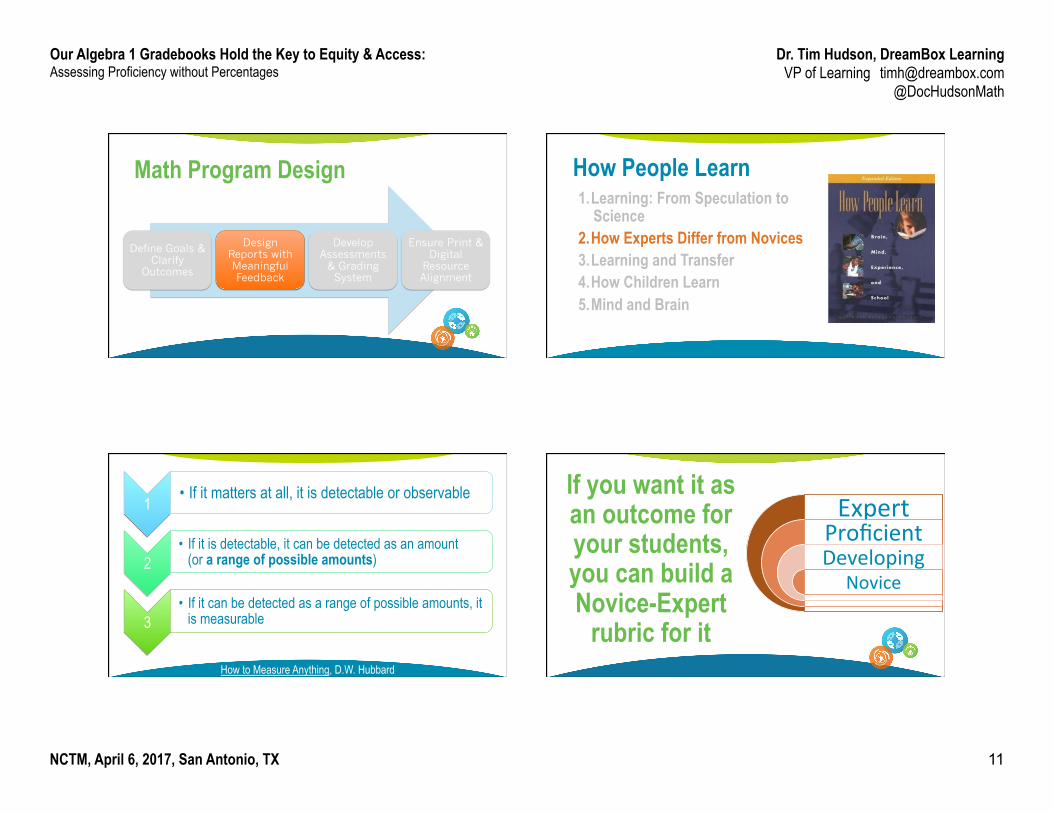
Math Program Design
Define Goals & Clarify
Outcomes
Design Reports with Meaningful Feedback
Develop Assessments
& Grading System
Ensure Print & Digital
Resource Alignment
1 2 3
Math Program Design
Define Goals & Clarify
Outcomes
Design Reports with Meaningful Feedback
Develop Assessments
& Grading System
Ensure Print & Digital
Resource Alignment
Learning Outcomes: A-M-T Acquire
Knowledge and Skills
Make Meaning Transfer
© Authentic Education
Learning Outcomes: A-M-T Acquire
Knowledge and Skills
Information
Facts
Procedures
Make Meaning Concepts
Ideas
Contexts
Situations
Transfer
Independent Use
Unfamiliar Situations
© Authentic Education
Our Algebra 1 Gradebooks Hold the Key to Equity & Access: Assessing Proficiency without Percentages
Dr. Tim Hudson, DreamBox Learning VP of Learning [email protected]
@DocHudsonMath
NCTM, April 6, 2017, San Antonio, TX 9
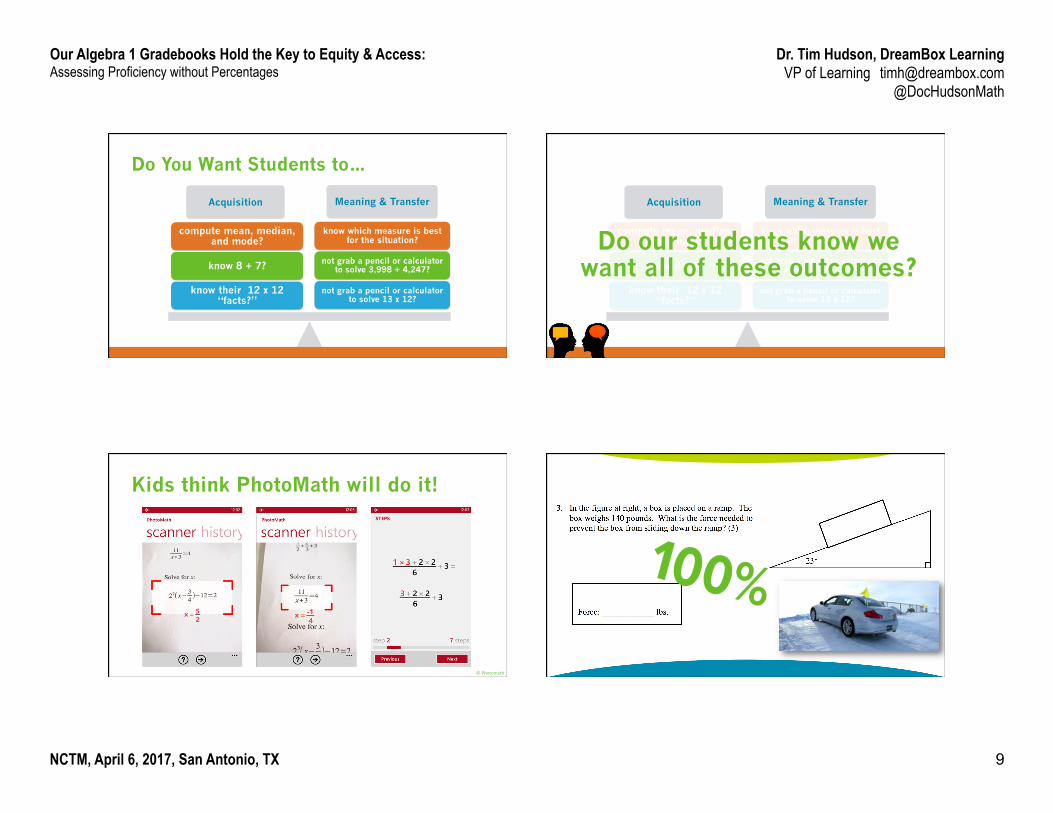
Do You Want Students to…
Acquisition Meaning & Transfer
not grab a pencil or calculator to solve 13 x 12?
not grab a pencil or calculator to solve 3,998 + 4,247?
know which measure is best for the situation?
know their 12 x 12 “facts?”
know 8 + 7?
compute mean, median, and mode?
Acquisition Meaning & Transfer
not grab a pencil or calculator to solve 13 x 12?
not grab a pencil or calculator to solve 3,998 + 4,247?
know which measure is best for the situation?
know their 12 x 12 “facts?”
know 8 + 7?
compute mean, median, and mode? Do our students know we
want all of these outcomes?
Kids think PhotoMath will do it!
© Photomath
100%

Our Algebra 1 Gradebooks Hold the Key to Equity & Access: Assessing Proficiency without Percentages
Dr. Tim Hudson, DreamBox Learning VP of Learning [email protected]
@DocHudsonMath
NCTM, April 6, 2017, San Antonio, TX 10
Skills Understanding
Understanding Skill
Skill
Skill
What grade does get?
Better Goals for Students David Bressoud, Mathematical Association of America (www.maa.org/columns):
“If computers can solve [math] problems so efficiently, why do we
drill our students in answering them?”
http://www.maa.org/external_archive/columns/launchings/launchings_08_09.html
Better Goals for Students David Bressoud, Mathematical Association of America (www.maa.org/columns):
“If a student feels that she or he has learned nothing that cannot be pulled directly from Wolfram|Alpha, then the
course really has been a waste of time.”
http://www.maa.org/external_archive/columns/launchings/launchings_08_09.html
Our Algebra 1 Gradebooks Hold the Key to Equity & Access: Assessing Proficiency without Percentages
Dr. Tim Hudson, DreamBox Learning VP of Learning [email protected]
@DocHudsonMath
NCTM, April 6, 2017, San Antonio, TX 11
Math Program Design
Define Goals & Clarify
Outcomes
Design Reports with Meaningful Feedback
Develop Assessments
& Grading System
Ensure Print & Digital
Resource Alignment
How People Learn 1. Learning: From Speculation to
Science 2. How Experts Differ from Novices 3. Learning and Transfer 4. How Children Learn 5. Mind and Brain
How to Measure Anything, D.W. Hubbard
1 • If it matters at all, it is detectable or observable
2 • If it is detectable, it can be detected as an amount
(or a range of possible amounts)
3 • If it can be detected as a range of possible amounts, it
is measurable
If you want it as an outcome for your students, you can build a Novice-Expert
rubric for it
Expert Proficient Developing
Novice

Our Algebra 1 Gradebooks Hold the Key to Equity & Access: Assessing Proficiency without Percentages
Dr. Tim Hudson, DreamBox Learning VP of Learning [email protected]
@DocHudsonMath
NCTM, April 6, 2017, San Antonio, TX 12
Term-Long Reporting Rubrics Should Communicate
Summative Report
Description of the student’s performance.
What the student can do independently.
What the student can do consistently.
Description of the student’s habits over
time.
What the student can do
to improve.
A Rubric for Thought Expert Practitioner Apprentice Novice
Inquiry Knowledge Acquisition
Problem Solving Communication
Reflection
Teaching What Matters Most by Strong, Silver, and Perini, © 2001, p. 58
Inquiry Rubric Expert Practitioner Developing Novice
Can formulate questions and seek answers independently; generates, tests, and refines hypotheses according to well-formulated criteria; uses evidence powerfully and persuasively; foresees and responds to counterarguments.
Looks for and uses questions to guide investigation; uses criteria to generate hypotheses; uses evidence effectively, but may fail to fully address counterarguments
Can use pre-drafted questions to direct investigation but needs help formulating her own; may have trouble telling quality hypotheses apart from guesses; substantiates some claims; pays little attention to counterarguments
Fails to look for questions to guide investigation; generates hypotheses haphazardly; fails to use evidence to substantiate claims
Teaching What Matters Most by Strong, Silver, and Perini, © 2001, p. 58
Problem Solving Rubric Expert Practitioner Developing Novice
Is constantly looking for and posing relevant questions. Experiments with a variety of solutions and perspectives
Understands there is more than one way to attack a problem Surveys own understanding to determine progress toward solution
Accepts problems on their own terms (e.g., rarely restates them to make them more meaningful); Often generates only one or two obvious solutions
Avoids difficult problems & rarely questions ideas Looks for convenient solutions
Teaching What Matters Most by Strong, Silver, and Perini, © 2001, p. 58

Our Algebra 1 Gradebooks Hold the Key to Equity & Access: Assessing Proficiency without Percentages
Dr. Tim Hudson, DreamBox Learning VP of Learning [email protected]
@DocHudsonMath
NCTM, April 6, 2017, San Antonio, TX 13
Transfer: Measures of Central Tendency Expert Proficient Developing Novice
Apply new and unfamiliar statistical measures (or invent new ones) to make predictions and draw conclusions.
Justify the most appropriate statistical measures of center to make predictions and draw conclusions.
Apply mean, median, mode, and range to solve problems and make predictions. (MO State Standard)
Compute mean, median, mode, and range given a data set.
Meaning Making: Function Properties Expert Proficient Developing Novice
Given tables, graphs, or equations of unfamiliar non-linear functions, determine and define properties of those functions.
Given a table, graph, or equation, classify a function as linear, quadratic, or exponential and justify your answer.
Given a table, graph, or equation, classify a function as linear or non-linear and justify your answer. (MO State Standard)
Given a table or graph, classify a relationship as a function or non-function and justify your answer.
Acquisition (Skill): Factoring Polynomials Expert Proficient Developing Novice
Factor polynomials with more than three terms, more than one variable, or a degree higher than two.
Completely factor any given quadratic expression. (MO State Standard)
Factor trinomials with a leading coefficient of one.
Factor out a Greatest Common Factor (GCF) from any polynomial.
* The codes in bold, such as N1A, are the Missouri state Course Level Expectations (CLE) for Algebra 1 page 1
High School Algebra 1 Rubric, First Semester, 2011-12, Parkway Schools (rev. 10/11)
Standard Expert Proficient Developing Novice
1. Represent Relationships (Creating Mathematical Models)
Translate quickly and fluently between contexts, tables, graphs, and equations. Select the best representation of a problem in context based on audience and purpose.
1.1 Meaningfully and mathematically represent a contextual situation in multiple ways. Represent a problem in context with a data table, graph, and equation (linear, quadratic, and exponential).
Translate an equation into a graph.
Translate data in a table into a graph. Translate an equation or a graph into a data table.
Compare all real numbers and place them on a number line.
1.2 Represent, compare, and order rational and irrational numbers, including approximate locations on a number line. N1A*
Place numbers on a number line and write inequalities if they are all in the same format (i.e., decimals, fractions), if they have the same denominator or the same number of decimal places.
Place numbers on a number line and write inequalities if the numbers are all in the same format (either whole numbers, decimals to two places, or simple fractions).
2. Identify Relationships (Classifying Mathematical Models)
Given tables, graphs, or equations of unfamiliar non-linear functions, determine and define properties of those functions.
2.1 Given a table, graph, or equation, classify a function as linear, quadratic, or exponential and justify your answer.
Given a table, graph, or equation, classify a function as linear or non-linear and justify your answer. A1D
Given a table or graph, classify a relationship as a function or non-function and justify your answer.
Determine several models (including unfamiliar, non-linear functions) that might represent a given situation. Of those options, justify the model that best represents the situation.
2.2 Determine the type(s) of functions (linear, quadratic, or exponential) that might model a given situation. Of those options, justify the type of function that best models the situation. A3A
Explain the similarities and differences of tables, graphs, or equations of linear, quadratic, and exponential relationships. A1C
Explain the similarities and differences in the tables or graphs of linear and non-linear functions.
3. Analyze Relationships (Making Predictions with Mathematical Models)
Justify the relevant domain and range of any relationship from context.
3.1 Justify the relevant domain and range of a linear, quadratic, or exponential relationship from context.
Determine the domain and range of a relationship from an equation or graph.
Determine the domain and range of relationships given a table.
Generate an equation that might model a given situation that appears to be linear and use it to make predictions about future data.
3.2 Consider multiple equations that might model a situation. Select and justify the best model for predicting the relationship.
Make and justify predictions about a relationship when given a table.
Make and justify predictions about a relationship when given a graph, including scatter plots. D3A
Apply new and unfamiliar statistical measures to make predictions and draw conclusions.
3.3 Justify the most appropriate statistical measures of center to make predictions and draw conclusions.
Apply mean, median, mode, and range to solve problems and make predictions. D2A
Find the mean, median, mode, and range of a set of numbers.

Our Algebra 1 Gradebooks Hold the Key to Equity & Access: Assessing Proficiency without Percentages
Dr. Tim Hudson, DreamBox Learning VP of Learning [email protected]
@DocHudsonMath
NCTM, April 6, 2017, San Antonio, TX 14
Standard Expert Proficient Developing Novice
Algebra 1 Rubric, First Semester, Parkway Schools, 2011-12 (rev. 10/11) page 2
4. Operate on Polynomials
Apply additional operations on polynomials, including division, negative exponents, fractional exponents, or powers raised to a power.
4.1 Perform exponent operations, addition, subtraction, and multiplication on polynomials. A2B
Multiply a monomial by any polynomial and a binomial by a binomial.
Add and subtract polynomials.
Factor polynomials with more than three terms, more than one variable, or a degree higher than two.
4.2 Completely factor any given quadratic expression. A2B
Factor trinomials with a leading coefficient of one.
Factor out a Greatest Common Factor (GCF) from any polynomial.
5. Interpret and Create Graphs
Identify and interpret the intercepts, rate of change, and maximum and minimum of any function when given a table or a graph.
5.1 Identify and interpret the intercepts, rate of change, and maximum and minimum of any linear, quadratic, and exponential functions when given a table or a graph. A4A
Identify and interpret the rate of change of linear and exponential functions when given a table.
Identify the intercepts of any function when given a graph as well as maximums and minimums when applicable.
Sketch a quick graph of any polynomial function when given its equation.
5.2 Sketch quick graphs of linear, quadratic, and exponential functions from equations in various forms.
Find intercepts given the equations of linear, exponential, and quadratic functions.
Find the maximum or minimum of a quadratic function given its equation.
* The codes in bold, such as N1A, are the Missouri state Course Level Expectations (CLE) for Algebra 1 page 1
High School Algebra 1 Rubric, First Semester, 2011-12, Parkway Schools (rev. 10/11)
Standard Expert Proficient Developing Novice
1. Represent Relationships (Creating Mathematical Models)
Translate quickly and fluently between contexts, tables, graphs, and equations. Select the best representation of a problem in context based on audience and purpose.
1.1 Meaningfully and mathematically represent a contextual situation in multiple ways. Represent a problem in context with a data table, graph, and equation (linear, quadratic, and exponential).
Translate an equation into a graph.
Translate data in a table into a graph. Translate an equation or a graph into a data table.
Compare all real numbers and place them on a number line.
1.2 Represent, compare, and order rational and irrational numbers, including approximate locations on a number line. N1A*
Place numbers on a number line and write inequalities if they are all in the same format (i.e., decimals, fractions), if they have the same denominator or the same number of decimal places.
Place numbers on a number line and write inequalities if the numbers are all in the same format (either whole numbers, decimals to two places, or simple fractions).
2. Identify Relationships (Classifying Mathematical Models)
Given tables, graphs, or equations of unfamiliar non-linear functions, determine and define properties of those functions.
2.1 Given a table, graph, or equation, classify a function as linear, quadratic, or exponential and justify your answer.
Given a table, graph, or equation, classify a function as linear or non-linear and justify your answer. A1D
Given a table or graph, classify a relationship as a function or non-function and justify your answer.
Determine several models (including unfamiliar, non-linear functions) that might represent a given situation. Of those options, justify the model that best represents the situation.
2.2 Determine the type(s) of functions (linear, quadratic, or exponential) that might model a given situation. Of those options, justify the type of function that best models the situation. A3A
Explain the similarities and differences of tables, graphs, or equations of linear, quadratic, and exponential relationships. A1C
Explain the similarities and differences in the tables or graphs of linear and non-linear functions.
3. Analyze Relationships (Making Predictions with Mathematical Models)
Justify the relevant domain and range of any relationship from context.
3.1 Justify the relevant domain and range of a linear, quadratic, or exponential relationship from context.
Determine the domain and range of a relationship from an equation or graph.
Determine the domain and range of relationships given a table.
Generate an equation that might model a given situation that appears to be linear and use it to make predictions about future data.
3.2 Consider multiple equations that might model a situation. Select and justify the best model for predicting the relationship.
Make and justify predictions about a relationship when given a table.
Make and justify predictions about a relationship when given a graph, including scatter plots. D3A
Apply new and unfamiliar statistical measures to make predictions and draw conclusions.
3.3 Justify the most appropriate statistical measures of center to make predictions and draw conclusions.
Apply mean, median, mode, and range to solve problems and make predictions. D2A
Find the mean, median, mode, and range of a set of numbers.
Imagine sharing this
level of insight with a parent
or receiving this level of detail when a new
student transfers into your class.
• Avoid negatives: “The student CAN’T…” • Share with students & parents up front • Expected to be Novice at the start?
Yes for content (i.e., parabolas, algorithms) No for process (i.e., inquiry, problem solving, Common Core SMPs)
• These are not meant to create “ability groups.” Engage rich tasks together.
Key Points Math Program Design
Define Goals & Clarify
Outcomes
Design Reports with Meaningful Feedback
Develop Assessments
& Grading System
Ensure Print & Digital
Resource Alignment
Our Algebra 1 Gradebooks Hold the Key to Equity & Access: Assessing Proficiency without Percentages
Dr. Tim Hudson, DreamBox Learning VP of Learning [email protected]
@DocHudsonMath
NCTM, April 6, 2017, San Antonio, TX 15
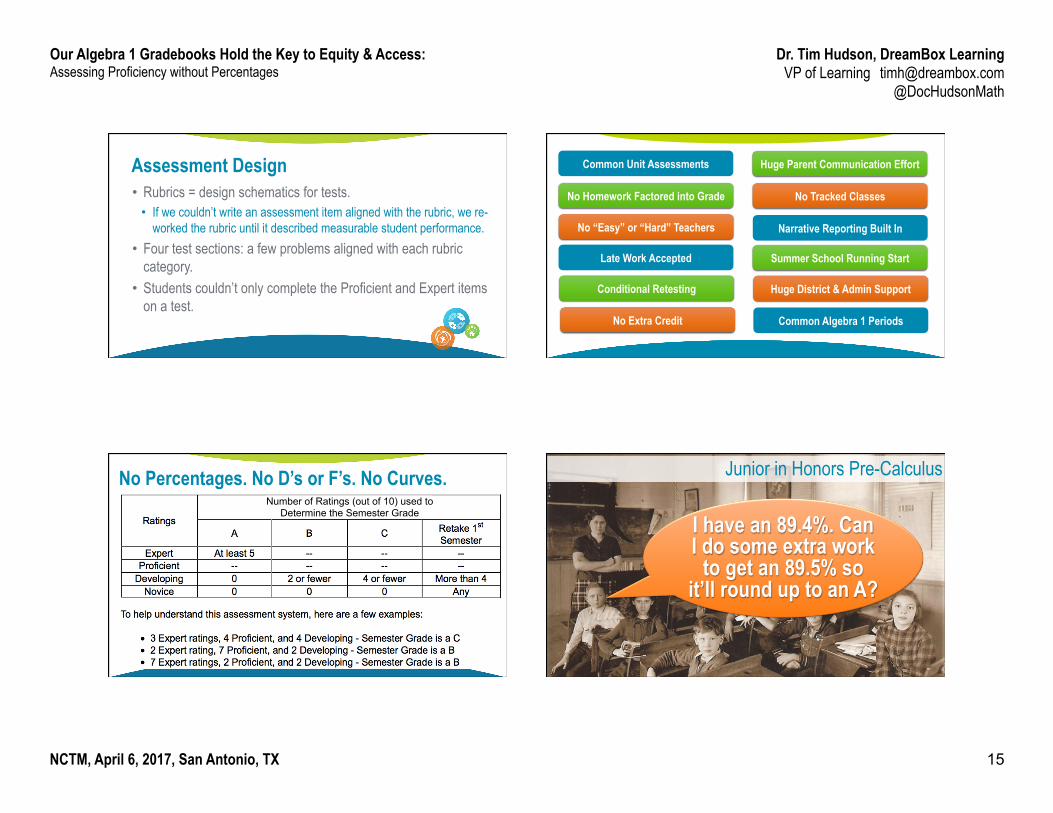
Assessment Design • Rubrics = design schematics for tests.
• If we couldn’t write an assessment item aligned with the rubric, we re-worked the rubric until it described measurable student performance.
• Four test sections: a few problems aligned with each rubric category.
• Students couldn’t only complete the Proficient and Expert items on a test.
Common Unit Assessments
No Homework Factored into Grade
No “Easy” or “Hard” Teachers
Late Work Accepted
Conditional Retesting
No Extra Credit
Huge Parent Communication Effort
No Tracked Classes
Narrative Reporting Built In
Summer School Running Start
Huge District & Admin Support
Common Algebra 1 Periods
No Percentages. No D’s or F’s. No Curves. Number of Ratings (out of 10) used to
Determine the Semester Grade I have an 89.4%. Can I do some extra work
to get an 89.5% so it’ll round up to an A?
Junior in Honors Pre-Calculus

Our Algebra 1 Gradebooks Hold the Key to Equity & Access: Assessing Proficiency without Percentages
Dr. Tim Hudson, DreamBox Learning VP of Learning [email protected]
@DocHudsonMath
NCTM, April 6, 2017, San Antonio, TX 16
“I know I can compute mean, median, and
mode, but I really don’t know which one is best.
Can you help me understand how to pick?”
Freshman in Algebra 1
When you change the assessment and reporting system, you change the
conversation with students.
Novice Developing Proficient Expert Total
Number of Items Completely Correct
Number of Total Items 5 5 3 2 15
Alternate Approach; 15-item Test First Trimester # Correct Items 30 Total Test Items
4 Expert 6 Proficient
10 Developing 10 Novice
Combined Number of Proficient AND Expert
Items Completely Correct (out of 10)
10 9 7-8 5-6 3-4 < 3
Combined Number of Novice AND
Developing Items Completely Correct
(out of 20)
18-20 A A B B C N
16-17 A B B C C N
14-15 B B C C N N
12-13 B C C N N N
10-11 C C N N N N
< 10 N N N N N N
Our Algebra 1 Gradebooks Hold the Key to Equity & Access: Assessing Proficiency without Percentages
Dr. Tim Hudson, DreamBox Learning VP of Learning [email protected]
@DocHudsonMath
NCTM, April 6, 2017, San Antonio, TX 17
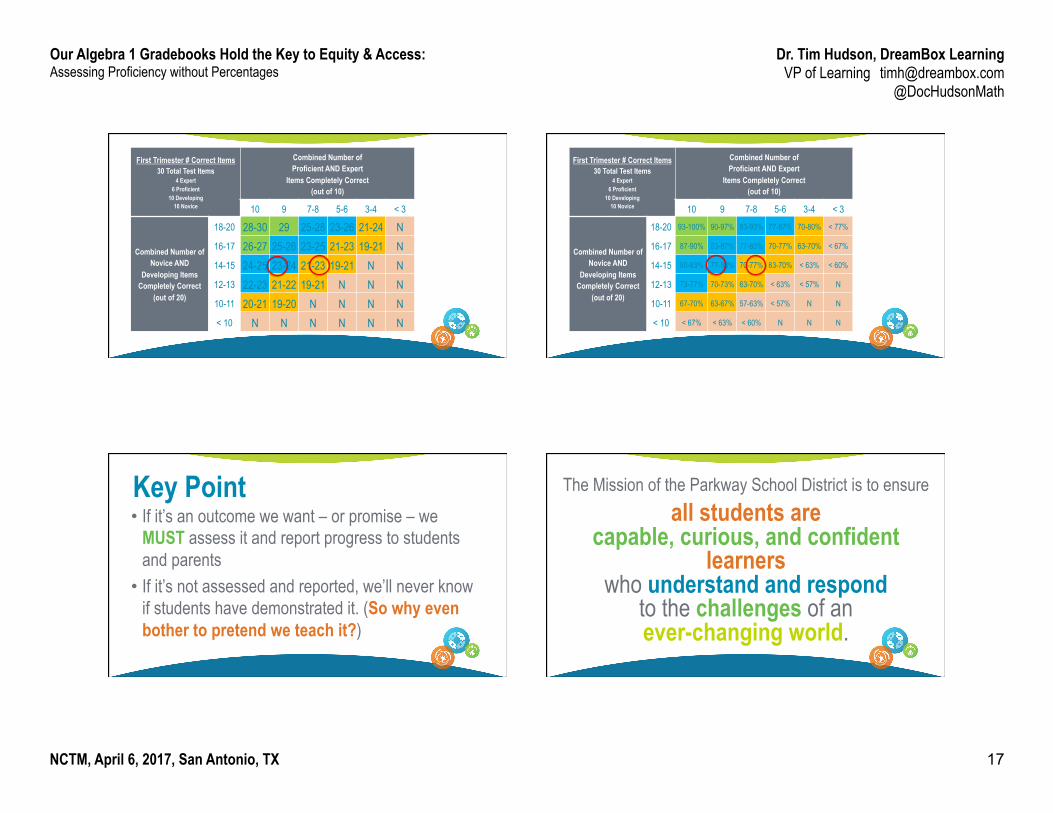
First Trimester # Correct Items 30 Total Test Items
4 Expert 6 Proficient
10 Developing 10 Novice
Combined Number of Proficient AND Expert
Items Completely Correct (out of 10)
10 9 7-8 5-6 3-4 < 3
Combined Number of Novice AND
Developing Items Completely Correct
(out of 20)
18-20 28-30 29 25-28 23-26 21-24 N
16-17 26-27 25-26 23-25 21-23 19-21 N
14-15 24-25 23-24 21-23 19-21 N N
12-13 22-23 21-22 19-21 N N N
10-11 20-21 19-20 N N N N
< 10 N N N N N N
First Trimester # Correct Items 30 Total Test Items
4 Expert 6 Proficient
10 Developing 10 Novice
Combined Number of Proficient AND Expert
Items Completely Correct (out of 10)
10 9 7-8 5-6 3-4 < 3
Combined Number of Novice AND
Developing Items Completely Correct
(out of 20)
18-20 93-100% 90-97% 83-93% 77-87% 70-80% < 77%
16-17 87-90% 83-87% 77-83% 70-77% 63-70% < 67%
14-15 80-83% 77-80% 70-77% 63-70% < 63% < 60%
12-13 73-77% 70-73% 63-70% < 63% < 57% N
10-11 67-70% 63-67% 57-63% < 57% N N
< 10 < 67% < 63% < 60% N N N
• If it’s an outcome we want – or promise – we MUST assess it and report progress to students and parents
• If it’s not assessed and reported, we’ll never know if students have demonstrated it. (So why even bother to pretend we teach it?)
Key Point The Mission of the Parkway School District is to ensure
all students are capable, curious, and confident
learners who understand and respond
to the challenges of an ever-changing world.

Our Algebra 1 Gradebooks Hold the Key to Equity & Access: Assessing Proficiency without Percentages
Dr. Tim Hudson, DreamBox Learning VP of Learning [email protected]
@DocHudsonMath
NCTM, April 6, 2017, San Antonio, TX 18
Transfer: Curious Learners Expert Proficient Developing Novice
I regularly ask insightful questions both inside and outside of class that extend the conversation and learning into new areas and imagine new connections.
When I am presented with a problem or new information, I ask questions to determine its meaning and begin reasoning to assess validity and credibility.
I often trust what I hear or read, but if something sounds really weird, I ask questions to learn more.
I immediately accept what is presented. I want an easy answer or method, so I can mindlessly use it forever.
Assessing Curiosity by Assessing Questions
Should we launch?
0
1
2
3
45 50 55 60 65 70 75 80
Num
ber o
f O-
Ring
Pro
blem
s
Temperature in °F at Launch Time
Performance Tasks and Rubrics: High School Mathematics, Danielson & Vasquez, Eye on Education, ©1998
What if we analyzed Curiosity Data? Course 6-week 12-week Semester
Algebra 1 Novice Novice Novice
Modern American History Novice Expert Novice
Biology Expert Proficient Novice
Orchestra Proficient Proficient Proficient
Physical Education Novice Novice Proficient
Honors English 1 Proficient Proficient Expert
Introduction to Business Expert Expert Expert

Our Algebra 1 Gradebooks Hold the Key to Equity & Access: Assessing Proficiency without Percentages
Dr. Tim Hudson, DreamBox Learning VP of Learning [email protected]
@DocHudsonMath
NCTM, April 6, 2017, San Antonio, TX 19
Math Program Design
Define Goals & Clarify
Outcomes
Design Reports with Meaningful Feedback
Develop Assessments
& Grading System
Ensure Print & Digital
Resource Alignment
1. Identify desired results 2. Determine acceptable evidence 3. Plan learning experiences and
instruction
Curriculum Design: How we Cause Learning
Understanding by Design, Wiggins & McTighe, ©2005
When you change the assessment and reporting system, you change the
conversation with students. And teachers. And parents.