NCSR S T · Horizontal Measurements - Pacing and Taping INTRODUCTION ... One course should be on...
56
NCSR SPECIAL TOPICS I – FOREST SURVEYING AND SILVICULTURE NORTHWEST CENTER FOR SUSTAINABLE RESOURCES (NCSR) CHEMEKETA COMMUNITY COLLEGE, SALEM, OREGON DUE # 9813445 NCSR EDUCATION FOR A SUSTAINABLE FUTURE www.ncsr.org FUNDING PROVIDED BY THE NATIONAL SCIENCE FOUNDATION OPINIONS EXPRESSED ARE THOSE OF THE AUTHORS AND NOT NECESSARILY THOSE OF THE FOUNDATION
Transcript of NCSR S T · Horizontal Measurements - Pacing and Taping INTRODUCTION ... One course should be on...
NCSR SPECIAL TOPICS I – FOREST SURVEYING AND SILVICULTURE
NORTHWEST CENTER FOR SUSTAINABLE RESOURCES (NCSR)CHEMEKETA COMMUNITY COLLEGE, SALEM, OREGON DUE # 9813445
NCSR EDUCATION FOR A SUSTAINABLE FUTURE
www.ncsr.org
FUNDING PROVIDED BY THE NATIONAL SCIENCE FOUNDATION
OPINIONS EXPRESSED ARE THOSE OF THE AUTHORS AND NOT
NECESSARILY THOSE OF THE FOUNDATION


NCSR Special Topics I - Forestry Surveying and Silviculture
The Northwest Center for Sustainable Resources is an Advanced Technology Education project funded by the National Science Foundation.
NCSR Special Topics I is a compilation of forestry-related topics and exercises selected from course materials developed at Central Oregon Community College in Bend, Oregon and Chemeketa Community College in Salem, Oregon. Titles of courses from which these materials were selected include Silvicultural Methods (Central Oregon Community College) and selected labs and exercises from Introduction to Silviculture and Forest Survey-ing (Chemeketa Community College). All materials were tested and revised at Allegany College in Cumberland, Maryland.
Technology programs in which these materials are incorporated are described fully in the Center’s report entitled, “Visions for Natural Resource Education and Ecosystem Science for the 21st Century.” Copies are available free of charge.
The authors and Center grant permission for the unrestricted use of these materials. Use them freely!
Course materials are also posted on our web site:
www.ncsr.org Please feel free to comment or provide input.
Wynn W. Cudmore, Ph.D., Principal InvestigatorNorthwest Center for Sustainable ResourcesChemeketa Community CollegeP. O. Box 14007Salem, OR 97309Phone: 503-399-6514Email: [email protected]
INTRODUCTION ........................................................................................................................ 1HORIZONTAL MEASUREMENTS - PACING AND TAPING .................................................................. 2PUBLIC LAND SURVEY SYSTEM AND TRIGONOMETRY ................................................................... 5HORIZONTAL CHAINING AND FIELD NOTES ............................................................................... 9COMPASS AND PACING ........................................................................................................... 11READING AND USING A MAP ................................................................................................... 13CREATING A MAP ................................................................................................................... 18COMPASS TRAVERSE ................................................................................................................ 19LEVELING COURSES ................................................................................................................ 20SAMPLE QUIZZES AND EXAMS .................................................................................................. 22
INTRODUCTION ...................................................................................................................... 29THE LEGO® DENSITY LAB ....................................................................................................... 33SILVICULTURE TOUR ............................................................................................................... 37UNEVEN-AGED MANAGEMENT CONVERSION .............................................................................. 39SILVICULTURAL APPLICATIONS: THINNING RECOMMENDATIONS ................................................. 46
Table of Contents NCSR Special Topics I
FOREST SURVEYING
SILVICULTURE

1Introduction
NCSR Special Topics I Forest Surveying
INTRODUCTION
Forest Surveying is an introductory course typically taught in the first year of a Forest Re-source Technology program. Students are introduced to basic forest surveying techniques in-cluding the fundamentals of horizontal and vertical measurements. The course also introduces students to planimetric and topographic maps.
Upon successful completion of this course, the student should be able to use basic surveying instruments to accurately measure horizontal distance, vertical distance, angles and directions. Students should also be able to analyze surveying data to compose field maps of forest resourc-es, calculate and adjust a closed traverse and calculate the area of a traverse.
SUGGESTED TEXT
Wolf, P.R. and R.C. Brinker. 1994. Elementary Surveying. Harper Collins College Publishers. New York. 760 pp.
2Horizontal
Measurement
NCSR Special Topics I Horizontal Measurements
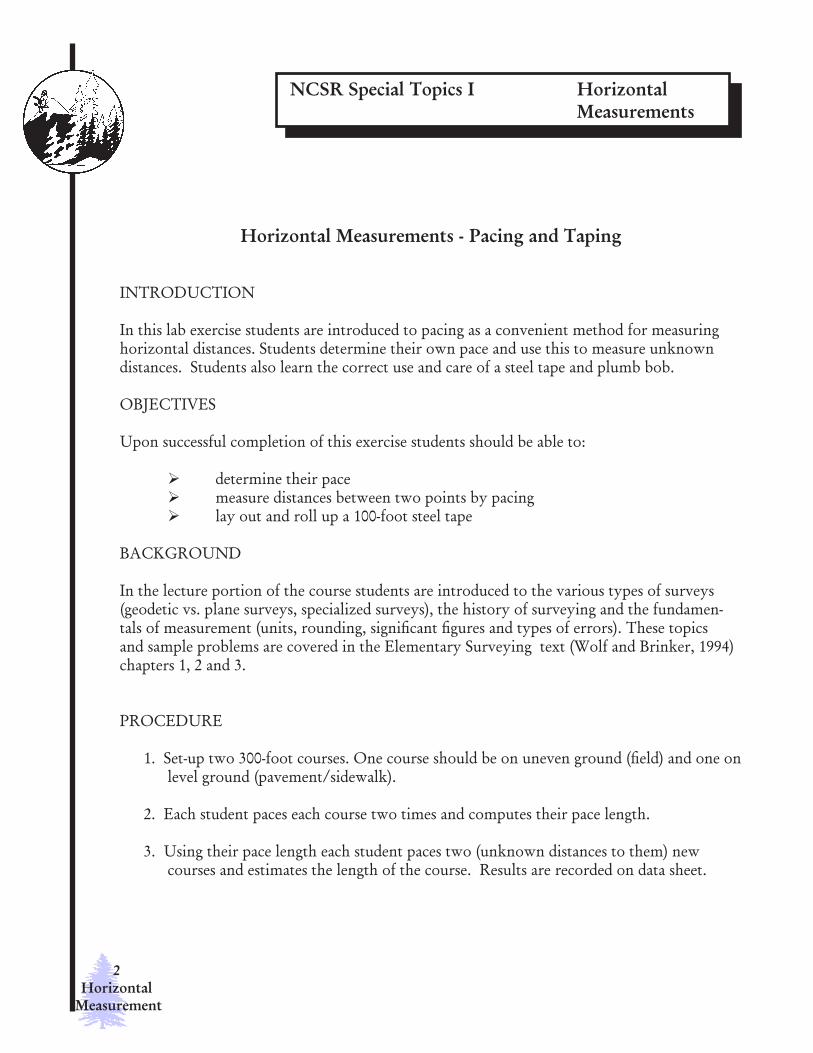
Horizontal Measurements - Pacing and Taping
INTRODUCTION
In this lab exercise students are introduced to pacing as a convenient method for measuring horizontal distances. Students determine their own pace and use this to measure unknown distances. Students also learn the correct use and care of a steel tape and plumb bob.
OBJECTIVES
Upon successful completion of this exercise students should be able to:
determine their pace measure distances between two points by pacing lay out and roll up a 100-foot steel tape
BACKGROUND
In the lecture portion of the course students are introduced to the various types of surveys (geodetic vs. plane surveys, specialized surveys), the history of surveying and the fundamen-tals of measurement (units, rounding, significant figures and types of errors). These topics and sample problems are covered in the Elementary Surveying text (Wolf and Brinker, 1994) chapters 1, 2 and 3.
PROCEDURE
1. Set-up two 300-foot courses. One course should be on uneven ground (field) and one on level ground (pavement/sidewalk).
2. Each student paces each course two times and computes their pace length.
3. Using their pace length each student paces two (unknown distances to them) new courses and estimates the length of the course. Results are recorded on data sheet.

3Horizontal
Measurement
4. Students will have weekly pacing exercises until pacing is mastered. Students should be aware that the length of pace may be affected by a number of factors including weath-er, ground cover, degree of slope, footwear, ground surface and time of day.
5. Unroll and roll up a 100-foot steel tape. The correct way to handle a tape and plumb bob when measuring will be demonstrated.
MATERIALS
Steel tape - 100-footPlumb bobStake flags to mark courses
4Horizontal
Measurement
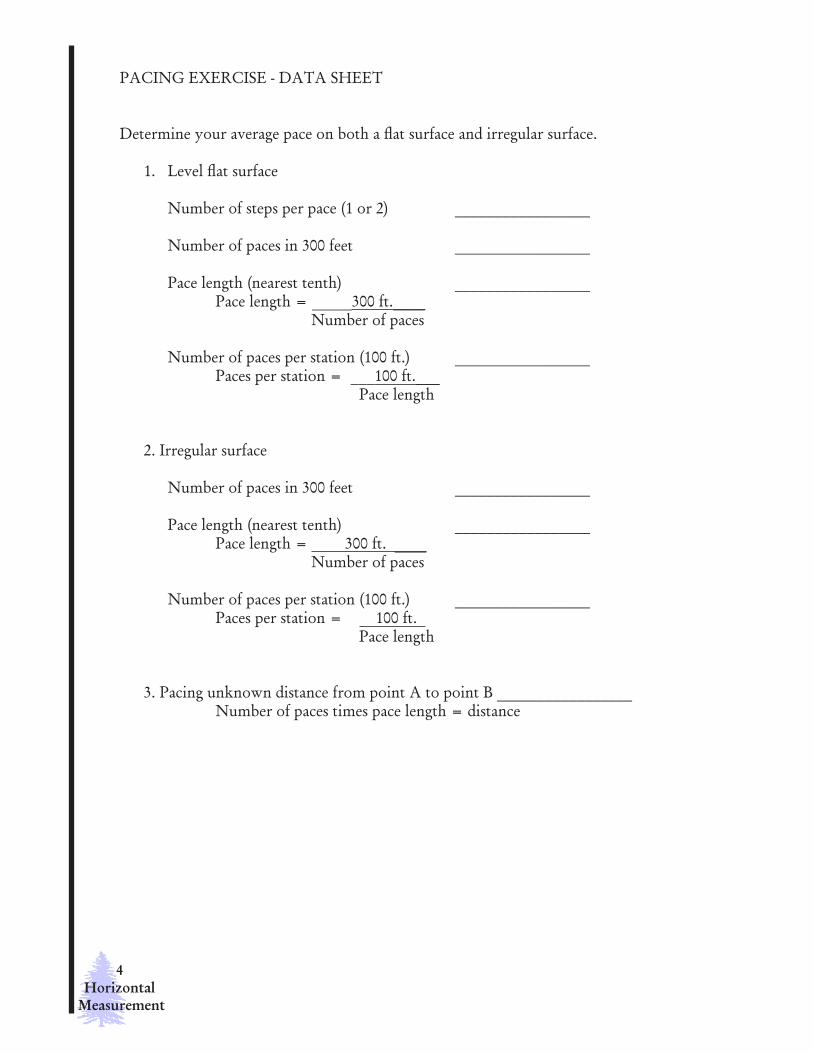
PACING EXERCISE - DATA SHEET
Determine your average pace on both a flat surface and irregular surface.
1. Level flat surface
Number of steps per pace (1 or 2) _________________
Number of paces in 300 feet _________________
Pace length (nearest tenth) _________________ Pace length = _____300 ft.____ Number of paces
Number of paces per station (100 ft.) _________________ Paces per station = ___100 ft.___ Pace length
2. Irregular surface
Number of paces in 300 feet _________________ Pace length (nearest tenth) _________________ Pace length = 300 ft. ____ Number of paces
Number of paces per station (100 ft.) _________________ Paces per station = 100 ft. Pace length
3. Pacing unknown distance from point A to point B _________________ Number of paces times pace length = distance

5PublicLand
NCSR Special Topics I Public Land Survey
Public Land Survey System and Trigonometry
INTRODUCTION
At the start of this lab have the students pace two different pacing courses. The rest of the lab time can be used for right triangles, areas and township, range problems.
OBJECTIVES
• Test the students pacing skills• Practice right triangles and public land subdivision (this is an inside lab)
BACKGROUND
In the lecture portion of the course students are introduced to right triangle trigonometry (sine, cosine and tangent) and its application to determine slope distances, horizontal distanc-es, vertical distances and tree heights. The public lands survey system (township, range, sec-tions) and proper methods for taking field notes are also described. These topics and sample problems are covered in the Elementary Surveying text (Wolf and Brinker, 1994) chapter 23. Examples of formats for field notes are included in Appendix D pages 711-720.
PROCEDURE
1. Set up two pacing courses of different lengths and on different surfaces and slopes. Have the student pace and estimate the distances of these courses.
2. Students work on right triangles, areas and township, range problems
6Public Land
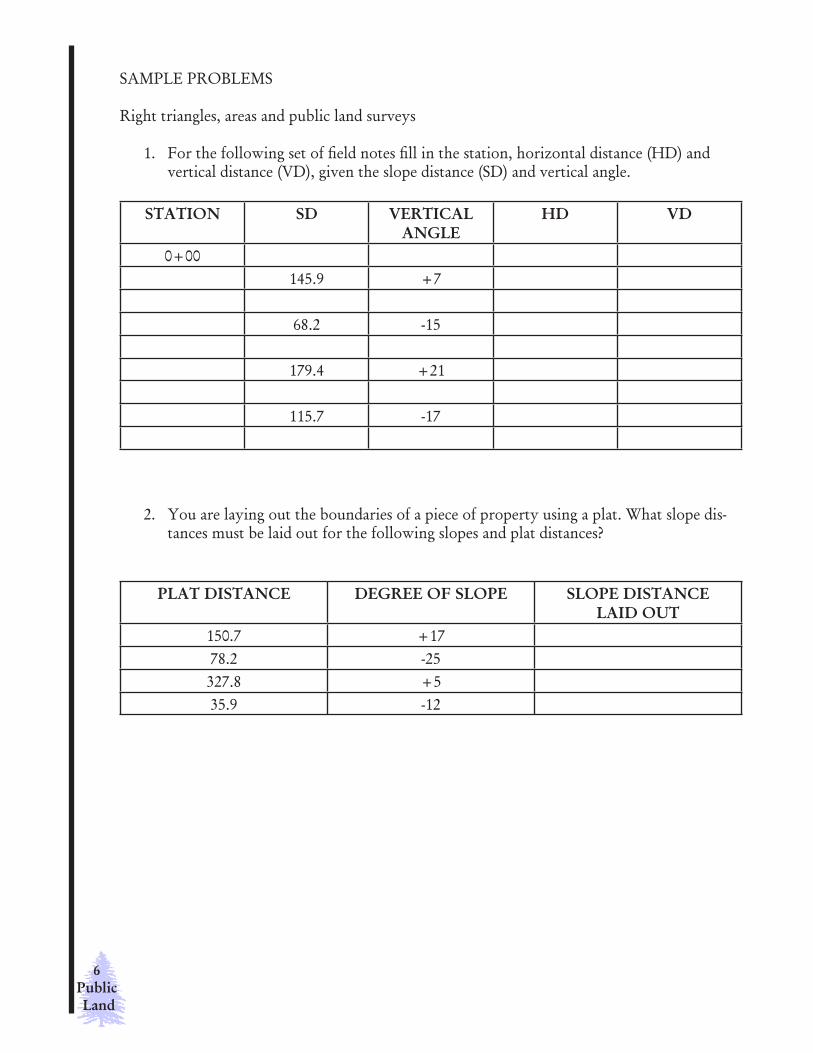
SAMPLE PROBLEMS
Right triangles, areas and public land surveys
1. For the following set of field notes fill in the station, horizontal distance (HD) and vertical distance (VD), given the slope distance (SD) and vertical angle.
STATION SD VERTICAL ANGLE
HD VD
0+00145.9 +7
68.2 -15
179.4 +21
115.7 -17
2. You are laying out the boundaries of a piece of property using a plat. What slope dis-tances must be laid out for the following slopes and plat distances?
PLAT DISTANCE DEGREE OF SLOPE SLOPE DISTANCE LAID OUT
150.7 +1778.2 -25327.8 +535.9 -12

7PublicLand
3. How tall are the following trees?
4. How wide are the following rivers?
5. Convert the dimensions of each figure into feet and chains. Find the area of each figure in square feet, square chains and acres.
A. Rectangles: 1) 345.9 ft. x 542.8 ft. 2) 15.7 c. x 28.4 c.
B. Circles: 1) radius = 678.3 ft. 2) radius = 78.3 c.

8Public Land
6. For the following legal descriptions (all in T03S R02E WM) find the following:
A. Dimensions of the parcel (how wide and how long) in feet and chains.
B. Area of each parcel in square feet, square chains and acres.
1) W1/2 SW1/4 SEC 25
2) NW1/4 SE1/4 SEC 25
3) E1/2 NE1/4 NW1/4 SEC 25
4) E1/2 E1/2 SEC 25

9HorizontalChaining
NCSR Special Topics I Horizontal Chaining
Horizontal Chaining and Field Notes
INTRODUCTION
In this lab students review the proper use of a steel tape and learn and practice the correct way to chain a distance and to record the information in their field book.
PROCEDURE
1. Students should demonstrate proper technique in the use of a steel tape to measure horizontal distances:
Lining in Applying tension Plumbing Marking tape length Reading the tape Recording the distance
2. Students should measure a 5 to 8-sided traverse
3. Students should lay out a traverse with different length sides and slopes
BACKGROUND
In the lecture portion of the course students are introduced to the various methods of making linear measurements (pacing, taping, range finders, electronic distance measurement and GPS). Potential sources of error and ways of minimizing this error are also discussed. These topics and sample problems are covered in the Elementary Surveying text (Wolf and Brinker, 1994) chapter 4.

10HorizontalChaining
MATERIALS
Steel tape - 100 foot Plumb bobsChaining gripsChaining pins (1 set)Field notebook

11Compass
and Pacing
NCSR Special Topics I Compass and Pacing
Compass and Pacing
INTRODUCTION
This lab combines pacing skills with the proper use of a compass. Upon completion, each student should be able to confidently navigate by developing distance and directional skills.
BACKGROUND
In the lecture portion of the course students are introduced to the theory and use of the com-pass including types of compasses, declination, bearings, azimuths and sources of error. These topics and sample problems are covered in the Elementary Surveying text (Wolf and Brinker, 1994) chapter 9.
MATERIALS Hand compassesInstruction cards PROCEDURE
The compass course for this laboratory exercise consists of twenty markers placed five feet apart on a straight magnetic west to east line.
Number the most westerly marker one and consecutively number every five feet to the east until all twenty markers are numbered. Each student will have a hand compass and instruc-tion card with the starting marker number and directions. Each student starts at the marker, which has the number that corresponds to the starting point on his or her card. When the stu-dent is finished they will write down the number of the nearest marker. All routes lead back to a marker on the starting line. Each student will run the course two times with two different routes.

12Compass
and Pacing
Scoring: Start with 50 points. Deduct 1 point for each foot off.
Course Set-up
Starting point 1 Starting point 6Go 36 degrees for 122 feet Go 03 degrees for 100 feetThen 149 degrees for 58 feet Then 132 degrees for 74 feetThen 235 degrees for 86 feet Then 225 degrees for 69 feetDestination number reached Destination number reached
Starting point 2 Starting point 7Go 17 degrees for 104 feet Go 34 degrees for 119 feetThen 150 degrees for 52 feet Then 186 degrees for 50 feetThen 142 degrees for 64 feet Then 228 degrees for 74 feetDestination number reached Destination number reached
Starting point 3 Starting point 8Go 38 degrees for 125 feet Go 346 degrees for 102 feetThen 237 degrees for 90 feet Then 129 degrees for 78 feetThen 186 degrees for 50 feet Then 211 degrees for 58 feetDestination number reached Destination number reached
Starting point 4 Starting point 9Go 36 degrees for 122 feet Go 346 degrees for 102 feetThen 174 degrees for 50 feet Then 129 degrees for 78 feetThen 228 degrees for 74 feet Then 186 degrees for 50 feetDestination number reached Destination number reached
Starting point 5 Starting point 10Go 22 degrees for 107 feet Go 343 degrees for 104 feetThen 158 degrees for 54 feet Then 141 degrees for 64 feetThen 186 degrees for 50 feet Then 145 degrees for 61 feetDestination number reached Destination number reached
Answer Key:
Starting point Destination point1 72 193 24 85 166 87 88 99 1510 19

13Reading
Map
NCSR Special Topics I Reading and Using a Map
Reading and Using a Map
OBJECTIVES
Upon successful completion of this exercise students should be able to:
describe a location on a map using the public survey system (township, range, section) determine on a map the direction and distance between two points locate him/herself in the field on a map by finding bearings to two known points calculate area of a parcel of land (in acres) read and understand the information on a quadrangle map
BACKGROUND
In the lecture portion of the course students are introduced to the fundamentals of mapping including scale, map types (planimetric vs. topographic), map symbols and legends, map pro-jections (orthographic, Lambert conformal, polyconic and mercator) and various map coor-dinate systems. These topics and sample problems are covered in the Elementary Surveying text (Wolf and Brinker, 1994) chapter 17.
PROCEDURE
Working in small groups of 3 to 4 students each, complete the mapping lab worksheets on the following pages.
MATERIALS
Two or three 7.5 or 15 minute quadrangle mapsCompassProtractorEngineering scale

14Reading
Map
•FOR INSTRUCTORS•
NOTES FOR INSTRUCTORS
Any USGS 7.5 or 15 minute map may be used for these exercises. Prior to lab, specific locations will need to be identified and marked on the maps that students will use for study. Questions on worksheets are provided here as examples and will need to be customized for the maps you have chosen.

15Reading
Map
MAPPING LAB WORKSHEET 1
1. You are at point W and you need a water drop. When you call in, how will you de-scribe your location (T,R,S) ?
2. You have been dropped off at Cougar Pass in division B of the fire. You need to take your crew to point G to mop up. What bearing or azimuth will you take to get there?
3. You are out in the black. You are not sure of your location, so you take a shot on Dean Mountain. And get a bearing of S 78 W. You also get a bearing to Cougar Pass of S 58 E. Describe your location (T,R,S).
4. The next day you need a water drop at point M. What is your Township, Range, Sec-tion and part of section?
5. How many acres is this fire?

16Reading
Map
MAPPING LAB WORKSHEET 2
LYONS QUADRANGLE MAP44122-G5-TF-024
1. What does 7.5 minute series map mean?
2. What are the following scales.
A. Representative fraction ________________________
B. 1 inch equals ________________________Feet.
C. 1 mile equals ________________________Inches.
3. What does contour interval mean?
4. What is the contour interval for this map?
5. What is the most Easterly and the most Westerly longitudes lines on this map?
A. Easterly ________________________
B. Westerly ________________________
6. What is the most Northerly and the most Southerly latitudes on this map?
A. Northerly ________________________
B. Southerly ________________________
7. This map was compiled from aerial photographs taken in what year?
8. When was this map field checked?
9. When was this map last edited?
10. What map projection was used to make this map?
11. What horizontal datum was used?
12. Is there a distinction made between houses, barns and other building? (yes or no) How do you know?
13. How much is the different between North American Datum (NAD) of 1927 (NAD27) and (NAD83)?

17Reading
Map
14. What is at the SW corner of the NW, NW, SW, sec. 22 T8S R2E WM.?
15. What is the percent of slope from Big Green Mountain to the SE section corner of sec-tion 35 in T8S R2E ?
16. What is the elevation of the campground in the SW, sec 25 T9S R2E WM. ?
17. What map would you need to use to find a point in sec. 35 T8S R1E WM. ?

18Creating
a Map
NCSR Special Topics I Creating a Map
Creating a Map
INTRODUCTION
In this lab students refine their skills in compass, pacing and data collection as they make a basic forest map.
PROCEDURE
1. On the graph side of your field book lay out a 30 chain by 8 chain piece.
2. Use all the space available in your field notebook. Do not make your drawing too small
3. Using your compass and pace, draw in the important features encountered, such as roads, trails, ridges, valleys, vegetation boundaries, etc.
4. At home on a piece of graph paper draw the paced map recorded in the field book to scale.
MATERIALS
Field notebookHand compass

19CompassTraverse
NCSR Special Topics I Compass Traverse
Compass Traverse
INTRODUCTION
Students will set up a five sided traverse with each side between 100-200 feet long, then col-lect the bearing and distance of each line. In the classroom students will calculate the interior angles, balance the traverse and find the area.
OBJECTIVES
• Collect data on a five-sided closed traverse• Set up and read a staff compass• Balance and adjust the five-sided traverse• Compute the area of the five-sided traverse
BACKGROUND
In the lecture portion of the course students are introduced to the fundamentals of performing a closed traverse. A review of bearings and azimuths is usually necessary. The various types of horizontal angles are then described (interior angles, angles to the right, deflection angles) followed by balancing a compass traverse. These topics and sample problems are covered in the Elementary Surveying text (Wolf and Brinker, 1994) chapter 8.
PROCEDURE
Students will set up a five-sided traverse with each side between 100-200 feet long, then col-lect the bearing and distance of each line. In the classroom students will calculate the interior angles, balance the traverse and find the area.
EQUIPMENT
Staff compassJacob staffSteel tape - 100 footField book
20LevelingCourses
NCSR Special Topics I Leveling Courses
Leveling Courses
INTRODUCTION
In this lab students learn how to set up a dumpy level and an automatic level. In separate exercises, students use these instruments to carry an elevation from one point to another.
OBJECTIVES
Upon successful completion of this exercise, students should be able to:
determine elevation differences carry an elevation from one point to another point set up a dumpy level correctly set up an automatic level correctly record information in the correct format
BACKGROUND
In the lecture portion of the course students become familiar with the terminology of eleva-tion and leveling (e.g., level line, mean sea level, bench mark, back sight, fore sight). They are also introduced to the various devices used in leveling (dumpy levels, automatic levels and level rods), their proper operation, common sources of error and methods of minimizing this error. These topics and sample problems are covered in the Elementary Surveying text (Wolf and Brinker, 1994) chapters 6 and 7.

21LevelingCourses
PROCEDURE
1. This laboratory exercise takes two lab periods - the first using a dumpy level and the second an automatic level. Optimal crew size for the exercise is three people so that two people can check the readings.
2. Identify one well-established bench mark as a starting point.
3. Each crew should run a level course around campus using a dumpy level. Pick up elevation points along the way and have them close back on the starting point.
4. On the second lab period the process should be repeated using an automatic level.
5. If time allows, students should also run this level course in a wooded area.
EQUIPMENT
Dumpy levelAutomatic levelTripodLevel rodField book

22SampleTests
NCSR Special Topics I Sample Quizzes and Exams
Sample Quizzes and Exams
FOREST SURVEYING - SAMPLE QUIZ
1. Explain the difference between geodetic and plane surveys.
2. Add up the following distances and show your answer to the proper significant figure.
256.32 025.22 054.2 421.1 002.56
3. What is the difference between errors and mistakes.
4. Convert 8 chains 15 links to feet.
5. Discuss the difference between precision and accuracy.
6. You have just counted 188, 187, 188, 186, 187, 186 paces in six trials of walking along a course of 500 feet. Then you walk 406, 409, 408 and 405 paces of an unknown distance. What is your pace and what is the unknown distance?

23SampleTests
7. For the following slope distances (SD) fill in the horizontal distance (HD) and vertical distance (VD).
SD VERT. ANG. HD VD178.9 +998.5 +1572.6 -21
Sin = O H
Cos = A H
Tan = O A
8. For the following legal descriptions (all in T02S R03W WM.) indicate on the map where it is located and its area in acres.
1) SE1/4, NW1/4, SEC 13
2) E1/2, E1/2, SEC 13
24SampleTests
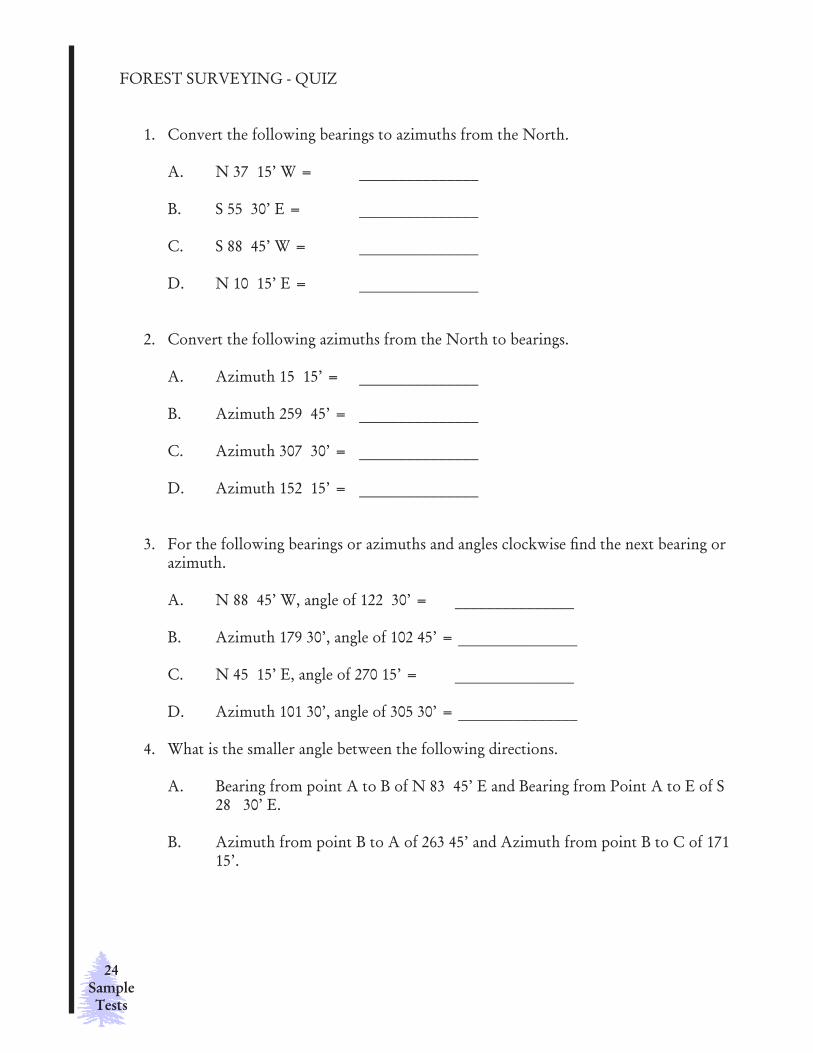
FOREST SURVEYING - QUIZ
1. Convert the following bearings to azimuths from the North.
A. N 37 15’ W = _______________
B. S 55 30’ E = _______________
C. S 88 45’ W = _______________
D. N 10 15’ E = _______________
2. Convert the following azimuths from the North to bearings.
A. Azimuth 15 15’ = _______________
B. Azimuth 259 45’ = _______________
C. Azimuth 307 30’ = _______________
D. Azimuth 152 15’ = _______________
3. For the following bearings or azimuths and angles clockwise find the next bearing or azimuth.
A. N 88 45’ W, angle of 122 30’ = _______________
B. Azimuth 179 30’, angle of 102 45’ = _______________
C. N 45 15’ E, angle of 270 15’ = _______________
D. Azimuth 101 30’, angle of 305 30’ = _______________ 4. What is the smaller angle between the following directions.
A. Bearing from point A to B of N 83 45’ E and Bearing from Point A to E of S 28 30’ E.
B. Azimuth from point B to A of 263 45’ and Azimuth from point B to C of 171 15’.
25SampleTests
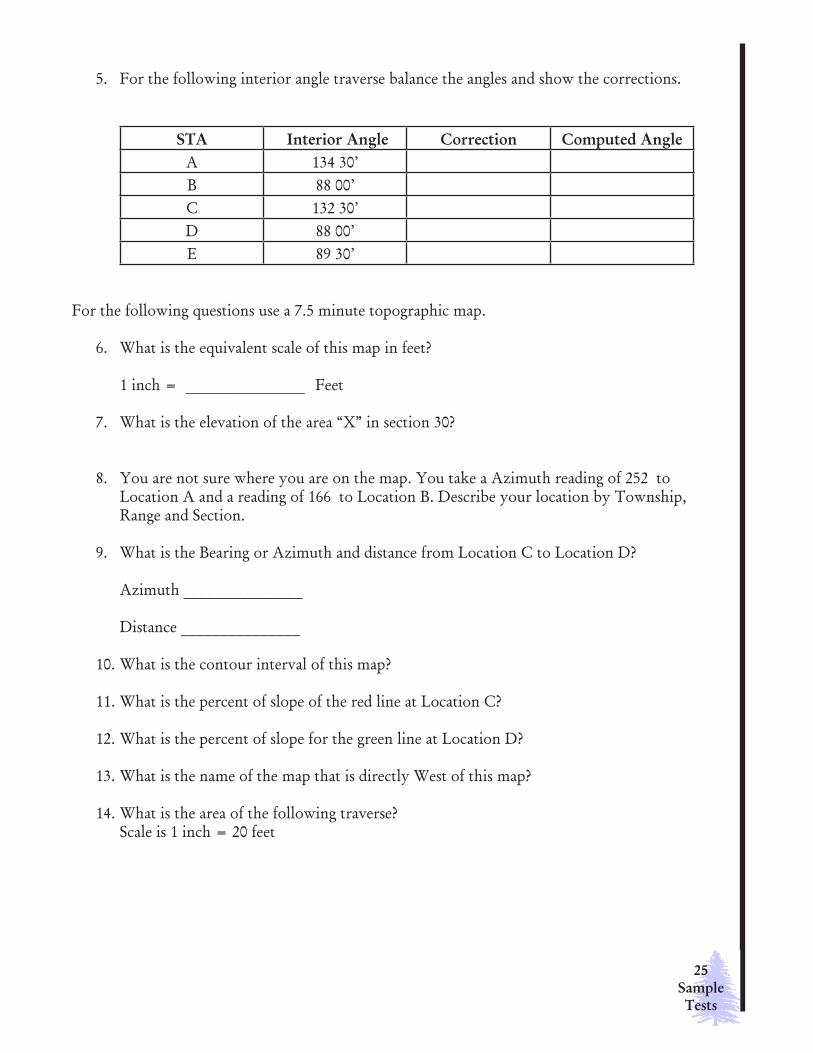
5. For the following interior angle traverse balance the angles and show the corrections.
STA Interior Angle Correction Computed AngleA 134 30’B 88 00’C 132 30’D 88 00’E 89 30’
For the following questions use a 7.5 minute topographic map.
6. What is the equivalent scale of this map in feet?
1 inch = _______________ Feet
7. What is the elevation of the area “X” in section 30?
8. You are not sure where you are on the map. You take a Azimuth reading of 252 to Location A and a reading of 166 to Location B. Describe your location by Township, Range and Section.
9. What is the Bearing or Azimuth and distance from Location C to Location D?
Azimuth _______________
Distance _______________
10. What is the contour interval of this map?
11. What is the percent of slope of the red line at Location C?
12. What is the percent of slope for the green line at Location D?
13. What is the name of the map that is directly West of this map?
14. What is the area of the following traverse? Scale is 1 inch = 20 feet

26SampleTests
FOREST SURVEYING - FINAL EXAM
1. List five methods of measuring horizontal distances. Give one advantage and one disad-vantage for each.
A.
B.
C.
D. E.
2. You count 79, 81, 80, 81 and 79 paces in five trials of walking along a 200 foot course. Then 305, 306 and 307 paces between points A and B.
A. What is your pace?
B. How far is it between points A and B in feet?
3. Convert the bearing of N 36 10’ W to an azimuth.
4. Convert the azimuth of 168 15’ to a bearing.
5. Compute the angle for point K.
Angle at point K _______________
6. You have an azimuth of 196 15’ and a angle of 38 15’ to the right what is your new azimuth?

27SampleTests
7. Complete the following level notes.Profile Levels
STA. B S H I F S I F S ELEV.BM #230 10.15 360.58
0+00 9.30+50 9.8TP #1 11.47
7.381+00 11.12+00 9.5TP #2 5.26
2.562+50 4.63+00 3.93+50 2.2
BM #230 3.37
8. For the following notes fill in the missing distances.
SLOPEDISTANCE
VERTICALANGLE
HORIZONTALDISTANCE
VERTICALDISTANCE
135.6 +8-13 66.8
+25 62.5113.8 -12
9. Find the area in acres for the following areas.
A. Rectangle 1040 feet by 1875 feet.
B. Circle with a radius 650 feet.
28SampleTests
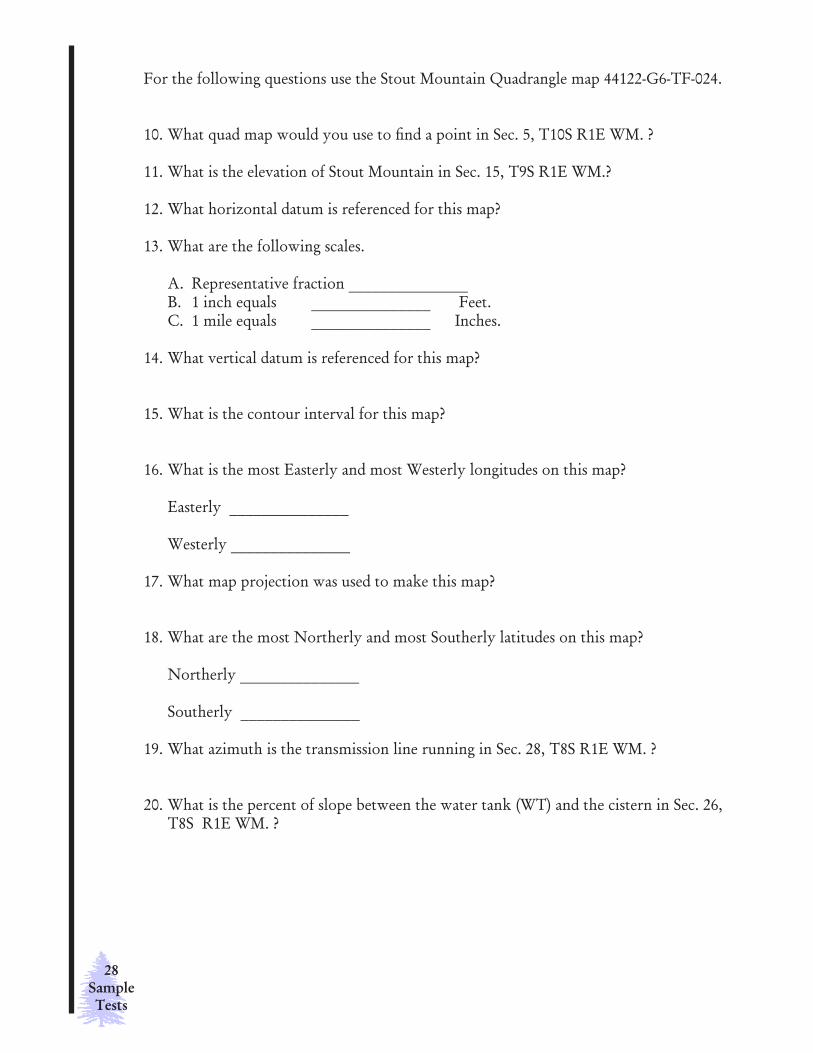
For the following questions use the Stout Mountain Quadrangle map 44122-G6-TF-024.
10. What quad map would you use to find a point in Sec. 5, T10S R1E WM. ?
11. What is the elevation of Stout Mountain in Sec. 15, T9S R1E WM.?
12. What horizontal datum is referenced for this map?
13. What are the following scales.
A. Representative fraction _______________ B. 1 inch equals _______________ Feet.C. 1 mile equals _______________ Inches.
14. What vertical datum is referenced for this map?
15. What is the contour interval for this map?
16. What is the most Easterly and most Westerly longitudes on this map? Easterly _______________
Westerly _______________
17. What map projection was used to make this map?
18. What are the most Northerly and most Southerly latitudes on this map?
Northerly _______________
Southerly _______________
19. What azimuth is the transmission line running in Sec. 28, T8S R1E WM. ?
20. What is the percent of slope between the water tank (WT) and the cistern in Sec. 26, T8S R1E WM. ?

29Silviculture
Introduction
NCSR Special Topics I Silviculture Introduction
Silviculture - An Introduction
What is Silviculture?
Silviculture is the art and science of producing and tending a forest. Silviculture applies the scientific principles underlying growth and development of single trees and forest stands as biological units. The theory and practice of controlling forest establishment, composition, structure, and growth is applied to forest stands to maintain and enhance their utility and purpose.
Social, Economic and Ecological Factors
Modern silviculture attempts to meet social (e.g., scenic quality, recreation), ecological (e.g., wildlife habitat) and economic (e.g., timber production) goals. These goals are often intercon-nected. For example, economic productivity of a site can only be maintained if site factors allow ecological processes such as nutrient cycling to continue. Since people’s livelihoods rely on social and economic factors, silvicultural treatments must produce benefits that exceed costs. These two factors often conflict, because the most economically efficient or socially ben-eficial practices may not be those considered the most ecologically sound.
The Role of Ecological Succession
Often, the most valuable commercial species in a region are relatively shade intolerant trees representative of the early or intermediate stages in natural forest succession (e.g., Douglas-fir in western Oregon or pines in coastal areas). These species are most likely to self prune lower branches, and they generally reproduce following a major disturbance, such as wildfire Many are very long-lived. Douglas-fir, for example, has a natural longevity that can exceed 1,000 years. As a result, these species can attain the economically desirable attributes of large size and resistance to decay.
Silviculturists manipulate natural selection with various treatments to achieve desired stand composition and structure. Generally, since succession proceeds more rapidly on better sites, silviculture is more economical on intermediate sites. On poor sites and some intermediate sites, a physiographic climax is reached, where succession beyond an intermediate stage will not occur.
30Silviculture
Introduction
Goals of Silviculture
Silviculture attempts to create and maintain the composition and structure of a forest that will best meet the objectives of the land owner. These objectives vary greatly among owners and must be clearly defined for appropriate silviculture prescriptions. Some typical objectives fol-low:
A. Control of stand structure Stand shape may be modified for esthetic reasons, to facilitate treatments and harvest,
or to control animal pests. Internal structure may be modified to select for certain age classes, arrangements of canopy levels/layers of vegetation or distribution of diameter classes.
B. Control of compositionThe types and quality of various species in the forest define the forest composition.Composition is controlled to limit undesirable species or poorly formed trees and isachieved by site preparation, cutting, poisoning, burning, planting, and introduction ofnew species.
C. Restocking of unproductive areasAreas that are capable of growing trees but are not fully stocked due to fire, destructivelogging, or animal damage may be restocked by planting seeds or seedlings.
D. Protection and reduction of lossesForest losses due to fire, fungi, insects, wind, or competition may be reduced by apply-ing silvicultural methods such as thinning and salvage logging.
E. Control of rotation lengthThe number of years required to grow a stand to a specified condition of economic maturity (i.e., rotation length) may be modified to achieve different goals. Douglas-fir (Pseudotsuga menziesii), for example, is commonly grown on a 40-60 year rotation to produce sawtimber in western Oregon.
F. Facilitation of harvestingPlanning operations may include management activities that will make harvesting ef-ficient, economical, and predictable.
G. Conservation of site qualitySilviculturists, like farmers, must conserve resources (particularly, soils) on a site to preserve future productivity. Silvicultural practices also have a great deal of influence on site microclimate. If site quality is conserved, renewable resources such as trees can replace themselves. Soil erosion is considered to be the least reparable of disturbances. Nutrients and applied chemicals can be lost through surface runoff and leaching.

31Silviculture
Introduction
Selected Silviculture Terminology
Advanced reproduction or regeneration: trees that reproduce naturally or are induced to grow under existing stands
Aforestation: establishing a forest where one has not previously existed
Forest succession: the natural changes that occur as a forest ages; stages may include pioneer (early), seral (intermediate) and climax (late) stages
Growing stock or forest capital: trees that are reserved in a forest to continue production
Improvement cuttings: cuttings made in older stands used to regulate species composition and improve the quality of a stand
Physiographic climax: the premature endpoint of forest succession achieved on some sites as a result of poor growing conditions; succession beyond an intermediate stage will not occur
Pruning: cuttings that involve branches only; generally used when high quality, knot-free sawlogs are desired
Regeneration/reproduction: replacing harvested trees either naturally or artificially
Release operations: treatments conducted to regulate species composition and improve the quality of very young stands
Reproduction methods: treatments of stand and site during the period of regeneration or establishment
Reproduction or regeneration cuttings: cuttings made with the twin purposes of removing overstory trees and creating environments favorable for regeneration
Reproduction or regeneration period: the period over which such regeneration treatments extend
Restocking: planting areas capable of growing trees that are not fully stocked due to fire, destructive logging, or animal damage
Rotation: the number of years required to grow a single crop or generation of trees to a speci-fied condition of economic maturity
Salvage cuttings: recovery of values represented by damaged trees or stands
Silvicultural system: the total program for the treatment of a stand during a rotation

32Silviculture
Introduction
Stand improvement: tending operations that involve outright investment without any har-vest of wood (i.e., pre-commercial thinning)
Stumpage: price for standing trees; estimated sale value “on the stump”
Tending or intermediate cutting: treatments that occur within a rotation
Thinnings: intermediate cuttings that are aimed primarily at controlling the growth of stands by adjusting stand density
RESOURCES
Smith, D.M., B.C. Larson, M.J., Kelty and M.S. Ashton. 1997. The Practice of Silviculture: Applied Forest Ecology, Ninth Edition. Wiley and Sons, Inc. New York, New York.
Silviculture courses may be taught with a laboratory or may be lecture-only. The topics list below is typical of the lecture portion of the course.
1. Introduction: Silviculture and its Place in Forestry2. Development of Silvicultural Systems and Methods of Regeneration3. The Silviculture of Pure Even-aged Stands4. Double-Cohort Pure Stands Regenerated by Partial Cutting5. The Experimental Forest6. Silviculture of Pure Uneven-aged Stands7. Responses of Individual Trees to Thinning and Pruning8. Management of Growth and Stand Yield by Thinning9. Methods and Applications of Thinning10. Release Operations and Herbicides11. Preparation and Treatment of the Site12. Site Classification and Species Selection13. Artificial Regeneration
For Silviculture courses in forestry programs taught with a laboratory component, the follow-ing pages describe several labs that may be appropriate for such a course.

33Lego®
Density Lab
NCSR Special Topics I The Lego® Density Lab
The Lego® Density Lab
INTRODUCTION
Measures of forest density are used by forestry professionals to describe the degree to which a given forested site is occupied by trees. Stand density, a quantitative measure of tree occupan-cy, is usually expressed in terms of the number of trees per acre, basal area, volume or other criteria on a per-acre basis. Density may also be expressed on a relative basis with respect to some optimal, or maximum standard.
The usefulness of these density measures is that they are indicators of factors affecting forest growth on a stand level (e.g., age, site quality, and intensity of inter-tree competition). The number, sizes and spatial distribution of trees in a stand are measures that give a picture of how crowded a stand of trees is. Among relative measures of stand density, stand density in-dex (SDI) is commonly used, as it is a measure representative of both the number of trees and their average size. SDI is, basically, the “equivalent” number of ten-inch-diameter trees that represents site occupancy, or density, of an actual stand. Relative density (RD) is expressed as a percentage, computed by dividing actual stand SDI by a biological maximum SDI.
SDI is expressed as a number of ten-inch-diameter trees per acre, relative to a biological maxi-mum that a given site can support, based on biological principles of stand growth - primarily, that each forested acre can only support so many trees. Trees divide up the resources (e.g., light, water, soil nutrients) in a competitive way, and the larger the tree, the more resources it needs. As trees grow and a stand develops, there is a maximum number of trees per acre that a site can support, for any given average tree size. As the stand grows toward this maximum, some trees must die before others can grow larger; the trees are growing, but the site resources are fixed. Expressing stand density as this equivalency of ten-inch-diameter trees allows an “apples-to-apples” comparison of stands, regardless of stand heterogeneity.

34Lego®
Density Lab
PROCEDURE
The goal of this exercise is to create and disseminate a visual, hands-on modeling process for designing even- and uneven-aged forest stands.
The possibilities for developing a more advanced model from Legos® are endless. For ex-ample, the model could take on a 3-D effect if the various size classes of trees were not only represented by blocks of different girth, but by stacks of blocks of varying heights; the larger-sized trees would be 8-pegged blocks stacked 5 blocks high, the average-sized trees be 4- and 6-pegged blocks stacked 3 blocks and 4 blocks high respectively, and so on. This would give a third dimension to the tree stand (acre) that would further exhibit overshadowing and space allocation. Ideally, a conical Lego® block could be designed that would more closely resemble a tree, and these blocks would be used to design the 3-D forested acre.
Equations to Calculate Stand Density Index (SDI) Coastal Douglas-fir
SDI of one tree = (DBH/10)1.6
SDI of stand = TPA (QMD/10)1.6
Where,
DBH = Diameter at Breast Height. Diameter of tree stem 4.5 feet above the ground.TPA = Trees per AcreQMD = Quadratic Mean Diameter. A measure of average tree diameter in a stand.
Douglas-fir Stand Density Index (SDI) Growth Zones
Decades of research and empirical data have yielded some general rules for tree vigor and growth rates of coastal Douglas-fir in the Pacific Northwest, at varying levels of stand SDI. The following tree growth zones have been established for Douglas-fir:
Maximum density zone - the biological maximum of site occupancy (i.e., How many 10-inch trees could possibly grow in an acre in this area?)
SDI = 600 in the productive Coast Range (variable), RD (relative density) = 1.0 (100%)
This maximum SDI value is established for ten-inch Douglas-fir trees for a given site. Each species has a different maximum SDI value. In the Willamette Valley, the maximum SDI will vary between 510 and 550, depending on site quality, but the categories, or zones, are repre-sented by the same percentages of maximum SDI.

35Lego®
Density Lab
Mortality zone - some trees will begin to die due to tree-to-tree competition
SDI = 330-600 in the Coast Range, RD = .55 – 1.0
Healthy zone - trees are vigorously growing, optimally using site resources
SDI = 210-330 in the Coast Range, RD = .35-.55
This is the well-accepted thinning zone; allowing the stand to grow to 330 SDI and then thin-ning back to 210 SDI, optimizes site resource utilization without allowing competition-in-duced mortality.
Diversity Zone - allows for differentiation of crown positions in the canopy
SDI = 120-240 in the Coast Range, RD = .20-.40
Thinning back to these levels of SDI should promote growth of understory vegetation or regenerated trees.
MATERIALS
Pegged base board (each 32” X 32” represents one acre) - one for each group of four students Legos® blocks for each 32” X 32” base board:
210 1-peg blocks110 2-peg blocks60 4-peg blocks40 6-peg blocks30 8-peg blocks
Blocks in each size division should be of the same color, and each division color should be dif-ferent from the others.
Tree size equivalencies for each block size are as follows:
1-peg block = 6.5” diameter (DBH) tree = .5 SDI2-peg block = 10.0” diameter (DBH) tree = 1 SDI4-peg block = 15.4” diameter (DBH) tree = 2 SDI6-peg block = 19.9” diameter (DBH) tree = 3 SDI8-peg block = 23.8” diameter (DBH) tree = 4 SDI
With each peg of room representing .5 SDI, the 32” X 32” pegged base board represents a maximum SDI (for the acre) of 512. SDI maximums may be different in different localities.
36Lego®
Density Lab
NOTES FOR INSTRUCTORS
Legos® are the perfect metaphor for exhibiting the spacing and sizes of trees in a particular forest stand. Because of the consistent categories of colors and sizes of Lego® blocks, these blocks are excellent for representing different possibilities in stand structure.
While involved in this lab, students use the Lego® blocks to silviculturally design a stand with optimal density (spacing). For example, with an adequate supply of Lego® tools students may begin “building” a stand of trees to reach an optimal density of 204 SDI (40 RD, or 40% of the maximum 512 SDI allowed on this acre). In building this stand with an uneven-aged struc-ture, they must carefully choose “trees” (blocks) from at least three of the size classes listed to design their acre, careful to note crowding of trees. This challenges the student to think and rethink “optimal” spacing, and challenges them to try and retry to attain that near-perfect al-location of trees.
The lab uses trees in a specific area (Coastal Douglas-fir) as an example. Other tree species could be substituted in different areas.
Viewing uneven-aged stands in the Pacific Northwest is very difficult as existing multi-aged, managed stands are few in number. Although it is necessary for students to view these stands to fully understand the impact of density on stand growth, using Legos® to metaphorically demonstrate the relationships between site resources and support of trees of certain sizes and numbers is a valuable learning tool. In the classroom, students can “build” their own forest stands from scratch, learning the difficulties involved with allocating trees on a site with fixed resources (the number of pegs on the Lego® base never changes).
•FOR INSTRUCTORS•

37Silviculture
Tour
NCSR Special Topics I Silviculture Tour
Silviculture Tour
INTRODUCTION
Field trips to visit actual silvicultural operations are valuable to see how things are done in the “real world”. This field trip is an opportunity for students to ask questions of the forest man-ager and gain insight into the day-to-day problems facing operations of this type.
PROCEDURE
While on-site, use the following checklist to build a description of the silvicultural operation you are visiting. Ask questions of the forest management representative who will be leading your lab and take diligent notes. Use the information you gather to develop your report of the field trip.
Ownership and personnel Who is the landowner? Who is responsible for management activities on this forest? Who decides what will be done? Who actually implements the activities done to these trees?
Management objectives Value of thinning Difference in merchantable growth as a result of different spacing regimens “Rules of thumb” for determining the need to thin/degree of crowding Height/spacing ratio (relative spacing) Diameter/spacing “D+” rules Live crown ratio The value of using a density management diagram Do the “rules of thumb” and the computations and density diagrams always match up? Costs/benefits of doing each? Is pruning worth the cost/effort? Virtues of trees
38Silviculture
Tour
Information about the forest Social pressures/impacts Wildlife habitat Aesthetics Legacy for future generations
Management Activities Methods used Thinning Pruning Planting/Clustering Conversion of species Fertilization
LAB PRODUCT
Prepare a professional-looking report that uses the information you have gathered on the site visit. Be prepared to share your report with the rest of the class.
The following format should be used for your report:
1. Write a two- to four-page report (double spaced, 12-point font) describing the silvicul-tural operation that you have visited.
2. Include a title with the name and location of the silvicultural operation and the date it was visited.
3. Use the headings and bulleted items on the previous page as a template for the body of the report. Note that these bullets are listed to give you general ideas of things to look for and ask about; these items may or may not be pertinent to any given field trip.
4. Describe concisely, yet thoroughly, the processes involved in the organization’s silvi-cultural process.
5. Write the report in coherent paragraphs. Do not write your report with bullets only!
6. The outline is intended to be used as a guide only. Include all important information describing your lab regardless of whether or not that information is included in the outline.

39Uneven-AgedManagement
NCSR Special Topics I Uneven-Aged Management Conversion
Uneven-Aged Management Conversion
INTRODUCTION
In the Ponderosa pine-dominated forests east of the Cascade Mountains, uneven-aged silvicul-ture has become of increasing interest over the last decade, following changing social para-digms of forest management. With increased emphases on providing continuous forest cover, enhanced wildlife habitat, and aesthetically pleasing landscapes, alternative silviculture systems are being looked at, predominantly by public forestland managers, to provide the necessary structural diversity to meet these multiple needs and also meet timber management objectives.
Ecosystem management (EM), implemented on most public lands, has led to an increasing fo-cus on ecological processes and the linkages between components of the forest ecosystem. In addition to this ecological focus, EM mandates consideration of economic and social impacts of management practices as well. As an alternative to clearcutting, uneven-aged management provides methods that can practically be implemented at the stand level, providing ecological and economic viability as well as societal acceptance.
Research results on growth and yield in multi-aged stands in the westside Pacific Northwest regions is virtually non-existent. Projects to determine yields and success of regeneration are underway, but the process of acquiring useful information will be slow. Most managed forestlands in this area are currently even-aged, second-growth plantations, planted following a clearcut. Therefore, the process of creating uneven-aged stands requires conversion of these single-canopied forests, over multiple cutting cycles, into stands with multiple, vigorously growing age classes.
The “burning question” is:
How do we practically mark a stand of trees, on an individual tree selection basis, to meet overall stand objectives?
40Uneven-AgedManagement
PROCEDURE
Prior to lab, a sample one-acre square plot has been flagged at the corners and at plot center.
Management Objectives
Stands are marked according to specific objectives and silvicultural needs. Objectives may include enhancement of timber production, wildlife habitat, watershed quality, or aesthetics. Specific stand needs include stocking control, species composition, insect and pathogen control, and regeneration establishment.
For the purposes of this exercise, two groups will be formed from the class, each with a “color name” corresponding to the flagging color they will use to mark trees for re-tention. Each group will mark the entire plot in accordance with one of the following stand objectives:
• Blue group: Timber production is a central management focus, with one green tree per acre designated for snag recruitment (20 inches DBH or greater). Creating and maintaining a stand with three vigorously growing, productive age classes is a must. The cutting cycle will be 20 years. With consideration to potential yield and the control of mountain pine beetle infestation, the optimum residual SDI has been calculated to be 120.
• Pink group: A top management objective is aesthetics with a focus on larger stems, and maintaining an open, park-like Ponderosa pine stand. The cutting cycle is 20 years. With consideration to these objectives, the optimal SDI has been calculated to be 70.

41Uneven-AgedManagement
Each group will:
1. Initially, allocate SDI equally across the diameter classes.
2. Using the following equations, equate your SDI calculations to BA and TPA and re-cord these numbers on your sheet, under the corresponding columns.
BA diam. class = (.005454) (DBHavg.)2 (TPA)
SDI = TPA (DBHavg./10)1.6
3. Observe the resulting TPA numbers in each diameter class. Evaluate these numbers, and decide if they are going to meet the desired management goal in each diameter class.
4. Using rationale from the desired management goal, reallocate the SDI numbers, if nec-essary, in each diameter class and record these numbers in the second set of columns on the Exercise Sheet.
5. Record these amounts on the color-coordinated Exercise Sheet under the column marked TARGET TPA. Recalculate the equivalent amounts of SDI and BA and re-cord these numbers on your Exercise Sheet, under the corresponding columns marked TARGET SDI and TARGET BA
6. Using the TPA numbers in each diameter class, mark an “optimal level” line across the grid on your Target TPA Tally Sheet to indicate your target TPA for this one-acre plot.
7. Walk through the plot, with the Exercise Sheet and the Target TPA Tally Sheet to determine which stems will be cut, and which will be retained, based on the objectives of your group and the target TPA numbers for each diameter class. Observe spacing, and use your diameter tape to determine the size of retained trees. Use the prism to check target levels of basal area. Mark retained trees with coordinated (pink or blue) colored flagging. Shade in the boxes on the Tally Sheet to correspond to the number of retained stems per diameter class.
Remember: Stem form, crown condition, spacing, and indications of disease should be incorporated into this decision-making process. These factors, and others, are observed on the ground, and should take top priority in choosing leave trees. Do not sacrifice sound biological selection principles to exactly meet your target calculations.
8. Shade in Target TPA Tally Sheet bars indicating actual TPA levels obtained after the plot walk-through. Record these TPA amounts on the second set of corresponding columns of the Exercise Sheet.
9. Using the equations above, calculate actual BA and actual SDI amounts for each diame-ter class and record these amounts in the corresponding columns on the Exercise Sheet.

42Uneven-AgedManagement
10. In the field, while still on-site: Shade in the number of retained stems, in each diameter class (TPA), on an easel pad sheet with a hand-drawn histogram. Also indicate the BA amount retained in each diameter class by putting a numeric label at the top of each TPA histogram bar. Be sure to label both axes.
11. Back in the computer lab: Enter numbers into the EXCEL spreadsheet and provide histogram graphs of TPA, BA and SDI amounts across the diameter classes. For the purposes of labeling the graph, diameter classes may be represented by the midpoint. Show cut and retained amounts on the same histogram graph for each of the three graphs.
12. Present graphs and rationale for marking to other groups and provide a two-page report explaining the process and conclusions of this exercise. Include the EXCEL his-tograms in the report. Be sure to write about the trade-offs and obstacles encountered while trying to meet your calculated goals on a real plot of trees.
LAB PRODUCT
Prepare a report that includes the following:
• Introduction• Site Description• Management Objectives• Outline of sampling procedure(s)• Proposed targets for TPA, BA and SDI (provide tables exhibiting these)• Observations from walk-through• Final targets for TPA, BA and SDI (provide histogram graphs)• Trade-offs and obstacles• Conclusions (Answer the question, “So what?”)

43Uneven-AgedManagement
TARGET TPA (Trees Per Acre) TALLY SHEET
0.0 - 8 in.
Target TPA:
Target BA:
8.1 - 16 in.
Target TPA:
Target BA:
16.1 - 24 in.
Target TPA:
Target BA:
24.1 - 32 in.
Target TPA:
Target BA:
44Uneven-AgedManagement
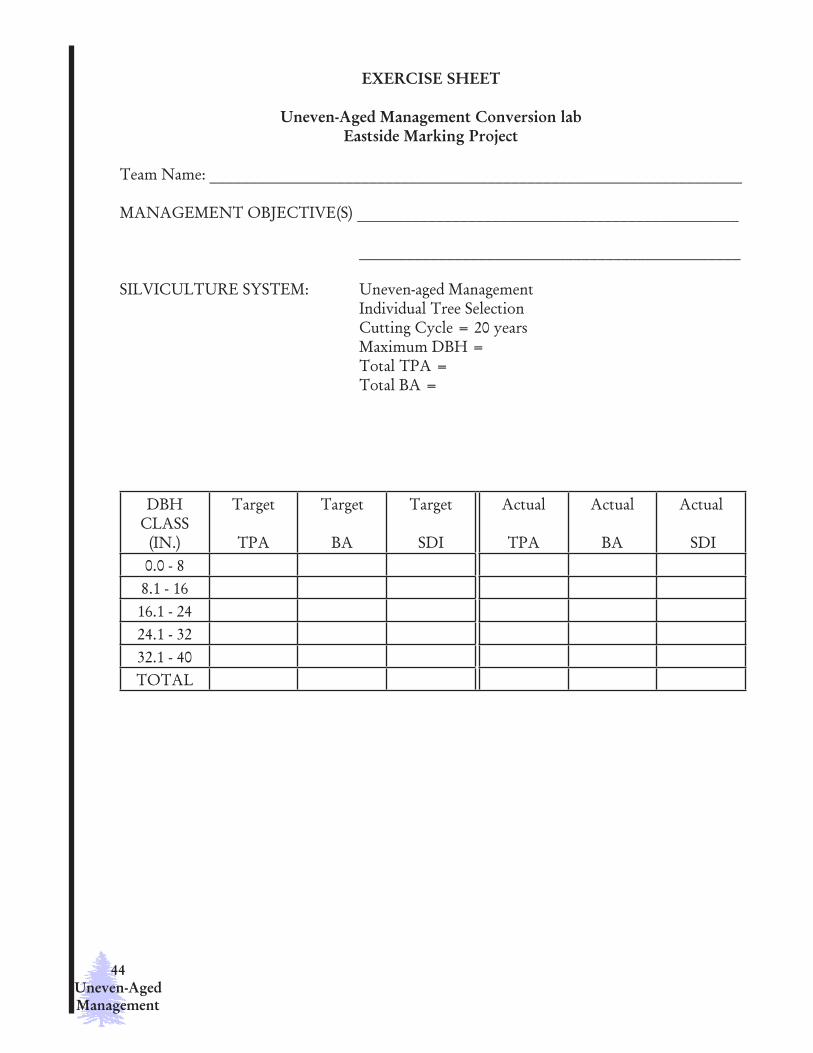
EXERCISE SHEET
Uneven-Aged Management Conversion labEastside Marking Project
Team Name: ___________________________________________________________________
MANAGEMENT OBJECTIVE(S) ________________________________________________
________________________________________________
SILVICULTURE SYSTEM: Uneven-aged Management Individual Tree Selection Cutting Cycle = 20 years Maximum DBH = Total TPA = Total BA =
DBHCLASS
(IN.)
Target
TPA
Target
BA
Target
SDI
Actual
TPA
Actual
BA
Actual
SDI0.0 - 88.1 - 1616.1 - 2424.1 - 3232.1 - 40TOTAL

45Uneven-AgedManagement
MATERIALS
Diameter tape20 BAF prism (optional)Target TPA tally sheetExercise sheetCalculator with exponential functions
REFERENCES
Cochran, P.H. 1992. Stocking levels and underlying assumptions for uneven-aged ponderosa pine stands. Pacific Northwest Research Station, USDA Forest Service. PNW-RN-509.
Cochran, P.H., J.M. Geist, D.L. Clemens, R.R. Clausnitzer and D.C. Powell. 1994. Suggested stocking levels for forest stands in northeastern Oregon and southeastern Washington. Pacific Northwest Research Station, USDA Forest Service. PNW-RN-513.
Emmingham, B. 1998. Uneven-aged management in the Pacific Northwest. Journal of For-estry. 96(7):37-39.
Fitzgerald, S. 1997. A conceptual approach to tree marking in uneven-aged stands. Unpub-lished paper. Proceedings from the Uneven-aged & Long Rotation Management Field Tour. March, 1997. Oregon State University Research Forest. Corvallis, Oregon.
Guldin, J.M. 1996. The role of uneven-aged silviculture in the context of ecosystem manage-ment. Western Journal of Applied Forestry. 11(1):4-12.
Long, J.N. 1998. Multi-aged systems in the central and southern Rockies. Journal of Forestry. 96(7):34-36.
NOTES FOR INSTRUCTORS
Use the following checklist for topics that need to be covered in the initial overview and dis-cussion prior to the lab:
• Plant associations• Limiting factors for tree growth• Soils• Fire ecology• Insect and disease management
Sample plots will need to be customized for your local conditions and needs.
•FOR INSTRUCTORS•

46SilviculturalApplications
NCSR Special Topics I Silvicultural Applications
Silvicultural Applications: Thinning Recommendations
INTRODUCTION
Thinning is an important tool in the silviculturist’s “tool box.” Promoting vigorous tree growth, preventing pathogen infestations, and enhancing wildlife habitat are just a few objec-tives around which silvicultural thinning prescriptions may be designed. To understand thin-ning and its importance in manipulating stand structure, the concepts of stand density must first be understood. Quadratic Mean Diameter (QMD), basal area per acre (BA), trees per acre (TPA), stem spacing, stand density index (SDI) and relative density (RD) are all frequently used measures of stand density in the Pacific Northwest. These calculations must be familiar to the effective silviculturist.
Calculations of stand density have been studied in the classroom; now it is time to apply them to a piece of forestland. This lab is designed to apply these calculated measures of stand density to a stand of second-growth Douglas-fir. Collecting mensuration data on tree age, diameter and height will facilitate the calculation of these density measures, and subsequently, an analysis of what “optimal density” is.
PROCEDURE
Plot Reconnaissance
1. Each installation will consist of 12 plots, six plots marked during each lab. The plots will be .05-acre circular plots. The radius of the plot should be calculated before leav-ing for the lab site. Buffer between plots (from plot center to plot center) =2.5 chains. Initial plots on each line are established one chain from the stand edge.
2. Within each .05-acre sample plot, a .01-acre subplot will be tallied for predominant understory vegetation. The subplot will be “double-centered” within the .05-acre plot. See sample plot layout diagram below.
3. Each plot will be flagged at the center, with additional flags distinguishing cruised trees from fix-sampled trees.

47SilviculturalApplications
4. For each sample plot, every tree above 2” DBH shall be recorded for measured (or observed) species, DBH, and condition. Increment boring shall be done on one domi-nant tree in three different plots. Heights shall be recorded for these trees, also. On these, measurements will be taken and calculations made for spacing/height ratios, live crown ratio, and height/diameter ratio. In each .01-acre subplot, the three most predominant species of understory vegetation will be recorded.
5. At each sample plot center, a sample point will be established to cruise trees with a 20-BAF prism. “In” trees will be measured for DBH, merchantable height, and form factor to obtain volume measurements. The variable-plot sampling (cruising) will be executed in a count-measure pattern on each sampling grid line.
Sample Plot Layout for .05-acre Plot
48SilviculturalApplications
Sample Plots
You will be assigned a 0.05-acre plot from which the following measurements will be taken:
• Number of trees• Number of trees by species (if applicable)• Average age at breast height (measured on 1 dominant tree per 2 plots)• Average dominant height (measured on 4 dominant trees per plot)• Percentage of live crown (measured on 4 dominant trees per plot)• Diameter at Breast Height• Associated plant species; predominant understory vegetation (on .01-acre subplot)• Condition class codes• Defect codes
LAB PRODUCT
Prepare a “Thinning Report” that includes the following sections:
Management Objectives
• Importance (if any) of income from timber• Sustainable supply of timber and/or other forest products• Ecological considerations• Educational/interpretive services• Wildlife habitat• Importance of aesthetics/social considerations• Species diversity
Description of Sampling Procedure and Measurements (taken from 0.05-acre plots)
• Grid dimensions and orientation• Number of trees (by species, if applicable)• Average age at breast height (measured on 3 dominant trees in stand)• Average dominant height (measured on same 3 dominant trees)• Percentage of live crown (measured on 1 dominant tree per plot)• Diameter at Breast Height• Associated plant species; predominant understory vegetation (on .01-acre subplot)• Condition of trees in form, merchantability, overall vigor and health

49SilviculturalApplications
Site/Stand Descriptions (based on all sample plots)
• Approximate acreage and map• Priority/dominant species• TPA• Average dominant height• Age• QMD• Site Index and Site Class• BA• Stem spacing• Height/spacing ratio• SDI and Relative Density• Volume
Thinning Recommendation
• Is thinning needed to promote optimal growth? Why? Explain how RD and other measures show you this.
• If thinning is needed, thin back to how many TPA?• On average, how many TPA will be removed? How much BA will be removed?• On average, how much BA, and how many TPA, will there be in the retained stand?• If you thin back to the “minimum” edge of the optimum growth zone, at what stand
QMD will the next cut take place?• Would you recommend a thinning from above or below? Why?• Based on the “ratio” methods of determining the need for thinning (crown ratio,
height-spacing ratio, height-diameter ratio), is there a need for thinning? Does this agree with your calculations of SDI and RD?
A template for a thinning recommendation report outline follows.

50SilviculturalApplications
THINNING RECOMMENDATION FINAL REPORT
Management Objectives
The land management representative listed the following management objectives for this stand:
1. 2.
For the entire tree farm as a unit, he said that the general management goals are to _________. This tree farm is managed by ___________________. As an organization, their first priority is to ___________. Also important to the successful management of this forest is __________. Because of ___________ , the tree farm managers must also manage to (conserve, provide, maintain, etc.) _____________. _____________ must also be considered since ____________.This stand of (species mix) is managed to supply ________________________. Careful con-sideration must be given to ___________________ because of the stand’s proximity to __________________.
Description of Inventory Procedures
Fixed, .05-acre, plots were sampled for ________________________ and data was recorded listing __________. The plots were placed on a sampling grid, with the initial sampling plot being located ___________ and __ chains in from ______________. Sample plot centers were then placed ____ chains apart on a sampling line with a bearing of ___________. Sampling lines were parallel with ____ chains between lines, and ___ lines were placed in the stand of ____ acres. Square sampling plots were laid out by _______________________, with the fol-lowing procedures for sampling:
Site Description
• Total acreage = _____ acres, the priority species = _______________ , TPA = _____• Average dominant (total) height = _________ feet, average age at breast height = ____
years• Site Index = ______ , Site Class = ____• BA/acre = ________ ft.2, QMD = ___ inches, stem spacing, on average = _______
feet• SDI = _____ , Relative Density = _______• Average live crown ratio in dominant trees = _____%, Height/spacing ratio = ______• Predominant ground vegetation (three most abundant species): __________________

51SilviculturalApplications
Thinning Recommendations
Based on the data acquired on this site, it is my recommendation that a thinning operation be performed on this stand to promote _______________. Because the (pertinent measurement) of the sampled plots is ____ , I believe the stand can be commercially thinned. I recommend a thinning from above to provide ______ and promote _____ for the future stand. The height-spacing ratio showed that _____________ , however the live crown ratio of most of the dominant stems showed _________________.
(Address condition of stand, the current level of relative density, intensity of thinning, mer-chantability of timber, signs of damage, social considerations, and relevance of all measure-ments to the stated management objectives.)

52SilviculturalApplications
TALLY SHEET
Names: __________________________________ Date: __________ Plot #: ______________
SPP DBH AGE HGT LCR HDR UVEG UVEG UVEG
Codes: Each of the elements in the following categories should have a code assigned.
SPP: SpeciesDBH: Diameter at breast heightAGE: AgeLCR: Live Crown RatioHDR: Height/Diameter ratioUVEG: Understory vegetation