NCOP PRESENTATION, 19 MARCH 2013
30
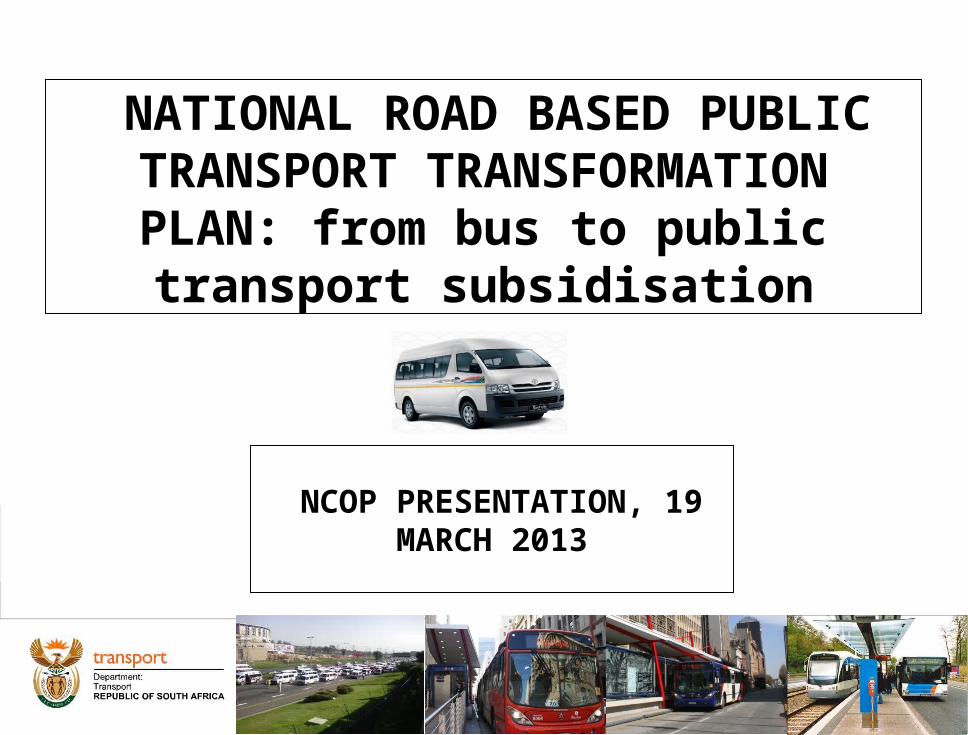
1 NATIONAL ROAD BASED PUBLIC TRANSPORT TRANSFORMATION PLAN: from bus to public transport subsidisation NCOP PRESENTATION, 19 MARCH 2013
description
NATIONAL ROAD BASED PUBLIC TRANSPORT TRANSFORMATION PLAN: from bus to public transport subsidisation. NCOP PRESENTATION, 19 MARCH 2013. Presentation Outline. Background Information Provincial Status Quo Investment in Public Transport Way Forward Funding Requirements - PowerPoint PPT Presentation
Transcript of NCOP PRESENTATION, 19 MARCH 2013
1
NATIONAL ROAD BASED PUBLIC TRANSPORT TRANSFORMATION
PLAN: from bus to public transport subsidisation
NCOP PRESENTATION, 19 MARCH 2013

2
Presentation Outline Background Information Provincial Status Quo Investment in Public Transport Way Forward Funding Requirements Implementation Programme Key Success Factors (Risks) Conclusion
3
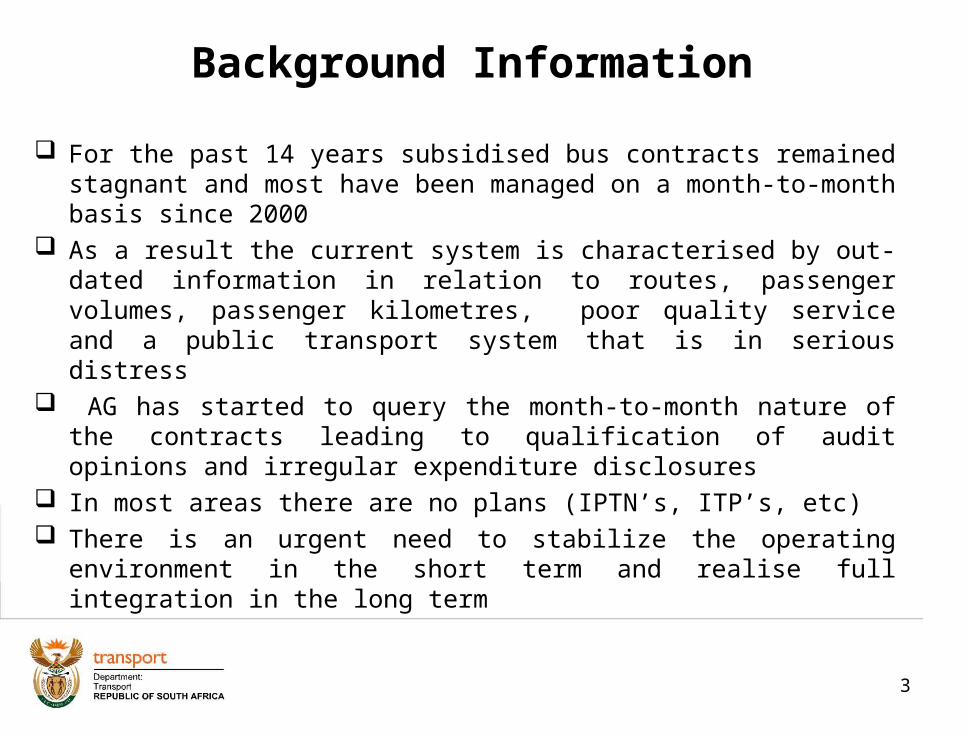
Background Information
For the past 14 years subsidised bus contracts remained stagnant and most have been managed on a month-to-month basis since 2000
As a result the current system is characterised by out-dated information in relation to routes, passenger volumes, passenger kilometres, poor quality service and a public transport system that is in serious distress
AG has started to query the month-to-month nature of the contracts leading to qualification of audit opinions and irregular expenditure disclosures
In most areas there are no plans (IPTN’s, ITP’s, etc) There is an urgent need to stabilize the operating environment in the
short term and realise full integration in the long term

4
Background Information
Provided for in Section 41 of the NLTA (No. 5 of 2009:
41. (1) Contracting authorities may enter into negotiated contracts with operators in
their areas, once only, with a view to—
(a) integrating services forming part of integrated public transport networks in
terms of their integrated transport plans;
(b) promoting the economic empowerment of small business or of persons
previously disadvantaged by unfair discrimination; or
(c) faciltating the restructuring of a parastatal or municipal transport operator to
discourage monopolies.
(2) The negotiations envisaged by subsections (1) and (2) must where appropriate include operators in the area subject to interim contracts, subsidised service contracts, commercial service contracts, existing negotiated contracts and operators of unscheduled services and non-contracted services.

5
Background Information…(modal split -road based)

Worldwide extensive funding support for public. Grounds: Economic: Vital for functioning and most economically efficient
means of (urban) travel Society: Equity, basic right of access Environmental / sustainability - least cost
Government funding to improve transport system effectiveness & sustainability and help achieve (spatial) development policy goals.
Background Information (Economic Rationale for Funding Support &
Subsidisation)
6

International Review-Total Cost of Transport Strategies
7
% local GDP on transportDeveloped cities High density, pro-public transport & NMT 5-7%
Low density, car based 12-15%Developing cities Low density sprawling 20% - 25%+
% M
etr
op
olit
an
GD
P
Source UITP 2006
Source UITP 2000
Conclusion: Compact cities with strong bias to public transport spend much less on transport with significant social and economic benefits
Richard Gordge
What do the red bars represent ?

Conclusion:Making public transport attractive (to all) requires major investments and subsidy. Only with increased corridor densities are operating cost
recovery likely to improve significantly.
International Review :Urban Densities and Operating Cost Recovery
8Background Information (International Review-Total Cost of Transport Strategies)
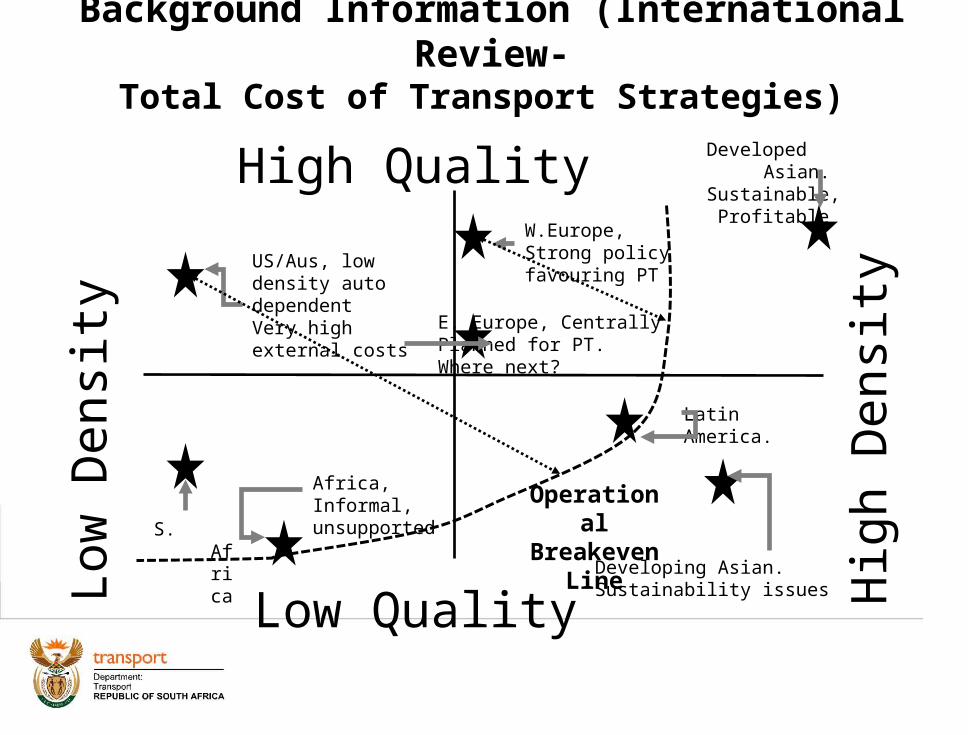
High Quality
Low Quality
Low
Den
sity
Hig
h D
ensi
ty
Developing Asian. Sustainability issues
Developed Asian. Sustainable, Profitable
Latin America.
W.Europe, Strong policy favouring PT
E. Europe, Centrally Planned for PT. Where next?
US/Aus, low density auto dependent Very high external costs
S. Africa
Africa, Informal, unsupported Operational
Breakeven Line
International Review :Plot of Systems based on Quality & Density
9Background Information (International Review-Total Cost of Transport Strategies)

Comparators: PTOG Subsidy
Exclusively intra-urban routes
Rural settlements linkage to regional centres
• Rural linkage to regional centres
• Intra-Urban Routes
Ex-homeland to main urban routes
•Transport to mines•Some rural to urban routes
•Long urban commuter routes•Long distance rural to urban commuter trips
Background Information…(subsidized services spread) Source: GIPTN

11
Background Information… (subsidy funding history)

12
Provincial Status Quo (PTOG Contracts)
Province Nature and number of contracts 2012/13 BudgetTotal Interim Tendered Negotiated
Eastern Cape 1 1 0 0 174,466
Free State 7 0 5 2 192,872
Gauteng 34 8 26 0 1,625,746
Kwazulu Natal 39 2 36 1 808,279
Limpopo 11 7 1 3 260,725
Mpumalanga 7 7 0 0 439,003
Northern Cape 6 1 0 5 39,255
North West 4 0 1 3 80,686
Western Cape 1 1 0 0 696,237
GRAND TOTALS 110 27 69 14 4,317,269

13
PTOG split per Province
2012/13 PTOG allocation R4,317,269,000

14
PTOG split per contract type
About R2.9billion of the R4,3billion annual bus subsidy (PTOG) goes to interim contracts
The amount exclude provincial allocations (Limpopo, North West and Eastern Cape)

METROS TOWNSHIPS INTO METROS RURALPutco
SowetoGolden Arrow
Putco Sandfontein
NWS Botlhaba Interstate
Ripple Effect(KZN )
Av trip distance 46 26 73 81 48 82Trips / bus/ day 2.0 4.2 5.4 2.2 3.9 1.7Km/bus/day 81 129 225 160 165 152Pax/bus/day 136 166 203 157 176 130Pax/bus/km 1.67 1.29 0.90 0.98 1.06 0.85% subsidy 60% 63% 62% 61% 81% 69%Subsidy/pass. R 13 R 12 R 13 R 18 R 13 R 25Average fare R 8 R 7 R 8 R 12 R 3 R 11Cost/km 36 25 19 30 17 31
Contract Cost Analysis
World Bank
250
1000+
4.5
1 rtn tripv low pax/bus.High cost/km
Less dist.low pax/busHigh sub.
Long tripsInter-work
Better cost/km1 rtn Long tripHigh cost/km
V low fare !
High per tripSubsidy
Long distance.
18

South Africa – Current Funding PictureN
atio
nal G
over
nmen
t Fun
ding
(R
m)
14
Cap
ital
: B
ench
mar
k +
B
ackl
og
= 1
6 to
24
Op
erat
ing
:
Ben
chm
ark
= 8
to
16
(12
Cit
ies)
(Rbn
)
Current PT Investments
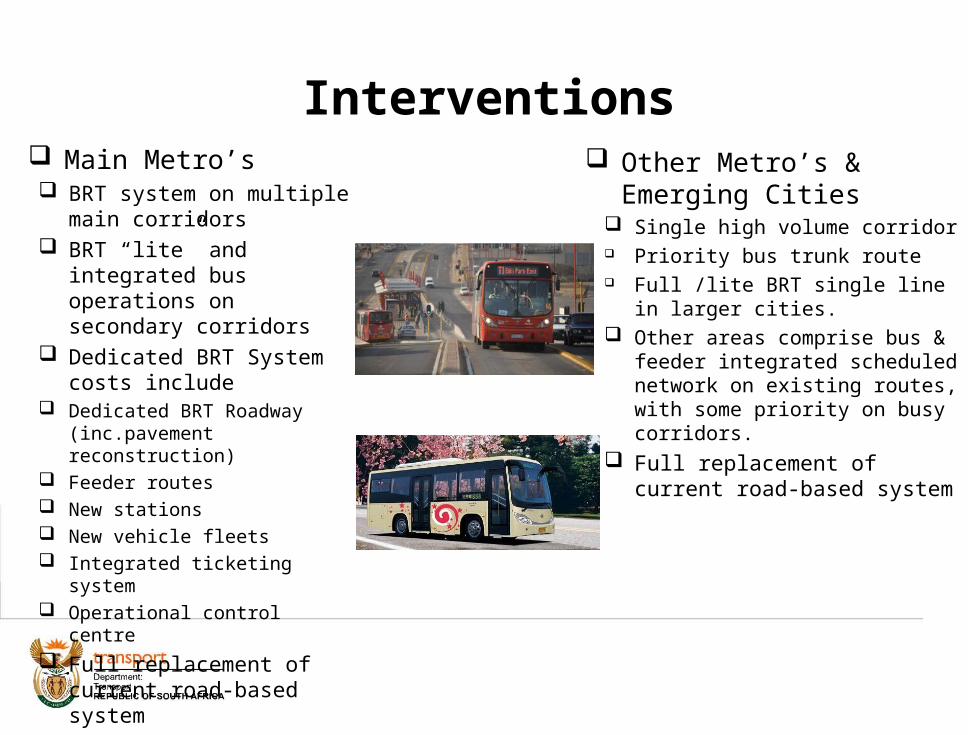
Interventions
23
Main Metro’s BRT system on multiple main
corridors BRT “lite” and integrated bus
operations on secondary corridors
Dedicated BRT System costs include
Dedicated BRT Roadway (inc.pavement reconstruction)
Feeder routes New stations New vehicle fleets Integrated ticketing system Operational control centre
Full replacement of current road-based system
Other Metro’s & Emerging Cities
Single high volume corridor Priority bus trunk route Full /lite BRT single line in larger
cities. Other areas comprise bus & feeder
integrated scheduled network on existing routes, with some priority on busy corridors.
Full replacement of current road-based system

Interventions24
Towns Formal bus system Inter-town services Mixed fleets including
Buses Midi buses Taxis
Full replacement of current road-based system
Scheduled services
High Density Rural and Rural Formalised mixed operations Vehicle re-cap Scheduled daily services to main centres Weekly services to regional towns Minimal infrastructure investments
Sparse Rural Selected interventions where viable Weekly & monthly services to towns Sharing services with health transport
and scholar transport Brokering, flexible scheduling and
confirmation of travel services No infrastructure costed

19
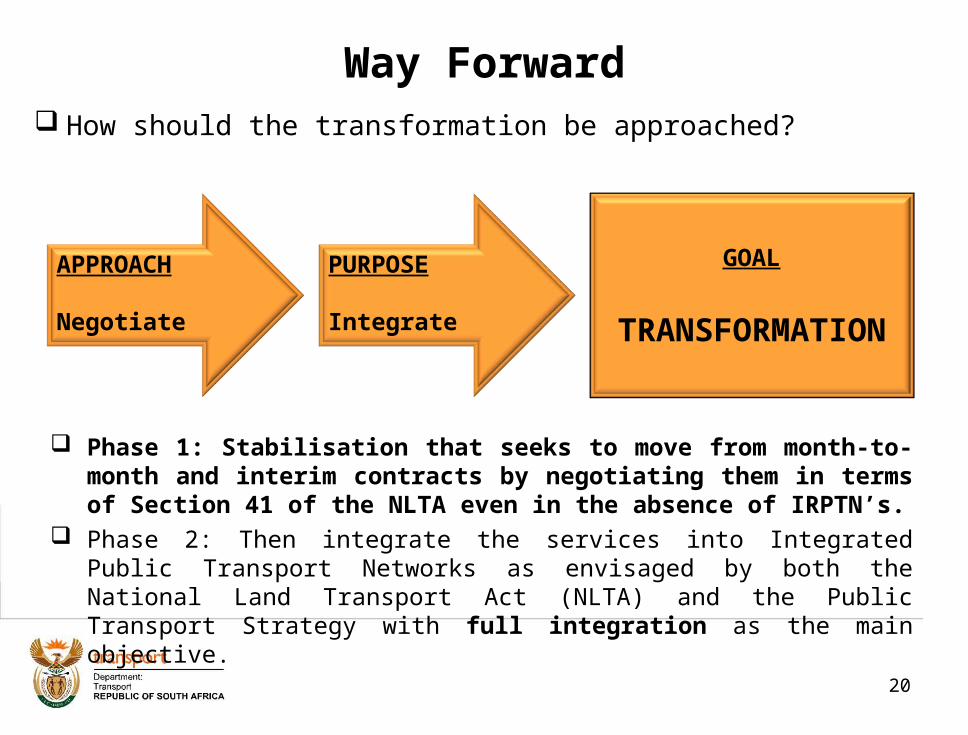
Way Forward
Why the need to transform: For the past 14 years subsidised bus contracts remained stagnant
and most have been managed on a month-to-month basis since 2000 As a result the current system is characterised by out-dated
information in relation to routes, passenger volumes, passenger kilometres, poor quality service and a public transport system that is in serious distress
AG has started to query the month-to-month nature of the contracts leading to qualification of audit opinions and irregular expenditure disclosures
In most areas there are no plans (IPTN’s, ITP’s, etc) There is an urgent need to stabilize the operating environment in the
short term and realise full integration in the long term.
20
How should the transformation be approached?
Phase 1: Stabilisation that seeks to move from month-to-month and interim contracts by negotiating them in terms of Section 41 of the NLTA even in the absence of IRPTN’s.
Phase 2: Then integrate the services into Integrated Public Transport Networks as envisaged by both the National Land Transport Act (NLTA) and the Public Transport Strategy with full integration as the main objective.
APPROACH
Negotiate
PURPOSE
Integrate
GOAL
TRANSFORMATION
Way Forward

21
Phase 1: Stabilisation Funds permitting identify interim and/or old order contracts to be
negotiated. Initially target those that need to be unbundled and ensure that at least one such contract per province is negotiated.
Identify role players (mainly industry role players whose operations will be affected by the targeted contracts/ routes)
Develop an national implementation work programme and involve the municipalities.
Fast track the removal of impediments; notably legislation obstacles (develop a cooperation framework to deal with the contracting authority challenges)
Integrate the different funding sources, starting with the soon to expire TRP allocation (as taxis will be integrated into mainstream formal public transport system).
Mobilise more funding
Way Forward

22
High Density Urban Setup (travel demand, congestion, travel time, etc
Low Density Rural Setup (availability, access etc.)
Dedicated infrastructure & services (BRT?)
Quality PT services to enable access and mobility
Phase 2: Full integration based on IPTN’s Address the contracting authority challenges in the NLTA. Review the Public Transport expectations in relation to the “12 cities”
requirements with regard to IRPTN’s Adopt a differentiated approach for different PT challenges in the country
Ensure the modes (rail, bus and taxi) compete for the road and not on the road. Integrate (merge) the funding streams ( PTIS, PTOG, TRP, Green Fund, etc.). MinMec approved the plan (concept) in principle
Way Forward

23
Subsidy Requirement (Stabilisation)

24
Funding Requirements (full integration)
Province 2012/13 Allocation‘000
Taxi/SBO integration‘000
Eastern Cape 174,466 523,398
Free State 192,872 578,616
Gauteng 1,625,746 4,877,238
Kwazulu Natal 808,279 2,424,837
Limpopo 260,725 782,175
Mpumalanga 439,003 1,317,007
Northern Cape 39,255 117,765
North West 80,686 242,058
Western Cape 696,237 2,088,711
TOTAL 4,317,269 12,951,805

25
Proposed programme per provinceImplementation Programme for MTEF period 2014/15 to 2016/17
Province2014/15 2015/16 2016/17
Contract Funding required ContractFunding required Contract
Funding required
Eastern Cape AB350 Phase 2 119,466,000 Algoa Bus Service 57,985,012
Mayibiye Bus
Service 89,404,900 Total 208,870,900 57,985,012 Free State IBL 50,424,139 Maluti Bus Service 10,849,884 Thebeyagae 143,905 Total 50,568,044 10,849,884
Gauteng North West Star 126,315,607 Putco Mamelodi 8,168,867Brakpan Bus
Service 3,939,927
Putco Soweto 88,269,829 Putco Kwandebele 163,862,569Putco
Soshanguve 67,319,861
Boksburg
Operations 9,797,808South Western
Areas 34,419,242 Atteridgeville BS 17,353,511 Eldorado Park 9,483,947 Vaal Operations 24,775,684 Total 224,383,244 215,934,625 113,388,983
Kwazulu Natal Impendhle 4,075,077Combined Transport 8,905,084 BTI (Ulundi) 9,896,966
Sizananimazulu 16,194,338 Ikhwezi 25,476,666 TansnatAfrica 12,430,322 Duzi Bus Service 985,250 TansAfrica 34,735,982 Nondweni BS 3,327,414 Thembekile 1,334,750 Emondlo 8,401,122 RippleEffect 7,189,715 Dumbe 1,298,864 Darnall 1,364,175 Maphumulo 1,112,452 Total 29,779,130 81,294,345 25,654,702

26
Implementation Programme for MTEF period 2014/15 to 2016/17
Province2014/15 2015/16 2016/17
Contract Funding required ContractFunding required Contract
Funding required
LimpopoGreat North Transport 83,085,555 Risaba 2,349,907 Putco 131,079
Mabirimisa 8,895,020Lowveld Bus
Service 7,013,468
Bahwaduba 12,105,064Swangi's Transport 9,918,162
Magwaba 8,691,662 Mukondeleli 4,088,084 R Phadziri 4,703,564 Netshituni 9,543,173 G Phadziri 12,239,699 Mulaudzi 5,730,988 Enos 9,917,489 Mabidi 784,345 Total 83,085,555 58,902,405 37,209,299Mpumalanga Buscor 116,108,991 Megabus 14,358,051 Tilly's 2,279,075 Thembalethu 1,527,971 Putco 782,175 GNT 5,456,581 Total 116,108,991 15,886,022 8,517,831Northern Cape Phumatra 3,339,478 Unitrans 6,145,026 Total 9,484,504 North West Atamelang 29,803,582 Bojanala 69,529,999 Phumatra 6,284,887 Thari Bus Service 54,346,413 Total 90,434,882 69,529,999 Western Cape 0 Golden Arrow 231,399,282 Total 0 231,399,282
Grand Total 812,715,250 741,781,574 184,770,815
Proposed programme per province

27
Implementation Programme for MTEF period 2014/15 to 2016/17
Province2014/15 2015/16 2016/17
Contract Funding required ContractFunding required Contract
Funding required
LimpopoGreat North Transport 83,085,555 Risaba 2,349,907 Putco 131,079
Mabirimisa 8,895,020Lowveld Bus
Service 7,013,468
Bahwaduba 12,105,064Swangi's Transport 9,918,162
Magwaba 8,691,662 Mukondeleli 4,088,084 R Phadziri 4,703,564 Netshituni 9,543,173 G Phadziri 12,239,699 Mulaudzi 5,730,988 Enos 9,917,489 Mabidi 784,345 Total 83,085,555 58,902,405 37,209,299Mpumalanga Buscor 116,108,991 Megabus 14,358,051 Tilly's 2,279,075 Thembalethu 1,527,971 Putco 782,175 GNT 5,456,581 Total 116,108,991 15,886,022 8,517,831Northern Cape Phumatra 3,339,478 Unitrans 6,145,026 Total 9,484,504 North West Atamelang 29,803,582 Bojanala 69,529,999 Phumatra 6,284,887 Thari Bus Service 54,346,413 Total 90,434,882 69,529,999 Western Cape 0 Golden Arrow 231,399,282 Total 0 231,399,282
Grand Total 812,715,250 741,781,574 184,770,815
Proposed programme per province

28
THE PLAN
Adequate (additional)
and sustainable
funding
Good, strong inter-sphere
relations
Uniform standards
and guidelines.
Effective M & E
From leadership,
management and
stakeholders. Communicate
all the time
Contracting role
clarification; legal
justification to negotiate v competition
TRANSFORMATION
Funding Institutional Structures
Support Commitment Legislation
(un)certainty
Key Success Factors
All of the above can also be viewed as RISKS if not attended to

29
The Plan was approved by MinMec. FUNDING remains the main impediment to achieve total
transformation and integration. The Taxi Recapitisation Programme will continue until taxis are fully
integrated in mainstream PT. In its current form the programme has to run for a further 2 years to allow for: Finalisation of the option analysis Securing adequate funding
Efficiencies will have to be introduced into the programme
Conclusion

THANK YOU