NCHRP Project 20-68A, Scan 14-02 Successful Intermodal...
118
Successful Intermodal Corridor Management Practices for Sustainable System Performance SCAN TEAM REPORT NCHRP Project 20-68A, Scan 14-02 Requested by the American Association of State Highway and Transportation Officials October 2016 The information contained in this report was prepared as part of NCHRP Project 20-68A U.S. Domestic Scan, National Cooperative Highway Research Program. SPECIAL NOTE: This report IS NOT an official publication of the National Cooperative Highway Research Program, Transportation Research Board, or the National Academies of Sciences, Engineering, and Medicine.
Transcript of NCHRP Project 20-68A, Scan 14-02 Successful Intermodal...

Successful Intermodal Corridor Management Practices for Sustainable System Performance
SCAN TEAM REPORT NCHRP Project 20-68A, Scan 14-02
Requested by theAmerican Association of State Highway and Transportation Officials
October 2016
The information contained in this report was prepared as part of NCHRP Project 20-68A U.S. Domestic Scan, National Cooperative Highway Research Program.
SPECIAL NOTE: This report IS NOT an official publication of the National Cooperative Highway Research Program, Transportation Research Board, or the National Academies of Sciences, Engineering, and Medicine.


IntroiiiS U C C E S S F U L I N T E R M O D A L C O R R I D O R
M A N A G E M E N T P R A C T I C E S F O R S U S TA I N A B L E
S Y S T E M P E R F O R M A N C E
Acknowledgments
This study was conducted as part of the National Cooperative Highway Research Program (NCHRP) Project 20-68A, the U.S. Domestic Scan program. This program was requested by the American Association of State Highway and Transportation Officials (AASHTO) through
funding provided by NCHRP. Additional support for selected scans is provided by the Federal Highway Administration (FHWA) and other agencies.
The purpose of each scan, and of Project 20-68A as a whole, is to accelerate the integration of innovative ideas into practice by information sharing and technology exchange among state transportation agencies. Experience has shown that personal contact with new ideas and their application is a particularly valuable means for sharing information about practices. A scan entails peer-to-peer discussions between practitioners who have implemented practices of interest and who are able to disseminate knowledge of these practices to other peer agencies. Each scan addresses a single technical topic that is selected by AASHTO and the NCHRP 20-68A Project Panel. Further information on the NCHRP 20-68A U.S. Domestic Scan program is available at http://apps.trb.org/cmsfeed/TRBNet-ProjectDisplay.asp?ProjectID=1570.
This report was prepared by the scan team for Scan 14-02, Successful Intermodal Corridor Management Practices for Sustainable System Performance. The members of the scan team are listed below. Scan planning and logistics are managed by Arora and Associates, P.C. Harry Capers served as the Principal Investigator. Melissa Jiang provided valuable support to the team. NCHRP Project 20-68A is guided by a technical project panel and managed by Andrew C. Lemer, PhD, NCHRP Senior Program Officer.
The scan team members include the following individuals:
Jean Wallace, Minnesota DOT, AASHTO Chair, Minnesota DOTBrian Hoeft, Regional Transportation Commission of Southern Nevada James Lambert, University of Virginia Kari Martin, Michigan DOT Neil Spiller, FHWA Steve Takigawa, California Department of Transportation Lynn Weiskopf, New York State DOT Brian Smith, AICP, Subject Matter Expert
DisclaimerThe information in this document was taken directly from the submission of the authors. The opinions and conclusions expressed or implied are those of the scan team and are not necessarily those of the Transportation Research Board or its sponsoring agencies. This report has not been reviewed by and is not a report of the Transportation Research Board or the National Academies of Sciences, Engineering, and Medicine.


IntrovA D VA N C E S I N
C I V I L I N T E G R AT E D M A N A G E M E N T
Scan 14-02 Successful Intermodal Corridor Management Practices for Sustainable System Performance
P R E PA R E D BY
R E Q U E S T E D BY T H E
American Association of State Highway and Transportation Officials
Jean Wallace, Minnesota DOT, AASHTO Chair, Minnesota DOTBrian Hoeft, Regional Transportation Commission of Southern Nevada
James Lambert, University of Virginia Kari Martin, Michigan DOT
Neil Spiller, FHWA Steve Takigawa, California Department of Transportation
Lynn Weiskopf, New York State DOT Brian Smith, AICP, Subject Matter Expert
Arora and Associates, P.C.Lawrenceville, NJ
October 2016
S C A N M A N AG E M E N T
The information contained in this report was prepared as part of NCHRP Project 20-68A U.S. Domestic Scan, National Cooperative Highway Research Program.
SPECIAL NOTE: This report IS NOT an official publication of the National Cooperative Highway Research Program, Transportation Research Board, or the National Academies of Sciences, Engineering, and Medicine.

TA B L E O F C O N T E N T S

TOC-iS U C C E S S F U L I N T E R M O D A L C O R R I D O R
M A N A G E M E N T P R A C T I C E S F O R S U S TA I N A B L E
S Y S T E M P E R F O R M A N C E
Table of Contents
Abbreviations and Acronyms ......................................................................... TOC-xi
Executive Summary ......................................................................................... ES-1Overview .............................................................................................................................................ES-1
Findings and Conclusions .............................................................................................................ES-3
Corridor Vision and Goals .................................................................................................ES-3
Collaboration ..........................................................................................................................ES-3
Leadership ...............................................................................................................................ES-3
Systems Approach ...............................................................................................................ES-4
Data ............................................................................................................................................ES-4
Customer-Focused Performance Measurement/Management ..........................ES-4
Outreach ...................................................................................................................................ES-4
Funding .....................................................................................................................................ES-5
Sustainability ..........................................................................................................................ES-5
Recommendations ...........................................................................................................................ES-5
1 Introduction and Background ................................................................... 1-1The Scan 14-02 Problem Statement ........................................................................................1-1
Background ........................................................................................................................................1-2
Corridor Planning .............................................................................................................................1-4
Corridor Management ....................................................................................................................1-5
Performance-Based Planning and Management ................................................................1-7
Decision Making and Governance .............................................................................................1-8
Intermodal Corridor Management Is Not Integrated Corridor Management ..........1-9
Unique Components of Intermodal Corridor Management for Sustainable System Performance ......................................................................................................................................1-10
2 Overview of Scan Peer Workshop ............................................................ 2-1
3 Key Findings and Conclusions .................................................................. 3-1Corridor Vision and Goals ............................................................................................................3-1
Collaboration .....................................................................................................................................3-2
Leadership ..........................................................................................................................................3-2
Systems Approach ..........................................................................................................................3-3
Data .......................................................................................................................................................3-4
Customer-Focused Performance Measurement/Management .....................................3-5
Outreach ..............................................................................................................................................3-6
Funding ................................................................................................................................................3-6
Sustainability .....................................................................................................................................3-6
4 Recommendations ...................................................................................... 4-1
5 Implementation Strategies ........................................................................ 5-1

TOC-ii
L I S T O F A P P E N D I C E S

TOC-iiiS U C C E S S F U L I N T E R M O D A L C O R R I D O R
M A N A G E M E N T P R A C T I C E S F O R S U S TA I N A B L E
S Y S T E M P E R F O R M A N C E
TOC-iii
List of Appendices
Appendix A: Scan Team Biographical Sketches ................................................................................AA
Appendix B: Scan Team Contact Information ....................................................................................AB
Appendix C: Amplifying Questions .........................................................................................................AC
Appendix D: Workshop Presentation Summaries .............................................................................AD
Appendix E: Host Agency Contacts .......................................................................................................AE

TOC-iv
L I S T O F F I G U R E S

TOC-vS U C C E S S F U L I N T E R M O D A L C O R R I D O R
M A N A G E M E N T P R A C T I C E S F O R S U S TA I N A B L E
S Y S T E M P E R F O R M A N C E
List of Figures
Figure D-1
Arizona’s AZTech Partnership focuses the efforts of many agencies in developing seamless
transportation for Phoenix. .......................................................................................................................................AD-2
Figure D2
The Caltrans mobility pyramid recognizes the fundamental roles of system maintenance and
monitoring while integrating data and operational technologies with system expansion and land
use/demand management to improve mobility. ...............................................................................................AD-6
Figure D-3
The I-15 ICM project in San Diego used a capability maturity model to assess strengths, allowing the
multiagency team to address technical and institutional weaknesses ....................................................AD-8
Figure D4
San Diego’s I-5 project employs dynamic rerouting in providing multimodal management
of the corridor. ................................................................................................................................................................AD-9
Figure D5
The I-80 SMART corridor combines technology with multimodal traveler information to manage an
intensely urban and congested corridor in the San Francisco Bay Area. .............................................. AD-11
Figure D6
Managing the I-80 SMART corridor requires a variety of technologies and installed devices to
provide travelers with dynamic routing and operating instructions. ......................................................AD-12
Figure D7
The I-80 SMART corridor is being delivered by a strong, collaborative partnership of many state,
regional, and local agencies united by an MOU which addresses stakeholder and community
concerns. ......................................................................................................................................................................... AD-13
Figure D8
Transportation planning in Florida supports a shared vision of future development. .................... AD-14
Figure D9
Florida’s planning efforts have identified four themes, which are guiding future land use and
economic and transportation corridor development. .................................................................................. AD-15
Figure D10
The East Central Florida Corridor effort is focused on an area of the state expected to experience
significant population and economic growth. ................................................................................................. AD-15
Figure D11
Maryland’s Model of Sustainability and Integrated Corridors (MOSAIC) is a high-level tool for
analyzing the impact of multimodal highway improvements on sustainability indicators, improving
long-range planning and project screening, and enhancing environmental stewardship. ............ AD-19
Figure D12
MOSAIC is being enhanced to include additional multimodal improvement types to be analyzed,
new data inputs, and new report formats. It is seen as becoming useful not only in HNI project
reviews, but also in corridor, concept and feasibility studies, development review, and initiating and
helping scope project planning and environmental analyses. Although flexible, MOSAIC could prove
unwieldly if used to examine too large a corridor. ......................................................................................... AD-19
Figure D13
The transit metric MassDOT developed to support its performance management approach to
guiding transportation investments .....................................................................................................................AD-22
Figure D14
The New York City area presents multimodal transportation service providers with myriad
operational and investment challenges in an intensely urban setting. ..................................................AD-23
Figure D15
Operating the multimodal transportation system in New York City requires interagency collaboration
to take advantage of many data sources needed to support operations and sophisticated multilevel
modeling. ........................................................................................................................................................................AD-25
Figure D16
When beginning to update its comprehensive transportation plan in 2012, North Carolina critically
examined its strategic highway corridors effort, initiated in 2004, to address
lessons learned ............................................................................................................................................................ AD-26
Figure D17
The state legislature revised NCDOT’s strategic highway corridors (SHC) development process in
2015 to emphasize a multimodal strategic transportation corridor system. .......................................AD-27
Figure D18
North Carolina’s strategic transportation corridor system is intended to promote economic
prosperity by connecting the state’s activity center clusters with one another and providing access
to important out-of-state economic activity centers................................................................................... AD-28
Figure D19
When Oregon’s Jobs and Transportation Act of 2009 required the use of a least-cost planning tool,
ODOT responded by developing Mosaic. ......................................................................................................... AD-29
Figure D20
How the Oregon Mosaic least-cost planning tool improves transportation
investment decisions .................................................................................................................................................AD-30
Figure D21
Mosiac allows the analysis of a project bundle’s benefits in nine categories, each with its own
quantitative and qualitative indicators. .............................................................................................................. AD-31
Figure D22
Oregon tested Mosaic on project bundles in the Portland region. ........................................................ AD-32
TOC-vi
L I S T O F F I G U R E S

Figure D23
Planning for Utah’s Wasatch Front Central Corridor, which includes I-15, heavy rail, light rail, bus
rapid transit, transit, and active transportation systems, builds on the collaborative use of common
planning assumptions by the three primary agencies: UDOT, MAG, and WFRC. ............................ AD-33
Figure D24
The Wasatch Front Central Corridor partners recognize that long-term success will depend on
continuously breaking down traditional funding and policy silos that prevent the development of
effective multimodal transportation systems. ................................................................................................AD-34
Figure D25
The I-95 corridor in northern Virginia is representative of the goals set by the Commonwealth
Transportation Board in designating Corridors of Statewide Significance as required by 2009 state
legislation. ...................................................................................................................................................................... AD-35
Figure D26
Virginia’s approach to corridor development management is based on a set of practical and
pragmatic principles. ................................................................................................................................................. AD-36
TOC-viiS U C C E S S F U L I N T E R M O D A L C O R R I D O R
M A N A G E M E N T P R A C T I C E S F O R S U S TA I N A B L E
S Y S T E M P E R F O R M A N C E

TOC-viii
L I S T O F TA B L E S

List of Tables
Table 1.1
Workshop participants’ relevant experience in each of the findings and
conclusions categories .....................................................................................................................................................3-1
TOC-ixS U C C E S S F U L I N T E R M O D A L C O R R I D O R
M A N A G E M E N T P R A C T I C E S F O R S U S TA I N A B L E
S Y S T E M P E R F O R M A N C E

A B B R E V I AT I O N S A N D A C R O N Y M S

TOC-xiS U C C E S S F U L I N T E R M O D A L C O R R I D O R
M A N A G E M E N T P R A C T I C E S F O R S U S TA I N A B L E
S Y S T E M P E R F O R M A N C E
Abbreviations and AcronymsAASHTO American Association of State Highway and Transportation Planning OfficialsADOT Arizona Department of TransportationADTM Active Traffic and Demand ManagementAMPO Association of Metropolitan Planning OfficialsCaltrans California Department of TransportationCEO Chief Executive OfficerCoSS Corridors of Statewide Significance (VirginiaCTP Comprehensive Transportation PlanDOT Department of TransportationFDOT Florida Department of TransportationFHWA Federal Highway AdministrationFTA Federal Transit AdministrationGIS Geographic Information System(s)HOT High-Occupancy TollHOV High-Occupancy VehicleHRTPO Hampton Roads Transportation Planning Organization (Virginia)ICM Integrated Corridor ManagementITS Intelligent Transportation System(s)MAG Mountainland Association of Governments (Utah)MAP-21 Moving Ahead for Progress in the 21st Century ActMassDOT Massachusetts Department of TransportationMDOT Maryland Department of TransportationMnDOT Minnesota Department of TransportationMPO Metropolitan Planning OrganizationMODA Multiple Objective Decision AnalysisMOSAIC Model of Sustainability and Integrated Corridors (Maryland)MOU Memorandum of UnderstandingMTC Metropolitan Transportation CommissionMUL Managed-Use LaneNCDOT North Carolina Department of TransportationNCHRP National Cooperative Highway Research ProgramNEPA National Environmental Policy ActNYCDOT New York City Department of TransportationNYSDOT New York State Department of TransportationODOT Oregon Department of TransportationSANDAG San Diego Association of GovernmentsSBS Select Bus Service (New York)SCTPO Space Coast Regional Transportation Planning Organization (Florida)SHA State Highway Administration (Maryland)SHC Strategic Highway Corridors (North Carolina)SMART Safety, Mobility, and Automated Real-time Traffic (California)SMF Smart Mobility Framework (Caltrans)

STC Strategic Transportation Corridor (North Carolina)TIGER Transportation Investment Generating Economic Recovery (grant program)TMC Traffic Management Center/Transportation Management CenterTMP Traffic Management Plan (Virginia)TRB Transportation Research BoardUDOT Utah Department of TransportationUSDOT United States Department of TransportationUTA Utah Transit AuthorityVDOT Virginia Department of TransportationWFRC Wasatch Front Regional Council (Utah)
TOC-xii
A B B R E V I AT I O N S A N D A C R O N Y M S

TOC-xiiiS U C C E S S F U L I N T E R M O D A L C O R R I D O R
M A N A G E M E N T P R A C T I C E S F O R S U S TA I N A B L E
S Y S T E M P E R F O R M A N C E

E X E C U T I V E S U M M A R Y
ES-1S U C C E S S F U L I N T E R M O D A L C O R R I D O R
M A N A G E M E N T P R A C T I C E S F O R S U S TA I N A B L E
S Y S T E M P E R F O R M A N C E
Executive SummaryOverview
Intermodal corridor management strives to meet transportation demand at the least social and economic cost while maximizing the return on previous and future investments in infrastructure and services. Intermodal corridor management builds on the principles of multimodal corridor planning,
integrated corridor management (ICM), and active traffic management. It recognizes that multiple modes can satisfy a variety of travel demands within a corridor and that most movement of people, goods, information, and services in a corridor involves movement between modes. This scan project is intended to produce practical guidance and examples for state departments of transportation and metropolitan planning organizations seeking opportunities to coordinate investments in multiple modal transportation networks within a corridor to maximize capacity and capitalize on investments creating synergies between modes.
The term “intermodal corridor management” as used in this scan project report could lead to confusion if reduced to an acronym. Practitioners of integrated corridor management feel understandable ownership of the acronym ICM so it is not easy to reduce this project’s topic to a simple set of letters. ICM refers to a more tactical approach to operating primarily highways and streets for optimal results. Intermodal corridor management presents a strategic way to determine the best investments in multiple modes to improve a transportation corridor’s productivity to support longer term social goals related to economy, environment, and community development and quality of life. Both concepts rely on collaboration between the owners and operators of transportation facilities within a corridor to integrate operations and supporting technologies. Additionally, the concept of what constitutes a transportation corridor is, in practice, elastic, ranging from short highway segments to longer highway segments to multiple modes of transportation sharing a linear course that may stretch between cities or between states.
The scan team members represent federal, state, and local transportation agencies and academia, all united by an interest in and passion for developing practical, innovative, and sustainable solutions to current and future mobility challenges. Rather than visit a number of agencies at different geographic locations, the team decided that a peer-exchange type of workshop would be the best way to gather information on best practices and enable interaction between practitioners themselves and with the scan team on such topics as:
Developing a purpose/vision for the management of the corridor(s) and how public input was used
Identifying relevant modes and linkages
Determining potential modal capacity and travel market share
Identifying modal performance parameters and success indicators
Exploring governance/institutional arrangements
Describing challenges to improving multimodal and intermodal performance
Describing implementation, operating and maintenance costs
Sharing returns on investment
Exploring sustainable transportation
ES-2
E X E C U T I V E S U M M A R Y
Scan team biographical sketches are provided in Appendix A; contact information is provided in Appendix B.
Based on a literature search and desk scan of current practices nationwide, the scan team invited the following states and agencies to participate in a weeklong workshop held in San Diego, California, during October 2015:
Arizona
Arizona Department of Transportation (AzDOT)
Maricopa County Department of Transportation
City of Scottsdale
California
California Department of Transportation (Caltrans)
San Diego Association of Governments (SANDAG)
Federal Highway Administration (FHWA) California Division
Florida
Florida Department of Transportation (FDOT)
Florida Department of Economic Opportunity
Space Coast Transportation Planning Organization (SCTPO)
Maryland State Highway Administration
Massachusetts Department of Transportation (MassDOT)
New York
New York State Department of Transportation (NYSDOT)
New York City Department of Transportation (NYCDOT)
North Carolina Department of Transportation (NCDOT)
Oregon Department of Transportation (ODOT)
Utah
Utah Department of Transportation (UDOT)
Mountainland Association of Governments (MAG)
Wasatch Front Regional Council (WFRC)
Virginia
Virginia Department of Transportation (VDOT)
Hampton Roads Transportation Planning Organization (HRTPO)
Prior to the workshop, the team provided workshop participants with a copy of the project desk scan and a set of amplifying questions which each participant group answered in writing. Each participating state team made a formal presentation during the workshop. Most teams were able to observe the other state team presentations and participate in the ensuing discussions. The contributions and input from all participants

ES-3S U C C E S S F U L I N T E R M O D A L C O R R I D O R
M A N A G E M E N T P R A C T I C E S F O R S U S TA I N A B L E
S Y S T E M P E R F O R M A N C E
throughout the entire workshop enriched the project team’s analysis and interpretation of the information presented.
The amplifying questions are provided in Appendix C, workshop presentation summaries in Appendix D, and host agency contact information in Appendix E.
Findings and ConclusionsThis project found no “silver bullets” when it comes to examples of successful, fully developed intermodal corridor management. However, many areas of the country are putting the pieces together to provide best practices that others can use as they move forward.
Corridor Vision and Goals
Several states have undertaken comprehensive efforts to define their core values and describe how they want to grow and develop in the future. This provides a common vision and set of goals that all levels of government, the private sector, and the public can share in identifying and managing transportation decisions and investments. The governor, private sector chief executive officers, legislators, department directors, public opinion leaders, and/or some combination of these can drive vision and goal setting. Who drives the effort is less important than the outcome of developing a guiding vision with clear objectives and quantifiable goals to set the context and coalesce support for subsequent decisions. However, the higher placed and more inclusive the champions of visioning and goal-setting are, the greater the likelihood of future success, particularly when some of those champions will still be there past the next election cycle. As one state’s team said during the scan, engaging the private sector takes some of the fear of planning out of the process.
A statewide vision provides a means for developing desired outcomes (e.g., serving freight to support economic growth goals, providing access to job centers or facilities critical to national defense, and preserving sensitive environmental or cultural areas) that can be used to identify and prioritize transportation corridors and adopt appropriate performance metrics. A unified vision also promotes the intense collaboration needed by multiple public and private agencies to effectively develop and operate multimodal corridors.
Collaboration
Intermodal corridor management requires collaboration at the highest end of the collaboration spectrum. Integrated corridor management efforts provide good examples of the degree of cooperation required to get multiple agencies operating in a coordinated, coherent effort to support common goals. Intermodal corridor management can increase the number of players by expanding geographic territory and increasing the modal facilities and services involved. Additionally, intermodal corridor management increases the time frame for collaboration by starting earlier in the planning stages of corridor development and modal improvements and extending collaborative efforts into operations and maintenance activities. Examples of successful collaboration in multimodal corridor development are characterized by shared goals, resources, and decision-making and by formal agreements.
Leadership
Leadership can focus efforts, break down silos, drive and empower organizational and cultural change, and provide champions. Change can come from legislative action or an Executive’s directive. Leadership and championing from the top are very important; however, to really get results you also need to get buy-in from the bottom up. Several state legislatures have created statutory frameworks for multimodal system development and project evaluation, selection, and prioritization. Several of the departments of transportation participating in this scan project have overtly adopted policies and organizational structures

intended to break down modal and funding silos to support developing intermodal and multimodal transportation systems and corridors. Agency leadership is changing the cultural mindset to focus on moving people and freight and using mode-neutral performance measures; leveraging technology to increase performance; considering operational strategies earlier in planning and project development; and incorporating emerging priorities, such as active transportation, into everyday practices. Leadership is necessary to turn policy statements into action.
Systems Approach
Corridors are defined by more than topography or the location of a highway. They can be shaped by many factors, such as current and projected population growth and economic development areas, multiple modes connecting major urban areas, or connections between port facilities and manufacturing and distribution centers. Travel patterns and multiple modes provide a means of describing corridors along which facility and operational improvements can increase the ability to move people and goods, even in intensely urbanized areas. Successful intermodal corridor management is both locale- and situation-dependent. Not all facilities and services fit everywhere, and not all performance goals can be achieved everywhere. Expectations of system users, such as travel times and mode choice, must be kept realistic. Transportation mode investments should compete in terms of customer-oriented outcomes like time, access/connectivity, price, convenience, reliability, and predictability.
Data
Data is an investment and an asset and must be planned and managed as such, starting when corridor goals are being developed. Data is necessary for planning, improving, and managing intermodal corridors. Data tells the story of a corridor’s performance, to support managing the corridor on a daily basis, to justify additional investments, and to sustain support for ongoing operations and maintenance costs. Data requires efficient collection, analysis, storage, and maintenance, and effective reporting. Real-time data collection and use supports managing and adjusting corridor throughput as necessary. The owners and operators of the modal networks within a corridor must coordinate their efforts so that data can be shared, integrated, and, most importantly, used. Data should support different levels of modeling appropriate for improving decisions at different stages of corridor development and management. In any corridor, however, data can be used to improve management and investment decisions, even if they are not perfect, as long as their limitations are recognized.
Customer-Focused Performance Measurement/Management
Gaining and sustaining popular and political support for intermodal corridor management and operation depends on explaining performance goals and results in terms that are meaningful and important to customers. Travelers are concerned about trip safety and affordability, travel time reliability, and being able to get where they want to when they need to be there. Businesses are concerned about timely availability of supplies and their ability to provide goods and services to customers. Customers will choose whatever modes of travel best provide those outcomes. System users will support corridor management efforts and investments that provide practical choices, improve modal performance, and achieve other societal goals, like economic growth, healthy communities, and environmental quality.
Outreach
Effectively engaging the public and elected officials to understand their needs and increase their knowledge of, and support for, improving the effective management and operation of multimodal transportation corridors has taken a variety of approaches across the country. These efforts range from deliberately reaching out to environmental justice communities and media approaches targeted at specific demographic
ES-4
E X E C U T I V E S U M M A R Y

groups to using surveys and social media to inform and effectively engage and educate the public and elected officials.
Funding
Sustained funding for intermodal corridor management is a challenge. Then again, sustained funding for transportation system improvement, operation, maintenance, and rehabilitation in general is a challenge. At least one state is planning corridor development with the assumption that all new capacity will be tolled. Even where funding is insufficient for fully carrying out intermodal and multimodal corridor management plans, states are finding creative ways to make incremental progress. Integrated corridor management is an important component of intermodal corridor management, and one that requires adequate funding to provide technical resources and staff operations 24/7. These funding challenges reinforce the need to make the business case about outcomes the public understands, cares about, and is willing to pay for.
Sustainability
Traditionally, sustainability in transportation has been defined in terms of striking a balance in the economic, environmental, and social benefits of transportation improvements while minimizing the projects costs in those same three dimensions. Embracing the concepts of the Brundtland Report1, sustainable transportation would be that which meets the multiple needs of the present to safely and reliably provide access to people, goods, information, and services without compromising the ability of future generations to meet their own mobility needs. States are undertaking various efforts to promote sustainability in intermodal transportation system and corridor management and development ranging from scenario planning and design flexibility to minimizing climate change-related impacts to looking at multigenerational transportation and land-use planning horizons.
RecommendationsThe findings of this domestic scan suggest recommendations related to dissemination of the information collected, workforce development, and further research.
Model efforts to disseminate the results of this scan after the climate change adaptation pilot program working with both FHWA and the Federal Transit Administration (FTA) (acting as “one USDOT”).
The United States Department of Transportation (USDOT), the American Association of State Highway and Transportation Planning Officials (AASHTO), the Association of Metropolitan Planning Officials (AMPO), and the Transportation Research Board (TRB) should work with the academic community to provide the workforce needed to develop, build, and operate the intermodal corridors of the future:
Improve planning and engineering curricula to merge the disciplines and emphasize operations strategies, intelligent transportation system (ITS)/ICM technology applications, data management and analysis, and visualization techniques for operations and planning applications.
Develop new job classifications relevant to multimodal corridor operations that go beyond traditional operations and planning.
Develop certification and recertification programs for the hands-on operators and managers of
ES-5S U C C E S S F U L I N T E R M O D A L C O R R I D O R
M A N A G E M E N T P R A C T I C E S F O R S U S TA I N A B L E
S Y S T E M P E R F O R M A N C E
1 Report of the World Commission on Environment and Development: Our Common Future, 1987, http://www.un-documents.net/our-common-future.pdf

integrated and intermodal corridors.
USDOT should continue to use Transportation Investment Generating Economic Recovery (TIGER), ICM pre-implementation and implementation grants, and other discretionary or targeted funding opportunities to incentivize and promote collaborative efforts to develop and operate managed multimodal corridors, and consider developing a specific pilot program similar to past and current ICM efforts to promote intermodal corridor planning and development.
USDOT, AASHTO, and AMPO should be proactive in mainstreaming the concept of multimodal managed corridors and support efforts to make the argument for adequately funding planning, data acquisition, and maintenance of corridor operations.
AASHTO should incorporate the findings and recommendations of this project into its National Operations Center of Excellence activities.
FHWA, FTA, and AASHTO should continue to work with other stakeholders to update design manuals and guidelines—being sensitive to facility type, place type, and location—to accommodate both multimodal network facilities and operations components.
AASHTO’s Standing Committee on Planning should prepare a research proposal for developing a capability maturity model for integrated multimodal corridor management to promote state and local improvement efforts. Such models provide agencies with a clear picture of what they want to be able to accomplish; they provide a means to evaluate their current strengths and identify specific areas where they need to develop staff and institutional abilities; and they provide a way to measure progress toward being able to achieve their goals.
Future research in multimodal and intermodal corridor development and management should consider:
The role served by intermodal transition points as throughput capacity enhancers or limiters
The potential impacts of disruptive technologies such as unmanned aerial vehicles for freight delivery
The potential for both enhanced operations and data acquisition presented by autonomous and connected vehicles
Better tools for measuring mode share for ride share and active transportation modes
USDOT and the National Cooperative Highway Research Program (NCHRP) should support a synthesis of best practices or support research into better measuring and forecasting person throughput via multiple modes in corridors to justify appropriate investments.
ES-6
E X E C U T I V E S U M M A R Y

ES-7S U C C E S S F U L I N T E R M O D A L C O R R I D O R
M A N A G E M E N T P R A C T I C E S F O R S U S TA I N A B L E
S Y S T E M P E R F O R M A N C E

C H A P T E R 1 : I N T R O D U C T I O N A N D B A C KG R O U N D

1–1S U C C E S S F U L I N T E R M O D A L C O R R I D O R
M A N A G E M E N T P R A C T I C E S F O R S U S TA I N A B L E
S Y S T E M P E R F O R M A N C E
1 Introduction and Background
At the end of the last millennium, Neil Pedersen, then with the Maryland Department of Transportation (DOT) and now the executive director of the Transportation Research Board (TRB), wrote one of a series of white papers for TRB’s Committee on Statewide Multimodal
Planning discussing issues facing transportation planners in the 21st century. In that paper, “Multimodal Transportation Planning at the State Level—State of Practice and Future Issues,”2 he wrote:
Although multimodal and intermodal planning is not new, analysis tools and performance measures that allow for mode-neutral and multimodal evaluations are woefully inadequate. Planning still takes place mostly at the modal level, and statewide plans are often a compilation of modal plans rather than a series of multimodal and intermodal solutions to identified needs. Successful examples of multimodal and intermodal planning processes should be documented and evaluated, with particular attention to how institutional issues can be addressed successfully. Technical tools that allow mode neutral and multimodal evaluations also need to be developed.
Fifteen years later, this scan project intends to identify successful examples and best practices in intermodal and multimodal corridor planning and management.
The Scan 14-02 Problem StatementIn February 2014, the American Association of State Highway and Transportation Planning Officials (AASHTO) selected the following problem statement for inclusion in the NCHRP 2068 Domestic Scan Program.
Intermodal corridor management strives to match the right services to meet demand at the least social and economic cost while maximizing the return on previous and future investments in infrastructure and services. As a management concept, intermodal corridor management builds on the principles of multimodal corridor planning, integrated corridor management, and active traffic management. It recognizes that multiple modes can satisfy a variety of travel demands within a corridor, and that most movement of people, goods, information, and services in a corridor involves movement between modes. With scarce funds available for transportation system preservation, safety, operations, and capacity additions, all modes must provide more than just choice—they must deliver performance.
To identify successful strategies that have been used to implement intermodal corridor management, this scan will examine practices in DOTs, MPOs, and other jurisdictions where corridor management has been taken beyond the concept of integrating technical operational capabilities to optimizing the potential contributions for a variety of modes within corridors. For each location visited, the scan team will explore such matters as:
How a stated purpose/vision for the management of the corridor(s) was developed, and how public input was used
How relevant modes and linkages were identified
How potential capacity/travel market share was determined for each mode
What modal performance parameters were selected and how those compare to emerging MAP-21 performance measures
Governance arrangements and how institutional impediments were overcome
Technical and technological challenges to improving multimodal and intermodal performance
2 Pederson NJ, Multimodal Transportation Planning at the State Level—State of the Practice and Future Issues, Transportation Research Board Committee on Statewide Multimodal Planning, 2000, http://onlinepubs.trb.org/onlinepubs/millennium/00076.pdf
1–2
C H A P T E R 1 : I N T R O D U C T I O N A N D B A C KG R O U N D
Success indicators
Cost to implement, operate, and maintain, and return on investment
Achieve sustainable transportation supporting economy, environment, and equity
This scan will aim to produce practical guidance and examples for state DOTs and MPOs seeking to gain the best return on investments in multimodal corridors to ensure each mode contributes to satisfying existing and latent demand for mobility and services. The scan will build on previous work on the technological challenges of integrated highway corridor management and multimodal integrated corridor management to examine the specific technical and institutional challenges and opportunities for matching the investment in appropriate modal options to meet community, economic, and environmental needs. Finally, the findings of this scan could provide DOTs and MPOs wishing to implement intermodal corridor management with examples of the successful integration of modes within corridors to provide needed services and the institutional arrangements that can bring intermodal corridor management to fruition.
BackgroundThe project team considered recent and comprehensive scan and National Coperative Highway Research Program (NCHRP) reports that summarized current thought and practices related to the Scan Project 14-02 topic, including integrated corridor management (ICM); multimodal corridor planning; sustainability; and analysis techniques and tools supporting multiple objective decisions, the kind needed when trying to develop multiple modal networks to achieve strategic performance goals within a transportation corridor.
Traditional corridor investment planning has often focused on the dominant transportation facility in a corridor. Where multiple modes coexist within a corridor, studies and resulting investments tend to focus on the mode owned and operated by the entity conducting the study and making the investment decisions. This approach may miss opportunities to coordinate investments in multiple transportation networks within a corridor to maximize capacity and to capitalize on investments creating synergies between modes. Sustainable transportation corridor performance is a multidimensional concept and includes transportation system support for state, local, and regional economies, communities, and environments; availability and use of resources for ongoing transportation system improvements, operations, and maintenance; and public appreciation and support for taking a multimodal management approach to developing and operating the transportation corridor.
Over the course of this project, the team also realized that the term intermodal corridor management as used in this scan project report might lead to misunderstanding and confusion. Practitioners of integrated corridor management (the coordinated operation of existing highway, arterial, and transit infrastructure elements in a transportation corridor to optimize their performance) feel understandable ownership of the acronym ICM, so it is not easy to reduce this project’s topic to simple set of letters. Similarly, the concept of what constitutes a transportation corridor is, in practice, elastic, ranging from short highway segments to longer highway segments to multiple modes of transportation sharing a linear course that may stretch between cities or between states.
How are the terms intermodal, corridor management, multimodal, and sustainable system performance used in the context of this project?
Intermodal refers to looking at the connections between modes in making a complete trip. The term intermodal commonly refers to freight movement as freight moves between maritime or air shipment modes to ground movement modes, such as trucks or trains, or movements between rail and truck. Similarly intermodal connections between nonmotorized or automobile travel to transit modes, such as light rail, heavy rail and buses, can be critical in terms of optimizing personal travel in a corridor. If an intermodal link is missing or not functioning as well as it might, the ability of certain modes to move people, goods, and
1–3S U C C E S S F U L I N T E R M O D A L C O R R I D O R
M A N A G E M E N T P R A C T I C E S F O R S U S TA I N A B L E
S Y S T E M P E R F O R M A N C E
services might be reduced. For example, if a commuter who must get to a train, light rail, or bus station by automobile cannot reliably do so, or if no parking is available, she may be forced to make the entire trip by car even though the transit vehicle has unused capacity. Intermodal also refers to the need to make operational and improvement investments across modes to yield the best performance for the corridor. This is similar to the concept of cross-asset allocations within the functions of an agency to provide the best mix of investments to maintain asset conditions and develop new assets.
Corridor management, for the purposes of this project, means looking at all the means of moving people, goods, and information along a corridor and deliberately planning, improving, and operating the components to work together to maximize efficient and effective throughput. Current efforts at integrated corridor management are focused primarily on making highways and arterials operate as efficiently as possible by using new technologies and operational techniques, data-driven decision-making, and by forming collaborative partnerships with the various jurisdictions owning, operating, and using parts of the highway corridor. This benefits the effectiveness of the modes that are highway- and arterial-dependent, but may not maximize the potential capacity of all modes within a corridor.
For example, topography and urban development constrain the ability to physically expand highway capacity in the I-5 corridor (including SR 167 and I-405) in Washington State near Seattle. As a result, a fairly robust transit and carpool network has developed. In addition, the corridor’s performance has been improved by ramp metering, traveler information, traffic management centers (TMCs), active traffic management, variable message signs, high-occupancy vehicle (HOV)/managed lanes, and dynamic tolling to manage demand. However, the I-5 corridor is truly multimodal. It also contains Amtrak service, freight rail, heavy commuter rail, light rail, and ferry routes that allow bypassing freeway travel. The corridor’s theoretical transportation capacity is greater than just its highway and arterial components. Its potential capacity would be greater than the sum of current use of each mode if coordinated investment and operational decisions were made with the express purpose of improving connections between the modes and ensuring each mode was being used optimally, in other words, managing the corridor as a whole, not just each of its individual physical or modal components. (This corridor was the subject of a white paper3 explaining the basic concepts of Integrated Corridor Management).
Sustainable system performance is multidimensional. At this term’s heart is the idea that the successful outcomes desired in managing the corridor for efficiency and effectiveness will be sustained over time. This requires the ability to measure success (i.e., performance measurement and management) and the continued availability of funding and the technological and human resources necessary to support not only investments in improvements, but also the managed operations and maintenance of facilities and services within a transportation corridor. Sustaining success also requires maintaining the public and political support, as well as continued collaboration across jurisdictions, which is necessary to provide those resources. Intermodal corridor management must clearly demonstrate that it positively impacts communities and their environment and economies (the three components of sustainability). System performance outcomes and measures must reflect more than congestion and delay statistics—they need to address what really matters to system users:
Reliable and equitable access to jobs, education, and recreation
Support for local, regional, and state environmental goals and quality of life
The efficient movement and availability of goods, commodities, and manufactured materials essential for economic vitality
Intermodal corridor management requires knowledge of and response to the myriad needs of multiple users desiring to move within the corridor, and tailoring the right mix of options and services to optimally meet those needs.

1–4
C H A P T E R 1 : I N T R O D U C T I O N A N D B A C KG R O U N D
Corridor PlanningLocal, regional, and state transportation agencies and the private sector have a long-standing practice of studying and developing surface transportation corridors. These corridors have commonly been defined by topography (e.g., the paths of rivers and valleys and mountain passes); transportation facilities (e.g., canals, ports, paths, roadways, railroads, and highways); and origins and destinations (e.g., ports, population centers, and the locations of agricultural, manufacturing, and other social and economic activities).
Traditional corridor investment planning has often focused on the dominant transportation facility in a corridor, such as highway improvements, which may have positive benefits to several related modes, such as automobile travel and highway-dependent transit. Where multiple modes coexist within a corridor, such as highways and freight or passenger rail, corridor studies and resulting investments tend to be specific to whichever mode is owned and operated by the entity conducting the study and making the investment decisions. This approach misses opportunities to make or coordinate investments that make maximum possible use of the capacity of multiple transportation networks to move people, goods, and information within a corridor. It may also miss capitalizing on investments creating synergies between modes, such as highway operational improvements that increase bus transit reliability and travel times, or access and park and ride facilities that could increase bus or rail transit use.
In 2004, NCHRP 08-36 Task 7, “Development of a Multimodal Tradeoffs Methodology for Use in Statewide Transportation Planning,”4 attempted to apply a conceptual framework for analyzing the tradeoffs between modal investments at a programmatic level and in a corridor-specific setting. The location of the corridor studied was the I-5 corridor in the greater Seattle region. This study concluded that the framework was difficult to apply programmatically, but might have some utility at the corridor level. This study highlighted the difficulty in developing performance metrics for multiple modes to support the type of investment analysis that has evolved into cross-asset allocation.
Donald Samdahl5 reviewed the rationale behind corridor planning and analysis and pointed out some of its advantages over regional transportation planning in identifying specific problems and solutions and generating public interest and support for proposed actions. He discussed corridor planning efforts ranging from local streets, analyses driven by the National Environmental Policy Act (NEPA) to regional and multistate corridors. Corridor studies at the local and regional level also provide an opportunity to include land use and urban design considerations.
NCHRP Report 661A, “Guidebook for Corridor-Based Statewide Transportation Planning,”6 presents an argument and an approach for using multimodal corridor planning as the basis for statewide planning, as opposed to looking at individual modes or projects. Corridor-based statewide planning provides the ability to better link corridor performance to statewide economic development, trade and freight movement, and environmental and connectivity goals. The authors encouraged viewing corridors of statewide significance from a multimodal perspective, and cited Florida’s Strategic Intermodal System as an example of improving existing and developing new corridors planned for multimodal use. They also referenced Wisconsin for including the criterion, “serve an important role for transportation modes, other than automobile” for use in selecting corridors.
Transit Cooperative Research Program Report 145, “Reinventing the Urban Interstate: A New Paradigm for Multimodal Corridors,”7 presents a new framework for planning and developing multimodal corridors that is
4 NCHRP 08-36 Task 7: Development of a Multimodal Tradeoffs Methodology for Use in Statewide Transportation Planning, Cambridge Systematics, Inc., Standing Committee on Planning, American Association of State Highway and Transportation Officials, 2004, http://onlinepubs.trb.org/onlinepubs/nchrp/docs/NCHRP08-36(07)_FR.pdf
5 Chapter 10. Transportation Planning Handbook. Third Edition. 2009 ITE6 Carr J, et al., NCHRP Report 661: A Guidebook for Corridor-Based Statewide Transportation Planning, National Cooperative
Highway Research Program, Transportation Research Board, http://onlinepubs.trb.org/onlinepubs/nchrp/nchrp_rpt_661.pdf
1–5S U C C E S S F U L I N T E R M O D A L C O R R I D O R
M A N A G E M E N T P R A C T I C E S F O R S U S TA I N A B L E
S Y S T E M P E R F O R M A N C E
1–5
based on three concepts relevant to this project:
Enhancing corridor transportation capacity and performance without adding freeway capacity by building and operating transit lines (including bus rapid transit, light rail, heavy rail, and commuter rail)
Building and operating successful transit systems in multimodal corridors that attract high transit ridership and encourage livability and environmental sustainability
Transforming a corridor’s land uses and activities to a more transit-oriented pattern
The concept of market segmentation is central to developing the multimodal corridor under this paradigm. Market segmentation tailors modal development in a coordinated, noncompetitive fashion with the intent of allowing each mode to thrive within the corridor and contribute to overall performance. Modes are complementary, providing greater person throughput and accessibility/connectivity. Multimodal agency partnerships, not individual modal owner/operators, guide planning and corridor development. The multimodal corridor deploys new technology for purposes beyond freeway capacity maximization to include modal coordination, coordinated pricing, parking management, and multimodal traveler information and looks at the complete trip, including multiple modes and intermodal connections. Under this paradigm, corridor performance is measured in terms such as person throughput, accessibility/connectivity, reliability, and economic competitiveness.
Corridor ManagementCorridor planning provides opportunities. State-level transportation plans tend to set high-level policy goals and estimate transportation system needs in terms of categories of improvements and very large funding gaps, neither of which are readily relatable to the average person. They are generally not project specific. Regional plans tend to be a bit more specific and involve a geographic scale more readily understood by the public. Most metropolitan transportation plans must consider specific projects in analyzing the transportation and air-quality implications of recommended system improvements. However at the plan level, the results of proposed investments are often rolled up into programs or bundles of project types with abstract labels such as “operational improvements” or “capacity increasing” or “transit”.
Corridor planning addresses a specific geographical area to which people can directly relate. The transportation facilities and services within a corridor can be enumerated, as can the functions the corridor provides for the local communities and the region. Scenarios can be constructed that address underlying assumptions about future population, economic and community growth, and environmental quality. Scenarios that include different ways in which the corridor’s mobility needs might be met can be similarly constructed and analyzed at a project- or service-specific level. Corridor planning provides a focal point for blending state and regional policy and local needs and concerns into specific recommendations for action. Performance metrics and goals can be set and the public can more readily monitor the effectiveness of actions intended to reach those goals.
Over the last several decades, state DOTs, regional planning and transit agencies, and local governments have increased their efforts to better manage highway and arterial operations to reduce congestion and make the most out of past transportation investments. USDOT has funded a series of pilot projects to demonstrate the benefits of employing technology and techniques that have been shown to increase highway and surface street productivity by reducing congestion and reducing the impact of incidents.
Recently completed NCHRP 20-68A Scan 12-02, “Advances in Strategies for Implementing Integrated
7 Ferrel C, et al., TCRP Report 145: Reinventing the Urban Interstate: A New Paradigm for Multimodal Corridors, Transit Cooperative Research Program, Transportation Research Board, http://onlinepubs.trb.org/onlinepubs/tcrp/tcrp_rpt_145.pdf
Corridor Management,”8 provides some relevant insights concerning managing transportation networks within a corridor. As mentioned previously, ICM mostly focuses on tactical issues related to effectively operating highway and arterial systems for efficient movement of automobiles, rubber-tired transit, and freight.
Scan 12-02 identified six basic building blocks for ICM:
1. Coordinated operations
2. Multiagency data sharing
3. Traveler information
4. Decision support system
5. Model of corridor
6. Memorandums of understanding
The Scan 12-02 team visited five locations where ICM is being developed and demonstrated:
New Jersey DOT (with numerous supporting agencies Pennsylvania DOT, New York State DOT, New Jersey Transit, New Jersey Turnpike Authority, New York City DOT, Delaware Valley Regional Planning Commission, Transportation Operations Coordinating Committee, and the New Jersey Transportation Planning Authority)
Dallas Area Rapid Transit (and Texas DOT; North Central Texas Council of Governments; the Cities of Dallas, Richardson, Plano, and University Park; Schneider Electric; Texas A&M Transportation Institute; and Southern Methodist University)
Minnesota DOT (and Minneapolis Metro Transit)
Maricopa DOT (with Arizona DOT; the Cities of Scottsdale and Phoenix; the Maricopa Association of Governments; Valley Metro; the Arizona Department of Public Safety; Salt River Pima-Maricopa Indian Community; Kimley-Horn and Associates, Inc.; and OZ Engineering
San Diego Association of Governments (with the California DOT; the Cities of San Diego, Escondido, and Poway; the Metropolitan Transit System and North County Transit District; Kimley-Horn and Associates, Inc.). San Diego, California, is one of two USDOT ICM Demonstration Project sites. The I-15 corridor in San Diego is a model for the multimodal deployment of the latest and evolving ITS technologies in the region. The San Diego region has a rich history of partnership among the San Diego Association of Governments (SANDAG) and its member agencies and diverse stakeholders, which are all committed to the ICM vision and implementation of the ICM System to support ICM programs.
The scan concluded there were four key items for developing ICM:
Funding, particularly for ongoing operations and maintenance, past the pilot phase
Staffing, both availability and expertise
1–6
C H A P T E R 1 : I N T R O D U C T I O N A N D B A C KG R O U N D
8 Motiani D, N Spiller, et al., NCHRP Project 20-68A, Scan 12-02: Advances in Strategies for Implementing Integrated Corridor Management (ICM), National Cooperative Highway Research Program, Transportation Research Board, http://onlinepubs.trb.org/onlinepubs/nchrp/docs/NCHRP20-68A_12-02.pdf

A champion or lead agency to drive efforts toward deployment
A lead coordinator to oversee day-to-day operations
Based on the literature, ICM shares common structural and development requirements with intermodal corridor management. It is one tool available for implementing intermodal corridor management and can serve as an incremental step along the journey from independent modal operators to coordinated and integrated multimodal operations and corridor development.
Performance-Based Planning and ManagementPerformance metrics for intermodal corridor management for sustainable system performance move beyond the minimum required by the Moving Ahead for Progress in the 21st Century Act (MAP-21). Performance measures should be user-oriented and address outcomes like reliability, access/connectivity, economic development, and quality of life. Such user-oriented performance metrics are still evolving.
FHWA recently published “Model Long Range Transportation Plans: A Guide for Incorporating Per-formance-Based Planning”9 to provide examples of best practices to DOTs, Metropolitan Planning Organizations (MPOs), Regional Transportation Planning Organizations (RTPOs), transit agencies, local and regional governments, and other government agencies. While this guidance document states that a balanced long-range plan should reflect community priorities and support attainment of desired performance outcomes for the multimodal transportation system, it presents a fairly traditional approach to developing a highway-centric long-range plan, albeit one focused on specific performance metrics. While it discusses scenario planning, it does not emphasize multimodal planning. However, the guide states:
The transportation plan should describe elements of the multimodal transportation system, including not only highways and transit, but also multimodal and intermodal facilities and pedestrian and bicycle networks. It should also address integrated management and operations of transportation systems and facilities. By including all elements of the integrated multimodal transportation system in decision-making, decision-makers, stakeholders, and the public can better understand the system needs and how the investment strategies support the state’s or region’s future. Within a performance-based plan, clearly defining the transportation system as a multimodal system can help decision-makers and the public consider goals, objectives, and performance measures that are multimodal in nature.
It notes several agencies and locations that have made substantial progress with performance-based long-range planning.
Minnesota’s GO Vision” and Statewide Multimodal Transportation Plan provide policy guidance to modal plans and tribal and regional plans and programs.
ADOT completed its statewide long-range transportation plan “What Moves You Arizona,” in 2011, with a horizon year of 2035.
Maryland DOT’s (MDOT’s) statewide plan is developed in coordination with the state’s modal agencies to address all modes of transportation, as well as links between modes.
The Genesee Transportation Council’s (the MPO for Rochester, New York) 2035 long-range transportation plan uses directional targets and multimodal performance measures, which include active transportation modes, in its transportation plan to show the desired and likely change for each measure relative to a benchmark.
1–7S U C C E S S F U L I N T E R M O D A L C O R R I D O R
M A N A G E M E N T P R A C T I C E S F O R S U S TA I N A B L E
S Y S T E M P E R F O R M A N C E
9 Grant M, et al., Model Long Range Transportation Plans: A Guide for Incorporating Performance-Based Planning, Federal Highway Administration, U.S. Department of Transportation, 2014, http://www.fhwa.dot.gov/planning/performance_based_planning/mlrtp_guidebook/fhwahep14046.pdf

Decision Making and GovernanceProactively planning and investing in multiple modes within a corridor requires new decision-support tools and new institutional and governance relationships and formal agreements among operating agencies to use them.
Multimodal investment decisions require the ability to look at different modal networks, each with its own primary performance measures and differing mobility and social outcomes, some more easily quantified or monetized than others. Multiple-objective decision analysis (MODA) is not new, but its use in making multimodal transportation investment decisions is still in the early stages.
NCHRP 08-36 Task 7, “Development of a Multimodal Tradeoffs Methodology for Use in Statewide Transportation Planning,”4 attempted to apply a previously developed conceptual framework for tradeoff analysis for investment decisions made at a programmatic level (Washington State Ferries versus other roadway improvements) and corridor (I-405) basis. The study concluded that the methodology was difficult to use programmatically, due primarily to lack of ability to roll up project-level performance information to programmatic levels; however, it was of some use if applied to a corridor analysis. The project was not entirely successful and the final report only presented findings. This study demonstrated the need for more sophisticated decision-support analysis tools.
NCHRP Report 664, “Measuring Transportation Network Performance,”10 presents building blocks for multimodal and multi-strategy investment prioritization:
Establish partnership agreements
Guide the investment prioritization and programming process by providing critical feedback on regional goals and performance objectives and data to support calculation of network performance measures
Oversee the performance-based project evaluation
Provide input on investment tradeoffs for project prioritization and programming
Define performance measurement framework
Define the vision (in the case of MTC, guided by the three Es of sustainability)
Establish goals and performance objectives
Develop measurement and data-collection methodologies
Conduct a financially unconstrained what if analysis
Use a mix of quantitative and qualitative measures
Link network performance measures to project prioritization and programming
NCHRP Report 806, “Guide to Cross-Asset Resource Allocation and the Impact on Transportation System Performance,”11 highlights one area in which transportation agencies are starting to employ MODA. They
1–8
C H A P T E R 1 : I N T R O D U C T I O N A N D B A C KG R O U N D
10 Report 664: Measuring Transportation Network Performance, Cambridge Systematics, National Cooperative Highway Research Program, Transportation Research Board, 2010, http://onlinepubs.trb.org/onlinepubs/nchrp/nchrp_rpt_664.pdf
11 NCHRP Report 806: Guide to Cross-Asset Resource Allocation and the Impact on Transportation System Performance, CH2M HILL, Inc., National Cooperative Highway Research Program, Transportation Research Board, 2014, http://onlinepubs.trb.org/onlinepubs/nchrp/nchrp_rpt_806.pdf
use MODA to address the commonly faced dilemma where, given finite resources, agencies must decide how to allocate those resources to improving system safety; increasing operational efficiency; reducing congestion; improving state-of-repair of bridges, signs, and guardrail; expanding system capacity; or protecting and enhancing environmental resources and community quality of life with a public that expects all of those outcomes. While addressing the issue of determining investment decisions within an agency regarding only its own assets, this report nonetheless draws some important conclusions regarding the current state of MODA as it could apply to intermodal corridor management decisions.
This report presents a framework and tool to allow decision-makers to consider:
(a) the several dimensions of system performance important to stakeholders (such as mobility, safety, and community livability); (b) the multiple measures an agency uses to describe condition and level of service of particular classes of transportation-system assets (such as pavements, signals, and drainage structures); and (c) the targets that an agency may set for the various dimensions of performance. This research was undertaken to develop a practical framework and analysis tools for dealing with this complex problem.
The report finds that most DOT resource-allocation decisions are siloed programmatically or geographically. The authors note that while the use of performance measures is not new to DOTs:
However, performance-based planning and programming, where investments and strategies are evaluated, selected, and programmed to achieve goals and performance targets across multimodal transportation assets, is not as common as the use of performance measures themselves. States and MPOs are only beginning to develop performance-based plans that incorporate performance management concepts for all modes, for operations, and for achieving broad economic, environmental, and community development goals.
In developing the decision framework, the researchers integrated:
Goals and objectives that serve as an expression of agency priorities and vision
Performance measures that demonstrate progress toward agency goals and objectives
Predictive models to forecast likely project impacts on system performance
Decision science techniques to score projects on a level playing field and optimize their selection for programming based on their anticipated benefits and the relative importance of those benefits to the decision maker
Trade-off analysis to reinforce scenario planning and to compare priorities with fiscal constraints
Intermodal Corridor Management Is Not Integrated Corridor ManagementThe literature review documented the currently high level of interest, particularly at the USDOT level, in promoting better operation of highway and arterial corridors as evidenced by the ICM demonstration projects. The review also highlighted some of the differences and features in common between intermodal corridor management and ICM that help refine the amplifying questions (see Appendix C) and the identification of agencies and locales that would be appropriate for inclusion in the Scan 14-02 project.
Integrated Corridor Management
Tactically/operationally oriented
Technology driven
Operator-oriented performance measures and monitoring
1–9S U C C E S S F U L I N T E R M O D A L C O R R I D O R
M A N A G E M E N T P R A C T I C E S F O R S U S TA I N A B L E
S Y S T E M P E R F O R M A N C E

Highway/arterial network focused
Freight included to the extent that truck access and movement considered
Decision support tools are tactical
Sustainability outcomes not really considered as first-order issues, although some benefits (like reduced air pollutant emissions) may be claimed
Technical and operational interagency agreements, trust based on common goals and practices, and mutually understood standards
Intermodal Corridor Management for Sustainable System Performance
Strategic view influencing capital and operating funding decisions affecting multiple modes within a corridor (consistent with corridor’s established vision and goals)
Uses technology as an enabler; ICM is one set of implementing tools
Performance outcomes and measures both operator- and user-oriented
Includes all transportation modal networks within a corridor, which can contribute to achieving overall corridor vision and performance goals
Freight movement considerations include non-highway options
Unified approach to making corridor investment decisions instead of single-purpose agencies making independent decisions or engaging in “this mode or that mode” funding debates; multiple operating agencies, stakeholders, and the public seek “this mode to this level and that mode to that level” investment scenarios to optimize performance of the corridor for multiple users. Decision support tools must be sufficiently sophisticated to handle performance criteria and objectives that are both quantifiable and not easily quantified, yet transparent enough to sustain popular support.
Governance involves shared decision powers and the highest levels of technical and political trust, engagement, and agreement on overarching community goals
Performance outcomes and measures should reflect the three building blocks of sustainability: community, economy, and environment
Unique Components of Intermodal Corridor Management for Sustainable System PerformanceFor the purposes of this project, there are certain aspects of the corridor planning and development process that pose unique challenges when attempting to manage intermodal corridors for sustainable system performance:
Corridor definition
Purposes and functions of corridor, mobility, and accessibility markets served
Identification of relevant transportation modes and systems
Capacity of modal networks
Multimodal performance measures
1–10
C H A P T E R 1 : I N T R O D U C T I O N A N D B A C KG R O U N D
Cross-modal investment decisions
Multiple-objective decision analysis
Governance/shared powers/institutional framework
Sustainability
Popular and political support for resources necessary for sustained operations and investments
Support for the economy, community, and environment
The scan team used these topic areas to focus amplifying questions and to structure scan activities.
1–11S U C C E S S F U L I N T E R M O D A L C O R R I D O R
M A N A G E M E N T P R A C T I C E S F O R S U S TA I N A B L E
S Y S T E M P E R F O R M A N C E

C H A P T E R 2 : O V E R V I E W O F S C A N P E E R W O R K S H O P
2–1S U C C E S S F U L I N T E R M O D A L C O R R I D O R
M A N A G E M E N T P R A C T I C E S F O R S U S TA I N A B L E
S Y S T E M P E R F O R M A N C E
2 Overview of Scan Peer Workshop
Typically NCHRP Project 20-68A domestic scans involve the scan team traveling to locations that exemplify best practices regarding the scan topic. Since this scan topic is more concerned with ideas, analytical tools, and institutional arrangements than hardware or physical structures, the scan team
decided that a peer-exchange type workshop would be the best way to gather information on best practices and provide for interaction between practitioners themselves and with the scan team on such topics as:
How a stated purpose/vision for the management of the corridor(s) was developed and how public input was used
How relevant modes and linkages were identified
How potential capacity/travel market share was determined for each mode
What modal performance parameters were selected
Governance arrangements and how institutional impediments were overcome
Technical and technological challenges to improving multimodal and intermodal performance
Success indicators
Cost to implement, operate, and maintain
Return on investment
Achieving sustainable transportation that supports the economy, the environment, and equity
Based on the team members’ personal knowledge and the review of recent research and efforts around the nation contained in the desk scan prepared early in the project, the scan team invited the following local, regional, state, and federal agencies to participate in a weeklong workshop in San Diego, California in October 2015:
Arizona
ADOT
Maricopa County DOT
City of Scottsdale
California
California DOT (Caltrans)
SANDAG
FHWA California Division
Florida
2–1
Florida DOT (FDOT)
Florida Department of Economic Opportunity
Space Coast Transportation Planning Organization (SCTPO)
Maryland State Highway Administration
Massachusetts DOT (MassDOT)
New York
New York State Department of Transportation (NYSDOT)
New York City Department of Transportation (NYCDOT)
North Carolina DOT (NCDOT)
Oregon DOT (ODOT)
Utah
Utah DOT (UDOT)
Mountainland Association of Governments (MAG)
Wasatch Front Regional Council (WFRC)
Virginia
Virginia DOT (VDOT)
Hampton Roads Transportation Planning Organization (HRTPO)
The scan team also sent the participants a set of amplifying questions to be answered in writing and submitted prior to the workshop (see Appendix C). The project team used this information as a foundation for structuring and conducting the workshop sessions.
During the four-day workshop, each state team made a formal presentation of its activities promoting intermodal corridor management, followed by questions and discussions between the presenters, the project team, and the other participants. Most state teams were able to participate in multiple sessions over several days in the workshop. Their observation of other teams’ presentations and participation in ensuing discussions enriched the project team’s analysis and interpretation of the information presented. Appendix D presents summaries of the participants’ workshop presentations.
2–2
C H A P T E R 2 : O V E R V I E W O F S C A N P E E R W O R K S H O P

2–3S U C C E S S F U L I N T E R M O D A L C O R R I D O R
M A N A G E M E N T P R A C T I C E S F O R S U S TA I N A B L E
S Y S T E M P E R F O R M A N C E
2–3

C H A P T E R 3 : K E Y F I N D I N G S A N D C O N C L U S I O N S
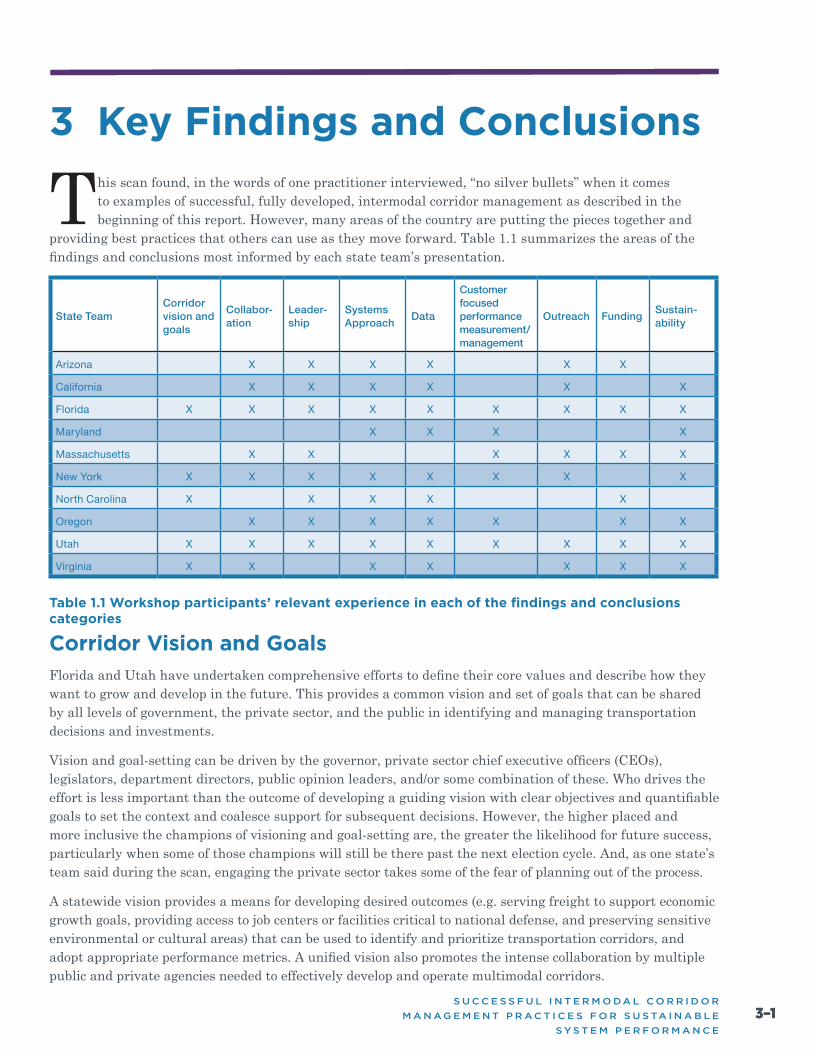
3–1S U C C E S S F U L I N T E R M O D A L C O R R I D O R
M A N A G E M E N T P R A C T I C E S F O R S U S TA I N A B L E
S Y S T E M P E R F O R M A N C E
3 Key Findings and Conclusions
This scan found, in the words of one practitioner interviewed, “no silver bullets” when it comes to examples of successful, fully developed, intermodal corridor management as described in the beginning of this report. However, many areas of the country are putting the pieces together and
providing best practices that others can use as they move forward. Table 1.1 summarizes the areas of the findings and conclusions most informed by each state team’s presentation.
Table 1.1 Workshop participants’ relevant experience in each of the findings and conclusions categories
Corridor Vision and GoalsFlorida and Utah have undertaken comprehensive efforts to define their core values and describe how they want to grow and develop in the future. This provides a common vision and set of goals that can be shared by all levels of government, the private sector, and the public in identifying and managing transportation decisions and investments.
Vision and goal-setting can be driven by the governor, private sector chief executive officers (CEOs), legislators, department directors, public opinion leaders, and/or some combination of these. Who drives the effort is less important than the outcome of developing a guiding vision with clear objectives and quantifiable goals to set the context and coalesce support for subsequent decisions. However, the higher placed and more inclusive the champions of visioning and goal-setting are, the greater the likelihood for future success, particularly when some of those champions will still be there past the next election cycle. And, as one state’s team said during the scan, engaging the private sector takes some of the fear of planning out of the process.
A statewide vision provides a means for developing desired outcomes (e.g. serving freight to support economic growth goals, providing access to job centers or facilities critical to national defense, and preserving sensitive environmental or cultural areas) that can be used to identify and prioritize transportation corridors, and adopt appropriate performance metrics. A unified vision also promotes the intense collaboration by multiple public and private agencies needed to effectively develop and operate multimodal corridors.
3–1
State TeamCorridor vision and goals
Collabor- ation
Leader- ship
Systems Approach Data
Customer focused performance measurement/ management
Outreach Funding Sustain- ability
Arizona X X X X X X
California X X X X X X
Florida X X X X X X X X X
Maryland X X X X
Massachusetts X X X X X X
New York X X X X X X X X
North Carolina X X X X X
Oregon X X X X X X X
Utah X X X X X X X X X
Virginia X X X X X X X

Establishing a vision for the future, working with stakeholders to set common goals, and creating clear objective and guiding principles all help support and focus subsequent corridor-level planning efforts and investment decisions.
Establishing state-level visions and goals can produce two major benefits. First, it reduces the need to address larger societal issues in the context of developing a corridor-specific development and management plan because these issues have already been dealt with. Second, it can produce a common vision and set of goals that can applied to multiple corridors.
Corridors aren’t just defined by topography or the location of a highway. Projected population growth and economic development areas, multiple modes that can connect major urban areas, and connections between port facilities and manufacturing and distribution centers all can shape corridors. Even in intensely urbanized areas served by a grid system of highways, arterials, and surface streets, travel patterns and multiple modal facilities provide a means of describing corridors along which facility and operational improvements can increase capacity to move people and goods.
CollaborationIntermodal corridor management requires collaboration at the highest end of the collaboration spectrum. ICM efforts provide good examples of the degree of cooperation required to get multiple agencies operating in a coordinated, coherent effort to support common goals. Intermodal corridor management can increase the number of players by expanding geographic territory and increasing the modal facilities and services involved. Additionally, intermodal corridor management increases the time frame for collaboration by starting earlier in the planning stages of corridor development and modal improvements and extending collaborative efforts into operations and maintenance activities.
Examples of successful collaboration in multimodal corridor development are characterized by:
Shared goals, resources, and decision-making
The ability to challenge your partners and have frank discussions while respecting each other’s boundaries and abilities
Formal written agreements that support ongoing relationships, define roles, set goals, establish structure, leverage resources, and determine who is paying for what and who gets to make decisions; in other words, reduce the odds of misunderstandings and mistakes that can work against partnered
Written agreements that can provide survival of partnerships and solutions over time as elected officials and partners’ representatives change; the time required to build trust and technical capabilities can far exceed terms of office
Strong reliance on formal intergovernmental agreements that detail operational responsibilities, business rules, and playbooks detailing actions triggered by decision support systems so partners are not surprised
LeadershipLeadership can focus efforts, break down silos, drive and empower organizational and culture change, and provide champions. Change can come from legislative action or an Executive’s directive. Leadership and championing from the top are very important; however, to really get results you also need to get buy-in from the bottom up.
State legislatures, such as those in North Carolina, Oregon, and Massachusetts, have created
3–2
C H A P T E R 3 : K E Y F I N D I N G S A N D C O N C L U S I O N S

statutory frameworks for multimodal system development and project evaluation, selection, and prioritization. However, the impact of these mandates can be reduced when they are not accompanied by funding for implementation and execution.
Florida’s multimodal corridor development project benefitted from the governor’s appointment of a high-level oversight group representing government, the private sector and environmental interests. This group lends the study effort credibility and sustainability over time. It is intended to be a model for future planning efforts statewide, focusing on well-planned communities, transportation corridors, protecting environmental and agricultural resources, and enhancing economic competitiveness and quality of life. This approach demonstrates that DOTs need not be the only stakeholder to lead corridor development efforts and that other stakeholders, such as economic development agencies, can be effective leaders or co-leaders as well.
Several DOTs participating in this scan project, including ODOT and UDOT, have overtly adopted policies and organizational structures intended to break down modal and funding silos to support developing intermodal and multimodal transportation systems and corridors. The standard should be investment decisions that provide the highest return regardless of mode.
Agency leadership is changing the mindset from the sole focus of moving vehicles to:
Moving people and freight
Using mode-neutral performance measures
Providing modal options
Leveraging technology to increase performance
Forcing earlier consideration of operational strategies in planning and project development activities
Budgeting for sustained operations and maintenance, particularly of IT infrastructure
Incorporating emerging priorities, such as active transportation, into everyday practices.
Leadership is necessary to turn policy statements into action. One participant drew an analogy with context-sensitive solutions, noting that their DOT no longer uses the phrase because its tenets are now woven into standard business practices.
In both multimodal corridor development and ICM, executive leadership can promote the high degree of collaboration and cooperation between state DOTs and regional transportation agencies seen in the most successful efforts.
To guide its efforts in improving its technical and organizational abilities in ICM, California is actively using a capability maturity model, such as the model presented in Domestic Scan Project 12-0288.
Systems ApproachCorridors are defined by more than topography or the location of a highway. They can be shaped by current and projected population growth and economic development areas, multiple modes connecting major urban areas, or connections between and port facilities and manufacturing and distribution centers. Travel patterns and multiple modes provide a means of describing corridors along which facility and operational improvements can increase the ability to move people and goods, even in intensely urbanized areas.
3–3S U C C E S S F U L I N T E R M O D A L C O R R I D O R
M A N A G E M E N T P R A C T I C E S F O R S U S TA I N A B L E
S Y S T E M P E R F O R M A N C E

Effective intermodal corridor management focuses performance on moving people and goods (and not vehicles) safely and reliably.
To manage multiple modes within a corridor, the corridor’s must be looked at as the sum of the capacities each of the modes that are, or could realistically and practically be, available to serve all market segments of current and future travel demand. The corridor must be operated integrating all modal networks and crossing jurisdictional boundaries.
Each mode should be operated to provide its greatest effective capacity. ICM can operate highways and parallel roadways to provide optimum throughput, safety, and reliability. Where a roadway lane is partially or fully taken for transit, there must be a comprehensive plan to ensure ridership. Virginia’s ICM plan is intended to use “all available seats” in a managed corridor while promoting mode and facility choice.
Successful intermodal corridor management is locale- and situation-dependent. Not all facilities and services fit everywhere, and not all performance goals can be achieved everywhere. System-user expectations (e.g., travel time and mode availability) must be kept realistic.
Transportation mode investments should compete in terms of customer-oriented outcomes like time, access, price, convenience, reliability, and predictability.
Realistic intermodal corridor management considers a “complete system” rather than “complete streets” (which interpret as all modes are applicable everywhere all the time). The appropriate question should be, “Are there sufficient complete modal networks within this corridor to satisfy different travel demands, including active transportation options?”, rather than, “Is every travel option available everywhere?” At the same time, the effectiveness of the networks to truly satisfy travel demand must consider the first and last mile of trips.
DataData is necessary for planning, improving, and managing intermodal corridors. Data is an investment and an asset and must be planned and managed as such, starting when corridor goals are being developed. It requires efficient collection, analysis, storage, maintenance, and effective reporting. The owners and operators of the modal networks within a corridor must coordinate their efforts so that data can be shared, integrated, and, most importantly, used.
Data must be considered early on as part of setting a managed corridor’s goals and objectives, which in turn drives discussions about what data needs to be collected by whom, who is going to manage the data, and how such efforts will be funded.
Data tells the story of a corridor’s performance to support managing the corridor daily, to justify additional investments, and to sustain support for ongoing operations and maintenance costs.
Data and models need to have ongoing utility to maximize return on investment. They must provide timely information to support and not bog down decisions. Data is most useful when it is collected and then used many times for different purposes and in different settings and tools.
Models are needed that can project multimodal performance in terms of outcomes like reliability; at the same time data should be used to validate performance projections and update the models.
Data should support different levels of modeling appropriate for improving decisions at different stages of corridor development and management. While modeling can be performed at the micro, meso, and macro scales, mesoscale modeling might allow screening alternative actions before
3–4
C H A P T E R 3 : K E Y F I N D I N G S A N D C O N C L U S I O N S
plunging into corridor/project detailed microscale modeling and planning, which can be more time- and data-consuming and more expensive.
Real-time data collection and use supports managing and adjusting corridor throughput as necessary. As highlighted in New York’s presentation, operating intensely traveled urban corridors may require using the most advanced and sensitive sensors to acquire necessary real-time data. On-board sensors and crowd-sourced data from third parties can provide an alternative or supplemental set of data to physical sensor systems. New York has developed a multifaceted strategy to “leverage renewable data.”
In any corridor, however, data can be used to improve management and investment decisions even if the data is not perfect as long as the data’s limitations are recognized.
Customer-Focused Performance Measurement/ManagementGaining and sustaining popular and political support for intermodal corridor management and operation depends on explaining performance goals and results in terms that are meaningful and important to customers. Travelers are concerned about trip safety and affordability, travel time reliability, and being able to get where they want to when they need to be there. They will choose whatever modes of travel best provide those outcomes. Businesses are concerned about timely availability of supplies and their ability to provide goods and services to customers. System users will support corridor management efforts and investments that provide practical choices, improve modal performance, and achieve other societal goals like economic growth, healthy communities, and environmental quality.
Corridors should be managed using consistent outcome-based performance measures and goals across all modes.
Pre- and post-implementation performance data is essential to demonstrate the impact of corridor management and performance improvement decisions and investments.
Maryland and Oregon have developed analysis systems designed to look at the impacts of projects within a corridor. In addition to looking at the transportation-related impacts, these evaluation systems take into account other societal goals. While these tools show promise, they are still works in progress and are being improved to include system components such as high-occupancy toll/high-occupancy vehicle (HOT/HOV) lanes, transit, and road diets. These evaluation systems have to address a mix of more readily measured transportation performance attributes and less quantifiable project outcomes, such as those related to the economy, quality of life, public health, and the environment.
Although they are outcomes people are concerned about, corridor managers are still struggling with quantifying the benefits of accessibility12, trips not taken, shorter trips, infill development, and livability.
Corridor performance goals can be as simple as reducing congestion for all modes, reducing single-occupancy vehicle use, reducing cost of travel delay, and increasing person throughput. The challenge comes in defining what achieving these goals really means and establishing realistic targets.
3–5S U C C E S S F U L I N T E R M O D A L C O R R I D O R
M A N A G E M E N T P R A C T I C E S F O R S U S TA I N A B L E
S Y S T E M P E R F O R M A N C E
12 Todd Littman (“Evaluating Accessibility for Transportation Planning—Measuring People’s Ability to Reach Desired Goods and Activities,” Victoria Transport Policy Institute, 24 August 2015) defines accessibility as “people’s ability to reach goods, services, and activities.” Factors affecting accessibility include mobility, quality and affordability of transport options, transport system connectivity, substitutes for physical mobility, and land-use patterns. While these factors suggest ways in which accessibility might be measured, it is clear that translating these factors into actual performance metrics is still a developing art.
OutreachEffectively engaging the public and elected officials to understand their needs and increase their knowledge of and support for improving the effective management and operation of multimodal transportation corridors has taken a variety of approaches across the country:
Making deliberate efforts to reach out to Environmental Justice and Title VI communities as part of public engagement (Massachusetts)
Adopting different media approaches based on demographics, such as age and seasonal residency (Florida)
Using surveys to solicit input for efforts ranging from developing programmatic policy themes and identifying desirable attributes for use in analyzing and prioritizing projects to targeting where bottlenecks and congestion occurring within a corridor (Hampton Roads Transportation Planning Organization)
Using social media, 511 (multimodal), and trip planning tools to keep the public informed and promote a dialogue
Targeting the nature of stakeholder involvement appropriately to audience (e.g., engaging elected officials about policy, not technical matters)
FundingSustained funding for intermodal corridor management is a challenge. Then again, sustained funding for transportation system improvement, operation, maintenance, and rehabilitation in general is a challenge. At least one state is planning corridor development with the assumption that all-new capacity will be tolled. Even where funding is insufficient for fully carrying out intermodal and multimodal corridor management plans, states are finding creative ways to make incremental progress. ICM is an important component of intermodal corridor management and requires adequate funding to provide technical resources and staff operations 24/7. These funding challenges reinforce the need to make the business case about outcomes the public understands and cares about, and is willing to pay for.
SustainabilityTraditionally, sustainability in transportation has been explained in terms of striking a balance in the economic, environmental, and social benefits of transportation improvements while minimizing the projects costs in those same three dimensions. To paraphrase the Brundtland Report1, sustainable transportation is that which meets the multiple needs of the present to safely and reliably provide access to people, goods, information, and services without compromising the ability of future generations to meet their own mobility needs. States are undertaking various efforts to promote sustainability in intermodal transportation system and corridor management and development:
Using scenario planning to integrate land use and transportation
Seeking strategies to reduce greenhouse gas emissions, including looking at the first and last mile of transit trips to enhance transit ridership and reduce cold-start air emissions
Considering climate change resiliency when developing future corridor improvement and operations plans
Deliberately considering multigenerational responsibility
3–6
C H A P T E R 3 : K E Y F I N D I N G S A N D C O N C L U S I O N S

Highlighting the economic benefits of infrastructure investments and defining success in corridor improvements as economic development instead of congestion reduction
Considering environmental constraints and ensuring economic, environmental, and community stakeholders are part of the decision process early on
Taking the long view Florida is using a 50-year planning horizon to project future needs—and plans to meet them. However, using such a long-term horizon presents challenges, including predicting the social and economic factors that will drive travel behavior; incorporating predictable and disruptive technological change and addressing near term problems in ways that do not preclude future options; and getting and keeping the public’s interest in issues that do not pose immediate threats.
Optimizing the effectiveness of existing facilities before increasing capacity
Pushing design flexibility to build and operate transportation facilities that are less energy- and resource-intensive than those traditionally designed
3–7S U C C E S S F U L I N T E R M O D A L C O R R I D O R
M A N A G E M E N T P R A C T I C E S F O R S U S TA I N A B L E
S Y S T E M P E R F O R M A N C E

C H A P T E R 4 : R E C O M M E N DAT I O N S

4–1S U C C E S S F U L I N T E R M O D A L C O R R I D O R
M A N A G E M E N T P R A C T I C E S F O R S U S TA I N A B L E
S Y S T E M P E R F O R M A N C E
4 Recommendations
The findings of this domestic scan suggest recommendations related to dissemination of the information collected and encouragement for implementing the best practices identified; workforce development; and further research.
Model efforts to disseminate the results of this scan after the climate change adaptation pilot program, working with both FHWA and FTA (acting as “one USDOT”) where, for example, results of specific pilot projects sponsored by FTA’s Climate Change Adaptation Initiative are highlighted as case studies on FHWA websites.
USDOT, AASHTO, AMPO, and TRB should work with the academic community to provide a framework for developing the workforce needed to develop, build, and operate the intermodal corridors of the future.
Improve planning and engineering curricula to better merge the disciplines and include an emphasis on operations strategies, ITS/ICM technology applications, data management and analysis, and visualization techniques for operations and planning applications
Develop new job classifications relevant to multimodal corridor operations that go beyond traditional highway operations and planning
Develop certification and recertification programs for the hands-on operators and managers of integrated and intermodal corridors
USDOT should continue to use TIGER, ICM pre-implementation and implementation grants, and other discretionary or targeted funding opportunities to incentivize and promote collaborative efforts to develop and operate managed multimodal corridors, and consider developing a specific pilot program similar to past and current ICM efforts.
USDOT, AASHTO, and AMPO should be proactive in mainstreaming the concept of multimodal managed corridors and support efforts to make the argument for adequately funding planning, data acquisition, and maintenance of integrated and intermodal corridor operations.
AASHTO should incorporate the findings and recommendations of this project into its National Operations Center of Excellence activities.
FHWA, FTA, and AASHTO should continue to work with other stakeholders to update design manuals and guidelines, being sensitive to facility type and place type and location, to accommodate both multimodal network facilities and integrated operations components.
AASHTO’s Standing Committee on Planning should prepare a research proposal for developing a capability maturity model for integrated multimodal corridor management to guide state and local improvement efforts. Such models provide agencies with a clear picture of what they want to be able to accomplish. They provide a means for agencies to evaluate their current strengths and identify specific areas where they need to develop staff and institutional abilities. These models also provide a way to measure progress toward agencies being able to achieve their goals. NCHRP Report 798,
4–1
13 NCHRP Report 798: The Role of Planning in a 21st Century State Department of Transportation—Supporting Strategic Decisionmaking, ICF International, National Cooperative Highway Research Program, Transportation Research Board, 2014, http://www.trb.org/Publications/Blurbs/172210.aspx

“The Role of Planning in a 21st Century State Department of Transportation—Supporting Strategic Decisionmaking,13” provides an assessment guide that can be used to start identifying staff and institutional strengths and weaknesses related to those capabilities needed for intermodal corridor development as outlined in this domestic scan project. Additionally NCHRP Report 798 specifically lists staff skills needed in the collaborative, technological, and political environment that are also necessary for successful intermodal corridor development and operation; thus, the report can inform agency leadership desiring to institute change as outlined in this domestic scan project.
Future research in multimodal and intermodal corridor development and management should consider:
The role served by intermodal transition points as throughput capacity enhancers or limiters
The potential impacts of disruptive technologies such as unmanned aerial vehicles for freight delivery
The potential for both enhanced operations and data acquisition presented by autonomous and connected vehicles
Better tools for measuring mode share for ride share and active transportation modes
USDOT and NCHRP should support a synthesis of best practices or support research into better measuring and forecasting person throughput via multiple modes in corridors to justify appropriate investments.
4–2
C H A P T E R 4 : R E C O M M E N DAT I O N S

4–3S U C C E S S F U L I N T E R M O D A L C O R R I D O R
M A N A G E M E N T P R A C T I C E S F O R S U S TA I N A B L E
S Y S T E M P E R F O R M A N C E
4–3

4–4
C H A P T E R 5 : I M P L E M E N TAT I O N S T R AT E G I E S
5 Implementation Strategies
This domestic scan project has identified numerous initiatives and best practices being employed by state, regional, and local agencies seeking to develop intermodal corridors. The project team encourages you to read Key Findings and Conclusions, Recommendations, and the detailed
summaries of the information presented and discussed during the scan workshop (see Appendix D) with the intent of finding ideas with applicability to your own local efforts. The team also encourages you to contact the workshop participants whose situations, challenges, and possible solutions have the most relevance for you.
The following implementation strategies identify possible actions that can be taken by entities responsible for advancing the state of the practice in transportation facility planning, development, and operations in line with national goals to mainstream and encourage use of the findings of this project on a broader scale.
This report identified specific examples of successful institutional relationships and governance agreements to produce effective and collaborative planning and execution of intermodal corridor development and operation. The Strategic Highway Research Program 2 capacity focus area produced a collaborative decision-making framework with supporting data, tools, and techniques. FHWA offers all of these as “PlanWorks: Better planning. Better projects.” PlanWorks provides a series of decision support tools to better integrate economic, environmental, and community needs into long-range transportation planning, programming, corridor planning, and environmental review/NEPA compliance stages of transportation system development. As it promotes PlanWorks’s application by transportation agencies, FHWA should include the conclusions in this report to better inform the tools and case studies presented to support the topic areas of long-range planning, visioning, and corridor planning.
FHWA’s “Model Long-Range Transportation Plans: A Guide for Incorporating Performance-Based Planning”9 recommends that planning should be multimodal; however, it presents little beyond traditional planning guidance with an emphasis on performance. FHWA should incorporate the collaborative planning concepts and practical intermodal corridor planning examples highlighted in this report in future updates of its guidance documents.
This report should serve as the basis for a workshop session at a TRB annual meeting, using several of the participating state representatives as panelists in a discussion building on the last several years’ annual meeting themes. Similarly, this project should be the subject of distance learning opportunities, such as webinars sponsored by TRB and its members.
AASHTO and AMPO, through their committees, should include workshops on the findings and recommendations of this project in their regularly scheduled conferences and committee meetings.
5-iS U C C E S S F U L I N T E R M O D A L C O R R I D O R
M A N A G E M E N T P R A C T I C E S F O R S U S TA I N A B L E
S Y S T E M P E R F O R M A N C E

A P P E N D I X A : S C A N T E A M B I O G R A P H I C A L S K E T C H E S

AA–1S U C C E S S F U L I N T E R M O D A L C O R R I D O R
M A N A G E M E N T P R A C T I C E S F O R S U S TA I N A B L E
S Y S T E M P E R F O R M A N C E
Appendix A:Scan Team Biographical Sketches
AA–1

JEAN WALLACE (AASHTO CHAIR) is the assistant division director for the Modal Planning & Program Management Division at Minnesota DOT (MnDOT). In her current role she supports the assistant commissioner in leading one of MnDOT’s five divisions, which is responsible for capital programming, performance measures, risk management, asset management, statewide planning, and research. Her division also includes the modal offices that are responsible for transit, bicycle, and pedestrian activities; freight and commercial vehicle operations; aeronautics; and passenger rail. Wallace has been with MnDOT since November 2008. Prior to her current assignment, she was the director of the Policy Analysis, Research, and Innovation Office and served as the assistant director for the Office of Project Scope and Cost Management. Wallace also worked for more than 14 years with the Federal Highway Administration at various locations throughout the country. She was recently appointed to a four-year term as the U.S. representative on the World Road Association (PIARC) Technical Committee Strategic Theme A.3 – Risk Management. She is a graduate of the University of Minnesota with a degree in civil engineering and is a registered professional engineer in Minnesota and a certified project management professional through the Project Management Institute.
BRIAN HOEFT is the director of FAST (Freeway and Arterial System of Transportation) in Las Vegas, Nevada, which is responsible for operation of traffic signal timing throughout southern Nevada, operation of the freeway ITS system, and maintenance of the communication network with the traffic signals and all freeway ITS devices. He has been with FAST since 2005 and the director since 2011. During Hoeft’s time as director, FAST has received the USDOT Data Innovation Challenge Award in 2014 and the ITE Transportation Systems Management and Operations Council Award in 2011. He has a wide range of technical experience in traffic operations and transportation planning and has worked for regional government, the Federal Highway Administration, and as a consultant. Hoeft has served as a U.S. Navy and U.S. Navy Reserve officer in the Civil Engineering Corps. He earned a bachelor’s degree in civil engineering and a master’s degree in engineering management from Brigham Young University.
JAMES H. LAMBERT is the president (2015-2016) of the worldwide Society for Risk Analysis (www.SRA.org). He is a licensed professional engineer, a fellow of the American Society of Civil Engineers, a fellow of the Society for Risk Analysis, and a senior member of the Institute of Electrical and Electronics Engineers. He is a member of the National Academy of Medicine Standing Committee on Health Threats Resilience. He is editor-in-chief of the Springer journal Environment Systems & Decisions. Lambert has led research projects funded by the National Science Foundation, the Federal Highway Administration, the U.S. Army Corps of Engineers, the U.S. Federal Aviation Administration, and Virginia DOT. He is a graduate of the University of Virginia (PhD, MS) and Princeton University (BSE). He served as the subject matter expert for NCHRP 20-68A, Scan 10-01, “Best Practices for Risk-Based Forecasts of Land Volatility for Corridor Management and Sustainable Communities.” He has served on several other Transportation Research Board (TRB) panels, including for the National Cooperative Highway Research Program, the Transit Cooperative Research Program, and the Airport Cooperative Research Program. He represented the TRB on the Technical Committee 1.5.1 Risk Management of the PIARC World Roads Association from 2012 to 2015.
KARI MARTIN is the University Region planner at Michigan DOT (MDOT). Since 2001, Kari Martin has been the lead region planner for the nine-county region MDOT University Region in south central Michigan. She has more than 23 years of transportation planning experience, beginning her career with MDOT in traffic analysis and forecasting for transportation projects of all sizes before moving on to manage National Environmental Policy Act studies related to capacity improvement projects. Martin is currently the lead planner for the State of Michigan’s first Active Traffic Management project along the US-23 corridor north of the City of Ann Arbor. She is a member of MDOT’s Multi-modal Development and Delivery (M2D2) Implementation Team, which is assessing MDOT’s standards, guidelines, procedures, and practices to identify changes that can be made to enhance the agency’s ability to accommodate all modes of transportation along the state’s transportation system.
AA–2
A P P E N D I X A : S C A N T E A M B I O G R A P H I C A L S K E T C H E S

Martin received a bachelor’s degree in urban and regional planning from Michigan State University and a master’s degree in project management from George Washington University.
NEIL SPILLER has been with FHWA Headquarters, Office of Operations (HOP) in Washington DC, since 2003 and is a program manager for three areas: managed lanes, ICM, and localized congestion and bottleneck reduction. In addition, he is the HOP contact and liaison for the discontinued Access Management program, but for which HOP still has national “community activity” presence, promotion, and endorsement of the program’s principles. Prior to coming to FHWA, Spiller was the traffic engineer and transportation planner for Frederick County, MD, for 11 years; prior to that, he was a private-practice consulting engineer for eight years. He received his civil engineering degree from the University of Maryland.
STEVE TAKIGAWA is the deputy director of Maintenance and Operations for the California DOT (Caltrans) and manages the day-to-day operations of the Division of Traffic Operations, the Division of Maintenance, and the Division of Equipment, overseeing a statewide operating budget of $2 billion, 8,500 employees, and a fleet with more than 10,000 pieces of equipment. He is a licensed civil engineer and has been with Caltrans for 28 years, serving in high-profile engineering and management positions. Takigawa has spearheaded a number of transportation innovations in California, including managing Caltrans’s fleet with global positioning system vehicle data; converting roadside lighting to light-emitting diodes; developing a lights-out program that uses prismatic sheeting on overhead signs and allows the removal of all lighting, copper wire, and catwalks; and developing and implementing an integrated maintenance management system for the maintenance program.
LYNN WEISKOPF is the director of the Office of Policy, Planning and Performance at the New York State DOT and has more than 20 years of transportation experience with the agency. In her current capacity, she oversees a variety of planning coordination activities and studies, including the state freight plan and the development of policies in such areas as capital program finance, energy and the environment, resiliency, freight, active transportation and demand management, performance management, and border-related issues. Within the DOT, Weiskopf has also served as executive assistant to the commissioner, director of statewide policy, director of state and local relations, and has held positions in federal relations and as a program and management analyst. She has also held positions in federal and local government and in the private sector. Weiskopf holds a master’s degree in public administration from Columbia University and a bachelor’s degree in economics and French from the University of Vermont.
BRIAN SMITH (SUBJECT MATTER EXPERT) has more than 40 years of professional experience in resource conservation and infrastructure development. He retired from the Washington State DOT (WSDOT) in 2014 as the Director of Multimodal Planning. He managed activities related to statewide and regional transportation planning, research, organizational and system performance measurement and reporting, data acquisition and analysis, sustainability, land use and growth management, and climate change. In 2005, Smith retired from the California DOT (Caltrans) as the Deputy Director, Planning and Modal Programs. There he managed the Divisions of Transportation Planning, Rail, Mass Transportation, Transportation System Information, Aeronautics, and Local Assistance. During his 22 years with the department, he also served as the statewide Environmental Division chief, the statewide Planning Division chief, deputy district director for Planning and Public Transportation, and as a district environmental branch chief. He represented Caltrans and WSDOT on AASHTO’s Standing Committees on Environment and Planning. Smith served on three TRB standing committees: Statewide Multimodal Transportation Planning; Metropolitan Policy, Planning and Processes; and Environmental Analysis in Transportation. He was an original and a continuing member of the Strategic Highway Research Program 2 Technical Coordinating Committee—Capacity, and has served as a chair or member of numerous TRB/NCHRP project panels. He received bachelor’s and master’s degrees from the University of California, Davis, and is a member of the American Institute of Certified Planners.
AA–3S U C C E S S F U L I N T E R M O D A L C O R R I D O R
M A N A G E M E N T P R A C T I C E S F O R S U S TA I N A B L E
S Y S T E M P E R F O R M A N C E

APPENDIX B : SCAN TEAM CONTACT INFORMATION

AB-1S U C C E S S F U L I N T E R M O D A L C O R R I D O R
M A N A G E M E N T P R A C T I C E S F O R S U S TA I N A B L E
S Y S T E M P E R F O R M A N C E
Appendix B:Scan Team Contact Information
AB-1

Jean Wallace PE, PMP – AASHTO ChairAssistant Division DirectorModal Planning & Program Management DivisionMinnesota Department of Transportation395 John Ireland Boulevard, MS 120St. Paul, MN 55155Phone: (651) 366-3181Fax: (651) 366-4795E-mail: [email protected]
Brian C. Hoeft PEDirector of FAST (Freeway and Arterial System of Transportation)Regional Transportation Commission of Southern Nevada4615 West Sunset RoadLas Vegas, NV 89118Phone: (702) 432-5311E-mail: [email protected]
James H. Lambert PE, DWRE, PhDAssistant Director, Center for Risk Management of Engineering SystemsResearch Associate Professor, Department of Systems and Information EngineeringUniversity of VirginiaPO Box 400747112C Olsson Hall151 Engineers WayCharlottesville, VA 22904Phone: (434) 982-2072 (434) 924-0960Fax: (434) 924-0865E-mail: [email protected]
Kari MartinUniversity Region PlannerMichigan Department of Transportation4701 West Michigan AvenueJackson, MI 49201Phone: (517) 750-0407E-mail: [email protected]
Neil SpillerTransportation Engineer, FHWAOffice of Operations, FHWA HQ1200 New Jersey Avenue, SEWashington, DC 20590Phone: (202) 366-2188E-mail: [email protected]
AB-2
APPENDIX B : SCAN TEAM CONTACT INFORMATION

AB-3S U C C E S S F U L I N T E R M O D A L C O R R I D O R
M A N A G E M E N T P R A C T I C E S F O R S U S TA I N A B L E
S Y S T E M P E R F O R M A N C E
Steve TakigawaDeputy Director Maintenance and OperationsCalifornia Department of TransportationPO Box 942873, MS 49Sacramento, CA 94273–0001Phone: (916) 654-6823E-mail: [email protected]
Lynn WeiskopfDirector, Office of Policy, Planning and PerformanceNew York State Department of Transportation50 Wolf Road, Floor 6Avenue A, 9th StreetAlbany, NY 12232-2633Phone: (518) 457-2320E-mail: [email protected]
Brian J. Smith AICP –Subject Matter Expert (SME)701 E. Ballantrae DriveShelton, WA 98584Phone: (360) 868-2025E-mail: [email protected]
AB-3

APPENDIX C : AMPLIFYING QUESTIONS

Appendix C:Amplifying Questions
AC-1S U C C E S S F U L I N T E R M O D A L C O R R I D O R
M A N A G E M E N T P R A C T I C E S F O R S U S TA I N A B L E
S Y S T E M P E R F O R M A N C E

AGENCY
Name:
Type (local, regional, special, state):
Size:
Please list the modes that your organization has the following responsibilities for:
a. Operations: ______________________________________________________________________________b. Development: ___________________________________________________________________________c. Capital investment: _____________________________________________________________________d. Funding: ________________________________________________________________________________ e. Planning: _______________________________________________________________________________f. Performance and/or reporting: ____________________________________________________________
CORRIDOR MANAGEMENT
1. What is your definition of “corridor”?2. How do you pick your corridors? How are corridor limits set?3. What are your key objectives?4. How is success defined?5. How are appropriate corridors selected to be multimodal? What criteria are used to reject suggested
corridors?6. How do you coordinate and manage multiple modes in a corridor?7. What are the key factors in intermodal planning for traveler and freight security? Corporate and
national security and defense?8. How are decisions prioritized?
PUBLIC AND STAKEHOLDER ENGAGEMENT
9. How do you inform and engage political and business leaders regarding your efforts? What are the risks and opportunities based on their perceptions?
10. What are the challenges with public outreach and engagement within the corridor? How have these challenges been met?
11. How do you engage commuters, corridor users, and those who live or work near the corridor?12. How do you gather information from underserved, low-income, and minority populations? What
goals were established to help these populations?13. How has real-time data been coordinated, processed, and communicated across modes and made
available to the public?
INSTITUTIONAL AND GOVERNANCE ISSUES
14. What agencies have you involve in corridor management?15. Who is leading, organizing, or guiding the effort?16. What agreements or MOUs are in place for planning and developing multimodal corridors among
agencies?17. What state laws or other governance provisions support intermodal and multimodal corridor
planning and development? Conversely, what governance issues are barriers for multimodal integration?
18. Who has been the champion for intermodal corridor management? If they are no long involved, why? Has anyone replaced the original champion?
19. What institutional and cultural changes have been necessary within your agencies to coordinate and
AC-2
APPENDIX C : AMPLIFYING QUESTIONS
manage multiple modes in a corridor?
PERFORMANCE OUTCOMES AND MEASURES
20. What are the desired performance outcomes for the modes being managed in your corridor? How do you measure them?
21. How were desired performance outcomes identified and agreed upon? Do you consider some performance measures higher priority than others?
22. What performance measures are in place?23. Who has ownership or responsibility for performance measures? Who is collecting the data? What
reporting is being done? Who is it shared with? How?24. What tools, forecasting models, or programs do you use to estimate performance benefits? Are after-
measurements conducted? If so, how close are the results to the forecasts?25. What economic performance measures, if any, are being used? Is there a return on investment or
benefit/cost measure to support corridor investment decisions?26. Is access to jobs or major economic centers considered an important measure for the corridor in
addition to more traditional measures like mobility/congestion?27. Have you estimated the capacity for each mode to move people and goods and provide acceptable
access?28. Did you have the appropriate before and after data to measure whether the stated purpose or vision
for the management of the corridor was met?29. How are you optimizing the potential contributions for a variety of modes within corridors?30. How do you consider technological changes such as in internet of things, big data, smart cities, V2X,
and connected vehicles?
INVESTMENT/FUNDING DECISIONS
31. Did you and your partners consider the benefit and cost of each mode’s contribution to recommended solutions?
32. With limited funding, how is project selection and sequencing prioritized for optimal benefit to users?33. How do intermodal planning and projects result in cost savings? To whom? Why?34. How do you consider fiscal constraint during the long-range planning process for a multimodal
corridor?35. How do you phase a multimodal corridor plan without having secure and adequate funding?36. How much funding is available for corridor management plan development and deployment?37. In recent or planned transportation project funding campaigns, how are agencies approaching the
voters or other community leaders for approval?38. Is funding applied across modes in a corridor?39. What are the guidelines or rules for choosing where to make investments?40. What funding sources are used? Are there one or multiple sources for each mode?41. How flexible are the funds?
SUSTAINABILITY OF PROGRAM/SUSTAINABLE TRANSPORTATION
42. What are the NEPA implications of an intermodal/multimodal concept? How do you move through that process if you are not fiscally constrained?
43. How is sustainability realized in your corridor plan?44. How have you secured funding for long-term corridor management, including operations and
maintenance?45. How does this effort support local, agency, and statewide sustainable transportation and
sustainability goals (e.g., planet/people/prosperity; communities/environment/economy; equity/environment/economy)?
AC-3S U C C E S S F U L I N T E R M O D A L C O R R I D O R
M A N A G E M E N T P R A C T I C E S F O R S U S TA I N A B L E
S Y S T E M P E R F O R M A N C E

LESSONS LEARNED
46. What lessons have you learned?47. What advice do you have for others in selecting and implementing an intermodal integrated
corridor?48. How long did it take until you saw results for your efforts?49. What has gone well?50. What do you see as your greatest success to date?51. What would you do differently next time?52. Is there anything else that you would like to tell us that is not covered in your answers to the above
questions?
AC-4
APPENDIX C : AMPLIFYING QUESTIONS

AC-5S U C C E S S F U L I N T E R M O D A L C O R R I D O R
M A N A G E M E N T P R A C T I C E S F O R S U S TA I N A B L E
S Y S T E M P E R F O R M A N C E

AC-6
A P P E N D I X D : W O R K S H O P P R E S E N TAT I O N S U M M A R I E S

Appendix D:Workshop Presentation Summaries
AD-1S U C C E S S F U L I N T E R M O D A L C O R R I D O R
M A N A G E M E N T P R A C T I C E S F O R S U S TA I N A B L E
S Y S T E M P E R F O R M A N C E

ArizonaArizona DOT, Maricopa County DOT, and City of Scottsdale
Nearly two decades ago, Arizona’s AZTech14 was established with an FHWA grant as a unique public/private partnership. The AZTech partnership’s mission is to provide a seamless multimodal transportation system in the greater Phoenix metropolitan area while minimizing environmental impacts and effectively managing transportation demands by integrating the region’s ITS infrastructure (see Figure D-1). AZTech comprises many agencies (i.e., city, county, MPO, regional, state, and federal), academia, and private partners, all focused on improving traffic management and operations with the intent of providing timely and accurate information, saving lives, improving mobility, and enhancing quality of life.
Figure D-1 Arizona’s AZTech Partnership focuses the efforts of many agencies in developing
seamless transportation for Phoenix.
The AZTech partnership has spent the last 20 years establishing partnerships and formalizing relationships, developing and testing technologies, strengthening interagency connectivity, bringing public safety into its scope, deploying operational plans and strategies, and moving into planning and implementation phases of ICM for the Loop 10115 corridor.
AD-2
A P P E N D I X D : W O R K S H O P P R E S E N TAT I O N S U M M A R I E S
14 AZTech, http://www.aztech.org/15 AZTech Loop 101 Integrated Corridor Management (ICM), AZTech, http://www.aztech.org/projects/integrated-corridor-mgmt.htm

The Loop 101 ICM plan case study demonstrates how AZTech has evolved by using formal institutional arrangements and agreements concerning operational roles and responsibilities, introducing technology, and developing response scenarios to coordinate multiple agency actions and reduce reaction times due to closure incidents and special events. In preparing for the worst-case scenario of a complete highway closure, the Loop 101 ICM plan includes:
Operational procedures and guidelines
Alternate route policy
Modeling of different freeway closure scenarios
Identifying regional corridors for operations
Signal timing collaboration capabilities for incident management
Ramp meter operational strategies
Traveler information plan
Model agreements to support operations
Incident management plans
Future plans call for including transit operations into the ICM framework.
The AZTech collaboration also produced a regional archive data system to provide data warehousing, data fusion, and integration. This system collects and processes freeway and arterial data, public safety data, and traffic signal data to support such services as 511, computer-aided dispatch for emergency services, and integration of traffic signal timing by different agencies within the corridor. AZTech’s regional information system supports a real-time incident management tool based on geographic information system (GIS) technology, which enables a tactical, coordinated, multiagency response.
In 20 years, AZTech’s partner agencies met the challenge of implementing an efficient alternate route traffic management system without developing a sophisticated decision support system. Along the way they have learned that:
The 24/7 availability, turnover, and education/certification of agency staff are critical success factors
Partnerships play a key role; they require commitment and regional priority and they evolve over time as field operations mature and expand to include new partners
Having formal interagency agreements helps sort out responsibilities, develop protocols up-front to avoid operational conflicts, and sustain partnerships through changes in elected and appointed officials
ICM plans continuously improve based on real-world experience and staff engagement
Operational strategies have no defined endpoints like construction projects; sustained funding for operations is a real challenge for agencies used to project-oriented programming and funding cycles
Performance reporting is critical to maintaining long-term support and sustainability; however, the story needs to be told better
AD-3S U C C E S S F U L I N T E R M O D A L C O R R I D O R
M A N A G E M E N T P R A C T I C E S F O R S U S TA I N A B L E
S Y S T E M P E R F O R M A N C E

CaliforniaCalifornia DOT, San Diego Association of Governments, FHWA California Division
With 38 million residents, California is the most populous state in the country. As its population and economy continue to grow, California is embracing change driven by state laws and policy on greenhouse gas reduction and developing sustainable communities, which have impacted the way needed transportation facilities and services are provided. Over the last several decades, the California DOT (Caltrans) has adopted numerous policies and guides, such as:
Context-Sensitive Solutions16 (2001)
Complete Streets Program17 (2008), which complements state law requiring complete streets to be considered in local general plans)
Complete Intersections Guide18 (2010)
Main Street, California: A Guide for Improving Community and Transportation Vitality19 (2013)
Caltrans has enacted design flexibility and endorsed the Urban Street Design Guide20 of the National Association of City Transportation Officials. Caltrans adopted a new strategic management plan in 2015 to better reflect state policies in the way it does business. This plan embraces improved communications, stronger partnerships, fostering a culture of performance and innovation, performance management, transparency, accountability, leadership, innovation, and teamwork. The plan establishes goals and performance measures reflecting these values.
In 2010, Caltrans developed its Smart Mobility Framework21 (SMF) to promote moving people and freight while enhancing economic and environmental resources. SMF is based on the principles of location efficiency/integrating land use and transportation, reliable mobility, health and safety, environmental stewardship, social equity, and robust economy. SMF includes nontraditional transportation performance measures intended to support planning and project-level decisions and evaluate progress toward implementing Smart Mobility principles.
Caltrans piloted SMF on the corridor system management plan for I-680 in Contra Costa County to develop strategies and methods for integrating SMF into transportation planning. After describing transportation elements within the corridor, including freeway facilities, transit networks, and the park-and-ride system, the pilot study looked at the multimodal connectivity of arterials and multiuse facilities within the corridor to describe a complete streets freeway corridor. Caltrans then reported on those SMF performance measures that could be used to assess current and future transportation performance, including:
AD-4
A P P E N D I X D : W O R K S H O P P R E S E N TAT I O N S U M M A R I E S
16 Context Sensitive Solutions, California Department of Transportation, State of California, http://www.dot.ca.gov/hq/tpp/offices/ocp/css.html
17 Complete Streets Program, Caltrans, State of California, http://www.dot.ca.gov/transplanning/ocp/complete-streets.html18 Complete Intersections: A Guide to Reconstructing Intersections and Interchanges for Bicyclists and Pedestrians, California
Department of Transportation, 2010, http://www.dot.ca.gov/trafficops/ped/docs/complete-intersections-brochure.pdf19 Main Street, California: A Guide for Improving Community and Transportation Vitality, California Department of
Transportation, 2013, http://www.dot.ca.gov/hq/LandArch/mainstreet/main_street_3rd_edition.pdf20 Urban Street Design Guide, National Association of City Transportation Professionals, NACTO,
http://nacto.org/publication/urban-street-design-guide/21 The Smart Mobility Framework, California Department of Transportation, State of California,
http://www.dot.ca.gov/hq/tpp/offices/ocp/smf.html

Mode share
Multimodal travel mobility (travel time, travel costs, and delay)
Multimodal travel time reliability (travel time reliability measures by mode and buffer indices)
Multimodal service quality (multimodal levels of service, complete streets, and asset conditions)
Multimodal safety
Pedestrian and bicycle mode share
Climate and energy conservation
Air emissions reductions
Return on investment
Caltrans has also applied its policies in working with local governments to incorporate these state policy initiatives into local projects. For example, the City of Redding modified a project to create a road diet and improve safety and bicycle travel on existing facilities. Similarly, Caltrans worked with the City of San Francisco to reduce speeds and structurally improve pedestrian and bicycling safety on Sloat Boulevard.
California and regional and federal agency representatives presented case studies of intermodal corridor management, spearheaded by ICM projects:
The strategic corridor planning process and the I-210 ICM pilot project being implemented in the Los Angeles region
The I-15 ICM project in San Diego
The I-80 and US 101 SMART corridors in the San Francisco Bay area
Innovative and sophisticated ICM technologies are being used to support each of these efforts, including:
Variable and changeable message signs
Lane use signs
Variable advisory and speed limit signs
Ramp metering
Dynamic rerouting on local arterials, including coordinated signal operations
Dissemination of real-time multimodal traveler information
Collaboration with regional and local governments and other stakeholders
Formally defined roles and responsibilities for developing and operating the corridors
Strong emphasis on system planning
Preplanned responses to operating conditions expected to arise
Caltrans uses its mobility pyramid in corridor management decision-making (see Figure D2). At the base of the pyramid is system monitoring and evaluation, “the foundation upon which all other strategies are built.” Moving up the pyramid, these strategies for improving corridor performance ascend through maintenance
AD-5S U C C E S S F U L I N T E R M O D A L C O R R I D O R
M A N A G E M E N T P R A C T I C E S F O R S U S TA I N A B L E
S Y S T E M P E R F O R M A N C E

and preservation; smart land use, demand management, and value pricing; ITS, traveler information/traffic control, and incident management; operational improvements; through system completion and expansion. As applied to Caltrans’ Los Angeles district, a corridor is defined as a broad geographic band with logical termini, often including not only a freeway, but also transit networks and adjacent arterials. Corridor management looks at all modes (i.e., highway, transit, transit-oriented land uses, active transportation modes, and supporting infrastructure) with an eye toward sustainability.
Figure D2 The Caltrans mobility pyramid recognizes the fundamental roles of system maintenance and monitoring while integrating data and operational technologies
with system expansion and land use/demand management to improve mobility.
Caltrans has initiated a statewide ICM program called Connected Corridors22 that looks for all opportunities to move people and goods efficiently by all modes available—freeways, arterials, transit, travel-demand management, and agency collaboration—to achieve the greatest gains in operational improvement. Caltrans selected the I-210 corridor, from Pasadena to La Verne, for a Connected Corridors pilot project. This corridor was selected based on a number of characteristics, including the availability of traffic monitoring systems (i.e., mainline, ramps, and intersections) and parallel arterials, some of which included traffic responsive systems already in place; HOV and HOT lanes; transit service, including bus and light rail transit; and demonstrated need for incident response capability.
I-210—Los Angeles Metropolitan Area
The objectives of the I-210 pilot project include reducing congestion and improving mobility within a section of the I-210 corridor in the San Gabriel Valley. The project involves coordinating management of the I-210
AD-6
A P P E N D I X D : W O R K S H O P P R E S E N TAT I O N S U M M A R I E S
22 Berkeley Connect Corridors, Integrated Corridor Management, UC Berkeley, http://connected-corridors.berkeley.edu/
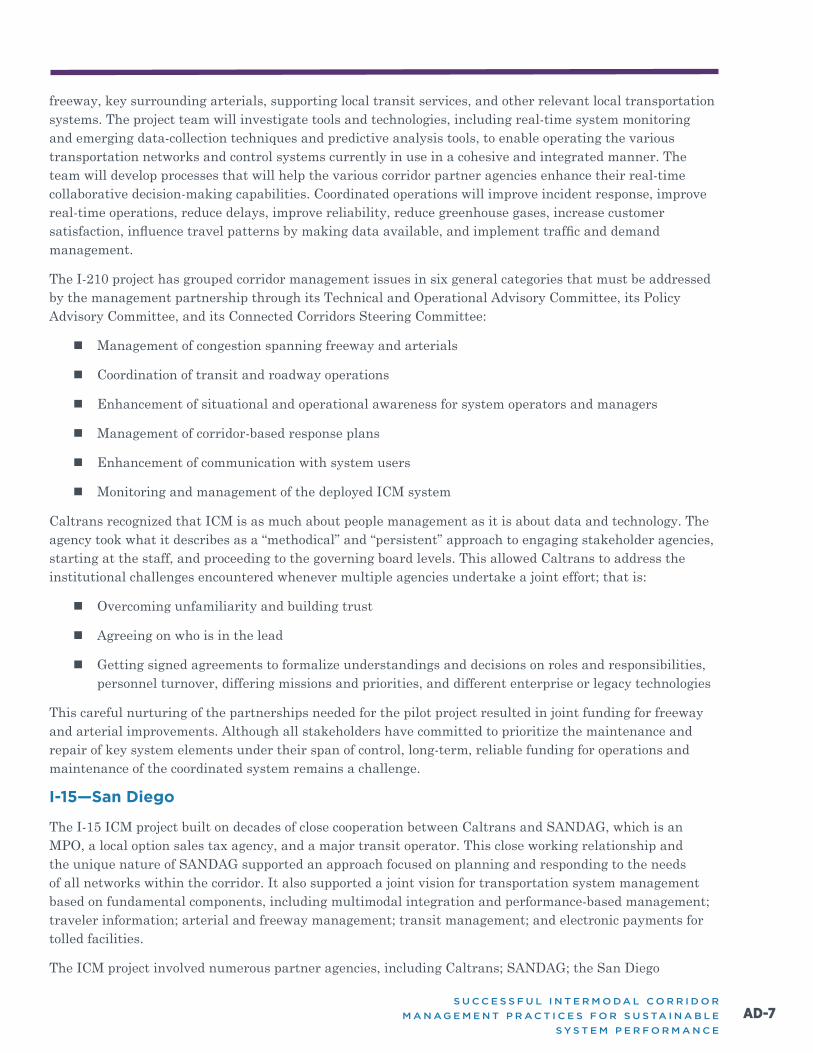
freeway, key surrounding arterials, supporting local transit services, and other relevant local transportation systems. The project team will investigate tools and technologies, including real-time system monitoring and emerging data-collection techniques and predictive analysis tools, to enable operating the various transportation networks and control systems currently in use in a cohesive and integrated manner. The team will develop processes that will help the various corridor partner agencies enhance their real-time collaborative decision-making capabilities. Coordinated operations will improve incident response, improve real-time operations, reduce delays, improve reliability, reduce greenhouse gases, increase customer satisfaction, influence travel patterns by making data available, and implement traffic and demand management.
The I-210 project has grouped corridor management issues in six general categories that must be addressed by the management partnership through its Technical and Operational Advisory Committee, its Policy Advisory Committee, and its Connected Corridors Steering Committee:
Management of congestion spanning freeway and arterials
Coordination of transit and roadway operations
Enhancement of situational and operational awareness for system operators and managers
Management of corridor-based response plans
Enhancement of communication with system users
Monitoring and management of the deployed ICM system
Caltrans recognized that ICM is as much about people management as it is about data and technology. The agency took what it describes as a “methodical” and “persistent” approach to engaging stakeholder agencies, starting at the staff, and proceeding to the governing board levels. This allowed Caltrans to address the institutional challenges encountered whenever multiple agencies undertake a joint effort; that is:
Overcoming unfamiliarity and building trust
Agreeing on who is in the lead
Getting signed agreements to formalize understandings and decisions on roles and responsibilities, personnel turnover, differing missions and priorities, and different enterprise or legacy technologies
This careful nurturing of the partnerships needed for the pilot project resulted in joint funding for freeway and arterial improvements. Although all stakeholders have committed to prioritize the maintenance and repair of key system elements under their span of control, long-term, reliable funding for operations and maintenance of the coordinated system remains a challenge.
I-15—San Diego
The I-15 ICM project built on decades of close cooperation between Caltrans and SANDAG, which is an MPO, a local option sales tax agency, and a major transit operator. This close working relationship and the unique nature of SANDAG supported an approach focused on planning and responding to the needs of all networks within the corridor. It also supported a joint vision for transportation system management based on fundamental components, including multimodal integration and performance-based management; traveler information; arterial and freeway management; transit management; and electronic payments for tolled facilities.
The ICM project involved numerous partner agencies, including Caltrans; SANDAG; the San Diego
AD-7S U C C E S S F U L I N T E R M O D A L C O R R I D O R
M A N A G E M E N T P R A C T I C E S F O R S U S TA I N A B L E
S Y S T E M P E R F O R M A N C E

Metropolitan Transit System; the North County Transportation District; the California Highway Patrol; and the Cities of San Diego, Poway, and Escondido. The effort to implement ICM started with the application of a capability maturity assessment model that identified where on the development scale, across a number of parameters, the team wanted to be versus a realistic assessment of where they were (see Figure D-3). This helped the team to focus on the most critical gaps in data, technical, and collaboration capabilities.
Figure D-3 The I-15 ICM project in San Diego used a capability maturity model to assess strengths, allowing the multiagency team to address technical and institutional
weaknesses.
The 20-mile, 10 general-purpose lane segment of I-15 selected for the ICM pilot project is unique in that it has four reconfigurable lanes, providing a “freeway within a freeway”. This segment has multiple entry points and direct access ramps from multiple transit parking stations along the corridor that provide access to the region’s Bus Rapid Transit services. A number of ICM strategies were identified as applicable to this project:
Active traffic management
A multimodal decision support system using:
Management of multiple modes
Traveler information en-route (changeable message signs and the 511 San Diego mobile app)
Pre-trip traveler information
Local roadway signal coordination and freeway ramp metering
AD-8
A P P E N D I X D : W O R K S H O P P R E S E N TAT I O N S U M M A R I E S
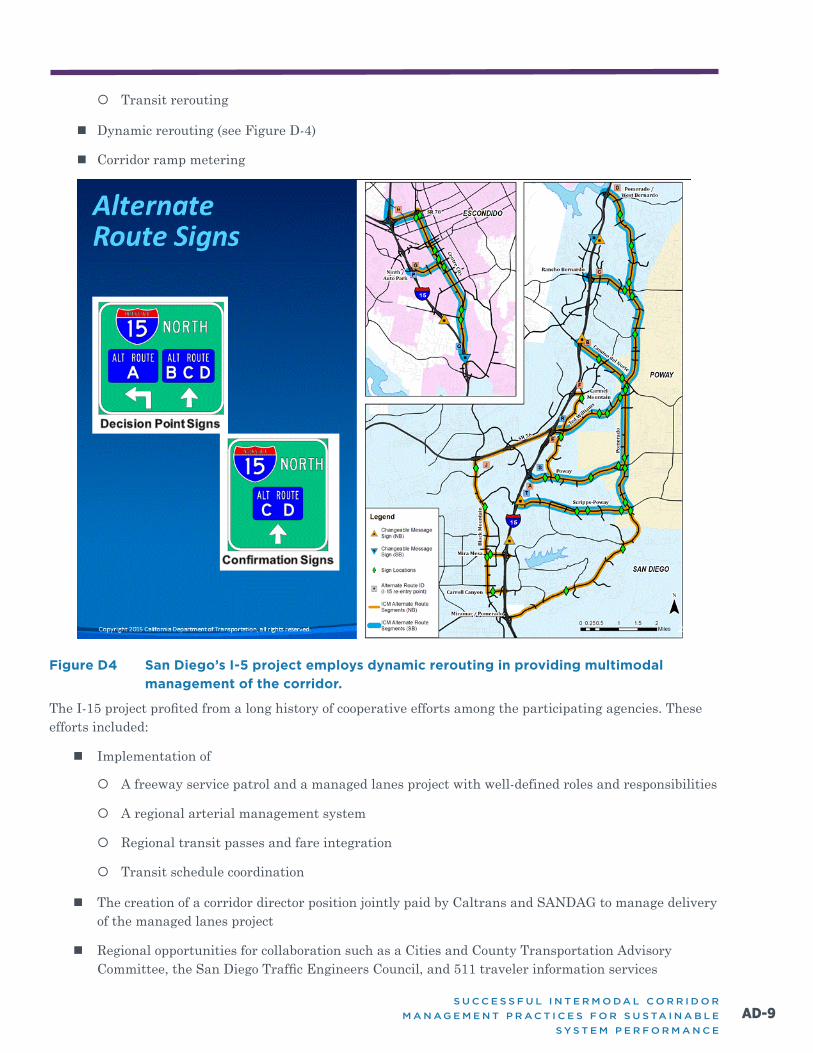
Transit rerouting
Dynamic rerouting (see Figure D-4)
Corridor ramp metering
Figure D4 San Diego’s I-5 project employs dynamic rerouting in providing multimodal
management of the corridor.
The I-15 project profited from a long history of cooperative efforts among the participating agencies. These efforts included:
Implementation of
A freeway service patrol and a managed lanes project with well-defined roles and responsibilities
A regional arterial management system
Regional transit passes and fare integration
Transit schedule coordination
The creation of a corridor director position jointly paid by Caltrans and SANDAG to manage delivery of the managed lanes project
Regional opportunities for collaboration such as a Cities and County Transportation Advisory Committee, the San Diego Traffic Engineers Council, and 511 traveler information services
AD-9S U C C E S S F U L I N T E R M O D A L C O R R I D O R
M A N A G E M E N T P R A C T I C E S F O R S U S TA I N A B L E
S Y S T E M P E R F O R M A N C E
The history of collaboration notwithstanding, there were still institutional challenges that were overcome by developing formal Memoranda of Understanding (MOUs), an agreed-to management framework, and technical memoranda outlining technical requirements leading to operational management plans that include pre-planned responses to both “normal” operations and incidents. As an outcome of the I-15 ICM project efforts, SANDAG and Caltrans established the I-15 Corridor Management Team. The team’s primary objectives are maintaining a long-term management vision, assessing corridor management strategies, and making actionable recommendations. The team is composed of director-level and management-team staff.
SANDAG led the effort to obtain a USDOT ICM pilot project grant. The success of this corridor’s integrated management relies on the active cooperation and collaboration of the operating agencies who maintain control over their assets and can request others to change their operations or mutually agree to automate certain actions when pre-identified conditions warrant. The project team’s bottom-line lessons learned to date include:
“We don’t know what we don’t know”
Explain individually, discuss as a group
Have performance measures
Do not promise what you cannot deliver
Extensive data requirements
Know users, validate document user requirements, and make sure those requirements track back to key performance metrics
Funding needed to maintain the system
Respect stakeholders views
I-80 and US 101 SMART Corridors—San Francisco Bay Area
The San Francisco Bay Area is large and diverse. Its transportation system must serve the needs of intensely populated urban areas, technological and manufacturing centers, ports, international airports, world-class universities, sprawling suburban communities, and rural agricultural and wine-growing regions. Its population is growing; its economy is healthy; it is a major tourist destination; and its transportation facilities continue to face growing congestion and delay for both travelers and freight.
The I-80 Safety, Mobility, and Automated Real-time Traffic (SMART) Corridor project23 (see Figure D5) involves a 20-mile interstate highway corridor located in Contra Costa and Alameda Counties, serving commute and recreational travel and freight. This highly congested corridor is physically constrained by adjacent urban development and the San Francisco Bay. It already contains a fully developed freeway, HOV lanes, direct connectors from HOV lanes to transit parking, heavy commuter rail and intercity Amtrak service, and park-and-ride lots. It also experiences severe congestion many hours of the day and unreliable travel times.
AD-10
A P P E N D I X D : W O R K S H O P P R E S E N TAT I O N S U M M A R I E S
23 I-80 SMART Corridor Project, Caltrans, http://80smartcorridor.org/

Figure D5 The I-80 SMART corridor combines technology with multimodal traveler information to manage an intensely urban and congested corridor in the San
Francisco Bay Area.
The SMART corridor project combines traditional traffic operations management strategies and technologies, with new approaches, such as active traffic management and the use of overhead lane control signs to alert travelers and harmonize traffic speeds to conditions. These measures are being combined with adaptive ramp metering, the use of arterials, and information display boards to give travelers the information needed to make wise travel route and mode choices (see Figure D6). The ICM approach relies on interconnecting Transportation Management Centers (TMCs) operated by local jurisdictions with Caltrans’ regional TMC, video monitoring, and playbooks for planned events and incidents. The public outreach for this project reflects the Bay Area’s cultural diversity and familiarity with technology and social media.
AD-11S U C C E S S F U L I N T E R M O D A L C O R R I D O R
M A N A G E M E N T P R A C T I C E S F O R S U S TA I N A B L E
S Y S T E M P E R F O R M A N C E

Figure D6 Managing the I-80 SMART corridor requires a variety of technologies and installed
devices to provide travelers with dynamic routing and operating instructions.
The funding for this project is a combination of federal, regional, and local transportation funds, including local option sales tax for transportation funds, combined with regional air quality and federal Congestion Mitigation Air Quality Improvement Program funds. This funding scheme reflects the range of federal, state, regional, and local project partners (see Figure D7).
AD-12
A P P E N D I X D : W O R K S H O P P R E S E N TAT I O N S U M M A R I E S

Figure D7 The I-80 SMART corridor is being delivered by a strong, collaborative partnership of many state, regional, and local agencies united by an MOU which addresses
stakeholder and community concerns.
This partnership is producing California’s most sophisticated managed intermodal corridor. The partnership is strengthened by frequent leadership and executive team meetings and the use of a comprehensive MOU that identified and addressed stakeholder and community concerns early in the development process. Employing seven distinct contracts during project implementation allowed the leverage of individual stakeholder capabilities and responsibilities. Stakeholders shared a common public outreach toolkit to maximize dissemination of project information while keeping the message consistent.
Each agency will be responsible for maintenance, operations, and upkeep of elements deployed within its jurisdiction. In addition, Caltrans has committed dedicated resources for performance measurement and reporting on resultant safety and mobility benefits, as well to help establish the level of logistical and human resources needed for optimum day-to-day corridor operations and upkeep of the deployed ITS elements for future application in other corridors.
The US 101 corridor is extremely congested and connects the North Bay and San Francisco with San Jose in the Silicon Valley. Strategies similar to those being employed on I-80 are also being used here, with an emphasis on incident response by the use of preplanned and signed freeway detours on four conventional state highways and many local major arterials.
Florida
AD-13S U C C E S S F U L I N T E R M O D A L C O R R I D O R
M A N A G E M E N T P R A C T I C E S F O R S U S TA I N A B L E
S Y S T E M P E R F O R M A N C E

Florida DOT, Florida Department of Economic Opportunity, and Space Coast Transportation Planning Organization
Florida presented its emerging multimodal corridor planning process using the East Central Florida Corridor as a case study. Florida anticipates continued population growth and increasing demographic diversity and economic growth, particularly in transportation-dependent sectors like export trade, freight, and tourism. Florida urban areas are largely situated along its coastline and are starting to grow together, giving rise to a nearly fivefold increase in the projected amount of congested highways by 2040. To address this, Florida has a long-range vision plan (i.e., the Florida Transportation Plan24), a policy plan for implementing its strategic intermodal system, and a freight mobility and trade plan. These plans value efficient and reliable mobility, more transportation choices for people and freight, and support for economic competitiveness. Florida is also ensuring alignment between its transportation planning and the Florida Strategic Plan for Economic Development25, led by its Department of Economic Opportunity.
Florida envisions its corridors of the future providing high-speed, high-capacity, efficient, and reliable visitor and trade flows between its urban regions. These corridors should provide more personal travels choices, incorporate emerging technologies; include other infrastructure such as utilities and communications; and be designed and located to protect and enhance Florida’s communities and environment.
Florida’s multimodal corridor planning takes place within a rich context of intense collaboration and planning for the state’s future (see Figure D8) The How Shall We Grow?26 regional visioning effort identified four key themes guiding future development: conservation, centers, countryside, and corridors (see Figure D9). Florida’s corridor planning is also influenced by a shift in objectives from moving vehicles to moving people and freight and an emphasis on the drivers and outcomes of transportation. (More information on Florida’s corridor planning process is available at Florida’s Future Corridors.)
Figure D8 Transportation planning in Florida supports a shared vision of future development.
AD-14
A P P E N D I X D : W O R K S H O P P R E S E N TAT I O N S U M M A R I E S
24 Florida Transportation Plan (FTP) and Strategic Intermodal System (SIS), Florida Department of Transportation, http://floridatransportationplan.com/
25 Florida Strategic Plan for Economic Development, Department of Economic Opportunity, http://www.floridajobs.org/Business/FL5yrPlan/FL_5yrEcoPlan.pdf
26 How Shall We Grow? Central Florida Regional Growth Vision, Central Florida Joint Policy Framework Committee, August 10, 2007, http://www.myregion.org/clientuploads/pdfs/HSWG_final.pdf

Figure D9 Florida’s planning efforts have identified four themes, which are guiding future land
use and economic and transportation corridor development.
In addition to statewide and regional long-range planning frameworks, visioning and goal setting by multiple stakeholders to focus corridor planning efforts, and innovative planning tool development, the East Central Florida Corridor Study was guided by a high-level oversight task force, which was appointed by Governor Rick Scott in November 2013. Chaired by the Florida Department of Economic Development, its 13 members represented public, private, and civic organizations. The Task Force presented its final report28, which included a set of guiding principles suitable for use in future corridor studies, recommendations for specific corridor improvements, and suggestions for future corridors to be studied, to Governor Scott on December 1, 2014.
Figure D10 The East Central Florida Corridor effort is focused on an area of the state expected
to experience significant population and economic growth.
AD-15S U C C E S S F U L I N T E R M O D A L C O R R I D O R
M A N A G E M E N T P R A C T I C E S F O R S U S TA I N A B L E
S Y S T E M P E R F O R M A N C E
28 Final Report, East Central Florida Corridor Task Force, December 1, 2014, http://www.ecfcorridortaskforce.org/doc/ECFCTF_FinalReport_signed.pdf

The successful East Central Florida Corridor effort has provided a succinct set of lessons learned:
Contributors to Success
High-level leadership and sponsorship from the governor’s office ensured interagency cooperation and private sector/interested party engagement
Commitment of resources by more than one agency
Collaboration between multiple state agencies; FDOT offices; and state, regional, and local partners
Consensus building was essential
Continuous involvement of environmental stakeholders, developers, and the business community built trust.
Early participation by environmental interests was particularly successful and was a paradigm shift.
The How Shall We Grow? regional visioning and the four Cs provided a discussion framework for future corridors
Built early consensus on shared values
Foundation for developing the guiding principles related to the four Cs for future corridors
Prior work provided an underlying driver for technical analysis
Working on the guiding principles set the stage for eventual recommendations
Task force members were champions for both the process and their concerns
Members able to present their goals, perspectives, and values to inform the task force and make the case for their positions
Creative use of data and analysis tools
Planning level analysis
Short time
Appropriate level of analyses for nontechnical audience
The approach works and can be used for the next corridor evaluation
Challenges
Anticipating changes in demographics, population, travel behavior, and technology when planning for 50+-year horizon
Implementing the task force’s recommendations must accommodate:
Environmental stewardship initiatives
Ongoing economic development efforts
Large-scale land and economic development activities
Transportation projects already in the pipeline
AD-16
A P P E N D I X D : W O R K S H O P P R E S E N TAT I O N S U M M A R I E S

The four Cs and related guiding principles for corridor development present their own challenges
Conservation – multiple local initiatives and regional conservation priorities
Countryside – counties differ in their approaches to agriculture and rural lands
Centers – urban areas have different population forecasts, changes in land development buildout size/timing, increasing use of sector planning with inconsistent planning horizons and definitions of need, and unclear decision-making and governance structures for some new developments
Corridors – gaining consensus of the scope of projects that cross multiple counties, implementation of regional transportation priorities across planning and jurisdictional boundaries and coordinating multiple transportation partners, not all of whom may be in formal governance relationships
Current environmental review processes are not structured to efficiently handle public/private partnerships and multimodal and multiple use corridors
The regional transit vision and plan are still being developed, led by the Central Florida Metropolitan Planning Organization Alliance via an MOU with FDOT
MarylandMaryland State Highway Administration
Maryland is the 19th most populous state, and the 5th most densely populated. By 2040, its population is expected to increase by about 20%, or 1.1 million people. The primary highway system carries more than two-thirds of the state’s total vehicle miles traveled. Although the Baltimore/Washington D.C. area has a well-developed multimodal transportation system, it is one of the most congested areas in the country.
To cope with the current and expected levels of travel demand, Maryland has a data-driven approach to planning and evaluating future highway investments that starts with a Highway Needs Inventory(HNI)29. The Maryland State Highway Administration (SHA) develops the inventory as its input to the Maryland DOT’s (MDOT’s) capital program. The inventory, along with lists of county priorities, provides input to the Consolidated Transportation Plan, which in turn drives specific project planning.
MDOT uses a performance-based approach to carrying out initiatives, policies, and goals, as required by the state’s Managing for Results process, MDOT Attainment Report30, and the Government Performance and Results Act of 199331. This target-setting and outcome-oriented approach ensures state agency accountability using reliable data and evaluation processes.
The SHA is responsible for developing a comprehensive highway corridor program that includes both short- and long-term improvements proposed for strategic corridors. Maryland realized that it needed a high-level tool for analyzing the implications of these improvements on mobility, natural resources, sustainability, communities, safety, and the economy. In response, the SHA, in collaboration with the University of Maryland and a consultant, created MOSAIC32
AD-17S U C C E S S F U L I N T E R M O D A L C O R R I D O R
M A N A G E M E N T P R A C T I C E S F O R S U S TA I N A B L E
S Y S T E M P E R F O R M A N C E
29 Highway Needs Inventory, State Highway Administration, Maryland Department of Transportation, http://www.roads.maryland.gov/Index.aspx?PageId=509
30 2016 Annual Attainment Report on Transportation System Performance, Maryland Department of Transportation, http://www.mdot.maryland.gov/newMDOT/Planning/CTP/Final_CTP_16_21/Documents/Attainment_2016_1_18_Single_LR.pdf
31 Government Performance Results Act of 1993, Office of Management and Budget, The White House, https://www.whitehouse.gov/omb/mgmt-gpra/gplaw2m
32 Zhang, Lei et al. 2011 Comprehensive Highway Corridor Planning with Sustainability Indicators. Baltimore MD. Maryland State Highway Administration MD-11-SP009B4E http://ntl.bts.gov/lib/42000/42900/42954/MD-11-SP009B4E_-_Comprehensive_Highway_Corridor_Planning_with_Sustainability_Indicators_-_Final_Report.pdf
(Model of Sustainability and Integrated Corridors). MOSAIC is intended to analyze the impact of multimodal highway improvements on sustainability indicators; improve long-range planning, highway needs inventory, project screening, and environmental stewardship; and help save time and money.
Given its data-driven business approach, MOSAIC draws upon both an asset data warehouse program and a rich, centralized, enterprise GIS. Over the last seven years, MOSAIC has progressed from a spreadsheet model to a more user-friendly enterprise GIS widget prototype. The widget is intended to reduce the time needed to populate data in the model. To date, MOSAIC development and vetting has been largely internal to MDOT and its partners; its development has cost approximately $750,000.
MOSAIC’s analysis starts with corridor selection, identification of possible improvements, and gathering available data on existing conditions. MOSAIC then looks at the implications of improvements (initially general-purpose lane and interchange projects) in six classes of sustainability indicators for logical segments of the corridor determined for each indicator (see Figure D11):
Mobility—improved travel time in corridor limits (based on traffic counts, vehicle probe speeds, roadway inventory data, and ongoing system performance monitoring efforts, with improved speed calculations based on Highway Capacity Manual procedures)
Safety—projected crash reductions compared to existing safety data
Socio-Economics—economic benefits associated with travel time costs; access to employment; gross domestic product; livability benefits, such as accessibility/connectivity and land use compatibility; noise exposure; and aesthetics, including historical road and site protection
Natural Resources—presence of resources (e.g., federal lands, agricultural lands, historic properties, conservation lands, and county parks) within a designated buffer around the corridor
Energy and Environment—U.S. Environmental Protection Agency MOVES-modeled emissions, fuel consumption
Costs—estimated planning, engineering, right of way, and construction costs for improvements based on Maryland SHA Highway Construction Estimating Manual.
MOSAIC can output maps, PDF reports, and GIS project files.
AD-18
A P P E N D I X D : W O R K S H O P P R E S E N TAT I O N S U M M A R I E S

Figure D11 Maryland’s Model of Sustainability and Integrated Corridors (MOSAIC) is a high-level tool for analyzing the impact of multimodal highway improvements on sustainability indicators, improving long-range planning and project screening, and
enhancing environmental stewardship.
The next iteration, MOSAIC II, includes enhanced improvement types to be analyzed, new report formats (see Figure D12), and the ability to link to Maryland’s statewide model, which works with national, statewide, and regional data inputs and travel analyses. The enhanced multimodal improvements include high-occupancy toll lanes, express toll lanes, bus-only lanes, truck-only lanes, light rail transit, and road diet.
Figure D12 MOSAIC is being enhanced to include additional multimodal improvement types to be analyzed, new data inputs, and new report formats. It is seen as becoming useful not only in HNI project reviews, but also in corridor, concept and feasibility studies, development review, and initiating and helping scope project planning and environmental analyses. Although flexible, MOSAIC could prove unwieldly if used to
examine too large a corridor.
AD-19S U C C E S S F U L I N T E R M O D A L C O R R I D O R
M A N A G E M E N T P R A C T I C E S F O R S U S TA I N A B L E
S Y S T E M P E R F O R M A N C E

While MOSAIC is still a work in progress, Maryland’s experience to date has produced some lessons learned:
Data resources are an investment.
Using the best data available is a reasonable strategy to get started.
An effective tool must be user friendly.
Project advocacy and analysis must be consistent.
MOSAIC is just one decision-support tool among many.
MassachusettsMassachusetts DOT
In 2009, responding to legislation intended to reform the state’s transportation agencies and the results of an extensive public engagement effort, Massachusetts combined its five independent transportation agencies and authorities into a unified department—MassDOT—and moved forward with a new business model. This new department combined the Massachusetts Bay Transportation Authority, the Massachusetts Turnpike Authority, the Massachusetts Highway Department, the Massachusetts Aeronautics Commission, and the Executive Office of Transportation. These agencies had experienced significant fiscal problems, faced service cuts, and competed with each other for funding. The governor and legislature agreed that reform was needed to address these issues and move beyond the era of the “Big Dig.” The new secretary also became CEO and chair of the board of directors, and transportation system users were no longer called travelers, commuters, motorists, or taxpayers, but rather were all now identified as customers.
The extensive public outreach effort, dubbed weMove Massachusetts33, used traditional and innovative outreach tools. This effort identified 10 customer-focused themes that reflect customer values and desires for their transportation system:
Improve Transportation System Reliability
Focus on Maintaining Our Transportation System
Design a Better Transportation System
Encourage Shared Use of Infrastructure
Increase Capacity by Expanding Facilities and Services
Create a More User-Friendly Transportation System
Broaden the Transportation System to Serve More People
Provide Adequate Transportation Funding and Collect Revenue Equitably
Minimize Environmental Impacts
Improve Access to Our Transportation System
AD-20
A P P E N D I X D : W O R K S H O P P R E S E N TAT I O N S U M M A R I E S
33 weMove Massachusetts: Planning for Performance, Office of Transportation Planning, Massachusetts Department of Transportation, May 2014, https://www.massdot.state.ma.us/Portals/22/Docs/WMM_Planning_for_Performance.pdf

These themes represented a number of public desires and wishes, including:
Minimizing delays and providing consistent travel time (not necessarily reliving congestion)
Maintaining assets
Creating innovative, creative and context-sensitive designs
Having roadway facilities that support vehicles, bicyclists, and pedestrians
Expanding capacity through corridor management, ITS, real-time traveler information, apps for customers, and some large capital investments
Paying more attention to transit, bicyclists, and pedestrians
Increasing balance by efficiently using funding from appropriations, fare increases, and a gas tax increase
Creating environmentally sustainable transportation (This led to MassDOT’s GreenDOT policy in 2010, a Healthy Transportation Policy Directive34 and Engineering Directive35, and the consideration of greenhouse gases when planning and programming new capital projects.)
Considering the multimodal mobility needs of all system users
Given this structural and policy background, and faced with the reality that not every desired project and service could be funded, MassDOT knew it needed a way to make logical, defensible, and smart future investment choices that provided the “best bang for the buck” for its customers. Implementing a performance management approach was integral to achieving publically supported outcomes, including supporting state greenhouse gas reduction goals, economic development, increased healthy transportation options and complete streets, cross-modal investments, and responding to the needs and demands of the changing customer demographics (e.g. millennials).
MassDOT found it needed performance metrics to support cross-asset allocation decisions and to influence the programming process. As a result, the updated 2014-2040 statewide long-range transportation plan, weMOVE Massachusetts, employed a Planning for Performance scenario planning tool. This tool allowed analysis of outcomes resulting from different funding level and allocation scenarios, which could then be compared the various policy goals.
To help develop scenarios, MassDOT conducted extensive public outreach, particularly to environmental justice and Title VI populations. This outreach helped identify outcomes MassDOT’s customers cared about. This information was used to further refine MassDOT’s development of a performance management context (i.e., goals, metrics, and targets) to help guide cross-asset allocation of flexible funds. Metrics for highways and transit included not only asset conditions, but also operational performance and accessibility outcomes (see Figure D13). The Planning for Performance tool allowed comparison of the results of current and variable levels of future investments against the identified goals, providing information about tradeoffs if considering different investment scenarios among the agency’s assets across modes, such as increased investments in transit and healthy transportation.
AD-21S U C C E S S F U L I N T E R M O D A L C O R R I D O R
M A N A G E M E N T P R A C T I C E S F O R S U S TA I N A B L E
S Y S T E M P E R F O R M A N C E
34 Healthy Transportation Policy Directive, Massachusetts Department of Transportation, September 9, 2013, http://www.massdot.state.ma.us/portals/0/docs/greendot/directivehealthytransportation.pdf
35 Design Criteria for MassDOT Highway Division Projects, Engineering Directive E-14-006, December 19, 2014, https://www.massdot.state.ma.us/Portals/8/docs/engineeringDirectives/2014/e-14-006.pdf
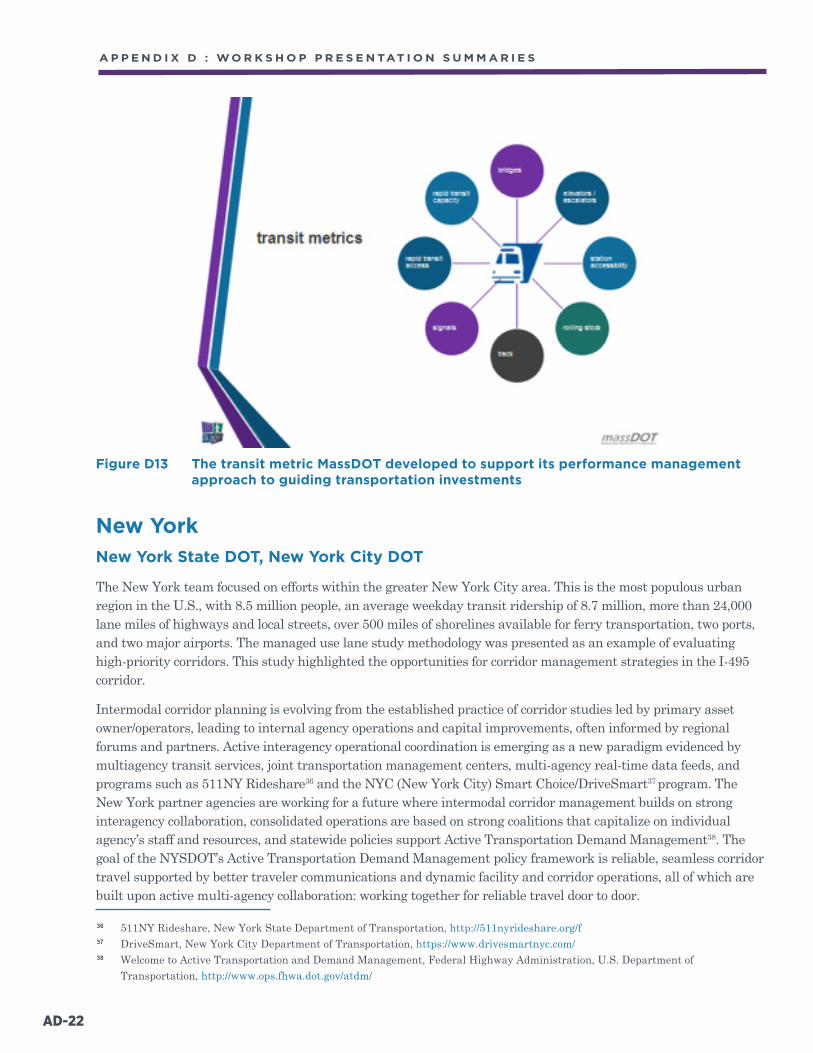
Figure D13 The transit metric MassDOT developed to support its performance management approach to guiding transportation investments
New YorkNew York State DOT, New York City DOT
The New York team focused on efforts within the greater New York City area. This is the most populous urban region in the U.S., with 8.5 million people, an average weekday transit ridership of 8.7 million, more than 24,000 lane miles of highways and local streets, over 500 miles of shorelines available for ferry transportation, two ports, and two major airports. The managed use lane study methodology was presented as an example of evaluating high-priority corridors. This study highlighted the opportunities for corridor management strategies in the I-495 corridor.
Intermodal corridor planning is evolving from the established practice of corridor studies led by primary asset owner/operators, leading to internal agency operations and capital improvements, often informed by regional forums and partners. Active interagency operational coordination is emerging as a new paradigm evidenced by multiagency transit services, joint transportation management centers, multi-agency real-time data feeds, and programs such as 511NY Rideshare36 and the NYC (New York City) Smart Choice/DriveSmart37 program. The New York partner agencies are working for a future where intermodal corridor management builds on strong interagency collaboration, consolidated operations are based on strong coalitions that capitalize on individual agency’s staff and resources, and statewide policies support Active Transportation Demand Management38. The goal of the NYSDOT’s Active Transportation Demand Management policy framework is reliable, seamless corridor travel supported by better traveler communications and dynamic facility and corridor operations, all of which are built upon active multi-agency collaboration: working together for reliable travel door to door.
AD-22
A P P E N D I X D : W O R K S H O P P R E S E N TAT I O N S U M M A R I E S
36 511NY Rideshare, New York State Department of Transportation, http://511nyrideshare.org/f37 DriveSmart, New York City Department of Transportation, https://www.drivesmartnyc.com/38 Welcome to Active Transportation and Demand Management, Federal Highway Administration, U.S. Department of
Transportation, http://www.ops.fhwa.dot.gov/atdm/

These efforts support NYSDOT’s investment strategy, which is based on sound asset management strategies supported by strong sustainability principles. NYSDOT’s strategies for asset management and sustainability include:
Asset Management
The right treatment at the right time in light of system needs
Consider the entire transportation system regardless of ownership or mode (i.e., system component owners/operators should be transparent to customers as they move across jurisdictions and modes)
Sustainability
Optimize user benefits across all modes
System, not project, corridor perspective
Consider all modal connections
Optimize system with technology investments
Embrace new technologies and sustainable data sources to inform temporal traffic conditions
Use probe data to develop dynamic simulation models for planning and operations
Prioritize community and commercial center access for people and goods
Balance environmental, economic, and social needs
The challenges to executing these strategies include funding, project complexities, long delivery time frames, competing interests and differing priorities for communities along a corridor (Figure D-14), and consensus building. However, working together with MPOs and partner agencies and sharing resources across agencies offer opportunities to promote the strategies through collaboration.
Figure D14 The New York City area presents multimodal transportation service providers with
myriad operational and investment challenges in an intensely urban setting.
AD-23S U C C E S S F U L I N T E R M O D A L C O R R I D O R
M A N A G E M E N T P R A C T I C E S F O R S U S TA I N A B L E
S Y S T E M P E R F O R M A N C E

The New York participants presented the I-495 managed-use lane (MUL) project as a case study for applied intermodal corridor management. A three-tiered process was used to screen regional corridors:
Tier 1 evaluated corridors according to use (vehicle volumes, congestion, speed, incidents/accident, and bus volumes)
Tier 2 evaluated MUL strategies applicable within the corridors selected in Tier 1
Tier 3 selected strategies and prioritized the corridors considering a benefit cost analysis
MUL strategies include HOT/HOV lanes, exclusive transitways, hard shoulder running, exclusive/dedicated truck lanes, active traffic management, and dynamic re-routing.
I-495 survived all three screening levels. A set of MUL improvements was developed, including a bus HOV lane extension that will connect to adjacent Select Bus Service (SBS) routes (New York City’s branding for bus rapid transit). Buses on SBS routes using Transit Signal Priority experienced 15 to 23% faster service, carried 10% more riders in their first year, experienced 95% customer satisfaction, provided increased comfort and convenience, and helped maintain traffic flow. This corridor is also an ICM pilot project grant recipient. The grant is for development of a concept of operations for the I-495 corridor from the Van Wyck Expressway in Queens through Manhattan to the New Jersey Turnpike.
The I-495 case study represents successful application of the elements of the ADTM:
Active Collaboration—multimodal coordination, real-time decision support, data integration, and cooperative planning and operations, leading to...
Actionable Information—with a focus on travel markets, multimodal information, and person throughput and...
Dynamic Management—that focuses on bottlenecks and chokepoints, with priority for transit vehicles and HOVs, which, when combined, support...
Application in Different Contexts—such as congested urban corridors, emergencies and special events, construction and work zones, seasonal congestion, weather events, freight movement, bottlenecks, and and crossings.
Continued implementation of the ADTM framework will require:
Strengthening effective operational collaboration for ATDM
Requiring operational integration between transportation management centers and operational and control systems
Expanding operational partnerships for systems management
Bringing new partners for systems management
Demonstrating the value of ATDM through deployment
Providing customized travel options and choices
Supporting effective goods and freight movement
Increasing HOV use
Using dynamic management
AD-24
A P P E N D I X D : W O R K S H O P P R E S E N TAT I O N S U M M A R I E S

Enhancing construction management
Managing weather events and other emergencies
Monitoring and evaluation of ATDM
Improve system monitoring and data for decision-making
Enhance ongoing program assessment
Institutional procedures and guidance to support ATDM
Review and adapt organizational and workforce protocols
Update planning and project development design guidelines
Continue to develop ATDM playbooks for application contexts
A sophisticated approach to data collection, sharing and reuse, and modeling at scales appropriate to needed decisions underpins these efforts (see Figure D15). Population density in New York City blurs the distinctions between networks, corridors, and local streets. In this context, efficiency means balancing the use of all available roadways. Data from probes (i.e., taxis, buses, and third parties), tag readers, traffic cameras, and the regional data repository, combined with static and dynamic simulation models that step down from macro/regional models to mesoscopic and microscopic (i.e., local) levels provide a decision-support basis for interagency collaboration. The slow process of building interagency collaboration can be advanced by finding champions as well as defining common interests and needs within each agency.
Figure D15 Operating the multimodal transportation system in New York City requires interagency collaboration to take advantage of many data sources needed to
support operations and sophisticated multilevel modeling.
AD-25S U C C E S S F U L I N T E R M O D A L C O R R I D O R
M A N A G E M E N T P R A C T I C E S F O R S U S TA I N A B L E
S Y S T E M P E R F O R M A N C E

North CarolinaNorth Carolina DOT
North Carolina is the nation’s 10th most populous state and has the 9th largest state gross domestic product, Both its growing population and economy over the next 25 years are expected to put further stress on its transportation system. North Carolina has a robust multimodal transportation system, which includes aviation; privately and publicly owned freight rail; the second largest state-run ferry system in the U.S.; and bicycle and pedestrian facilities, passenger rail, highways and tollways, ports, and public transportation. NCDOT oversees, and operates large parts of this system, including over 80,000 miles of state highways and local roadways.
North Carolina began state transportation planning in the 1950s and 3C (continuing, comprehensive, and cooperative) planning in the 1960s. Over time, state government has provided an increasingly structured framework for planning and developing the state’s transportation system and the corridors making up that system. In 2001, NCDOT began developing a multimodal comprehensive transportation plan (CTP) pursuant to state statute. The CTP was developed cooperatively between NCDOT and the MPOs established by federal law and state-created rural planning organizations.
In 2004 NCDOT embarked on developing a strategic highway corridors (SHC) network comprising a set of existing highways vital to moving people and goods within and just outside North Carolina. The SHCs are intended to provide safe, efficient, reliable, high-speed, and high-capacity highway travel throughout the state.
The 2012 update to the CTP emphasized data-driven planning and a cultural push for transparency (see Figure D16). The Board of Transportation, which oversees NCDOT, wanted to re-examine the SHC to consider multimodal opportunities, create a quantitative process for identifying SHCs, and focus on high-priority corridors.
Figure D16 When beginning to update its comprehensive transportation plan in 2012, North Carolina critically examined its strategic highway corridors effort, initiated in
2004, to address lessons learned.
AD-26
A P P E N D I X D : W O R K S H O P P R E S E N TAT I O N S U M M A R I E S
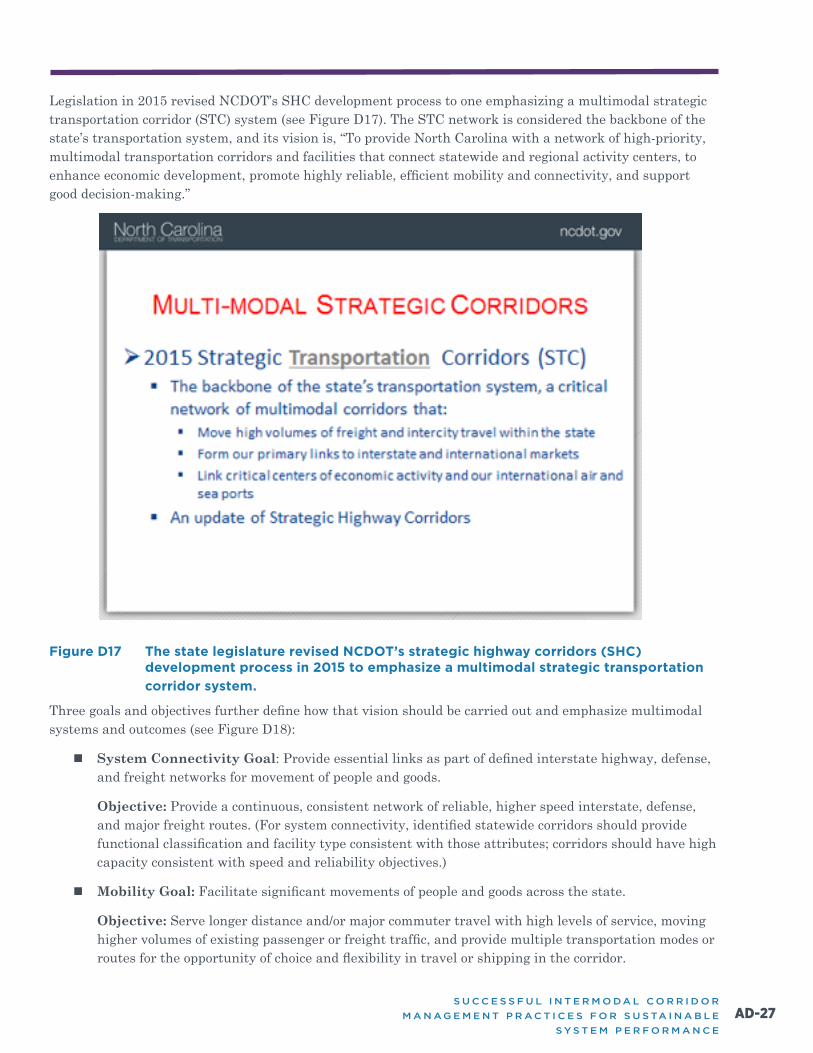
Legislation in 2015 revised NCDOT’s SHC development process to one emphasizing a multimodal strategic transportation corridor (STC) system (see Figure D17). The STC network is considered the backbone of the state’s transportation system, and its vision is, “To provide North Carolina with a network of high-priority, multimodal transportation corridors and facilities that connect statewide and regional activity centers, to enhance economic development, promote highly reliable, efficient mobility and connectivity, and support good decision-making.”
Figure D17 The state legislature revised NCDOT’s strategic highway corridors (SHC) development process in 2015 to emphasize a multimodal strategic transportation
corridor system.
Three goals and objectives further define how that vision should be carried out and emphasize multimodal systems and outcomes (see Figure D18):
System Connectivity Goal: Provide essential links as part of defined interstate highway, defense, and freight networks for movement of people and goods.
Objective: Provide a continuous, consistent network of reliable, higher speed interstate, defense, and major freight routes. (For system connectivity, identified statewide corridors should provide functional classification and facility type consistent with those attributes; corridors should have high capacity consistent with speed and reliability objectives.)
Mobility Goal: Facilitate significant movements of people and goods across the state.
Objective: Serve longer distance and/or major commuter travel with high levels of service, moving higher volumes of existing passenger or freight traffic, and provide multiple transportation modes or routes for the opportunity of choice and flexibility in travel or shipping in the corridor.
AD-27S U C C E S S F U L I N T E R M O D A L C O R R I D O R
M A N A G E M E N T P R A C T I C E S F O R S U S TA I N A B L E
S Y S T E M P E R F O R M A N C E
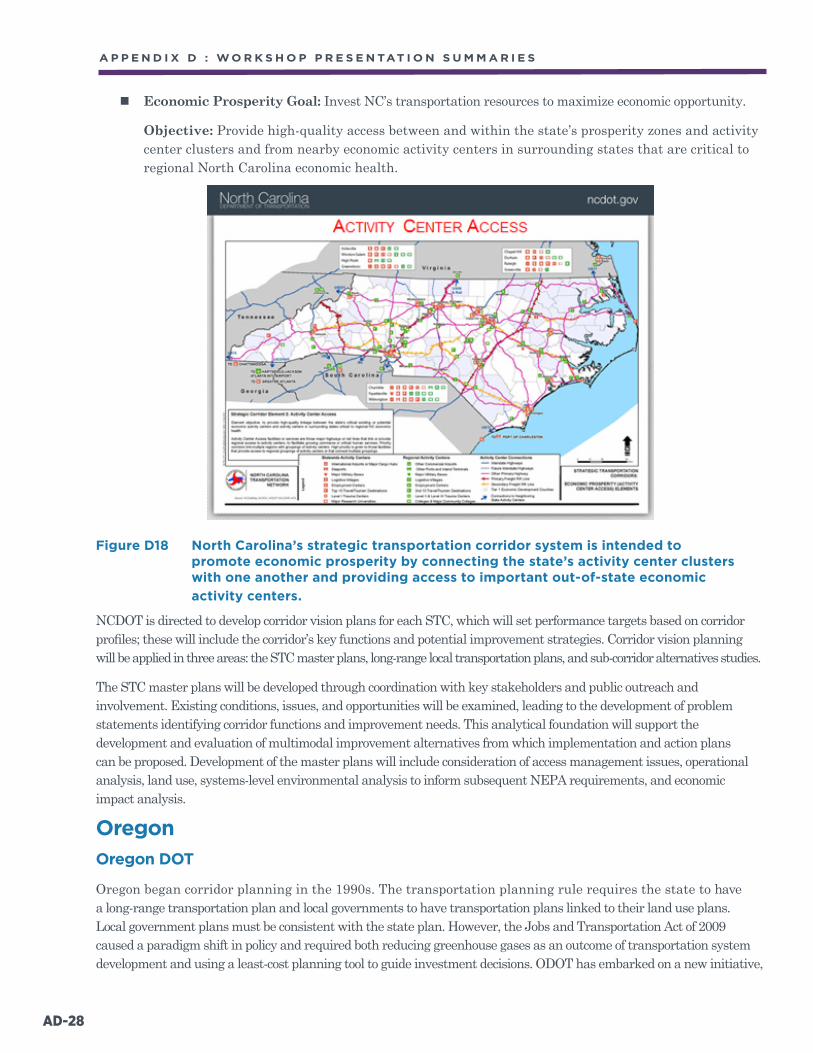
Economic Prosperity Goal: Invest NC’s transportation resources to maximize economic opportunity.
Objective: Provide high-quality access between and within the state’s prosperity zones and activity center clusters and from nearby economic activity centers in surrounding states that are critical to regional North Carolina economic health.
Figure D18 North Carolina’s strategic transportation corridor system is intended to promote economic prosperity by connecting the state’s activity center clusters with one another and providing access to important out-of-state economic
activity centers.
NCDOT is directed to develop corridor vision plans for each STC, which will set performance targets based on corridor profiles; these will include the corridor’s key functions and potential improvement strategies. Corridor vision planning will be applied in three areas: the STC master plans, long-range local transportation plans, and sub-corridor alternatives studies.
The STC master plans will be developed through coordination with key stakeholders and public outreach and involvement. Existing conditions, issues, and opportunities will be examined, leading to the development of problem statements identifying corridor functions and improvement needs. This analytical foundation will support the development and evaluation of multimodal improvement alternatives from which implementation and action plans can be proposed. Development of the master plans will include consideration of access management issues, operational analysis, land use, systems-level environmental analysis to inform subsequent NEPA requirements, and economic impact analysis.
OregonOregon DOT
Oregon began corridor planning in the 1990s. The transportation planning rule requires the state to have a long-range transportation plan and local governments to have transportation plans linked to their land use plans. Local government plans must be consistent with the state plan. However, the Jobs and Transportation Act of 2009 caused a paradigm shift in policy and required both reducing greenhouse gases as an outcome of transportation system development and using a least-cost planning tool to guide investment decisions. ODOT has embarked on a new initiative,
AD-28
A P P E N D I X D : W O R K S H O P P R E S E N TAT I O N S U M M A R I E S

Intermodal Oregon39, and is working to break down organizational and funding silos separating modal activities. The intent is to find the right solution to a transportation problem regardless of financial issues.
To address greenhouse gas related to transportation, ODOT developed the GreenSTEP40 emissions model, which allows testing the effects of different policies related to transportation and land use.
ODOT developed Mosaic41 as a least-cost planning tool that allows comparisons of different transportation projects and bundles of projects to find the most cost-effective solutions, making progress toward a variety of mobility and social goals (see Figure D19). Mosaic has a number of indicator categories for which costs and benefits are monetized or measured with other metrics:
Accessibility/connectivity
Economic vitality
Environmental stewardship
Equity
System funding/finance
Land use and growth management
Mobility
Quality of life and livability
Safety and security
Figure D19 When Oregon’s Jobs and Transportation Act of 2009 required the use of a
least-cost planning tool, ODOT responded by developing Mosaic.
AD-29S U C C E S S F U L I N T E R M O D A L C O R R I D O R
M A N A G E M E N T P R A C T I C E S F O R S U S TA I N A B L E
S Y S T E M P E R F O R M A N C E
39 Kim D, Intermodal ODOT: What does it mean to front-line employees in the Region Tech Centers & Technical Services?, 2015 ODOT Transportation Engineering Conference, Oregon Department of Transportation, April 29, 2014, https://www.oregon.gov/ODOT/HWY/TRAFFIC-ROADWAY/docs/pdf/2015_conference/2015_Kim.pdf
40 Greenhouse Gas Strategic Transportation Energy Planning (GreenSTEP), Transportation Development – Planning, Oregon Department of Transportation, https://www.oregon.gov/ODOT/TD/TP/pages/greenstep.aspx
41 Mosaic: Value and Cost Informed Planning, Oregon Department of Transportation, http://www.oregonmosaic.org/

Mosaic is Oregon’s approach to incorporating both quantifiable benefit/cost analysis and MODA into its transportation planning and decision processes at local, regional, and statewide levels (see Figure D20).
Figure D20 How the Oregon Mosaic least-cost planning tool improves transportation
investment decisions
Mosaic was developed in collaboration with a diverse group of stakeholders. It is intended to be a web-based value- and cost-informed planning tool that can be applied to both supply-side (e.g., new bicycle paths) and demand-side (e.g., bicycle education programs) projects and programs. Mosaic allows transportation outcomes that can be monetized to be compared to outcomes measured in other ways. It allows for disparate types of information to be used together to better understand the implications of transportation decisions across multiple societal goals. Mosaic is not, however, a decision-making tool, nor is it precise.
Mosaic is ideally supported by a travel-forecasting model and GIS data covering social and demographic characteristics, land use, transportation networks, and environmental and cultural resources. It can be applied to “bundles of projects,” including comparisons of different bundles with modal themes such as transit-oriented, ITS, or highway capacity (see Figure D21). Mosaic provides benefits and costs in dollars where possible, nonmonetary qualitative or quantitative impacts where appropriate; it also provides ranges of values to address uncertainties and a documented analysis process.
AD-30
A P P E N D I X D : W O R K S H O P P R E S E N TAT I O N S U M M A R I E S

Figure D21 Mosiac allows the analysis of a project bundle’s benefits in nine categories, each
with its own quantitative and qualitative indicators.
The Mosaic downloadable spreadsheet tool and guidance documents, including a workbook, are available online.42
Oregon tested Mosaic in a portion of the Portland Metro region using hypothetical bundles of roadway, transit, and active transportation-themed investments so the results would reflect directly on current adopted projects and programs (see Figure D22). The analysis yielded results that might be reasonable expected from the project bundles. Although it is complex, Mosaic can be productively applied in areas having travel modeling and GIS support in place to help users understand the implications of their decisions. It is flexible in terms of scalability to available data and the mixture of investment bundles types. Mosaic provides the basis for, and requires, robust discussion between stakeholders about values and assumptions. It is not a “black box” that automatically provides the answer; instead, it is used to help inform decision makers. Oregon plans to use the Mosaic tool as part of the regional transportation plan development process for a new, emerging MPO in 2016/2017.
AD-31S U C C E S S F U L I N T E R M O D A L C O R R I D O R
M A N A G E M E N T P R A C T I C E S F O R S U S TA I N A B L E
S Y S T E M P E R F O R M A N C E
42 Mosaic Evaluation Report, CH2MHILL, Oregon Department of Transportation, October 2014, http://www.oregon.gov/ODOT/TD/TP/LCP/Mosaic_EvaluationReport.pdf
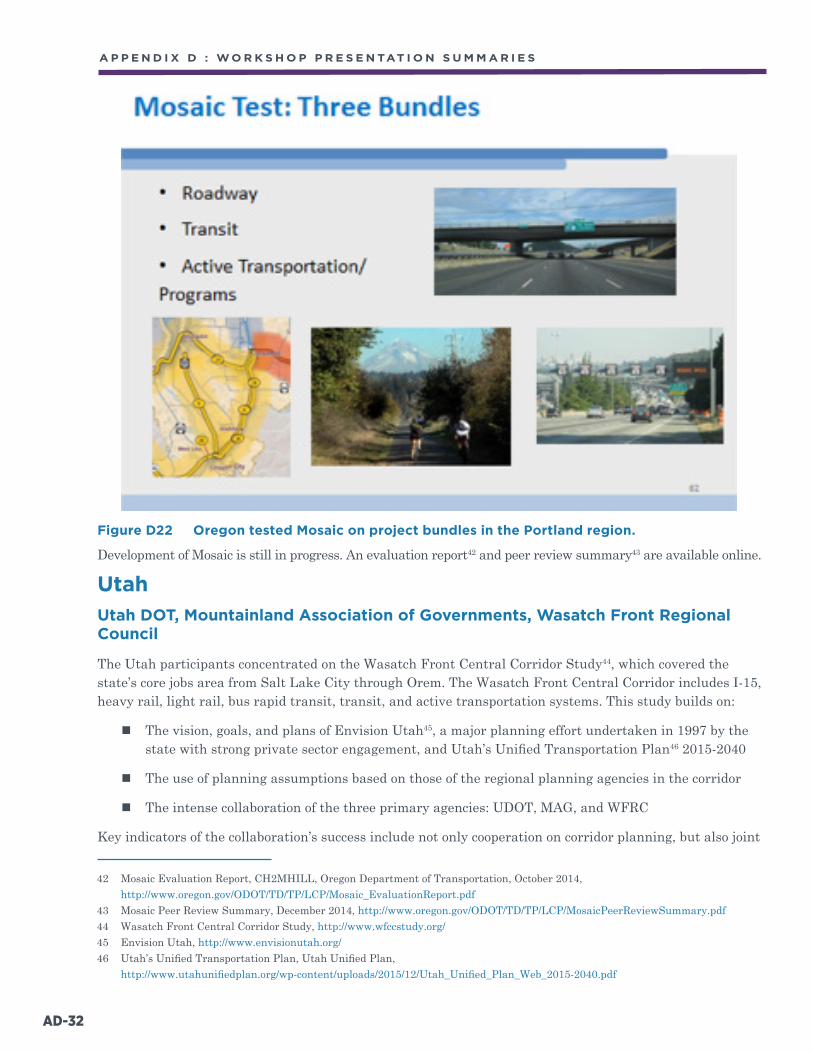
Figure D22 Oregon tested Mosaic on project bundles in the Portland region.
Development of Mosaic is still in progress. An evaluation report42 and peer review summary43 are available online.
UtahUtah DOT, Mountainland Association of Governments, Wasatch Front Regional Council
The Utah participants concentrated on the Wasatch Front Central Corridor Study44, which covered the state’s core jobs area from Salt Lake City through Orem. The Wasatch Front Central Corridor includes I-15, heavy rail, light rail, bus rapid transit, transit, and active transportation systems. This study builds on:
The vision, goals, and plans of Envision Utah45, a major planning effort undertaken in 1997 by the state with strong private sector engagement, and Utah’s Unified Transportation Plan46 2015-2040
The use of planning assumptions based on those of the regional planning agencies in the corridor
The intense collaboration of the three primary agencies: UDOT, MAG, and WFRC
Key indicators of the collaboration’s success include not only cooperation on corridor planning, but also joint
AD-32
A P P E N D I X D : W O R K S H O P P R E S E N TAT I O N S U M M A R I E S
42 Mosaic Evaluation Report, CH2MHILL, Oregon Department of Transportation, October 2014, http://www.oregon.gov/ODOT/TD/TP/LCP/Mosaic_EvaluationReport.pdf
43 Mosaic Peer Review Summary, December 2014, http://www.oregon.gov/ODOT/TD/TP/LCP/MosaicPeerReviewSummary.pdf44 Wasatch Front Central Corridor Study, http://www.wfccstudy.org/45 Envision Utah, http://www.envisionutah.org/46 Utah’s Unified Transportation Plan, Utah Unified Plan,
http://www.utahunifiedplan.org/wp-content/uploads/2015/12/Utah_Unified_Plan_Web_2015-2040.pdf
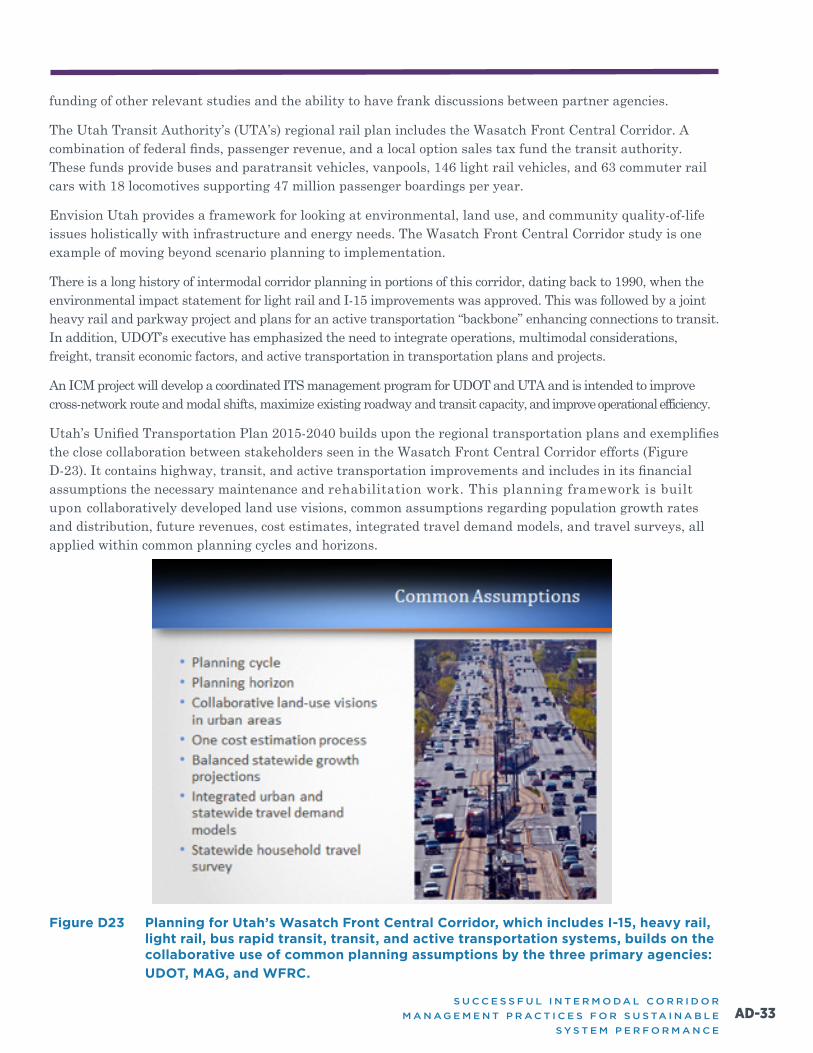
funding of other relevant studies and the ability to have frank discussions between partner agencies.
The Utah Transit Authority’s (UTA’s) regional rail plan includes the Wasatch Front Central Corridor. A combination of federal finds, passenger revenue, and a local option sales tax fund the transit authority. These funds provide buses and paratransit vehicles, vanpools, 146 light rail vehicles, and 63 commuter rail cars with 18 locomotives supporting 47 million passenger boardings per year.
Envision Utah provides a framework for looking at environmental, land use, and community quality-of-life issues holistically with infrastructure and energy needs. The Wasatch Front Central Corridor study is one example of moving beyond scenario planning to implementation.
There is a long history of intermodal corridor planning in portions of this corridor, dating back to 1990, when the environmental impact statement for light rail and I-15 improvements was approved. This was followed by a joint heavy rail and parkway project and plans for an active transportation “backbone” enhancing connections to transit. In addition, UDOT’s executive has emphasized the need to integrate operations, multimodal considerations, freight, transit economic factors, and active transportation in transportation plans and projects.
An ICM project will develop a coordinated ITS management program for UDOT and UTA and is intended to improve cross-network route and modal shifts, maximize existing roadway and transit capacity, and improve operational efficiency.
Utah’s Unified Transportation Plan 2015-2040 builds upon the regional transportation plans and exemplifies the close collaboration between stakeholders seen in the Wasatch Front Central Corridor efforts (Figure D-23). It contains highway, transit, and active transportation improvements and includes in its financial assumptions the necessary maintenance and rehabilitation work. This planning framework is built upon collaboratively developed land use visions, common assumptions regarding population growth rates and distribution, future revenues, cost estimates, integrated travel demand models, and travel surveys, all applied within common planning cycles and horizons.
Figure D23 Planning for Utah’s Wasatch Front Central Corridor, which includes I-15, heavy rail, light rail, bus rapid transit, transit, and active transportation systems, builds on the collaborative use of common planning assumptions by the three primary agencies:
UDOT, MAG, and WFRC.
AD-33S U C C E S S F U L I N T E R M O D A L C O R R I D O R
M A N A G E M E N T P R A C T I C E S F O R S U S TA I N A B L E
S Y S T E M P E R F O R M A N C E

Despite the extraordinarily high level of collaboration and joint planning support exhibited by the Utah participants, they recognize the ongoing challenges of breaking down planning, decision, and funding silos involving transportation, land use and urban design, local and regional coordination, tax policies, and pricing (see Figure D24). They also acknowledge the ongoing need to develop statewide system performance goals and address how to measure the value of the trip not taken, the shorter trip, and the benefits of infill land development; in other words, the value of the outcomes of a number of publically supported policies. UDOT’s director has been instrumental in challenging his agency’s culture by encouraging staff to think outside traditional DOT planning, design, and funding silos and through leading by example.
Figure D24 The Wasatch Front Central Corridor partners recognize that long-term success will depend on continuously breaking down traditional funding and policy silos
that prevent the development of effective multimodal transportation systems.
VirginiaVirginia DOT, Hampton Roads Transportation Planning Organization
VDOT is responsible for building, operating, and maintaining the third largest public road and highway system in the U.S. Virginia’s state legislature has created a planning framework within which the state’s multimodal long-range transportation plan, VTrans204047, must operate. This plan, which VDOT must update every five years, addresses the transportation system’s state of good repair; safety; and the capacity/operations of intercity corridors, the intra and interregional network, and urban development areas.
In 2014, House Bill 248 (HB2) directed the Commonwealth Transportation Board to develop and use a project scoring and selection system by 2016 to make sure that limited funds are invested in the most critical needs. House Bill 188749 established the Construction District Grant Program, which is open only to localities, and the High Priority Projects program, for which only needs identified in the VTrans2040 Multimodal Plan are eligible
AD-34
A P P E N D I X D : W O R K S H O P P R E S E N TAT I O N S U M M A R I E S
47 VTrans2040, Office of Intermodal Planning and Investment, [Virginia] Commonwealth’s Office of Intermodal Planning and Investment, http://www.vtrans.org/vtrans2040.asp
48 HB 2 [Virginia] Commonwealth Transportation Board; statewide prioritization process for project selection, http://leg1.state.va.us/cgi-bin/legp504.exe?141+sum+HB2
49 HB 1887 [Virginia] Commonwealth Transportation Board; membership, funding, updates annual reporting and allocations, https://leg1.state.va.us/cgi-bin/legp504.exe?ses=151&typ=bil&val=hb1887

for the HB2 statewide prioritization process. In 2012 and 2014, under two different governors, Virginia also dedicated funds for deploying innovative transportation technologies intended to reduce congestion, improve mobility and safety, provide travel data, and improve emergency response.
In 2009, Virginia passed legislation creating Corridors of Statewide Significance50 (CoSS) designated by the Commonwealth Transportation Board. VDOT presented the I-95 CoSS in Northern Virginia as a case study (see Figure D25). The goals for this corridor include reducing dependency on single-occupant vehicles, reducing congestion for all travel, and reducing economic costs associated with travel delays.
Figure D25 The I-95 corridor in northern Virginia is representative of the goals set by the Commonwealth Transportation Board in designating Corridors of
Statewide Significance as required by 2009 state legislation.
VDOT is developing improvement strategies for achieving these goals that include investments in technology (i.e., ICM [see Figure D26]); improving the capacity of highways, transit, and passenger and freight rail; and transportation demand management. An I-95 ICM plan was prepared in 2012 through a collaborative effort by state, regional, and local agencies; however, as of 2015, no ICM grant funds have been awarded to this program. The goals of this plan are to “use all seats” (bus, train, and vehicles), all lanes, all parking spaces, and all modes, and to use technology to inform multimodal and intermodal choices.
AD-35S U C C E S S F U L I N T E R M O D A L C O R R I D O R
M A N A G E M E N T P R A C T I C E S F O R S U S TA I N A B L E
S Y S T E M P E R F O R M A N C E
\50 Corridors of Statewide Significance: Introduction, Virginia’s Long-Range Multimodal Transportation Plan, Office of Intermodal Planning and Investment, Commonwealth Transportation Board, March 2010, http://www.vtrans.org/resources/introduction_chapter.pdf

Figure D26 Virginia’s approach to corridor development management is based on a set of
practical and pragmatic principles.
At present ICM is being incrementally deployed through the regional traffic management plans (TMPs) for megaprojects and through the use of innovative transportation technology funds. The megaproject TMPs offer the opportunity of testing the effectiveness of various strategies, including incident management; augmenting existing transit, ridesharing, telework, and flexible work-hour programs; co-managing traffic on I-95 and the adjacent arterial network; and public outreach and marketing. The TMPs have provided the means to implement lower cost and quick deployment ICM measures, such as providing the public with comparable travel time signs (leveraging INRIX data); 511 multimodal enhancements, including a multimodal trip planner; and outreach and marketing campaigns to increase 511 use.
The ITT funds have provided for a parking management system pilot at a park-and-ride facility, ramp metering upgrades, and feasibility studies for expansion, closed circuit television camera placement on arterials for better incident management, and comprehensive review of adaptive signal control strategies.
The I-95 megaprojects have provided both a need and funding support for cooperative efforts leading to customer outreach and implementation of components of ICM and multimodal corridor management. While this approach has produced successes that can be built upon, the eventual lack of additional funds and what has been to date an ad hoc or piecemeal implementation of strategies will not produce the ultimate vision of integrated and multimodal corridor management “using all seats.” That will require formal, continuous stakeholder engagement; a performance-based decision support system; and adequate, dependable funding.
The Hampton Roads area of Virginia is challenged in that is has major port and military facilities that affect travel demand on I-64, particularly for trucks, and that can limit travel demand management options due to unique military base operating characteristics. Currently, about 80% of commute travel is via single-occupant vehicles. Two-thirds of freight moves by truck, about a third by rail, and a small percentage by barge. Hampton
AD-36
A P P E N D I X D : W O R K S H O P P R E S E N TAT I O N S U M M A R I E S
Roads faces challenges posed by topography and by the operational needs of the area’s military bases.
Believing that the best decisions are based on numbers and facts, HRTPO has conducted the Hampton Roads Military Transportation Needs Study: Highway Network Analysis51, and the Hampton Roads Military Transportation Study—Military Commuter Survey52 to further identify problems and potential solutions not adversely impacting military operations. HRTPO has also looked at the possible impacts of sea level rise/storm surge related to climate change on roads serving the military.
As a way of forecasting future transportation facility and service needs, HRTPO also conducted an independent study of what National Household Travel Survey53 data from 1983, 1995, and 2008/9 suggested about mode choices made by millennials. Like other midsized metropolitan areas like Hampton Roads, it’s difficult for bus and rail to have significant mode shares for personal transportation; however, rail can move a significant share of freight.
HRTPO presented corridor case studies examining the impacts of various improvements on throughput, safety, and travel times. As expected, the results were mixed, depending on the type of improvements, the corridors’ travel characteristics, and the corridors’ geography.
AD-37A D VA N C E S I N S A F E T Y P R O G R A M P R A C T I C E S I N
Z E R O - FATA L I T I E S S TAT E S
51 Hampton Roads Military Transportation Needs Study: Highway Network Analysis, Hampton Roads Transportation Planning Organization, September 2011, http://hrtpo.org/uploads/docs/Military%20Transportation%20Needs%20-%20Highway%20Network%20Analysis%20Final%20Report.pdf
52 Hampton Roads Military Transportation Needs Study: Military Commuter Survey, Hampton Roads Transportation Planning Organization, September 2012, http://hrtpo.org/Documents/Reports/Military%20Commuter%20Survey%202012%20FINAL%20Report.pdf
53 National Household Travel Survey, Federal Highway Administration, U.S. Department of Transportation, http://nhts.ornl.gov/

APPENDIX E : HOST AGENCY CONTACTS

Appendix E:Host Agency Contacts
AE-1S U C C E S S F U L I N T E R M O D A L C O R R I D O R
M A N A G E M E N T P R A C T I C E S F O R S U S TA I N A B L E
S Y S T E M P E R F O R M A N C E

ArizonaReza Karimvand PEAssistant State EngineerTransportation Technology ManagerArizona Department of Transportation2302 W. Durango StreetPhoenix, AZ 85009Phone: (602) 712-7640E-mail: [email protected]
Nicolaas SwartTraffic Management Division ManagerMaricopa County Department of Transportation2901 W. Durango StreetPhoenix, AZ 85009Phone: (602) 506-0599E-mail: [email protected]
Steve RamseyInterim ITS ManagerCity of Scottsdale3939 N. Drinkwater BoulevardScottsdale, AZ 85251Phone: (480) 294-9469E-mail: [email protected]
CaliforniaAnn MahaneyChief, Smart Mobility BranchCalifornia Department of Transportation1120 N. Street, MS-32Sacramento, CA 95814Phone: (916) 653-4097E-mail: [email protected]
S. Sean NozzariDeputy District DirectorDistrict 4 – Traffic OperationsCalifornia Department of Transportation111 Grand AvenueOakland, CA 94612-3717Phone: (510) 286-6345E-mail: [email protected]
Ali F. Zaghari, PE, PMPDeputy District DirectorDivision of Traffic OperationsDistrict 7California Department of Transportation100 S. Main StreetLos Angeles, CA 90012Phone: (213) 897-0362E-mail: [email protected]
AE-2
APPENDIX E : HOST AGENCY CONTACTS
Gary SlaterDeputy District Director for PlanningDistrict 7California Department of Transportation100 S. Main StreetLos Angeles, CA 90012E-mail: [email protected]
Cory BinnsChief Deputy District DirectorCaltrans, District 114050 Taylor StreetSan Diego, CA 92110Phone: (619) 688-6709E-mail: [email protected]
Bill FiggeDeputy District Director, PlanningCaltrans, District 114050 Taylor StreetSan Diego, CA 92110Phone: (619) 688-6681E-mail: [email protected]
Gary VetteseDistrict Division ChiefTraffic Management CenterCaltrans, District 117183 Opportunity RoadSan Diego, CA 92111Phone: (858) 467-4323E-mail: [email protected]
Marcelo PeinadoDistrict Division Chief, Traffic OperationsCaltrans, District 114050 Taylor StreetSan Diego, CA 92110Office: (619) 688-3142E-mail: [email protected]
Lima SaftTMC Operations EngineerTraffic Management CenterCaltrans, District 117183 Opportunity RoadSan Diego, CA 92111Phone: (858) 467-3203E-mail: [email protected]
Joshua ReeseSignal Operations EngineerTraffic Management CenterCaltrans, District 117183 Opportunity Road
AE-3S U C C E S S F U L I N T E R M O D A L C O R R I D O R
M A N A G E M E N T P R A C T I C E S F O R S U S TA I N A B L E
S Y S T E M P E R F O R M A N C E

San Diego, CA 92111Phone: (858) 467-3034E-mail: [email protected]
Chris SchmidtMulti-Modal Programs Branch ChiefPlanningCaltrans, District 114050 Taylor StreetSan Diego, CA 92110Phone: (619) 220-7360E-mail: [email protected]
Ray TraynorDepartment DirectorOperationsSANDAG401 B Street, Suite 800San Diego, CA 92101Phone: (619) 699-6987 (619) 710-4001E-mail: [email protected]
James Dreisbach-TowlePrincipal Technology Program ManagerIntelligent Transportation SystemsSANDAG401 B Street, Suite 800San Diego, CA 92101Phone: (619) 699-1914E-mail: [email protected]
Ellison AlegreProject Manager, Transportation PlanningSANDAG401 B Street, Suite 800San Diego, CA 92101Phone: (619) 699-0729E-mail: [email protected]
FloridaMaria A. Cahill, AICPFlorida Department of TransportationOffice of Policy Planning605 Suwannee Street, MS 28Tallahassee, FL 32399Phone: (850) 414-4820E-mail: [email protected]
James StansburyCommunity PlanningFlorida Department of Economic Opportunity107 East Madison StreetCaldwell BuildingTallahassee, FL 32399-4120
AE-4
APPENDIX E : HOST AGENCY CONTACTS
Phone: (850) 717-8512E-mail: [email protected]
Bob KammExecutive DirectorSpace Coast Transportation Planning Organization2725 Judge Fran Jamieson WayBldg. B; Room 105; MS #82Melbourne, FL 32940Phone: (321) 690-6890E-mail: [email protected]
MarylandTara Penders, AICP
Regional Planner - Baltimore RegionRegional & Intermodel Planning DivisionOffice of Planning & Preliminary EngineeringMaryland State Highway Administration707 North Calvert StreetBaltimore, MD 21202-3601Phone: (410) 545-8941E-mail: [email protected]
Subrat MahapatraMaryland State Highway AdministrationOffice of Planning & Preliminary EngineeringDSED707 North Calvert StreetBaltimore, MD 21202-3601Phone: (410) 545-5649E-mail: [email protected]
MassachusettsTrey Joseph WadsworthManager of MPO ActivitiesOffice of Transportation PlanningMassachusetts Department of Transportation10 Park Plaza #4160Boston, MA 02116Phone: (857) 368-8837E-mail: [email protected]
New YorkUchenna MaduDirector, Planning & Project DevelopmentNew York State Department of Transportation New York City Regional Office(Region 11)One Hunters Point Plaza47-40 21st StreetLong Island City, NY 11101Phone: (718) 482-4526E-mail: [email protected]
AE-5S U C C E S S F U L I N T E R M O D A L C O R R I D O R
M A N A G E M E N T P R A C T I C E S F O R S U S TA I N A B L E
S Y S T E M P E R F O R M A N C E

Mike MarsicoAssistant Commissioner, Bureau of Parking / Modeling and Data
AnalysisNew York City Department of Transportation34-02 Queens Boulevard, Room 256Long Island City, NY 11101Phone: (212) 839-6672Fax: (212) 839-7777E-mail: [email protected]
North CarolinaTerry ArellanoSystems Planning Group SupervisorNorth Carolina Department of TransportationTransportation Planning Branch1554 Mail Service CenterRaleigh, NC 27699-1554Phone: (919) 707-0960E-mail: [email protected]
Kerry MorrowStatewide Plan EngineerNorth Carolina Department of TransportationTransportation Planning BranchPhone: (919) 707-0924E-mail: [email protected]
OregonErik Havig PEPlanning Section ManagerOregon Department of Transportation555 13th Street NE, Suite 2Salem, OR 97301Phone: (503) 986-4127E-mail: [email protected]
UtahJeff HarrisProgram Development Planning DirectorUtah Department of Transportation4501 South 2700 WestSalt Lake City, UT 84119Phone: (801) 965-4354E-mail: [email protected]
Shawn SeagerRegional Planning DirectorMountainland Association of Governments586 E 800 NOrem, UT 84097Phone: (801) 229-3800E-mail: [email protected]
Ted KnowltonDeputy Executive Director
AE-6
APPENDIX E : HOST AGENCY CONTACTS

Wasatch Front Regional Council295 North Jimmy Doolittle RoadSalt Lake City, UT 84116Phone: (801) 363-4230E-mail: [email protected]
VirginiaTzungwen (Amy) McElwainProject AdministratorNorthern Region Operations OfficeVirginia Department of Transportation4975 Alliance DriveFairfax, VA 22030Phone: (703) 259-1782E-mail: [email protected]
Robert B. Case, PE, PTOE, PhDPrincipal Transportation EngineerHampton Roads Transportation Planning OrganizationThe Regional Building, 723 Woodlake DriveChesapeake, VA 23320Phone: (757) 420-8300Fax: (757) 523-4881E-mail: [email protected]
AE-7S U C C E S S F U L I N T E R M O D A L C O R R I D O R
M A N A G E M E N T P R A C T I C E S F O R S U S TA I N A B L E
S Y S T E M P E R F O R M A N C E