NCDOT BENEFIT/COST ANALYSIS FOR PLANNING HIGHWAY PROJECTS · NCDOT BENEFIT/COST ANALYSIS FOR...
58
NCDOT BENEFIT/COST ANALYSIS FOR PLANNING HIGHWAY PROJECTS NCDOT Research Project 2005-20 Prepared by Daniel J. Findley, E.I., Graduate Student Dr. John R. Stone, Associate Professor Department of Civil, Construction & Environmental Engineering and Shannon J. Fain, P.E., Research Associate Robert S. Foyle, P.E., Associate Director The Institute for Transportation Research and Education North Carolina State University Raleigh, NC Prepared for North Carolina Department of Transportation Raleigh, NC July 2007
-
Upload
nguyenliem -
Category
Documents
-
view
217 -
download
2
Transcript of NCDOT BENEFIT/COST ANALYSIS FOR PLANNING HIGHWAY PROJECTS · NCDOT BENEFIT/COST ANALYSIS FOR...

NCDOT BENEFIT/COST ANALYSIS FOR
PLANNING HIGHWAY PROJECTS
NCDOT Research Project 2005-20
Prepared by
Daniel J. Findley, E.I., Graduate Student
Dr. John R. Stone, Associate Professor
Department of Civil, Construction & Environmental Engineeringand
Shannon J. Fain, P.E., Research Associate
Robert S. Foyle, P.E., Associate Director
The Institute for Transportation Research and Education
North Carolina State UniversityRaleigh, NC
Prepared for
North Carolina Department of Transportation
Raleigh, NC
July 2007
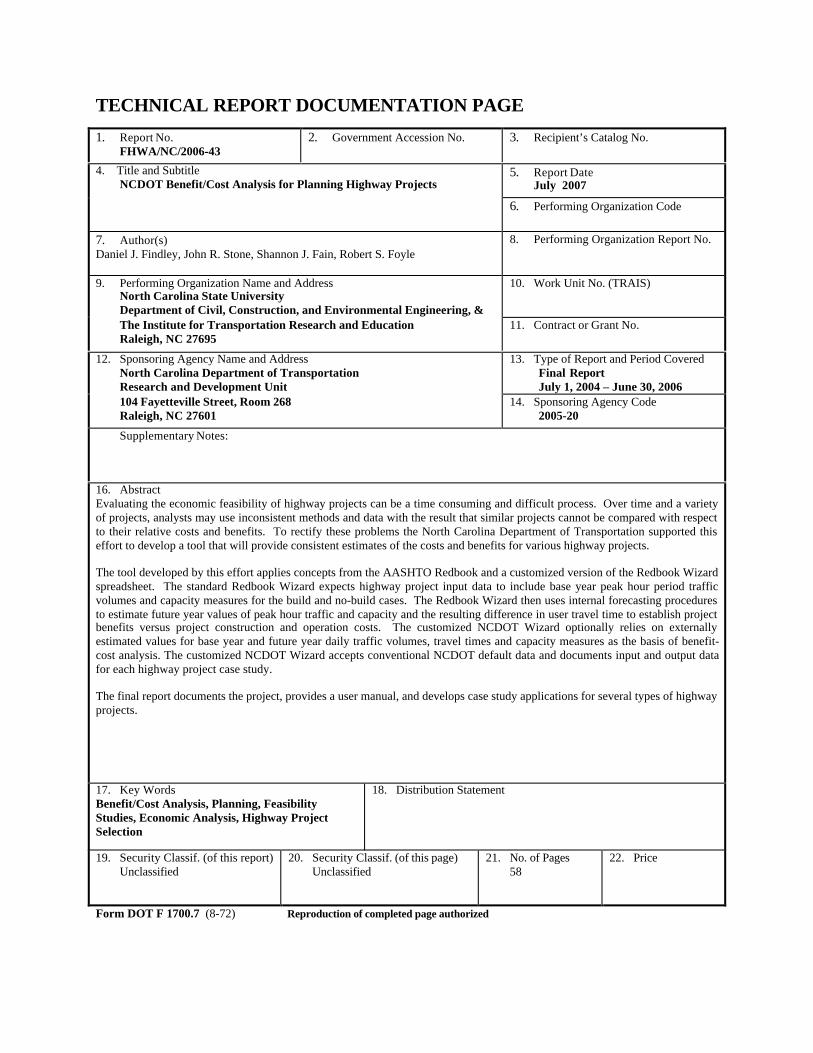
TECHNICAL REPORT DOCUMENTATION PAGE
1. Report No.FHWA/NC/2006-43
2. Government Accession No. 3. Recipient’s Catalog No.
4. Title and SubtitleNCDOT Benefit/Cost Analysis for Planning Highway Projects
5. Report DateJuly 2007
6. Performing Organization Code
7. Author(s)Daniel J. Findley, John R. Stone, Shannon J. Fain, Robert S. Foyle
8. Performing Organization Report No.
9. Performing Organization Name and AddressNorth Carolina State UniversityDepartment of Civil, Construction, and Environmental Engineering, &
10. Work Unit No. (TRAIS)
The Institute for Transportation Research and EducationRaleigh, NC 27695
11. Contract or Grant No.
12. Sponsoring Agency Name and AddressNorth Carolina Department of TransportationResearch and Development Unit
13. Type of Report and Period Covered Final ReportJuly 1, 2004 – June 30, 2006
104 Fayetteville Street, Room 268Raleigh, NC 27601
14. Sponsoring Agency Code2005-20
Supplementary Notes:
16. AbstractEvaluating the economic feasibility of highway projects can be a time consuming and difficult process. Over time and a varietyof projects, analysts may use inconsistent methods and data with the result that similar projects cannot be compared with respectto their relative costs and benefits. To rectify these problems the North Carolina Department of Transportation supported thiseffort to develop a tool that will provide consistent estimates of the costs and benefits for various highway projects.
The tool developed by this effort applies concepts from the AASHTO Redbook and a customized version of the Redbook Wizardspreadsheet. The standard Redbook Wizard expects highway project input data to include base year peak hour period trafficvolumes and capacity measures for the build and no-build cases. The Redbook Wizard then uses internal forecasting proceduresto estimate future year values of peak hour traffic and capacity and the resulting difference in user travel time to establish projectbenefits versus project construction and operation costs. The customized NCDOT Wizard optionally relies on externallyestimated values for base year and future year daily traffic volumes, travel times and capacity measures as the basis of benefit-cost analysis. The customized NCDOT Wizard accepts conventional NCDOT default data and documents input and output datafor each highway project case study.
The final report documents the project, provides a user manual, and develops case study applications for several types of highwayprojects.
17. Key WordsBenefit/Cost Analysis, Planning, FeasibilityStudies, Economic Analysis, Highway ProjectSelection
18. Distribution Statement
19. Security Classif. (of this report)Unclassified
20. Security Classif. (of this page)Unclassified
21. No. of Pages58
22. Price
Form DOT F 1700.7 (8-72) Reproduction of completed page authorized

ii
DISCLAIMER The contents of this report reflect the views of the author(s) and not necessarily the views of the North Carolina Department of Transportation. The authors are responsible for the facts and the accuracy of the data presented herein. The contents do not necessarily reflect the official views or policies of either the North Carolina Department of Transportation or the Federal Highway Administration at the time of publication. This report does not constitute a standard, specification, or regulation.
iii
ACKNOWLEDGEMENTS The research team thanks the North Carolina Department of Transportation for supporting this project. It is our hope that the benefit-cost tool developed in this project will become part of the decision-making process for NCDOT. We recognize the support and guidance of the Research Project Steering and Implementation Committee: Calvin W. Leggett (Chair), Debbie Barbour, Mike Bruff, Laura Cove, Randy Garris, Ed Johnson (CAMPO), Derrick Lewis, Roy Shelton, Mike Stanley, Joseph (Max) Tate (FHWA), Moy Biswas, and Richard Lakata. We also appreciate the efforts of graduate student Daniel J. Findley, who did an outstanding job throughout the project and was vital to its completion. He was especially valuable during the lengthy process of testing various software options. The research team was pleased to collaborate with ECONorthwest staff who developed the AASHTO Redbook Wizard and the customized version for NCDOT. Randall Pozdena led that effort, Carl Batten programmed the custom Wizard, and Ted Helvoigt applied the Wizard to various NCDOT highway projects. Without the help of all the above individuals, this project could not have been successfully accomplished.

iv
EXECUTIVE SUMMARY The evaluation of transportation projects for feasibility purposes can be a time consuming and difficult process. Over time and a variety of highway projects, the process can become very inconsistent as different engineers apply different datasets and methods. The North Carolina Department of Transportation needs a computational tool that can provide a consistent methodology for efficiently evaluating costs and benefits for various highway projects. For many years NCDOT engineers and planners used the in-house Benefits Matrix Model to perform project evaluations. The method is straight forward, fairly user friendly and has low data requirements. The Benefits Matrix Model evaluates user benefits and some costs; however, there are no planning, design, regulatory compliance, construction, operation or maintenance costs considered within the model. Without this cost information, the Benefits Matrix Model cannot accurately calculate the economic efficiency of a project. The benefit-cost analysis tool described in this report overcomes the deficiencies of the Benefits Matrix Model. It applies concepts from the AASHTO Redbook in the form of a customized version of the Redbook Wizard spreadsheet. The standard Redbook Wizard expects highway project input data to include base year peak hour period traffic volumes and capacity measures for the build and no-build cases. The Redbook Wizard then uses internal forecasting procedures to estimate future year values of peak hour traffic and capacity and the resulting difference in user travel time to establish project benefits versus project construction and operation costs. The customized NCDOT Wizard optionally relies on externally estimated values for base year and future year daily traffic volumes, travel times and capacity measures as the basis of benefit-cost analysis. The customized NCDOT Wizard accepts conventional NCDOT default data and documents input and output data for each highway project case study. This final report documents the project, provides a user manual, and develops case study applications for several types of highway projects. Currently, the Transportation Planning Branch uses statistical methods or travel demand model software to estimate base year and future year traffic volumes of proposed projects. If the project is relatively well-defined and somewhat isolated from network traffic divergence effects, the internal Wizard forecasting procedures could be used to estimate future year traffic. As a result, significant time savings could be achieved considering the hundreds of projects and feasibility studies that NCDOT accomplishes each year. Thus, research is recommended to test the potential time and money savings. The research would test the accuracy of the Wizard forecasts versus conventional forecasts and resulting time savings. The NCDOT could also benefit from future research in the area of establishing a baseline benefit/cost ratio for typical projects. The baseline could separate economically successful and unsuccessful projects. The research could focus on a review of completed projects for several improvement types developing a base-line benefit/cost ratio ‘standard’ for each type of project. The baselines by project type could be further categorized by North Carolina region – eastern, central, and western. The baseline benefit/cost ratio could assist NCDOT staff in distinguishing the beneficial projects and those that are not at an early stage in the planning process.

v
TABLE OF CONTENTS
DISCLAIMER ...................................................................................................................... ii
ACKNOWLEDGEMENTS ...................................................................................................... iii
EXECUTIVE SUMMARY ...................................................................................................... iv
INTRODUCTION .................................................................................................................. 1 BACKGROUND ............................................................................................................................ 1 PROBLEM STATEMENT .............................................................................................................. 1 SCOPE AND OBJECTIVES ........................................................................................................... 1 RESEARCH APPROACH .............................................................................................................. 2 REPORT OVERVIEW .................................................................................................................. 3
LITERATURE REVIEW ......................................................................................................... 4 CAL-B/C ..................................................................................................................................... 4 NET-BC ..................................................................................................................................... 6 SPASM ....................................................................................................................................... 7 BENEFITS MATRIX MODEL ....................................................................................................... 9 VIRGINIA DEPARTMENT OF TRANSPORTATION SCORING METHOD ................................... 10 REDBOOK USER BENEFIT ANALYSIS FOR HIGHWAYS .......................................................... 11 WSDOT MOBILITY PROJECT PRIORITIZATION PROCESS ................................................... 13
MODEL COMPARISON ....................................................................................................... 16 SUMMARY MODEL COMPARISONS ......................................................................................... 16 KINSTON CASE STUDY FOR BENCALC, CAL-B/C, AND THE REDBOOK WIZARD ................ 17 JUSTIFICATION FOR SELECTING THE REDBOOK WIZARD ................................................... 19
THE REDBOOK AND WIZARD ............................................................................................ 20 BACKGROUND .......................................................................................................................... 20 REDBOOK DATA REQUIREMENTS .......................................................................................... 24 DEFAULT DATA ........................................................................................................................ 26 REDBOOK WIZARD MODIFICATIONS FOR NCDOT .............................................................. 26 REDBOOK WIZARD SENSITIVITY ANALYSIS .......................................................................... 28 MODEL APPLICATIONS ........................................................................................................... 31 SUMMARY ................................................................................................................................ 32
FINDINGS AND CONCLUSIONS ........................................................................................... 33
RECOMMENDATIONS FOR IMPLEMENTATION .................................................................... 34

vi
RECOMMENDATIONS FOR FUTURE RESEARCH .................................................................. 35
PRODUCTS AND IMPLEMENTATION AND TECHNOLOGY TRANSFER PLAN ........................... 36 PRIMARY PRODUCTS ............................................................................................................... 36 SECONDARY PRODUCTS .......................................................................................................... 36 IMPLEMENTATION AND TECHNOLOGY TRANSFER PLAN ..................................................... 36
REFERENCES .................................................................................................................... 38
APPENDICES ................................................................................................................... A-1 A. KINSTON BENEFIT COST CASE STUDY: COMPARING METHODS ................................. A-1 B. NCDOT REDBOOK USER MANUAL (SEPARATE DOCUMENT) C. NCDOT REDBOOK WIZARD CASE STUDIES (SEPARATE DOCUMENT) 1.) FAYETTEVILLE BOONE TRAIL ROAD: TWO LANE TO FOUR OR FIVE LANE 2.) MORGAN’S CORNER (PASQUOTANK COUNTY): INTERCHANGE 3.) INTERSTATE 74 (BRUNSWICK COUNTY): FOUR LANE TO INTERSTATE
LIST OF TABLES
TABLE 1: WSDOT MOBILITY PROJECT PRIORITIZATION PROCESS ORGANIZATION ..................... 14
TABLE 2: MODEL COMPARISON ..................................................................................................... 16
TABLE 3A: KINSTON CASE STUDY RESULTS BASED ON BENCALC ANALYSIS ............................. 18 TABLE 3B: KINSTON CASE STUDY RESULTS BASED ON REDBOOK WIZARD ANALYSIS ............... 18 TABLE 3C: KINSTON CASE STUDY RESULTS BASED ON CAL-B/B ANALYSIS ............................... 18 TABLE 4: REDBOOK QUICKGUIDE TABLE TO THE BASIC STEPS OF USER BENEFIT ANALYSIS ..... 22
TABLE 5: REDBOOK INPUT DATA SUMMARY SHEET ..................................................................... 24
TABLE 6: REDBOOK INPUT SEGMENT DATA SUMMARY SHEET FOR ALTERNATIVE 1 .................. 25
TABLE 7: NCDOT REDBOOK WIZARD USER MANUAL DEFAULT VALUES ................................... 27
TABLE 8: REDBOOK WIZARD SENSITIVITY ANALYSIS .................................................................. 30
TABLE 9: REDBOOK WIZARD IMPROVEMENT TYPES ..................................................................... 31
LIST OF FIGURES
FIGURE 1: REDBOOK FLOWCHART ................................................................................................. 23
FIGURE 2: REDBOOK SENSITIVITY ANALYSIS - VOLUME .............................................................. 28
FIGURE 3: REDBOOK SENSITIVITY ANALYSIS – FREE FLOW SPEED .............................................. 29

1
INTRODUCTION
BACKGROUND
The North Carolina Department of Transportation (NCDOT) is responsible for a variety of highway projects throughout the state. Numerous transportation planning, design, construction, operation, maintenance, rehabilitation, and reconstruction projects are considered each year in each of the 14 highway divisions. Evaluating these projects in terms of feasibility, overall costs and benefits can be a time consuming and difficult process and determining whether to begin, continue, or terminate a project is an important and often difficult decision. To aid and support this decision-making process improved technical analysis at specific stages of project planning and project development is needed. The NCDOT currently uses the in-house Benefits Matrix Model to perform project evaluations. This model is simple, fairly user friendly and has low data requirements. User benefits and some costs are considered under a life-cycle costing framework; however, there are no planning, design, regulatory compliance, construction, operation or maintenance costs. Therefore, the NCDOT is in need of a new computational tool. This new tool should be capable of consistently evaluating significant user benefits and costs of current and potential projects and project amendments under a life-cycle framework. Additionally, the tool should be simple, user friendly, have reasonable data requirements and be able to effectively differentiate between efficient and inefficient projects and/or project elements. PROBLEM STATEMENT
The NCDOT desires to establish a consistent methodology to assist in project programming and development decisions. A new computational tool that is simple, user friendly and has low data requirements is needed. The goal of this project is to develop a new cost-benefit analysis tool that allows the NCDOT to readily identify efficient and inefficient projects. SCOPE AND OBJECTIVES
This research project assesses alternative methods to determine the costs and benefits of NCDOT highway projects. The best method is selected and customized for input data developed by NCDOT travel demand models or other procedures. The method does not estimate the costs and benefits of non-highway projects, and it does not estimate the costs and benefits of highway projects relative to environmental, community and economic development impacts. The specific objectives of the research are to: 1. Review and document cost-benefit methods. 2. Review and document pertinent NCHRP studies and associated software. 3. Obtain the 2003 AASHTO Redbook (NCHRP Project 2-23) and its Wizard methodology for
estimating highway user benefits and costs. 4. Determine types of projects, costs and benefits to be considered. 5. Demonstrate and evaluate pertinent software tools used by other DOTs.

2
6. Determine whether to develop a new model or customize existing software. 7. Collect baseline project data from the NCDOT to test alternative software tools. 8. Provide technical documentation on the theory behind the software. 9. Provide an executive summary of the software. 10. Develop a user manual. 11. Present two “train-the-trainer” modules to NCDOT personnel and obtain feedback. RESEARCH APPROACH
Scoping Meeting The project began with a meeting of NCDOT stakeholders, the purpose of which was to ensure agreement on project goals, methodology, and deliverables. An initial decision was reached on the desired components during this meeting with the NCDOT defining the key characteristics to be incorporated into the benefit-cost analysis tool (e.g. highway projects, traffic improvements, low data requirements, user friendly, etc.). The research team used this feedback to examine the various software options available and the inherent tradeoffs associated with each so that they could balance the Department’s primary objectives and priorities with the available budget and time available for the project. Literature Review The literature review presents the advantages and disadvantages of numerous benefit-cost methods. It drew from a NC State University masters project by NCDOT engineer Terry Arellano, P.E.. The literature review, interviews with peer DOTs, and comparative tests of top ranked models pointed toward the new AASHTO Redbook Wizard developed by NCHRP Project 2-23. The team subsequently collaborated with ECONorthwest, the AASHTO Redbook consultant, to develop the NCDOT custom Redbook Wizard. Comparison of Benefit-Cost Analysis Methods and Software Using project data for a proposed arterial in Kinston, NC, the project team developed a comparison of cost-benefit analyses for potential models. During this stage, the methodologies included three potential candidates – the NCDOT Benefits Matrix (Ben-Calc) spreadsheet, the Caltrans Cal-BC spreadsheet, and the AASHTO Redbook Wizard spreadsheet. The results of the tests lead the project team to recommend the Redbook Wizard as the model of choice for implementation by NCDOT. Selection of Methodology/Software The NCSU team presented the Redbook Wizard recommendation to the NCDOT Research Project Steering and Implementation Committee and discussed its advantages and disadvantages. The Committee agreed with the recommendation and the research continued with case study tests to identify any problems.

3
Case Study Tests with the Redbook Wizard Several typical NCDOT project feasibility studies were chosen to illustrate the application of the Redbook Wizard. The tests revealed that there was an incompatibility between the data requirements of the Wizard and the data available in the usual NCDOT feasibility study. Essentially, the Wizard requires only base year peak-hour volumes for the build and no-build highway alternatives. It forecasts future year peak-hour volumes using simplified growth factor methods. However, NCDOT engineers develop base year and future year daily traffic volumes using statistical techniques and complicated transportation demand modeling software. Modifications to Redbook Wizard To accommodate the usual NCDOT approach to estimating base year and future year volumes for highway alternatives, ECONorthwest made adjustments to the Wizard. The custom NCDOT Wizard can now accept either the usual NCDOT daily volume estimates for base year and future year conditions of proposed highway projects or base year conditions and anticipated traffic growth scenarios. The custom Wizard also documents input and output data for each benefit-cost analysis and permits adjustments to default parameters. Documentation After the software was finalized, the research team wrote a technical document, the NCDOT Redbook Wizard User Manual, which includes information and explanations on the software’s capabilities and operational functions. Future users can reference this material when guidance is needed while utilizing the Redbook Wizard. Training Sessions for NCDOT Staff The NCSU research team conducted a training session on the custom Wizard. Several highway projects illustrated the input, output and default parameter requirements for the Wizard. REPORT OVERVIEW
The remaining portions of this report address the results of the literature review, model comparisons, the selection of candidate models, case studies, Redbook Wizard recommendation and justification, Redbook Wizard tests, recommended modifications, and a sensitivity analysis of the Wizard data inputs. Conclusions and recommendations including ideas for future research complete the report. Appendices discuss the NCDOT Redbook Wizard User Manual, case studies, and feedback from NCDOT staff who previewed the final software product during training sessions.

4
LITERATURE REVIEW
The literature review examined benefit-cost methodologies and their related software. Options currently available and references for the software were catalogued. The methods selected for further investigation were Cal-B/C, NET-BC, the NCDOT Benefits Matrix Model, and the Redbook Wizard. Methods currently being used by other state Departments of Transportation received special attention with respect to their advantages and disadvantages and the type and amount of data required. A matrix summarized the different methods based upon ten criteria ranging from ease of use and input data required, to project types that are covered by each method. The following material is a discussion of several of the models currently being used for benefit-cost analysis. The discussion includes a summary of the approach, data requirements and entry methods, general format (look and feel of the program), how the results are produced and formatted as well as background information such as who developed the software and for whom it was developed. CAL-B/C Summary Cal-B/C was developed by the California Department of Transportation (Caltrans) for use within the department. Cal-B/C evaluates benefits based on user time savings, vehicle operating cost savings, and safety cost savings as well as external benefits such as air quality emission estimates (Arellano, 2002). Cal-B/C evaluates the following types of projects: Highway Capacity Expansion
Transit Capacity Expansion
Operational Improvements
Transportation Management Systems (TMS)
General Highway Passenger Rail Auxiliary Lane Ramp Metering
HOV Lane* Light-Rail (LRT) Freeway Connector Ramp Metering Signal Coordination
Passing Lane Bus HOV Connector Incident Management Interchange HOV Drop Ramp Traveler Information
Bypass Off-Ramp Widening
Arterial Signal Management
Pavement On-Ramp Widening
Transit Vehicle Location (AVL)
Transit Vehicle Signal Priority
Bus Rapid Transit (BRT) *Using the HOV Lane analysis, HOT projects can also be evaluated. The main format of Cal-B/C is a spreadsheet-based model where the user enters inputs on two separate worksheets (Project Information and Model Inputs). The Project Information worksheet includes the following inputs:

5
Type of project (e.g. HOV lane, passing lane, bypass) Project location Duration of peak periods Number of lanes (existing vs. new) Number of HOV lanes (existing vs. new) Free flow speed Length (in miles) Average Daily Traffic (with and without project) Anticipated travel demand (with and without project) Percent trucks Truck speed (if passing lane project) Average vehicle occupancy (peak vs. non-peak) Actual 3-year accident counts and rates for facility Statewide average for highway classification (existing vs. new) Transit data Project costs, including ROW costs, construction costs, maintenance and operations
costs, rehab costs, mitigation costs and other costs. Total costs are reported in constant dollars and present value. Note: user must enter these costs.
The Model Inputs worksheet lets the user override values calculated by the model on the Project Information worksheet and also includes a cell for the user to enter comments on why they chose to override the model values. After all of the project information is entered on the two input worksheets, analysis is carried out by the program and the output is given on the Results worksheet. Model Outputs include the following items:
Life cycle costs in millions of dollars Life cycle benefits in millions of dollars Net present value in millions of dollars Benefit/cost ration Rate of return on investment per year Project payback period in years
Additionally, the Results page asks the user if the proposed project will result in induced travel demand. If ‘yes’ is entered the model uses the “change in consumer surplus” economic technique to take the induced demand into account. Concerns Although Cal-B/C allows the user to manually enter average daily traffic volumes and future demand estimates, it does not allow direct incorporation of network data from travel demand models (Arellano 2002). Also, the user is required to provide data on the construction, operation, and maintenance costs associated with the proposed improvement, data that may not always be available at the time analysis is performed.

6
The default values used in Cal-B/C (e.g. hourly wages, fuel costs) are specific to California only; however, the program allows the defaults to be changed by the user prior to analysis. NET-BC Summary NET-BC was developed by Bernadin Lochmueller & Associates for use by the Indiana Department of Transportation in their benefit-cost calculations. NET-BC is the user benefit component of the Major Corridor Investment-Benefit Analysis System (MCIBAS), which is used for assessing the relative costs and benefits of proposed major highway corridor projects within Indiana (Kaliski 1998). Within NET-BC, analysis is based upon loaded traffic assignment networks which were previously developed in separate travel demand software programs such as TransCAD® and TRANPLAN®. As stated above, benefits are only calculated for highway improvements and they are based on vehicle operating costs, accident costs and average hourly income. Analysis in NET-BC is carried out in six steps, the first being the uploading of the loaded highway network for base and future year conditions for both “build” and “no-build” options from a travel demand software program. This linkage to a network and its many links allow NET-BC to assess network diversion, a major advantage compared to other methods that allow only project-level and corridor-level analysis. Once the network is in place, trip tables are applied which analyze the base and future year trips and travel time matrices to calculate travel time data based upon the actual predicted network values. After the trip tables have been applied the user can then move on to the third step in the process in which default parameters are displayed and, if desired, changed by the user. The parameters include a) traffic assignments for the base year, target year, and current year, b) the number of years in analysis period, c) the number of years that the project is predicted to be under construction, and d) a breakdown of auto trip purposes (work, commute, non-work) related to the project. Additionally, some parameters, such as total project cost and residual value, do not have defaults and must be manually entered by the user. The user can then, in the fourth step of the process, move on to entering unit costs, such as accident rates and vehicle unit cost factors. The fifth step uses price indices to obtain present monetary value for accidents, travel time, and vehicle operating costs. Finally, the last step is where the actual analysis is carried out and a summary report is produced that displays total user benefits by user type, B/C ratio and net present value. Concerns The primary concern of NET-BC is that the user cannot easily modify all of the default values. This is particularly troublesome for use by NCDOT in that NET-BC contains defaults based on data collected in Indiana. If NET-BC were used in North Carolina then the defaults would need to be changed within the program code itself.

7
Another concern of NET-BC is that the program must be configured to interact with the structure of the particular travel demand software used in conjunction with NET-BC. Once again, this would involve some programming requirements, but it is anticipated that this would be a minor issue. Finally, as a network analysis tool, NET-BC requires use of a planning model for all analyses. Because NCDOT controls an extensive rural highway system, models are not available for all highway projects. Thus, it is not feasible to construct a planning model for many kinds of highway improvement projects, e.g., a rural intersection improvement project. SPASM Summary Developed by the Federal Highway Administration (FHWA) for use nationwide, SPASM was designed for use at the ‘sketch’ planning level and allows results to be presented in several different ways including the benefits/costs to the users, annualized cost to the agency, total transportation costs, and net change in emissions due to the proposed project. As a result of its very broad approach to benefit-cost analysis, SPASM includes many factors that other more ‘narrow’ methods often do not, including the effect of transit ridership (both rail and bus), carpool use, transit-auto disincentives and induced travel. The basic methodology of SPASM is broken down into six components using six worksheets. The first worksheet, Unit Costs, allows the user to enter unit costs for each of the different modes as well as the following general parameters:
Weekdays per year HC, CO, and NOX cost per ton Grams per ton Average speed for auto, bus, and pedestrian access to transit (speed to actually get to
the transit location) Added delay for buses on arterials due to pick-ups and drop-offs Travel time exponent to distribute traffic among parallel highway facilities Iteration control factor – number of iterations in the traffic assignment process to
achieve convergence Value of travel time Energy unit and BTUS per energy unit Non-fuel user costs (oil, tires, depreciation, repairs) Public agency transit operating costs External costs Travel time elasticity Passenger car equivalents

8
The second worksheet, Impact Rates, enables the user to enter emission and energy consumption rates for autos, trucks, buses and rail based on travel speed. These values are used to calculate the dollar value equivalent cost of the emissions caused by the improvement. Users can enter data on associated public agency costs on the third worksheet, Agency Costs. SPASM uses these inputs to produce annualized costs for capital, operations and maintenance costs based on the lifetime of the improvement. Parameters include:
Discount rate – rate used to modify the benefits and costs of the future to make them comparable to those in the present.
Capital cost Midpoint of construction period Useful life – used to convert capital costs to annualized costs over the lifetime of the
improvement. Other operational and maintenance costs
The Facilities worksheet accommodates inputs to develop in-vehicle travel times. Users enter data for the base case as well as the improvement case. Inputs include length of facility (miles), capacity of facility (passenger car equivalents per hour) and free flow speed of facility (mph). The final data entry worksheet, Demand Inputs, allows users to input data on the peak and off-peak travel demands for the base case and improvement case by mode (auto, truck, carpool, local bus, express bus, and rail). Inputs include person trips per average weekday, average vehicle occupancy, out-of-pocket cost per person (includes all fares and tolls), wait time per trip (includes walkup time), access mode distances (distance in miles that pedestrians, auto users, and bus riders must travel to arrive at transit locations), as well as access mode fractions – percentage of travelers using each of the three modes to travel to transit locations (walking, autos, buses). The final SPASM worksheet presents the results of the analysis of the data provided in the five input worksheets. The Outputs sheet provides a summary of total annual user benefits, agency costs, external costs, net benefits, and a benefit/cost ratio. In addition, the Outputs page lists results by mode based on daily impacts such as:
Change in person trips User benefits ($) Revenue transfers – increase in public agency revenue resulting from increase in the
out-of-pocket cost per person. BTUs (millions) Emissions – dollar value equivalences of the emissions resulting from the
improvement(s). Other external costs Public vehicle operating costs

9
Concerns The central concern of SPASM is that the user is required to have a large amount of data on hand for the vast number of inputs required, including off-peak and peak period data for both the base case and improvement case. There is also a substantial amount of detailed information required for all mode types. For a project that is looking at a specific highway improvement, this data collection effort may prove to be very difficult and time consuming. NCDOT BENEFITS MATRIX MODEL (BENCALC) Summary The Benefits Matrix Model was developed by Dr. Marion R. Poole, P.E., former manager of the NCDOT Transportation Planning Branch (previously the Statewide Planning Branch). NCDOT has used the tool for 20 years for benefit-cost analysis of roadway improvement projects. The model uses three components to develop the benefit-cost comparison:
1) User benefits: total savings ($) based on annual vehicle cost savings, travel time cost savings and accident cost savings over a twenty-year period. Travel time costs are based on the average hourly income for the county in which the proposed improvement is based.
2) Economic development potential: the model does not produce this evaluation; rather, the user has to enter the information based on subjective knowledge.
3) Environmental impacts: the model does not produce this evaluation; rather, the user has to enter the information based on subjective knowledge.
The actual layout of the Benefits Matrix Model is fairly straightforward. There are only two worksheets, Inputs Data and Results. The Input Data page requires dual input data for both the ‘do-nothing’ option and the build option. The input data include items such as:
Hourly wage Vehicle occupancy rate Life of project (years) Length of project (miles) Base year user volumes Future year user volumes Average speed Facility type Base year volume to capacity ratio Future year volume to capacity ratio
The results of the calculations are listed in a manner that allows comparison between the ‘do-nothing’ option and the build option. Results displayed for comparison include calculated accident rates, calculated accident costs, vehicle speed, vehicle hours traveled, person time cost, vehicle miles traveled, and vehicle operating costs.

10
Concerns There are several concerns with the Benefits Matrix Model. One concern is that the user must enter data such as volumes, speed, and v/c ratio directly and cannot import this data from a travel demand model. This concern has already been addressed by the Transportation Planning Branch through the development of a separate program, Excelspd, which allows data transfer from a travel demand model and results in speed and v/c ratio as inputs for the highway segment being analyzed. Another concern of the Benefits Matrix Model is that many of the costs evaluated in the program are based on values requiring periodic update, such as vehicle operating costs, accident costs, average hourly income, etc. Currently, there is no ‘automated’ system to update these values; they must be updated manually in order to provide up-to-date results. Yet, such changes in model parameters are hard to document (the parameters are hidden spreadsheet pages), and the changes lead to inconsistent cost-benefit analyses from engineer to engineer and project to project. A final concern on the model is that it does not use project costs in its evaluation process. Therefore, results do not include a benefit/cost ratio. To overcome this, the Transportation Planning Branch currently uses an internal cost estimation worksheet that can be used along with the Benefits Matrix Model to arrive at a B/C ratio. VIRGINIA DEPARTMENT OF TRANSPORTATION SCORING METHOD Summary The Virginia Department of Transportation Scoring Method was developed by the Virginia Research Council of VDOT. It uses two general methods: a ‘traditional’ benefit-cost analysis and a prioritization process. The traditional benefit-cost analysis evaluates major corridor and feasibility studies. The traditional method usually includes costs for planning and engineering, right-of-way acquisition, construction, and general lifetime costs. The costs are compared to benefits from travel time savings and air quality. The prioritization process takes all costs and divides the total by the base year VMT. The resulting normalized value permits comparing projects against one another. The cost/VMT value is not the ultimate deciding factor, rather it ranks projects. The values are then reviewed by a team which uses the rankings (as well as non-technical considerations *see below*) to arrive at a final candidate project list to submit to the Virginia Commonwealth Transportation Board for final approval/selection. The Virginia Department of Transportation Scoring Method evaluates two classes of projects, Interstate System and Primary System Recommendations. Interstate System Recommendations

11
are prioritized on a statewide basis and the candidate improvement list is limited to five recommendations. Primary System Recommendations are prioritized by construction district and the candidate list is limited to five per district. Non-technical considerations include, but are not limited to the following:
Local and regional support Availability of funding/improvement cost Leveraging the funding sources – maximizing the use of federal/local/private funding
sources Project development considerations: timeframe and extent of federally required
locations studies Project phasing: starting the next phase of a multi-purpose roadway improvement Route continuity: the improvement maintains a logical transition with existing facilities
Concerns The model has a significant number of qualitative parameters and data entries. It is also geared towards fulfilling the VDOT Strategic Plan. Implementation of this type of project selection method for NCDOT would take one to two years of development and buy-in from upper managers and adoption by the North Carolina Board of Transportation. REDBOOK USER BENEFIT ANALYSIS FOR HIGHWAYS
Summary User Benefit Analysis for Highways, commonly known as the “Redbook,” was developed through the National Cooperative Highway Research Program (NCHRP) Project 02-23 by ECONorthwest, in association with Parsons Brinckerhoff, Inc. and Kittelson & Associates, Inc. The Redbook was approved by the American Association of State Highway and Transportation Officials (AASHTO) and consists of a manual and a CD-ROM. The Redbook was developed to assist in decision making for highway investment planners in the transportation field in various levels within government. The Redbook Wizard is a spreadsheet-based model that prompts the user for input one step at a time. The Redbook Wizard includes the following inputs:
Segment Data (e.g., Number, Names, Functional Classification, Improvement Types, Length)
Peak Hour, Peak Direction Volumes Free Flow Speed Peak Direction Capacity Number of Accidents by Type Number of Lanes Agency Operating Costs Change in Travel Time Due to Delay Analysis Period User Class Data

12
Vehicle Type and Occupancy Value of Time Fuel Cost Economic Data Commercial Load Values Cost of Accidents by Type Construction Management Alternatives Project Costs Delay and Accidents Due to Construction Base Case Data Improved Case Data Terminal Value Traffic Conversion Factors
After all of the project information is entered through the Redbook Wizard, the user is instructed how to use (and not to use) the results. The user then presses the finish button and is taken to the results page where the output is located. The following data is included in the output:
Value of Time Benefits Vehicle Operating Cost Benefits Accident Reduction Benefits Agency Operating Cost Benefits User Benefits from Construction Capital Costs Benefit-Cost Ratio
The Redbook and the Wizard represent the state-of-practice on economic models for highway improvement analyses. Because they have been adopted by AASHTO, there will be investment to maintain and update the models. For example, there is a current effort to include environmental costs into the analysis process. This maintenance and on-going efforts to enhance the model make it very attractive for all users. Concerns The Redbook Wizard is difficult to retrace through the series of windows to change a value. Updating a value in the program requires the user to click through a number of screens or use the awkward “jump” command. The parameters, which sometimes need to be updated with site current information, are inaccessible to users.

13
WSDOT MOBILITY PROJECT PRIORITIZATION PROCESS
Summary The WSDOT Mobility Project Prioritization Process is used by Washington State DOT to estimate the cost efficiency for projects. The cost-efficiency (in the form of a benefit/cost ratio) consists of 65% of the evaluation criteria for the WSDOT. The costs used in the calculations include right-of-way, engineering, construction, and operation and maintenance. The benefits of the project result from travel-time savings. The output of this model is used as input for TOPSIS, a program that is used to prioritize WSDOT highway mobility projects. The organization of the WSDOT Mobility Project Prioritization Process is shown in the following chart that includes the worksheets in the model and the inputs. The output calculated in the WSDOT Mobility Project Prioritization Process is located on the Estimate and B-C Ratio Worksheet. The output from this worksheet is used as input for TOPSIS which prioritizes highway mobility projects. The present value of benefits and costs are used to find the Net Present Value and the Benefit/Cost Ratio. The present value of benefits consists of:
Lane Addition Benefits High Occupancy Vehicle Lane Benefits Park & Ride Lots Benefits Four-Step Model Estimates Benefits Intersection Benefits Interchange Benefits Safety Benefits
The present value of costs includes:
Total Project Costs Cost by Non-WSDOT Residual Cost of Total Operation & Maintenance Costs

14
Table 1: WSDOT Mobility Project Prioritization Process Organization
Worksheet Description Required Inputs / Actions
Software Notes Provides software's purpose, structure, color coding scheme. Describes each of the worksheets.
None
Project Description Project description. Project description, including route, posted speed, title, beginning and ending mileposts, no build and build number of lanes, and terrain.
Global Variables Benefit-cost analysis assumptions and default values that are used throughout the workbook.
Discount rate (i), project life cycle (n), benefit days per year, select or define ADT 24-hour distribution curve, identify start and end of AM and PM peak periods, value of time and operating costs, population density (U or R).
24-Hour Volume Distribution Chart
Graphically displays the selected Year 1 directional and total volume distribution by hour of the day.
Select or define the ADT 24-hour distribution curve in the Global Variables worksheet. The selected curve will automatically be displayed in the 24 Hour Volume Distribution chart.
Estimate and B-C Ratio
Cost estimates for preliminary engineering, environmental retrofit, right-of-way, construction, operation & maintenance. Incorporates present value of user benefits for each particular improvement. Estimates the benefit / cost ratio.
Quantities needed for cost calculations, non-WSDOT cost share, and operation & maintenance costs, or total WSDOT present value costs (PVc).
4 Step Model Benefits
Estimates annual 24-hour user benefits based on output from an accepted 4-step model.
Model description, truck %, peak period AVOs, and 24-hour vehicle-hours traveled on state facilities.
Two Way Left Turn Lane (TWLTL) and Multilane Access Management Benefits
Estimates annual 24-hour user benefits for converting a 2-lane undivided facility to a 3-lane TWLTL facility (Harwood/St. John method), OR for median treatments and/or access spacing changes for 4-7 lane facilities (NCHRP 395 method).
Peak direction of selected ADT hourly distribution curve, median type, average access spacing, access control class, daily and peak hour traffic data, and truck %.
Worksheet Description Required Inputs / Actions
General Purpose Lane Benefits
Estimates annual 24-hour user benefits for adding a general purpose lane. Facilities that can be analyzed include: a 2-lane highway, an arterial, a rural/small urban freeway, or a multilane highway or freeway.
No build and build posted speeds, direction(s) of added lane, ADT and K factor or working peak hour volumes, truck %, grade and length of grade, volume growth rate, and roadway type.
Climbing Lane Benefits
Estimates the annual 24-hour user benefits for adding a truck climbing lane to a 2-lane highway or to an arterial.
No build and build posted speeds, direction(s) of added lane, ADT and K factor or working peak hour volumes, truck %, grade and length of grade, volume growth rate, and roadway type.
Intersection Benefits
Estimates the annual 24-hour user benefits for improving an existing intersection.
No build and build total approach volumes, number of lanes, average intersection delays, and intersection v/c ratios, existing approach volumes by hour for 24 hours, and build scenario % reduction by approach.

15
New Interchange Benefits
Estimates the annual 24-hour user benefits for adding a new interchange to an existing facility.
Year 1 and Year 20 working peak hour volumes, distances and speeds or travel times for no build and build origin-destination paths.
HOV Lane Benefits Estimates the directional annual 24-hour user benefits for adding an HOV lane.
Directional number of lanes with and w/o project, ADT or directional working peak hour volumes, HOV and GP growth rates, truck %s, and traffic composition.
Park & Ride Lot Benefits
Estimates the bi-directional annual 24-hour user benefits for constructing a park & ride lot.
Number of parking spaces, % of lot capacity used, various destination data, user distribution (transit riders/carpoolers), and AVOs.
Safety Benefits Estimates the annual 24-hour user benefits of improving the safety of a facility.
Selection of safety improvements, identification of the number of accidents by type of accident.
SYNCHRO Worksheet placeholder for icon link to SYNCHRO. None
WSDOT Default Curves
Contains WSDOT default speed-flow curves for 50, 60, and 70 mph facilities. Speeds are dependent upon v/c ratio and the number of lanes. HOV lane speeds are dependent upon volumes.
None
HCM 2000 Curves
Contains the HCM 2000 speed-flow curves for freeways. Speeds are dependent upon free-flow speeds, length of segment, and v/c ratio.
Posted speed and length of section must be provided in the Project Description worksheet. These values are used to estimate speed-flow relationship.
Concerns The WSDOT Mobility Project Prioritization Process estimates user benefits only by travel time savings. Therefore, the software is mostly based on capacity enhancements. The project team saw the need for more user benefit considerations besides only travel time savings. The resulting benefit/cost ratio from this software is input into the TOPSIS program and becomes 65% of the overall decision criteria for transportation officals. The method is customized for Washington issues and scenarios and would be difficult to modify for North Carolina.
16
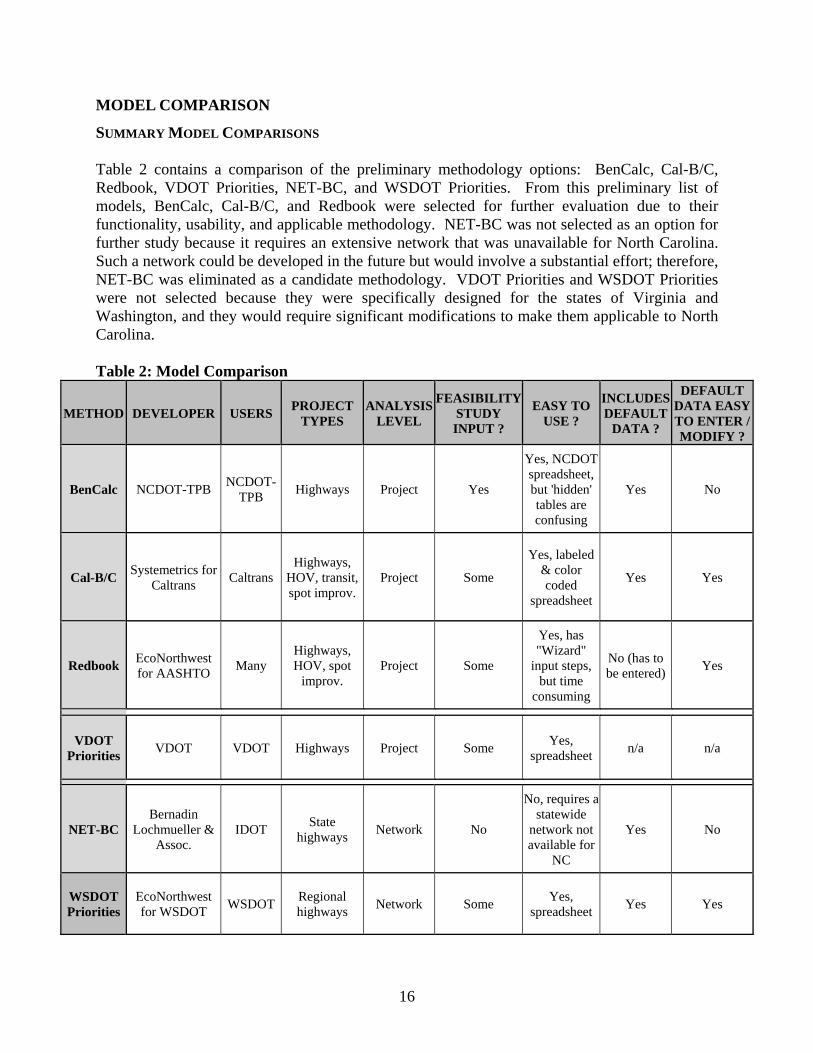
MODEL COMPARISON
SUMMARY MODEL COMPARISONS Table 2 contains a comparison of the preliminary methodology options: BenCalc, Cal-B/C, Redbook, VDOT Priorities, NET-BC, and WSDOT Priorities. From this preliminary list of models, BenCalc, Cal-B/C, and Redbook were selected for further evaluation due to their functionality, usability, and applicable methodology. NET-BC was not selected as an option for further study because it requires an extensive network that was unavailable for North Carolina. Such a network could be developed in the future but would involve a substantial effort; therefore, NET-BC was eliminated as a candidate methodology. VDOT Priorities and WSDOT Priorities were not selected because they were specifically designed for the states of Virginia and Washington, and they would require significant modifications to make them applicable to North Carolina. Table 2: Model Comparison
METHOD DEVELOPER USERS PROJECT TYPES
ANALYSIS LEVEL
FEASIBILITY STUDY INPUT ?
EASY TO USE ?
INCLUDES DEFAULT
DATA ?
DEFAULT DATA EASY TO ENTER / MODIFY ?
BenCalc NCDOT-TPB NCDOT-TPB Highways Project Yes
Yes, NCDOT spreadsheet, but 'hidden' tables are confusing
Yes No
Cal-B/C Systemetrics for Caltrans Caltrans
Highways, HOV, transit, spot improv.
Project Some
Yes, labeled & color coded
spreadsheet
Yes Yes
Redbook EcoNorthwest for AASHTO Many
Highways, HOV, spot
improv. Project Some
Yes, has "Wizard"
input steps, but time
consuming
No (has to be entered) Yes
VDOT Priorities VDOT VDOT Highways Project Some Yes,
spreadsheet n/a n/a
NET-BC Bernadin
Lochmueller & Assoc.
IDOT State highways Network No
No, requires a statewide
network not available for
NC
Yes No
WSDOT Priorities
EcoNorthwest for WSDOT WSDOT Regional
highways Network Some Yes, spreadsheet Yes Yes

17
KINSTON CASE STUDY FOR BENCALC, CAL-B/C, AND THE REDBOOK WIZARD
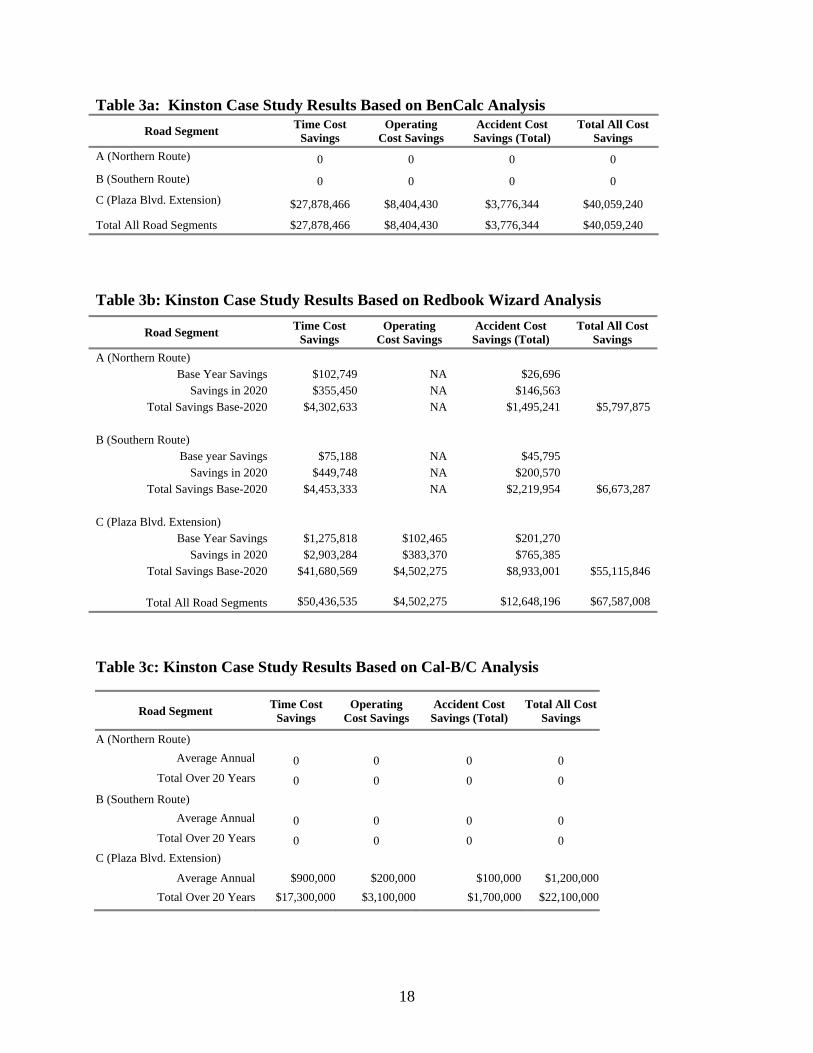
The final three options for a benefit/cost model were further examined using a case study of a bypass project in Kinston, North Carolina. The functionality of and comparisons between BenCalc, Cal-B/C, and the Redbook Wizard were tested using the Plaza Boulevard Extension Project, NCDOT Project U-4018 (Appendix A). The Plaza Boulevard Extension is a “green field” bypass between NC58 (Queen Street) and NC11 (Greenville Highway) in Kinston, NC (Lenoir County, Division 2). The NCDOT feasibility study on the project dated May 7, 1999 (FS-9902B) provided data for each of the three tested software packages. The project corridor contains two existing parallel routes to the proposed Plaza Boulevard Extension⎯one to the north and one to the south of the proposed link. The case study analyzed the alternate routes as the base case (do-nothing) case and the Plaza Boulevard Extension as the improvement project. The Plaza Boulevard Extension (Link C) will be a 1.3 mile segment that will provide an east-west link through the northern portion of Kinston. The link will divert traffic from the two other existing links. One link runs north of the proposed project location (Link A) and the other link runs south of the proposed project location (Link B). This project is explained in more detail with full inputs and outputs in Appendix A. The final results in total cost savings from the Kinston Case Study were $40.1 million for BenCalc, $67.6 million for the Redbook Wizard, and $22.1 million for Cal-B/C. Although each software program provided different results, the most valuable information came from the process of using and testing each piece of software and understanding the underlying methodology. The project team learned about the details and methodology of each software program. Cal B/C was easy to navigate, especially in the case of reopening the spreadsheet to change/update a value. Cal B/C parameters are accessible and easily modified by users through their Model Inputs and Parameters Worksheets. Cal B/C is based on many of the same standards as Redbook, with an emphasis on data and parameters specific to California. For example, most of the Value of Time theory and calculations are based on the U.S. DOT recommendations. Many organizations such as AASHTO and the FHWA are referenced by Cal B/C for their expertise in various areas. The Redbook Wizard is difficult to navigate with the “jump” option. After a user becomes familiar with the software, the “jump” tool is helpful. The step by step process of the Redbook Wizard can help a beginner make sure that each step is completed before continuing. Redbook is the national standard and is based on the state of the practice. The Wizard does not allow the user to open another Excel window while it is running. The BenCalc Spreadsheet has a date in the title of 7/9/1997, but there is an anecdotal report of an update to the parameters in 2001. The case study provided operational comparisons for the three models (Table 3).
18
Table 3a: Kinston Case Study Results Based on BenCalc Analysis Road Segment Time Cost
Savings Operating
Cost Savings Accident Cost
Savings (Total) Total All Cost
Savings A (Northern Route) 0 0 0 0 B (Southern Route) 0 0 0 0 C (Plaza Blvd. Extension) $27,878,466 $8,404,430 $3,776,344 $40,059,240
Total All Road Segments $27,878,466 $8,404,430 $3,776,344 $40,059,240
Table 3b: Kinston Case Study Results Based on Redbook Wizard Analysis
Table 3c: Kinston Case Study Results Based on Cal-B/C Analysis
Road Segment Time Cost Savings
Operating Cost Savings
Accident Cost Savings (Total)
Total All Cost Savings
A (Northern Route) Base Year Savings $102,749 NA $26,696
Savings in 2020 $355,450 NA $146,563 Total Savings Base-2020 $4,302,633 NA $1,495,241 $5,797,875
B (Southern Route)
Base year Savings $75,188 NA $45,795 Savings in 2020 $449,748 NA $200,570
Total Savings Base-2020 $4,453,333 NA $2,219,954 $6,673,287
C (Plaza Blvd. Extension) Base Year Savings $1,275,818 $102,465 $201,270
Savings in 2020 $2,903,284 $383,370 $765,385 Total Savings Base-2020 $41,680,569 $4,502,275 $8,933,001 $55,115,846
Total All Road Segments $50,436,535 $4,502,275 $12,648,196 $67,587,008
Road Segment Time Cost Savings
Operating Cost Savings
Accident Cost Savings (Total)
Total All Cost Savings
A (Northern Route) Average Annual 0 0 0 0
Total Over 20 Years 0 0 0 0 B (Southern Route)
Average Annual 0 0 0 0 Total Over 20 Years 0 0 0 0
C (Plaza Blvd. Extension)
Average Annual $900,000 $200,000 $100,000 $1,200,000 Total Over 20 Years $17,300,000 $3,100,000 $1,700,000 $22,100,000

19
Not too surprisingly, each method with its different inputs and parameters gave different results for the Kinston Plaza Boulevard Project; however, each showed that the project provides benefits to the user. Generally BenCalc was inadequate in comparison to the more recent Cal-B/C and Redbook Wizard in that it used relatively few inputs and the results of two different analysts were different. Cal-B/C and the Redbook Wizard, which are based on national standards for computing benefits and costs, gave more consistent results. Cal-B/C was designed specifically for use by Caltrans and contained some data that was specific to California. The Redbook Wizard gave consistent results and more complete results in that costs and benefits for the alternate routes could also be calculated. Overall, the research team preferred using the Redbook Wizard. The Wizard required peak hour volumes and capacity information for only the base year build and no-build cases. However, the feasibility study for Kinston Plaza Boulevard Project, contained base year and future year ADT values for the build and no-build cases as a result of the usual NCDOT network modeling of the Kinston Network. Thus, to use the Redbook Wizard with NCDOT feasibility study input, ECONorthwest engineers had to modify the feasibility study data to “fit” Wizard input requirements. This awkward conversion was eventually overcome by customizing the Wizard to optionally accept NCDOT daily volume data, as well as the usual Wizard peak hour volume data. JUSTIFICATION FOR SELECTING THE REDBOOK WIZARD
The process of examining the Kinston Case Study, through use of the three different methodologies and their respective software, convinced the project team to recommend the Redbook Wizard as the benefit-cost software for NCDOT. The Redbook Wizard takes the user step-by-step through the process of data input, and it is based on the “User Benefit Analysis for Highways,” which is the national standard for highway benefit analysis. The Redbook Wizard ensures the accurate completion of the benefit/cost analysis by requiring the user to complete each step in sequence. The “jump” feature allows users to return to specific parts of the process to modify input. The Wizard is capable of handling a variety of highway improvement types, and it provides defensible and reliable results because it is based on the national standard for benefit/cost analysis. Adopting and using a national standard allows NCDOT to receive updates when there is a change in methodology or technology. The project team and the NCDOT Research Project Steering and Implementation Committee met in September 2005 to discuss the software options and obtain concurrence on the recommended Redbook Wizard. The presentation included detailed information about the case study to explain how each program performs and their comparative advantages and disadvantages. NCDOT agreed that the various aspects and capabilities of the Redbook Wizard would fit the Department’s need for highway project benefit-cost analyses.
20
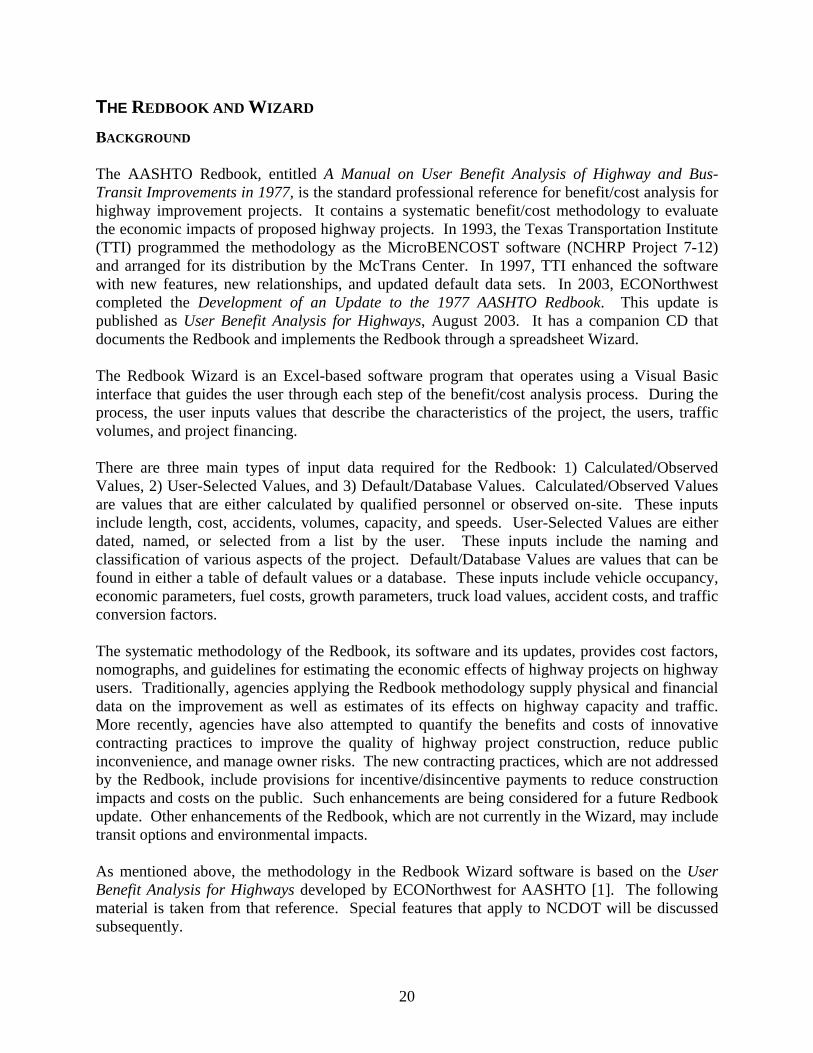
THE REDBOOK AND WIZARD BACKGROUND
The AASHTO Redbook, entitled A Manual on User Benefit Analysis of Highway and Bus-Transit Improvements in 1977, is the standard professional reference for benefit/cost analysis for highway improvement projects. It contains a systematic benefit/cost methodology to evaluate the economic impacts of proposed highway projects. In 1993, the Texas Transportation Institute (TTI) programmed the methodology as the MicroBENCOST software (NCHRP Project 7-12) and arranged for its distribution by the McTrans Center. In 1997, TTI enhanced the software with new features, new relationships, and updated default data sets. In 2003, ECONorthwest completed the Development of an Update to the 1977 AASHTO Redbook. This update is published as User Benefit Analysis for Highways, August 2003. It has a companion CD that documents the Redbook and implements the Redbook through a spreadsheet Wizard. The Redbook Wizard is an Excel-based software program that operates using a Visual Basic interface that guides the user through each step of the benefit/cost analysis process. During the process, the user inputs values that describe the characteristics of the project, the users, traffic volumes, and project financing. There are three main types of input data required for the Redbook: 1) Calculated/Observed Values, 2) User-Selected Values, and 3) Default/Database Values. Calculated/Observed Values are values that are either calculated by qualified personnel or observed on-site. These inputs include length, cost, accidents, volumes, capacity, and speeds. User-Selected Values are either dated, named, or selected from a list by the user. These inputs include the naming and classification of various aspects of the project. Default/Database Values are values that can be found in either a table of default values or a database. These inputs include vehicle occupancy, economic parameters, fuel costs, growth parameters, truck load values, accident costs, and traffic conversion factors. The systematic methodology of the Redbook, its software and its updates, provides cost factors, nomographs, and guidelines for estimating the economic effects of highway projects on highway users. Traditionally, agencies applying the Redbook methodology supply physical and financial data on the improvement as well as estimates of its effects on highway capacity and traffic. More recently, agencies have also attempted to quantify the benefits and costs of innovative contracting practices to improve the quality of highway project construction, reduce public inconvenience, and manage owner risks. The new contracting practices, which are not addressed by the Redbook, include provisions for incentive/disincentive payments to reduce construction impacts and costs on the public. Such enhancements are being considered for a future Redbook update. Other enhancements of the Redbook, which are not currently in the Wizard, may include transit options and environmental impacts. As mentioned above, the methodology in the Redbook Wizard software is based on the User Benefit Analysis for Highways developed by ECONorthwest for AASHTO [1]. The following material is taken from that reference. Special features that apply to NCDOT will be discussed subsequently.
21
“The first concept of user benefit analysis to master is the notion of the frame of reference of the analysis. Specifically, all benefit-cost analysis is conducted by comparing two situations: the situation without the project in place, and the situation with the project in place. The situation without the project is typically called the base case and the situation with the project is typically called the project alternative or the project scenario. If there are many project alternatives that are to be compared, they all must be compared, first, to the same base case. Pair-wise comparisons of alternatives only establish the relative, not absolute, viability of a project alternative. The reason that user benefit analysis focuses on comparing two situations is, of course, a practical one: the new project cannot lay claim to all of the travel benefits that users already enjoy or will continue to enjoy even if the project is never implemented. The new project can only take credit for improvements to travel conditions, relative to the base case conditions. As a practical matter, this comparative frame of reference for user benefit analysis also makes user benefit analysis feasible. It is much easier to model and measure changes from base case conditions than it is to model a project’s effects in a vacuum.”
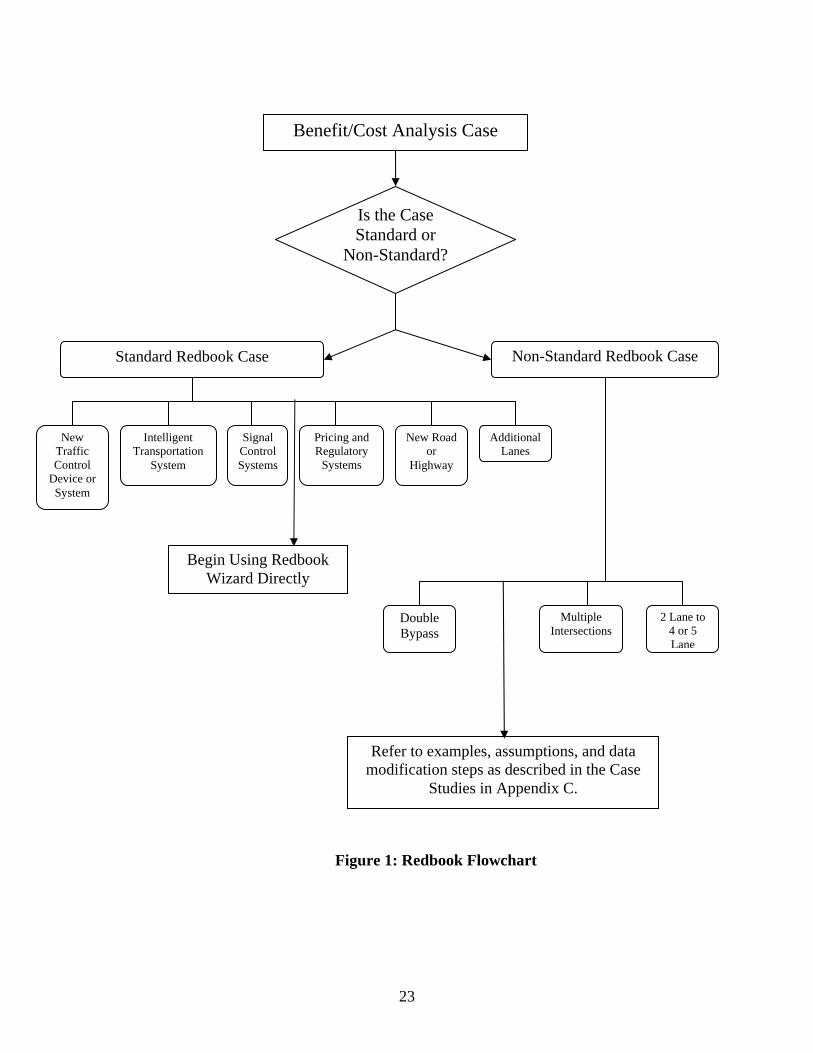
The QuickGuide table that follows on the next page (Table 4) defines the eleven basic steps in the Redbook user benefit analysis. Also described in the table are the types of data required and the referenced area of the Redbook available for more information. The table is available in the Redbook on page 2-3. Following the QuickGuide is a flowchart developed by the research team (Figure 1) which describes the process that the analyst should approach for the Redbook Wizard. A standard improvement type can be directly input into the Wizard, while a non-standard improvement will require additional data modification and assumptions to prepare it for input. Some examples of non-standard projects have been included as case studies in the Appendices.

22
Table 4: Redbook QuickGuide Table to the Basic Steps of User Benefit Analysis
Step Types of Information Needed Go Here for More Information
1 Define the Project Alternative and the Base Case
1. The network elements affected Chapter 2 2. Engineering characteristics 3. Project build-out schedule 4. Project capital cost schedule 5. Project operating cost schedule
2 Determine the level of detail required 1. Vehicle classes to be studied Chapter 3 2. Types of benefits and costs Chapter 4 3. Hourly/daily/seasonal detail 4. Link vs. corridor perspective 5. Periods to model explicitly
3 Develop basic user cost factors 1. Value(s) of time Chapter 3 2. Vehicle occupancy rate(s) Chapter 4 3. Vehicle unit operating costs Chapter 5 4. Accident rate and cost parameters
4 Select economic factors 1. Discount rate Chapter 5 2. Analysis period Chapter 6 3. Evaluation date 4. Inflation rate(s) 5. Value of life, morbidity
5 Obtain traffic performance data (for Project Alternative and Base Case) for explicitly modeled projects
1. Volumes, speeds/travel times, occupancy, before and after improvement
Not covered in this manual See Highway Capacity Manual for guidance
2. Usually requires travel demand and traffic assignment model(s).
6 Measure user costs (for Project Alternative and Base Case) for affected link(s) or corridor(s)
1. Hourly/daily/seasonal traffic volumes Chapter 3 2. Link/corridor travel time costs Chapter 4 3. Vehicle operating costs Chapter 5 4. Intersection delay costs 5. Accident costs 6. Factors in Steps 3 and 4
7 Calculate user benefits 1. Data from Step 5 Chapter 5 2. User benefit formula
8 Extrapolate/interpolate benefits to all project years (unless all time periods are explicitly modeled)
1. Traffic growth rate factors Chapter 6 2. Volume-delay function factors 3. Peak-spreading assumptions
9 Estimate terminal value 1. Assumptions about facility life Chapter 6 2. Assumptions about salvage opportunities
10 Determine present value of benefits/costs
1. Data from Steps 1, 4, 7, and 8 Chapter 6 2. Analysis of project management alternatives
11 Make project selection decision 1. Data from Step 9 Chapter 6
2. Data from other project alternatives
3. Budget constraint conditions
23
Figure 1: Redbook Flowchart
Standard Redbook Case Non-Standard Redbook Case
Additional Lanes
New Road or
Highway
New Traffic Control
Device or System
Signal Control Systems
Pricing and Regulatory
Systems
Intelligent Transportation
System
Is the Case Standard or
Non-Standard?
Benefit/Cost Analysis Case
Refer to examples, assumptions, and data modification steps as described in the Case
Studies in Appendix C.
Begin Using Redbook Wizard Directly
Double Bypass
Multiple Intersections
2 Lane to 4 or 5 Lane

24
REDBOOK Data Requirements
Tables 5 and 6 list the data required as inputs to the Redbook Wizard. Table 5, Redbook Input Data Summary Sheet, lists the inputs that are applied to all segments in the analysis. Table 6, Redbook Input Segment Data Summary Sheet for Alternative 1, lists the inputs that are specific to each segment in the analysis. In most cases, the entire project length can be input as one segment. Multiple segments should be used when roadway conditions differ along the project, including the number of lanes or the functional classification.
Table 5: Redbook Input Data Summary Sheet
Input Item Number of segments to analyze Year construction begins Year operation begins Last year of analysis period Base year Name of User Class 1 Name of User Class 2 Vehicle Type for User Class 1 Vehicle Type for User Class 2 Vehicle Occupancy for User Class 1 (persons) Vehicle Occupancy for User Class 2 (persons) Value of Time for User Class 1 (base-year dollars) Value of Time for User Class 2 (base-year dollars) Fuel Cost for User Class 1 (base-year dollars per gallon) Fuel Cost for User Class 2 (base-year dollars per gallon) Percent of Operating Costs that are fuel (percentage points) Real discount rate (percentage points) Inflation rate (percentage points) Financing rate (percentage points) Financing term (years) Issuance cost (% of amount financed) (percentage points) General traffic growth rate (percentage points) Annual Growth of Value of Time (percentage points) Average Truckload Value (base-year dollars) Market Interest Rate for truckload value (percentage points) Average Commercial Cargo Value (base-year dollars) Market Interest Rate for Commercial Cargo Value (percentage points) Cost per property damage accident (base-year dollars) Cost per injury accident (base-year dollars) Cost per fatal accident (base-year dollars) Name of Construction Management Alternative 1

25
Table 6: Redbook Input Segment Data Summary Sheet for Alternative 1 Segment Input Item Names given to segments Functional Class of each segment Improvement Type for each segment Segment Length without improvement (miles) Segment Length with improvement (miles) Method for Calculating Change in User Delay Base peak-direction, peak-hour volume (vehicles per day) Base peak-direction capacity (PCEs per hour) Base Free Flow Speed (miles per hour) Base Property-Damage Only Accidents (with base-year volume) (accidents per year) Base Injury Accidents (with base-year volume) (accidents per year) Base Fatal Accidents (with base-year volume) (accidents per year) Base Operating Cost (base-year dollars) Improved peak-direction, peak-hour volume (vehicles per day) Improved Capacity (PCEs per hour) Improved Free Flow Speed (miles per hour) Improved Property-Damage Only Accidents (with opening-year volume) (accidents per year) Improved Injury Accidents (with opening-year volume) (accidents per year) Improved Fatal Accidents (with opening-year volume) (accidents per year) Improved Operating Cost (opening-year dollars) K Factor for User Class 1 (peak hour volume/daily volume) K Factor for User Class 2 (peak hour volume/daily volume) D Factor for User Class 1 (peak-direction volume/total volume) D Factor for User Class 2 (peak-direction volume/total volume) Week Factor for User Class 1 (weekly volume/weekday volume) Week Factor for User Class 2 (weekly volume/weekday volume) Month Factor (monthly volume/weekly volume) Seasonal Factor (peak monthly volume/average monthly volume) Percent of base peak-hour, peak-direction volume that is in User Class 1 (percentage points) Percent of base peak-hour, peak-direction volume that is in User Class 2 (percentage points) Percent of improved peak-hour, peak-direction volume that is in User Class 1 (percentage points) Percent of improved peak-hour, peak-direction volume that is in User Class 2 (percentage points) Terminal Value (base-year dollars) Construction Management Alternative 1 Construction Property-Damage Only Accidents (each) Construction Injury Accidents (each) Construction Fatal Accidents (each) Total delay during construction (vehicle hours) Total extra VMT on detour route (vehicle miles) Speed on detour route (miles per hour) Right-of-way acquisition cost (construction-year dollars) Planning and design cost (construction-year dollars) Construction management cost (construction-year dollars) Construction cost (construction-year dollars)

26
DEFAULT DATA
Default data are important in the process of calculating the benefit/cost ratio to maintain consistent and accurate comparisons among similar project types. In this discussion of default values, the default data are actually input data, but not necessarily specific to the project. Some values such as accident costs will be applied consistently to all projects, while some values such as traffic conversion factors should be applied to each project based on its classification and geographic location. The default data will ensure that projects are analyzed in a consistent manner. The project team recommends that someone at NCDOT should be responsible for updating, maintaining, and distributing the default values on a regular basis. These values are not automatically part of the Redbook Wizard, rather, they must be manually entered by the user. The research team developed the following table (Table 7) of default values based on national and statewide data sources. For a complete explanation and source data of the values, refer to Appendix B. The NCDOT analyst should use these default values unless they have subsequently been updated, or there are more detailed data available for the specific project. REDBOOK WIZARD MODIFICATIONS FOR NCDOT
The research team, based on guidance from NCDOT, asked ECONorthwest to customize the standard Redbook Wizard tool to better match NCDOT operating procedures. The changes included additional options for inputting user delay, choices in the input of volume, and some corrections to calculations within the software. The additional options for inputting user delay allow the user to calculate user delay outside of the Redbook Wizard and input those results into the software or continue using the Redbook Method for determining user delay. The project team recommends using the Redbook Method for calculating user delay. The additional options allow for any future changes in the way NCDOT wants to calculate user delay. For this modification, the underlying methodology was not affected. The choices in the input of volume are in the format of either ADTs (Average Daily Traffic) or PCEs (Passenger Car Equivalents). The research team recommended this modification to allow NCDOT analysts to directly enter volumes from feasibility studies, where they are typical recorded as ADT values. The Redbook program will convert ADT volumes into PCE volumes for delay analyses. Finally, errors in the standard Redbook Wizard were corrected by ECONorthwest including minor software glitches and a miscalculation of construction costs due to incorrect application of growth factors.

27
Table 7: NCDOT Redbook Wizard User Manual Default Values
Input Value or Function Source
User Class / Economic / Vehicle Operating Cost Data Vehicle Occupancy for Automobiles (persons/vehicle) 1.6 Current National Household Travel Survey
Vehicle Occupancy for Trucks (persons/vehicle) 1.08 NCDOT O&D Surveys
Value of Time of Automobiles ($/hour) * $16.00 WEBSARAS Value of Time of Trucks ($/hour) * $16.00 Bureau of Labor Statistics Fuel Cost ($/gallon) * $ 3.00 American Automobile Association for NC Fuel Cost (% of Operating Cost) 52 % Bureau of Transportation Statistics Average Truck Load Value $ 14,500 Bureau of Transportation Statistics Market Interest Rate (%/year) * 6.75 % United States Federal Reserve
Economic Data Real Discount Rate (%/year) 3 % Redbook Wizard User Manual Inflation Rate (%/year) * 3 % Bureau of Labor Statistics Financing Rate (%/year) 0 % Standard Definition Financing Term (years) 0 Standard Definition (assuming standard payment without bonds) Issuance Cost (% of amount financed) 0 % Standard Definition General Traffic Growth Rate (%/year) * Varies Reverse Engineered from the traffic forecast data Annual Growth of Value of Time (%/year) 2 % Redbook Wizard User Manual
Property Damage Only Accident Cost ($/crash) * $4,300 NCDOT Traffic Engineering and Safety Systems Branch
Injury Accident Cost ($/crash) * $46,000 NCDOT Traffic Engineering and Safety Systems Branch
Fatal Accident Cost ($/crash) * $3,700,000 NCDOT Traffic Engineering and Safety Systems Branch Traffic Conversion Factors
K Factor 0.10-0.15 NCLOS D Factor 0.55-0.70 NCLOS Weekday-to-Week Expansion Factor 6.0 Redbook Wizard User Manual Week-to-Month Expansion Factor 4.35 Redbook Wizard User Manual Seasonality Factor 1.1 Redbook Wizard User Manual
* = Input value requires regular NCDOT updates

28
REDBOOK WIZARD SENSITIVITY ANALYSIS The goal of the sensitivity analysis was to determine the input values that, when altered, were the most influential in the final result. The most sensitive values are the ones that analysts should be most careful in their estimates. The same rationale applies to default data. The required input values from the I-74 Case Study were analyzed, with some values adjusted for ease of use. For most of the input parameters, the value used in the I-74 case study was altered by 25% and 50% while all other values were held constant (some of the parameters did not lend themselves to be altered by 25% and 50%, such as Free Flow Speed which instead used 5-mph increments). The most sensitive parameters were found to be volumes, free flow speeds, accidents, and project length. Data collection should place special emphasis on the accuracy of these values. In the I-74 case study, accidents did not prove to be particularly sensitive, because the crash rate values were low and a percentage change did not affect the overall result significantly. In another case study with high accident rates, accidents were much more sensitive. For projects where the before and after improvement length are equal, length is not sensitive. However, project length appears to be a sensitive value when the new alignment alters travel time, either by a shorter length or faster travel time or both. The percent of change in Total User Benefits are noted in Table 8. Figures 2 and 3 show graphs of the change in benefits versus the change in input value for volume and free flow speed, respectively.
Redbook Sensitivity Analysis - Volume
-300%
-200%
-100%
0%
100%
200%
300%
400%
500%
0% 10% 20% 30% 40% 50%
Change in Input Value (%)
Base Case Volume
Improved Case Volume
Input Average
Figure 2: Redbook Sensitivity Analysis - Volume

29
Redbook Sensitivity Analysis - Free Flow Speed
-200%
-100%
0%
100%
200%
0% 10% 20%
Change in Input Value (%)
Base Case Free Flow Speed
Improved Case Free Flow Speed
Input Average
Figure 3: Redbook Sensitivity Analysis – Free Flow Speed

30
Table 8: Redbook Wizard Sensitivity Analysis
Input Initial Value 25% Increase Value
% Change (From 25%
Increase)
50% Increase Value
% Change (From 50%
Increase)
Segment Length (before) 15.3 19.125 302.56% 22.95 605.13%Segment Length (after) 15.3 19.125 -278.83% 22.95 -557.65%Autos Vehicle Occupancy 1.6 2 22.81% 2.4 45.61%Trucks Vehicle Occupancy 1.08 1.35 0.81% 1.62 1.62%Autos Value of Time $16 $20 22.81% $24 45.61%Trucks Value of Time $16 $20 0.81% $24 1.62%Autos Fuel Cost $3.00 $3.75 0.00% $4.50 0.00%Trucks Fuel Cost $3.00 $3.75 0.00% $4.50 0.00%Real Discount Rate 3% 4% -16.83% 5% -30.56%General Traffic Growth Rate 3.00% 3.75% 205.03% 4.50% 823.66%Annual Growth of Value of Time 2.00% 2.50% 8.72% 3.00% 18.22%Average Truck Load Value $14,500 $18,125 0.00% $21,750 0.00%Market Interest Rate 6.75% 8.44% 0.00% 10.13% 0.00%Base Case Volume 26,800 33,500 73.47% 40,200 489.05%Base Case Peak Direction Capacity 4,400 5,500 -6.08% 6,600 -6.80%Base Case Free Flow Speed 60 65 -92.79% 70 -172.39%Base Case PDO Accidents 14 17.5 0.03% 21 0.05%Base Case Injury Accidents 15 18.75 0.30% 22.5 0.60%Base Case Fatal Accidents 0.66 0.825 1.05% 0.99 2.11%Improved Case Volume 26,800 33,500 -24.67% 40,200 -252.00%Improved Case Peak Direction Capacity 4,600 5,750 3.70% 6,900 4.20%Improved Case Free Flow Speed 65 70 79.45% 75 147.39%Improved Case PDO Accidents 2.27 2.8375 0.00% 3.405 -0.01%Improved Case Injury Accidents 0.99 1.2375 -0.02% 1.485 -0.04%Improved Case Fatal Accidents 0.058 0.0725 -0.09% 0.087 -0.19%K Factor 0.12 0.15 6.62% 0.18 101.40%D Factor 0.55 0.6 -8.11% 0.65 -14.64%Weekday to Week Expansion Factor 6 5.5 -8.10% 6.5 7.73%Week to Month Expansion Factor 4.35 4.75 8.55% 5 14.00%Seasonality Factor 1.1 1.375 -56.83% 1.65 -71.12% Average = 8.15% Average = 40.09%

31
MODEL APPLICATIONS
The Redbook Wizard can be applied to eight improvement types. Table 9 provides descriptions and examples of each improvement type from the AASHTO Redbook with additional comments.
Table 9: Redbook Wizard Improvement Types Improvement
Type Description & Example
Additional Lanes
This is the conventional method of adding capacity, and can take various forms. Additional lanes could actually be referred to as additional capacity. This improvement type should be selected when additional lanes are added. For example, turning a two-lane road into a four-lane road would be considered additional lanes. An example of adding capacity, while not necessarily adding lanes, is converting a four-lane highway into a four-lane freeway with full-access control.
Traffic Control Signals, signs, ramp metering and roundabouts can be added to existing roads, or incorporated in new roads to enhance effective capacity.
Signal Control Systems
Existing signalization systems can be enhanced to change timing and coordination of traffic flows.
ITS
These are improvements that allow the road or the user to respond to changing conditions on the road. ITS improvements include such things as variable or incident signage, incident management, and on-board navigation aids.
Geometric Improvement
Geometric improvements occur in the curvature and grade of the roadway. Improvements to road geometry are generally targeted at improving safety by reducing curve angles. These improvements are categorized into the following groups: horizontal and vertical curves.
Intersection Improvement
Intersection improvements can sometimes be confused with the other more specific improvements, such as geometric improvement or traffic control. For analysis in the Redbook Wizard, intersection improvements include the alteration of a skew angle, exclusive left-turn and right-turn lanes, and intersection sight distance.
Roadside or Lighting
Roadside or lighting improvements provide safety enhancements to road users. Roadside or lighting projects improve roadside features to reduce the occurrence and severity of accidents should the vehicle leave the road. Some roadside improvements include: roadside topography and drainage features, sign and luminaire supports (and similar structures), roadside barriers, median barriers, bridge railings and transitions, and barrier end treatments and crash cushions.
Preservation or Maintenance
Preservation projects are a road improvement activity involving significant renovation of the existing roadway without adding to the road’s effective capacity. Maintenance projects involve the activities needed to keep a highway and its appurtenances in serviceable condition.

32
SUMMARY
The Redbook Wizard is an Excel-based software program that guides the user through each step of the benefit/cost analysis process. The Redbook Wizard can be applied to eight types of improvements. During the process, the user is required to input values that describe the project and financing of the project. The input data fits into three classifications: Calculated/Observed Values, User-Selected Values, and Default/Database Values. Calculated/Observed Values describe the project, while User-Selected Values classify or name the project. Default data is important in the process of calculating the benefit/cost ratio to maintain consistent and accurate comparison among similar project types. The default data will ensure that projects are analyzed in a consistent manner. The research team strongly recommends that NCDOT be proactive in updating, maintaining, and distributing the default values on a regular basis. The research team, based on guidance from the NCDOT, asked ECONorthwest to modify the standard Redbook Wizard tool to make it more applicable to NCDOT operating procedures. The changes included additional options for inputting user delay, choices in the input of volume, and some corrections to calculations within the software. The sensitivity analysis that was performed provided valuable information about the input data that should receive the most focus from NCDOT. The most sensitive parameters are volumes, free flow speeds, accidents, and project length. The inclusion of project length as a highly sensitive value is misleading because the sensitivity actually results from a difference between the before and after improvement lengths. Typically, the length of a project will remain the same in the before and after improvement cases, which would make the value not sensitive.

33
FINDINGS AND CONCLUSIONS The goal of this research was to develop a new cost-benefit analysis tool that provides a simple way to identify economically efficient and inefficient highway projects based on user benefits and costs considered under a life-cycle costing framework. This research provides NCDOT staff with a consistent and reliable tool to evaluate costs and benefits for a variety of highway projects and project elements in various stages of completion from the planning phase through design. The research team began the project looking at six software options for use by NCDOT to perform their highway benefit/cost analysis: BenCalc, Cal-B/C, Redbook Wizard, VDOT Priorities, NET-BC, and WSDOT Priorities. After a preliminary screening process, the research team chose BenCalc, Cal-B/C, and the Redbook Wizard to analyze in more detail. A case study was used to test each of the software programs and determine which one method would serve NCDOT the best. The project team selected the Redbook Wizard, and NCDOT staff agreed with the selection. The Redbook Wizard performed well in the case study, it is a national standard, and it provides consistent results with a reasonable number of input data requirements. The most sensitive parameters in the Redbook methodology were found to be volumes, free flow speeds, and in certain cases, accidents. Data collection should place special emphasis on the accuracy of these values. Default parameter values related to these data, for example cost/accident, are also important and should be updated on regular intervals. The Redbook Wizard can calculate a benefit/cost ratio for up to eight improvement types. The key to calculating an accurate benefit/cost ratio is correctly representing the proposed project with the input data. Appendix C provides examples of projects and how an analyst can approach several types of projects.
34
RECOMMENDATIONS FOR IMPLEMENTATION The project team recommends that the North Carolina Department of Transportation utilize the newly customized Redbook Wizard software program to calculate the benefit/cost ratio of highway projects. NCDOT analysts can have confidence in the Redbook Wizard because it is based on the nationally accepted methodology of the AASHTO Redbook. The NCDOT should follow the approach and guidelines set forth in this report and the NCDOT Redbook User Manual for Redbook analyses to maximize efficiency and consistency between projects. NCDOT default data for Redbook Wizard inputs should be updated regularly according to each parameters’ volatility or as new planning cycles begin. NCDOT analysts need to contact a number of NCDOT units for data for the benefit/cost analysis process, but the majority of data will originate from the Feasibility Studies Unit. Cooperation between the benefit/cost analysts and the Feasibility Studies Unit is critical to the success of the process. The Feasibility Studies Unit can support the Redbook Wizard analysts by including data that is relevant to the Redbook in their project feasibility studies. The Redbook Wizard has simplified methods that can forecast traffic and eliminate the usual NCDOT travel demand modeling for Base Year and Future Year highway networks. Using that capability should improve forecasting efficiency and response time for studies.

35
RECOMMENDATIONS FOR FUTURE RESEARCH The simplified forecasting methods internal to the Redbook Wizard can eliminate some labor intensive travel demand modeling for projects. Currently the Transportation Planning Branch uses statistical methods or travel demand model software to estimate base year and future year traffic volumes of proposed projects. If the project is relatively well defined and somewhat isolated from network traffic divergence effects, the internal Wizard forecasting procedures could be used to estimate future year traffic. As a result, significant time savings could be achieved considering the hundreds of projects and feasibility studies that NCDOT accomplishes each year. Thus, research is recommended to test the potential time and money savings. The research would test the accuracy of the Wizard forecasts versus conventional forecasts and resulting time savings, if any. The NCDOT could also benefit from future research in the area of establishing a base-line benefit/cost ratio for typical projects. The base-line could separate economically successful and unsuccessful projects. The research could focus on a review of completed projects for several improvement types developing a base-line benefit/cost ratio ‘standard’ for each type of project. The baselines by project type could be further categorized by North Carolina region – eastern, central, and western. The base-line benefit/cost ratio could assist NCDOT staff in distinguishing the beneficial projects, and those that are not, at an early stage in the planning process.
36
PRODUCTS AND IMPLEMENTATION AND TECHNOLOGY TRANSFER PLAN Primary Products User-friendly benefit-cost analysis software – a spreadsheet-based tool (customized AASHTO Redbook Wizard) that evaluates proposed highway project user benefits and costs under a life-cycle costing framework. Executive Summary – need for economic feasibility analysis, current NCDOT procedure with the Benefits Matrix Model, proposed Redbook Wizard procedure, input data and output cost-benefit results. User Manual – the capabilities and operations of the cost-benefit analysis tool, as well as instructions on using the Redbook Wizard software. Training Session – the NCDOT custom AASHTO Redbook Wizard and project cost-benefit evaluations. Technical Documentation – background for the research, literature review, justification for choosing the AASHTO Redbook and Wizard, customization of the Wizard for NCDOT, application procedures, and example cost-benefit evaluations. Secondary Products Input data – baseline values and sensitivity of project data and parameters. Default Values – NCDOT default values for parameters used in the Redbook Wizard. Recommendations – suggestions for implementation of the NCDOT custom Redbook Wizard and for future research to identify benefit-cost thresholds for potentially successful projects. IMPLEMENTATION AND TECHNOLOGY TRANSFER PLAN The implementation and technology transfer of the products of this research have already begun. During the first phase of the implementation, the project team held a workshop for NCDOT personnel who will use the Wizard. During the workshop the team discussed the spreadsheets and demonstrated the software on typical highway project cases. Additional workshops outside the scope of this project may be necessary for other personnel. After the workshop the team delivered the technical report and case studies demonstrating the software to NCDOT for review. In addition, the software was included on CD for NCDOT to test. During the second phase of the implementation NCDOT will distribute the software to project engineers for application to proposed highway projects. While the software is a customized AASHTO Redbook application for NCDOT, it is important for NCDOT to obtain appropriate authorization from AASHTO to use the software. This may involve purchasing an appropriate
37
number of copies of the 2005 version of the Redbook and the accompanying Redbook CD Wizard for engineers and analysts. Alternately, a special license agreement may be necessary. In any event, it would be helpful for users to have the AASHTO Redbook and Wizard for reference in addition to the customized NCDOT Redbook Wizard CD and User’s Manual provided with this final report. After obtaining AASHTO authorization to use the customized NCDOT Wizard, NCDOT should distribute the software to the Program Development Branch, the Transportation Planning Branch, and others who will use the software. Also, according to any AASHTO licensing requirements, NCDOT should consider making the software available to city and state agencies and consultants involved in highway feasibility planning in North Carolina. As the analysts in the Transportation Planning Branch and the Program Development Branch become familiar with the Redbook Wizard, they should explore the capability of the Wizard to internally forecast future changes in traffic and related accidents and costs. Such internal analysis may simplify and shorten the current process of separately modeling and statistically forecasting traffic on highway projects.

38
REFERENCES 1) American Association of State Highway and Transportation Officials, User Benefit Analysis
for Highways. Washington, DC (2003). 2) American Association of State Highway and Transportation Officials (2003), “User Benefit
Analysis for Highways.” Washington, DC. 3) Arellano, T., (2002), “An Assessment of Benefits Analysis Models for Transportation
Planning,” Civil Engineering Masters Project, North Carolina State University, Raleigh, NC. 4) Kaliski, J., G. Weisbrod (1998), “Guide to MCIBAS (Major Corridor Investment-Benefit
Analysis System) and Its Economic Impact Analysis Component,” Indiana Department of Transportation, Cambridge Systematics Inc, and the Economic Development Research Group.
5) Botma, H., H. Papendrecht and D. Westland (1980), “Validation of Capacity Estimators
Based on the Distribution of Headways”, Transportation Research Laboratory, TU Delft.

A-1
Appendix A Kinston Benefit Cost Case Study:
Comparing BenCalc, Redbook Wizard, and Cal-B/C This appendix for analyzing the Kinston Case Study with the AASHTO Redbook Wizard and BenCalc was prepared by Randall Pozdena and Ted Helgovit of ECONorthwest. Introduction The purpose of this memorandum is to summarize the results of using the AASHTO Redbook procedures to evaluate the Plaza Boulevard Extension (PBE) project of NCDOT and to comment on the differences in Redbook and BenCalc procedures and results. The Redbook is a user benefit calculation manual and an associated set of electronic tools for assisting the calculation of user benefits. Many different types of improvements can be evaluated using the Redbook procedures. The purpose of examining the PBE project is to see whether the Redbook procedures are easily adapted to the type of sketch planning data that NCDOT's current procedures employ. As one shall see, the PBE project is easily handled by the Redbook. However, there are several differences between the user benefits calculated under the Redbook procedures vs. the procedures of the NCDOT's BenCalc spreadsheet method. Specifically, the BenCalc procedure appears to ignore benefits to induced traffic and benefits from increased speeds on network links that enjoy reduced load as a result of the improvement. The BenCalc spreadsheet also does not explicitly address the peaking behavior of traffic. It works with ADT rather than the traditional peak period traffic conditions and the more conventional use of k and d factors to accommodate all-day benefits.1 There are also some other, more minor differences and inconsistencies that are discussed below. The Sample Project The PBE project involves the development of a new road to bypass two older, slower, and more circuitous routes. The data used by NCDOT in its analysis thus related to three network segments. For brevity, we will refer to these segments as A, B, and C. Segments A (“The Northern Route”) and B (“The Southern Route”) exist in the "do nothing" case and the project case. Segment C (“Plaza Boulevard Extension”) only exists in the project case. The development of Segment C provides an improved means of traversing a corridor in the community of Kinston. Segment C provides a shorter and faster path than do Segments A and B. Consequently, there is diversion of traffic from Segments A and B to C. In addition, there will be new or induced traffic on Segment C; that is, total traffic on C will exceed the volume of traffic diverted from Segments A and B. Calculating Benefits: The BenCalc Approach In the BenCalc calculations, there appear to be 21 years of assumed project benefits. All calculations are performed on the average of circumstances described for 1999 and 2020. In essence, this is tantamount to linear interpolation of benefits in each of the endpoint years. Separate calculations are made for travel-time savings, operating cost savings, and accident cost savings.
1 The k factor is the proportion of ADT that occurs during the peak hours in the peak direction; The d- factor is the one–way traffic’s share of total traffic.
A-2
Data provided by the sketch planning process appears to be the following:
1. The Segments are characterized by length and free flow speed.
2. Volume data for Segments A and B with and without the improvement for the years 1999 and 2020.
3. Speed data for Segments A and B before the improvement for both study years. There are no speed data provided for these segments with the improvement.
4. Operating costs are incorporated by means of a lookup table. The values depend on average speed.
5. Accident costs are differentiated into three accident types: fatal, injury, and property-damage-only. Accident costs are obtained from a lookup table whose values are dependent on the volume-capacity ratio.
6. All vehicles are treated homogeneously in terms of their value of time. Specifically, all vehicles are assumed to have a value of time per person equal to $13 per hour and a vehicle occupancy rate of 1.6 persons per vehicle.
The benefit calculation procedure of the BenCalc spreadsheet attributes benefits only to diverted traffic, i.e., the volume of traffic diverted from Segments A and B to Segment C. Thus, for example, in the case of travel-time savings, the volume of diverted traffic in each study year is multiplied by the difference in travel time in the do-nothing case and the project case. For operating cost savings, total operating costs in the do-nothing case on Segments A and B is compared with operating costs of the diverted traffic on Segment C. Similarly, accident costs are derived by comparing the VMT in the do-nothing case on Segments A and B versus the VMT of diverted traffic on Segment C. There is no inflation or discount rate adjustment made to the benefit calculations. Calculating Benefits: The Redbook Approach The Redbook approach and the BenCalc approach are similar, but differ somewhat in the type of data required and, more significantly, in the underlying benefit calculation methodology. The Redbook allows evaluation of a variety of improvement types. For the purposes of this analysis, the improvement is considered a capacity enhancement. The data required by the Redbook Wizard are as follows:
1. Each of the three road segments is characterized by a length and free-flow speed, both in the base case and in the improvement case. They are also characterized by a conventional functional classification. In the PBE project case, each segment is considered a Principal Urban Arterial.
2. The Redbook calculations are based on peak volumes, with daily traffic characterized by a peaking parameter, k, and a traffic directional parameter, d. Since only ADT was available from the PBE project sketch data, ECONorthwest computed the implied peak hour volume assuming typical k and d factors and the volume-delay relationship implicit in the segment functional class and free-flow speed.
3. Though the Redbook permits traffic to be comprised of various vehicle types, the PBE project appears to consider only the automobile vehicle class. ECONorthwest, therefore, performed the Redbook Wizard analysis for only this vehicle class.
4. Operating costs are entered in the Redbook Wizard by denoting a cost of motor fuel and a factor to express the share that motor fuel represents of total operating costs. These costs are then applied internally to VMT assuming an average of 22 miles per gallon. Operating costs are a

A-3
function of speed in the Redbook case. Data from the BenCalc operating cost lookup table were used to derive operating cost data entry figures for the Wizard.
5. Accident costs in the Redbook are dealt with by entering the cost per accident and the number of accidents for each segment with and without the improvement. Data from the BenCalc lookup table for accident categories were used to derive these inputs for comparability.
6. The Wizard allows benefits obtained in one period to be extrapolated or interpolated to other periods using ADT growth when the project is a capacity enhancing type. Alternatively, individual project years can be evaluated separately and interpolated or extrapolated by any other means the analyst desires. For consistency with the BenCalc methodology, ECONorthwest implemented the latter procedure and did not employ the ADT growth rate extrapolation procedure.
7. The Redbook allows inflation and discounting factors to be applied to the multiyear stream of user benefits. The BenCalc procedure does not explicitly employ these factors for the PBE project. For consistency, therefore, inflation and discount rates are set to zero in the Redbook simulations.
Table 1 and Table 2 display the inputs required for BenCalc and the Redbook Wizard, respectively, in order to evaluate the PBE project. Many of the inputs are the same and all are derivable from the BenCalc data. Results: BenCalc vs. the Redbook The methodology for measuring user benefits using the Redbook is different from the methodology implicit in BenCalc. The primary difference is that the Redbook takes a consumer surplus approach to benefits measurement whereas the BenCalc spreadsheet focuses only on explicit cost savings to diverted traffic in the PBE project. In a project such as the PBE project, there are user benefits to two other types of users in addition to the diverted traffic. The first is the benefit to users who remain on the original Segments A and B. They enjoy reduced loads on those segments in the form of higher speeds. This in turn may give them some benefit in the form of reduced accidents and reduced operating costs. The second group of users who benefit in addition to diverted traffic are new, or induced traffic. Specifically, the improved travel times in the corridor induce additional users to travel. Although they were not willing to travel at the old cost of traversing the corridor on Segments A and B, they bear costs less than what they would have been willing to pay as a result of the improvement offered by Segment C. The results of the BenCalc calculations and the Redbook calculations are presented in Table 3 and Table 4, respectively. The most obvious difference is that the total user benefits are lower in the BenCalc case than in the Redbook case. This is primarily a result of the inclusion of benefits to non-diverted users of Segments A and B and the inclusion of benefits to induced users on Segment C. There are other subtle differences in the operating cost and accident cost categories, but these result from slight differences in the computational approaches of the two methods. Despite the differences between the two approaches, it is clear that a project like the PBE project can be evaluated using the Redbook.

A-4
Table 1: Model Inputs—BenCalc. Input Segment A
1999 Segment A
2020 Segment B
1999 Segment B
2020 Segment C
1999 Segment C
2020 Facility Type Arterial Arterial Arterial Arterial Collector Collector ADT0 1,700 3,600 1,600 3,400 NA NA ADT1 NA NA NA NA 3,100 7,3000 Length0 2.62 miles 2.62 miles 2.12 2.12 NA NA Length1 NA NA NA NA 1.3 1.3 VMT (21-year Tot.) 53,219,634 40,625,952 51,317,175 VOT0 $13/hour $13/hour $13/hour $13/hour NA NA VOT1 NA NA NA NA $13/hour $13/hour VOR0 1.6 1.6 1.6 1.6 NA NA VOR1 NA NA NA NA 1.6 1.6 Peak-Hour Vol0 NA NA NA NA NA NA Peak-Hour Vol1 NA NA NA NA NA NA Hourly Capacity0 NA NA NA NA NA NA Hourly Capacity1 NA NA NA NA NA NA Avg. Speed 36.6 MPH 35.7 MPH 40.2 MPH FF-Speed0 NA NA NA NA NA NA FF-Speed1 NA NA NA NA NA NA Peak Speed0 NA NA NA NA NA NA Peak Speed1 NA NA NA NA NA NA V/C 0.136 0.295 0.181 0.415 0.101 0.245 K-factor0 NA NA NA NA NA NA K-factor1 NA NA NA NA NA NA D-factor0 NA NA NA NA NA NA D-factor1 NA NA NA NA NA NA Operating Cost0 NA NA NA NA NA NA Operating Cost1 NA NA NA NA NA NA Price of Fuel0 NA NA NA NA NA NA Price of Fuel1 NA NA NA NA NA NA Fuel % of Op.0 NA NA NA NA NA NA Fuel % of Op.1 NA NA NA NA NA NA Prop Acc (Total) 83 67 18 Injury Acc (Total) 43 34 22 Fatal Acc (Total) 0 0 0 Cost/Prop Acc $2,400 $2,400 $2,400 $2,400 $2,400 $2,400 Cost/Injury Acc $61,000 $61,000 $61,000 $61,000 $61,000 $61,000 Cost/Fatal Acc $3,100,000 $3,100,000 $3,100,000 $3,100,000 $3,100,000 $3,100,000 Inflation 0 0 0 0 0 0 Days In Year 365 365 365 365 365 365
Table Source: ECONorthwest from NCDOT data.

A-5
Table 2: Model Inputs—Redbook Input Segment A
1999 Segment A
2020 Segment B
1999 Segment B
2020 Segment C
1999 Segment C
2020 Facility Type Urban Art. Urban Art. Urban Art. Urban Art. Urban Art. Urban Art. ADT0 6,700 13,800 8,900 18,400 3,300 7,000 ADT1 5,000 10,200 7,300 15,000 6,100 14,300 Length0 2.62 miles 2.62 miles 2.12 2.12 2.37 2.37 Length1 2.62 miles 2.62 miles 2.12 2.12 1.3 1.3 VMT0 6,407,395 13,197,322 6,887,066 14,238,429 2,854,756 6,055,544 VMT1 4,781,638 9,754,542 5,648,942 11,607,415 2,894,450 6,785,350 VOT0 $13/hour $13/hour $13/hour $13/hour $13/hour $13/hour VOT1 $13/hour $13/hour $13/hour $13/hour $13/hour $13/hour VOR0 1.6 1.6 1.6 1.6 1.6 1.6 VOR1 1.6 1.6 1.6 1.6 1.6 1.6 Peak-Hour Vol0 201 414 267 552 99 210 Peak-Hour Vol1 150 306 219 450 18 429 Hourly Capacity0 147 299 195 395 72 152 Hourly Capacity1 110 223 161 325 135 316 Avg. Speed0 38 MPH 36 MPH 38 MPH 34 MPH 38 MPH 36 MPH Avg. Speed1 39 MPH 38 MPH 39 MPH 36 MPH 41 MPH 40 MPH FF-Speed0 45 MPH 45 MPH 45 MPH 45 MPH 45 MPH 45 MPH FF-Speed1 45 MPH 45 MPH 45 MPH 45 MPH 45 MPH 45 MPH Peak Speed0 20.7 MPH 19.6 MPH 20.7 MPH 18.5 MPH 20.7 MPH 19.6 MPH Peak Speed1 21.3 MPH 20.7 MPH 21. 3 MPH 19.6 MPH 22.4 MPH 21.8 MPH V/C0 0.136 0.295 0.181 0.415 0.159 0.355 V/C1 0.101 0.218 0.148 0.338 0.101 0.245 K-factor0 0.06 0.06 0.06 0.06 0.06 0.06 K-factor1 0.06 0.06 0.06 0.06 0.06 0.06 D-factor0 0.5 0.5 0.5 0.5 0.5 0.5 D-factor1 0.5 0.5 0.5 0.5 0.5 0.5 Operating Cost0 NA NA NA NA NA NA Operating Cost1 NA NA NA NA NA NA Price of Fuel0 $1.00/Gal. $1.00/Gal. $1.00/Gal. $1.00/Gal. $1.00/Gal. $1.00/Gal. Price of Fuel1 $1.00/Gal. $1.00/Gal. $1.00/Gal. $1.00/Gal. $1.00/Gal. $1.00/Gal. Fuel % of Op.0 25% 25% 25% 25% 25% 25% Fuel % of Op.1 25% 25% 25% 25% 25% 25% # Prop Acc.0 9.5 21.5 10.5 25.6 0.9 4.1 # Prop Acc.1 7.0 15.2 8.5 19.6 0.7 3.1 # Injury Acc.0 4.9 11.0 5.5 12.6 1.2 3.6 # Injury Acc.1 3.6 7.9 4.4 9.9 1.1 3.3 # Fatal Acc.0 0.03 0.09 0.04 0.13 0.009 0.035 # Fatal Acc.1 0.02 0.06 0.03 0.09 0.007 0.026 Cost/Prop Acc $2,400 $2,400 $2,400 $2,400 $2,400 $2,400 Cost/Injury Acc $61,000 $61,000 $61,000 $61,000 $61,000 $61,000 Cost/Fatal Acc $3,100,000 $3,100,000 $3,100,000 $3,100,000 $3,100,000 $3,100,000 Inflation 0 0 0 0 0 0 Days In Year 365 365 365 365 365 365
Table Source: ECONorthwest from NCDOT data.

A-6
Table 3: User Benefits Based on BenCalc Analysis Road Segment Time Cost
Savings Operating
Cost Savings Accident Cost Savings (Total)
Total All Cost Savings
A (Northern Route) 0 0 0 0
B (Southern Route) 0 0 0 0
C (Plaza Blvd. Extension) $27,878,466 $8,404,430 $3,776,344 $40,059,240
Total All Road Segments $27,878,466 $8,404,430 $3,776,344 $40,059,240
Table Source: Data and calculations from NCDOT
Table 4: User Benefits Based on Redbook Analysis Road Segment Time Cost
Savings Operating
Cost Savings Accident Cost Savings (Total)
Total All Cost Savings
A (Northern Route) Base Year Savings $102,749 NA $26,696
Savings in 2020 $355,450 NA $146,563 Total Savings Base-2020 $4,302,633 NA $1,495,241 $5,797,875
B (Southern Route)
Base year Savings $75,188 NA $45,795 Savings in 2020 $449,748 NA $200,570
Total Savings Base-2020 $4,453,333 NA $2,219,954 $6,673,287
C (Plaza Blvd. Extension) Base Year Savings $1,275,818 $102,465 $201,270
Savings in 2020 $2,903,284 $383,370 $765,385 Total Savings Base-2020 $41,680,569 $4,502,275 $8,933,001 $55,115846
Total All Road Segments $50,436,535 $4,502,275 $12,648,196 $67,587,008
Table Source: Calculations by ECONorthwest, based on data from NCDOT

A-7
Calculating Benefits: The CAL-B/C Approach The CAL-B/C approach is similar to both the Redbook approach and the BenCalc approach, but differs somewhat in the type of data required and in the underlying benefit calculation methodology. CAL-B/C deals with four main types of benefits that can result from a highway or transit project: travel time, operating cost, accident cost, and emission savings. The model can handle a variety of improvement types which can be found in the following table.
Highway Capacity Expansion
Transit Capacity Expansion
Operational Improvements
Transportation Management Systems (TMS)
General Highway Passenger Rail Auxiliary Lane Ramp Metering
HOV Lane Light-Rail (LRT) Freeway Connector Ramp Metering Signal Coordination
Passing Lane Bus HOV Connector Incident Management
Interchange HOV Drop Ramp Traveler Information
Bypass Off-Ramp Widening Arterial Signal Management
Pavement On-Ramp Widening Transit Vehicle Location (AVL)
Transit Vehicle Signal Priority
Bus Rapid Transit (BRT)
The data required by CAL-B/C are as follows:
1. Project data is the initial section of information that is required from the user. The data includes the type of project, location of the project, the length of the construction period, and the length of the peak period. The location of the project is used to calculate emission benefits/costs for the project. Emission benefits were not considered for the PBE project.
2. The Highway Design and Traffic Data section is comprised of five sub-sections: Highway Design, Average Daily Traffic, On-Ramp Volume, Pavement Condition, and Average Vehicle Occupancy. Highway Design data contains the number of lanes, number of HOV lanes, type of HOV restriction, free-flow speed, ramp design speed, and length. Average Daily Traffic includes the volumes in the base year and forecast year, HOV volumes, percent weaving traffic, percent trucks, and truck speed. On-Ramp Volume is the on-ramp volumes and the associated metering strategy. The Pavement Condition is recorded for the base year and forecast year. Average Vehicle Occupancy is entered for general traffic and high occupancy vehicles.
3. Highway Accident Data is also considered in the CAL-B/C method. Actual three-year accident data is used along with statewide averages for the highway classification.
4. Transit Data is another consideration of CAL-B/C, but was not a consideration for the PBE project.
5. The final user input are the project costs, which includes direct project costs, mitigation, and transit agency cost savings.
6. The Parameters Worksheet in CAL-B/C contains values that the user might update with specific project information to override the defaults. The parameters include: economic, highway operations, travel time, operating cost, and accident cost parameters.
The tables in the appendices displays the inputs required for CAL-B/C in order to evaluate the PBE project. Many of the inputs are the same and all are derivable from the BenCalc data.
A-8
Analysis of Plaza Boulevard Extension Using CAL-B/C There are multiple ways to analyze the Plaza Boulevard Extension using CAL-B/C. One way is to separate the facility into Northern (A), Southern (B), and Project (C) Segments and evaluate each separate using the general highway type project (Input can be found in Table 5). Another method to input the PBE project is to average segments A and B and compare them to C using the Bypass type project (Input can be found in Table 6). A final way to evaluate the PBE project is to sum the parallel facilities (A and B) and use the Bypass type project (Input can be found in Table 7). There is a concern about evaluating the facility in three separate segments in the general highway type. CAL-B/C internally assumes there is an “other road” in which the project is being based on. The “other road” gives the basis for differences with the project link for a net benefit or cost. By evaluating each of the segments separately, CAL-B/C is effectively double-counting the results for each segment because of the “other road.” The way to avoid the problem with the “other road” is to evaluate the facility as a bypass project. There has been some concern about averaging the parallel facilities, but this method seems to be most appropriate for use in CAL-B/C. The final evaluation technique to sum the parallel facilities instead of averaging them was necessary to test all possibilities. Results: CAL-B/C The following images give more detailed information about the case study that was applied to Cal-B/C. The results of the three evaluations of CAL B/C are presented in Table 8.

A-9
17
BC Case Study DescriptionBC Case Study DescriptionPlaza Blvd Extension Plaza Blvd Extension -- Kinston (UKinston (U--4018)4018)
AA
BB
CC
BB
CC
AA
1.3 mi1.3 mi
AA
BB
18
BC Case Study DataBC Case Study DataPlaza Boulevard Extension, FS-9902B, U-4018Kinston, North Carolina (Lenoir County)
A. Northern section = 2.62 miles, 4 lanesB. Southern section = 2.13 miles, 4 lanesC. Project section = 1.30 miles, 4 lanes
A. Northern section ADT:1999: 6,700 2020: 13,800
B. Southern section ADT:1999: 8,900 2020: 18,400
C. Project section ADT:1999: 6,100 2020: 14,300

A-10
Table 5: Model Inputs—CAL-B/C Analysis of Each Segment Separately
Input Segment A Segment A Segment B Segment B Segment C Segment C
1999 2020 1999 2020 1999 2020
Project Type General Highway General Highway General Highway General Highway General Highway General Highway
Construction Period 3 years 3 years 3 years 3 years 3 years 3 years
Peak Period 2 hours 2 hours 2 hours 2 hours 2 hours 2 hours
Lanes 4 4 4 4 4 4
Free Flow Speed 45 mph 45 mph 45 mph 45 mph 45 mph 45 mph
ADT0 6,700 13,800 8,900 18,400 3,300 7,000
ADT1 5,000 10,200 7,300 15,000 6,100 14,300
Length 2.62 miles 2.62 miles 2.12 miles 2.12 miles 2.37 miles 1.3 miles
VOT $13/hour $13/hour $13/hour $13/hour $13/hour $13/hour
VOR 1.6 1.6 1.6 1.6 1.6 1.6
Max V/C 1.4 1.4 1.4 1.4 1.4 1.4
Capacity (per lane) 2000 vph 2000 vph 2000 vph 2000 vph 2000 vph 2000 vph
Fuel Cost $1.00/gallon $1.00/gallon $1.00/gallon $1.00/gallon $1.00/gallon $1.00/gallon
Non-Fuel Costs $.15/mile $.15/mile $.15/mile $.15/mile $.15/mile $.15/mile
K-factor 0.06 0.06 0.06 0.06 0.06 0.06
PDO Acc (Actual) 83 NA 67 NA 18 NA
Injury Acc (Actual) 43 NA 34 NA 22 NA
Fatal Acc (Actual) 0 NA 0 NA 0 NA
Cost/Prop Acc $2,400 $2,400 $2,400 $2,400 $2,400 $2,400
Cost/Injury Acc $61,000 $61,000 $61,000 $61,000 $61,000 $61,000
Cost/Fatal Acc $3,100,000 $3,100,000 $3,100,000 $3,100,000 $3,100,000 $3,100,000
Real Discount Rate 0 0 0 0 0 0
Days In Year 365 365 365 365 365 365

A-11
Table 6: Model Inputs—CAL-B/C Analysis of Average Parallel Facilities and Project Segment
Input Segment A & B Segment A & B Segment C Segment C
1999 2020 1999 2020
Project Type Bypass Bypass Bypass Bypass
Construction Period 3 years 3 years 3 years 3 years
Peak Period 2 hours 2 hours 2 hours 2 hours
Lanes 4 4 4 4
Free Flow Speed 45 mph 45 mph 45 mph 45 mph
ADT0 7,800 16,100 NA NA
ADT1 6,100 14,300 1,700 1,800
Length 2.37 miles 2.37 miles NA 1.3 miles
VOT $13/hour $13/hour NA $13/hour
VOR 1.6 1.6 NA 1.6
Max V/C 1.4 1.4 NA 1.4
Capacity (per lane) 2000 vph 2000 vph NA 2000 vph
Fuel Cost $1.00/gallon $1.00/gallon NA $1.00/gallon
Non-Fuel Costs $.15/mile $.15/mile NA $.15/mile
K-factor 0.06 0.06 NA 0.06
PDO Acc (Actual) 0.7 NA NA NA
Injury Acc (Actual) 1.1 NA NA NA
Fatal Acc (Actual) 0.007 NA NA NA
Cost/Prop Acc $2,400 $2,400 NA $2,400
Cost/Injury Acc $61,000 $61,000 NA $61,000
Cost/Fatal Acc $3,100,000 $3,100,000 NA $3,100,000
Real Discount Rate 0 0 NA 0
Days In Year 365 365 NA 365

A-12
Table 7: Model Inputs—CAL-B/C Analysis of Summed Parallel Facilities and Project Segment
Input Segment A & B Segment A & B Segment C Segment C
1999 2020 1999 2020
Project Type Bypass Bypass Bypass Bypass
Construction Period 3 years 3 years 3 years 3 years
Peak Period 2 hours 2 hours 2 hours 2 hours
Lanes 8 8 4 4
Free Flow Speed 45 mph 45 mph 45 mph 45 mph
ADT0 15,600 32,200 NA NA
ADT1 6,100 14,300 9,500 17,900
Length 2.37 miles 2.37 miles NA 1.3 miles
VOT $13/hour $13/hour NA $13/hour
VOR 1.6 1.6 NA 1.6
Max V/C 1.4 1.4 NA 1.4
Capacity (per lane) 2000 vph 2000 vph NA 2000 vph
Fuel Cost $1.00/gallon $1.00/gallon NA $1.00/gallon
Non-Fuel Costs $.15/mile $.15/mile NA $.15/mile
K-factor 0.06 0.06 NA 0.06
PDO Acc (Actual) 0.7 NA NA NA
Injury Acc (Actual) 1.1 NA NA NA
Fatal Acc (Actual) 0.007 NA NA NA
Cost/Prop Acc $2,400 $2,400 NA $2,400
Cost/Injury Acc $61,000 $61,000 NA $61,000
Cost/Fatal Acc $3,100,000 $3,100,000 NA $3,100,000
Real Discount Rate 0 0 NA 0
Days In Year 365 365 NA 365
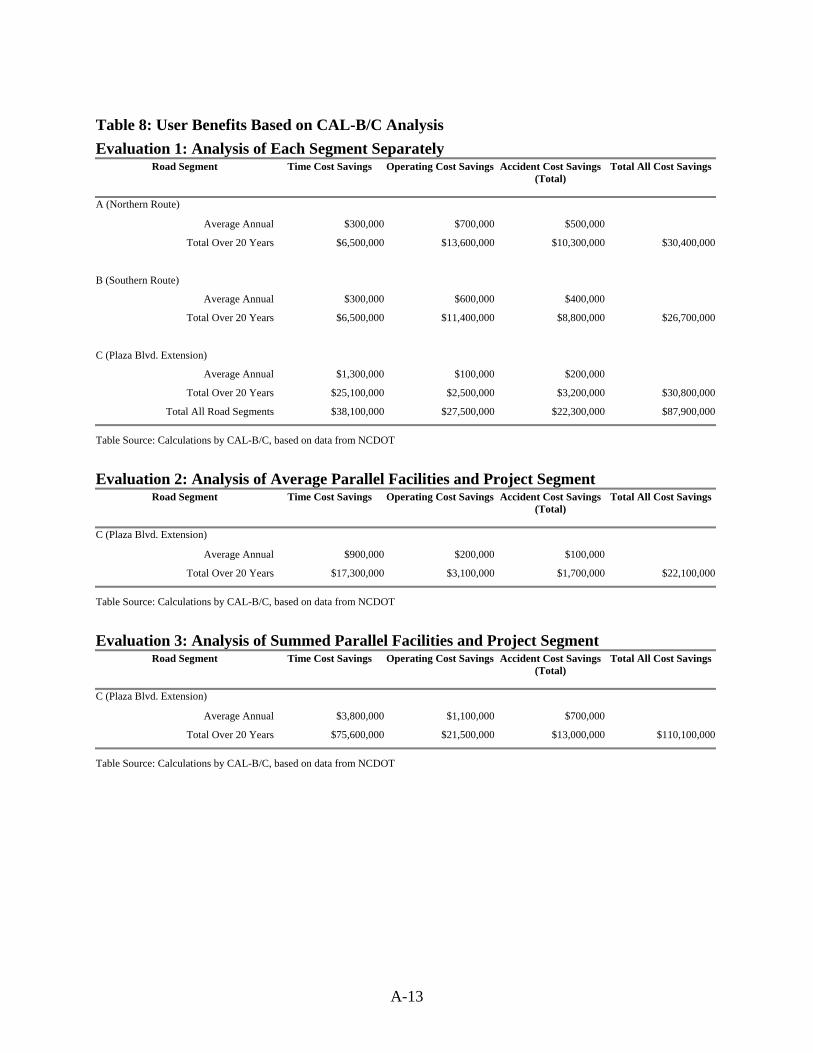
A-13
Table 8: User Benefits Based on CAL-B/C Analysis
Evaluation 1: Analysis of Each Segment Separately Road Segment Time Cost Savings Operating Cost Savings Accident Cost Savings
(Total) Total All Cost Savings
A (Northern Route)
Average Annual $300,000 $700,000 $500,000
Total Over 20 Years $6,500,000 $13,600,000 $10,300,000 $30,400,000
B (Southern Route)
Average Annual $300,000 $600,000 $400,000
Total Over 20 Years $6,500,000 $11,400,000 $8,800,000 $26,700,000
C (Plaza Blvd. Extension)
Average Annual $1,300,000 $100,000 $200,000
Total Over 20 Years $25,100,000 $2,500,000 $3,200,000 $30,800,000
Total All Road Segments $38,100,000 $27,500,000 $22,300,000 $87,900,000
Table Source: Calculations by CAL-B/C, based on data from NCDOT
Evaluation 2: Analysis of Average Parallel Facilities and Project Segment Road Segment Time Cost Savings Operating Cost Savings Accident Cost Savings
(Total) Total All Cost Savings
C (Plaza Blvd. Extension)
Average Annual $900,000 $200,000 $100,000
Total Over 20 Years $17,300,000 $3,100,000 $1,700,000 $22,100,000
Table Source: Calculations by CAL-B/C, based on data from NCDOT
Evaluation 3: Analysis of Summed Parallel Facilities and Project Segment Road Segment Time Cost Savings Operating Cost Savings Accident Cost Savings
(Total) Total All Cost Savings
C (Plaza Blvd. Extension)
Average Annual $3,800,000 $1,100,000 $700,000
Total Over 20 Years $75,600,000 $21,500,000 $13,000,000 $110,100,000
Table Source: Calculations by CAL-B/C, based on data from NCDOT