NBER WORKING PAPER SERIES STRATEGIC BARGAINING BEHAVIOR ... · NBER WORKING PAPER SERIES STRATEGIC...
48
NBER WORKING PAPER SERIES STRATEGIC BARGAINING BEHAVIOR, SELF-SERVING BIASES, AND THE ROLE OF EXPERT AGENTS: AN EMPIRICAL STUDY OF FINAL-OFFER ARBITRATION Orley Ashenfelter Gordon B. Dahl Working Paper 11189 http://www.nber.org/papers/w1118 NATIONAL BUREAU OF ECONOMIC RESEARCH 1050 Massachusetts Avenue Cambridge, MA 02138 March 2005 We thank Mark Bils, David Card, Henry Farber, David Lee, Lance Lochner, and Bentley MacLeod for valuable discussions and suggestions. We also thank seminar participants at Brigham Young University, Columbia Business School, University of Arizona, University of British Columbia, University of California at Berkeley, and University of California at Davis for helpful comments. The views expressed herein are those of the author(s) and do not necessarily reflect the views of the National Bureau of Economic Research. © 2005 by Orley Ashenfelter and Gordon B. Dahl. All rights reserved. Short sections of text, not to exceed two paragraphs, may be quoted without explicit permission provided that full credit, including © notice, is given to the source.
Transcript of NBER WORKING PAPER SERIES STRATEGIC BARGAINING BEHAVIOR ... · NBER WORKING PAPER SERIES STRATEGIC...
NBER WORKING PAPER SERIES
STRATEGIC BARGAINING BEHAVIOR, SELF-SERVING BIASES,AND THE ROLE OF EXPERT AGENTS:
AN EMPIRICAL STUDY OF FINAL-OFFER ARBITRATION
Orley AshenfelterGordon B. Dahl
Working Paper 11189http://www.nber.org/papers/w1118
NATIONAL BUREAU OF ECONOMIC RESEARCH1050 Massachusetts Avenue
Cambridge, MA 02138March 2005
We thank Mark Bils, David Card, Henry Farber, David Lee, Lance Lochner, and Bentley MacLeod forvaluable discussions and suggestions. We also thank seminar participants at Brigham Young University,Columbia Business School, University of Arizona, University of British Columbia, University of Californiaat Berkeley, and University of California at Davis for helpful comments. The views expressed herein arethose of the author(s) and do not necessarily reflect the views of the National Bureau of Economic Research.
© 2005 by Orley Ashenfelter and Gordon B. Dahl. All rights reserved. Short sections of text, not to exceedtwo paragraphs, may be quoted without explicit permission provided that full credit, including © notice, isgiven to the source.
Strategic Bargaining Behavior, Self-Serving Biases, and the Role of Expert Agents: An EmpiricalStudy of Final-Offer ArbitrationOrley Ashenfelter and Gordon B. DahlNBER Working Paper No. 11189March 2005JEL No. J5
ABSTRACT
In this paper we study the complete evolution of a final-offer arbitration system used in New Jersey
with data we have systematically collected over the 18-year life of the program. Covering the wages
of police officers and firefighters, this system provides virtually a laboratory setting for the study of
strategic interaction. Our empirical analysis provides convincing evidence that, left alone, the parties
do not construct and present their offers as successfully as when they retain expert agents to assist
them. In principle, expert agents may be helpful to the parties for two different reasons: (a) they may
move the arbitrator to favor their position independently of the facts, or (b) they may help eliminate
inefficiencies in the conduct of strategic behavior. In this paper we construct a model where the agent
may influence outcomes independent of the facts, but where the agent may also improve the
outcomes of the process by moderating any self-serving biases or over-confidence that may have led
to impasse in the first instance. Our data indicate that expert agents may well have had an important
role in moderating self-serving biases early in the history of the system, but that the parties have
slowly evolved to a non-cooperative equilibrium where the use of third-party agents has become
nearly universal and where agents are used primarily to move the fact finder's decisions.
Orley AshenfelterIndustrial Relations SectionFirestone LibraryPrinceton UniversityPrinceton, NJ 08544and [email protected]
Gordon DahlDepartment of EconomicsHarkness 229University of RochesterRochester, NY 14627and [email protected]
1
I. Introduction
Rational arrangements to resolve unproductive disputes are a key determinant of how
well a modern economy operates.1 Yet few empirical studies of field data, designed to test the
functioning of these systems, currently exist. In this paper we study the complete evolution of a
final-offer arbitration system used in New Jersey with data we have systematically collected over
the 18-year life of the program. Covering the wages of police officers and firefighters, this
system was designed by an economist and provides virtually a laboratory setting for the study of
the evolution of strategic interaction.2 It also provides us with an opportunity to characterize with
publicly available data an arbitration system for resolving disputes. The use of arbitration
systems has grown steadily for the resolution of disputes involving divorce and child custody,
securities regulation, international business disputes, and labor contracts (including the setting of
major league baseball salaries), and the design of these systems is still in its infancy. We use
these data both to provide a stylized description of the basic operating characteristics of the
system and to test and estimate a theoretical model of bargainers’ behavior and the role of third
parties (who are typically lawyers) in that behavior.
Our empirical analysis provides convincing evidence that, left alone, the parties do not
construct and present their offers as successfully as when they retain expert agents to assist them.
Apparently, even in this relatively simple bargaining environment, the parties derive considerable
benefits from expert assistance. In principle, expert agents may be helpful to the parties for two
different reasons: (a) they may move the arbitrator to favor their position independently of the
facts, or (b) they may help eliminate inefficiencies in the conduct of strategic behavior. In the
former case, the parties encounter what are the equivalent of prisoners’ dilemma incentives:
despite their cost and the zero sum nature of the game, each party will have an incentive to hire an
agent regardless of what the other party does. In the latter case, however, the parties receive
benefits that lead to higher quality arbitrated outcomes.3 In this paper we construct a model that
permits us to test and estimate the influence of the agent’s role in the arbitration process. We do
this in a model where the agent may influence outcomes independent of the facts, but where the
agent may also improve the outcomes of the process by moderating any self-serving biases or
over-confidence that may have led to the impasse in the first instance. We thus characterize
empirically the role of expert agents as possible moderators of self-serving biases and test for the
1 See Glaeser and Shleifer (2003), Pencavel (1991), Bhagat, Brickley, and Coles (1994), Cutler and Summers (1988), Murphy, Shleifer, and Vishny (1991). 2 See Richard Lester (1984). 3 See especially Bazerman et al (1992) and Gilson and Mnookin (1994).
2
presence of these efficiency-enhancing effects.4 The unique institutional structure we study, and
the longitudinal character of the data we use, provide a unique opportunity to study a key and
unresolved issue in the empirical analysis of strategic behavior.
The data reveal a number of empirical regularities, and some puzzles also. Final-offer
arbitration requires the parties to make binding offers from which an arbitrator, selected in part by
the parties, must make a choice without compromise. First, the data indicate that employer
victory rates, which in early periods were well below the 50 percent that was initially anticipated,
have converged toward that rate over time. Likewise, the difference between the parties’ offers
has tended to decrease over time. Concurrently, the use of third-party agents and lawyers to assist
the parties has increased steadily over time. Coupled with the observed higher victory rates for
parties that retain third-party agents, this suggests that the role of third-party agents may be
critical in the evolution of the system.
To capture these facts we set out a simple model in which arbitrators behave as
statistically exchangeable random variables.5 As in earlier work, our data provide very strong
support for this model of arbitrator behavior, but they also support the finding that arbitrator
behavior is altered to favor the party that is represented by an agent. This leads us to specify a
two-stage game in which each of the parties first decides whether to hire an agent and then
decides a final offer. Characterizing the parties’ offers as a forward-looking Nash equilibrium in
expected utilities, and using some standard approximations to the usual functional forms, leads to
the conclusion that the employer win rate should be close to 50 percent. More generally, the
model implies that the win rate, and the difference between the parties’ offers, should be
approximately independent of whether the parties retain a third-party agent. As we show in a
more general model, deviations from these predictions permit identification of the role of expert
agents in moderating the parties’ self-serving expectations. The key to our ability to test for this
role is the fact that the parties must incorporate their strategic behavior into their final offers, and
the latter become a sufficient statistic for determining the possible efficiency-enhancing role of
expert agents.
This model also has predictions regarding the use of third-party agents, which depends on
the benefits and costs of their use. When benefits are high relative to costs, as we show them to
4 See Mas (2005), Babcock and Olson (1992), Babcock, Loewenstein, Issacharoff, and Camerer (1995), Babcock, Wang, and Loewenstein (1996), and, for a brief survey, Babcock and Loewsenstein (1997). 5 This characterization of arbitrator behavior was first used by Farber and Katz (1979) and Farber (1980), and tested by Ashenfelter and Bloom (1984). Bloom and Cavanagh (1986), Block and Steiber (1987), Farber and Bazerman (1986), and Olson, Dell’Omo, and Jarley (1992) provide evidence on arbitrator behavior and selection. A survey of the evidence on arbitrator behavior is provided by Ashenfelter (1987).
3
be for many of the parties, retaining an agent is a dominant strategy (that is, optimal despite the
other party’s behavior) and the parties may face incentives to hire agents even if, in equilibrium,
they do not improve results. The theory predicts that when dominant strategies are optimal, the
demand for the services of an agent by one party is independent of the demand by the other party.
This hypothesis is easily subject to empirical test with our data.
Despite some anomalies, the empirical results provide convincing evidence for many of
these elementary game theory predictions. First, the estimated payoff matrix for the parties
provides strong evidence that many of the bargaining pairs do face prisoner’s dilemma incentives
each time they bargain. Second, the data indicate that each party’s observed demand function for
agents is independent of the other party’s behavior, which is strong confirmation that the parties
do play dominant strategies. Third, the parties have slowly evolved to the equilibrium predicted
by the non-cooperative behavior that prisoner’s dilemma incentives create, and the use of third-
party agents has become nearly universal. Finally, there is considerable evidence that third-party
agents have, at least for employers, moderated self-serving expectations, and thus increased
employer wage offers and their win rates.
The paper is structured as follows: We begin with a description of our data and its
collection. We then set out our theoretical model and its testable implications. Our empirical
results are described in a sequence that begins with tests for dominant strategy play in the hiring
of agents, continues with evidence on arbitrator behavior, and concludes with tests for the role of
third-party agents in moderating the expectations of the parties.
II. Data
The history behind the development of public sector arbitration in New Jersey begins in
1968, when public sector employees were granted the right to engage in collective bargaining, but
strikes were forbidden. While this restriction guaranteed a community police and fire protection,
it also led to drawn-out negotiations that often spilled over from one budget year to the next. To
ensure that contracts were current, the New Jersey Fire and Police Arbitration Act was approved
in May 1977.
The Act specifies that police and fire department workers, and their municipal employers,
must start the collective bargaining process at least 120 days before a contract expires. If an
agreement is not reached by 60 days before this date, the two parties must begin formal
arbitration proceedings. While conventional arbitration can be invoked if both sides agree, the
terminal procedure by law is final-offer arbitration. In contrast to conventional arbitration, where
the arbitrator often specifies a salary increase somewhere in between the proposals of the two
4
sides, with final-offer arbitration, the arbitrator is limited to choosing either the final salary
proposal of the municipality or the union.
The Act also established the New Jersey Public Employment Relations Commission
(PERC), whose function is to impartially administer the Act. PERC assigns arbitrators to cases
by giving each side the same list of seven arbitrators. Each side is allowed to eliminate three of
the names, and must rank the remaining four. The arbitrator with the highest combined rank is
given the job of listening to the arguments of both parties and deciding the case. The parties
involved in the dispute split the cost of the arbitrator, whose fee schedule is set by PERC. Further
details on the 1977 Act can be found in Bloom (1980).
In 1996, the Act was amended so that conventional arbitration became the default
mechanism if the sides could not agree on a procedure. In addition, arbitrator selection changed,
so that a computer program now randomly picks a name from PERC’s approved list of
arbitrators. While it would be interesting to study what effect these changes have had on the use
of arbitration and its outcomes, we have chosen to limit our study to the earlier period when the
system was unchanged.
We collected data for the period 1978 to 1995, when final-offer arbitration was the
default procedure and the parties had considerable input in choosing the arbitrator. PERC keeps a
copy of the legally binding docket describing the arbitration proceedings for each case. These
dockets typically record the final offers of the two parties, the arbitrator’s award, who attended
the hearings, relevant dates, and summaries of the arguments. We obtained photocopies of the
dockets for all arbitrated disputes handled by PERC in New Jersey for our time period. To ensure
the quality of the data, each case was read and the data collected using a standard form
independently by two readers. Any discrepancies were then re-checked by a third individual to
resolve any errors. For this time period, we collected and entered data on 896 final-offer
arbitration cases from arbitrators’ written dockets.
Table 1 provides summary statistics on the cases resolved by final-offer arbitration in
New Jersey from 1978 to 1995. Approximately three-fourths of the cases involve a dispute over
pay raises, and a majority of the cases involve police officers.6 The data show that arbitrators
have typically been more likely to select the union’s offer than the employer’s offer, with
employers winning about 40 percent of the cases submitted to arbitration. This result is
6 There are relatively few fire units involved in arbitration since smaller localities in New Jersey typically have volunteer fire departments. The “other” category for “Type of Unit” in Table 1 refers to a small number of bargaining units, such as nurses or educators, who were not required to use the arbitration system but were permitted to utilize the system set up by PERC.
5
inconsistent with the notion that the equilibrium outcome in this dispute resolution system is a 50
percent victory rate. Union bargainers are far more likely to enlist the assistance of a professional
agent to help select the arbitrator, prepare the case, and present this case to the arbitrator. Unions
employ third-party agents in 80 percent of the arbitration cases compared to only 60 percent for
employers. Agents are most often lawyers, but they can also be labor relations specialists,
professors, accountants, or other professionals.7
Many variables are common to both the employer and union and are likely to affect the
costs of obtaining representation. One of the most important characteristics affecting the cost of
retaining an agent is the size of the bargaining unit. For example, for a large bargaining unit the
monetary cost of retaining an agent on a per-person basis will be smaller than for a small
bargaining unit. We were able to collect information on the size of the bargaining unit for
approximately half of the sample. From these data we were able to confirm that the population of
the municipality, which we collected for every bargaining unit from the 1980 U.S. Decennial
Census, is a good proxy for the number of employees.8 The number of years covered by the
award likely influences the benefit of hiring an agent compared to the costs in a similar manner.
Only one-fifth of arbitrated cases cover a one-year contract, while the majority of cases being
arbitrated cover a two-year period. As we shall see, these variables all affect the likelihood that
an agent is retained in the way expected.
How do agents affect the arbitration process and do the parties learn and adapt to the
incentives of the system of final-offer arbitration over time?
We begin by looking at whether hiring an agent corresponds to a greater probability of
success in arbitration. Table 2 reveals that by employing an agent, the parties to a dispute
increase the chance their final offer will be selected by around 22 to 30 percent. The win rate of
the employer is around 40 percent when neither side uses an agent, a rate that is not statistically
significantly different from the win rate when both sides use agents. Each side greatly increases
the chance that their offer will be selected by hiring an agent, however, when both sides pay for
costly agents, the probability of victory is roughly the same as when neither side hires an agent.
If the parties to a dispute did not change their final offers when hiring agents, this table could be
interpreted as evidence that the parties face a prisoner’s dilemma: hiring an agent pays off, but if
7 The criteria we use to label someone as an agent is a representative who handled at least two arbitrated disputes for at least two different unions/municipalities in the period spanned by the data. This definition excludes municipal staff members or full-time union lawyers who are not third-party specialists in labor disputes. 8 A regression of the number of uniformed employees on the population of a municipality and its square has an R-squared of 0.58. This regression does not include cases involving county or state employees.
6
both parties engage in this behavior they are not as well off as if neither party did.
However, the parties will generally change their final offers in response to the hiring of
agents, since they care not just about winning but also the awarded wage increase. Table 3
displays the difference in the final offers of the parties as a function of agent use. While the wage
offers of each side will be examined in more detail below, Table 3 suggests that employer agents
substantially moderate final offers. The median difference in offers falls from over two
percentage points to a little over 1.5 percentage points when the employer hires an agent.
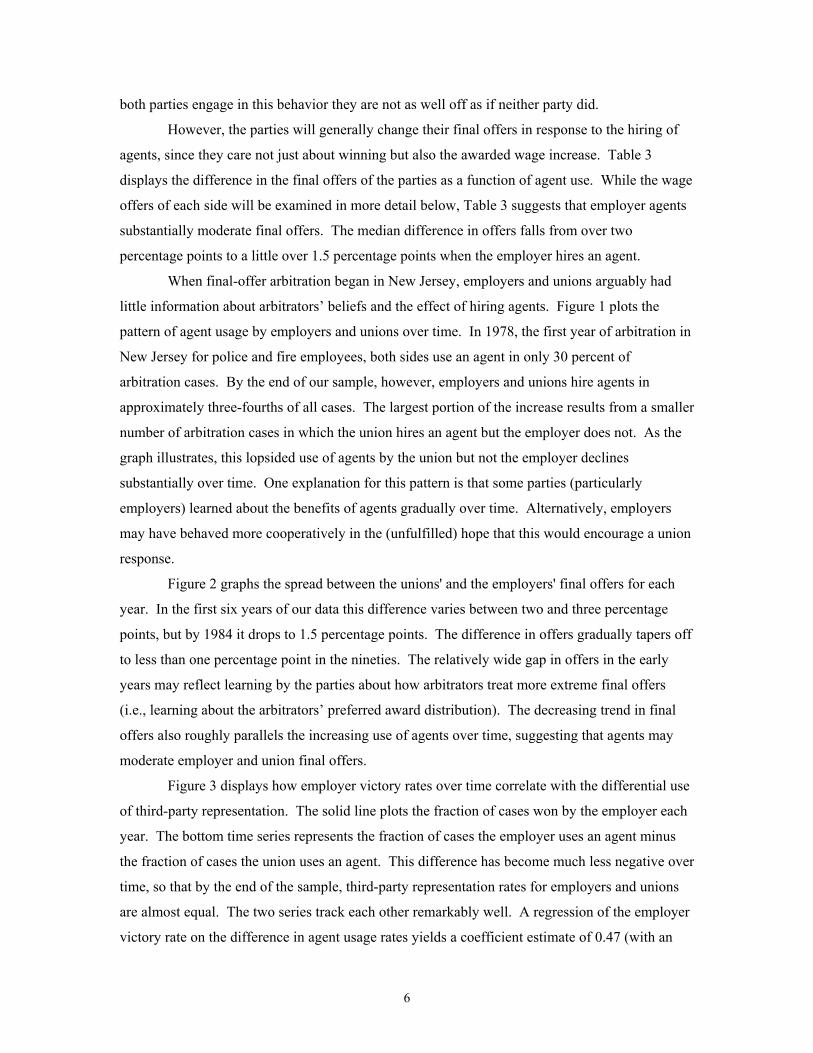
When final-offer arbitration began in New Jersey, employers and unions arguably had
little information about arbitrators’ beliefs and the effect of hiring agents. Figure 1 plots the
pattern of agent usage by employers and unions over time. In 1978, the first year of arbitration in
New Jersey for police and fire employees, both sides use an agent in only 30 percent of
arbitration cases. By the end of our sample, however, employers and unions hire agents in
approximately three-fourths of all cases. The largest portion of the increase results from a smaller
number of arbitration cases in which the union hires an agent but the employer does not. As the
graph illustrates, this lopsided use of agents by the union but not the employer declines
substantially over time. One explanation for this pattern is that some parties (particularly
employers) learned about the benefits of agents gradually over time. Alternatively, employers
may have behaved more cooperatively in the (unfulfilled) hope that this would encourage a union
response.
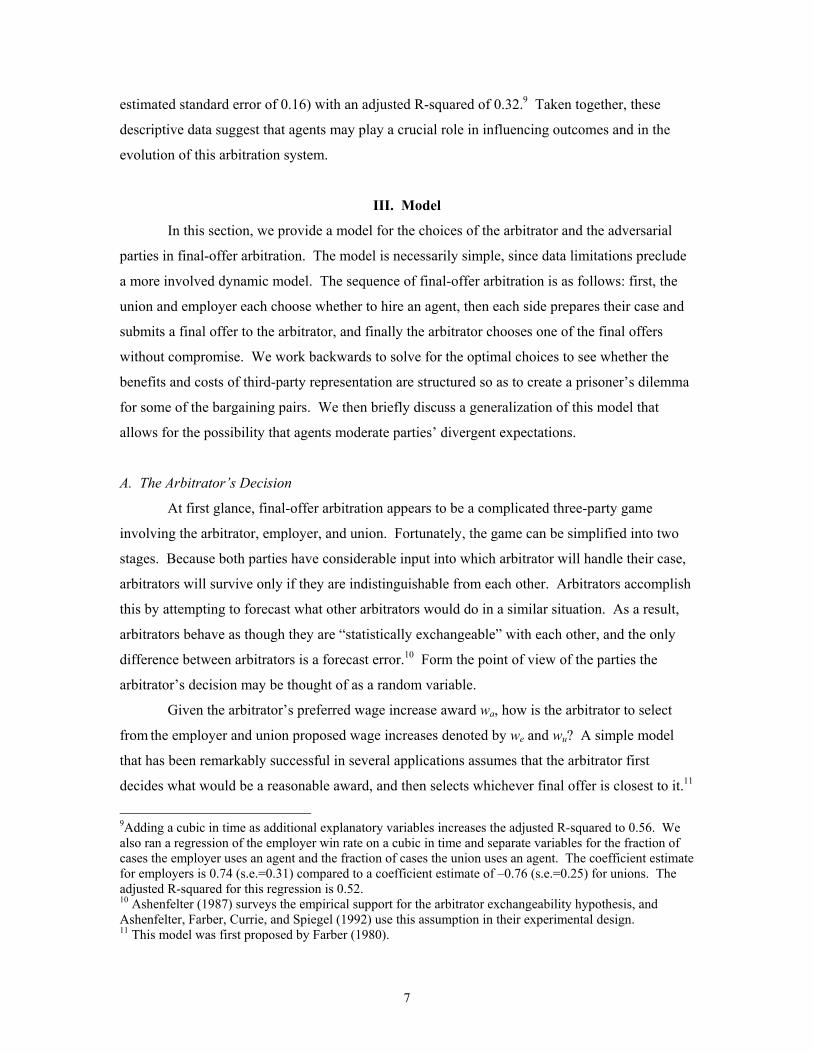
Figure 2 graphs the spread between the unions' and the employers' final offers for each
year. In the first six years of our data this difference varies between two and three percentage
points, but by 1984 it drops to 1.5 percentage points. The difference in offers gradually tapers off
to less than one percentage point in the nineties. The relatively wide gap in offers in the early
years may reflect learning by the parties about how arbitrators treat more extreme final offers
(i.e., learning about the arbitrators’ preferred award distribution). The decreasing trend in final
offers also roughly parallels the increasing use of agents over time, suggesting that agents may
moderate employer and union final offers.
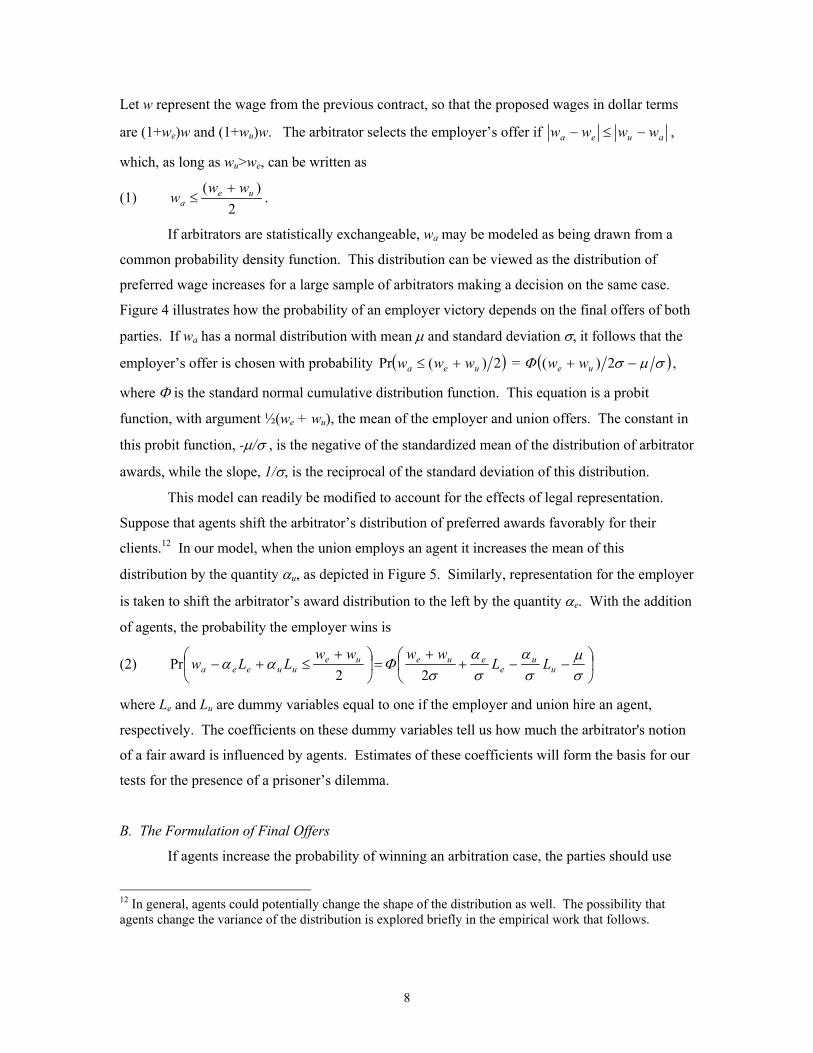
Figure 3 displays how employer victory rates over time correlate with the differential use
of third-party representation. The solid line plots the fraction of cases won by the employer each
year. The bottom time series represents the fraction of cases the employer uses an agent minus
the fraction of cases the union uses an agent. This difference has become much less negative over
time, so that by the end of the sample, third-party representation rates for employers and unions
are almost equal. The two series track each other remarkably well. A regression of the employer
victory rate on the difference in agent usage rates yields a coefficient estimate of 0.47 (with an
7
estimated standard error of 0.16) with an adjusted R-squared of 0.32.9 Taken together, these
descriptive data suggest that agents may play a crucial role in influencing outcomes and in the
evolution of this arbitration system.
III. Model
In this section, we provide a model for the choices of the arbitrator and the adversarial
parties in final-offer arbitration. The model is necessarily simple, since data limitations preclude
a more involved dynamic model. The sequence of final-offer arbitration is as follows: first, the
union and employer each choose whether to hire an agent, then each side prepares their case and
submits a final offer to the arbitrator, and finally the arbitrator chooses one of the final offers
without compromise. We work backwards to solve for the optimal choices to see whether the
benefits and costs of third-party representation are structured so as to create a prisoner’s dilemma
for some of the bargaining pairs. We then briefly discuss a generalization of this model that
allows for the possibility that agents moderate parties’ divergent expectations.
A. The Arbitrator’s Decision
At first glance, final-offer arbitration appears to be a complicated three-party game
involving the arbitrator, employer, and union. Fortunately, the game can be simplified into two
stages. Because both parties have considerable input into which arbitrator will handle their case,
arbitrators will survive only if they are indistinguishable from each other. Arbitrators accomplish
this by attempting to forecast what other arbitrators would do in a similar situation. As a result,
arbitrators behave as though they are “statistically exchangeable” with each other, and the only
difference between arbitrators is a forecast error.10 Form the point of view of the parties the
arbitrator’s decision may be thought of as a random variable.
Given the arbitrator’s preferred wage increase award wa, how is the arbitrator to select
from the employer and union proposed wage increases denoted by we and wu? A simple model
that has been remarkably successful in several applications assumes that the arbitrator first
decides what would be a reasonable award, and then selects whichever final offer is closest to it.11
9Adding a cubic in time as additional explanatory variables increases the adjusted R-squared to 0.56. We also ran a regression of the employer win rate on a cubic in time and separate variables for the fraction of cases the employer uses an agent and the fraction of cases the union uses an agent. The coefficient estimate for employers is 0.74 (s.e.=0.31) compared to a coefficient estimate of –0.76 (s.e.=0.25) for unions. The adjusted R-squared for this regression is 0.52. 10 Ashenfelter (1987) surveys the empirical support for the arbitrator exchangeability hypothesis, and Ashenfelter, Farber, Currie, and Spiegel (1992) use this assumption in their experimental design. 11 This model was first proposed by Farber (1980).
8
Let w represent the wage from the previous contract, so that the proposed wages in dollar terms
are (1+we)w and (1+wu)w. The arbitrator selects the employer’s offer if auea wwww −≤− ,
which, as long as wu>we, can be written as
(1) 2
)( uea
www
+≤ .
If arbitrators are statistically exchangeable, wa may be modeled as being drawn from a
common probability density function. This distribution can be viewed as the distribution of
preferred wage increases for a large sample of arbitrators making a decision on the same case.
Figure 4 illustrates how the probability of an employer victory depends on the final offers of both
parties. If wa has a normal distribution with mean µ and standard deviation σ, it follows that the
employer’s offer is chosen with probability ( )2)(Pr uea www +≤ = ( )σµσΦ −+ 2)( ue ww ,
where Φ is the standard normal cumulative distribution function. This equation is a probit
function, with argument ½(we + wu), the mean of the employer and union offers. The constant in
this probit function, -µ/σ , is the negative of the standardized mean of the distribution of arbitrator
awards, while the slope, 1/σ, is the reciprocal of the standard deviation of this distribution.
This model can readily be modified to account for the effects of legal representation.
Suppose that agents shift the arbitrator’s distribution of preferred awards favorably for their
clients.12 In our model, when the union employs an agent it increases the mean of this
distribution by the quantity αu, as depicted in Figure 5. Similarly, representation for the employer
is taken to shift the arbitrator’s award distribution to the left by the quantity αe. With the addition
of agents, the probability the employer wins is
(2)
−−+
+=
+≤+−
σµ
σα
σα
σΦαα u
ue
eueueuueea LL
wwwwLLw
22Pr
where Le and Lu are dummy variables equal to one if the employer and union hire an agent,
respectively. The coefficients on these dummy variables tell us how much the arbitrator's notion
of a fair award is influenced by agents. Estimates of these coefficients will form the basis for our
tests for the presence of a prisoner’s dilemma.
B. The Formulation of Final Offers
If agents increase the probability of winning an arbitration case, the parties should use
12 In general, agents could potentially change the shape of the distribution as well. The possibility that agents change the variance of the distribution is explored briefly in the empirical work that follows.
9
this information in formulating their final offers. In choosing a final offer, each side trades off
the benefit of a larger wage increase (or decrease) with the probability that their offer will be
selected. Expected utility as a function of the final offers and legal representation for the
employer and union are respectively
(3) ])1[()1(])1[(),,,( wLcwUPwLcwPULLwwEU eeueeeueue ++−+++=
(4) ])1[()1(])1[(),,,( wLcwVPwLcwPVLLwwEV uuuuueueue −+−+−+=
where P is the probability that the arbitrator will choose the employer’s offer (as described in
equation (2)), U(⋅) and V(⋅) are the employer’s and union’s utility functions, and ce and cu are the
costs of hiring an agent for the employer and union. We approximate the utility of the parties by
constant absolute risk aversion (CARA) utility functions, with U(x)=-eγx and V(x)=-e-γx. The first
order conditions for utility maximization with respect to we and wu are
(5) 0)()( =−−∂∂ wewe
ewewewuwe
ewePee
wP γγγ γ
(6) 0))(1()( =−+−∂∂ −−− wuwu
uwewuwuwu
uwePee
wP γγγ γ .
In a Nash equilibrium these equations must be satisfied simultaneously. Noting that the
arbitrator treats the wage offers of the parties symmetrically, after some algebra, equations (5)
and (6) jointly imply that each side wins approximately fifty percent of the time in equilibrium.
The surprising feature of this prediction is that it holds for a reasonable range of risk aversion
parameters for the employer and union (see Appendix).
It is now easy to show that we have the following expressions for the final wage offers of
the employer and union:
(7) )0(2ϕ
σααµ −+−≈ uueee LLw
(8) )0(2ϕ
σααµ ++−≈ uueeu LLw
where ϕ(0) is the normal pdf evaluated at zero. Note that these equilibrium final offers are now a
function only of agent use and the parameters associated with the arbitrator’s distribution. In the
limiting case of risk neutrality, no approximations are necessary and equations (7) and (8) hold as
equalities. A more detailed derivation of the results in this section and a discussion of the
accuracy of the approximation can be found in the Appendix.
10
C. The Incentives to Hire an Agent
When deciding whether to hire an agent, each side trades off the benefit of legal
representation with the cost. Benefits are captured by αe and αu, the expected shifts in the
arbitrator’s distribution of preferred awards. Costs, previously denoted as ce and cu, should be
interpreted broadly and could include agent fees as well as the “ease” with which representation
can be obtained. To facilitate comparison to the benefits, costs are measured as the proportion
that legal expenses are of the old wage bill (i.e., the old wage multiplied by the number of
employees).
In general, whether the benefits of hiring an agent are greater than the costs depends on
what the other side does. However, in the current model where the parties have dominant
strategies that is not the case. For the union, the benefit and cost of hiring an agent is independent
of whether the employer hires an agent and visa versa. This is a restriction that can be tested
empirically.
In equilibrium, the expressions for expected utility based on equations (3) and (4) and
CARA utility functions can now be expressed solely as functions of legal representation. After a
normalization of the utility functions (using positive affine transformations) it can be shown that
(9) eeuueeue LcLLLLEU −−≈ αα),(*
(10) uuuueeue LcLLLLEV −+−≈ αα),(*
where * indicates that the utility function has been normalized. In the limiting case of risk
neutrality for both parties, these expressions do not involve any approximations, but are exact.
The derivation of these equations can be found in the Appendix. It is now a simple matter to
calculate optimal agent use. As legal representation is a dichotomous choice for the employer
and union, there are four possible cases to consider when calculating expected utility.
Comparisons of these values will indicate when the optimal strategy involves hiring an agent.
To better understand when prisoner’s dilemma incentives arise in the framework just
developed, it is useful to construct the payoff matrix as a function of legal representation. Table 4
displays expected utility based on equations (9) and (10). The upper right hand corner to the
matrix in Table 4 contains the payoffs to the employer (first entry) and the union (second entry)
as calculated for the case where the union retains an agent and the employer does not. The
payoffs are expressed relative to the case where neither party retains an agent, where the payoffs
in this latter case have been normalized to zero. The same type of analysis easily fills in the
remaining parts of the payoff matrix.
In the model, each party hires an agent if the benefits exceed the costs. In terms of the
11
payoff matrix, it is easy to see the employer hires an agent if αe-ce>0 and the union hires an agent
if αu-cu>0. In other words, each side chooses to hire an agent if the percentage point shift in the
mean of the arbitrator’s preferred wage distribution exceeds the cost expressed as a percentage of
the old wage.
The payoff matrix implies the union has a dominant strategy to hire an agent if αu-cu>0,
since then it pays for the union to retain an agent regardless of what the employer does. For
example, if the employer does not retain an agent, the union receives an expected wage increase
of αu-cu, which is greater than 0. (The payoff αu-cu is called “the temptation” in the extensive
literature on the prisoner’s dilemma.) Likewise, if the employer retains an agent, the union is
certainly better off doing so also since -cu>-αu. (The quantity -αe is called the “sucker’s payoff”!)
It is easy to see that when αe-ce>0, precisely the same reasoning applies to the employer’s
choices. In this case, the employer is also better off employing an agent regardless of what the
union does.
The presence of dominant strategies does not ensure a prisoner’s dilemma, however. It
must also be the case that the payoffs when neither side hires an agent exceed the payoffs when
both sides hire an agent. This will be the case when αe-αu-ce<0 and αu-αe-cu<0, since both parties
would clearly be better off if they could agree not to hire agents, even though noncooperation is
the dominant strategy. If the benefits to hiring an agent are symmetric (i.e., αu=αe), the payoff
matrix simplifies and the existence of a dominant strategy implies the prisoner’s dilemma. With
symmetric benefits, if the union and the employer do what is in their individual best interests they
both retain agents and spend cu and ce, respectively. However, the arbitration results are precisely
the same as what would have occurred if neither union nor employer had retained costly agents.
The private demand for legal services generated in this way is clearly socially inefficient. This
paper tests for prisoner’s dilemma incentives by (1) testing for the presence of dominant strategy
play, and (2) estimating the parameters αu and αe.
Before proceeding, notice this setup easily explains why we might observe some
bargaining pairs in each of the cells of Table 4. If the costs are too expensive compared to the
benefits some unions and employers will have dominant strategies that imply they do not retain
agents. For example, for a small unit with only 2 or 3 employees, the benefit of legal
representation may not be worth the cost. It is important to remember that not all units will find
themselves in a prisoner’s dilemma under our setup. Only those bargaining pairs who satisfy the
conditions in the lower right hand corner of Table 4 face prisoner’s dilemma incentives.
12
D. Biased Expectations and the Moderating Effect of Agents
There are two immediate predictions of the model developed above: (i) the employer win
rate should be approximately 50 percent, independent of the use of agents, and (ii) the difference
in the final wage offers should not vary (to first order) based on legal representation. These
predictions can quickly be examined by referring back to Tables 2 and 3. In contrast to the
model, the data reveal that the employer win rate is not close to 50 percent and that the win rate
depends heavily on whether the parties hire agents. Furthermore, the difference in final offers
drops by 25 percent when the employer hires an agent.
Other studies have also found large effects due to third-party agents on the probability of
winning.13 One contribution of this paper is to show that the reduced-form effects of agents
found in these empirical studies may not be due simply to differences in risk aversion or
prisoner’s dilemma incentives. Our model is based on CARA utility functions with potentially
different coefficients of risk aversion; however, even with a different class of utility functions (for
example, CRRA), the large differential win rates and narrowing spread of final offers as a
function of legal representation is difficult to reconcile with the rest of the model.14 Other forces
must also play a role in shaping the final offers or demands of the parties.
A simple extension to the model can describe the patterns observed in Tables 2 and 3 and
also provide a test of whether agents simply influence the arbitrator or whether they also assist the
parties in constructing and convincing them to present more efficient offers. In order to motivate
the analysis it is useful to first ask why the parties to a dispute end up in arbitration in the first
place. Since arbitration is costly in terms of money, time, and labor-management relations, it
would seem to be in the best interests of both parties to agree to a settlement. One leading
explanation for bargaining impasse is that the parties have divergent and overly optimistic
expectations about the arbitrated outcome.15 With such self-serving biases, negotiations are more
likely to fail and the parties will be forced into arbitration. One useful contribution of agents may
be that they moderate the unrealistic expectations of their clients. To make this analysis concrete,
13 See Adler, Hensler, and Nelson (1983), Block and Stieber (1987), Mnookin et al (1990) and Wagar (1994). 14 For example, consider constant relative risk aversion utility functions of the form V(x)=(x1-λ-1)/(1-λ) when λ≠1 and V(x)=ln(x) when λ=1. Simple calculations reveal that for typical values of proposed wage increases and agent costs, the pattern of win rates in the four boxes of Table 2 cannot be generated by any reasonable pair of risk aversion parameters for employers and unions. The reason is that it is difficult to have agents symmetrically increase win rates for employers and unions when only one side hires an agent and at the same time have unions winning 60 percent of the time when neither side hires agents or both sides hire agents. 15 See Babcock et al (1995), Babcock and Olson (1992), Farber and Bazerman (1989), and Farber and Katz (1979). See McCall (1991) for an alternative model.
13
suppose the two parties have divergent beliefs about of the mean of the arbitrator’s preferred
award distribution. Beliefs about the means for the employer and union are ee δµµ −= and
uu δµµ += , where δ is the amount of the bias and the subscripts e and u indicate employer and
union variables respectively.
If agents help their clients understand what is reasonable in a given case, they change
beliefs so that eeee Lβδµµ +−= and uuuu Lβδµµ −+= . This means that there are now two
potential advantages to hiring an agent. As before, agents shift the distribution of the arbitrator’s
preferred award (by αe or αu), but now they also provide clients with potentially more accurate
(i.e., less biased) information about the location of the arbitrator’s award distribution.
If beliefs about the arbitrator’s award distribution are formulated in this manner, then it is
easy to show that the equations for the final offers of the two sides become
(7′) )0(2
)(ϕσαβαδµ −++−+−≈ uueeeee LLw
(8′) )0(2
)(ϕσβααδµ +−+−+≈ uuueeuu LLw .
The probability of an employer victory is no longer necessarily 50 percent in equilibrium. In the
absence of agents, the party with less bias will win more often, since their wage offer will be
closer to the arbitrator’s preferred award on average. Moreover, agents have the potential to
moderate final offers, and hence increase the probability their client will win the case.16
It is important to recognize that even when beliefs are biased (so that ee δµµ −= and
uu δµµ += differ from µ), the perceived costs and benefits to hiring an agent are the same as
before. Each side may have unrealistic views about the mean of the arbitrator’s preferred award
distribution, but the perceived payoff to hiring an agent remains exactly as specified in equations
(9) and (10). The perceived payoffs to legal representation continue to be captured by Table 4,
and some parties will continue to find themselves facing prisoner’s dilemma incentives. After
hiring an agent the actual payoff to legal representation changes, since agents moderate
unrealistic beliefs. This benefit becomes apparent only after the employer or union chooses to
hire an agent.
16 An alternative motivation for equations (7′) and (8′) is that agents care more about winning a case than the wage increase, since information on win rates is more easily conveyed to prospective clients. To increase the probability of winning, agents may try to convince their clients to scale back their final offers.
14
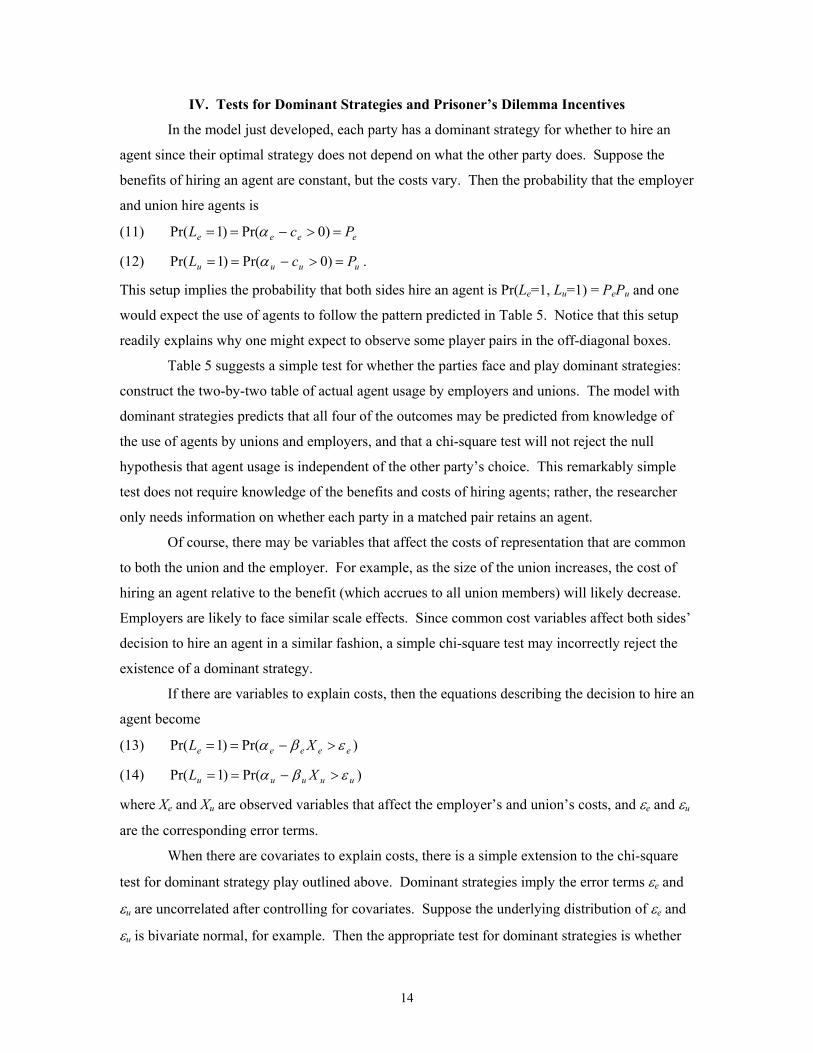
IV. Tests for Dominant Strategies and Prisoner’s Dilemma Incentives
In the model just developed, each party has a dominant strategy for whether to hire an
agent since their optimal strategy does not depend on what the other party does. Suppose the
benefits of hiring an agent are constant, but the costs vary. Then the probability that the employer
and union hire agents is
(11) eeee PcL =>−== )0Pr()1Pr( α
(12) uuuu PcL =>−== )0Pr()1Pr( α .
This setup implies the probability that both sides hire an agent is Pr(Le=1, Lu=1) = PePu and one
would expect the use of agents to follow the pattern predicted in Table 5. Notice that this setup
readily explains why one might expect to observe some player pairs in the off-diagonal boxes.
Table 5 suggests a simple test for whether the parties face and play dominant strategies:
construct the two-by-two table of actual agent usage by employers and unions. The model with
dominant strategies predicts that all four of the outcomes may be predicted from knowledge of
the use of agents by unions and employers, and that a chi-square test will not reject the null
hypothesis that agent usage is independent of the other party’s choice. This remarkably simple
test does not require knowledge of the benefits and costs of hiring agents; rather, the researcher
only needs information on whether each party in a matched pair retains an agent.
Of course, there may be variables that affect the costs of representation that are common
to both the union and the employer. For example, as the size of the union increases, the cost of
hiring an agent relative to the benefit (which accrues to all union members) will likely decrease.
Employers are likely to face similar scale effects. Since common cost variables affect both sides’
decision to hire an agent in a similar fashion, a simple chi-square test may incorrectly reject the
existence of a dominant strategy.
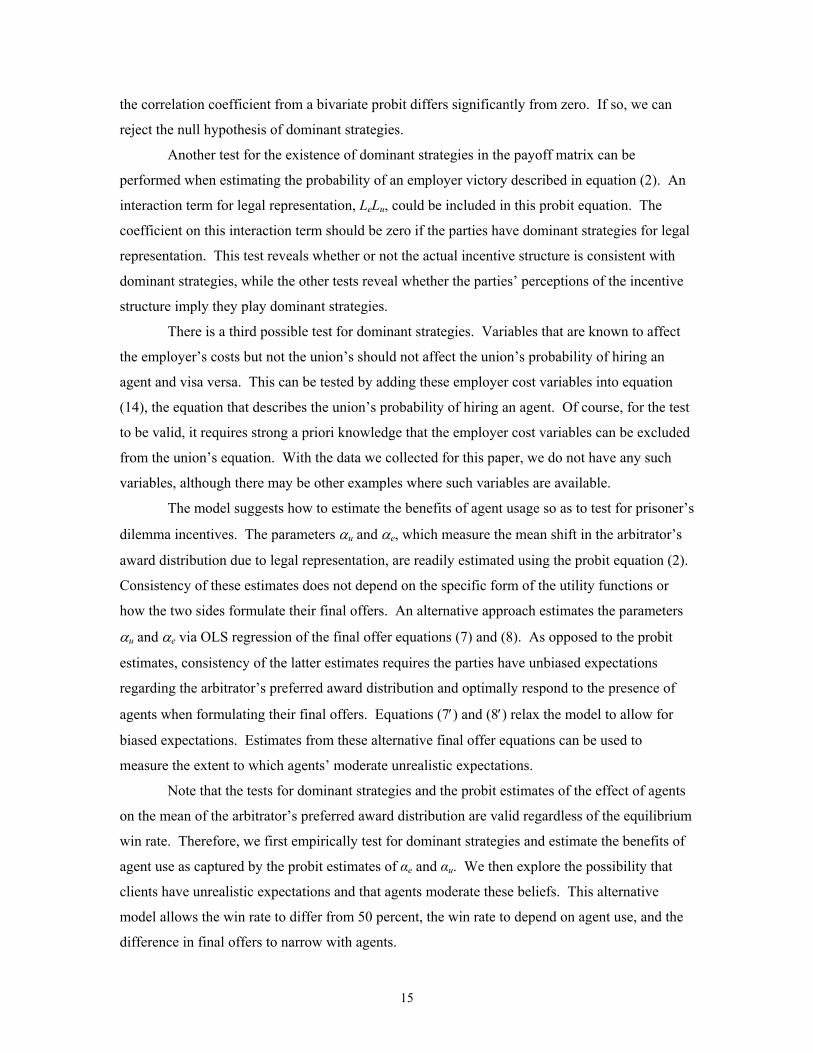
If there are variables to explain costs, then the equations describing the decision to hire an
agent become
(13) )Pr()1Pr( eeeee XL εβα >−==
(14) )Pr()1Pr( uuuuu XL εβα >−==
where Xe and Xu are observed variables that affect the employer’s and union’s costs, and εe and εu
are the corresponding error terms.
When there are covariates to explain costs, there is a simple extension to the chi-square
test for dominant strategy play outlined above. Dominant strategies imply the error terms εe and
εu are uncorrelated after controlling for covariates. Suppose the underlying distribution of εe and
εu is bivariate normal, for example. Then the appropriate test for dominant strategies is whether
15
the correlation coefficient from a bivariate probit differs significantly from zero. If so, we can
reject the null hypothesis of dominant strategies.
Another test for the existence of dominant strategies in the payoff matrix can be
performed when estimating the probability of an employer victory described in equation (2). An
interaction term for legal representation, LeLu, could be included in this probit equation. The
coefficient on this interaction term should be zero if the parties have dominant strategies for legal
representation. This test reveals whether or not the actual incentive structure is consistent with
dominant strategies, while the other tests reveal whether the parties’ perceptions of the incentive
structure imply they play dominant strategies.
There is a third possible test for dominant strategies. Variables that are known to affect
the employer’s costs but not the union’s should not affect the union’s probability of hiring an
agent and visa versa. This can be tested by adding these employer cost variables into equation
(14), the equation that describes the union’s probability of hiring an agent. Of course, for the test
to be valid, it requires strong a priori knowledge that the employer cost variables can be excluded
from the union’s equation. With the data we collected for this paper, we do not have any such
variables, although there may be other examples where such variables are available.
The model suggests how to estimate the benefits of agent usage so as to test for prisoner’s
dilemma incentives. The parameters αu and αe, which measure the mean shift in the arbitrator’s
award distribution due to legal representation, are readily estimated using the probit equation (2).
Consistency of these estimates does not depend on the specific form of the utility functions or
how the two sides formulate their final offers. An alternative approach estimates the parameters
αu and αe via OLS regression of the final offer equations (7) and (8). As opposed to the probit
estimates, consistency of the latter estimates requires the parties have unbiased expectations
regarding the arbitrator’s preferred award distribution and optimally respond to the presence of
agents when formulating their final offers. Equations (7′) and (8′) relax the model to allow for
biased expectations. Estimates from these alternative final offer equations can be used to
measure the extent to which agents’ moderate unrealistic expectations.
Note that the tests for dominant strategies and the probit estimates of the effect of agents
on the mean of the arbitrator’s preferred award distribution are valid regardless of the equilibrium
win rate. Therefore, we first empirically test for dominant strategies and estimate the benefits of
agent use as captured by the probit estimates of αe and αu. We then explore the possibility that
clients have unrealistic expectations and that agents moderate these beliefs. This alternative
model allows the win rate to differ from 50 percent, the win rate to depend on agent use, and the
difference in final offers to narrow with agents.
16
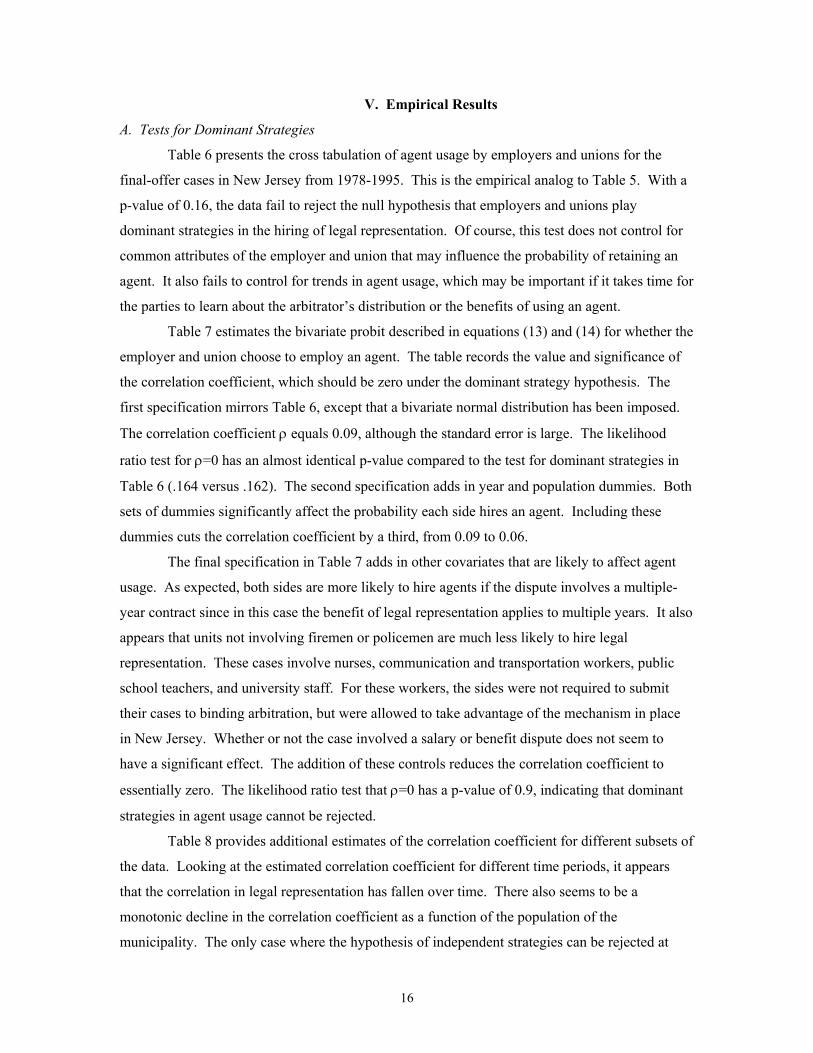
V. Empirical Results
A. Tests for Dominant Strategies
Table 6 presents the cross tabulation of agent usage by employers and unions for the
final-offer cases in New Jersey from 1978-1995. This is the empirical analog to Table 5. With a
p-value of 0.16, the data fail to reject the null hypothesis that employers and unions play
dominant strategies in the hiring of legal representation. Of course, this test does not control for
common attributes of the employer and union that may influence the probability of retaining an
agent. It also fails to control for trends in agent usage, which may be important if it takes time for
the parties to learn about the arbitrator’s distribution or the benefits of using an agent.
Table 7 estimates the bivariate probit described in equations (13) and (14) for whether the
employer and union choose to employ an agent. The table records the value and significance of
the correlation coefficient, which should be zero under the dominant strategy hypothesis. The
first specification mirrors Table 6, except that a bivariate normal distribution has been imposed.
The correlation coefficient ρ equals 0.09, although the standard error is large. The likelihood
ratio test for ρ=0 has an almost identical p-value compared to the test for dominant strategies in
Table 6 (.164 versus .162). The second specification adds in year and population dummies. Both
sets of dummies significantly affect the probability each side hires an agent. Including these
dummies cuts the correlation coefficient by a third, from 0.09 to 0.06.
The final specification in Table 7 adds in other covariates that are likely to affect agent
usage. As expected, both sides are more likely to hire agents if the dispute involves a multiple-
year contract since in this case the benefit of legal representation applies to multiple years. It also
appears that units not involving firemen or policemen are much less likely to hire legal
representation. These cases involve nurses, communication and transportation workers, public
school teachers, and university staff. For these workers, the sides were not required to submit
their cases to binding arbitration, but were allowed to take advantage of the mechanism in place
in New Jersey. Whether or not the case involved a salary or benefit dispute does not seem to
have a significant effect. The addition of these controls reduces the correlation coefficient to
essentially zero. The likelihood ratio test that ρ=0 has a p-value of 0.9, indicating that dominant
strategies in agent usage cannot be rejected.
Table 8 provides additional estimates of the correlation coefficient for different subsets of
the data. Looking at the estimated correlation coefficient for different time periods, it appears
that the correlation in legal representation has fallen over time. There also seems to be a
monotonic decline in the correlation coefficient as a function of the population of the
municipality. The only case where the hypothesis of independent strategies can be rejected at
17
conventional levels of significance is for municipalities with less than 10,000 residents. Since we
collected data for cases that used conventional and consent arbitration, we also provide estimates
of the correlation coefficient, ρ, for agent usage for these arbitration mechanisms.17 The
estimates from these other two arbitration systems are bigger, but due to larger standard errors,
the null hypothesis that ρ=0 cannot be rejected. Although not shown, adding controls as in Table
7 reduces the size of many of these correlation coefficients. In summary, the estimates suggest
that employer and union demands for an agent are independent, which is consistent with
dominant strategy play.
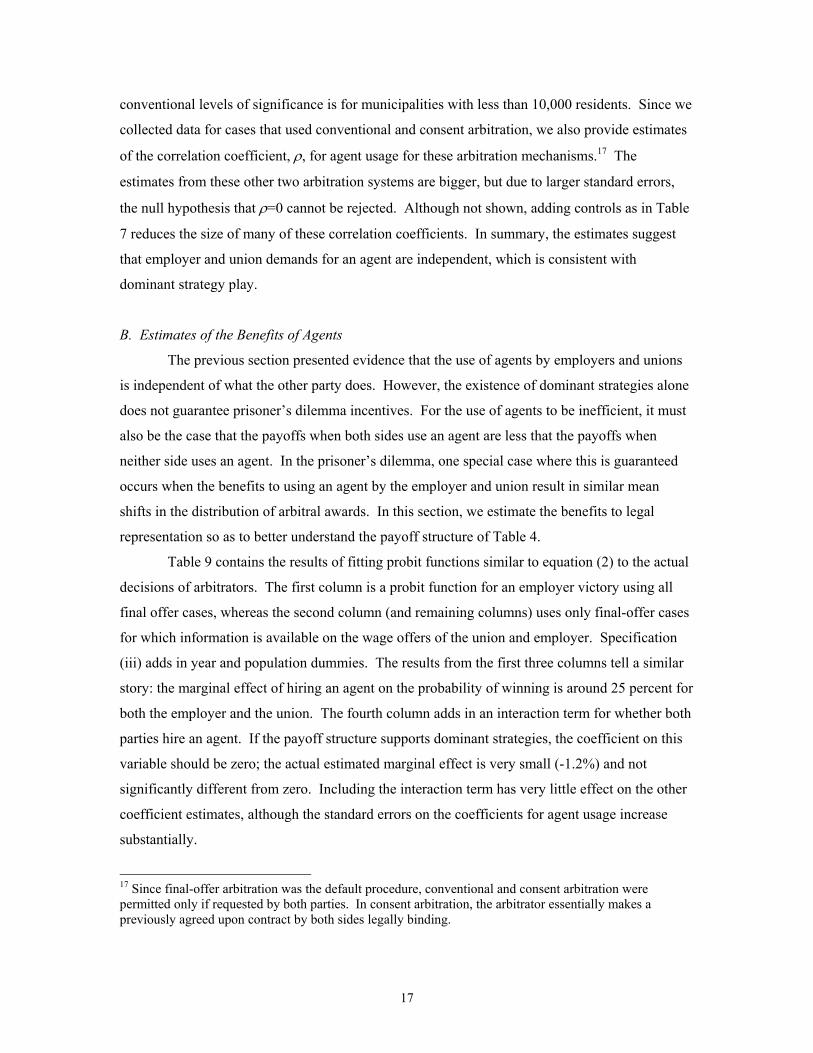
B. Estimates of the Benefits of Agents
The previous section presented evidence that the use of agents by employers and unions
is independent of what the other party does. However, the existence of dominant strategies alone
does not guarantee prisoner’s dilemma incentives. For the use of agents to be inefficient, it must
also be the case that the payoffs when both sides use an agent are less that the payoffs when
neither side uses an agent. In the prisoner’s dilemma, one special case where this is guaranteed
occurs when the benefits to using an agent by the employer and union result in similar mean
shifts in the distribution of arbitral awards. In this section, we estimate the benefits to legal
representation so as to better understand the payoff structure of Table 4.
Table 9 contains the results of fitting probit functions similar to equation (2) to the actual
decisions of arbitrators. The first column is a probit function for an employer victory using all
final offer cases, whereas the second column (and remaining columns) uses only final-offer cases
for which information is available on the wage offers of the union and employer. Specification
(iii) adds in year and population dummies. The results from the first three columns tell a similar
story: the marginal effect of hiring an agent on the probability of winning is around 25 percent for
both the employer and the union. The fourth column adds in an interaction term for whether both
parties hire an agent. If the payoff structure supports dominant strategies, the coefficient on this
variable should be zero; the actual estimated marginal effect is very small (-1.2%) and not
significantly different from zero. Including the interaction term has very little effect on the other
coefficient estimates, although the standard errors on the coefficients for agent usage increase
substantially.
17 Since final-offer arbitration was the default procedure, conventional and consent arbitration were permitted only if requested by both parties. In consent arbitration, the arbitrator essentially makes a previously agreed upon contract by both sides legally binding.
18
The last two specifications in Table 9 add in the average of the parties’ final offers. The
results indicate that when the employer hires an agent, the distribution of awards shifts upward by
around two-thirds of a standard deviation of the distribution of arbitral awards. Likewise, when
the union retains an agent, the distribution of awards shifts downward by around two-thirds of a
standard deviation. In the bottom panel, we test whether or not these mean shifts are equal in
magnitude for the employer and union. In both specifications, the null hypothesis of a symmetric
agent effect cannot be rejected.
Table 10 considers two alternative models for the effects of agents and final offers. First,
it could be the case that employers and unions hire agents to reduce the variance in outcomes for
a given set of final offers. The first column interacts the use of agents with the average of the
final offers to test for whether agents change the variance of the award distribution in addition to
the mean. The coefficients on these interactions indicate that hiring an agent has almost no effect
on the variance of the award distribution. Second, arbitrators could treat employer and union
final offers differentially. The second specification includes the employer and union final offers
separately in lieu of the average of the two. While the coefficient on the employer’s final offer is
larger, the null hypothesis that the offers are treated symmetrically cannot be rejected.18
Since our panel of arbitration cases spans 18 years, our dataset contains many disputes
decided by the same arbitrator as well as many cases represented by the same agent. Table 11
uses these unique aspects of the data to estimate probit models that control for individual agent
effects and individual arbitrator effects. The first column adds in dummy variables for the
experienced agents, where “experienced” is defined as an agent who handled at least 35
arbitration cases. These agent dummies enter the probit equation significantly, with the effect of
using an (non-experienced) agent being somewhat smaller compared to the estimates in Tables 9
and 10. One agent, Mr. Loccke, was especially experienced. He represented the union in 25
percent of all arbitration cases. The second specification includes only the 165 final offer cases
where the union hired Mr. Loccke. Holding constant the legal representation of the union in this
manner, the employer’s use of an agent has a similar effect compared to previous estimates.
If arbitrators are not statistically exchangeable, it is possible that different arbitrators
could be systematically pro-union or pro-employer. The third column of estimates in Table 11
includes dummies for the 42 arbitrators who handled at least two cases and did not always decide
in favor of the union or employer. These dummies are not jointly significant, and they do not
18 The gap between the employer and union final-offer coefficients drops in models similar to those estimated in Table 11.
19
markedly change the previous estimates of the benefits of hiring an agent. Mr. Mitrani was the
arbitrator in approximately 10 percent of all cases going to arbitration. Specification (iv) uses
only data from cases handled by him. Once again, the estimated benefits of agent usage do not
change appreciably. The results from these two specifications suggest that the benefits of legal
representation are not primarily due to an agent’s assistance in the selection of the arbitrator.
In summary, the results in Tables 9 through 11 provide strong evidence that each party
increases the chance that their offer will be accepted when they retain agents. The benefits of
agent use appear to be the same for both the employer and union in terms of mean shifts in the
award distribution. There also is no significant interaction effect when both parties hire agents on
the arbitrator’s decision. Given the evidence that each party has a dominant strategy and that the
benefits of using an agent are symmetric, we conclude that prisoner’s dilemma incentives exist
for legal representation in New Jersey final-offer arbitration.
Is there any way to translate the shifts in the award distribution from retaining an agent
into dollar terms? Richard Lester helped in the design of New Jersey’s final-offer mechanism
and followed its use over time. For the mid-eighties, he found that legal fees are generally around
$5,000 per case for the union, and up to $15,000 per case for the employer (Lester (1989)). A
permanent increase in the compensation of a police officer by 1% would have a discounted
present value of perhaps $2,000 to $3,000 for this same time period. It would take a bargaining
unit of only 5 to 10 employees to make it well worth the cost for each party individually to retain
an agent. In short, there is little doubt that the incentive structure in New Jersey’s arbitration
system creates a prisoner’s dilemma for the parties.
C. Measurement Error in the Observed Final Offers
One empirical issue arises when fitting the probit function of equation (2) since the final
wage offers of the two parties are likely to be measured with error. When collecting the wage
offer data, we noted that sometimes the entire unit was bargaining over a percentage wage
increase that applied to all workers. Other times we had to calculate final offers using a salary
increase for a police officer with a given rank and level of experience. In addition, while we
focus on wages, other non-wage benefits such as uniform allowances, sick leave, and dental
benefits were often included in the arbitration cases. Using wage compensation only may be a
somewhat noisy estimate of the total value of the items under dispute.
Fortunately, the basic structure of the model is unaffected by classical measurement error.
Suppose we observe noisy estimates of the actual final offers *ew and *
uw , where the noise is
mean zero and independent of ew , uw , and aw . Using the noisy estimates instead of the true
20
values, we can rewrite equation (1) as
(1′) 2
)( **ue
aww
mw+
≤+
where m is a new random variable capturing the combined measurement error in the final offers.
Assuming m has a normal distribution with variance 2mσ , the left hand side of (1′) is normally
distributed with variance 22mσσ + .
How are the coefficient estimates affected by the presence of the type of measurement
error described above? In a linear model, if an explanatory variable is measured with classical
error, the corresponding coefficient is biased towards zero. In our probit model with
measurement error, there is likely to be a similar attenuation bias, although it should be noted that
the coefficient estimate could theoretically be biased up in more general cases.19 Since the
coefficient on the average of the final wage offers in the absence of measurement error is the
reciprocal of σ , if this coefficient is biased towards zero, the implied estimate of σ is upward
biased. Since the average of the final offers is close to orthogonal to agent use in this dataset,
however, this bias should not markedly affect the coefficient estimates for agents in the probit
equation. Indeed, including the average of the final offers does not change the coefficient
estimates appreciably (see Table 9). It will, however, affect the scaling used to obtain the implied
mean shifts from using an agent.
If there were no measurement error, column (v) in Table 9 would imply that the standard
deviation of the arbitrator’s award distribution is 3.19 percent. The implied mean shifts due to the
employer and union using an agent would be -2.25 percent and 1.91 percent, respectively. If the
actual value of σ is smaller, the implied mean shifts from using an agent would also be smaller.
This suggests that it might be simplest to express the effect of agents relative to the standard
deviation. Alternatively, one can look at the marginal effect of a change in agent use on the
probability of an employer victory. Tables 9 through 11 estimate that both union and employer
agents shift the arbitrator’s distribution favorably for their clients by around two-thirds of a
standard deviation, with an associated marginal effect of approximately 25 percentage points.
D. Estimates of the Moderating Effect of Agents
As we showed earlier, it is possible to test whether expert agents moderate the self-
serving expectations of the parties and to estimate any effect they may have from the effect that
19 See Carroll, Ruppert, and Stefanski (1995) for a general discussion of measurement error in nonlinear models.
21
agent usage has on the final offers of the parties. This is a particularly important characteristic of
the final-offer system, since the offers of the parties provide a complete summary of their
strategic behavior. Moreover, it is possible to estimate the moderating effect of agents even if the
center of the arbitral distribution is not known by using a fixed-effects estimator, much in the
manner of the fixed-effects estimator so often used to eliminate bias in the typical cross-section
relationship. Subtracting the final offer of the employer in equation (7′) from the final offer of
the union in equation (8′) differences out any common observed or unobserved variables and
yields
(15) )0(ϕ
σββδδ +−−+≈− uueeeueu LLww ,
where βe and βu are estimates of the effect of the moderating effect on self-serving biases that
result from agent usage for the employer and union.
The estimated coefficients for this differenced equation appear in Table 12. The
coefficient for the union’s agent usage dummy is not significantly different from zero, whereas
the coefficient for employer’s agent usage is significantly negative. The employer’s estimate
implies βe equals 0.44 percent, or that agents cause employers to increase their offers by almost
half of a percentage point on average. This is precisely the direction that the moderating effect
would be expected to be for an employer. However, we do not find this effect for the union,
suggesting that any self-serving biases may have been asymmetric in this case.20
Whether half of a percentage point is a large or small effect depends partly on the
magnitude of σ, the standard deviation of the arbitrator’s preferred award distribution. The
constant term in the difference regression is an estimate of )0(ϕσδδ ++ eu . If there were no
bias (i.e., 0== eu δδ ), then the estimated σ would be 0.83 percent. Any bias in the parties’
beliefs would make this number even smaller. A conservative estimate is that agents cause
employers to increase their offer by one-half of a standard deviation of the award distribution, a
fraction that increases as the sum of the bias terms grows. Recall that the implied estimate of σ
was over 3 percent using Table 9 (ignoring measurement error). The difference between the
implied estimates from Tables 9 and 12 suggests that there must be a fair amount of measurement
error in the observed final offers. Any common measurement error is subtracted out of equation
20 The least squares estimates of the effects of agent usage on the offers of the parties, apart from the effect on the employer’s offer of an employer’s agent, are small and poorly determined. There are several explanations for this result, including the problem of omitted variables that is, of course, resolved in the fixed-effects estimation of equation (15).

22
(15), but remains in equation (2). Viewed in this light, the effects appearing in Table 12 are not
necessarily small although they are imprecisely measured.
E. The Effect of Agents over Time
The data in Figures 1 and 2 noted earlier suggest that the parties may learn about
arbitration and the benefits of agents as time goes on. To better understand the evolution of the
system and the demand for agents over time, Table 13 interacts agent use with arbitrators’
decisions and final offers over time. The first column in Table 13 re-estimates the probability of
an employer victory, allowing for agents to become more or less effective advocates over time.
The data is divided into three periods and interacted with agent use to create six dummy variables
for the probit of equation (2). Although the estimates move a little, the effects of using an agent
are fairly constant across periods. The effects are similar to those estimated in Tables 9 through
11 and not significantly different for the three time periods. These results imply that the
incentives to hire an agent do not change much over time. They suggest that the increasing use of
agents over time is not primarily because agents are becoming more effective at persuading
arbitrators to rule in favor of their clients.
If the extent of biased expectations for the moderating effect of agents changes over time,
then time interactions should be added to the equations to explain the final offers also. The
difference in final offers then parallels equation (15), where the relevant parameters are allowed
to vary over time as parties update their beliefs. Column (ii) in Table 13 regresses the difference
in the final offers on dummy variables for agent use in three time periods and three period
specific intercept terms (compare to Table 12, column (iii)). It appears that agents moderated
employers’ final offers substantially in the first six years of the data, but had a negligible effect in
the last 12 years of the data. In contrast, agents have no significant moderating effect on wages
for unions in any of the time periods. Perhaps employers were more biased in the early years, and
agents helped to moderate these unrealistic beliefs. The separate intercept terms for the three
time periods support the notion that the parties were particularly biased in the early years of the
data. The intercept term, which estimates )0(ϕσδδ ++ eu for each time period, decreases from
2.5 for the first data period to 1.0 for the final data period. If σ remained constant over time, this
pattern implies the amount of bias ( eu δδ + ) decreased significantly over time as the parties
learned about the arbitrators’ average preferred wage increase. While it would be interesting to
model the dynamics of these changes over time in more detail, such an analysis is not feasible
with the current dataset.

23
VI. Conclusion
Our study of the 18-year evolution of a carefully structured arbitration system suggests
that the parties do respond, albeit slowly, to strategic incentives to alter their behavior. First, a
simple model of the bargaining game that separates the arbitrator’s behavior from the strategic
interaction of the parties is consistent with the data. Second, the evidence is strong that the
parties face incentives to employ costly third-party agents to improve their outcomes. In a simple
model we show that if the parties have dominant strategies, the demand for an agent by one party
is independent of the other party’s behavior. This implication of the model for the behavior of the
parties is easily tested and our data are consistent with it.
We also show that for many of the bargaining pairs, the structure of the payoff matrix
they face in each bargaining round is much like that in the classical prisoner’s dilemma: the
benefits to the parties dissipate if both retain agents. However, this does not rule out the
possibility that agents may play a key role in moderating any self-serving expectations the parties
may have. To test for this possibility we construct a general model in which it is possible to
estimate the extent to which agents play a key productive role in altering any incorrect
expectations the parties may hold about the arbitrator’s behavior. The data do provide empirical
support for the hypothesis that employers who hired agents in the early periods of operation of the
system were productively assisted and that this resulted in increased final offers and employer
win rates. However, there is no evidence that this role for agents persisted after the first few
years of the system’s existence. Instead, employers seem to have learned how to educate their
expectations regardless of whether an agent was employed. Of course, as with any instructional
outcome, it is difficult to know whether this may well be the payoff to the earlier use of expert
agents. As a result, it is not possible to draw any overall conclusion about the possible efficiency-
enhancing role for expert agents.
As is well known (see Kreps (1991), for example), when there is repeated play the parties
may arrive at cooperative arrangements despite the existence of a prisoner’s dilemma payoff
matrix in each round of bargaining. Thus, we look for evidence of the parties’ cooperation by
studying the history of the use of agents by the parties. When the system first began there is
strong evidence that the parties did not always retain agents, even when they would have found it
in their unilateral interest to do so. The data also suggest that when agents were retained in the
early period it was primarily by unions, who in turn enjoyed higher than predicted win rates as a
result. However, over the long run the data are unambiguous on one key point: they imply that
the parties have slowly approached the point where agents are being employed nearly universally,
despite the evidence that, when both parties employ agents, they do not influence outcomes. In

24
short, the evidence from this field study of a precisely specified arbitration system is that
cooperative behavior that is not in the short-run interests of the parties is difficult to sustain.
A key question for future research is the extent to which the findings in this application
are likely to be informative in other situations of bargaining and conflict. One important issue is
the extent to which there is heterogeneity in the long-run outcomes of different systems, for
whatever reason. The role of agents in situations of conflict has been the source of a great deal of
recent research, and the variety of settings in which the issue arises is enormous.21 Certainly the
evidence from laboratory experiments, which, apart from anecdotes, comprises nearly all of what
is generally known about the role of cooperation in prisoner’s dilemma environments, suggests
that cooperation sometimes occurs unpredictably in some groups.22 Despite the evidence in other
environments, far more study of the evolution of these systems over time is needed if we are to
understand how to design systems that will encourage cooperative behavior in a wide variety of
settings.
21 A particularly interesting example is Mnookin and Susskind (1999), which reports studies ranging from sports agents to diplomats. 22 See, for example, Rapoport and Chammah (1965) and Poundstone (1992).
25
References
Adler, Jane, Deborah Hensler and Charles Nelson, “Simple Justice: How Litigants Fare in the Pittsburgh Court Arbitration Program,” Institute for Civil Justice, Rand Corporation, 1991.
Ashenfelter, Orley, “Arbitrator Behavior,” American Economic Review,” May 1987, Vol. 77, pp.
342-346. Ashenfelter, Orley and David Bloom, “Models of Arbitrator Behavior: Theory and Evidence,”
American Economic Review, March 1984, Vol. 74, pp. 111-125. Ashenfelter, Orley, Janet Currie, Henry Farber and Matthew Spiegel, “An Experimental
Comparison of Dispute Rates in Alternative Arbitration Systems,” Econometrica, Nov. 1992, Vol. 60, pp. 1407-1433.
Babcock, Linda, and George Loewenstein, “Journal of Economic Perspectives, Winter 1997, Vol.
11, No. 1, pp. 109-126. Babcock, Linda, George Loewenstein, Samuel Issacharoff and Colin Camerer, “Biased
Judgments of Fairness in Bargaining,” American Economic Review, Dec. 1995, Vol. 85, No. 5, pp. 1337-1343.
Babcock, Linda and Craig Olson, “The Causes of Impasses in Labor Disputes,” Industrial
Relations, 1992, Vol. 31, No. 2, pp. 348-360. Babcock, Linda, Xianghong Wang, and George Loewenstein, “Choosing the Wrong Pond: Social
Comparisons that Reflect a Self-Serving Bias,” Quarterly Journal of Economics, Feb. 1996, Vol. 111, No. 1, pp. 1-19.
Bazerman, Max, Margaret Neale, Kathleen Valley, Edward Zaja, and Yong Kim, “The Effects of
Agents and Mediators on Negotiation Outcomes,” Organization Behavior and Human Decision Processes, 1992, Vol. 53, pp. 55-73.
Bhagat, Sanjay, Brickley, James and Coles, Jeffrey L. “The Costs of Inefficient Bargaining and
Financial Distress: Evidence From Corporate Lawsuits,” The Journal of Financial Economics, April 1994, Vol. 35, pp. 221-247.
Block, Richard and Jack Stieber, “The Impact of Attorneys and Arbitrators on Arbitration
Awards,” Industrial and Labor Relations Review, July 1987, Vol. 40, pp. 543-555. Bloom, David, “Customized ‘Final-Offer’: New Jersey’s Arbitration Law,” Monthly Labor
Review, Sept. 1980, Vol. 103, No. 9, pp. 30-33. Bloom, David and Christopher Cavanagh, “An Analysis of the Selection of Arbitrators,”
American Economic Review, June 1986, Vol. 76, pp. 408-422. Carroll, Raymond, David Ruppert and Leonard Stefanski, Measurement Error in Nonlinear
Models, Chapman and Hall, 1995. Cutler, David and Summers, Lawrence, “The Cost of Conflict Resolution and Financial Distress:
Evidence From the Texaco-Pennzoil Litigation,” Rand Journal of Economics, Summer 1998, Vol. 19, pp. 157-72.
Farber, Henry, “An Analysis of Final-Offer Arbitration,” Journal of Conflict Resolution, Dec.
1980, Vol. 5, pp. 683-705.
26
Farber, Henry and Max Bazerman, “The General Basis of Arbitrator Behavior: An Empirical Analysis of Conventional and Final-Offer Arbitration,” Econometrica, Nov. 1986, Vol. 54, pp. 1503-1528.
Farber, Henry and Max Bazerman, “Divergent Expectations as a Cause of Disagreement in
Bargaining: Evidence from a Comparison of Arbitration Schemes,” Quarterly Journal of Economics, Feb. 1989, Vol. 104, pp. 99-120.
Farber, Henry and Harry Katz, “Arbitration and the Incentive to Bargain,” Industrial and Labor
Relations Review, Oct. 1979, Vol. 33, No. 1, pp. 55-63. Gilson, Ronald and Robert Mnookin, “Disputing Through Agents: Cooperation and Conflict
Between Lawyers in Litigation,” Columbia Law Review, 1994, Vol. 509. Glaeser, Edward and Andrei Shleifer, “The Rise of the Regulatory State,” Journal of Economic
Literature, June 2003, Vol. 41, pp. 401-425. Kreps, David, Game Theory and Economic Modelling, Oxford University Press, 1991. Lester, Richard, Labor Arbitration in State and Local Government, Industrial Relations Section,
Princeton University, 1984. Lester, Richard, “Analysis of Experience Under New Jersey’s Flexible Arbitration System,” The
Arbitration Journal, June 1989, Vol. 44, pp. 14-21. Mas, Alexandre, "Reference Pay and Police Enforcement: Evidence from Final Offer
Arbitration," U.C. Berkeley mimeo, February 2005. McCall, Brian, “Interest Arbitration and the Incentive to Bargain: A Principal-Agent Approach,”
Journal of Conflict Resolution, March 1991, Vol. 34, pp. 151-167. Mnookin, Robert, Eleanor Maccoby, Catherine Albiston and Charlene Depner, “Private Ordering
Revisited: What Custodial Arrangements are Parents Negotiating?” in Stephen Sugarman and Herma Hill Kay, eds. Divorce at the Crossroads, Yale University Press, 1990.
Mnookin, Robert, and Lawrence Susskind, Negotiating on Behalf of Others, Sage Publications,
1999. Murphy, Kevin, Andrei Shleifer, and Robert Vishny, “The Allocation of Talent: Implications for
Growth,” Quarterly Journal of Economics, May 1991, Vol. 106, pp. 501-530. Olson, Craig, Gregory G. Dell’Omo, and Paul Jarley, “A Comparison of Interest Arbitrator
Decision-Making in Experimental and Field Settings,” Industrial and Labor Relations Review, July 1992, Vol. 45, pp. 711-723.
Pencavel, John, Labor Markets Under Trade Unionism, Cambridge: Basil Blackwell, 1991. Poundstone, William, Prisoner’s Dilemma, New York: Doubleday, 1992. Rapoport, Anatol and Albert Chammah, Prisoner’s Dilemma: A Study in Conflict and
Cooperation, The University of Michigan Press, 1965.
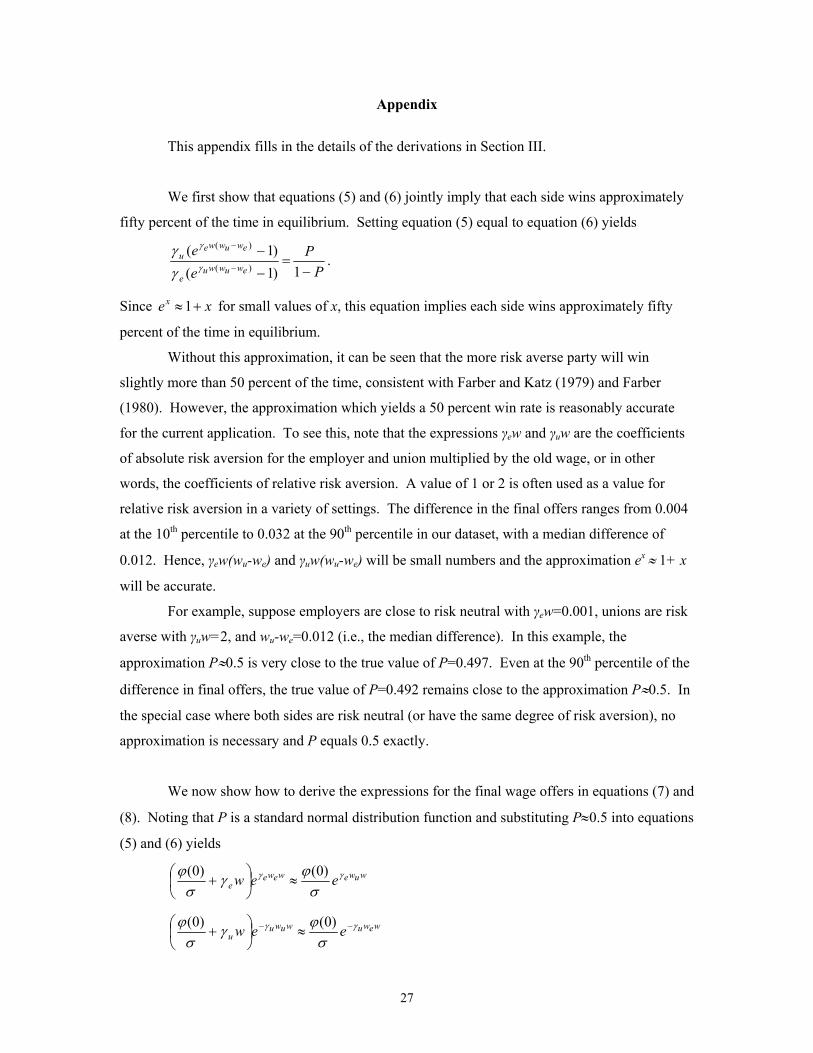
27
Appendix
This appendix fills in the details of the derivations in Section III.
We first show that equations (5) and (6) jointly imply that each side wins approximately
fifty percent of the time in equilibrium. Setting equation (5) equal to equation (6) yields
P
Pee
ewuwwue
ewuwweu
−=
−
−−
−
1)1()1(
)(
)(
γ
γ
γγ
.
Since xex +≈1 for small values of x, this equation implies each side wins approximately fifty
percent of the time in equilibrium.
Without this approximation, it can be seen that the more risk averse party will win
slightly more than 50 percent of the time, consistent with Farber and Katz (1979) and Farber
(1980). However, the approximation which yields a 50 percent win rate is reasonably accurate
for the current application. To see this, note that the expressions γew and γuw are the coefficients
of absolute risk aversion for the employer and union multiplied by the old wage, or in other
words, the coefficients of relative risk aversion. A value of 1 or 2 is often used as a value for
relative risk aversion in a variety of settings. The difference in the final offers ranges from 0.004
at the 10th percentile to 0.032 at the 90th percentile in our dataset, with a median difference of
0.012. Hence, γew(wu-we) and γuw(wu-we) will be small numbers and the approximation ex ≈ 1+ x
will be accurate.
For example, suppose employers are close to risk neutral with γew=0.001, unions are risk
averse with γuw=2, and wu-we=0.012 (i.e., the median difference). In this example, the
approximation P≈0.5 is very close to the true value of P=0.497. Even at the 90th percentile of the
difference in final offers, the true value of P=0.492 remains close to the approximation P≈0.5. In
the special case where both sides are risk neutral (or have the same degree of risk aversion), no
approximation is necessary and P equals 0.5 exactly.
We now show how to derive the expressions for the final wage offers in equations (7) and
(8). Noting that P is a standard normal distribution function and substituting P≈0.5 into equations
(5) and (6) yields
wuwewewee eew γγ
σϕγ
σϕ )0()0(
≈
+
wewuwuwuu eew γγ
σϕγ
σϕ −− ≈
+
)0()0(
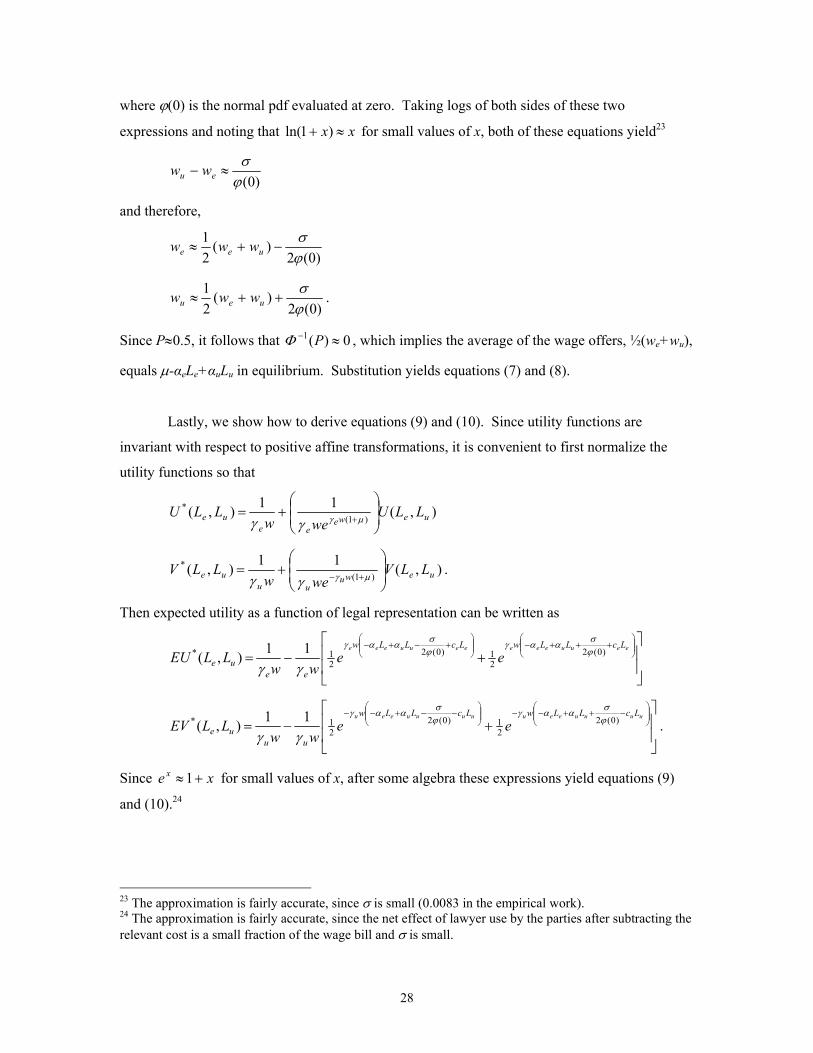
28
where ϕ(0) is the normal pdf evaluated at zero. Taking logs of both sides of these two
expressions and noting that xx ≈+ )1ln( for small values of x, both of these equations yield23
)0(ϕ
σ≈− eu ww
and therefore,
)0(2
)(21
ϕσ
−+≈ uee www
)0(2
)(21
ϕσ
++≈ ueu www .
Since P≈0.5, it follows that 0)(1 ≈− PΦ , which implies the average of the wage offers, ½(we+wu),
equals µ-αeLe+αuLu in equilibrium. Substitution yields equations (7) and (8).
Lastly, we show how to derive equations (9) and (10). Since utility functions are
invariant with respect to positive affine transformations, it is convenient to first normalize the
utility functions so that
),(11),( )1(*
ueweee
ue LLUwew
LLU
+=
+µγγγ
),(11),( )1(*
uewuuu
ue LLVwew
LLV
+=
+− µγγγ.
Then expected utility as a function of legal representation can be written as
+−=
+++−
+−+− eeuueeeeeuueee LcLLwLcLLw
eeue ee
wwLLEU )0(2
21)0(2
21* 11),( ϕ
σααγϕσααγ
γγ
+−=
−++−−
−−+−− uuuueeuuuuueeu LcLLwLcLLw
uuue ee
wwLLEV )0(2
21)0(2
21* 11),( ϕ
σααγϕσααγ
γγ.
Since xe x +≈1 for small values of x, after some algebra these expressions yield equations (9)
and (10).24
23 The approximation is fairly accurate, since σ is small (0.0083 in the empirical work). 24 The approximation is fairly accurate, since the net effect of lawyer use by the parties after subtracting the relevant cost is a small fraction of the wage bill and σ is small.

TABLE 1. SUMMARY STATISTICS FOR FINAL-OFFER ARBITRATION CASES IN NEW JERSEY, 1978-1995. Percent Employer Victoriesa 39.4 Cases in Which the Union Uses an Agent 79.7 Cases in Which the Employer Uses an Agent 59.2 Cases with Unavailable Data on Agents 4.1 Disputed Items: Wages Only 12.5 Non-wage Benefits Only 5.5 Wages and Non-wage Benefits 82.0 Type of Unit: Police 84.8 Fire 12.9 Other 2.2 Population of Municipality: population≤5,000 9.6 5,000<population≤10,000 15.1 10,000<population≤15,000 12.8 15,000<population≤25,000 14.4 25,000<population≤50,000 15.3 50,000<population≤100,000 8.5 population>100,000 (excluding county or state cases) 6.1 county case 14.4 state case 1.2 unavailable 2.6 Number of Uniformed Employees:b
employees≤10 16.1 10<employees≤25 28.7 25<employees≤50 26.3 50<employees≤100 14.5 employees>100 14.5 Number of Years Covered by Award: One 20.4 Two 52.6 Three or More 27.0 Note: Percentages calculated using 896 final-offer arbitration cases, except where noted. aPercentage calculated using 845 cases for which the arbitrator’s decision was available. bPercentages calculated using 429 cases for which data was available.
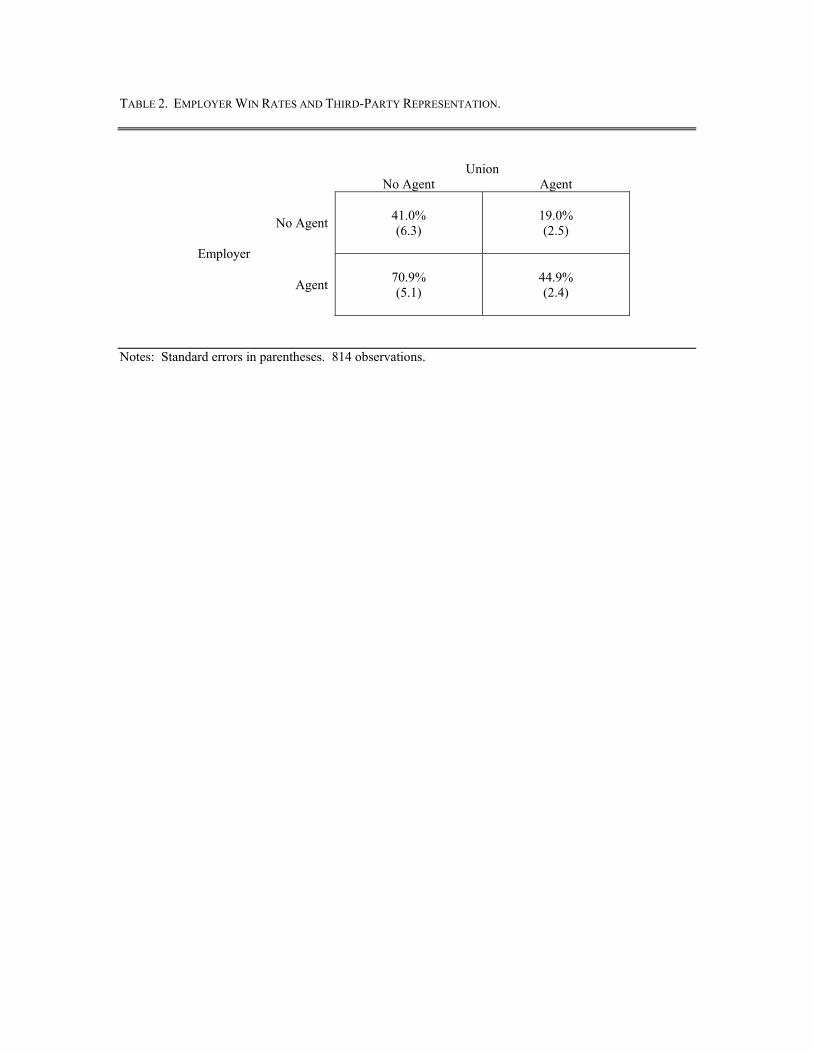
TABLE 2. EMPLOYER WIN RATES AND THIRD-PARTY REPRESENTATION.
Union No Agent Agent
No Agent
41.0% (6.3)
19.0% (2.5)
Employer
Agent
70.9% (5.1)
44.9% (2.4)
Notes: Standard errors in parentheses. 814 observations.
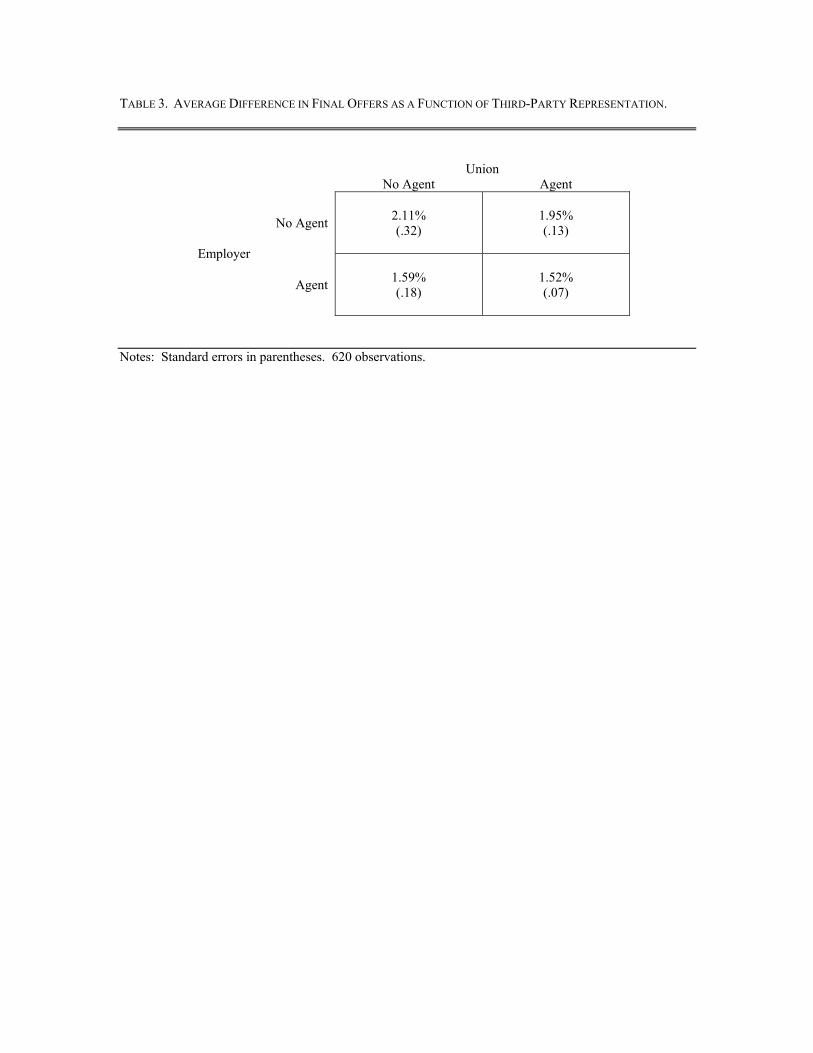
TABLE 3. AVERAGE DIFFERENCE IN FINAL OFFERS AS A FUNCTION OF THIRD-PARTY REPRESENTATION.
Union No Agent Agent
No Agent
2.11% (.32)
1.95% (.13)
Employer
Agent
1.59% (.18)
1.52% (.07)
Notes: Standard errors in parentheses. 620 observations.

TABLE 4. PAYOFF MATRIX FOR EMPLOYER AND UNION STRATEGIES TO USE AN AGENT.
Union No Agent Agent
No Agent
0, 0
-αu, αu-cu
Employer
Agent αe-ce, -αe
αe-αu-ce, αu-αe-cu
Note: The first entry represents the employer’s payoff and the second entry represents the union’s payoff. The payoffs are written in terms of the proportionate effect on the net value added (employer) and the net wage bill (union). αe, αu = the shift in the mean of the distribution of arbitrator awards resulting from the use of an agent for the employer and union, respectively ce, cu = the cost (as a percentage of the wage bill) of using an agent for the employer and union, respectively

TABLE 5. TWO-WAY TABULATION OF PREDICTED AGENT USE ASSUMING DOMINANT STRATEGIES.
Union No Agent Agent
No Agent
(1- Pu)(1- Pe)
Pu(1- Pe)
Employer
Agent
(1- Pu)Pe
PuPe
Pe, Pu = probability the employer and union hire agents, respectively
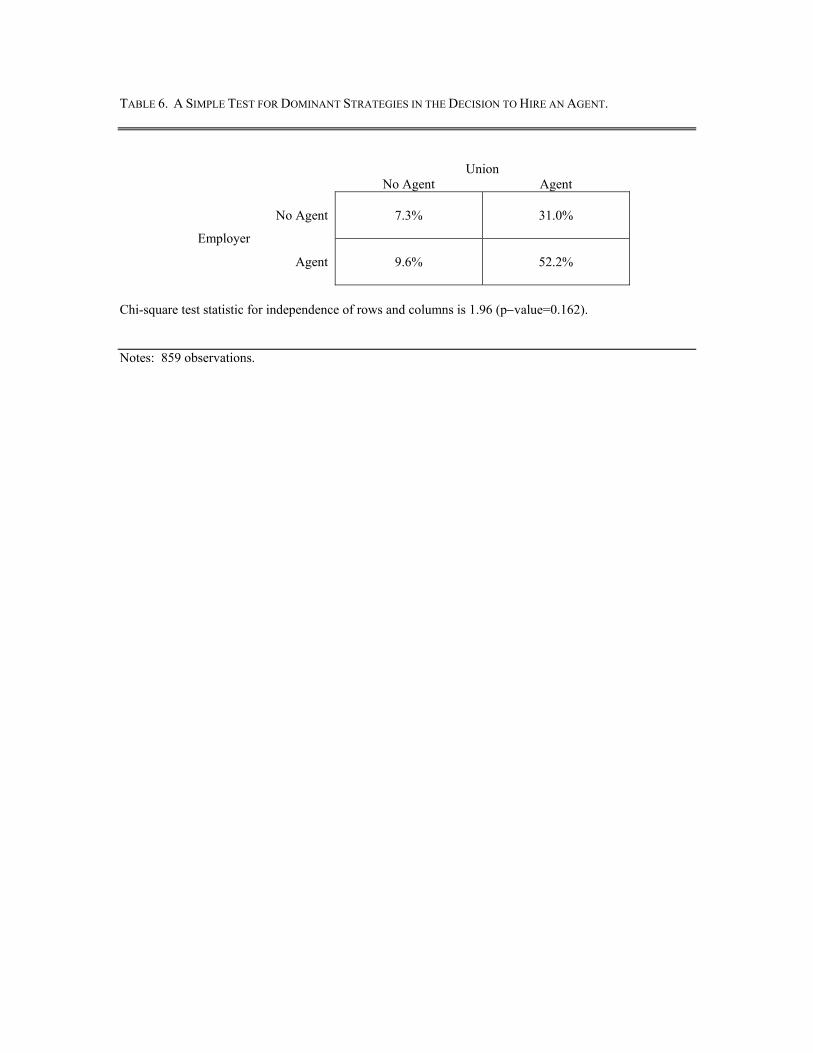
TABLE 6. A SIMPLE TEST FOR DOMINANT STRATEGIES IN THE DECISION TO HIRE AN AGENT.
Union No Agent Agent
No Agent
7.3%
31.0%
Employer
Agent
9.6%
52.2%
Chi-square test statistic for independence of rows and columns is 1.96 (p−value=0.162). Notes: 859 observations.
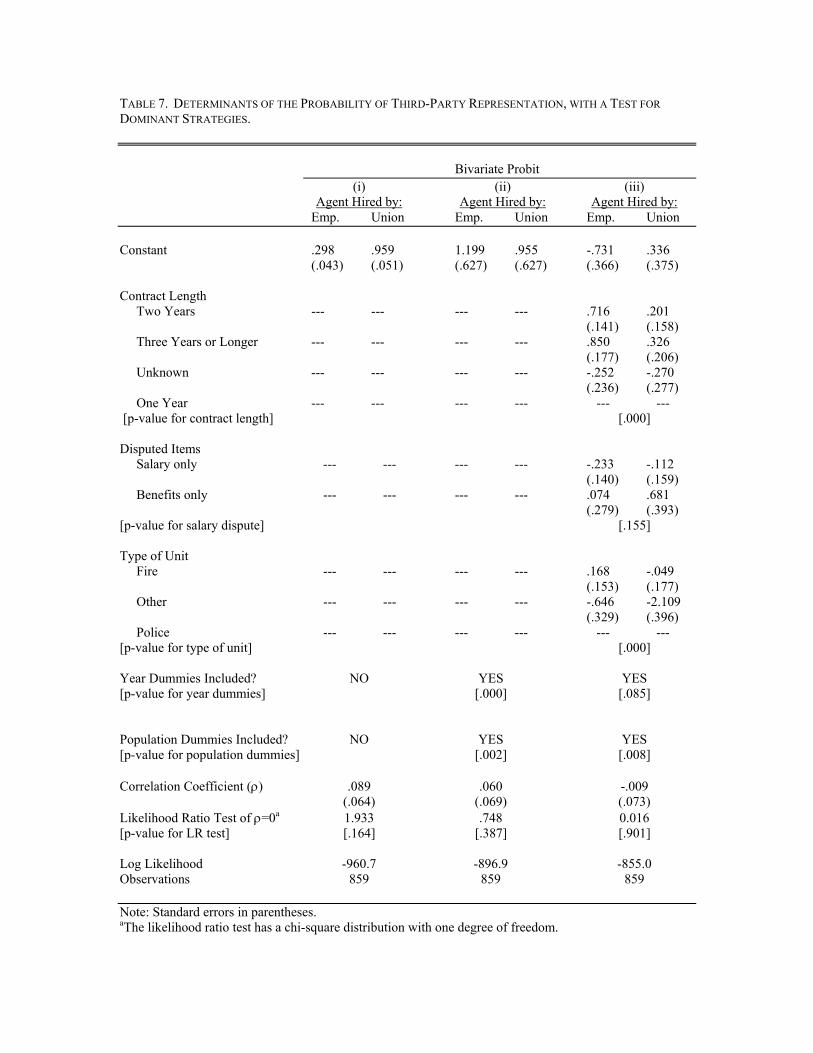
TABLE 7. DETERMINANTS OF THE PROBABILITY OF THIRD-PARTY REPRESENTATION, WITH A TEST FOR DOMINANT STRATEGIES.
Bivariate Probit
(i) (ii) (iii) Agent Hired by: Agent Hired by: Agent Hired by: Emp. Union Emp. Union Emp. Union Constant .298 .959 1.199 .955 -.731 .336 (.043) (.051) (.627) (.627) (.366) (.375) Contract Length
Two Years --- --- --- --- .716 .201 (.141) (.158) Three Years or Longer --- --- --- --- .850 .326 (.177) (.206) Unknown --- --- --- --- -.252 -.270 (.236) (.277) One Year --- --- --- --- --- --- [p-value for contract length] [.000] Disputed Items Salary only --- --- --- --- -.233 -.112 (.140) (.159) Benefits only --- --- --- --- .074 .681 (.279) (.393) [p-value for salary dispute] [.155] Type of Unit Fire --- --- --- --- .168 -.049 (.153) (.177) Other --- --- --- --- -.646 -2.109 (.329) (.396) Police --- --- --- --- --- --- [p-value for type of unit] [.000] Year Dummies Included? NO YES YES [p-value for year dummies] [.000] [.085] Population Dummies Included? NO YES YES [p-value for population dummies] [.002] [.008] Correlation Coefficient (ρ) .089 .060 -.009 (.064) (.069) (.073) Likelihood Ratio Test of ρ=0a 1.933 .748 0.016 [p-value for LR test] [.164] [.387] [.901] Log Likelihood -960.7 -896.9 -855.0 Observations 859 859 859 Note: Standard errors in parentheses. aThe likelihood ratio test has a chi-square distribution with one degree of freedom.

TABLE 8. ADDITIONAL ESTIMATES OF THE CORRELATION COEFFICIENT FOR THE CHOICES OF THE PARTIES TO HIRE AN AGENT.
Bivariate Probit
Correlation p-value from Coefficienta Std. Err. LR test of ρ=0 Obs. Time Period 1978-1995 .089 .064 .164 859 1978-1985 .076 .077 .323 542 1986-1995 .018 .122 .884 317 Type of Arbitration Final Offer .089 .063 .164 859 Conventional .141 .111 .215 251 Consent .176 .167 .313 101 Dispute over Wages and Benefits? Yes .053 .072 .458 704 No .214 .140 .137 155 Type of Unit Police .096 .071 .177 728 Fire -.059 .179 .741 114 Population of Municipality population <= 10,000 .392 .116 .002 212 10,000 < population <= 25,000 .094 .128 .465 232 25,000 < population <= 50,000 .078 .176 .657 135 50,000 < population <=100,000 -.074 .231 .750 74 population > 100,000b -.154 .131 .247 186 aThe estimated correlation of the error terms in the two equations determining whether the employer and union hire an agent, without any additional covariates. bIncludes county and state cases.

TABLE 9. ESTIMATES OF THE PROBABILITY THE EMPLOYER’S FINAL OFFER IS CHOSEN BY THE ARBITRATOR.
Probit
(i) (ii) (iii) (iv) (v) (vi) Employer Hires an Agent .756 .708 .733 .760 .699 .613 (.098) (.112) (.123) (.282) (.128) (.293) [.274] [.255] [.262] [.271] [.249] [.220] Union Hires an Agent -.667 -.637 -.562 -.543 -.597 -.659 (.122) (.144) (.152) (.233) (.157) (.245) [-.260] [-.249] [-.219] [-.212] [-.232] [-.256] Both Sides Hire Agents --- --- --- -.032 --- .104 (.308) (.319) [-.012] [.039] Average of Final Offers --- --- --- --- .311 .313
(.054) (.054) [.116] [.117]
Year Dummies Included? NO NO YES YES YES YES p-value for Year Dummies .491 .493 .006 .006 Population Dummies Included?a NO NO YES YES YES YES p-value for Population Dummies .014 .014 .006 .006 Log-Likelihood -501.5 -382.9 -363.8 -363.8 -342.5 -342.5 Observations 814b 620 620 620 620 620 Agent Effect Symmetric?c
p-value .543 .684 .367 .645 .606 .926 Notes: Standard errors reported in parentheses. The change in probability associated with a change in each independent variable is reported in brackets (calculated at the means of the other independent variables). aMunicipalities are divided into seven population groups, based on population figures from the 1970, 1980, and 1990 U.S. Censuses. Cases involving counties or the state receive separate dummies. bSpecification (i) uses data from all final offer arbitration cases, while (ii)-(vi) use only final offer arbitration cases for which information is available on the wage offers of the union and employer. cTest of the null hypothesis that the coefficients on “employer hires an agent” and “union hires an agent” are equal in magnitude and opposite in sign.
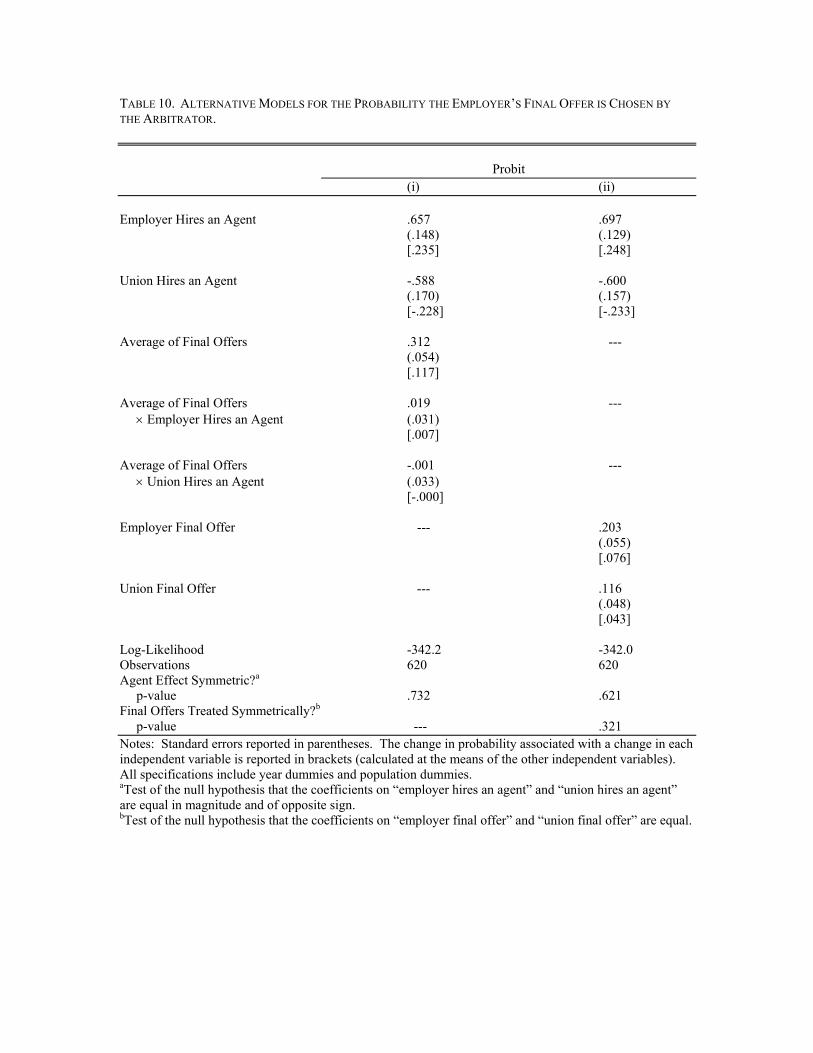
TABLE 10. ALTERNATIVE MODELS FOR THE PROBABILITY THE EMPLOYER’S FINAL OFFER IS CHOSEN BY THE ARBITRATOR.
Probit
(i) (ii) Employer Hires an Agent .657 .697 (.148) (.129) [.235] [.248] Union Hires an Agent -.588 -.600 (.170) (.157) [-.228] [-.233] Average of Final Offers .312 --- (.054) [.117] Average of Final Offers .019 --- × Employer Hires an Agent (.031) [.007] Average of Final Offers -.001 --- × Union Hires an Agent (.033) [-.000] Employer Final Offer --- .203 (.055) [.076] Union Final Offer --- .116 (.048) [.043] Log-Likelihood -342.2 -342.0 Observations 620 620 Agent Effect Symmetric?a
p-value .732 .621 Final Offers Treated Symmetrically?b
p-value --- .321 Notes: Standard errors reported in parentheses. The change in probability associated with a change in each independent variable is reported in brackets (calculated at the means of the other independent variables). All specifications include year dummies and population dummies. aTest of the null hypothesis that the coefficients on “employer hires an agent” and “union hires an agent” are equal in magnitude and of opposite sign. bTest of the null hypothesis that the coefficients on “employer final offer” and “union final offer” are equal.

TABLE 11. ADDITIONAL ESTIMATES CONTROLLING FOR AGENT AND ARBITRATOR FIXED EFFECTS.
Probit
(i) (ii) (iii) (iv) Employer Hires an Agent .494 .936 .851 .667 (.141) (.615) (.148) (.392) [.180] [.295] [.297] [.259] Union Hires an Agent -.418 --- -.671 -.757 (.178) (.188) (.523) [-.162] [-.261] [-.289] Average of Final Offers .349 .249 .371 .244 (.059) (.131) (.064) (.119) [.131] [.089] [.139] [.097] Experienced Agent Dummies?a YES NO NO NO p-value for Employer Agents .000 p-value for Union Agents .052 Only Cases where Mr. Loccke NO YES NO NO Hired by Union?b Arbitrator Dummies?c NO NO YES NO p-value .381 Only Cases with Mr. Mitrani NO NO NO YES as Arbitrator?d Log-Likelihood -322.2 -83.5 -291.2 -40.6 Observations 620 165 569 77 Agent Effect Symmetric?e
p-value .736 --- .431 .854 Notes: Standard errors reported in parentheses. The change in probability associated with a change in each independent variable is reported in brackets (calculated at the means of the other independent variables). All specifications include year dummies and population dummies. aDummies for agents hired by the employer (or union) who handled at least 35 arbitration cases. There are six such agents for the employer and five such agents for the union. bWhen hiring an agent, the union hires Mr. Loccke over twenty-five percent of the time. This column only includes cases where Mr. Loccke represented the union. cIncludes cases handled by 42 arbitrators who handled at least two cases and did not always decide in favor of the union or the employer. dMr. Mitrani was the arbitrator in approximately ten percent of all cases going to arbitration. This column only includes cases decided by Mr. Mitrani. eTest of the null hypothesis that the coefficients on “employer hires an agent” and “union hires an agent” are equal in magnitude and of opposite sign.
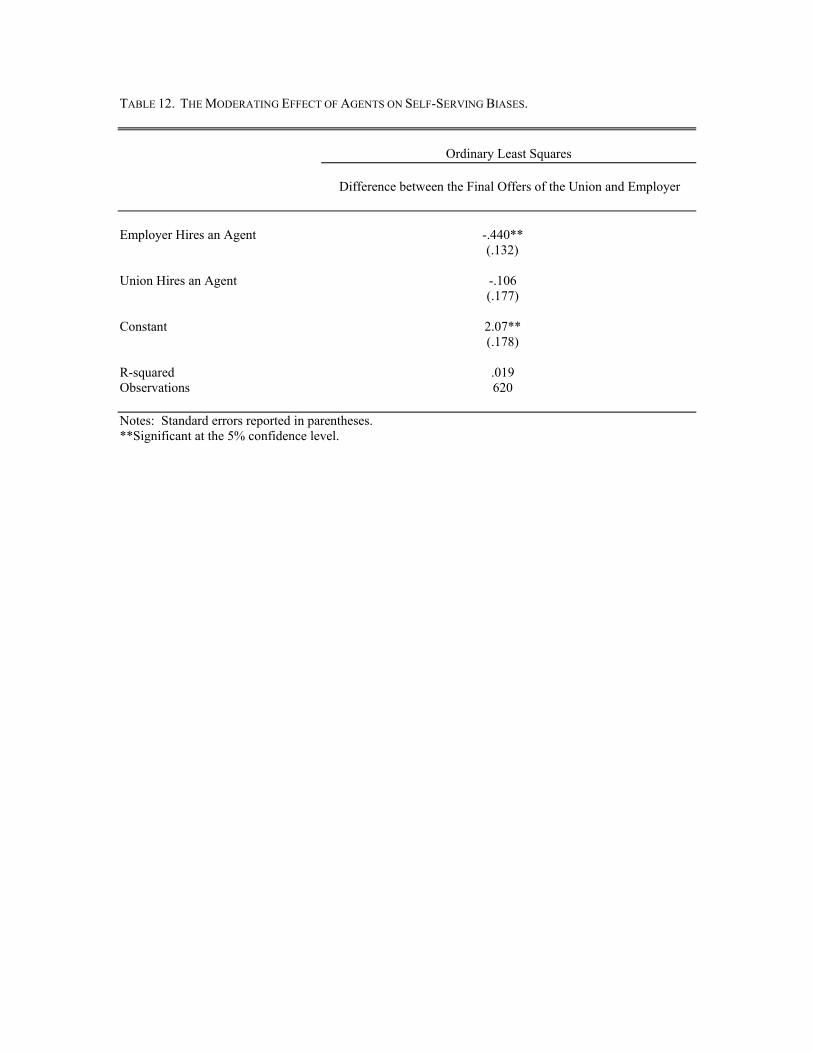
TABLE 12. THE MODERATING EFFECT OF AGENTS ON SELF-SERVING BIASES.
Ordinary Least Squares
Difference between the Final Offers of the Union and Employer
Employer Hires an Agent -.440** (.132) Union Hires an Agent -.106 (.177) Constant 2.07** (.178) R-squared .019 Observations 620 Notes: Standard errors reported in parentheses. **Significant at the 5% confidence level.
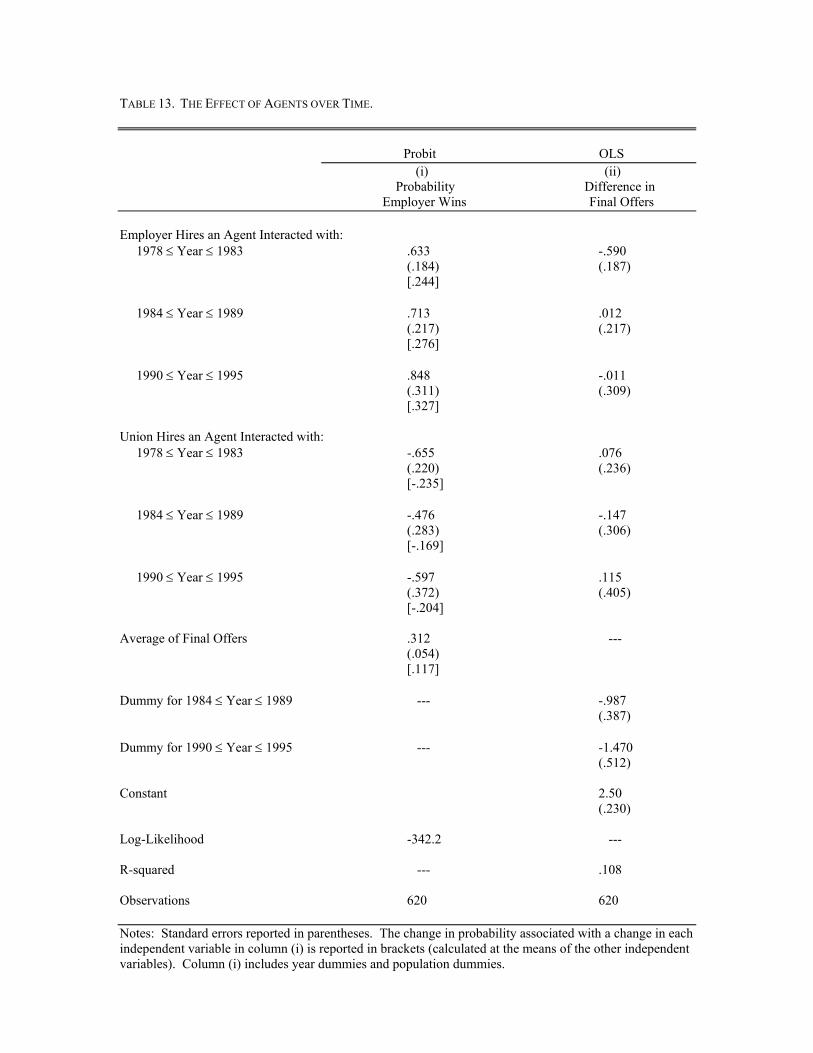
TABLE 13. THE EFFECT OF AGENTS OVER TIME.
Probit OLS
(i) (ii) Probability Difference in Employer Wins Final Offers Employer Hires an Agent Interacted with: 1978 ≤ Year ≤ 1983 .633 -.590 (.184) (.187) [.244] 1984 ≤ Year ≤ 1989 .713 .012 (.217) (.217) [.276] 1990 ≤ Year ≤ 1995 .848 -.011 (.311) (.309) [.327] Union Hires an Agent Interacted with: 1978 ≤ Year ≤ 1983 -.655 .076 (.220) (.236) [-.235] 1984 ≤ Year ≤ 1989 -.476 -.147 (.283) (.306) [-.169] 1990 ≤ Year ≤ 1995 -.597 .115 (.372) (.405) [-.204] Average of Final Offers .312 --- (.054) [.117] Dummy for 1984 ≤ Year ≤ 1989 --- -.987 (.387) Dummy for 1990 ≤ Year ≤ 1995 --- -1.470 (.512) Constant 2.50 (.230) Log-Likelihood -342.2 --- R-squared --- .108 Observations 620 620 Notes: Standard errors reported in parentheses. The change in probability associated with a change in each independent variable in column (i) is reported in brackets (calculated at the means of the other independent variables). Column (i) includes year dummies and population dummies.

Figure 1. Pattern of Third-Party Representation in Final Offer Arbitration Cases in New Jersey, 1978-1995.
0%
10%
20%
30%
40%
50%
60%
70%
80%
90%
100%
78 79 80 81 82 83 84 85 86 87 88 89 90 91 92 93 94 95
Year
Perc
ent o
f Arb
itrat
ion
Cas
es
Union uses an agent, employer does not Both sides use agents Employer uses an agent, union does not Neither side uses an agent
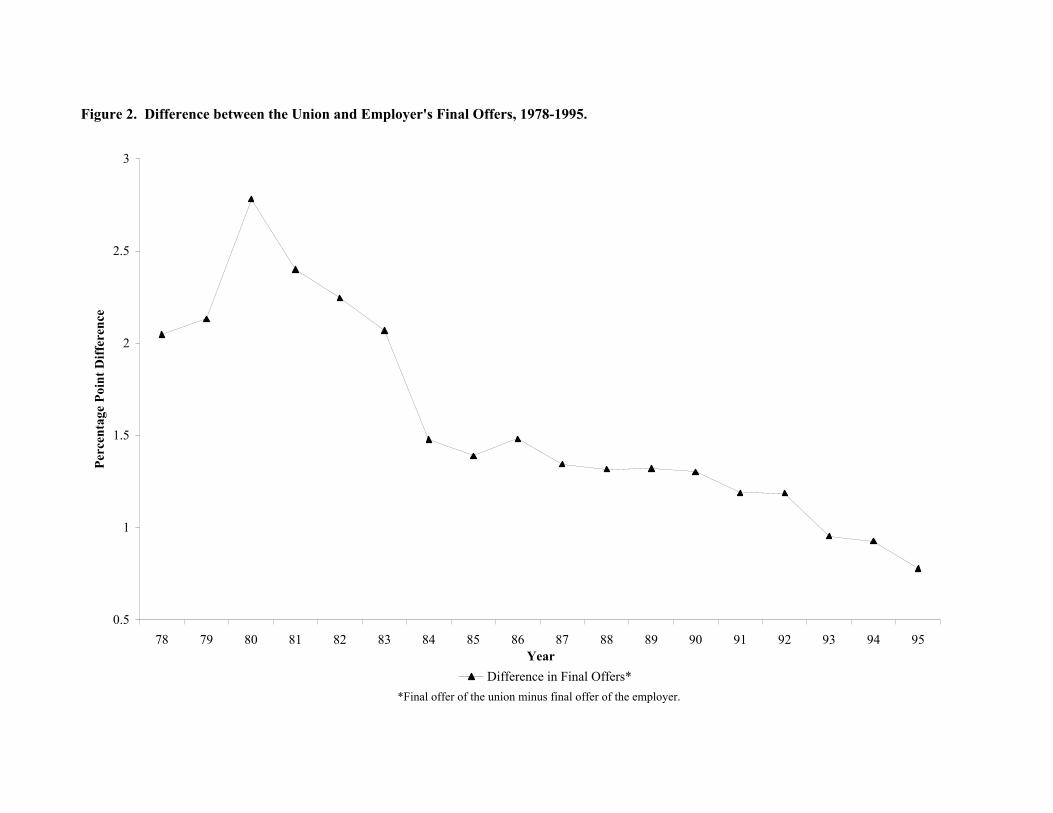
Figure 2. Difference between the Union and Employer's Final Offers, 1978-1995.
0.5
1
1.5
2
2.5
3
78 79 80 81 82 83 84 85 86 87 88 89 90 91 92 93 94 95Year
Perc
enta
ge P
oint
Diff
eren
ce
Difference in Final Offers* *Final offer of the union minus final offer of the employer.
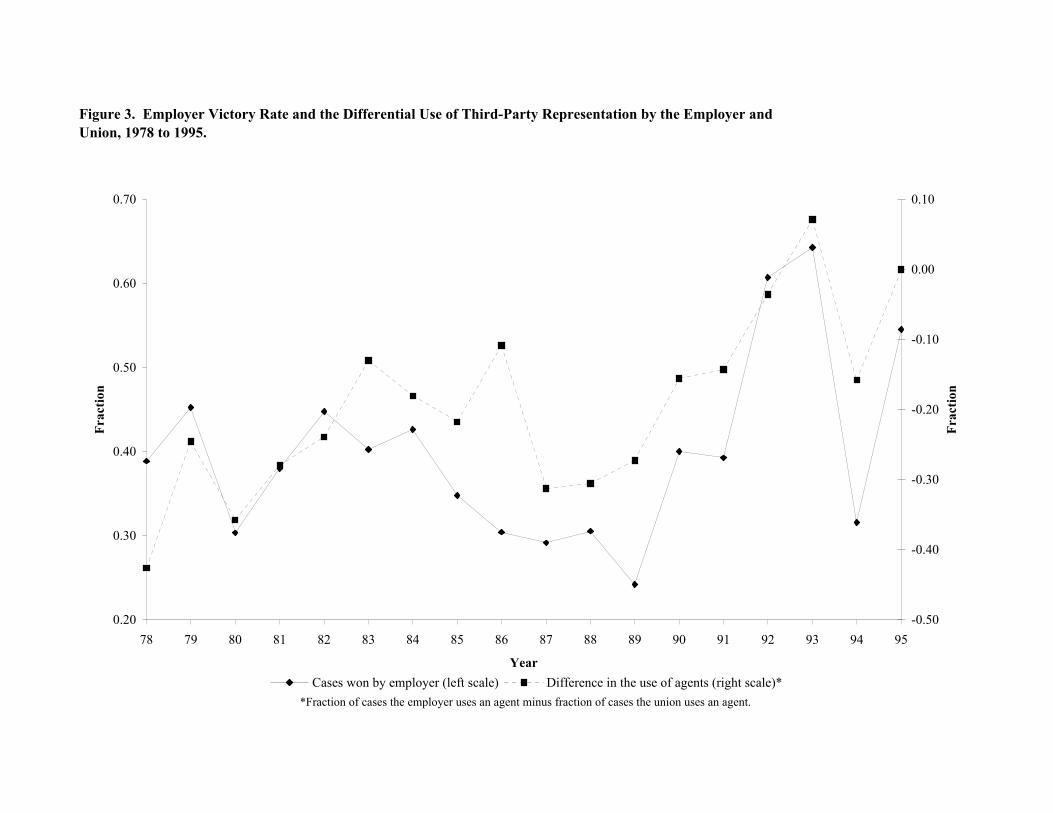
Figure 3. Employer Victory Rate and the Differential Use of Third-Party Representation by the Employer and Union, 1978 to 1995.
0.20
0.30
0.40
0.50
0.60
0.70
78 79 80 81 82 83 84 85 86 87 88 89 90 91 92 93 94 95
Year
Frac
tion
-0.50
-0.40
-0.30
-0.20
-0.10
0.00
0.10
Frac
tion
Cases won by employer (left scale) Difference in the use of agents (right scale)**Fraction of cases the employer uses an agent minus fraction of cases the union uses an agent.
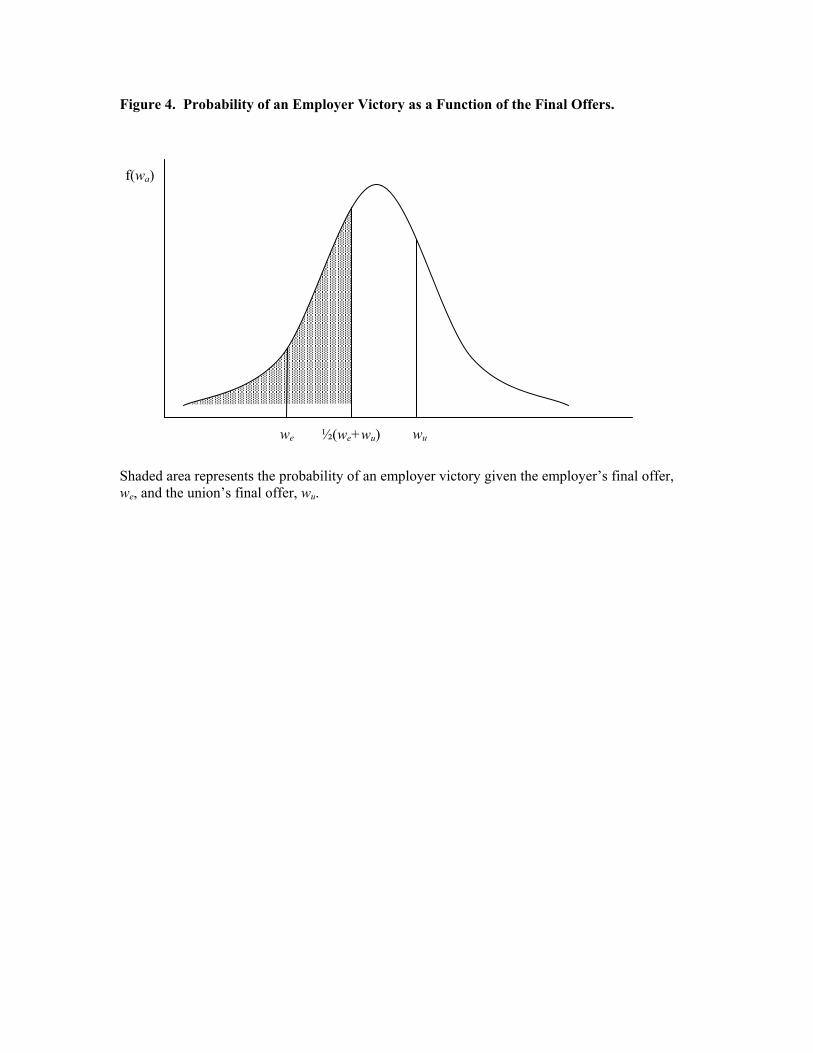
Figure 4. Probability of an Employer Victory as a Function of the Final Offers.
Shaded area represents the probability of an employer victory given the employer’s final offer, we, and the union’s final offer, wu.
½(we+wu)
f(wa)
we wu
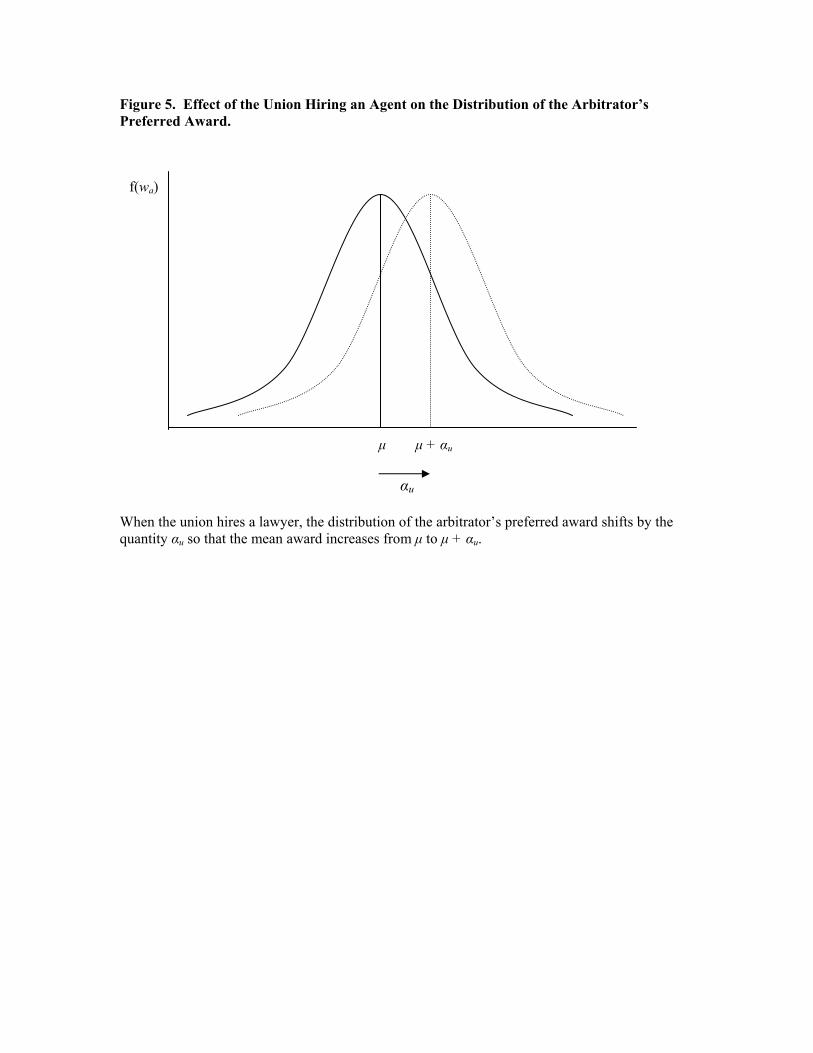
Figure 5. Effect of the Union Hiring an Agent on the Distribution of the Arbitrator’s Preferred Award.
When the union hires a lawyer, the distribution of the arbitrator’s preferred award shifts by the quantity αu so that the mean award increases from µ to µ + αu.
αu
µ µ + αu
f(wa)