Levin Klevorick Nelson Winter Gilbert Griliches Appropriability P&D BPEA 1987

NBER WORKING PAPER SERIES
THE QUALITY OF IDEAS:MEASURING INNOVATION WITH
MULTIPLE INDICATORS
Jean O. LanjouwMark Schankerman
Working Paper 7345http://www.nber.org/papers/w7345
NATIONAL BUREAU OF ECONOMIC RESEARCH1050 Massachusetts Avenue
Cambridge, MA 02138September 1999
We thank Mogee Research and Analysis for making the matched sample and citations data available,Jonathan Putnam for obtaining those data, and Bronwyn Hall, Adam Jaffe and Michael Fogarty for supplyingvarious parts of the firm-level data on patents and R&D used in Section 9 of the paper. We are grateful toZvi Griliches and other participants in the NBER Summer Institute on R&D for constructive comments, andto Giacomo Bruzzo for research assistance. The Nuffield Foundation and the Suntory-Toyota InternationalCentre for Economic and Related Research at the LSE provided financial support. The views expressedherein are those of the authors and not necessarily those of the National Bureau of Economic Research.
© 1999 by Jean O. Lanjouw and Mark Schankerman. All rights reserved. Short sections of text, not toexceed two paragraphs, may be quoted without explicit permission provided that full credit, including ©

notice, is given to the source.The Quality of Ideas: Measuring Innovationwith Multiple IndicatorsJean O. Lanjouw and Mark SchankermanNBER Working Paper No. 7345September 1999JEL No. O31, O32
ABSTRACT
We model early expectations about the value and technological importance (‘quality’) of a patented
innovation as a latent variable common to a set of four indicators: the number of patent claims, forward
citations, backward citations and family size. The model is estimated for four technology areas using a
sample of about 8000 U.S. patents applied for during 1960-91. We measure how much ‘noise’ each
individual indicator contains and construct a more informative, composite measure of quality. The variance
in ‘quality’, conditional on the four indicators, is just one-third of the unconditional variance. We show the
variance reduction generated by subsets of indicators, and find forward citations to be particularly
important. Our measure of quality is significantly related to subsequent decisions to renew a patent and to
litigate infringements. Using patent and R&D data for 100 U.S. manufacturing firms, we find that adjusting
for quality removes much of the apparent decline in research productivity (patent counts per R&D)
observed at the aggregate level.
Jean Olson Lanjouw Mark SchankermanEconomics Department The London School of EconomicsYale University and Political ScienceP.O. Box 208264 Houghton StreetNew Haven, CT 06520-8264 London WC2A 2AE and NBER [email protected]

Innovations vary widely in value. Although partly realized over time, some of this
heterogeneity is related to characteristics of innovations at 'birth'. The recent computerization
of patent applications makes it possible to exploit information on the characteristics of patents
to make an early assessment of innovation quality. In this paper we show how to construct a
measure of the expected value of an innovation, conditional on this early information. We
call this the quality of the innovation, to emphasize its dual technological and value
dimensions. The commercial success of an innovation is something that evolves --there may
be technical improvements, potential markets will be explored, new competitors may arise,
and so on. For this reason, the measure of quality developed in this paper is not the same as
the ex post value of an innovation. However, we would expect them to be related. Recent
studies have found a significant relationship between indicators which appear early after an
innovation's discovery and ex post measures of value derived from stock market prices, firm
profit accounting or survey estimates (e.g., Hall, Jaffe and Trajtenberg, 1999; Harhoff,
Scherer and Vopel, 1999). Since the ex post value of an innovation is only discovered over
time, it would be useful to have an early measure of quality that can reduce the unconditional
heterogeneity in value as of the patent application date.
Information about the early expectations of quality can improve our understanding of
financing and other decisions regarding further development of the innovation. There are no
obvious direct measures of this concept. One approach is to use an event study that examines
changes in stock prices on the announcement of a patent application or grant (Austin 1993).
But event studies are typically sensitive to the timing of information and it is hard to pinpoint
convincingly the arrival of 'news' in this context. Our alternative is to exploit the details of
patent data relating to a given innovation at or near its 'birth.'
Economists have used many patent-based measures of innovation: simple counts of
patents, counts weighted by forward citations (Trajtenberg, 1990), years of renewal (Pakes,
1986; Schankerman and Fakes, 1986), and patent family size (the number of countries in
which the patent is applied for -- Putnam, 1996). Another, under-explored, candidate is the
number of patent claims. Tong and Frame (1994) propose the number of claims as a measure
of the 'size' of an innovation, and show that claims-weighted patent counts are more closely
related to R&D spending at the national level than simple patent counts. Lanjouw and
Schankerman (1997) show that the number of claims is related to the probability that a patent
is litigated. Since the number of claims per patent varies widely, using claims data might help
account for the very large heterogeneity in the value of patents (for a review of the evidence,
Lanjouw, Pakes and Putnam, 1998).

In this paper we analyse a new database that brings together detailed information on
patents in the United States during the period 1960-91 These data provide us with multiple
indicators of a patent's unobservable quality, as assessed soon after the patent application is
made. We focus on four leading characteristics: the number of claims, forward citations.
backward citations, and patent family size. Rather than treat any of these indicators as
'correct,' we analyse them together in a latent variable framework that allows each to contain
idiosyncratic ('measurement') error. This is needed since any single indicator is likely to be
affected by factors other than the quality of the innovation — for example, randomness in the
citing process, or firm-level differences in strategies for writing patent claims. Using multiple
indicators has two important advantages. First, it enables us to identify how much of the
variance in each indicator is related to 'quality' and how much is idiosyncratic. Second, we
can construct a more informative, composite measure of the quality of a patent, conditional on
its observed characteristics. Such an index -- or the component indicators -- can be used to
improve measurement of innovation output for studies of R&D productivity, models of
economic growth that emphasize successful innovation (Aghion and Howitt, 1997), and other
areas in which the output of the innovation process plays an important role.
We summarize a few key findings here. Forward citations and claims are the least
noisy indicators (with as much as 30 percent of the variation being related to 'quality'),
followed by claims and backward citations. We use the estimated signal ratios to construct a
composite index of quality. The variance in quality, conditional on the four indicators, is just
one-third of the unconditional variance. Forward citations are the most important indicator in
terms of variance reduction. The quality index is significantly related to the subsequent
decisions of owners to renew their patents and to take patent disputes to court. Finally, we
apply the methodology to R&D and detailed patent data for 100 U.S. manufacturing firms
during the period 1980-89. Adjusting for patent quality differences substantially reduces the
apparent decline in research productivity (patent counts per R&D) that is observed at the
aggregate level -- the R&D productivity paradox. But we also find that that some of our
'resolution' to the paradox may itself be due to the changing propensity of firms to cite over
time, rather than to any real changes in the underlying quality of innovation.
The paper is organised as follows. Section 1 describes the data set. Section 2
examines the correlation structure of the indicators. hi Section 3 we set out the latent variable
model and show how it generates a composite index of quality. In Section 4 we present the
parameter estimates for the model and discuss what the results imply about the information
content in each of the indicators. In Section 5 we construct the composite quality index
quality, and show the variance reduction achieved by conditioning on different subsets of the
four indicators. Sections 6 and 7 present a formal test for threshold effects of patent family
size and examine the effect of using different lengths of forward citations ('citation-spans').

3
Section 8 investigates the empirical relationship between the four indicators, and the
composite quality index, and two subsequent economic decisions by the patentee: first, the
decision to renew patent protection and, second, the decision to defend the property rights by
taking a patent dispute to court. In Section 9 we show how adjusting patents counts for
differences in quality affects the co-variation between R&D input and innovation output, both
across firms and over time. Brief concluding remarks follow.
1. Description of the Data
The data comprise a set of U.S. patents applied for during the period 1960-91. One of
our interests is to examine the relationship between our composite indicator of quality and
patentees' subsequent decisions to engage in litigation. As litigation is an uncommon event,
involving less than one percent of patents on average, we began our data construction by
purposefully selecting litigated patents. Using the Derwent compilation of U.S. Patent and
Trademark (FF0) information, we identified 3,887 U.S. patents involved in 5,452 patent
cases during the period 1975-1991.' We then generated a 'matched' set of patents. For each
litigated patent, a patent was chosen at random from the set of all U.S. patents with the same
application month and a common 4-digit International Patent Classification (IPC) sub-class
assignment. This sampling strategy ensures that we have a sufficient number of litigated
patents to make an investigation of this characteristic meaningful. Earlier analysis of these
data in Lanjouw and Schankerman (1997) indicates that litigated patents are more valuable,
which means that this sampling strategy also over-represents more valuable patents, and
provides more variation in our indicators.
By drawing on other data sources, we obtained information on a range of
characteristics for each matched and litigated patent. These include the number of claims, the
number of backward and forward citations, and the number of countries in which a patent
application was filed on the innovation (family size) -- the variables used in the estimation of
the latent variable model in Section 3. We also have information about the technology area of
the innovation, the nationality of the patentee, and whether or not patent renewal fees were
paid at age 4. We now briefly describe each of these variables.
Claims: A patent is comprised of a set of claims that delineate what is protected by the patent.
The principal claims define the essential novel features of the invention in their broadest form
The U.S. federal courts are required to report to the PTO whenever a case is filed involvinga U.S. patent. Due to under-reporting, we estimate our data include about half of all cases

4
and the subordinate claims describe detailed features of the innovation. The patentee has an
incentive to claim as much as possible in the application, but the patent examiner may require
that the claims be narrowed before granting. The number of claims is now readily available
on a PlO CD.
Citations: An inventor must cite all related prior U.S. patents in the application. A patent
examiner skilled in the field is responsible for insuring that all appropriate patents have been
cited. Like the claims, these help to define the rights of the patentee. For each patent in the
litigated and matched data, we obtained the number of prior patents cited in the application
(backward citations). We obtained the same information on all subsequent patents that had
cited a given patent in their own applications, as of 1994 (forward citations). We construct
three forward citation measures. FwdS includes all forward cites to the patent that occur
within five years of the patent application date, a period which we call the 'citation span'
(FwdlO and Fwdl5 are defined similarly). Each variable requires a different truncation of
cohorts, but treats all patents within eligible cohorts symmetrically.2
Family Size: In order to protect an innovation in multiple countries, a patentee must secure a
patent in each country. We call the group of patents protecting the same innovation its
'family' (these are also commonly called parallel patents). Because there are fees, translation
and legal costs associated with applying for and maintaining each patent in force, only a
fraction of patentees seek protection outside of their home markets, and a yet smaller fraction
find it worthwhile to patent widely.3 (About 5% of U.S. domestic patent owners request
protection in more than 10 countries.) International agreements give inventors at most two
and a half years to file all worldwide applications, so family size is established early.4
Technology Group (IPC): Each patent is assigned by the patent examiner to 9-digit categories
of the technology-based IPC classification system. Our data contain assignments at the
filed during this period, but there is no evidence of selection bias in a comparison of casesreported and those unreported (for details, Lanjouw and Schankerman, 1997).
2 This procedure involves discarding some information (citations that occur outside the span).The alternative is to use all observed cites for each patent, but then the analysis wouldconflate any cohort effects with the effects of changing citation span.
By going through the European Patent Office, a patentee may request protection in morethan one member country with a single application. But this does not reduce the costs oftranslating the patent documents, the renewal fees and other legal costs in each country.

5
aggregated 4-digit subclass level (614 in number). Using these detailed assignments, we
classify each patent into one of four broader technology groups: Pharmaceuticals, Chemicals,
Electronic and Mechanical.5
Nationality: We construct a variable for the nationality of each patent owner. First we
classify the inventor as domestic, Japanese or other foreign using the address in the patent
application. Although all patents are issued to individuals, about two-thirds of patents are
assigned by their inventors to other parties (e.g., employers). We define the nationality of
patent ownership as that of the assignee if there is one, otherwise as that of the inventor.
Patent Renewals: Patent renewal fees were introduced in the United States in 1982, and apply
to patents applied for after that date. Renewal fees are required at 4, 8, and 12 years after the
patent grant date. The data contain renewals through 1994. Since nearly all patents in the
U.S. are granted within three years, the data will cover the renewal decision at age 4 for most
of the patents in cohorts 1982-1987.
2. Correlation Structure of the Indicators
Table 1 summarises the correlation structure of the indicators for the entire sample,
and separately for domestic and foreign-owned patents. Since the raw data are skewed, we
log transform indicators (except the dichotomous renewal and litigation variables).6 Several
points are worth noting. First, all of the 'time-zero' indicators -- the number of claims,
backward cites and family size -- are positively and significantly correlated with each other.
Second, patent family size is more strongly correlated with the other time-zero indicators for
domestic-owned patents than for foreign-owned patents. Since more than two-thirds of
domestic patents are not taken out abroad (family size = 1), the correlation of family size with
other indicators for the domestic sub-sample reflects the effect of innovation quality both on
the number of countries and the initial decision to patent abroad at all. Thus the correlation
patterns suggest that there may be a threshold effect: that the important information about the
quality of the innovation may be in the decision to take out a patent in any foreign country
The Paris Convention gives applicants twelve months to apply in other signatory countriesafter having made the first, or priority, application. The Patent Cupertino Treaty allows a 25month period after a priority PCT application, increased to 30 months in the late 1980's.
The IPC categories included in each of these groups are: Drugs and Health, A61 and AO1N;Chemical, A62, B31, C01-C20; Electronic, G01-G21, H-; Mechanical, B21-B68 excl. B31,C21-C30, E01-F40.
6 An observation is dropped when a citation value is zero.

6
rather in the in how many countries. In Section 6 we construct a parametric test of this
hypothesis.Third, the correlation coefficients between forward citations and the other time-zero
indicators are not systematically larger when longer citation spans are used (compare Fwd5,
FwdlO and Fwdl5). Later citation is progressively less correlated with early citation. The
correlation between the number of citations in the first five years and thosethat occur during
years 6-10 is 0.54; the correlation with those occurring during years 11-15 is 0.38. This could
be due to increased arbitrariness in later citation. However, another plausible explanation is
that, at least to some extent, later citations represent real news about the realised value of an
innovation, which cannot be predicted by information available at the patent applicationdate.
The latter explanation is suggested by the finding of Jaffe, Hall and Trajtenberg (1999) that
later (unpredicted) citation is more strongly related to the market value of firms than are
(forward) citations that have already occurred (see Section 7 for more discussion).
Finally, the time-zero indicators are positively correlated with the probability that the
patent is renewed at age four and that it is involved in litigation during its life — both of which
represent a subsequent economic decision by thepatentee.7 Patent renewal is correlated most
strongly with family size, while litigation is correlated most strongly with the number of
claims. We consider these relationships in a multivariate setting in Section8.
We have estimated that the patentee or his representative, such as an exclusive licensee, is
the plaintiff in about 90% of cases (Lanjouw and Schankerman, 1997).

7
3. Latent Variable Model
To investigate the information content in our indicators and construct a composite
measure of quality, we estimate a one-factor latent variable model. It can be written as
(1) YkI =Uk + Akq, + ek q — N(O, 1) and ek — N(O, 0k),
where i denotes the patent, k = 1 K denotes observable indicators, q is the common factor,
and 2k is the factor loading for indicator k. Since the common factor is unobservable, we
normalise by setting O2= 1 (the alternative is to normalise one of the , but the interpretation
does not change). In addition to the common factor, each indicator contains an idiosyncratic
factor ek' with variance 02k. This captures any variation not common to the other indicators
used in the model.
The common factor is simply the unobserved characteristic of a patented innovation
that influences all of the indicators, so we must consider what this characteristic could be. In
the estimations we use as our indicators the number of forward and backward citations, claims
and family size. Because applying for protection in each country is costly, family size should
be directly related to the expected (private) value of protecting an innovation and thus to the
value of the innovation itself.8 This, in turn, will be linked to the technological importance of
the innovation and market opportunities. The number of citations is related most directly to
the technological importance of an innovation. Having a large number of forward citations
over a long time span may indicate that an innovation has made an important contribution to
further research. Having been cited frequently soon after application suggests that an
innovation was quickly identified as being important. It also indicates the presence of others
working in a similar area, and thus that the area is expected by others to generate economic
value. This is also true of backward citations, although large numbers of citations to others
also suggests that the particular innovation is likely to be more derivative in nature. The
number of claims may also indicate that an innovation is technologically sigiificant — a
broader area of technological space is being staked out. All else equal, it may also require
more claims to define an innovation in an area in which competitors are actively patenting.
Thus, as with citations, a large number of claims may be associated with the general
feasibility and potential profitability of the technology area of the innovation.
We call the common factor quality, encompassing the technological significance of
an innovation as associated with its (private) value, because we find it difficult to think of any

8
other characteristic that would be common to all four indicators. For example, while
computerisation might increase the number of backward and forward citations per patent, by
making it easier to search for relevant prior art, there is no reason that this would increase the
number of claims per patent. Similarly, changes in patent application fees would affect patent
family size, and possibly the number of claims per patent (as ideas are repackaged into
'broader' patents), but this would not directly affect patent citations.9 We show later that
estimates of this common factor are correlated with the economic decisions to renew and
litigate the patent.
The one factor model implies the following theoretical covariance matrix of
indicators
(2)
where bold letters represent column vectors and y is the vector of indicators demeaned by
nationality and technology group as appropriate. 'J =E[eel is assumed to be diagonal. That
is, the idiosyncratic factors are assumed to be uncorrelated across indicators (or patents),
which seems reasonable in this context'° We estimate the model by maximum likelihood.
This involves finding the set of parameters {)k} and {O2j} that make the theoretical
covariance matrix as close as possible to the observed correlation structure. The one-factor
model with K indicators has K(K+1)/2 observed covariance terms and 2K parameters. This
leaves K(K-3)12 over-identifying restrictions that provide a test of whether a one-factor model
is an adequate representation of the observed covariance structure. As K = 4, we have two
over-identifying restrictions.
Under our assumptions, the latent variable and K indicators have the joint normal
distribution
[ql rl '(3) I —N(O,I), whereX= I
LY] L-
8 For related evidence, see Putnam (1996) who initiated the study of patent family size as aneconomic decision.
These examples may suggest that the covariance structure of the indicators might requiremore than one common factor in order to account for covariance among subsets of indicators.However, we will show that a one-factor model is not rejected by the data.
tO Firm effects arising from variation in patenting strategies are limited by the input of thePTO, and multiple patent office examiners influence indicators for a given patent (e.g.,forward citations are given by examiners in different time periods, and family size depends onexaminers in multiple countries.)

9
We can write the posterior mean and variance of the latent variable, conditional on the
observed indicators, y, as
(4)
and
(5)
E[qly] =
Var(qly) = 1- 'A'A.
Given a set of estimated factor loadings, equation (4) provides an estimate of the latent
variable for each patent (as deviation around mean zero), which we will use as a measure of
its quality. The conditional posterior mean of the latent variable is a linear combination of the
set of indicators, where the weights depend on the factor loadings. Note that the conditional
posterior variance of quality is a constant that can be estimated, but it does not depend
directly on the indicators. The quadratic form in equation (5) represents the percentage
reduction in the variance of quality due to conditioning on the set of indicators, y (since the
unconditional variance is normalised to one). Finally, with a suitable redefinition of y, ) and
A, equations (4) and (5) also apply to cases where only a subset of the indicators is available
to predict the latent variable.
4. Estimation Results and the Information in Indicators
Table 2 presents the parameter estimates of the model for the four technology groups
and the pooled sample. We include nationality of ownership effects in the first and
nationality and technology group effects in the pooled estimation. The table presents the
results using a five-year span for forward citations (FwdS). (We discuss the implications of
using alternative citation spans in Section 7 below.)
The factor loadings are estimated fairly precisely.
common factor is rejected for each technology group and the
not reported in the table). The over-identifying restrictions
The hypothesis that there is no
pooled sample (p-values <0.001;
are not rejected at the 0.05 level
except for the pooled sample ( (2) statistics), but even here they are not rejected at 0.01
level." These results confirm that a one-factor model is a statistically adequate description of
the covariance structure of these indicators.
Table 2 also presents estimates of the signal ratios, Sb defined as the percentage of
the variance of the kth indicator associated with the common factor. Given the normalisation

10
=1, we have Sk = Ak k where C2y,k is the variance of the kth indicator demeaned by
nationality and technology group as appropriate. For the pooled data, all of the signal ratios
are statistically significant and range from about ten to thirty percent. In all four technology
groups, forward citations and claims are the most informative indicators. Forward citations
have the largest signal ratio, except among mechanical patents. The signal ratio for forward
citations is especially large in drugs and chemicals. It is interesting that both backward and
forward citations are more informative indicators when considering patents on drug or
chemical innovations than for patents in the other two technology groups.
One might argue that the claims in a patent represent more meaningful 'units of
invention' than the patent as a whole. If true, we would expect citations per claim to be a
better indicator than either citations or claims alone. We find that controlling for claims does
reduce the variance in our citation indicators. The reduction is modest in the case of
mechanical and electronic innovations. The between-group variance (defined by the number
of claims) accounts for about 7 to 12 percent of the total variance in the log of five-span
forward citations, and 6 to 8 percent for the log of backward citations. It is a more significant
reduction for drug and chemical patents, with the between-claims component of the total
variance being about 20 percent for forward and 15 percent for backward citation in each of
those technology areas.
However, the fact that controlling for claims reduces the variance in the citations
indicators does not imply that it yields a measure which is more informative about quality.
The results in Table 2 imply that normalizing for claims does not improve the signal ratio for
forward or backward citations. To see this, define forward citations per claim (in logs) as Zd
= Yfd - ye,,,,. Using equation (1), the variance of Zd is a2 (zfrd) = -A1)2 +a2The signal ratios for za and YJd are (Ad -A,,,J2 /a2,,d and Ad 2 /a2Yd, respectively. The
relative size of these signal ratios depends on the parameter estimates (the same argument
holds for backward citations). In the extreme case, where citations and claims have the same
factor loadings, citations per claim would be entirely unrelated to the latent variable. Using
the estimated factor loadings in Table 2, it turns out that both forward and backward cites per
claim are much noisier measures than either claims or forward or backward cites. This
conclusion holds for the pooled sample and each technology group. The estimated signal
ratios for Zd are less than 0.03, except for drugs where it is 0.06; for ZbVd, all signal ratios are
less than 0.03.
The point estimates indicate that Abd< in all technology groups except drugs,
where they are nearly identical. This implies that backward cites per claim are inversely
The over-identifying restrictions are also not rejected for any technology group when weseparate domestic and foreign-owned patents.

I'
related to the quality of the innovation. We also find that )d>A in all technology groups
except mechanical patents, where they are nearly identical. This implies that forward cites
per claim are positively related to quality. We interpret these findings as saying that the
extent of citation contains information about how derivative an innovation is. Conditional on
the patent breadth, as picked up by the number of claims, an innovation with more backward
citations (more references to relevant prior art) is more likely to be a derivative innovation,
and thus less valuable. An innovation with many forward citations is likely to be more
valuable per claim than one with fewer cites. These results are consistent with Lanjouw and
Schankerman (1997), who found that the probability of litigation declines with backward cites
per claim and increases with forward cites per claim, other things equal.
5. Composite Indicator of Innovation Quality
As discussed in Section 3, we can use the estimated factor loadings to compute
estimates of the conditional mean and variance of the quality of an innovation, given a set of
observed characteristics of a patent. In this section we present the relative contribution of
each member of our set of indicators to the 'composite index' of quality, and show how the
variance in quality conditional on a given set of indicators is affected by restrictions on those
included.
The conditional (posterior) mean of quality is a linear combination of the indicators
(see equation (4)). Table 3 presents the implied weights for each indicator, based on the
parameter estimates from Table 2. For the pooled sample, forward citations get about a third
of the weight, claims and backward citations get a quarter each, with the remainder to family
size. This pattern is broadly similar across technology fields, with the main difference being
that forward and backward citations get greater weight in pharmaceuticals (75 percent
between them), while patent family size is considerably more important for electronic and
mechanical patents than for drugs and chemical innovations.
Because putting together sets of indicators may be costly, we next consider the
potential gains from using multiple indicators. Some may be particularly important and this
may vary by the technology area of the innovation. It is not necessary to have four indicators
— the single latent variable model is estimable with any subset of K =3 indicators (see Section
3)12 Further, one could use the estimates here, or from elsewhere, to construct an estimate of
q from any subset of the indicators without re-estimating the model, as long as one is willing
12 course, the factor that is "common" to a particular subset of three indicators may differfrom that which is "common" to our four, yielding a different composite quality indicator.

12
to assume a similar correlation structure holds across the different sets of data. Thus we
consider how the conditional variance of quality (equation 5) varies when using different
subsets of the indicators to predict the latent variable. Table 4 presents the results, based on
the parameters from Table 2. The unconditional variance is normalised to unity, so the entries
in the table represent one minus the estimated percentage reduction in variance we get by
using different subsets of indicators.
Conditioning on all four indicators — the log of forward cites, claims, family and
backward cites -- reduces the conditional variance of the latent variable by about two-thirds in
all four technology groups. Relative to this benchmark, forward citations are the most
important indicator. When we drop only forward citations from the composite indicator, the
variance increases by 43 percent for the pooled sample. The increase is especially large for
patents in the drugs and chemical groups, 75 and 61 percent respectively, but even for
electronic and mechanical patents the increase is about 40 percent. When we drop only
claims, the variance increases by about 35 percent for the pooled sample. The effect of not
using the information in the number of claims is more modest for drug and chemical patents,
increasing the variance by 14 to 20 percent, compared to 40 to 50 percent for electronic and
mechanical patents.
Patent family size is less important than forward cites or claims in the pooled sample.
Dropping family size raises the variance of the latent variable by about 14 percent. But again
this varies by technology field: the variance increases by 20 percent for electronic and
mechanical patents, but by only about 5 percent for drugs and chemicals. In part this may be
due to a greater propensity to patent drug and chemical innovations abroad, so the information
content of family size for the marginal patent is smaller. In drugs and chemicals, about half
of domestic-owned patents are taken out abroad (47.8 and 52.8 percent, respectively). For
electronic and mechanical patents, the figures are 34.9 and 42.9 percent.
Information on the number of claims and backward citations is available in the patent
application and is thus relatively cheap to obtain. The last row of computations shows that,
in each technology area, we get a substantial reduction in the conditional variance of quality
even if we restrict ourselves to these two indicators. However, there is also a sizable gain to
obtaining the full set of indicators. In the pooled data, the implied reduction in the variance is
40 percent when conditioning only on the number of claims and backward citations,
compared to the two-thirds reduction in the conditional variance when all four indicators are
used.
Also note that the latent variable model with three indicators is exactly identified and thus isnot testable.

13
To summarize, there is a substantial information gain to using multiple indicators to
measure the quality of an innovation, and a large payoff to including (five-year span) forward
citations in a composite index, especially for drug and chemical innovations.
6. Testing for Threshold Effects in Patent Family Size
In this section we investigate the finding in Section 2 that family size is more strongly
correlated with the other indicators for domestic-owned than foreign-owned patents. We
want to test the hypothesis suggested earlier that this is due to a threshold effect: that quality
is more closely linked to the decision whether to patent abroad than it is to the number of
countries in which protection is sought. We ask the following question: What does a unit
increase in (log) family size tell us about the quality of the patent? If we compute the
posterior mean of quality conditioning only on family size, then using equation (4) we obtain
the answer E[q IfamI/afam = ).j,,,/ This forms the basis of the test reported in Panel A
of Table 5. We estimate the model twice: once on the sample of those domestic-owned
patents where protection was also taken out abroad (family > 1), and then on the sub-sample
of all domestic-owned patents (family � If there is no threshold effect, then the
estimated parameter should not be significantly different for the two samples. If
there is a threshold effect, this ratio should be smaller when the restricted sample of domestic
patents (family > 1) is used, since it does not capture the effect of quality on the decision to
patent abroad in the first place.
If instead we suppose that all of the indicators are used to predict the posterior mean
of quality, then the appropriate answer is EtIq IyjfiJfam = A'Oam where o,,, is the column
vector of A' that corresponds to family size. In this case, the inference we draw about quality
from a unit increase in family size depends in a non-linear way on the covariance of family
size with the other indicators. In Panel B of the table we present the point estimates of
for the sample of all domestic-owned patents (family � 1) and for the sub-sample of domestic-
owned patents where protection was also taken out abroad (family> 1).
' We focus on domestic-owned patents in order to avoid confounding the test by nationalityeffects. However, the decision to patent in a foreign country may be particularly informativefor U.S.-owned patents. The size of the U.S. domestic market means there is less incentive topatent abroad (so the quality threshold for doing so is higher). However, for patents ofEuropean and other ownership, patenting abroad is more common and marginal increases infamily size may be a more important signal of quality. We cannot test this hypothesis withthe current data, but there is some supporting evidence in Harhoff, Scherer and Volpel (1999).Using German patent data, they find that family size is a significant determinant of theprobability that a patent is renewed to full term.

14
The first row of each panel provides estimates for all domestic-owned patents, while
the second rows refer to the restricted sample. The evidence is consistent with the existence
of a threshold effect: the point estimates of the factor loading are smaller for the restricted
sample, as predicted. This holds for each technology group and the pooled sample. Using a
one-tailed t-test, we reject the null hypothesis that the point estimates are equal in the pooled
sample and in two of the four technology groups.'4 The point estimates in Panel B are also
consistent with the threshold hypothesis. In each technology group, the estimate of A'a,,, is
smaller for the restricted sample of domestic patents with family> 1, as predicted.
7. Expected Quality and Subsequent Events: Forward Citations
One of the costs of using forward citations as an indicator is that they take time to
accumulate. Jaffe and Trajtenberg (1997) show that the time profile of citations stretches
over several decades, though the bulk of citations occur within about fifteen years. Thus there
may be a trade-off between comprehensiveness and timeliness in using forward citations.
Although later citations only accumulate over time, they may be a better measure of what the
patentee and others know at time zero than a measure restricted to citation close to the date of
the patent application. If so, then even though the latent variable q refers to the quality of an
innovation as seen soon after discovery, it may be worthwhile to include later citations in the
estimation of this factor.
We found in Section 2 that citation over longer time spans becomes increasingly less
correlated with separate, individual, time-zero indicators. To examine this further, we
estimate the one-factor model using three alternative forward citation spans -- five, ten and
fifteen years. Table 6 summarises the signal ratios for the three citation spans (detailed
parameter estimates are omitted for brevity). Except in drugs, lengthening the citation span
beyond five years does not improve the information content in this indicator.'5 For drug
patents, the point estimates indicate some gain from extending the span, but it is not
statistically significant. This finding is good news: as Table 6 shows, forward citations are
This t-test is conservative (biased against rejecting the null). The reason is that the twosamples of domestic patents overlap, which induces positive covariance between the estimates
and )L',,, (where '0' indicates all domestic patents and '1' those with family> 1). Wedo not account for this covariance, and thus overestimate the standard error of -
IS Because longer citation spans encompass shorter ones (e.g., FWD5 is a subset of FWD1O),the observed differences in the signal rates understate the decline in the information contentassociated with later citations.

15
the most informative of our set of indicators and using them is important.'° For purposes of
measuring initial expectations about the quality of a patented innovation, it is not necessary or
even helpful to use very long citation spans.
This result shows that later citations are less correlated with the common factor that
underlies other time-zero indicators, those generated at the patent application date. In part this
may be due to a 'citing the classics' phenomenon -- the underlying quality of the innovation
may be unchanged over time, but later citations are only distantly related to it. However, a
second explanation is that later citations reflect the ultimate success of in innovation.
Patentees and others have an initial assessment of the quality of an innovation but, as time
passes, they learn about the value of a patented innovation (Pakes, 1986; Lanjouw, 1998) and
shifts in demand conditions and technological competition may change its value. While time-
zero indicators and near term citations (e.g., FWD5) are useful in predicting future citations,
later citations also convey news about changes in market valuation of the innovation.
Because learning and competition take time to develop, we would expect the positive
correlation of later citations with the time-zero indicators to diminish over time. This
interpretation is supported by Hall, Jaffe and Trajtenberg (1999), who show that the market
value of firms at a given date is related to the stock of forward citations occurring after that
date but not those that have already occurred. When they decompose future citations into a
part that is predicted by 'past' forward citations (and time dummies) and an unpredictable
component, they find that both matter but the unanticipated part of forward citations has a
stronger impact on market value.
8. Quality and Subsequent Events: Patent Renewal and Litigation Outcomes
We have shown that using multiple indicators improves the prediction (reduces variance)
of the expected quality of innovations. But quality in that analysis is entirely 'self-referential'
in the sense that it is defined exclusively in terms of the common factor linking the four
indicators. We now consider whether the composite measure of quality is related to
independent, economic decisions of the patentee. First we investigate whether the composite
index is related to the probability that the patent is renewed at age four, and then to the
likelihood that it is litigated at some point during its life. In Section 9 we analyse how
adjusting patent counts for quality differences (where quality is measured by the composite
index) affects the relationship between R&D, a measure of inputs into the innovative process,
and patent counts as a measure of innovative output.
16See also Section 5 where we show that forward citations substantially reduce the
conditional variance in the composite quality index.

16
We estimate two probit specifications to study both the probability of renewal and
litigation: one with the composite measure of quality as an explanatory variable and a second,
unrestricted model in which the four basic indicators -- the logs of the numbers of forward
citations (five-year span), claims, family size and backward citations -- enter separately. Ineach case one can view a comparison of the coefficients in these models in two ways. If one
takes it as a maintained hypothesis that all four of the indicators are related to the dependent
variable only through their relation to quality (based on time-zero information), then one can
view it as a test of the weighting scheme proposed in Section 5. The unrestricted coefficients
on the four indicators should satisfy the proportionality restrictions implied by the weights for
the composite indicator presented in Table 3. The chi-square tests with three degrees of
freedom reported in the table test these restrictions. On the other hand, if one takes it as a
maintained hypothesis that the weighting scheme appropriately reflects the strength of each
indicator's link to quality (based on time-zero information), then deviations from
proportionality are informative and potentially interesting in their own right.
As described in Section 1, maintaining a U.S. patent in force requires the payment of
renewal fees 4, 8 and 12 years after granting. First-generation economic models of patent
renewal relate the decision to renew a patent to the cost of renewal, the unobserved initial
returns to holding the patent, and the age of the patent which reflects the cumulated decay in
returns (Pakes and Schankerman, 1984; Schankerman and Pakes, 1986). We estimate a probit
regression for the probability of renewal decision at age 4 (available data for age 8 are too
sparse). Because the Patent Office adjusts fees for inflation, the cost of renewal depends on
the age of the patent but not on the cohort. Therefore, both the renewal cost and depreciation
effects will be absorbed in the constant term of the regression, and we can simply relate the
probability of renewal to the indicators of the quality of the patent (or the composite quality
index). All of the estimations control for nationality of ownership, and allow for technology
group effects in the pooled sample.
Table 7 presents two columns for each technology and the pooled data containing
unrestricted and restricted parameter estimates for the probability of renewal at age 4. The
key determinants of this probability are the number of forward citations and family size. This
holds in three of the four technology groups and the pooled sample. The number of claims
and backward citations do not appear to affect the renewal decision.17 When we substitute the
In a recent study of German patent data, Harhoff, Scherer and Vopel (1999) also find thatforward citations in the European Patent Office are significantly related to the probability thata patent is renewed to full term, and that this effect is large for drugs and chemicals.However, contrary to our result, they find that the number of backward citations is positivelyrelated to full term renewal. The difference in results may be due to the difference between

17
composite index of quality for the separate indicators, we obtain very similar and significant
point estimates for its coefficient in the different technology groups and pooled sample.
However, the tests of the proportionality restrictions that are implied by the composite
measure are not strongly confirmed by the data. Formally, we cannot reject the restrictions in
drugs, chemicals and electronics, but each case of non-rejection reflects the imprecision of the
point estimates on claims and backward citations. This may be due, in part, to there being too
little variation in renewal at age 4 to identify the impact of claims and backward citations (the
renewal rate at age 4 varies between 86 and 92 percent). Extending the data forward in time
to include substantial coverage of renewal at ages 8 and 12 would help to sharpen the
analysis.
These results suggest that the probability that a patent is renewed at age 4 is more closely
related to the number of forward citations it receives and its family size than would be
suggested by these variables as indicators of initial quality alone. As indicated earlier, this
result can be interpreted to mean that the weights in the composite quality index are
inappropriate, or that these indicators have other ties to the renewal probability beyond time-
zero expectations of the quality of the underlying innovation. As an example, patent family
size may have an additional link to patent renewals (beyond its role in the innovation quality
index) because the decisions to renew and to apply for protection in other countries are both
based on the value of patent protection, rather than the value of the innovation itself.
Table 8 presents the corresponding unrestricted and restricted parameter estimates for
the litigation equation. The binary dependent variable here is whether the patent is involved
in a patent suit sometime during its life. We find that the number of forward citations, family
size and the number of claims are all significant determinants of the litigation probability.
This holds in all technology groups (except family size in electronics) and in the pooled
sample. Backward citations are only related to the litigation of chemical patents. When we
substitute the composite index of quality for the separate indicators, we obtain similar and
significant point estimates for its coefficient in the different technology groups and pooled
sample. However, the proportionality restrictions are rejected in three of the four technology
groups and in the pooled data. The main reason for the rejection is that the composite quality
index gives about a quarter of the weight to backward citations, but they do not affect the
probability of litigation once we control for the other characteristics of a patent.
The main difference between the patent renewal and litigation regressions is that the
number of claims does not affect renewal at age four but does influence the probability of a
patent suit. This finding is consistent with the hypothesis that a patentee needs more claims
renewal to age 4 and to full term, or to the fact that they do not control for the number ofpatent claims.

18
to delineate his property rights in 'crowded' teelmological areas, where the potential
infringement of other competing innovations is particularly likely if only a few broad claims
are used to define the innovation. It is in such crowded areas that we also expect litigation to
be more likely.
Finally, we test for evidence of a threshold effect of family size in the renewal and
litigation decisions. To do so, we include in renewal and litigation regressions a dummy
variable (Big lam) that takes the value of unity when family size is larger than one (that is, for
foreign-owned patents and domestic-owned patents taken out abroad) and zero otherwise. If
there is a threshold effect (i) the coefficient on the threshold dummy should be positive, and
(ii) the coefficient on family size should be smaller than in the probit that excludes the
threshold dummy. Table 9 summarises the results. The first row in each panel reports the
coefficient on family size from the probit without a threshold dummy (taken from Tables 7
and 8). The second and third rows in each set present the coefficients on family size and the
threshold dummy from the expanded model. The estimates for the pooled sample confirm the
predictions of a threshold effect. When the threshold dummy is included in the probit
regression, its coefficient is positive and significant, while the coefficient on family size is no
longer significant. This holds both for the renewal and litigation equations. The results for
the separate technology groups, where the sample sizes are smaller (especially for renewals)
point in the same direction. In all cases the point estimates move in the expected direction:
the coefficient on family size falls and the coefficient on the dummy variable is positive, but
the estimates are not always statistically significant.
Based on the evidence in Table 9 and Section 6, we conclude that the important decision
revealing the quality of the innovation is the decision to take a patent out abroad, rather than
how many countries in which the application is made (at least for U.S. patents). A number of
studies of patent renewal have found that domestic-owned patents tend to have lower value
than foreign-owned patents. Our finding suggests that this difference may not be due to any
inherent difference in value between domestic and foreign-owned patents, but rather to the
fact that domestic-owned patents are comprised of two distinct sub-samples -- patents that are
exclusively domestic and those that are patented abroad. Another implication is that future
econometric studies that use patent family size should allow for a free parameter to capture
this threshold effect.
9. Quality-Adjusted Patents: Is the Decline in R&D Productivity Real?
In this section we analyse how adjusting for the differences in patent quality affects our
understanding of the relationship between investment in the R&D process and innovative
output. To do so, we need a data set that contains both detailed patent information and the

19
associated R&D. We use an extract from the NBER-Case Western Reserve University R&D-
Patents Master File, 1959-1995, which covers more than 2000 firms. For illustrative purposes
we use a sample of 100 U.S. manufacturing firms for the period 1980-89. For each firm we
have all of the patents it applied for during the period and its annual R&D expenditure.'8
Average firm size is large (around 10,000 employees), with an average of almost 40 million
1998 dollars of R&D expenditure and 24 patents per year. But there is considerable variation
in these characteristics, with standard deviations more than twice the mean levels. Of the 98
firms, about a third did not obtain any patents during the decade under study.
We selected 25 firms in each of four broad SIC groups that correspond roughly to the
technology groups analysed in this paper.'9 The concordance between the industrial
classification of the firm (and its R&D) and the technology classification of patents (based on
the IPC) is very imperfect. It is probably best for pharmaceuticals, where firms typically
specialise in development of drug innovations (though sometimes these are first classified as
chemical patents). The concordance is not very reliable for electronic and mechanical
patents, since firms in these two broad groups often patent in one another. For this reason we
will focus on the results for the pooled sample and pharmaceuticals.
For each patent in the sample we obtained information on forward and backward
citation and the number of claims. In order to calculate a quality index for these patents we
could re-estimate the one-factor model using the new sample and this subset of three
indicators, as discussed in section 5. But the sample is small and it seems reasonable to
assume that the correlation structure of the indicators is similar to that in the much larger
sample of litigated and matched patents used above. Therefore, for this illustration we use the
parameter estimates from Table 2 and the three indicators available for each patent in this
sample to predict the composite quality measure (posterior mean) for that patent.
In order to study the time series movements of quality, patent counts and R&D, we
compute an average quality index for all patents in a given cohort. These are presented in
Figure 1 for each technology group (normalised at unity in 1980). The average quality rises
over the decade in all technology groups by more than 30 percent. Taken at face value, this
means that simple patent counts substantially understate the growth in quality-adjusted
patents. As Figure 2 shows, R&D spending for these firms rose by more than 80 percent over
this period, while the number of patents increased by only 30 percent. Adjusting for changes
in the composite quality index removes most of this apparent decline in research productivity.
The index of weighted patent counts (denoted by wgtcnts) tracks R&D spending much more
IS Two firms are not usable due to missing R&D.

20
closely and shows almost the same cumulative growth over the decade. The correlation
between annual R&D investment by our sample of firms and their total patents is 0.89,
between their R&D and total quality-weighted patent counts is 0.97.20 For comparison, we
also provide a patent count measure weighted only by the number of forward citations (five-
year span), denoted by cit5cnts. Adjusting for forward cites tracks R&D better than
unadjusted counts, but still indicates considerable decline in R&D productivity. Of course,
we do not know whether productivity was roughly constant or declined, but this example
clearly shows that adjusting for quality can dramatically change our conclusions about what
has happened to R&D productivity over time.
Figure 3 presents the same information for pharmaceuticals, where the concordance
between the technology-based classification of patents and the industry-based classification of
R&D is good.2t On the face of it, there was a dramatic decline in R&D productivity: R&D
grew more than two-fold without any overall increase in the number of patents. Here
adjusting for quality is even more important than in the pooled data. The correlation between
the annual R&D investment of our pharmaceutical firms and their total patents each year is
0.52. This rises to 0.82 when we adjust for quality. However, although quality-adjusted
patent counts rise over time, there remains evidence of a considerable decline in productivity.
Our interpretation of the trends in Figures 1 and 2 depends on the identifying
assumption that there is a stable relationship over time between quality and our four
indicators. Hall, Jaffe and Trajtenberg (1999) emphasize that changes in patent office
practices or growth in the universe of potentially citing patents could also lead to patents from
later cohorts to receiving larger numbers of forward citations --even if the average quality of
patents remained unchanged. They estimate a model of citation frequency as a function of
citing-year effects and a (stable) citation-lag distribution. Their estimates can be used to
identify the variation in forward citations that is due to citing-year effects, which is arguably
unrelated to variation in the average quality of the protected innovations. Figure 4 replicates
Figure 2 but uses 'deflated' forward citations based on Hall, et. al. (Table D.1, 1999). It
shows that much of the trend growth in measured quality, and with it our 'resolution' to the
R&D productivity puzzle, nay itself be due to the changing propensity of firms to cite over
19 Technology groups are associated with the following SIC classes: Drugs - 2834; Chemicals— 2800, 2810, 2819, 2860-2899; Mechanical — 3500-3569; Electronic — 3571-3573, 3670-3679.
20 For this illustration, we use contemporaneous R&D and patent counts. The average lagbetween R&D and patent application is relatively short (Pakes and Schankerman, 1984;Griliches, Hall and Hausman, 1986).
21 Figures for the other technology groups are available from the authors upon request.

21
time, rather than to any real changes in the underlying quality of innovation. However, further
research is needed to pin down the correct interpretation of 'citing-year' effects.
Finally, we consider the relationship between R&D input and the output of patented
innovations at the firm level. In the pooled sample, the correlation across firms and years is
0.66. Whether adjusting for the quality of a firm's patents leads to a measure with a closer
link to R&D investment depends on whether there are systematic differences across firms in
the anticipated quality of their innovations. There might be if firms have different research
strategies that lend themselves to producing different types of outputs. If so, one would
expect that at least some of the firms with few patents relative to their R&D expenditure
would be ones with higher quality innovations, and adjusting would strengthen the
relationship between R&D inputs and innovative output. On the other hand, if the anticipated
quality of innovations across firms is similar in any given year, then differences across firms
in the actual average quality of their patents in any given year would simply be an outcome of
the stochastic nature of the R&D process. Weighting by quality in this context would weaken
the link between R&D and the measure of innovative output. The latter is what we find: the
correlation between firm R&D and quality-adjusted output of patented innovation is 0.60 —
lower than its correlation with simple counts.22 Thus there does not seem to be any evidence
of strong firm differences in the average quality of the innovations that they expect to produce
when investing in R&D, or that whatever differences there are get swamped by the stochastic
element in the R&D process.
Concluding Remarks
In this paper we analyse a new database that brings together detailed information on
patents applied for in the United States during the period 1960-9 1. These data provide us
with multiple indicators of the underlying 'quality' of a patented innovation. We model the
'quality' of an innovation, as assessed soon after patent application is made, as a latent
variable that is common to a set of four indicators: the number of patent claims, forward
citations, backward citations and patent family size. This allows us to measure how much of
the variance in each indicator is related to 'quality' and how much is idiosyncratic. This
information is used to construct a composite index of quality for each patent, conditional on
its observed characteristics. The model is estimated using a sample of about 8000 patents in
four technology areas: pharmaceuticals, chemicals, electronic and mechanical.
22 This conclusion also holds if we average out the time-series variation for each firm. Thecorrelation between the average R&D and patent counts for firms is 0.68, but only 0.62 withquality-adjusted patent counts.

22
We find that forward citations and claims are the least noisy indicators, followed by
claims and backward citations. Adjusting for the composite quality index, we find that the
conditional variance in quality, given the patent's characteristics, is just one-third of the
unconditional variance. The composite quality index is significantly related to the decisions to
renew a patent and to defend patent rights in court. When we use the individual indicators, we
find that forward citations and family size are important determinants of the renewal decision,
but claims and backward citations are not. By contrast, the likelihood of patent litigation is
related to forward citations, family size and claims. We also find strong evidence of a
threshold effect of patent family size, indicating that it is the decision to take a patent out
abroad (rather than how many countries) that reveals the quality of the innovation. Finally,
using R&D and patent data for 100 U.S. manufacturing firms for 1980-89, we show that
adjusting for quality removes most of the apparent decline in research productivity observed
at the aggregate level. But much of this 'resolution' appears to be largely due to 'citing-year'
effects which may or may not be related to the underlying value of the innovations.
This paper is only a first step in exploiting detailed patent information to construct an
index of innovation quality. Other indicators are available (see, for example, Harhoff,
Scherer and Vopel, 1999). Future research should identify which indicators are informative,
use them to improve the composite index of innovation quality and, most important, examine
whether the index helps to explain the value of innovation and economic decisions that are
related to it.

23
Table 1. Correlation Matrix: Pooled, Domestic and Foreign-Owned Patent?
Claims Family Bwd Fwd5 FwdO FwdlS Lit Ren4
Family .118.189.094
Bwd .142 .030.139 .095.082 011b
Fwd5 .237 .158 .144.231 .248 .135.204 029b .117
FwdlO .284 .133 .156 .857.277 .225 .143 .858.265 •029b .149 .844
Fwdl5 .273 .116 .122 .766 .928.270 .203 .103 .773 .928.245 .073 .142 .729 .924
Lit .181 .005" .091 .276 .313 .310.158 .121 .058 .260 .293 .294.142 .054 .058 .247 .303 .288
Ren4 .077 .127 .052 .129 .162 Nc .145.089 .150 .049 .118 .157 Nc .163.051 .061 .070 .170 .192 Nc .125
Notes:
a) The first (bold) entry in each cell refers to the correlation for the pooled sample, thesecond to domestic-owned patents and the third to foreign-owned patents, with(maximum) sample sizes of 6093, 4693 and 1400, respectively. Actual sample size varieswith each pair of variables. An entry 'Nc' means not computable. Non-dichotomousvariables are in logs.
b) Not statistically significant at the 0.05 level.

24
Table 2. Parameter Estimates For One-Factor Model, By Technology Groupa
IndependentVariable (lo2) Dru2s Chemical Electronic Mechanical Pooled
FwdS 0.68 0.61 0.55 0.44 0.52(0.07) (0.08) (0.04) (0.03) (0.02)
Claims 0.38 0.41 0.45 0.46 0.44(0.06) (0.06) (0.04) (0.03) (0.02)
Family 0.35 0.32 0.39 0.38 0.37(0.06) (0.06) (0.04) (0.03) (0.02)
Bwd Cites 0.40 0.31 0.24 0.27 0.28(0.06) (0.06) (0.04) (0.03) (0.02)
SIWd 0.46 0.37 0.30 0.19 0.27(0.09) (0.09) (0.05) (0.03) (0.02)
Scim 0.14 0.17 0.20 0.21 0.19(0.06) (0.06) (0.04) (0.03) (0.02)
Sfm 0.13 010b 0.15 0.14 0.14(0.06) (0.06) (0.04) (0.03) (0.02)
Sbd 0.16 0.10 0.06 0.07 0.08(0.06) (0.06) (0.03) (0.03) (0.02)
No.obs. 615 606 1767 3123 6111
X2(2) 0.39 0.79 5.20 2.86 8.04(p-value) (0.82) (0.67) (0.07) (0.24) (0.02)
Notes:
a) Estimated standard errors are in parentheses. The model also includes nationality dummyvariables (arid for the pooled data, technology dummies). An 'Sk denotes the estimated signalratio calculated as )k2 /crYk2 . The (2) statistic tests the over-identifying restrictions for theone-factor model.b) Not significant at the 0.05 level.

25
Table 3. Weights on Different Indicators in the Composite Quality Indexa
Dru2s Chemicals Electronics Mechanical Pooled% Weighton (ba):
FwdS 39.8 39.5 35.3 25.9 32.3
Claims 14.9 21.9 27.7 30.8 26.7
Family 10.8 11.0 17.6 18.2 16.0
Bwd 34.5 27.6 19.4 25.1 25.0
Note:a) The weight for the kth indicator is the kth element in the vector A'A./ z' A'A where A isthe vector of estimated factor loadings, A the covariance matrix of the set of indicators, and za unit vector. Each is the derivative of q with respect to the given indicator, as implied by theformula for E{q lyl in equation (4), with the set normalized to sum to one.

26
Table 4. Conditional Variance of the Latent Variable: Different Sets of Indicators
Indicators (los) Druas Chemicals Electronics Mechanical Pooled
Unconditional 1.00 1.00 1.00 1.00 1.00Variance
FwdS, Claims, .329 .387 .360 .337 .361Family, Bwd
Drop FwdS .580 .626 .502 .460 .518
Drop Claims .378 .472 .495 .498 .489
Drop Family .341 .407 .430 .406 .412
Drop Fwd5 and .625 .673 .622 .560 .606Family
No. obs. 4721 3450 5234 2656 16,061
Note:a) Computed as the predicted value of Var(qI y) = 1- A /t1 A using estimates of the factorloadings,), and covariance matrix A for the set of indicators relevant in each case.

27
Table 5. Test of Threshold Family Effect Using Correlation Structure of Indicatorsa
Drugs Chemical Electronic Mechanical PooledPanel A
0.43 0.29 0.42 0.37 0.38
(all domestic) (.06) (.07) (.03) (.03) (.02)
0.16 0.21 0.30 0.32 0.28
(family >1) (.10) (.09) (.06) (.05) (.02)
t.statistic1' 2.33 0.69 1.78 0.89 4.42
Panel B0.058 0.092 0.24 0.27 0.21
(all domestic)
-0.094 0.072 0.024 0.17 -.003
(family>1)
Notes:a) Entries are parameter estimates for family size from the one-factor model of Table 2 but
based only on the sample of domestic-owned patents. The first row in each panel uses alldomestic-owned patents; the second includes only those where protection was also soughtoutside the U.S. (family >1). Estimated standard errors are in parentheses.
b) The t-statistic tests the null hypothesis H0: .1,/cryjm)°= ,/O2yjm)' against thealternative H1: )0 < ), where a superscript 0' denotes all domesticpatents and 1' denotes domestic-owned patents with family >1.

28
Table 6. Signal Ratios for Forward Citation of Different Spans
Citation span Drugs Cheniical Electronic Mechanical Pooled
Fwd5 0.46 0.37 0.30 0.19 O.27r
(.09) (.09) (.05) (.03) (.02)
FwdlO 0.50 0.35 0.38 0.21 0.30(.10) (.09) (.05) (.03) (.02)
Fwdl5 0.58 0.37 0.35 0.16 0.26(.10) (.09) (.05) (.03) (.02)
Note.
a) See note (a) of Table 2. Entries are computed from estimates of the one-factor model usingthe forward cites measure identified in the first column. Estimated standard errors are inparentheses. An 'r denotes rejection of the over-identifying restrictions of the model at the0.05 level.

29
Table 7. Probit Regressions for Patent Renewal at Age 4
IndependentVariables
(log) Drugs Chemicals Electronics Mechanical Pooled
FwdS .26* .48* .07 .21* .18*(.14) (.20) (.08) (.07) (.05)
Claims -.03 -.04 .12 .06 .60(.14) (.18) (.09) (.07) (.05)
Family .21* •3Ø* .06 .30* .21*(.12) (.17) (.08) (.07) (.04)
Bwd .03 -.07 .03 .12 .07(.15) (.20) (.10) (.08) (.05)
Quality •35* .51* .19* .38* 33*Measure (.15) (.20) (.09) (.05) (.05)
Pseudo-R2 .088 .064 .132 .086 .026 .026 .067 .051 .056 .048
% Correct 91.6 92.7 89.4 86.1 88.3Predictions"
No. obs. 234 179 554 950 1922
x2 (3) 3.3 4.3 0.2 12.4 13.9
Notes:a) Estimated standard errors are in parentheses. An asterisk denotes statistical significance atthe 0.05 level. The (3) statistic refers to the test of the proportionality restrictions impliedby the composite quality index.
b) Both the unrestricted and restricted estimations predict a probability of renewal greaterthan 50% for all patents, so the number of correct predictions is the rate of renewal in eachcase.

30
Table 8. Probit Regressions for Patent Litigationa
a) Estimated standard errors are in parentheses. An asterisk denotes statistical significance atthe 0.05 level. The x2(3) statistic refers to the test of the proportionality restrictions impliedby the composite quality index.
Dru2s Chemicals
.40*
(.07)39*
(.07)
Mechanical
.14*
(.07)
Pooled
IndependentVariables
(log)
Fwd cites
Claims
Family
Bwd cites
QualityMeasure
Pseudo-R2
.36*(.03)
.17*(.08)
•37*
(.02)
.14*(.06)
.11*(.03)
.12*(.06)
.17*(.02)
-.02(.07)
.06*(.03)
.21 *
(.08)
.05 *
(.02)
Electronics
.36*(.04)
.27*(.04)
-.02(.04)
-.07(.05)
.45 *
(.04)
66.9 66.5
47.6
53*(.07)
.01
(.04)
.67*
(.09)
.01
(.03)
.16 .15 .15 .15
70.4 69.9% CorrectPredictions
No. obs.
.35 *
(.03)
.14 .12
68.6 67.8
•44*
(.02)
.12 .10
538
x2 (3)
64.2 62.5
.13 .12
66.2 66.2
484
10.4
Note:
1521
1.4
2548 5091
53.8 83.0

31
Table 9. Test of Threshold Effect in Patent Renewal and Litigation Equations
Druas Chemicals Electronics Mechanical PooledRenewalEquationFamily0 35* .32* •39* .38* •37*
(.06) (.06) (.04) (.03) (.02)
Family1 .19 -.34 -.086 .17* .073(.25) (.40) (.15) (.10) (.08)
Bigfam .05 1.91* .36 .31* •34*(.57) (1.1) (.31) (.20) (.15)
LitigationEquationFamily0 .14* .12* -.02 .06* .05*
(.06) (.06) (.04) (.03) (.02)
Family1 .14* -.04 -.08 -.09 -.05(.10) (.10) (.07) (.05) (.04)
Bigfam .02 .46* .12 •33* .23*(.24) (.19) (.14) (.10) (.07)
Note:
a) Fanüiv° refers to the coefficient on patent family size taken from Tables 7 and 8.Family' refers to the same coefficient when we include a threshold dummy in theprobit regressions, defined as Bigfam = 1 if family> I and zero otherwise.

32
o pCi A ipc2o ipc3 ipc4
1.6 -
1.3
.7 _______________ _____1989
yearGrowth in Average Patent Quality
Figure 1
1980

2.2 -
1.8
1.4
1
Figure 3
o r_d0 wgtcnts
o r_d0 wgtcnts
Patent Counts and
cit5cntscounts
cit5cntscounts
yearR&D: Pharmaceuticals
1989
1989
33
2
1.8
1.6
1.4
1.2
1
.8
Figure 2
Simple &
1980 1983 1986year
PatentWeighted Counts and R&D
1980 1983 1986
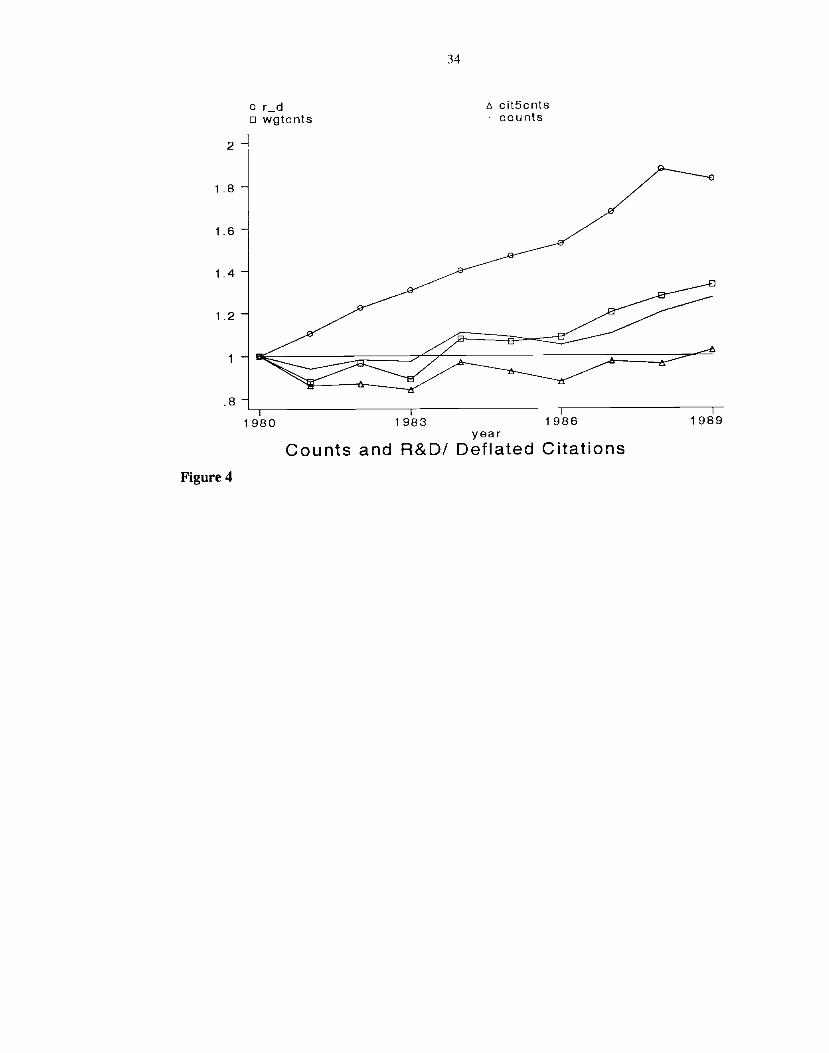
34
o r_do wgtcnts
cit5cntscounts
2
1.8
1.6
1.4
1.2
1
.8 -
Figure 4
1980 1983 1986
Citationsyear
Counts and R&D! Deflated
1989

35
References
Aghion, Philippe and Peter Howitt (1997), Enciogenous Growth Theory Cambridge: MITPress).
Austin, David (1993) "An Event Study Approach to Measuring Innovative Output: The Caseof Biotechnology", American Economic Review Vol. 83, pp. 253-58.
Griliches, Zvi (1990), "Patent Statistics as Economic Indicators: A Survey,' Journal ofEconomic Literature, 18(4), (December), 1661-1707.
Griliches, Zvi, Bronwyn Hall and Jerry Hausman (19861), "Patents and R&D: Is there a lag?"International Economic Review, vol.27, no.2, pp. 265-283.
Hall, Bronwyn, Adam Jaffe and Manuel Trajtenberg (1999;), "The NBER-Case WesternReserve University R&D-Patents Master File, 1959-1995 (Cambridge, Ma.: NBER).
"Market Value and Patent Citations: A First Look," Paper presented at the NBERConference in Honor of Zvi Griiches' 20 Years as Productivity Program Director(Cambridge, Ma.), June 1999.
Harhoff, Dietmar, Frederic Scherer and Katrin Vopel (1999), 'Citations, Family Size,Opposition and the Value of Patent Rights: Evidence from Germany," mirneo (February).
Jaffe, Adam and Manuel Trajtenberg (1997) "Knowledge Flows across Time and Space asEvidenced by Patent Citations," Mirneo. NBER.
Lanjouw, Jean (1998), "Patent Value in the Shadow of Infringement: Simulation Estimationsof Patent Value, Review of Economic Studies, vol. Vol. 65, pp. 671-710.
Lanjouw, Jean and Mark Schankerman (1997), "Stylized Facts of Patent Litigation: Value,Scope and Ownership," NBER Working Paper No. 6297
Lanjouw, Jean, Ariel Pakes and Jonathan Putnam (1998), "How to Count Patents and ValueIntellectual Property: Uses of Patent Renewal and Applications Data," Journal of IndustrialEconomics, December, Vol. XLVI, no. 4. pp. 405-33.
Pakes, Ariel (1986), "Patents as Options: Some Estimates of the Value of Holding EuropeanPatent Stocks," Econometrica, 54, 755-784.
Pakes, Ariel and Mark Schankerman (1984), "The Rate of Obsolescence of Patents, ResearchGestation Lags and the Private Rate of Return to Research Resources," in Zvi Griliches, ed.,R&D, Patents and Productivity (Chicago: University of Chicago Press), 73-88.
Putnam, Jonathan (1996), The Value of International Palent Rights, Ph.D. thesis (lYaleUniversity).
Schankerman, Mark (1998), "How Valuable is Patent Protection? Estimates by TechnologyField," Rand Journal of Economics, 29(1), (Spring), 77-107.
Schankerman, Mark and Ariel Pakes (1986;), "Estimates of the Value of Patent Rights inEuropean Countries During the Post-1950 Period," Economic Journal (December), 1052-76.

36
Tong, Xuesong and J. Davidson Frame (1994), "Measuring National TechnologicalPerformance with Patent Claims Data," Research Polkv, vol. 23, 133-141.
Trajtenberg, Manuel (1990), 'A Penny for Your Quotes: Patent Citations and the ValueofInnovation," Rand Journal of Economics, 21(1), 172-87.

</ref_section>