FDI and processing and assembling trade FDI’s contribution to China’s exports.

NBER WORKING PAPER SERIES
IS CHINA’S FDI COMING AT THE EXPENSE OF OTHER COUNTRIES?
Barry EichengreenHui Tong
Working Paper 11335http://www.nber.org/papers/w11335
NATIONAL BUREAU OF ECONOMIC RESEARCH1050 Massachusetts Avenue
Cambridge, MA 02138May 2005
The views expressed herein are those of the author(s) and do not necessarily reflect the views of the NationalBureau of Economic Research.
©2005 by Barry Eichengreen and Hui Tong. All rights reserved. Short sections of text, not to exceed twoparagraphs, may be quoted without explicit permission provided that full credit, including © notice, is givento the source.

Is China’s FDI Coming at the Expense of Other Countries?Barry Eichengreen and Hui TongNBER Working Paper No. 11335May 2005JEL No. F0
ABSTRACT
We analyze how China’s emergence as a destination for foreign direct investment is affecting the
ability of other countries to attract FDI. We do so using an approach that accounts for the
endogeneity of China’s FDI. The impact turns out to vary by region. China’s rapid growth and
attractions as a destination for FDI also encourages FDI flows to other Asian countries, as if
producers in these economies belong to a common supply chain. There is also evidence of FDI
diversion from OECD recipients. We interpret this in terms of FDI motivated by the desire to
produce close to the market where the final sale takes place. For whatever reason � limits on their
ability to raise finance for investment in multiple markets or limits on their ability to control
operations in diverse locations � firms more inclined to invest in China for this reason are
corresponding less inclined to invest in the OECD. A detailed analysis of Japanese foreign direct
investment outflows disaggregated by sector further supports these conclusions.
Barry EichengreenDepartment of EconomicsUniversity of California549 Evans Hall 3880Berkeley, CA 94720-3880and [email protected]
Hui TongBank of EnglandThreadneedle StreetLondon, [email protected]

Is China’s FDI Coming at the Expense of Other Countries?1
Barry Eichengreen and Hui Tong April 2005
1. Introduction
China’s emergence has been perhaps the single most important new development
affecting the world economy at the outset of the 21st century. By some estimates the
country contributed more than a quarter of the growth of global GDP in recent years.2 It
is the world’s sixth larger trader, supplying more than 6 per cent of global exports. It is a
leading destination for foreign direct investment by producers seeking to capitalize on its
large domestic market and low labor costs. (See Figure 1.) It has become sufficiently
consequential that, for a period in the autumn of 1994, the question of whether the
Chinese economy was overheating was the number one issue for forecasters of global
growth.
Much of this attention has focused on how China is affecting the advanced
economies. There has been discussion for example of whether a revaluation of the
renminbi would lead to a general revaluation of Asian currencies against the dollar and
narrow the U.S. trade deficit. There are complaints in Europe that China’s reluctance to
let its currency to rise has caused the dollar’s decline to be disproportionately
concentrated on the euro-dollar rate.3 There are worries in Japan and Korea that the rapid
1 University of California, Berkeley and Bank of England, respectively. None of the views expressed here are necessarily those of the Bank of England. We thank Julian di Giovanni and seminar participants at the Bank of England for helpful comments. 2 When GDP is measured at purchasing power parity. 3 See for example the report in Agence France Presse (2004).

2
growth of Chinese industry, fed by foreign direct investment from these and other
countries, is “hollowing out” their manufacturing sectors.4
But China’s impact on developing countries is equally profound. As an exporter
of labor-intensive manufactures, China competes with other developing countries with a
comparative advantage in labor-intensive manufactured goods. In the developing world
there is trepidation that, with 200 million to 300 million underemployed rural Chinese
still to be integrated into the modern manufacturing sector, the impact has only begun to
be felt.5 As a magnet for foreign investment, China has allegedly made it more difficult
for other emerging markets to attract FDI. Thus, when FDI inflows into the Mexican
maquiladora sector dropped from $3 billion in 2000 to $2 billion in 2003, there was a
tendency to blame the emergence of China as a more attractive low-cost production and
export platform.6 When foreign direct investment in Malaysia fell from RM 19 billion in
2001 to RM 2 billion in the first half of 2002, Prime Minister Mahathir explained that
“Everyone is feeling the pinch because the amount of FDIs [sic] has shrunk and then, a
lot of that is going to China…”7
But China is also a growing market for the exports of other countries. It is
currently the fastest growing foreign market for countries like Brazil that are major
exporters of raw materials.8 Chinese companies are integrated into global supply chains,
assembling components produced in other parts of the world and producing components
4 Lincoln (2002) provides discussion and analysis. 5 At the end of 2004 these fears were highlighted by the impending expiration of the Multifiber Arrangement, by which the growth of China’s textile and apparel exports had been constrained. There is also the urban legend that more sombreros are now manufactured in China than in Mexico. 6 Thus, United Nations (2004, p.61) concludes that “the relocation of FDI from the maquila industries had mainly been caused by competition from Asia. One third of all enterprises that have left are reported to have moved to China…” 7 Straits Times (21 September 2002), quoted in McKibbin and Woo (2003), p.14. 8 See for example the report in Lapper (2004).

3
and materials that are assembled and finished in other countries. Thus, the growth of
capacity and demand in China, rather than making other developing countries less
attractive as platforms for production, could make them more attractive to the extent that
they succeed in producing for the Chinese market and integrating into the same supply
chains.
The point applies also to FDI. To reap the full benefits of building assembly
plants in China, firms may also need to invest in component production in Singapore or
Malaysia. The increase of FDI in China may thus encourage additional FDI in other
countries rather than crowding it out.
To date, analysis of these issues has focused mainly on export competition and
Asia. Yang and Vines (2000) simulate a multi-sector, multi-country model with
differentiated products as a way of analyzing the impact of China on exports from other
Asian countries, finding that ASEAN’s exports drop slightly while those of Japan, South
Korea, Taiwan, Singapore, and Hong Kong rise. Ahearne, Fernald, Loungani and
Schindler (2003) regress the growth of other Asian countries’ exports on China’s exports
(and various controls) but find only a weak correlation. Our own take (Eichengreen,
Rhee and Tong 2004) uses the gravity model augmented to include a role for China’s
exports. While we find a tendency for China’s exports to third markets to crowd out the
exports of other Asian countries, this effect is felt mainly in markets for consumer goods
and hence by less-developed Asian countries that export those products, not in markets
for capital goods or by the more advanced Asian economies for which machinery and
equipment comprise a significant fraction of total exports. At the same time, there has
been a tendency for a rapidly growing China to suck up imports from its Asian neighbors.

4
But this direct effect of Chinese imports is mainly felt in markets for capital goods and
thus by the more advanced Asian economies. This analysis of trade flows thus suggests
that more and less developed countries are being affected differently by China’s rise.
Even fewer studies have considered how China’s emergence as a magnet for FDI
is affecting FDI flows to other countries. Mercereau (2005) uses data for 14 countries
spanning the period 1984-2002. He includes China’s share of total FDI to the region as a
way of capturing potential crowding out of FDI flows to other countries and finds that
crowding out, so measured, is evident only for two countries: Singapore and Myanmar.
However, these regressions are estimated by panel OLS and suffer from obvious
endogeneity problems. Chantasasawat, Fung, Iizaka and Siu (2004) use data for eight
Asian economies in addition to China over the period 1985-2001 and estimate equations
for China’s FDI inflows and other Asian countries’ FDI inflows by two-stage least
squares. The annual data for the other eight countries are pooled and treated as a panel.
They find that China’s FDI receipts and other Asian countries’ receipts are positively, not
negatively, correlated. This is a striking finding, although questions can be raised about
their approach.9 One also wonders whether their conclusion carries over to other
regions.10
9Their strategy of using China-specific variables as instruments for FDI inflows into other countries would not work if they included time fixed effects (which are necessarily omitted), since the year effects and China-specific variables would then be perfectly correlated. 10 In addition, McKibbin and Woo (2003) calibrate a simulation model on this assumption for the period subsequent to China’s accession to the WTO and show that the ASEAN-4 countries (Indonesia, Malaysia, the Philippines and Thailand) have a tendency to lose income and productivity growth, ceteris paribus. In fact, McKibban and Woo distinguish two cases, which they associate with the pre-2002 (pre-WTO) and post-2002 (post-WTO) periods. They assume that FDI flows into China and into other Asian countries were complementary prior to China’s accession to the WTO (that increases in FDI in China led to increases in FDI in other Asian countries) but that FDI flows into China and FDI flows into other Asian countries were substitutes thereafter. Their simulation analysis focuses on the latter (FDI diversion) case. Other Asian countries lose productivity growth because in their analysis FDI is a source of positive technology spillovers (as well as a way of raising capital/labor ratios). The authors also go on to show how the countries in question can limit the loss of FDI inflows and neutralize the impact of any loss that they fail to

5
In this paper we seek to shed further light on these issues. We focus on the
following questions. Has China’s emergence as a low-cost production and export
platform and its growing attractions as a destination for FDI made it more difficult for
other countries to attract FDI? Which countries and regions have seen FDI inflows
diverted toward China, and which source countries are responsible for the shift? Or does
China’s FDI-fueled growth, by making neighboring countries a logical platform for
producing for the Chinese market and stimulating the development of regional supply
chains, in fact heighten their attractions as destinations for FDI?
The framework for our analysis is the gravity model of bilateral flows but used
here to analyze foreign direct investment rather than trade. In addition to the standard
gravity-model variables – inter alia, the size of the source and destination countries and
the distance between them – we augment the specification to include also Chinese FDI
receipts from the same source country. The identification strategy – using the distance
between China and the source country as an instrument for Chinese FDI receipts – is also
the same as in that previous study. And, as in our previous analysis of exports, our
results for FDI are somewhat surprising.
offset by strengthening their ability to absorb new foreign technologies and engaging in indigenous technical innovations. Blazquez-Lidoy, Rodriguez and Santiso (2004, p.30) observe that FDI into Mexico declined by 30 per cent between 2002 and 2003, FDI into Brazil by 52 per cent, while FDI flows into China were soaring – a fact they attribute to “the prospect of a huge domestic market of 1.3 billion consumers…” They worry that this will slow technology transfer and industrialization, as Latin America reverts to being an exporter of primary commodities. But they do not first test for FDI diversion. There is also an interesting related study by Blonigen, Davies, Waddell and Naughton (2004) that uses spatial econometric techniques to analyze the spatial correlation of FDI to alternative (neighboring regions). However, their data is limited to OECD countries, and their method could not be used to answer our question without further adaptation.

6
2. Foreign Direct Investment since 1990
Since the early 1990s, China has become a major destination for foreign direct
investment. The country now has the third largest stock of FDI, after only the United
States and United Kingdom.11 This increase has occurred in the context of the global
growth of FDI. Net FDI flows to developing countries rose steadily over the 1990s, from
$21 billion in 1989 to $179 billion in 1999.12 The bulk of these flows went to a handful
of countries, notably China, Brazil, Argentina and Mexico. The economies of Central
and Eastern Europe also attracted growing amounts of FDI over the course of the decade
but starting from low levels, reflecting the early difficulties of transition.13
In fact FDI in developing countries accounted for only a minority of the world
total. In the second half of the 1990s some 68 per cent of global FDI inflows were
received by the advanced economies, a share that rose to 79 per cent in 1999-2000. This
surge in the share of global FDI attracted by the advanced countries reflected both the
effects of crises in emerging markets at the end of the 1990s and the privatization of
telecommunications providers in many advanced countries. In interpreting our empirical
results below, it will be import to place the growth of China’s FDI receipts in this global
context.
The main sources of FDI remain Europe, the U.S., and Japan. Europe was the
source of nearly 60 per cent of global FDI inflows in the 1990s. Much of this was intra-
European FDI, reflecting the incentives for consolidation provided by the creation of the
11 See Adhikari and Yang (2002). Above all of these countries is Luxembourg, which is a special case, in that most of its FDI is transshipped to other destinations. 12 These estimates are from World Bank (2002). 13 Over the course of the decade FDI in the transition economies reached 3 per cent of the world total, surpassing the share of developing Asia excluding China. Two thirds of total inflows to the transition economies were concentrated in four countries: the Czech Republic, Hungary, Poland and Russia.

7
single market. In addition, toward the end of the decade the advent of the euro, by
enhancing the liquidity of European financial markets and providing more finance for
mergers and acquisitions, encouraged European FDI flows to other parts of the world.
U.S. FDI also increased in the second half of the 1990s, reflecting the liquidity of U.S.
financial markets and impact of globalization. After surging at the end of the 1980s in
response to the appreciation of the yen, Japanese FDI declined in the 1990s as the
economy entered its slump. More recently, South-South FDI flows have grown in
importance. Asia’s newly developing countries have engaged in growing FDI in China.
China and South Africa are now major investors in Africa. There is also much talk of
Chinese FDI in Latin America.
FDI in China picked up after 1993, reflecting the further liberalization of the
economy, exchange rate unification, and inflation stabilization. Although the country
first opened its doors to FDI in 1979, interest on the part of foreign investors was
stimulated when Deng Xiaoping reaffirmed China’s commitment to market-friendly
reforms and opening the economy during a tour of the southern provinces in 1992.
Inflows first exceeded $30 billion in 1993 and ranged from $35 billion to $45 billion
from 1994 through 2000, reaching $47 billion in 2001. Increasingly these inflows have
taken the form not of greenfield investment but mergers and acquisitions, the number of
which rose 107 in 2002 to 214 in 2003.14
The FDI receipts of other Asian countries held up well through 1996, and their
subsequent slump was presumably a consequence of the financial crisis of 1997-8.15 But
14 United Nations (2004), p.50. Capital Markets Consultative Group (2004) argues that the share of M&As in China’s FDI inflows should increase further as the privatization of state enterprises gains momentum. 15 Policy makers in some Asian countries then responded to the crisis by liberalizing access to their markets for foreign investors, and the depreciation of East Asia exchange rates encouraged fire-sale FDI. For
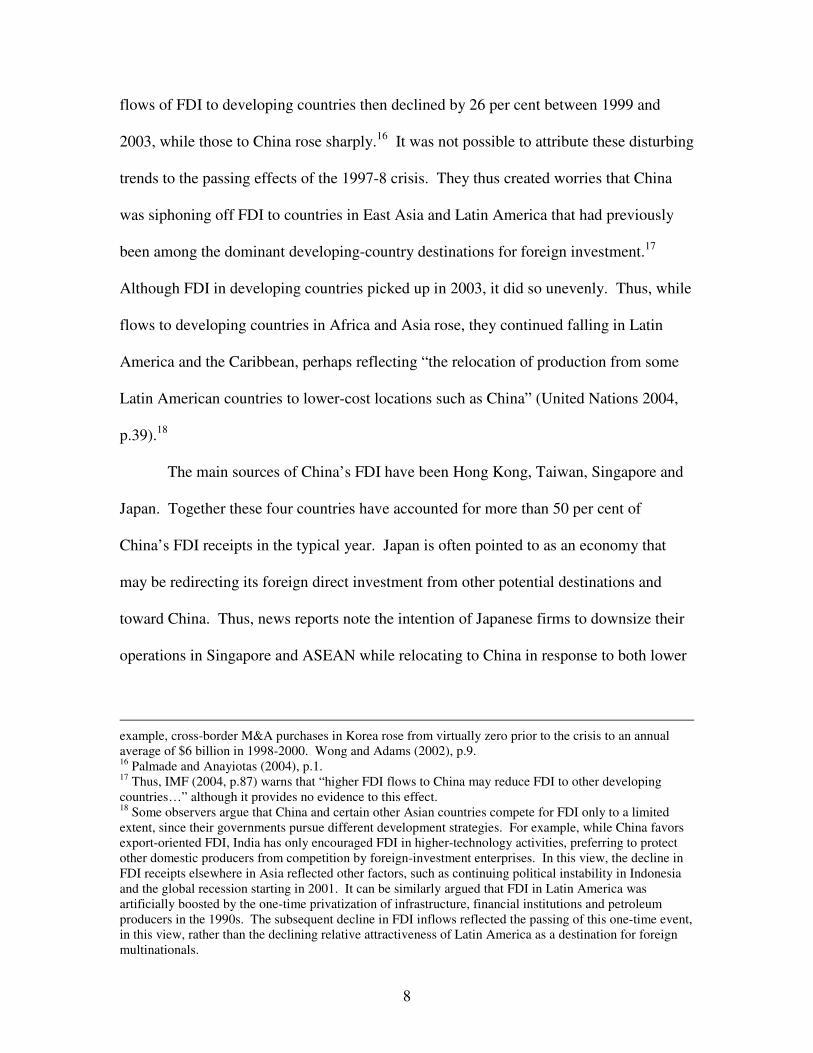
8
flows of FDI to developing countries then declined by 26 per cent between 1999 and
2003, while those to China rose sharply.16 It was not possible to attribute these disturbing
trends to the passing effects of the 1997-8 crisis. They thus created worries that China
was siphoning off FDI to countries in East Asia and Latin America that had previously
been among the dominant developing-country destinations for foreign investment.17
Although FDI in developing countries picked up in 2003, it did so unevenly. Thus, while
flows to developing countries in Africa and Asia rose, they continued falling in Latin
America and the Caribbean, perhaps reflecting “the relocation of production from some
Latin American countries to lower-cost locations such as China” (United Nations 2004,
p.39).18
The main sources of China’s FDI have been Hong Kong, Taiwan, Singapore and
Japan. Together these four countries have accounted for more than 50 per cent of
China’s FDI receipts in the typical year. Japan is often pointed to as an economy that
may be redirecting its foreign direct investment from other potential destinations and
toward China. Thus, news reports note the intention of Japanese firms to downsize their
operations in Singapore and ASEAN while relocating to China in response to both lower
example, cross-border M&A purchases in Korea rose from virtually zero prior to the crisis to an annual average of $6 billion in 1998-2000. Wong and Adams (2002), p.9. 16 Palmade and Anayiotas (2004), p.1. 17 Thus, IMF (2004, p.87) warns that “higher FDI flows to China may reduce FDI to other developing countries…” although it provides no evidence to this effect. 18 Some observers argue that China and certain other Asian countries compete for FDI only to a limited extent, since their governments pursue different development strategies. For example, while China favors export-oriented FDI, India has only encouraged FDI in higher-technology activities, preferring to protect other domestic producers from competition by foreign-investment enterprises. In this view, the decline in FDI receipts elsewhere in Asia reflected other factors, such as continuing political instability in Indonesia and the global recession starting in 2001. It can be similarly argued that FDI in Latin America was artificially boosted by the one-time privatization of infrastructure, financial institutions and petroleum producers in the 1990s. The subsequent decline in FDI inflows reflected the passing of this one-time event, in this view, rather than the declining relative attractiveness of Latin America as a destination for foreign multinationals.

9
costs of production and the attractions of a large domestic market.19 IMF (2002) refers to
the tendency for Japanese companies to move their electronic component production
facilities from Singapore and Malaysia to China.
In sum, “[the] central issue,” in the words of Wong and Adams (2002), “is
whether China is absorbing a predominantly large share of FDI and crowding out FDI to
the rest of Asia.” The same question can also be asked of FDI flows to other parts of the
world. But, as these same authors caution, “viewed from a longer term perspective, FDI
inflows to China and to the other part of Asia could well be complementary rather than
competitive.” This is the issue we address in the remainder of this paper.
3. Data and Methodology
The data for our study are drawn mainly from the OECD.20 The OECD defines
FDI as international investment by a resident entity in one country (the direct investor)
with the objective of establishing a lasting interest in an enterprise resident in a country
other than that of the investor (the direct investment enterprise).21 It provides data for
FDI flows, disaggregated by destination, for 29 source countries (the principal European
countries, the U.S., Canada, Australia, New Zealand, Mexico, South Korea and Turkey).
It breaks down outflows from these countries, by destination, distinguishing 60 OECD
and non-OECD recipients. To broaden our coverage of FDI flows in Asia, where the
largest impact may be felt, we added data on FDI inflows from national sources for
19 See the citations in Wong and Adams (2002), p.13. 20 “Source OECD” at http://www.sourceoecd.org. 21 As described in the glossary to Source OECD, “Lasting interest implies the existence of a long-term relationship between the direct investor and the enterprise and a significant degree of influence by the direct investor on the management of the direct investment enterprise. Direct investment involves both the initial transaction between the two entities and all subsequent capital transactions between them and among affiliated enterprises, both incorporated and unincorporated.”
10
Bangladesh, Pakistan, and Vietnam (information on which is not included in the OECD
data base). We focus on the period starting in 1988, since China only became an
important destination for FDI from the early 1990s.
The OECD provides FDI in source-country currency. We convert it into millions
of U.S. dollars and then deflate it by the U.S. CPI for urban consumers. Real GDP and
GDP per capita in constant 1995 U.S. dollars are obtained from the World Bank’s World
Development Indicators. Other country-specific variables, such as land area and
language, are from Rose (2002), as is the distance variable. See Appendix 1 for further
details.
The framework for our analysis is the familiar workhorse of the empirical
international economics, the gravity model, where the log of FDI is related to on
measures of the economic size of the source and destination countries and the distance
between them. We consider bilateral flows between all 29 source and 63 destination
countries.22 We regress the log of FDI by country i in country j (say, of Japan in Mexico)
on their log GDPs, their log per capita GDPs, the distance between them, and the other
now-standard gravity model arguments (combined land area, land lockedness, number of
islands, common language, common colonizer, whether the countries in question were
ever in a colonial relationship). Our innovation is to include a measure of China’s FDI
receipts from the same source country (in the present example, Japan). We model
22 With provision for observations dropped due to missing variables. When the data point is not missing but zero FDI is recorded between a pair of countries (as is the case with about 15 per cent of our non-missing observations), it is not clear how to treat this observation, especially since the log of zero is undefined. Conventional practice in the gravity model literature is to replace the zero observations with the minimum of the log of positive values in the sample (in the present case, -7). We proceed in this manner here. Alternatively, one could simply drop these observations, but this might be a source of truncation bias. In practice, we find very similar results when dropping the zero observations and setting them to -7. Similarly, studies like Eichengreen and Irwin (1995) that have used Tobit and similar methods to adjust for the possibility of truncation in the context of trade tend to find that the impact on the estimated coefficients is minimal.

11
separately China’s own FDI receipts and the FDI receipts of other countries using this
same framework.
The benchmark specification does not include country-pair fixed effects, which
authors like Anderson and Marcouiller (2002) suggest may be important, since we are
already including a country-pair specific variable, namely distance.23 Below we follow
Anderson and Marcouiller’s suggestion for how to deal with this problem, namely by
adding country-pair specific institutional variables such as measures of country risk. We
use indices from the International Country Risk Guide (ICRG), which provides measures
of political, economic and financial risk. Here we focus on its measure of political risk,
which seeks to capture bureaucratic quality, corruption, democratic accountability, ethnic
tensions, external conflict, governmental stability, internal conflict, investment profile,
law and order, military in politics, religious tension, and socioeconomic conditions.24 We
include the ICRG measure for both the source and destination country.
While the gravity model has been widely used in studies of trade, its application
to bilateral FDI flows is less common. However, a number of earlier studies have shown
that the gravity model also has explanatory power when applied to foreign direct
investment. This is not surprising: larger countries have more companies with the
resources to invest abroad and are more likely to attract FDI; similarly, to the extent that
distance proxies for information as well as transportation costs, countries located at a
greater distance are less likely to engage in bilateral FDI. An early study by Grubert and
23 Adding country-pair fixed effects would also require us to drop common language, land lockedness, number of islands, common land border, and common colonizer. Below we show what happens when we replace these variables with country-pair fixed effects. 24 The index runs from 0 to 100, with higher values indicating lower risk. It tends to vary significantly over time for emerging markets but less for advanced countries. As for China itself, between 1990 and 2002, the period covered here, the index varies from 56 to 75.

12
Mutti (1991) used the gravity model to analyze patterns of plant and equipment
investment by U.S. multinationals. Frankel (1997) used the gravity model to analyze the
impact of preferential trade arrangements on FDI. Hejazi and Safarian (2002) used an
augmented gravity model to explain Canadian FDI. Stein and Duade (2001) used the
gravity model to analyze FDI flows between 28 OECD home countries and 63 host
countries, focusing on how institutional characteristics of the destination countries in
particular affect the volume of flows. Loungani, Mody, Razin and Sadka (2003)
employed a gravity model of bilateral FDI to analyze the role of information in directing
investment flows. di Giovanni (2005) used the gravity model to analyze cross-border
mergers and acquisitions.
It is important to recognize the potential endogeneity of Chinese FDI in an
equation designed to explain FDI flows between other country pairs. Unobserved factors
(for example, an improvement in investor sentiment worldwide) that increase Japanese
FDI in Mexico will also in general increase Japanese FDI in China, creating a correlation
between the error term and the key explanatory variable. The standard treatment for this
problem is instrumental variables, the difficulty being the paucity of plausible and
powerful instruments that is the bane of empirical macroeconomics.
Fortunately, in the present context the gravity model suggests an instrument that
is both exogenous and strongly correlated with Chinese FDI. The obvious instrument, in
other words, is the distance between China and the country that is the source of the
foreign investment.25
25 In addition, the gravity model suggests including China’s GDP as an instrument in the first-stage regression. Although this variable, like distance, is correlated with China’s FDI, questions can be raised about its endogeneity. But the dependent variable in the first-stage regression is China’s FDI receipts from a particular source country, Japan for example, not its aggregate FDI receipts. While there are plausible

13
A problem is that this instrumental variable does not vary over time. This would
mean that we are using the cross section variation in our instrument to identify the
exogenous component of Chinese FDI but using the result to address a time-series
question (how changes over time in China’s FDI receipts are affecting other countries’
FDI inflows). We therefore build on the increasingly large literature on FDI and
institutional quality (Hines, Henisz 2000, Wei 2000, Hausmann and Fernandez-Arias
2000) by also including the ICRG index of political risk in China as an additional time-
varying instrumental variable for Chinese FDI.
Table 1 shows the first-stage estimates based on this specification. Columns 1
and 2 are for the case where the only instrumental variable is China’s distance from the
country that is the source of its FDI. Columns 3 and 4 add China’s GDP as a time-varying
instrument. Columns 5 and 6 then add the measure of China’s political risk. In columns 7
and 8 we introduce time fixed effects in both the first and second stages to avoid
conflating common trends with causal effects. This requires us to drop China’s GDP and
political risk from the list of instrumental variables, since both are linear functions of the
time dummies. Reassuringly, our results for the second stage are very similar across all
these specifications of the first stage. In what follows we use the time dummies in our
baseline specification.26
reasons for thinking that China’s FDI- (and export-) led growth model involves causality running from FDI inflows to GDP as well as the other way around, it is less obvious that China’s aggregate GDP is affected by its FDI from an individual source country. In practice, our results are essentially the same when we drop Chinese GDP from the instrument list, although the coefficient estimates are slightly less precise. This is reassuring, since when we include time fixed effects, as we do in the benchmark estimates, China’s GDP must be dropped from the instrument list since it is perfectly correlated with the vector of period dummies. 26 When we use all three instrumental variables (distance from China, China’s GDP, and China’s political risk), the coefficient capturing the impact of Chinese FDI inflows on other countries’ FDI receipts enters with a coefficient of -0.08 with a standard error of 0.03. Evidently, opting instead for the vector of time dummies leads to a smaller impact (where smaller means in absolute value terms), the analogous

14
4. Basic Results
In Table 2 we report the second stage estimates. We provide OLS estimates for
comparison, which shows how much difference is made by the instrumental variables.
The basic gravity variables enter as expected. Larger countries send and receive
more FDI. Higher labor costs in the originating country and lower labor costs in the
destination (as captured by per capita GDP) are associated with larger FDI flows.
Distance between the sending and receiving countries has a negative impact, while
common language, common land border, common colonizer, past colonial relationship,
access to sea lanes, and the existence of a currency union all have a positive impact. Our
time-varying measure of institutional quality enters positively for both the sending and
receiving countries. This makes sense, since higher values of this variable imply lower
risk.
The key coefficient for present purposes is that on Chinese FDI. In the
instrumental-variables regressions, the coefficient on this variable is negative but not
significantly different from zero at the 95 per cent confidence level. (Here and
throughout we report robust standard errors that correct for heteroscedasticity.) When we
exclude the time fixed effects (in estimates not reported in Table 2), the coefficient
remains negative and becomes significantly different from zero. Thus, there is some sign
here of a tendency for China’s FDI inflows to crowd out FDI inflows to other countries,
though the robustness of the effect is not clear. Note how much difference
coefficient in Table 2 being -0.1. Note, however, that the pattern of effects on the OECD, Asia, Latin America and Central and Eastern Europe is the same irregardless of whether or not time dummies are dropped in favor of additional time-varying instrumental variables.

15
instrumentation makes; in the OLS estimates provided only for comparison, the
coefficient on Chinese FDI is instead strongly positive.27
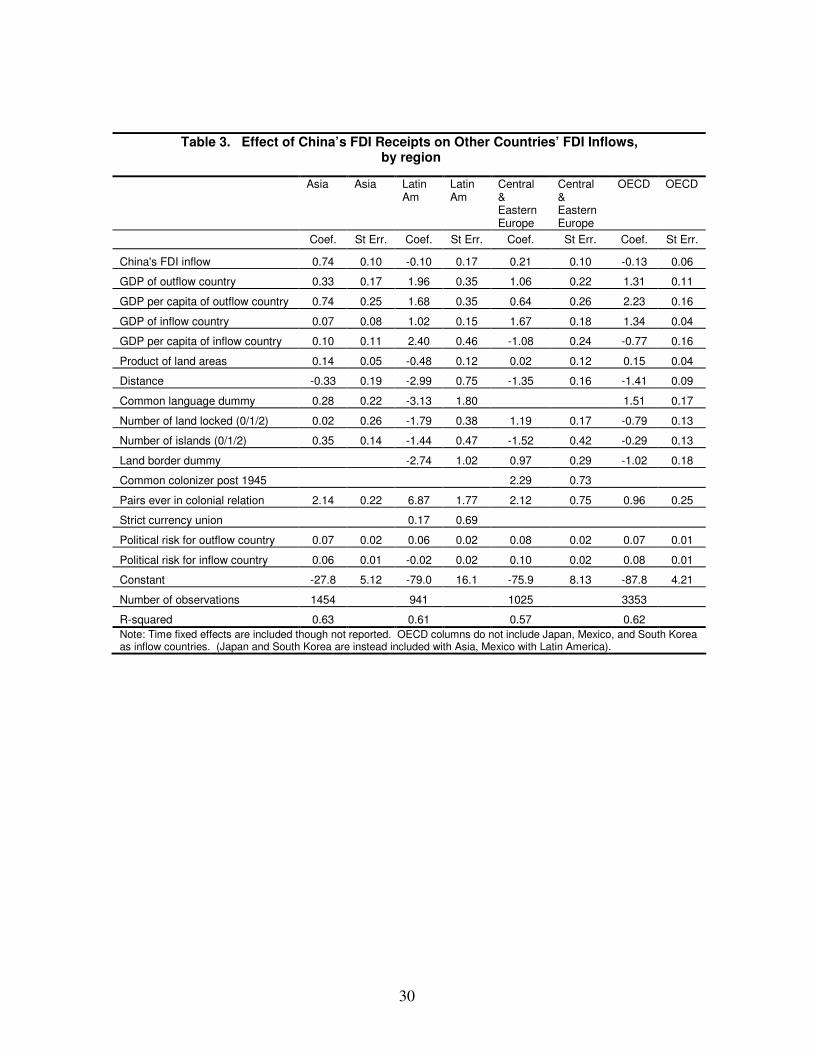
The question is whether FDI in China has the same impact on FDI in all regions –
that is, whether the weakly negative coefficient on Chinese FDI is in fact conflating
different effects in different parts of the world. In Table 3 we therefore distinguish FDI
flows to Asia, Latin America, Central and Eastern Europe, and the OECD, where we
exclude from the OECD Mexico and South Korea (since they joined the organization
only midway through our sample period we include them instead with Latin America and
Asia) as well as Japan (which we also include with the Asian grouping). It appears that
Chinese FDI inflows are is complementary with the FDI inflows of other Asian countries.
Recall that this was also the finding of Chantasasawat, Fung, Iizaka and Siu 2004, using a
different methodology. We find essentially the same thing for Central and Eastern
Europe and no impact on the FDI receipts of Latin America.28 There is little evidence
here, in other words, that China’s FDI creates problems for other developing economies
by limiting their own access to FDI.
Thus, the weak negative coefficient obtained for the full sample is driven by the
only remaining country grouping, the OECD. This result appears to be robust; it is not
27 Not surprisingly, since FDI in China and FDI in other countries tend to be affected by the same trends in globalization and shifts in investor sentiment. Note that this is the same result that we found in our previous paper for exports: Chinese exports had a tendency to crowd out other countries’ exports when the distance between China and its final market was used as an instrument, but Chinese exports and other countries’ exports were positively correlated when ordinary least squares was used. 28 It turns out that the positive coefficient on China’s FDI in the equations for Central and Eastern Europe is driven by the observations for one country, Hungary. Deleting the observations for Hungary renders the coefficient on China’s FDI insignificantly different from zero; in contrast, deleting the observations for other Central and Eastern European countries one by one has no impact on the results. (The other members of this region for which we have observations are Bulgaria, the Czech Republic, Poland, the Slovak Republic, Romania, Russia, Slovenia and Ukraine.) It appears that this effect is driven by the observations for 1993-95, when Hungary engaged in a burst of privatization transactions and China was simultaneously opening to foreign flows. In other words, there may be reason to worry that this particular correlation is spurious.
16
obviously driven by the observations for any one OECD economy.29 An interpretation is
that in some cases, notably those involving OECD countries, competition for FDI is
driven not merely by relative costs of production but also by market-size considerations.
Automobile producers, for example, when considering in which countries to undertake
FDI, take into account the advantages of producing close to the final market both for
tariff-jumping reasons and in order to be able to better tailor their product mix to local
demand. The interest of motor-vehicle producers to get into China in order to tap that
country’s growing demand for their products, which has been much discussed since the
early 1990s, is a case in point. To be sure, for this desire to set up production facilities in
China to discourage investment in additional plant in other markets, there must be an
added element. There must be limits on the ability of headquarters to efficiently control
overseas facilities in a proliferation of different locations, for example, or increasing costs
of external finance. Our results suggest that one or another of these considerations has
been operating in the present context.
5. Robustness Checks
We performed number of sensitivity analyses of the robustness of these results.
First, we limited the sample to the period starting in 1993 when FDI flows into China
became increasingly important. The results are similar to before. When we aggregate all
regions together, the effect of Chinese FDI is still negative but insignificantly different
from zero. The positive, statistically significant impact on other Asian countries is still
29 When we drop the different OECD countries from the sample one by one, the only case in which the significant negative coefficient on Chinese FDI is eliminated is the Netherlands. Even then, the coefficient in question is still negative (at -0.07). And when we drop the Netherland and Germany together, the previous result is restored.

17
evident and, indeed, larger than before, as if regional supply chains and other investment
complementarities have become more pronounced with time. The estimated coefficient
for Asia rises from 0.74 with a standard error of 0.10 to 0.91 with a standard error of
0.11. The main difference is that the coefficient for Latin America also turns positive,
although it remains small (at 0.14) and is not significantly different from zero at standard
confidence levels. There has been much recent discussion of increased FDI in Latin
America to provide raw materials for the FDI-fueled industrial boom in China – both by
China itself and by third countries (see e.g. China Economic Net 2004). It could be that
this is what we are picking up, although the sample period may end too soon to fully
capture a development heavily concentrated toward its end.
Second, we experimented with adding other potential determinants of FDI to
verify that the Chinese FDI variable was not simply picking up their effects. We added
measures for the presence or absence of controls on FDI inflows and outflows for the
receiving and sending countries, respectively.30 The coefficients on controls have the
expected signs: less control of outflows in the sending country and less control of inflows
in the receiving country make for more bilateral FDI. Importantly, the coefficients on
China’s FDI are largely unchanged from before.31
We also added a measure of bilateral exchange rate variability (defined as the
coefficient of variation of monthly average changes in the bilateral exchange rate over the
30 These variables were coded from the standard IMF source by Nancy Brune, to whom we are grateful for sharing her data. 31 The one difference is that the positive coefficient on Latin American FDI receipts is now larger (at 0.64) and significantly different from zero (with a t-statistic of 2.79). Unfortunately, the partial coverage of our controls variables forces us to drop the observations for Colombia, Panama and Venezuela, leaving only Argentina, Brazil, Chile and Mexico. The first three countries are all cases where China’s FDI-fueled growth has been cited as a factor encouraging foreign investment in their primary-producing sectors. Thus, it is hard to be confident that this result reflects the greater impact of Chinese growth on the attractions of investment in their primary producing sectors or simply the smaller sample.

18
calendar year). Consistent with a number of previous studies, we find that greater
bilateral exchange rate variability does in fact significantly reduce bilateral FDI flows.
But what is important for present purposes is that it has no impact on the previously
estimated effects of Chinese FDI on other countries. Similarly, we added the lagged rate
of currency depreciation, both by itself and interacted with a dummy variable for 1999
and 2000, in an effort to control for fire-sale FDI. The interaction term enters positively
and significantly (at the five per cent level) in 1999, consistent with the idea of fire-sale
FDI. Again, however, adding these terms individually or in combination does not change
our findings regarding the effects of China’s FDI.
Next we added a dummy variable for whether the inflow country is a member of
the World Trade Organization (WTO) or the GATT (in the period prior to the
establishment of the WTO).32 The results support the hypothesis that WTO/GATT
membership is associated with larger FDI inflows.33 (The point estimate of 0.96 comes
with a standard error of 0.17.) Again, however, addition of this variable has no impact on
our results for the effects of Chinese FDI.
Finally, we examined the impact of adding country-pair fixed effects to the
second stage. While the coefficients on Chinese FDI mostly retain their previous signs,
many of them lose their statistical significance. This result appears to be due to the
multicollinearity created by adding a very large vector of country-pair dummies. When
we regress log GDP on the country-pair dummies, we obtain an R2 in excess of 0.99.
32 From Andy Rose’s website. 33 This is in contrast to some results on FDI in Rose (2003). We continue to obtain the same result reported in the text when we drop China’s FDI from the list of explanation variables and estimate the determinants of inflows using country-pair fixed and random effect. Note, however, that our sample is somewhat different, and, perhaps more importantly, Rose defines his observations and dependent variable differently, aggregating the FDI flows to and from each country pair.

19
Including both log GDP and the country-pair dummies as explanatory variables produces
a value for the Variance Inflation Factor (VIF) in excess of 200, well above the critical
cut-off point of 30 used in multicolinearity tests. And when we include the log GDPs,
country-pair dummies and fitted value of China’s FDI as explanatory variables, the VIF
reaches 1,000. Given the choice between including measures of country size or country-
pair fixed effects, we are inclined toward the former, since this helps us to pick up
variation over time – which is in essence the subject of this paper.
6. Further Disaggregation by Recipient and Provider
We now look more closely at which countries are driving the results – and which
countries are responsible for the positive effect of China’s FDI receipts on the FDI
receipts of other Asian countries in particular. To this end, we rerun the same
specification for the subsample of Asian countries but allow the coefficient on the fitted
value of China’s FDI inflows to differ for each Asian FDI recipient. The results are in
Table 4. We obtain significantly positive coefficients for all Asian countries. The largest
coefficients are for Japan and Singapore, two important producers of capital goods and
electronic components used in Chinese manufacturing, and for Indonesia, a heavy
supplier of raw materials and energy to China. Interestingly, the smallest coefficients are
for Korea, where warnings of the “hollowing out” of domestic industry by China’s
growth and fears of FDI diversion are pervasive, and Pakistan and Bangladesh, two Asian
countries whose supply-chain links with China are relatively minimal.34
34 These last results are also consistent with those in our previous paper, where we found weak negative effects of China’s growth of the exports of Pakistan and Bangladesh, which compete with China in the production of textiles, apparel, footwear, etc. We return to this point below.

20
Table 5 provides evidence on which FDI providers are mainly responsible for the
positive coefficients on China’s FDI for other Asian FDI recipients. We obtain positive
effects across the board, suggesting that firms in all OECD countries regard FDI in China
and FDI in other Asian countries as complements rather than substitutes. The largest
absolute impact is due to Japan, because the value of Japanese FDI in China (and other
Asian countries) is far larger than FDI in Asia by other OECD source countries.
7. A Closer Look at Japanese FDI
The preceding results suggest that China’s emergence may be particularly
important for the direction of FDI flows, in terms of absolute magnitude, in the case of
Japan. In this section we therefore examine that country’s foreign direct investment
flows in more detail. We first disaggregate Japanese FDI by individual Asian recipient
country. That is, limiting the sample of FDI recipients to Asian countries (as in Table 5),
we not only allow the coefficient on China’s fitted FDI inflows to differ between Japan
and other source countries, but we allow the Japanese outflow effect to be different for
each Asian recipient of Japanese FDI.
The results are shown in Table 6. The largest positive coefficients are for
Japanese FDI in Indonesia, Malaysia, Singapore, Thailand and Vietnam. The first
country is an important supplier of raw materials to China, while the others are plausible
members of common supply chains with China. The smallest coefficients are for
Bangladesh, India and – interestingly – Korea. The first two cases are consistent with the
interpretation here insofar as Bangladesh and India are not linked into the same supply
chains as China. The coefficient for Korea’s FDI receipts from Japan may be picking up
21
the redirection of Japanese FDI toward lower-labor-cost markets, consistent with
warnings of the hollowing out of Korean industry.35 Note that this is consistent with
what we found for Korea in Table 4 above.
Another way of gaining insight into the redirection of Japanese FDI outflows is to
disaggregate them by sector as well as region. Table 7 disaggregates Japanese foreign
investment over the period 1989-2003 into eight manufacturing industries and nine
nonmanufacturing sectors. For each region, we report the simple correlation between
Japan’s sector-specific FDI in China and its sector-specific FDI in other countries.36
The results are consistent with those obtained from our gravity-model analysis.
There is a positive correlation between Japanese FDI flows to China and Japanese FDI
flows to other Asia whether we consider manufacturing, nonmanufacturing, or total FDI.
This is the same complementarity that we observed using the gravity model above.
Looking at individual sectors, the only exceptions are food processing, chemicals,
construction, trade, and finance and insurance.
For Latin America, we obtain the same weak negative correlation as in the
gravity-model analysis. Again, this is evident for manufacturing, nonmanufacturing and
total FDI alike. In Central and Eastern Europe, where we obtained a positive coefficient
in the gravity-model analysis, we again see positive correlations for manufacturing,
nonmanufacturing, and total Japanese FDI. The positive correlation for manufacturing
seems heavily driven by electrical machinery/electronics and motor vehicles/transport
35 Thus, from our results it would appear that the hollowing-out phenomenon in Korea reflects not so much the diversion of Korea’s own investment toward China as the diversion of inward investment toward lower-labor-cost economies. 36 Since we have only 15 time series observations for each region, a more sophisticated econometric analysis does not seem justified. All values are expressed in real U.S. dollars (yen values are first converted by the yen/dollar exchange rate and then deflated by the U.S. price index).

22
equipment. We suspect that this correlation is spurious, as argued above.37 The positive
correlation for non-manufacturing investment is primarily driven by minerals and mining
and by real estate. (In the case of mining it is important to observe that our data for
Eastern Europe include Russia as an inflow country.) Again, we suspect that this is
correlation, not causation, as argued above.
The last column of Table 7 considers the correlation between Japanese FDI in
China and Japanese FDI in OECD countries.38 Our surprising result above was the
finding of significant diversion of Japanese FDI away from OECD destinations as
Japanese FDI in China expanded. The same correlation is evident here in the sectoral
results. There is a negative correlation between Japanese FDI in China and Japanese FDI
in the OECD for manufacturing, nonmanufacturing, and the total alike, although it is
small in the case of nonmanufacturing sectors. The correlation is negative for six of the
eight manufacturing industries; the exceptions are textiles (where the effect is essentially
zero) and chemicals. The effects are more heterogeneous in the case of
nonmanufacturing sectors – not surprisingly given the existence of only a very small
negative correlation for nonmanufacturing industries overall.
Overall, our aggregate results receive further support from this disaggregated
analysis. Japanese FDI in China and Japanese FDI in other Asian countries appear to be
complements rather than substitutes, although the same happy outcome may not obtain in
each and every industry; for example, producers of processed foods and chemicals are not
likely to be so favored. To the extent that China’s emergence results in FDI diversion, it
37 The correlation reflects the fact that Japanese firms were separately increasing their capacity in these manufacturing industries in both China and Eastern Europe in the late 1990s and the early part of the present decade, not that Eastern Europe and China were part of an integrated supply chain. 38 Bear in mind that, as above, Mexico and South Korea are excluded from the OECD for purposes of this analysis.

23
appears to mainly be the OECD countries that suffer. We interpret in terms of the
domestic-market effect. Japanese firms that would have invested in the OECD in order
to be able to produce close to and sell into its large market are increasingly attracted to
China for essentially the same reasons. Limits on their ability to finance and control
operations in geographically diverse markets have thus led to some crowding out of
Japanese FDI in the OECD in favor of Japanese FDI in China.
8. Conclusions
There has been considerable recent discussion of the possibility that China’s
emergence as a destination for investment has diverted FDI receipts from other countries,
Asian countries in particular. In this paper we analyzed this possibility using both
aggregated and disaggregated data. The aggregate analysis employing bilateral FDI
flows from OECD sources to OECD and non-OECD destinations does not indicate FDI
diversion from other Asian countries. If anything, there is some evidence that
developments making China a more attractive destination for FDI also make other Asian
countries more attractive destinations for FDI, as would be the case if China and these
other economies are part of the same global production networks. Japanese firms, it
appears from our results, are among the leaders in attempting to exploit these
complementarities.
On the other hand there is some evidence of FDI diversion from OECD recipients.
We interpret this in terms of FDI motivated by the desire to produce close to the market
where the final sale takes place. For whatever reason – limits on their ability to raise
finance for investment in multiple markets or limits on their ability to control operations

24
in diverse locations – firms more inclined to invest in China for this reason are
corresponding less inclined to invest in the OECD. Again, it appears that Japanese firms
are among the leaders in redirecting their foreign investment in this way.
These findings then led us to examine Japanese FDI in China and other regions at
the sectoral level. The sectoral patterns confirm the aggregate analysis. Japanese FDI
flows to China and other Asian countries tend to be positively, not negatively, correlated.
The main exceptions in the case of manufacturing are food processing and chemicals,
where supply-chain linkages are plausibly less prominent than in, say, consumer
electronics.
From the perspective of FDI diversion, then, China’s rise is both good and bad
news. It is good news for Asia, although it may not be such good news for individuals
who depend for their livelihoods on the food-processing and chemicals industries, which
are receiving less foreign investment as a result of Chinese competition. On the other
hand, China’s rise may be bad news in this respect for OECD countries and their
manufacturing sectors in particular.
As we found in our previous paper on trade, blanket statements concerning
China’s impact are not particularly supportable. The country’s emergence is a mixed
blessing requiring a nuanced analysis.
25
References Adhikari, Ramesh and Yongzheng Yang (2002), “China’s Increasing Openness: Threat or Opportunity to Others?” unpublished manuscript, Asian Development Bank and International Monetary Fund. Agence France Presse (2004), “EU Mulls Options to Counter Euro’s Surge” (14 November), www.channelnewssaia.com/stories/afp_world_business/view/111404. Ahearne, Alan G., John G. Fernald, Prakash Loungani and John W. Schindler (2003), “China and Emerging Asia: Comrades or Competitors?” International Finance Discussion Paper no. 789, Board of Governors, Federal Reserve System (December). Anderson, James and Douglas Marcouiller (2002), “Insecurity and the Pattern of Trade: An Empirical Investigation,” Review of Economics and Statistics 84, pp.342-352. Blonigen, Bruce, Ronald Davies, Glen Waddell and Helen Naughton (2004), “FDI in Space: Spatial Autoregressive Relationships in Foreign Direct Investment,” NBER Working Paper no. 10939 (December). Capital Markets Consultative Group (2004), Foreign Direct Investment in Emerging Market Economies, Washington, D.C.: IMF. Chantasasawat, Busakorn, K.C. Fung, Hitomi Iizaka and Alan Siu (2004), “Foreign Direct Investment in China and East Asia,” unpublished manuscript, National University of Singapore, UC Santa Cruz and University of Hong Kong (November). China Economic Net (2004), “Economic Dance with China Hand in Hand with Latin America,” 30 November, www.en.ce.cn/main/insight/200411/30. Di Giovanni, Julian (2005), “What Drives Capital Flows? The Case of Cross-Border M&A Activity and Financial Deepening,” Journal of International Economics 65, pp.127-149. Eichengreen, Barry and Douglas Irwin (1995), “Trade Blocs, Currency Blocs, and the Reorientation of Trade in the 1930s,” Journal of International Economics 38, pp.1-24.. Eichengreen, Barry, Yeongseop Rhee and Hui Tong (2004), “The Impact of China on the Exports of Other Asian Countries,” NBER Working Paper no.10768 (September). Frankel, Jeffrey A. (1997), Regional Trading Blocs in the World Economic System, Washington, D.C.: Institute for International Economics. Grubert, Herb and John Mutti (1991), “Taxes, Tariffs and Transfer Pricing in Multinational Corporate Decision-Making,” Review of Economics and Statistics 73, pp.285-293.

26
Hausmann, Ricardo and Eduardo Fernandez-Arias (2000), “Foreign Direct Investment: Good Colesterol?” Research Department Working Paper no. 417, Washington, D.C.: Interamerican Development Bank (March). Hejazi, Walid and A. Edward Safarian (2002), “Explaining Canada’s Changing FDI Patterns,” unpublished manuscript, University of Toronto (September). Henisz, Witold (2000), “The Institutional Environment for Multinational Investment,” Journal of Law, Economics and Organization 16, pp.334-364. Hines, James (1995), “Forbidden Payment: Foreign Bribery and American Business After 1977,” NBER Working Paper no. 5266. International Monetary Fund (2002), “Foreign Direct Investment in China: What Do We Need to Know?” Transcript of an Economic Forum (2 May), www.imf.org. International Monetary Fund (2004), “China’s Emergence and its Impact on the Global Economy,” World Economic Outlook (April). Lapper, Richard (2004), “Latin America Dances to the Chinese Beat,” Financial Times (11 November), p.3. Lian, Daniel (2004), “Sino Hollow,” Morgan Stanley Global Economic Forum (21 October). Lincoln, Edward J. (2002), “On Japan: ‘Hollowing Out’ in Perspective,” Newsweek Japan (August), also at www.brookings.edu/view/op-ed/lincoln/20020828.htm. Loungani, Prakash, Ashoka Mody, Assaf Razin and Efraim Sadka (2003), “The Role of Information in Driving FDI: Theory and Evidence,” Scottish Journal of Political Economy 49, pp.546-543. McKibbin, Warwick and Wing T. Woo (2003), “The Consequences of China’s WTO Accession for its Neighbors,” Asian Economic Papers 2 (2), pp.1-38. Mercereau, Benoit (2005), “FDI Flows to Asia: Did the Dragon Crowd Out the Tigers?” unpublished manuscript, IMF (March). Palmade, Vincent and Andrea Anayiotas (2004), “FDI Trends: Looking Beyond the Current Gloom in Developing Countries,” Public Policy for the Private Sector Note Number 273 (September), Washington, D.C.: World Bank. Rose, Andrew (2003), “Notes on Other Things the WTO Might Be Doing (Besides Liberalizing Trade),” unpublished manuscript, University of California, Berkeley.

27
Stein, Ernesto and Christain Duade (2001), “Institutions, Integration and the Location of Foreign Direct Investment,” in New Horizons for Foreign Direct Investment, OECD Global Forum on Foreign Direct Investment, Paris: OECD, pp.101-128. United Nations (2004), World Investment Report 2004, Geneva and New York: United Nations Conference on Trade and Development. Wei, Shangjin (2000), “How Taxing is Corruption on International Investors?” Review of Economics and Statistics 82, pp.1-11. World Bank (2002), Global Development Finance 2002, Washington, D.C.: World Bank. Wong, Yu Ching and Charles Adams (2002), “Trends in Global and Regional Foreign Direct Investment Flows,” unpublished manuscript, IMF (August). Yang, Tongzheng and David Vines (2000), “The Fallacy of Composition and the Terms of Trade of Newly Industrializing Economies,” unpublished manuscript, Oxford University.

28
Table 1. First Stage Estimates: Determinants of China’s FDI Inflow
Coef St Err Coef
St Err Coef
St Err Coef
St Err
China's distance to source country -2.43 0.05 -2.46 0.05 -2.46 0.05 -2.51 0.05
China's GDP (log) 1.27 0.07 1.15 0.07
China's political risk 0.063 0.004
GDP of outflow country (log) 1.59 0.02 1.59 0.02 1.60 0.02 1.66 0.02
GDP per capita of outflow country (log) 1.60 0.05 1.82 0.05 1.73 0.05 1.42 0.05
GDP of inflow country (log) 0.10 0.02 0.06 0.02 0.05 0.02 0.03 0.02
GDP per capita of inflow country (log) -0.25 0.03 -0.12 0.03 -0.08 0.03 0.00 0.03
Product of land areas (log) -0.09 0.01 -0.07 0.01 -0.06 0.01 -0.04 0.01
Distance (log) 0.10 0.03 0.08 0.03 0.07 0.03 0.04 0.02
Common language dummy 0.67 0.07 0.72 0.07 0.70 0.06 0.67 0.06
Number of land locked (0/1/2) -0.23 0.05 -0.28 0.05 -0.27 0.05 -0.22 0.05
Number of islands (0/1/2) -1.27 0.05 -1.28 0.05 -1.23 0.05 -1.12 0.05
Land border dummy -0.14 0.10 -0.16 0.10 -0.17 0.10 -0.19 0.09
Common colonizer post 1945 0.98 1.04 0.90 1.02 1.01 1.01 1.30 0.91
Pairs ever in colonial relation 0.10 0.11 0.10 0.11 0.11 0.11 0.10 0.10
Strict currency union 0.63 0.64 0.43 0.62 0.29 0.62 -0.23 0.56
Political risk for outflow country 0.035 0.004 0.011 0.004 0.015 0.004 0.049 0.004
Political risk for inflow country 0.036 0.003 0.020 0.003 0.016 0.003 0.006 0.003
Year 1988
Year 1989 1.50 0.18
Year 1990 1.12 0.18
Year 1991 2.13 0.17
Year 1992 2.36 0.16
Year 1993 2.17 0.16
Year 1994 3.57 0.16
Year 1995 4.02 0.16
Year 1996 4.61 0.16
Year 1997 3.72 0.16
Year 1998 3.25 0.17
Year 1999 2.97 0.17
Year 2000 2.84 0.16
Year 2001 2.73 0.16
Year 2002 2.92 0.16
Constant -40.4 0.8 -74.4 2.0 -74.7 2.0 -42.8 0.7
R-squared 0.73 0.75 0.75 0.80
Number of observations 7642 Source: see text.

29
Table 2. Second Stage Estimates of China’s FDI Receipts on Other Countries’
FDI Inflows
IV IV OLS OLS
Coef St Err Coef St Err China's FDI inflow (log) -0.01 0.04 0.25 0.02 GDP of outflow country (log) 1.43 0.08 0.98 0.04 GDP per capita of outflow country (log) 1.58 0.11 1.25 0.09 GDP of inflow country (log) 1.11 0.04 1.05 0.03 GDP per capita of inflow country (log) -0.23 0.05 -0.17 0.05 Product of land areas (log) -0.07 0.02 -0.01 0.02 Distance (log) -0.96 0.05 -0.98 0.04 Common language dummy 1.13 0.12 0.94 0.11 Number of land locked (0/1/2) -0.41 0.09 -0.34 0.08 Number of islands (0/1/2) -0.59 0.08 -0.48 0.08 Land border dummy 0.34 0.14 0.39 0.17 Common colonizer post 1945 7.02 0.67 6.68 1.67 Pairs ever in colonial relation 1.86 0.17 1.97 0.17 Strict currency union 4.29 0.34 4.50 1.02 Political Risk for outflow country 0.08 0.01 0.07 0.01 Political Risk for inflow country 0.05 0.00 0.04 0.00 Constant -80.1 2.86 -64.1 1.6 Number of observations 7642 7642 R-squared 0.55 0.56 Note: Time fixed effects are included though not reported.
30
Table 3. Effect of China’s FDI Receipts on Other Countries’ FDI Inflows, by region
Asia Asia Latin
Am Latin Am
Central & Eastern Europe
Central & Eastern Europe
OECD OECD
Coef. St Err. Coef. St Err. Coef. St Err. Coef. St Err.
China's FDI inflow 0.74 0.10 -0.10 0.17 0.21 0.10 -0.13 0.06
GDP of outflow country 0.33 0.17 1.96 0.35 1.06 0.22 1.31 0.11
GDP per capita of outflow country 0.74 0.25 1.68 0.35 0.64 0.26 2.23 0.16
GDP of inflow country 0.07 0.08 1.02 0.15 1.67 0.18 1.34 0.04
GDP per capita of inflow country 0.10 0.11 2.40 0.46 -1.08 0.24 -0.77 0.16
Product of land areas 0.14 0.05 -0.48 0.12 0.02 0.12 0.15 0.04
Distance -0.33 0.19 -2.99 0.75 -1.35 0.16 -1.41 0.09
Common language dummy 0.28 0.22 -3.13 1.80 1.51 0.17
Number of land locked (0/1/2) 0.02 0.26 -1.79 0.38 1.19 0.17 -0.79 0.13
Number of islands (0/1/2) 0.35 0.14 -1.44 0.47 -1.52 0.42 -0.29 0.13
Land border dummy -2.74 1.02 0.97 0.29 -1.02 0.18
Common colonizer post 1945 2.29 0.73
Pairs ever in colonial relation 2.14 0.22 6.87 1.77 2.12 0.75 0.96 0.25
Strict currency union 0.17 0.69
Political risk for outflow country 0.07 0.02 0.06 0.02 0.08 0.02 0.07 0.01
Political risk for inflow country 0.06 0.01 -0.02 0.02 0.10 0.02 0.08 0.01
Constant -27.8 5.12 -79.0 16.1 -75.9 8.13 -87.8 4.21
Number of observations 1454 941 1025 3353
R-squared 0.63 0.61 0.57 0.62 Note: Time fixed effects are included though not reported. OECD columns do not include Japan, Mexico, and South Korea as inflow countries. (Japan and South Korea are instead included with Asia, Mexico with Latin America).

31
Table 4. Effect of China’s FDI Receipts on Individual Asian Countries (Second Stage)
Coef. Std. Err. t-stat
GDP of capital-outflow country (log) 0.65 0.24 2.8
GDP per capita of capital-outflow country (log) 1.09 0.25 4.4
GDP of capital-inflow country (log) 0.13 0.11 1.1 GDP per capita of capital-flow country (log) 0.07 0.15 0.5
Product of land areas (log) 0.08 0.06 1.4
Distance (log) -0.92 0.29 -3.2 Common language dummy 0.64 0.24 2.7
Number of land locked (0/1/2) -0.001 0.24 0.0
Number of islands (0/1/2) 0.01 0.19 0.0 Dummy for pairs ever in colonial relation 2.09 0.35 5.9
Political Risk for capital-outflow country 0.07 0.02 3.8
Political Risk for capital-inflow country 0.05 0.01 3.7 ChinaFDIfitted*Japan 0.70 0.16 4.3
ChinaFDIfitted*Bangladesh 0.39 0.16 2.5
ChinaFDIfitted*India 0.49 0.14 3.4 ChinaFDIfitted*Indonesia 0.70 0.13 5.3
ChinaFDIfitted*Korea 0.35 0.16 2.2
ChinaFDIfitted*Malaysia 0.53 0.13 4.0 ChinaFDIfitted*Pakistan 0.36 0.15 2.5
ChinaFDIfitted*Philippine 0.52 0.15 3.6
ChinaFDIfitted*Singapore 0.65 0.15 4.4 ChinaFDIfitted*Thailand 0.58 0.14 4.2
ChinaFDIfitted*Vietnam 0.65 0.16 4.0
Constant -36.3 6.24 -5.8 Number of Observations 1454
R-squared 0.60
Note: Time fixed effects are included though not reported.

32
Table 5. The Effect of China’s FDI Receipts on Asian Countries’ FDI Inflows,
by Source Country
Coef. St. Err. t-stat GDP of capital-outflow country (log) -0.90 0.37 -2.45 GDP per capita of capital-outflow country (log) 1.18 0.51 2.32 GDP of capital-inflow country (log) -0.27 0.10 -2.81 GDP per capita of capital-flow country (log) 0.15 0.11 1.36 Product of land areas (log) 0.33 0.06 5.42 Distance (log) -0.18 0.23 -0.8 Common language dummy -1.26 0.29 -4.36 Number of land locked (0/1/2) -1.77 0.67 -2.65 Number of islands (0/1/2) 1.77 0.22 8.18 Dummy for pairs ever in colonial relation 0.09 0.35 0.27 Political Risk for capital-outflow country -0.04 0.02 -2.13 Political Risk for capital-inflow country 0.06 0.01 6.18 ChinaFDIfitted*Hungary 0.47 0.34 1.38 ChinaFDIfitted*Spain 0.52 0.31 1.69 ChinaFDIfitted*Czech 0.59 0.38 1.57 ChinaFDIfitted*Slovak 0.69 0.31 2.24 ChinaFDIfitted*New Zealand 0.81 0.27 3.01 ChinaFDIfitted*Denmark 0.86 0.28 3.09 ChinaFDIfitted*Poland 0.89 0.49 1.83 ChinaFDIfitted*Japan 0.92 0.17 5.34 ChinaFDIfitted*Mexico 1.33 0.40 3.29 ChinaFDIfitted*Italy 1.33 0.24 5.56 ChinaFDIfitted*Germany 1.43 0.22 6.56 ChinaFDIfitted*Turkey 1.51 0.42 3.58 ChinaFDIfitted*Korea 1.57 0.15 10.63 ChinaFDIfitted*France 1.65 0.23 7.09 ChinaFDIfitted*UK 1.67 0.25 6.79 ChinaFDIfitted*Austria 1.69 0.40 4.18 ChinaFDIfitted*Iceland 1.85 0.28 6.69 ChinaFDIfitted*Australia 1.96 0.34 5.83 ChinaFDIfitted*Finland 2.00 0.30 6.66 ChinaFDIfitted*Sweden 2.02 0.34 5.89 ChinaFDIfitted*Norway 2.14 0.70 3.07 ChinaFDIfitted*US 2.23 0.24 9.35 ChinaFDIfitted*Netherlands 2.44 0.24 10.07 ChinaFDIfitted*Swiss 2.86 0.33 8.79 ChinaFDIfitted*Portugal 3.10 0.59 5.27 ChinaFDIfitted*Greece 5.07 1.23 4.12 Constant 5.34 11.25 0.47 Number of observations 1454 R-squared 0.71 Note: Time fixed effects are included though not reported.

33
Table 6. The Effect of China’s FDI Receipts on Asian Countries’ FDI Inflows, by Source and Recipient Country
Coef. Std. Err. t-stat
GDP of capital-outflow country (log) -0.30 0.23 -1.3
GDP per capita of capital-outflow country (log) 0.47 0.25 1.9
GDP of capital-inflow country (log) -0.11 0.09 -1.2
GDP per capita of capital-flow country (log) 0.03 0.12 0.2
Product of land areas (log) 0.22 0.05 4.3
Distance (log) -0.58 0.30 -2.0
Common language dummy -0.94 0.23 -4.0
Number of land locked (0/1/2) 0.35 0.23 1.5
Number of islands (0/1/2) 1.57 0.20 7.8
Dummy for pairs ever in colonial relation 1.90 0.33 5.7
Political Risk for capital-outflow country 0.05 0.02 2.8
Political Risk for capital-inflow country 0.06 0.01 5.1
ChinaFDIfitted*(Source country is not Japan) 1.35 0.14 9.7
ChinaFDIfitted*Japan*Bangladesh 0.51 0.17 3.0
ChinaFDIfitted*Japan*India 0.66 0.14 4.7
ChinaFDIfitted*Japan*Indonesia 0.95 0.14 6.6
ChinaFDIfitted*Japan*Korea 0.61 0.18 3.4
ChinaFDIfitted*Japan*Malaysia 0.76 0.15 5.2
ChinaFDIfitted*Japan*Pakistan 0.55 0.14 3.9
ChinaFDIfitted*Japan*Philippine 0.65 0.16 4.0
ChinaFDIfitted*Japan*Singapore 0.75 0.15 5.0
ChinaFDIfitted*Japan*Thailand 0.87 0.15 5.9
ChinaFDIfitted*Japan*Vietnam 0.85 0.20 4.4
Constant -6.56 6.00 -1.1
Number of observations 1454
R-squared 0.64
Note: Time fixed effects are included though not reported.

34
Table 7. Correlation between Japan’s FDI Outflow to China and
Other Regions: by Sector
Asia Latin Am
Central & Eastern Europe
OECD
Manufacturing Total 0.32 -0.05 0.10 -0.23 Food -0.40 0.00 -0.28 -0.20 Textile 0.30 0.37 -0.03 0.08 Lumber & Pulp 0.14 0.12 -0.18 -0.04 Chemical -0.29 -0.25 -0.06 0.42 Metal 0.42 0.40 0.23 -0.31 Machinery 0.16 -0.11 0.11 -0.15 Electrical 0.51 -0.11 0.49 -0.32 Transport 0.30 -0.08 0.51 -0.22 Non-Manufacturing Total 0.20 -0.34 0.32 -0.02 Farming & Forestry 0.56 0.16 -0.14 0.23 Fishery 0.36 0.06 0.46 -0.08 Mining 0.18 -0.13 0.91 0.57 Construction -0.15 0.39 -0.12 -0.22 Trade -0.47 0.00 0.39 -0.05 Finance & Insurance -0.27 0.20 -0.07 -0.01 Service 0.50 0.49 0.22 0.58 Transportation 0.63 0.32 0.36 -0.24 Real Estate 0.20 0.51 0.86 0.04 Total 0.18 -0.22 0.07 -0.33 Note: The sample period is 1989 to 2003. FDI is expressed in real US dollar term.

35
Figure 1. China's FDI Inflow
0
5
10
15
20
25
30
35
40
1988 1989 1990 1991 1992 1993 1994 1995 1996 1997 1998 1999 2000 2001 2002 2003
Year
Per
cent
age
China/World China/Developing Countries
36
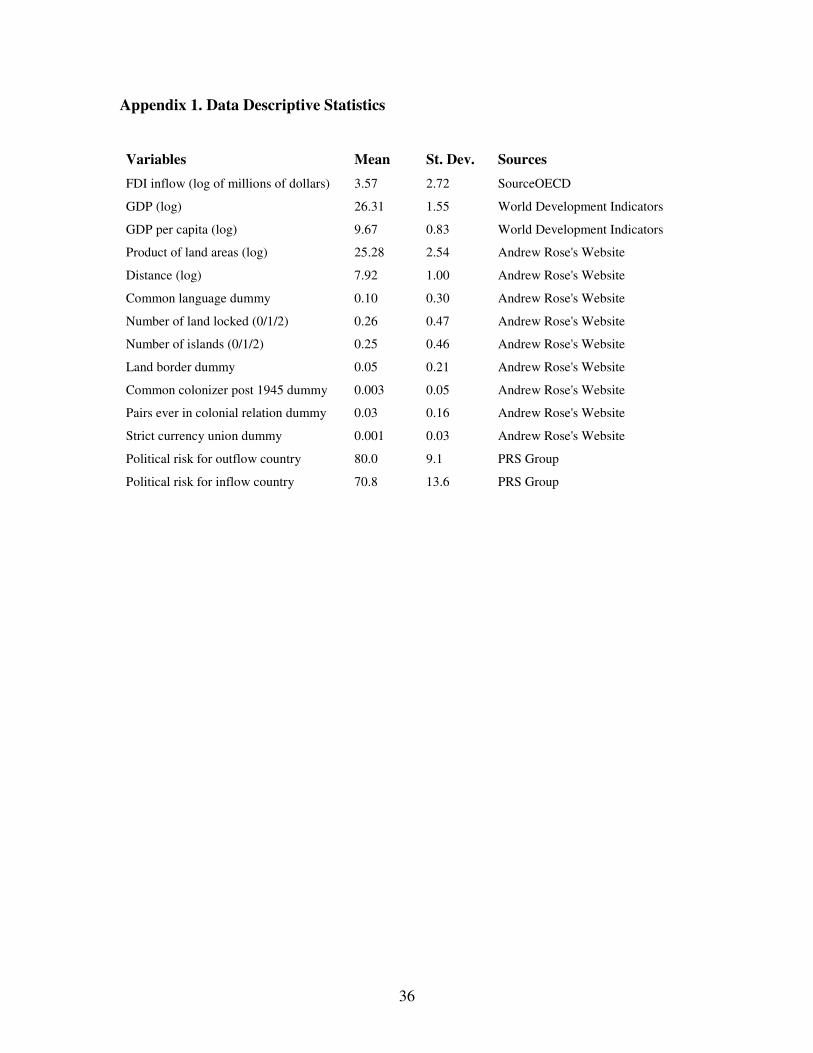
Appendix 1. Data Descriptive Statistics Variables Mean St. Dev. Sources FDI inflow (log of millions of dollars) 3.57 2.72 SourceOECD
GDP (log) 26.31 1.55 World Development Indicators
GDP per capita (log) 9.67 0.83 World Development Indicators
Product of land areas (log) 25.28 2.54 Andrew Rose's Website
Distance (log) 7.92 1.00 Andrew Rose's Website
Common language dummy 0.10 0.30 Andrew Rose's Website
Number of land locked (0/1/2) 0.26 0.47 Andrew Rose's Website
Number of islands (0/1/2) 0.25 0.46 Andrew Rose's Website
Land border dummy 0.05 0.21 Andrew Rose's Website
Common colonizer post 1945 dummy 0.003 0.05 Andrew Rose's Website
Pairs ever in colonial relation dummy 0.03 0.16 Andrew Rose's Website
Strict currency union dummy 0.001 0.03 Andrew Rose's Website
Political risk for outflow country 80.0 9.1 PRS Group
Political risk for inflow country 70.8 13.6 PRS Group