NBER WORKING PAPER SERIES INCOME TAX INCENTIVES … · NBER WORKING PAPER SERIES INCOME TAX...
44
NBER WORKING PAPER SERIES INCOME TAX INCENTIVES TO PROMOTE SAVING Charles Becker Don Fullerton Working Paper No. 487 NATIONAL BUREAU OF ECONOMIC RESEARCH 1050 Massachusetts Avenue Cambridge MA 02138 June 1980 Presented at the May 12, 1980 Symposium of the National Tax Association-Tax Institute of America. We would like to thank John Shoven and John Whalley with whom Don Fullerton worked to develop the general equilibrium model used in this paper. We would also like to thank Norman Ture and Charles McLure for valuable suggestions, and the Treasury Department's Office of Tax Analysis for financial assistance. We retain responsibility for remaining errors and for views expressed. The research reported here is part of the NBER's research program in Taxation. Any opinions expressed are those of the author and not those of the National Bureau of Economic Research.
Transcript of NBER WORKING PAPER SERIES INCOME TAX INCENTIVES … · NBER WORKING PAPER SERIES INCOME TAX...

NBER WORKING PAPER SERIES
INCOME TAX INCENTIVESTO PROMOTE SAVING
Charles Becker
Don Fullerton
Working Paper No. 487
NATIONAL BUREAU OF ECONOMIC RESEARCH1050 Massachusetts Avenue
Cambridge MA 02138
June 1980
Presented at the May 12, 1980 Symposium of the National TaxAssociation-Tax Institute of America. We would like to thank JohnShoven and John Whalley with whom Don Fullerton worked to developthe general equilibrium model used in this paper. We would alsolike to thank Norman Ture and Charles McLure for valuablesuggestions, and the Treasury Department's Office of Tax Analysisfor financial assistance. We retain responsibility for remainingerrors and for views expressed. The research reported here is partof the NBER's research program in Taxation. Any opinionsexpressed are those of the author and not those of the NationalBureau of Economic Research.

NBER Working Paper #487June, 1980
~ncome Tax ~ncentives to Promote Saving
ABSTRACT
This paper examines six possible reforms of the U.S. personal income
tax system. The paper evaluates the proposals by estimating the dynamic
analog to compensating variations using a medium-scale general equilibrium
model designed to allow a broad range of tax policies. We find that pro-
posals to index the tax system for inflation tend to provide large welfare
gains, while other measures designed to raise the net-of-tax return to
capital are successful to the extent that they serve as ad hoc-offsets
for inflation or to the extent that they partially integrate the corporate
and personal income taxes. Results also indicate that intertemporal and
interindustry efficiency gains are of comparable importance. Finally,
results suggest that additional intertemporal welfare gains can be achieved
at the cost of a more regressive over-all tax structure.
Charles BeckerDon Fullerton
Woodrow Wilson School ofPublic and International Affairs
Princeton UniversityPrinceton, New Jersey 08544
(609) 452-6425(609) 452-4811

Economic research as well as popular attention has focused in recent
years on the intertemporal and interindustry efficiency distortions in
the U. S. tax system. This paper estimates the welfare gains from proposals
intended to reduce distortions imposed by the present tax structure, and
notes the degree to which these gains derive from intertemporal or inter
industry corrections. Our model and results support three propositions.
First, the proper allocation of new capital is as crucial as the creation
of new capital itself. Second, tax reform plans to index the system against
inflation are more potent in this combined task of increasing savings and
allocating investment efficiently than are ad hoc measures designed to en
courage saving, such as interest income exclusions, capital gains exclusions
or pension liberalization. Finally, larger welfare gains from removal of
intertemporal and interindustry distortions entail the cost of a less pro
gressive tax structure, since high income groups tend to save a higher
proportion of their income.
We examine six alternative plans which might be discussed in an ef-
fort to increase consumer savings through the personal income tax system
in the United States. These plans attempt to affect savings through an in
crease in the real rate of return either by direct tax cuts on savings or by
indexing tax rates against inflation. The paper.presents estimates of static
and dynamic resource allocation effects for the six plans, and compares them
to results obtained in earlier work on the impacts of more sweeping reforms.
A medium-scale numerical general equilibrium model is used which integrates
the U. S. tax system with consumer demand behavior by household and producer
behavior by industry.

- 2-
The static or annual welfare measures are derived by comparing the
1973 base year to a single counterfactual equilibrium, and they concentrate
mostly on interindustry distortions. Ranking the six plans by the size of·
the gain, results indicate that extensive inflation indexation of the U. s.
tax system would yield the largest annual static efficiency gain, more
than $4 billion (1973 dollars). Excluding 60% of dividends from the per-
sonal tax base would have an effect about half as large, while indexing
capital gains alone would further reduce the gain. Proposals to exclude
70% of interest income from the personal tax base or to decrease the capital
gains inclusion to 30% augment welfare still less. A plan to increase pen
sion, Keogh, and IRA maxima and to expand their scope engenders fairly
small static welfare gains because they do not operate so as to decrease
interindustry distortions in the allocation of capital.
Our dynamic measures of welfare gain are derived by comparing an en-
tire sequence of equilibria under the new-tax regime to the sequence gen-
erated from the 1973 tax regime. It not only captures gains from reducing
capital misallocation, but also records intertemporal efficiency gains
from reducing the "double tax" on savings. Dynamic effects exceed static
ones, and our analysis indicates that the extensive indexation plan may
yield gains whose present value is approximately $200 billion, or about 1/2
of 1% of the discounted present value of an "expanded" income stream to the
U. S. economy after correction for population growth.~1 The dividend ex
clusion yields present value gains of about $100 billion, while the other
plans are less successful. Plans differ in their distributional impacts,
although these findings depend on the nature of replacement taxes used to
preserve government revenues. The size of dynamic resource allocation ef-

- 3 -
fects are sensitive to the choice of the replacement tax, while static gains
are more robust.
The relative magnitude of the gains involved depend largely on one's
perspective. They could be treated as upper bounds, since the disequi1ib-
rium losses likely to be incurred are not captured in our model. On the
other hand, the size of the gains is reduced by our assumption that financial
policies do not change. The best plans discussed here offer welfare bene-
fits approximately as large as those accruing with the complete integration
of the corporate and personal income taxes, as discussed in Fullerton, King,
Shoven, and Whalley (1980a and 1980b).
At least four choices greatly influence the size of welfare gains and
the proportions of those gains derived from removal of interindustry and
intertempora1 distortions. First, we employ 0,,4 for the uncompensated
savings elasticity with respect to the net rate of return. Intertemporal
distortions would be greater, and hence their role more important, if this
elasticity were higher.11 Second, we use .04 to discount future welfare
gains from intertempora1 corrections. These would be more (less) signifi-
cant if a larger (~ma11er) discount rate were used. Third, since each of the
plans involves at least a short-term revenue loss, we assume that the gov-
ernment balances its budget by scaling up personal marginal tax rates or· by
imposing lump-sum taxes on consumers. We describe this scaling procedure
more thoroughly in Section III. Because scaled marginal rates apply to in-
come from both labor and capital, the effect is to remove only a portion
of the intertemporal distortion while allowing any given reform plan to have
full interindustry effects. Fourth, our estimates of the elasticity of 8ub-
stitution between capital and labor in each industry vary between 0.6 and

- 4 -
1.0. Higher elasticities of substitution would imply larger interindustry
distortions. Consequently, the relative size of gains from the removal of
interindustry and intertemporal distortions cannot be forecast with pre
cision. Our results make it apparent, however, that the order of magnitude
of the gains is similar.
I. Saving, Inflation, and Income Taxation.
The U. S. tax system's treatment of capital imposes two major types
·of distortion. The first of these is an intertemporal one. Savings occur
of of after-tax income, yet its return may be taxed again by both the cor
porate and personal income taxes. This additional taxation has the effect
of raising the cost of saving, thus biasing consumption plans towards the
present and away from the future. The second large distortion is an inter
industry one. Different industries incur different effective capital tax
rates due to varying degrees of incorporation, age structures of assets,
debt/equity ratios, and other financial policies. Rational investors will
equalize rates of return net of all taxes that discriminate by industrial
location. Therefore, as producers set the marginal cost of capital equal
to its marginal product, the latter must differ by industry. Reallocation
of capital from low to high marginal product industries could consequently
increase total product.
Both intertemporal and interindustry distortions are aggravated by
the presence of inflation. With respect to taxes on labor income, the progres
sive nature of the personal income tax (PIT) ensures rising marginal and
average tax rates for individuals as inflation occurs, unless rates are
systematically reduced. Since saving varies positively with real income,
the effect of inflation through its impact on the personal income tax may

- 5 -
be to reduce private saving.
With respect to taxes on capital income, inflation creates illusory
capital gains which are nonetheless taxed as if they were real. The value
of shares in an industry should rise by an amount approximately equal to che
inflation rate times that industry's ownership of capital stock, and these
purely nominal gains are then taxed as income. Inflation simultaneously
reduces the real value of permissable depreciation deductions for calculating
the corporate or personal income tax base. Furthermore, with the deduction
of interest payments and inclusion of interest income in tax bases, inflation
lowers the effective rate of tax on borrowers and increases the rate on
lenders. Because industries differ with respect to (a) the proportians of
capital gains that are real and nominal, (b) the age structure of their as
sets, and (~) the proportion of investment financed by debt, the effect of
infTation will not only increase capital taxes on real capital income, but will
do so differentially by industry.
The present tax system thus contains a considerable anti-savings bias,
aggravated by its inflation non-neutrality. Consequently, there exists a
prima facie case for encouraging saving through the tax system and its
treatment of inflation. Since proposals to increase saving through the tax
system do so by increasing the return to postponed consumption, and as in
flation increases effective personal and corporate income tax rates, pro-
posals to promote saving tend to partially offset the real effects of in
flation. Conversely, attempts to make taxes on labor and capital income
inflation neutral11 will increase the real return to saving. Welfare ef
fects of a plan to raise savings and reduce intertemporal distortions will
be heavily influenced by the reform's impact on reducing interindustry dis-

- 6 -
tortions caused by inflation, and vice versa.
Advocates and opponents of various proposals to increase saving and
index taxes have taken sides with necessarily partial knowledge of their
plans' long term productive and distributive impacts. Our estimates
below show that the effects of typical proposals on national income vary
considerably, while distributive impacts range from extremely regressive
to approximately neutral. The remainder of the paper evaluates some of
these tax reform proposals by simulating them in a dynamic general equi
1ibirum model of the U. S. economy.
This model, developed by Fullerton, Shoven, and Whalley for the U. S.
T!easury Department, is based on disaggregated micro data. It captures the
effects of a tax change on factor prices and output prices, thus measuring
both the sources side and uses side of income simultaneously. The initial
parameters are obtained in a manner that ,allows us to replicate the 1973
U. S. economy as an equilibrium. We assume that the 1973 economy was both
in equilibrium and that it was on a steady-state growth path. Welfare im
pacts of a proposal are then determined by calculating its model-equivalent
form, obtaining an equilibrium for a counterfactua1 economy in which the re
form has b~en implemented, and then comparing this economy to the unaltered
base equilibrium sequence.
The next section formally introduces and describes six concrete propo
sals for tax structure reform. These plans are similar at least in spirit
to existing proposals in government and political circles. The third section
discusses the general equilibrium model used to evaluate the proposals
and notes the sources for the data and exogenous parameter values employed.
Section IV considers the simulation results obtained, while a concluding
section summarizes the insights they reveal. Finally, in an Appendix we

- 7 -
specify how each tax proposal is translated into modelled rate and equa-
tion changes'for the purpose of calculating the counterfactua1 economy.
II. Six Reforms.
The first proposal considered, P1, is a plan to raise the maximum
amounts deductible for employer or employee contributions to pension plans,
4/Keogh self-employment plans and IRA retirement accounts.- The plan's
primary goal is to encourage savi~g, and it does far less to remove inter-
industry distortions or to correct for inflation. Increasing these maxima
effectively serves to reduce the proportion of an individual's savings sub-
ject to taxation, and thus reduces the inter·tempora1 distortion caused by
the tax system. In principle, any plan to expand pension/Keogh/IRA cover-
age or to raise their ceilings has an ambiguous effect on inducing new
savings. While the price effect is clearly positive, since the effective
cost of postponing consumption is reduced, the income effect is likely to
have a negative impact. Since we use an estimate from Boskin (1978) of .4
for the uncompensated elasticity of savings with respect to the net rate of
return, our results show that P1 does have a strong, positive imp~ct on
savings.
The second proposal considered, P2, makes 70% of personal interest re-
~ ceipts deductible from the personal tax base. While P2's supporters may in-
tend to encourage saving and partially index capital income against inflation,
the latter goal is not systematically achieved. Nominal interest income
is already deductible on the borrower's side. As corporate business is a
major net debtor, thi~ treatment means that inflation could have a nega-
tive effect on real tax rates for interest income, more than removing any
double taxation. The plan may exacerbate the debt/equity distortion

- 8 -
already existing with the corporate income tax on only equity income.
Since only certain forms of savings are encouraged by an interest in-
come exclusion, one would expect it to be a less potent savings inducement
. .. 5/ It might have a larger wel-than l1beral1zat10n of the pension programs.-
fare gain, however, since the interest exclusion generates reductions in
interindustry and other distortions, as industries with disproportionately
large amounts of debt finance tend to be relatively highly taxed by cor-
porate or other tax systems.
The third proposal consists of the imposition of a60% dividends ex
clusion from the personal income tax basJYcombined with the elimination of
the $100 dividend deduction.i / As the value of the $100 deduction amounts
to only about 4% of dividends paid in 1973, the net effect is to substantia1-
ly reduce the average rate of taxation on personal savings. The effect on
the marginal rate is still stronger: those with dividend income above $100
receive the majority of dividend income. Therefore, the $100 deduction is
primarily a lump-sum transfer to dividend recipients, and has little impact
on marginal tax rates. Since dividends as a return to savings are taxed at
both theco~porate and personal level, increasing the exclusion helps e1im-
inate an important source of intertemporal distortion. Furthermore, due to
~different rates of incorporation and financial policies across industries,on dividends
the extra tax/implies various rates among various industries. The ef-
ficiency gains from dividend exclusion may therefore be especially strong.
P4 is based on a recent proposal by Senator Russell Long (D.-La.) to
reduce the percentage of capital gains includable in the personal income
tax to 30%. While P4 may be partially intended to counteract the rising
effective capital tax rates due to inflation, it does so in an ad hoc

- 9 -
manner. Its main consequence is to raise the rate of return to holding
corporate stock. As with P2 and P3, only one of several forms of savings
receives a reduction in intemporal distortion, and then only a partial one.
Their relative potencies will depend on the extent to which interindiustry
distortions are also lessened. Welfare gains will also be affected by
the plans' distributional impacts, primarily because of different propen-
sities to save. Since high income consumers save a higher proportion of
their incomes, a progressive (regressive) tax change will tend to reduce
(i ) h i f i saved.~/ncrease t e aggregate proport on 0 ncome
In contrast to P4, the next plan does involve the inflation indexation
of capital gains. The added real tax burdens on capital gains income i~
posed by inflation may cause significant net welfare losses, as well as
creating large income redistributions. On the other hand, an inflation in-
dexation proposal would be slightly more difficult to implement than any
of the plans previously mscussed. Any scheme would be necessarily imperfect
since a perfect price index dces.not exist. Once a price index is chosen,
the base purchase price used in the calculation of capital gains can beT
readily adjusted upward by a factor ~~i (l~(t» , where ~(t) is the
inflation rate in year t, and T is the number of years for which the
asset is held. In our calculations we compare indexation to a benchmark
equilibrium with a .perpetual 7% inflation rate, the rate recorded in 1973.
The degrees of excludability allowed in P2 and P3 were chosen with the in-
tention of making them comparable in terms of additional capital formation
to P5.
The final proposal considered, P6, is one designed to almost complete
ly index taxes on income from capital against inflation. 9! It is the only

- 10 -
plan involving changes to tax laws other than on the personal income tax.
P6 includes the indexation of depreciation deductions for corporate in-
come taxes, incorporates the indexation of capital gains, and also involves
changes in the treatment of interest income. Taxation of dividends at a
constant rate with only insignificant deductions renders its taxation ap-
proximately inflation-neutral. The other major taxes such as those on
property and rent income, are also approximately ad valorem taxes on
factor income, and as such are inflation neutral. In general, any tax
levied in an ad valorem fashion, either on a product or on a fac-
tor's income, will be inflation neutral. A tax with a variable average
rate or which taxes nominal value that fails to increase pari passu with
inflation will have its effective rate vary with inflation.
Depreciation allowance indexation requires that each corporate or non-
corporate firm's taxable income in year k be reduced by the amountk~=~, (l~(t»·DEPR(k) where k' is the year in which the firm's capi-
tal assets were purchased and DEPR(k) is the historical cost depreciation
allowance in year k. Obviously, the computational problem grows in com-
plexity when one admits the possibility that firms purchase various assets
in different years. Nonetheless, the practical problems of implementation
~are far from insurmountable.
Indexation of capital gains corresponds exactly to that of plan 5.
Finally, interest indexing in P6 involves the deduction of interest income
from the personal income tax base equal to the rate of inflation times the
base value of interest-earning assets. However, deduction of interest pay-
ments from the corporate income tax base must be cut by n(t) times the
value of their interest-receiving 1~abi1ities. Household interest deduc-
tions on n(t) times their interest beari~g liabilities are also barred.
1JI

- 11-
Given the above tax adjustments, the only significant impact of unan-
ticipated inflation ~n real capital income earnings will be to impose lump-
sum gains on debtors and losses on lenders. When P6 is implemented, a
corporation's capital tax rate will be unchanged by inflation regardless of
its financial policies. Individuals are taxed only on the returns to their
investments, rather than on the returns plus ~(t) times their interest-bear-
ing assets.
III. The General Equilibrium Model.
We use an empirical general equilibrium model previously developed
by Fullerton, Shoven and Whalley to simulate the effects of different tax
10/reform proposals.-- It has been constructed as a general purpose model,
but is particularly well' suited to analyze specific tax policy changes. Its
construction from disaggregated microeco~omic data allows interindustry
distinctions unobtainable in most macroeconomic models. A brief outline of
the model is provided here.
The economy is divided into nineteen profit-maximizing industries,
each of which produces a single output from a,combination of capital services,
labor serv~ces, and the outputs of other industries. Capital services are in
fixed supply during a given period, but grow over time as investment occurs.
Labor endowment is in fixed supply at any instant, but grows over time at
a constant rate. Labor supply in any period is variable and equals ag-
gregate labor endowment less leisure:.time. Labor s,Upply is thus determined
by leisure demands, which depend on relative prices and income. Both
labor and capital are perfectly mobile across industries.
Each industry has a Cobq-Douglas or other Constant Elasticity of Sub-
stitution (CES) production function 'over primary inputs, where the elas-

- 12-
ticity of substitution is chosen as a t~est-guess" value from evidence in
the literature. Each output is used in part as an intermediate input through
a fixed-coefficient input-output matrix. Outputs can also be purchased by
government, used for investment, or be converted via a fixed coefficient
transformation into one of fifteen consumer goods. There is a simple for
eign trade sector to close the model, but for all practical purposes this
model of the U. S. e~onomy should be considered to be a closed one.
There are twelve consumer classes, differentiated by their 1973 income
levels. Consumers in each class possess initial endowments of labor and
capital services which can be sold for use in production or to government.
Perfect factor mobility' and perfect competition combine to ensure equality
of the net-of-tax return among industries. As noted above, a consumer can
also choose to buy some of his own labor endowment as leisure. We model all
gov.ernment transfers as essentially lump-sum payments to consumer groups in
proportion to their observed 1973 receipts from social security, unemploy
ment compensation, food stamps, and other welfare programs.
Consumer demand functions are based on CES utility functions with
double nesting. The choice between present and future consumption is rep
resented by the outside nest, and the elasticity of substitution between
~ those two types of consumption is based on an estimate of the uncompen
sated savings elasticity with respect to the net-of-tax rate of return.
We use the value of 0.4 found by Boskin (1978). The breakdown of present
consumption into commodities and leisure is represented by the inside nest,
and the elasticity of substitution between those two subsets is based on an
estimate of the uncompensated labor supply elasticity with respect to the
net-of-tax wage. For this latter value we use 0.15. This choice is discussed

- 13 -
in Fullerton (1980a). All classes have the same form of utility function, and
identical labor supply and savings elasticities. They do have different de
mands for all commodities, however, with the parameters determined from
Consumer Expenditure Survey data.
The various Federal, state and local taxes are typically modelled as
ad valorem tax rates on purchases of appropriate products or factors. Cor
porate income taxes and property taxes are modelled as different effective
rates of tax on use of capital by industry. Social security, workmen's com
pensation and unemployment insurance appear as industry taxes on labor use.
Personal income taxes operate as different linear schedules for each con
sumer group, with marginal tax rates increasing from an average of 1% for
the lowest income group to 40% for the highest income group.
In our benchmark model inflation has effects on real taxes through
the capital gains and interest income taxes and by the use of depreciation
allowances based on historical costs. Consequently, inflation has the real
effect of altering each industry's tax on use of capital services
and hence its effective price of capital services. On the other
hand, the inflation rate remains an exogenously specified parameter.
There is an implicit presumption in the model that various
tax policies do not have differential impacts on the inflation rate itself.
Instead, the model has been adjusted to obtain 'different effective capital
tax rates for different inflation rates. Effective capital tax rates are
calculated by measuring each industry's real use of capital services with
replacement cost depreciation.
The model is parameterized for 1973 using data from the National
Income and Product Accounts, the Bureau of Labor Statistics' Consumer Ex
penditure Survey, and the Treasury Department's merged tax file. These

- 14 -
data are adjusted for known inaccuracies 9f government collection proced
ures and for general equilibrium consistency requirements.ll
/ This "bench-
mark" data set is used to solve backwards for relevant preference parameters
and tax rates. so that the model solution can replicate the benchmark equi-
1ibrium. The user can specify different tax rates a~d equations to re-
calculate a simulated "counterfactua1" equilibrium with different resource
allocations for comparison with the benchmark. The model is solved using
Merrill's variant of Scarf's algorithm for an equilibrium price vector
where excess demands and profits are zero.
Capital accumulation occurs through the act of saving by consumers and
replacement investment by firms. less depreciation. Savings is treated as
the sixteenth consumer good, and involves the purchase of producer goods in
fixed proportions to form a composite investment good. The conversion from
expected future consumption to demand for savings is based on a myopic ex-
pectations assumption: consumers take the current return to capital as the
expected future return in deciding how much to save. In a steady state,
this myopia will turn out to be realistic.
The notion of a static benchmark equilibrium is extended to a bench-
mark steady state in which all values grow proportionately at the effective
labor force growth rate. Labor force growth is evenly divided between popu-
lation changes and Harrod-neutral technical progress. A tax policy change
causes divergence from the original steady state path, and alters the economy's
factor ratio and utility levels at any instant. The model's essential
convexity makes asymptotic convergence to a new steady state path an almost
certain event. The new steady state i~ characterized by a new constant
ratio of effective labor units to capital service units and unchanging rela-
tive prices. The net adVisability of a policy change will depend on the

- 15 -
size and timing of changes in consumer utility levels, the distribution of
those changes, and the discount rate used to compare the two sequences.
It is important to recognize the somewhat limited sense in which we
simulate general equilibria. Various financial policies are captured in
our modelling of capital income distribution flows, but we assume these poli-
cies to be fixed because we have no estimates of the elasticities of cor-
porate financial policy with respect to the effective prices of finance.
Therefore, for example, a reduction in the dividends includability in the
PIT base does not induce corporations to alter the fraction of net income
they distribute as dividends. This assumption of corporate non-responsive-
ness causes the present value estimates to be biased downwards. Sensitivity
analysis can be performed by allowing corporations 'to alter their financial
patterns in a logical direction but by an essentially arbitrary amount.
Th • h b d . d f h 1" h 12/1S strategy as een pursue 1n a stu y 0 ot er tax po 1Cy c anges.---
It has been found that extreme corporate reaction assumptions lead to
welfare gains of roughly 50 to 100% more than the gains registered in the
nonresponsive case.
The model as specified does not include aspects of disequilibrium such
as factor unemployment. It measures real effects without a money equation,
expressing all prices in relative terms. Voluntary unemployment is captured
~ through the labor/leisure choice, though, and the interaction of exogenous-
ly specified inflation with effective tax rates is modelled by adjusting
those rates appropriately. The model is thus complementary to short-run
Keynesian disequilibrium models rather than competitive with them.
Finally, the model requires that government run a balanced budget.13/
Therefore, when policy changes generate alterations in the tax equations
and parameters, the revenue gain or.loss implied cannot be recorded as a

- 16 -
government surplus or deficit. The model further specifies that the gov-
ernment obtain a specific real value of goods and services over time, with
its purchasing power defined by means of a Laspeyres price index. Conse-
quently, each policy change that implies a loss of government purchasing
power must be compensated by a tax increase that just offsets that loss.
The model is constructed to allow for automatic changes in the income tax
structure to provide the extra tax to maintain an "equal yield." This
equal yield can be realized by imposing a lump-sum tax on all consumer groups
in proportion to their initial net incomes, or by increasing the marginal
tax rate of each class by a constant amount (additive scaling), or by multi-
plying the marginal rate of each class by a constant fraction (multiplica-
tive scaling). This last method can impose severe deadweight losses on the
economy, because proportionately more of the revenue is obtained from the
high7income, high-saving class. Some might prefer' its progressive nature,
however, since the capital tax reductions of the six proposals are often
regressive. Rather than comment on the desirability of different distributional
impacts, we present the reader with alternative replacement taxes. The
tradeoff between efficiency and distributional impacts will be noted below.
IV. Results.
Table 1 presents the dynamic welfare gains, measured as the present
value of compensating variations for all classes over time. This measure
will include both intertemporal and interindustry efficiency effects. For
the dynamic welfare effects we evaluate the instantaneous utility over
current consumption and leisure in each period. That is, letting Cf
denote future consumption, L denote leisure, and X. (i=l, ••• ,15)1.
denote each of the current consumption goods, we evaluate the "H"s in the
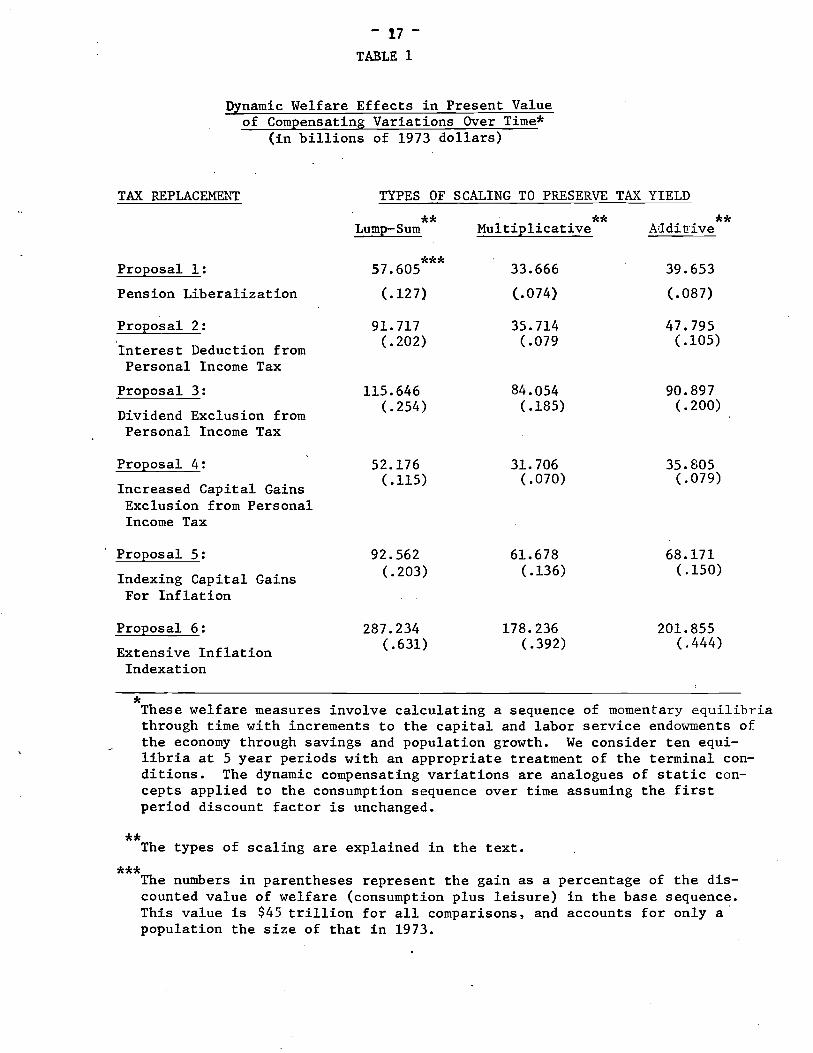
- 17 TABLE 1
Dynamic Welfare Effects in Present Valueof Compensating Variations Over Time*
(in billions of 1973 dollars)
TAX REPLACEME1"'T
Proposal 1:
Pension Liberalization
Proposal 2:
Interest Deduction fromPersonal Income Tax
Proposal 3:
Dividend Exclusion fromPersonal Income Tax
TYPES OF SCALING TO PRESERVE TAX YIELD
** ** **Lump-Sum Multiplicative Ailditrive
***57.605 33.666 39.653
(.127) (.074) (.087)
91. 717 35.714 47.795(.202) ( .079 (.105)
115.646 84.054 90.897(.254) ( .185) (.200)
Proposal 4:
Increased Capital GainsExclusi.on from PersonalIncome Tax
ProposalS:
Indexing Capital GainsFor Inflation
Proposal 6:
Extensive InflationIndexation
52.176(.115)
92.562(.203)
287.234(.631)
31. 706( .070)
61.678(.136)
178.236( .392)
35.805( .079)
68.171(.150)
201.855(.444)
*These welfare measures involve calculating a sequence of momentary equilibriathrough time with increments to the capital and labor service endowments ofthe economy through savings and population growth. We consider ten equilibria at 5 year periods with an appropriate treatment of the terminal conditions. The dynamic compensating variations are analogues of static concepts applied to the consumption sequence over time assuming the firstperiod discount factor is unchanged.
**The types of scaling are explained in the text.
***The numbers in parentheses represent the gain as a percentage of the dis-counted value of welfare (consumption plus leisure) in the base sequence.This value is $45 trillion for all comparisons, and accounts for only a .population the size of that in 1973.

-.-" ..... ,.~._- .,_..•.. -.,.,. ",,~ .. ,,"'!:';~~
- 18
TABLE 2
Selected Effects of the Six Tax Reform Proposals
(1) (2) . (3) (4) (5) (6) (7) (8) (9)
Expanded National Revenue Cost Initial Final Initial Final FinalIncome Income Shortfall Effective- Relative Relative Chance in Change in Change inChange Change ness Price of Price of Savings Savings Capital Stock
($ billions) ($ billions)($ billions) Ratio ~ Capital (%) (%) (%)
Proposal 1: .204 .406 2.673 12.59 0.998 0.972 4.184 4.199 3.053(Pension (.012) (.032)l1beraUza tion)
Proposal 2: .857 -.055 4.357 8.20 1.017 1.012 0.834 0.848 0.614(Interest (.051) (-.005)Deduction fromthe PersonalIncome Tax)
Proposal 3:(DiVidends Exclu-sion from the 1.763 1.155 2.493 33.72 1.015 1.008 1.135 1.138 0.828Personal (.104) (.092)Income Tax)
Proposal 4: .572 .223 1.612 19.67 1.008 1.004 0.641 0.644 0.468(Increased (.033) (.017)Capital GainsExclusion fromthe PersonalIncome Tax)
Proposal 5: 1.188 .634 2.465 25.02 1.013 1.006 1.074 1.080 0.785(Indexing (.070) ( .050)Capital Gainsfor Inflation)
Proposal 6: 4.183 2.026 8.681 20.53 1.048 1.027 3.215 3.267 2.364(Extensive (.248) ( .162)InflationIndexation)
Column (1): The figures represent static welfare gains (with multiplicative scaling in $ billions), equal tochanges 'in annual real expanded income. The latter includes national income plus leisure valuedat the household net-of-tax wage. A geometric mean of Paasche and Laspeyres price indices areused to obtain real changes. The figures in parentheses are the percentage changes in expandedincome caused by each reform.
Column (2): This column gives additions to national income, (with multiplicative scaling) again using thegeometric mean of old and new prices. Figures in parentheses give the gains as a percent ofnational income (excluding leisure).
Column (3): The numbers in this column represent the first year's revenue shortfall (in $ billions) causedby each proposal. This is the value of the lump-sum tax that must be levied on individuals inth~ new equilibrium (With lump-sum scaling) to preserve government purchasing power.
Column (4): This is the "cost-effectiveness" measure, equal to the ratio of the dynamic welfare gain (withmultiplicative scaling) divided by revenue shortfall.
Column (5): These figures give the first year's price of capital services relative to the price of labor services (when multiplicative scaling was used in the simulation). In the benchmark steady stateequilibrium sequence the relative price of capital services equals 1 throughout all periods.
Column (6): The same relative price as in Column 5, but for year 50. These should be close to the new steadystate price ratios.
Col~ (7):
Column (8):
Column (9):
These figures are the first year's percentage changes in saving over the benchmark values inducedby the proposed reforms (with multiplicative scaling).
The last period's savings from the reform sequence as a percent of the same period's savingsin the benchmark sequence (with multiplicative scaling).
The figures represent the percentage change in private capital endowment in year 50 induced bythe proposed reforms (with multiplicative scaling).

TABLE 3
'"Percentage Changes in Expanded Real Income after Taxes and Transfers byIncome Class, for Eac~ Tax Replacement
Proposal 1: ProP2_s~L2: Proposal 3: Proposal 4: Proposal 5: Proposal 6:
Interest Dividend Exc1u- Increased Capital Indexing CapitalConsumer Group Pension Deduction From sion From Person- Gains Exclusive From Gains for Infla- Extensive In-
(lncome _Brackets)' Liberalization Personal Income Tax al Income Tax Personal Income Tax tion flat ion IndexingAdd."'''' Nult. Add. Mult. Add. ~u1t. Add. Mu1t. Mi:. Mult. Add. Mult.
0-3.000 -.136 .066 -.146 .166 -.039 .143 -.074 .046 -.089 .091 .310 .935
3-4.000 -.147 .027 -.081 .191 .013 .171 -.040 .063 -.038 .118 .283 .827
4-5.000 -.152 -.004 -.060 .173 .037 .172 -.021 .067 -.013 .121 .231 .697
5-6.000 -.138 -.004 -.043 .169 .056. .179 -.013 .068 .004 .126 .263 .687
6-7.000 -.125 .000 -.043 .155 .071 .186 . -.001 .075 .020 .134 .273 .670
7-8.000 -.107 -.002 -.036 .131 .083 .180 .007 .071 .034 .130 .266 .600
8-10.000 -.074 .006 -.024 .103 .092 .166 .013 .062 .043 .117 .249 .504I
~0-12.000 -.015 .036 .013 .094 .130 .177 .033 .065 .078 .125 .328 .490 ....\0
12-15.000 .046 .082 .019 .076 .146 .179 .046 .068 .094 .127 .357 .469
15-20.000 .149 .135 .088 .064 .196 .182 .072 .064 .141 .128 .450 .402
20-25.000 .252 .201 .183 .100 .• 273 .225 .117 .087 .211 .164 .637 .471
25.000 + 1.269 1.037 1.342 .975 1.139 .'923 .612 .471 1.002 .791 2.619 1.881
1<Expanded Real Income includes leisure. valued at the household net-of-tax wage rate. Numbers shown are the arithmetic means of percentagechanges to income based on Paasche and Laspeyres price indices.
1<1<The percentage changes arc shown for additive seal:! ng of marginal tax rates for revenue replacement. then for mu1tiplicate scaling.

TABLE 4
*Capital Tax Rates By Industry
Proposal 2 Proposal 3 Proposal 4 Proposal 5 Pro,posal 6
Interest Deduc- Dividend Exclusion Increased Capital Gains Indexing Capital
Benchmark**tion from Personal from Personal Exclusion from Personal Gains for Infla- Extensive InflationIncome Tax Income Tax Income Tax tion Indexing
-***f .70 .61 .64 .66 .64 .60Agriculture· Fores-
. tries· Fisheries .47 .44 .47 .47 .47 .43Mining .87 .82 .80 .80 .78 .69Crude Petroleum &
Natural Gas .88 .87 .64 .85 .79 .74Construction 1.94 1. 73 1.81 1.86 1. 79 .99Food and Tobacco 3.20 2.83 2.73 3.12 2.95 2.08Texti1~s, Apparel,
Leather 2.36 2.10 2.15 2.27 2.17 1. 75Paper and Printing 1.52 1.49 1.40 1.43 1.39 1.17Petroleum Refining .42 .41 .44 .36 .35 .33Chemicals and Rubber 1. 75 1.68 1.55 1.65 1.60 1.29
NLumber· Furniture· Stone .85 .82 .80 .77 .76 .69 0Metals and Machinery 1.61 1.50 1.48 1.52 1.47 1.21 ITransportation Equipment 19.21 13.49 11.56 20.86 17.14 4.29Motor Vehicles 1. 20 1.13 1.07 1.12 1.08 1.00Transportation, Com-
munication, Utilities 1.53 1.23 1.30 1.49 1.38 1.09Trade 1.73 1.66 1.60 1.64 1.59 1.33Finance and Insurance 1. 80 1.80 1. 75 1.72 1. 75 1.56Real Estate .58 .53 .58 .58 .58 .56Services .68 .64 .67 :67 .66 .58Government Enterprises .26 .26 .26 .26 .26 .26
*Capital tax rates are defined as total capital factor taxes over capital income net of all taxes.
**The tax rates for Proposal 1 (pension liberalization) are identical to the benchmark rates because only consumers' savings subsidies are affected.
***-f is the average proportion of capital income taxable by 'the personal income tax. It is further explained in the text and appendix.

- 21 -
individual nested utility functions
(1)
We then obtain the number of dollars needed to pay each consumer in each
period to be able to reach the H sequence of the benchmark, and discount
those dollars by the assumed 4% discount rate.
Table 2 presents a number of summary statistics for the six plans,
including the static or annual measures of welfare gain in columns I and 2.
The static measures of efficiency shown in column I are the changes in ex
panded income, defined as the sum of national income plus leisure, evalu
ated at the geometric mean of pre- and post-policy change prices. Column
two gives the percentage change of national income alone, and can thus be
affected by labor/leisure choices. We use the real income figures rather
than. compensating or equivalent variations in static comparisons because
the utility contribution of savings may be inaccurately assessed by con
sumers due to their myopic expectations.
Column 3 shows the revenue shortfalls generated by the various proposals
when revenues are replaced by lump-sum taxes on. consumers. This type of re
placement tax was used here to isolate the effects of the plan without com
bined effects from scaling marginal tax rates. A "cost-effectiveness" ratio,
equal to the dynamic welfare gain with multiplicative scaling divided by
this first year revenue shortfall is also computed and shown in column
4. Column 5 presents the relative price of capital services in the first
year and column 6 the relative price of capital in year 50. The latter
set of figures should be close to the steady state price ratio. Column
7 gives the first year's percentage increase of savings over the bench
mark value for each reform, while column 8 gives the same figure for

- 22 -
year 50. Finally, column 9 provides the percentage increase in capital
stock after 50 years with each reform.
Table 3 presents the twelve income classes along with the distribution
al results of each plan. We examine only the initial distribution effects
from the static model because the dynamic model is not able to obtain sat
isfactory estimates of distributional impacts. Table 4 shows the nineteen
industries in the model, and presents a comparison of capital tax rates by
industry for the six plans.
Examining Table 1 first, it is apparent that the P6 extensive index
ing plan dominates all other proposals by large amounts, regardless of the
replacement tax. Welfare gains are about $200 billion in present value.
Results of sensitivity analysis suggest that the added depreciation de-
duction accounts for most of the gain. A reason for the strong showing
of both P6 and the P3dividends exclusion proposal, with about $100 billion
of gains, lies largely in their removal of interindustry distortions.
They both go a long way towards reducing taxes on capital and thus much
intertemporal distortion as well. 14fn fact, the gain from inflation index
ing is nearly equal to the elsewhere estimated gain from full integration
of the corporate and personal income taxes.lil It is also evident from
Table 1 that there is a sizeable welfare gain to be had from the F5 indexing
capital gains alone, over $60 billion. This exceeds by more than $30
billion the gain from P4" (jncreasing the capital gains exclusion to 70%).
To lielp explain this result, turn briefly to Table 4, which suggests that
P5 (gains indexing) is more successful than P4 (gains exclusion) in re
ducing the effective capital tax rates on those industries with particu
larly high rates, thus giving it a stronger interindustry effect. That
it also reduces f (the average proportion of capital income taxable by

- 23 -
the personal income tax} by a larger amount attests to its superior ability
in reducing intertemporal distortions as well.
The dynamic welfare benefits from adopting PI (pensions liberalization)
or P2 (interest exclusion) are comparable to the gains from implementing
P4 (capital gains exclusion). This result in itself is noteworthy, since
it suggests that interindustry effects are extremely important. PI offers
purely intertemporal efficiency gains, and P2 offers large intertemporal
benefits relative to P4. 16 / Nonetheless, P4 compensates by achieving
greater interindustry gains than PI or P2. Note, however, that the weight
of the intertemporal gains is apparently greater for the lump-sum replace-
ment, where intertemporal efficiency gains are not offset by revenue-pre-
serving taxes on both labor and capital income.
The static welfare results in the first two columns of Table 2 conform
to the pattern set in Table 1, with the exception of a reversal of ranking
of P4 (~apital gains exclusion) and PI (pensions liberalization). Pension
liberalization looks relatively worse here because the static measures do
not adequately capture intertemporal effects, where it is strongest. P2
(jnterest exclusion) does relatively bette~, though in the case of multi
plicative scaling for tax replacement it actually induces a fall in national
income.
Turning to column 3 of Table 2,it is seen that the extensive indexa-
tion package requires a much larger income tax increase to offset its im-
plementation than does any other plan. The interest exclusion plan also
demands a rather large replacement tax, particularly relative to the size
of the welfare gain it offers. Proposals 3 (dividends exclusion), 4 (gains
exclusion) and 5 (gains indexation) require relatively small replacement
taxes, and thus have high cost-effectiveness ratios, shown in column 4.

- 24 -
While the cost-effectiveness ratio provides a rough indicator of net benefits
per dollar of tax revenue» it does not demonstrate that these plans are most
desirable in the sense of, providing the largest net gains or savings in-
creases.
The price of capital services relative to the price of labor services
appears in columns 5 and 6 in Table 2. The expected return to saving in
this model is
r = (2)
where Ps is the price of the composite savings or investment good» Pk
is the relative price of capital services in columns 5 or 6» y is the
four percent real net-of-tax rate of return to capital assets» and P
is the expected composite relative price index of consumption goods antici-
pated to prevail in the following periods.
Except for the pension liberalization proposal» which raises the rate
of return by providing a savings subsidy (reduces Ps )>> the increases in
Pk largely mirror the increases in r induced by the reforms. Ignoring
the insignificant changes that occur in gross Ps and P» the effect' of
pension liberalization is to increase r by 3.03%. Long-run increases'
in Pk (~nd therefore r) are merely 0.4% for P4 (gains exclusion)>> 0.6%
for P5 (gains indexation)>> 0.8% for P3 (dividends exclusion)>> and 1.2% for
P2 (interest exclusion)>> but amount to some 2.7% when extensive inflation
indexation is implemented. As they have the largest impacts on r» PI and
P6 will generate the largest purely intertempora1 welfare gains. Note
that the savings responses that ensue tend to moderate the degree to which
Pk increases over time» as capital/labor ratios increase. The tendency

- 25 -
to absorb part of the efficiency gains in increased leisure time further
raises the capital/labor ratio~
Columns 7 and 80f Table 2 present savings responses to each of the
proposals. Pl~ the direct savings subsidy, has the largest impact, followed
closely by the extensive indexation plan. The other savings plans gener-
ate an amount of savings roughly 1% over the benchmark case in each year.
Column 9 provides similar information, that PI and then P6 do the most to
raise future capital stocks through savings.
Looking at the distributional patterns appearing in Table 3, importance
of the form of tax replacement is evident: multiplicative scaling greatly
enhances the gains or reduces the losses of the poorer classes. On the
other hand, multiplicative scaling induces lower welfare gains °in both the
static and dynamic present value estimates than either other replacement.
It has been found both here and elsewhere that a strong tradeoff exists
between the size of the welfare gain and its distribution to the poorer
classes. 17/ This is only mitigated on occasion by the fact that the very
bottom income groups, consisting largely of retirees, own significant amounts
of capital.
All proposals are regressive when additive scaling is used for tax re-
placement. In the case of PI (pension liberalization)~ the first eight
~ classes are made worse off. P6 (extensive indexation) is only weakly re-
gressive under additive scaling, and no class is made worse off.
Examining the distributional effects with multiplicative scaling for
tax replacement~ we find that all plans show bimodal curves for percentage
benefit gains. This stems from the U-shaped distribution of the capital!
labor ratio across income classes, so that any plan which increases Pk
or cuts taxes on capital will tend to have a U-shaped distribution of gains.

- 26 -
PI remains a somewhat regressive plan. With the exception of benefits
accruing to the twelfth income class, the distribution effects of P3
(dividends exclusion) and P4 (gains exclusion) are not far from being
proportionate. Again excluding the twelfth class, P6 (extensive indexation)
even enjoys a progressive distribution of gains. All proposals provide a
percentage gain to the richest class far larger than to any other class.
P6, however, is a Pareto improvement in the sense that every class is made
'better off regardless of the tax replacement.
The capital tax rates presented in Table 4 are valuable for comparisonsrelative
of/interindustry tax differentials. The rates do not iriclude certain pen-
sion tax exclusions modelled as general savings subsidies. A cursory glance
shows that of the proposals modelled as directly affecting the capital tax
rates (P2 through P6), P6 (extensive indexing) reduces capital tax
rates by a far larger amount than do the others. It seems especially ef-
fective in reducing tax rates for the most heavily taxed industries, and
thus yields more interindustry gain as well as intertemporal gain.
Most of the results obtained are consistent with a priori expectations.
The gains accruing to the proposals involving increased exclusions (P2,
P3, P4) largely reflect the fact that they represent movements towards per-
sonal and corporate tax integration. The size of the gains from indexing
schemes attest to the importance of inflation in increasing both inter-
temporal and interindustry distortions. Obviously, these welfare impacts
would have been even more important if 1980 data had been available so
that 1980 inflation rates could be used.

- 27 -
v. Conclusion.
This paper analyzes six alternative plans to increase savings by cut-
ting taxes on capital income. The capital tax cuts appear in different
forms, and include effortsto reduce the real impacts of inflation on the
taxation of real income. We employ a recently constructed general equi-
librium model for the U. S. economy and tax system. The paper discusses
the model and its use of disaggregated data in the third section, and out-
lines the model equivalent forms of the proposals in an appendix.
Extensive indexation of capital taxes for inflation is shown to yield
present value dynamic gains of about $200 billion, comparable to the welfare
gains obtainable from integration of the personal and corporate income taxes.
A 60% exclusion of dividends from the personal income tax offers gains of
about $100 billion, based on the assumption of unchanging financial policies.
The gains for indexing only capital gains for inflation are over $60 billion,
indicating that this proposal dominates the proposal to reduce the capital
gains inclusion to 30%. The distribution of the gains among the income c1as-
ses is similar for the two proposals.
Both the static and dynamic results indicate that interindustry efficiency
gains are of the same order of magnitude as intertempora1 ones. The plan
most successful in terms of generating new savings and capital formation,
PI, is among the least successful in terms of welfare gains measures. The
simulations serve to emphasize our first proposition that increased capital
is only valuable if used properly. In general, the inflation indexing plans
prove effective in achieving both greater capital formation and its proper
allocation. As the second proposition notes, the proposals to increase thein generating welfare gains.
return to capital in an ad hoc manner tend to be less successfu1/ One can-
not divorce resource allocation effects from a welfare analysis of the i~

- 28 -
pacts of proposed savings incentives.
Dynamic and static gains are highly sensitive to the chosen yield pre
serving tax, as these taxes impose differing welfare losses themselves. It
is apparent that the results will also be highly sensitive to the inflation
rate chosen. In general, non-neutrality of the U. S. tax system ensures
that inflation will have significant real effects.
As our third proposition states, there is an apparent inverse rela
tionship between the size of welfare gain obtainable and its progressive
impact for any particular plan. The cost of increased capital accumula-
tion through reduced intertemporal distortions appears to be a redistribution
of income shares from poor to rich.
As a summary observation we draw attention to the one plan which pro
vides gains to all classes, even if the percentage gains differ, regardless
of replacement .tax assumption. This plan, involving the provision of ex
tensive inflation indexation, also happens to be the plan with the largest
dynamic welfare gain, accruing from improvements to intertemporal efficiency
and interindustry efficiency. These two strong. attributes of the indexing
plan are only offset by its possibly greater administrative complexity.

- 29 -
APPENDIX
The general equilibrium model is designed to allow a variety of methods
of distributing income from different assets, and to capture the influence
of the major taxes imposed on each type of capital income. This Appendix
discusses the modelling of capital taxes and personal taxes on capital in-
come, and explains the changes made to the benchmark data set and equations
in order to model the proposed reforms.
The capital tax calculation computer program, TMOD, first estimates
total returns to capital in each of the nineteen industries. It reads in,
data on dividends, retained earnings, rents paid, interest payments, unin-
corporated capital income and imputed interest payments in each industry. We
aim to allocate capital according to where it is used rather than by the
sector in which the returns are ultimately received. The imputed interest
payments prevent the Finance/Insurance industry, which enjoys positive net
interest income, from being credited with negative capital use.
Our goal is to determine the capital tax rate (eTR) in each industry
as a function of the relevant tax laws, institutional patterns, and finan-
cial practices. To find the CTR in an industry, we divide capital taxes
~ by net capital factor income. We define a unit of capital as that amount
which earns an annual return of $1 net of all taxes that discriminate ac-
cording to industrial location. This definition stems from the requirement
of a Walrasian equilibrium that marginal factor returns net of all taxes
be equalized across industries. Because effective taxation on capital in-
come at the personal income tax (PIT) level depends upon the industry from

- 30-
which the capital income was received~ it is necessary to include part of
personal tax payments in the tax on income from capital. 18 I
To model this~ define KGi
as capital income net of taxes paid at
the firm level in industry i but gross of personal income taxes. Also
define kg. as the amount of capital income received before PIT paymentsJ
by the j th income class. Then
19L KG
i+ KG
20=
i=l
12L.
j=lkg,
J(1)
where KG20 represents the government's use of privately owned capital
for its own "consumption" purposes.
Data on the marginal tax rates of each of the consumer classes have
been obtained from the Treasury Department's merged tax file. A weighted
average marginal tax rate then can be calculated as
where T.J
12L kgjTjj=lT =12
.Llkg,
JCI J
is the marginal tax rate of the .thJ consumer group.
(2)
Next~ the model defines a fraction f. for each of the industries and1.
government which denotes the proportion of that sector's capital income which
is subject to full personal income taxation. This fraction differs across
industries due to a number of features~ including the variance in dividendI
retention policies of firms and the degree to which unincorporated capital
qualifies for the investment tax credit. In addition to the capital taxes
paid directly by industries~ there is now another factor tax~ tP~ which

- 31 -
is labelled the personal factor tax (PFT). Total PFT's paid in an
industry are then
i=1, ••• ,20, (3)
where the personal factor tax rate on KGi
is fiT
Introduction of the PFT enables us to define a unit of capital as
that asset which earns $1 net of all cap~tal taxes including the PFT~ Then
the number of units of capital in an industry, equal to net capital income
in that industry, is KNi = KGi(l - fiT). We also define f as the aver
age fraction of KGi which is fully subject to the PIT:
f =
20r KG.f.
i=l J. J.
20r KG
ii=l
(4)
The new KNi will be distributed to the 12 consumer classes as kn .•J
Since capital income has been subjected to the average PIT rate at the
factor level, there is a correction for each marginal tax rate at the per-
sona1 level. The personal income tax applied to capital income is given
by
t~ = (T.. - T)kg.fJ J J
j=l, ••. ,12 (5)
(in net of all tax capital units).
This equation states that corrections at the personal level are based
on the average fraction of capital income that is taxable at the personal
level.

- 32 -
These consumer taxes on capital income are both positive and negative
and when aggregated over the twelve consumer classes yield no revenue.
The modelled system operates exactly as a withholding system under which
each industry pays tax on fiKGi at the average rate T. The consumer
income taxes t~ correct the tax rate for each consumer class: those withJ
rates above L pay more taxes while those below ~t refunds. Since T is chosen
as the capital weighted average of marginal tax rates, the
above sum' over the twelve consumer classes to zero.
t~J
equations
Given the fi's, determination of the capital tax rate in industry i
(CTRi ) is straightforward. It equals the sum of the corporate franchise tax
(CFTi
) ,corporate income tax (CITi ), property taxes, (PTi ), and personal fac
tor taxes paid in the i th industry, divided by capital income net of all
taxes. That is,
eFT. + CIT. + PT. + ti 'CTR. = _--=1.:::..-__.....:1.==--__:::.1.__=_
1. KNi
i=1, ••• ,19. (6)
To calculate the f. we make use of data on capital income types by1.
industry, consisting of corporate dividends (DIVi), retained earnings (RE.),
. 1.
corporate and noncorporate net monetary interest payments (M! .) and im1.
puted interest payments (II.), net rent payments including the rent from. 1.
owner-occupied homes (RENT.), and the return to' capital used in noncor1.
porate business (NCli ). These types of capital are treated differently by
the personal income tax,~each can be said to have a proportion g which
is fully taxable by it. An industry's fi
is the weighted average of these
g proportions, and each industry has different weights or amounts of these
capital income types. Specifically,

- 33-
(7)
+
where NCITC. is the noncorporate investment tax credit. Since the NCITC.1 1
reduce the personal income tax liability, we include in the numerator the
amount of income which if fully taxable would result in the reduced lia-
bi1ity. It is the amount NCli - NCITCi/L which when multiplied by L
yields observed tax collections NCr. L - NCITC .•1 1
For the housing industry,
imputed net rents of owner-occupied homes are excluded from the numerator
since this imputed income is not taxable.
In the benchmark case, and gRENT are taken to be one, since
interest and rents are entirely subject to the personal income tax. The
value of dividend exclusions under the $100 deductability rule amounts to
about 4% of dividend payments. For simplicity we treat the exclusion as a
fixed percent, rather than a fixed amount, and use .96 for gDIV'
The determination of gRE is more complex. The effective propori
tion of taxable capital gains is reduced by the deferral allowed, assuming
retained earnings are immediately capitalized in the value of corporate
stock but that the stock is not immediately sold. Estimates of the deferral
value suggest that it is considerable; we multiply the percentage of gains
includable, PINCL, by 50% to account for this deferral. 1973 tax law pro-
vided for 50% inclusion of capital gains in the PIT base, giving PINCL a
base value of a half. With inflation, the annual increment in capital
Fina1-
- 34 -
gains - that is, the rise in stock value - should exceed the value of·
retained earnings. Capital gains should also reflect the nominal in-
crease in that industry's capital assets, an amount equal to the inf1a-
tion rate, T , times ASSETi , the value of assets held by corporations
in the i th industry. The increment in nominal capital gains divided by
the industry's real capital gains is then (~.ASSETi + REi)/REi •
1y, before this amount can be multiplied by the deferral factor and PINeL,
recognition must be taken of the approximately 17.2% of corporate stock
which was held in 1973 by pensions and insurance companies. Taxation on
savings through these channels is virtually nonexistant, but the model
already treats this tax break as part of a 30% savings exclusion from the
PIT, since approximately 30% of household savings in 1973 occurred through
these vehicles. To avoid doubly crediting this tax break, 17.2% of retained
earnings must be treated here as being fully taxable. Then
(~·ASSET. + RE.)·(~828) + .172= PINCL· (deferral) . ~.. ~ ~
REi
= .207(ASSET./RE.) + .379.~ ~
(8)
Note that unlike the other g proportions, gRE varies by industry.i
/Figures concerning insurance company and pensions' holdings are available
in Flow of Funds data. The ASSET. figures are 'obtained from 1976 Survey~
of Current Business data in the following manner. Estimates of corporate
net rents and net interest paid are added to figures, giving corporate profits
after tax with inventory valuation adjustment (IVA) and capital consumption
adjustment (CCA). Corporate net rents and net interest shares of total

- 35 -
rents and interest paid are assumed to equal the ratio of corporate profits
after tax with IVA + eCA over the sum of those profits and noncorporate
capital income. The resulting vector of income to corporate assets is
then scaled up to equal $732 billion, the asset value of individuals' cor-
porate equity holdings in 1973. The ASSETi
values thus equal the value
of corporate capital owned by households and used in the i th industry.
Having described the manner in which the model derives capital tax
rates, we proceed to consider the changes incorporated in order to capture
the goals of the six tax reforms. The proposal to raise pension maxima is
treated as an increase in the savings exclusion from 30 to 40%.
The plan to increase the interest exclusion is also straightforward.
Flow of Funds data on assets and liabilities suggest that the gross lending
by households is $793.2 billion, while lending by pensions and insurance
companies is $323.7 billion, or 29% of the combined value. Insurance and
pension income is lightly taxed but this exclusion is treated elsewhere.
Therefore interest excludability should only pertain to the sum directly
. paid to individuals. We use gross rather than net household assets to de-
termine our weights, on the grounds that P2 does not affect the ability of
individuals to deduct interest payments from their taxes. Letting PI1~INCL
denote the percentage of interest income fully taxable at personal rates,
~ we have
g1 = P1NT1NCL·(.7l} + .29 (9)
The impact of the excludability proposal, P2, is to reduce PINT1NCL from
1 to .3, or from 1 to one half.
The next three proposals involve only single parameter changes. The
plan to remove the $100 dividend dequction but to allow a 60% dividends
- 36 -
exclusion from the personal tax base starts with the assumption that the
percentage distribution of total dividend income accruing to nontaxable
insurance companies and pensions equals their share in equity holdings,
the aforementioned 17.2%. Referring to the percentage of dividends includ-
able in the PIT base as PDIVINCL, gDIV may be written as
~IV = PDIVINCL·(.828} + .172. (10)
The model equivalent form of P3 is to change PDIVINCL from .9444 to .389,
or from .96 to one half.
The proposal to increase the capital gains exclusion, P4, is modelled
in a like manner. The term PINCL in equation (8) is reduced from .5 to
.3 to capture the reduction in capital gains includability from 50% in
1973 to Senator Long's suggested 30%.
The P5 proposal set forth as an alternative to Senator Long's proposal would
index capital gains by removing the capital gains tax on purely nominal ap
preciation in stock values. This is achieved in the model by setting ~
equal to zero in equation (8).
The final, comprehensive indexing package involves several substantive
changes. As with P5, capital gains indexing is achieved by setting ~
/ in equation (8) to zero. Indexing of depreciations is achieved in the following
manner. We start with the assumption that the indexing scheme will permit a
reduction in the tax liability of the i thindustry by an amount equal to
DEDUCTIONi = «1 + ~) t - 1) ·DEPRi·CTRi • (11)
Inflation is assumed to be a constant 7%, and t represents the mean
length of time from an asset's purchase to its declaration for the deprecia-

- 37 -
conservativelytion allowance. We/take this figure to be three years for all industries,
so that .225043 is used for (l~)t - 1. It should be stressed that the
results are highly sensitive to the values chosen for i. Moreover,one
would ordinarily anticipate a change in financial policies to accompany
changes in the tax treatment of depreciation: t should change with the
removal of discrimination against long-lived assets. OUr model does not
capture this additional efficiency gain.
The new capital tax, NCTi
, equals the old capital tax, OCT. less1
DEDUCTIONi • Consequently, the new capital tax rate can be obtained by divi
ding NeT. by KN • ,1 1
OCTi - 0.225043.DEPRi ·CTRiKN
i(12)
and solving for CTRi yields:
CTR.1
(13)
The figures for DEPR.1
are found by aggregating and adding corporate capi-
tal consumption allowance data for 1973 obtained from the July, 1976 SCB
to unpublished estimates of noncorporate depreciation obtained from the
Commerce Department.
The third element in comprehensive indexing involves the removal of
part of taxable interest income from the PIT.base and elimination of part
of the individual and corporate deduction for interest payments. SCB figures
suggest a 1973 inflation rate of roughly 7% and prime interest rate of
slightly more than 8%. Assuming the average loan was at 9%, a real interest

- 38 -
rate of 2% emerges. Since 7/9 of interest income was only nominal,
we reduce the value of PINTINCL from 1 to 2/9 in the equation:
gI = PINTINCL· (.262) + (.738) (14)
The removal of 7/9 of the deductions ~laimed on household interest
payments as well means that only household net interest-bearing assets,
some $114.9 million, should enter the weighting scheme. This lowers the
weight on PINTINCL to .262 (compared to P2 in which gross interest-bearing
assets entered the weighting scheme). The impact of this measure is notnet
great, since most/interest income accrues to pensions and insurance com-
panies, which are already favored. The value of gI only falls from 1 to .942.
Since it is not the intention of indexing to allow both interest pay-
ments and interest receipts to be deducted, corporate interest deducta-
bility is decreased to 2/9 of total interest payments. Individuals and
corporations are thus allowed only a real deduction invariant with the in-
flat ion rate. In principle, 7/9 of interest deductability for noncorporate
enterprises should also be removed. We felt, however, that this would be
a highly impractical proposal. Much unincorporated business, particularly
in agriculture, has a high ratio of interest payments to gross income. A
reduction in their interest deductability could imply tax liability in ex-
cess of cash receipts since gain occurs as a lower real value of debt.
Without significant institutional changes, it is unclear that this could
be accoIIDnodated without severe disruption: It is also most unlikely that
the Congress would consider such a reduction in the first place. We there-
fore limited our reduction in deductible interest payments to the household and

- 39 -
corporate sectors. In addition to changing the weights in (14), this
action has the effect of increasing corporate taxes in industry by the
.48 marginal corporate tax rate in 1973 times the percent of·interest no
longer deductible, 7/9, times corporate interest payments in industry i,
CINT.. Additional corporate income tax payments in the i th industry,1
NCITi , are then
(IS)
The CINTi figures used are for net corporate interest paid, taken from un
published data for 1973 allowed us by the National Income Division of the
Commerce Department.
The general equilibrium model we use clearly allows the effective
modelling of a great number of policies, in manners similar to the adapta-
tions for the six proposals outlined above. A limited drawback is that
financial policies remain unchanged. However, any guess or prediction based
on a model of the U. S. financial sector can easily be incorporated by simply
altering the sizes of various flows in the TMOD routine.

Footnotes
1The expanded income stream also includes an evaluation of leisureequal to the present value of the net-of-tax wage times leisurehours enjoyed over time.
2See Boskin (1978) and Summers (1978). Boskin also reaffirms thatsaving is a positive function of net-of-tax real income.
3For expositional convenience, we refer to a tax system in which taxes arehomogeneous of degree one in prices as "inflation neutral" or"indexed." That is, an indexed system is one in which nominalbut not real variables are affected by the inflation rate.
4The modelling of all six plans is specified in more detail in theappendix.
5Our notion of potency or cost effectiveness is shown in Table 2. Itis the change in present value of real income caused by the reformedsequence of equilibria, divided by the first year's revenue shortfallinduced by the change
6We consider dividend deduction from the personal income tax rather thanfrom the corporate income tax for purposes of allowing greater comparability with the plans to permit interest income and capital gains ex-
. clusions from the personal income tax.
7The tax rates and deductions are all based on our 1973 data and taxlaws. Our comparisons are all based on changes to the 1973 economyand the following dynamic sequence based from the 1973 economy, whichhad a $100 dividend exclusion.
8In our model, individuals all have the same utility functional form.Data consistency requirements imply differences in some parameters;exogenously chosen ones are assumed identical across individuals.Each CES form has constant marginal utility of income, though thesevalues may differ by class since parameters differ.
9
True inflation neutrality would be difficult, if not impossible toachieve. Individuals and firms alter financial practices in mannersthat prevent any practical proposal from achieving inflation neutrality.Any change to capital tax rates such as the indexation of all capitalincome could thus cause capricious capital gains and losses, followingthe adage that an old tax is a good tax. Proposals for indexationand their shortcomings are discussed in Brinner (1973) and Folsom (1978).

Footnotes, Cont'd.
10More detailed descriptions of the model can be found in Fullerton(1980b) or in Fullerton, et al., (1978, 1980a, 1980b).
11A detailed presentation of the procedures is supplied in Fullerton,Shoven, and Whalley, (1978).
12See Fullerton, et al., (1980a), pp. 21,24.
13Extensions to allow government debt are currently being consideredalong with numerous other extensions and applications of the ~odel.
14Plan 3 (60% dividend exclusion from the PIT) does relatively well herebecause of its role as a partial corporate and personal tax integrationscheme. We recognize that there may be more advantageous tax integration proposals, such as dividend gross-up and credit or dividend deduction from the corporate tax base. These proposals are discussed inFullerton, et al., (1980a, 1980b).
15See Fu11erton t et al., (1980b).
16That P2's intertemporal effects exceed P4's can be seen from Table4: since both F2 and P4 only affect the proportions of capital incometaxable by the PIT, the "f."s, and i, the greater reduction in i by P2.indicates that it lowers c~pita1 taxes and hence intertemporal distortionmore than does P4.
17See Fullerton, et al., (1980b).
18Special thanks must go to Harvey Galper of the Treasury Department forfirst suggesting the industrial discrimination of the personal incometax, and to John Shoven of Stanford University for most of the ideasin modelling it. These features of the model were used in other papersby Fullerton, King, Shoven and Whalley.

References
Boskin, M., (1978), "Taxation, Saving, and the Rate of Interest,"Journal of Political Economy.
Brinner, R., (1973), "Inflation, Deferral and the Neutral Taxation ofCapital Gains," National Tax Journal.
Feldstein, M. and L. Summers, (1979), "Inflation and the Taxation ofIncome from Capital," National Tax Journal.
Folsom, R.N., (1978), "Neutral Capital Gains Taxation under Inflationand Tax Deferral," National Tax Journal.
Fullerton, D., (1980a), "On the Possibility of an Inverse Relationshipbetween Tax Rates and Government Revenues," National Bureau ofEconomic Research working paper no. 467.
... , (1980b), "The Capabilities, Requirements and Limitations of aGeneral Equilibrium Taxation Model," forthcoming in the Proceedingsof the National Tax Association - Tax Institute of America }leetings,October 1979.
Fullerton, D., J. Shoven, and J. Whalley, (1978), "General EquilibriumAnalysis of U.S. Taxation Policy," in 1978 Compendium of TaxResearch, Office of Tax Analysis, U.S. Treasury Department.
Fullerton, D., A. T. King, J. Shoven, and J .. Whalley, (1980a), "Corporateand Personal Tax Integration in the U.S.: Some Preliminary Findingsfrom a General Equilibrium Analysis," in R. Haveman and K. Hollenbeck,eds., Microeconomic Simulation, Institute for Research on Poverty,Madison, Wisconsin.
... , (198'1b), "Tax Integration in the U.S.: A General Equilibrium Approach,"National Bureau of Economic Research working paper No. 337R.
McLure, C. Jr., (1978), "Status Report on Tax Integration in the UnitedStates," ·National Tax Journal.
Parker, J. and E. Zieha, (1976), "Inflation, Income Taxes and the Incentivefor Capital Investment," National Tax Journal.
Summers, L., (1978), "Tax Policy in a Life Cycle Model," National Bureauof Economic Research working paper no. 302.
Sunley, -E., (1979), "Indexing the Income Tax for Inflation," National TaxJournal.