NBER WORKING PAPER SERIES DATA ANALYSIS, COMMUNICATION ... · NBER WORKING PAPER SERIES DATA...
28
NBER WORKING PAPER SERIES DATA ANALYSIS, COMMUNICATION, AND CONTROL Roy E. Welsch* Working Paper No. 64 COMPUTER RESEARCH CENTER FOR ECONOMICS AND MANAGEMENT SCIENCE National Bureau of Economic Research, Inc. 575 Technology Square Cambridge, Massachusetts 02139 December 1974 Preliminary: not for quotation NBER working papers are distributed informally and in limited numbers for comments only. They should not be quoted without written permission. This report has not undergone the review accorded official NBER publications; in particular, it has not yet been submitted for approval by the Board of Directors. *NBER Computer Research Center and Massachusetts Institute of Technology, Sloan School of Management. Research supported in part by National Science Foundation Grant GJ-1154X3 to the National Bureau of Economic Research, Inc.
-
Upload
nguyenthuan -
Category
Documents
-
view
216 -
download
0
Transcript of NBER WORKING PAPER SERIES DATA ANALYSIS, COMMUNICATION ... · NBER WORKING PAPER SERIES DATA...

NBER WORKING PAPER SERIES
DATA ANALYSIS, COMMUNICATION, AND CONTROL
Roy E. Welsch*
Working Paper No. 64
COMPUTER RESEARCH CENTER FOR ECONOMICS AND MANAGEMENT SCIENCENational Bureau of Economic Research, Inc.
575 Technology SquareCambridge, Massachusetts 02139
December 1974
Preliminary: not for quotation
NBER working papers are distributed informally and in limitednumbers for comments only. They should not be quoted withoutwritten permission.
This report has not undergone the review accorded official NBERpublications; in particular, it has not yet been submitted forapproval by the Board of Directors.
*NBER Computer Research Center and Massachusetts Institute ofTechnology, Sloan School of Management. Research supported inpart by National Science Foundation Grant GJ-1154X3 to theNational Bureau of Economic Research, Inc.

Abstract
The role of data analysis in communication, persuasion, and decision-
making is discussed. Some problems with current data-analysis prac-
tice are presented, including communication, complex models, large
data bases, one-pass processing, rigid assumptions, resistance, vali-
dity, prior information, access to new methods, and the responsiveness
of data analysis researchers to real world needs. Recent progress in
these areas is then outlined, with emphasis on graphics, Bayesian
regression, robust estimation, and jackknife, and interactive computing
systems. Some remaining challenges for data analysts and others who
are trying to integrate data into decision-making processes are discussed.
.

Contents
1. Introduction . 1
2. Communication and Control 2
3. Problems 3
4. Progress 7
5. Challenges 21
References 24
Figures
Figure 1. Identifying Points with the CLOUDS Command IPNT . . . 9
Figure 2. Finding Points with the CLOUDS command FIND 9
Figure 3. Points with a Given Attribute are Given a SpecialSymbol Using the MARK Command in CLOUDS 10

1. Introduction
Many times in the past few years, I have felt that I existed
mainly to fill out questionnaires for researcherstrying to discover
something about me or my role in various social processes. These days
I ignore all but those with well designed questions, assuming that the
rest will send a follow-up questionnaire, ifthey are at all serious.
This almost never happens. Often I wonder just how my answers are used
to understand a particular social process and whether my life was changed
in a negative way because of inadequate data analysis.
Probably twice a week, I am asked (or told) to act on the basis of
some data that has been collected and perhaps (notvery often) analyzed.
Most of this I ignore, too. The statistics produced by the Federal Govern-
ment are harder to ignore. If the inflation rate is ten percent and my
raise is five percent, I am likely to act. A single number (unfortunately
with no measure of precision attached), which we will presume for now is
the result of careful data analysis,not only communicates something about
the social processes around me, but almost compels me to act.
Data is one raw material we use to investigate social processes
and programs. Some data is a thoughtless (and often essentially useless)
by-product of the social process. For example, observational, studies and
nonrandomized field trials are often used to evaluate social programs, but
past experience [6] indicates that', we would be better off with more carefully
controlled randomized field trials. Many medical researchers have already
learned the lesson of randomizationperhaps because they realize that clinical
* Parenthesized numerals refer to entries in the Reference section, p. 24.

-2-
trials may cost lives and cannot be wasted. In any case, this raw material
(naturally we would like high-grade ore) needs processing, in many different
ways, before we can begin to extract indications and evidence from it and
before we can integrate it into the decision—making processes of society.
2. Communication and Control
Data analysis is what we do with data to help extract and commu-
nicate information about the process that generated the data. Data analysis then
is a communication link in most social processes. How data-analysis is
performed and presented helps to determine how (and how much) information
flows in society and this information helps determine the behavior of
social processes and our ability to control them. Data analysts cannot
afford to lose sight of this fact - it might be argued that undue emphasis
on the rigid models of mathematical statistics did cause some of us to lose
sight of this broader role of data analysis.
For purpose5 of this paper I have divided those involved in the
world of data analysis into four groups: developers of data analysis metho-
dology, data analysts, interpreters of analyses, and decision-makers. The
lines are often blurred and some of us can count ourselves in all four groups.
The following sections of this paper will discuss aspects of data analysis
related to all four groups. It has been my experience that if the members
of the first group fail to consider the needs of the other three, much of
its research fails to have a significant impact on communication in society
and the control of social processes.

-3-
3. Problems
There are problems with data analysis as it is practiced and used
today. At each level — decision—maker, interpreter, analyst and developer,
we see unfilled needs. In this section some of these problems are
presented. I do not mean to imply that there is nothing right about data
analysis as it is practiced today. My main point is that there is definitely
room for improvement.
Communication. All of us can rightfully wonder if statisticians know very
much about communication, especial.1y when we examine how the results of
data analysis are used in society as a whole. Consider the (hopefully
summary) numbers printed in precise columns on a page of computer output
from a typical statistical routine. Do multiple correlation coefficients
and statistics really tell the story? Perhaps they do to a few people,
but we cannot afford to think of just this small group alone. What good
is high quality data analysis if it fails to get the message in the data
across to society and decision—makers?
Complex Models. The increasing emphasis on systems, feedback, and control,
has meant that the models we build to describe social processes have become
increasingly complex. They are large, nonlinear, and interdependent.
Standard calibration techniques like single stage least—squares often fail
to provide reasonable results in either the analysis of model structure or
prediction. Must we be forced to use linear models because we cannot
calibrate nonlinear models? We also need more help in deciding which
variables to include and how they should be reexpressed to simplify
our analysis.

-4-
Large Data Bases. While we still need more and better data bases in
some areas, there are a. large number of cases where the size of the data
base we now have is almost overwhelming. We have trouble getting a feel
for the structure of these sets of data. Often we do not have a good
prior feeling about the models needed to describe the process that gener-
ated these data. We would like to have the data help us derive reasonable
models. Do we have to worry about data-dredging or can we take a more
relaxed attitude and explore the data In a sensible and sensitive way?
Are large data bases likely to be well behaved, or do we need to consider
more deeply the effects of blunders and mistakes?
One-Pass Processing. All too often we see data that has been "analyzed"
by one pass through a statistical package. When reading we often pause
to reread a paragraph or sentence in order to summarize it In our own
words. We may go over it several times before we feel we have understood
Its significance. Is there any real reason why we should not look at our
data several different times in several different ways? What do we do if
we get different results on some of these journeys through the data?
Rigid Assumptions. Many of the statistical methods that we use today have
been derived under rigid sets of assumptions and then shown to be optimal
when these conditions hold. With more complex models and data bases it
has become Increasingly difficult to justify some of these assumptions.
Data analysis cannot afford to be locked in by the need for computational
ease or mathematical simplicity. Can we tolerate methods that are
violently affected by small changes in these assumptions? For example,
linear programming techniques provide solutions to certain kinds of
constrained optimization problems. If some of the coefficients (derived
.

—5-
from data) used in the model are very sensitive to one data point, then
what good does it do to apply an elaborate optimization technique which
can be very sensitive to a change in a single coefficient?
Resistance. If we forego mathematical simplicity and computational ease,
what should the axioms of data analysis be? One emerging principle is
that of resistance 116]: a technique is resistant if the sununary conclusions
it produces change little in the face of gentle perturbations in much of
the data or violent perturbations in a little of the data. For example,
the median is resistant while the mean is not. We may have to give up
something to achieve this for a broad spectrum of data analysis situations.
What is a reasonable price to pay for the insurance and stability obtained
by using resistant methods?
Validity. Many of us have discovered the hard way that a model can be
"optimally calibrated" on a given data base and then fail rather spectacu-
larly when used for prediction or checked on a different data base.
There are many reasons for this, but we need to have ways to assess the
validity of our data analysis. Are we to take seriously the "inflation
rate statistics" published monthly if there is no indication of their
precision? At least most political poiis now contain some indication of
precision. Data analysis suffers when measures of validity are lacking
or are removed by those who interpret and publish the results of data
analysis.
Prior Information. Data analysis cannot operate in a vacuum away from
those who are familiar with the process that generated the data. Often

-6-
those close to the data will be far more helpful in suggesting models and
constraints than any exploratory look at the data by a data analyst. Some-
times we may want to give formal weight to these prior ideas in the data
analysis process. While Bayesian statisticians have formulated many ways
to do this, far too little of this research has been implemented in ways
that are useful to the average analyst who is working with data and with
those who have prior information. How can we use prior information to help
validate the results of data analysis?
Access to Methods. One of my great frustrations is to tell colleagues
about a new technique that would really help with the analysis of their
data, only to see later that they did not try it because of the difficulties
involved in getting the method to the data. (Getting the data to the
method is another, usually equally frustrating, possibility.) We need
somehow to bring analyst, daia, method, and models together via a
communication system that will allow creative data analysis to take place.
Responsive Data-Analysis Research. A significant portion of those involved
in the development of new data-analysis methods should be responsive to
the needs of data analysts and decision-makers who are working with new
kinds of data and models. Part of the problem is communication and feed-
back among these groups. In some cases developers are also analysts and
analysts are also decision-makers. This is often extremely useful and
needs to be encouraged. But we need to make better use of the communica-
tion channels already open to us (conferences, on-line consulting) to
foster the responsive development of data-analysis methodology.
S
-7-
4. Progress
In recent years progress has been made on many of the problems
outlined in the last section. The computer and the communication and
control systems associated with computers have made much of this progress
possible. Equally important is the fact that the development of data-
analysis techniques has become somewhat of a distinct discipline linked
to, but separate from, mathematics and mathematical statistics. New data-
analysis methods get tested by computer simulation and field experience
and not just by adherence to rigid mathematical models. The primary
purpose of data analysis research is to develop techniques to analyze
data rather than to apply mathematics to the problems that arise in data
analysis.
The following summary of progress reflects my own views and limited
experience. For convenience I have broken this section up into the same
headings as the last one. It will be readily apparent that many of the
new techniques and ideas cut across these boundaries.
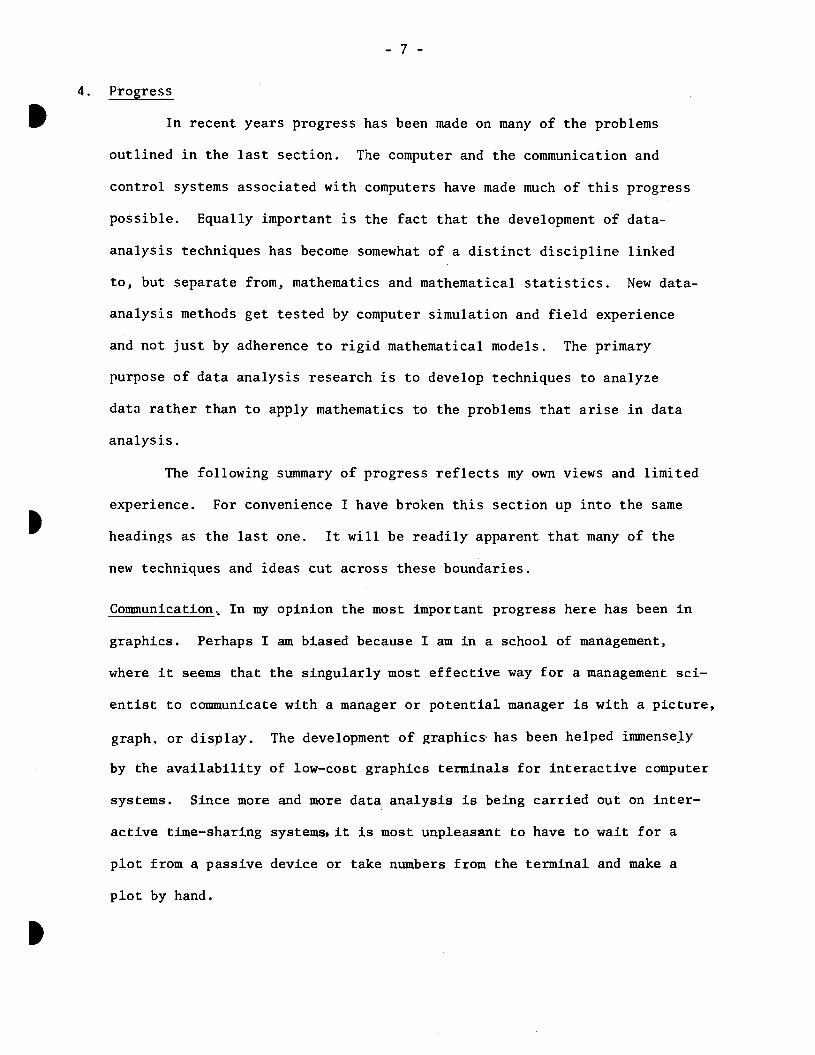
Communication. In my opinion the most important progress here has been in
graphics. Perhaps I am biased because I am in a school of management,
where it seems that the singularly most effective way for a management sci-
entist to communicate with a manager or potential manager is with a picture,
graph, or display. The development of graphics' has been helped immensely
by the availability of low—cost graphics terminals for interactive computer
systems. Since more and more data analysis is being carried out on inter-
active time—sharing systems, it is most unpleasant to have to wait for a
plot from a passive device or take numbers from the terminal and make a
plot by hand.

—8-
I have participated in the development of a low-cost interactive
graphics system at the National Bureau of Economic Research Computer
Research Center. The system, called CLOUDS, was originally designed to
plot and manipulate p-dimensional point clouds and, in particular to
fully exploit the proven utility of the basic scatter plot. Groups of
commands are designed to scale) project, rotate, masks overlay, zoom,
connect points with lines, provide labels and text, and work with in-
dividual points.
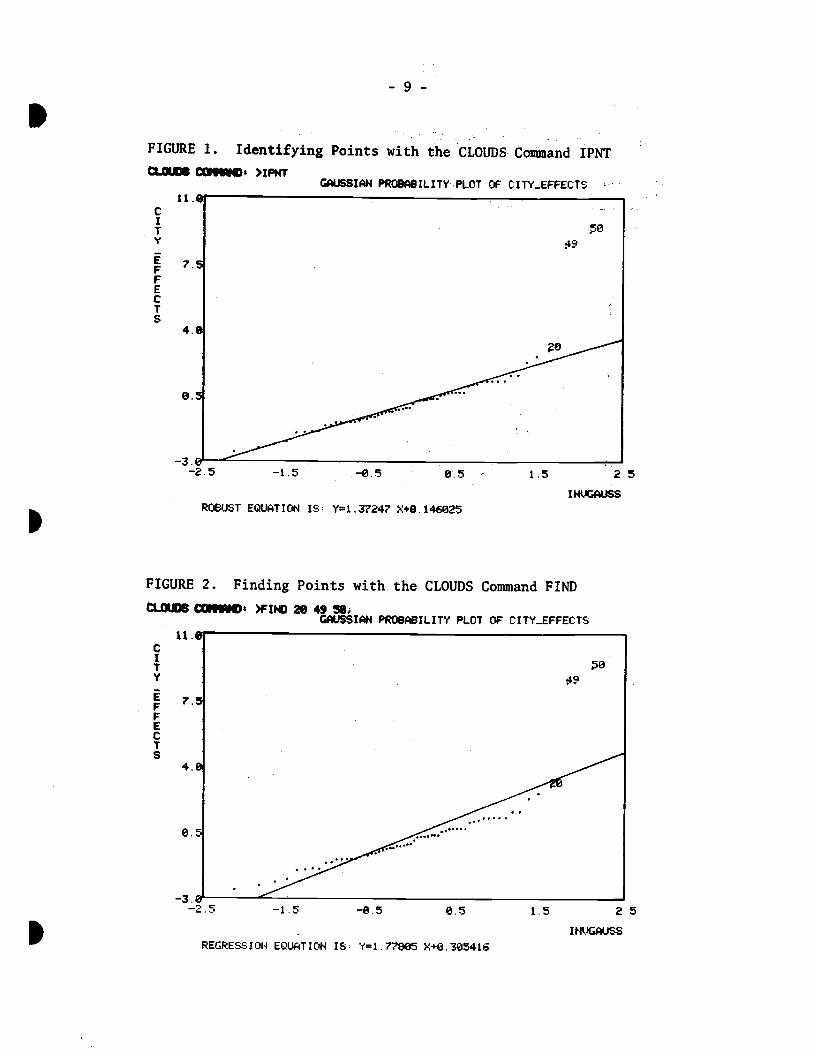
The last group of commands has proved to be especially useful
because with a scatter plot on the screen, the cursors can be used to
add, move, identify, label, and delete points, while a keyboard command
allows the user to find where a particular point has been plotted. It
is also possible to mark different groups of points (say by years, scale,
or cluster) with different symbols to facilitate observation and ident-
ification. An example identifying outliers and finding points is provided
in Figures 1 and 2 while Figure 3 shows how marked points can provide
additional information on a scatter plot. For a detailed description of
this system see [15] and [19].
CLOUDS is often used in its own right, but the commands have been
used even, more as building blocks to implement the plots developed by
Tukey [17] and others, many of which bear little resemblance to point
clouds.
Today, most people who use data analysis in their work are either
not acquainted with the possibilities of graphic data analysis or believe
the cost is too high. As a consequence, potential ideas for new pictures
are suppressed or never formulated. We have found that once a user sees
-9-
FIGURE 1. Identifying Points with the CLoUDs Cosland IPNT
fliMI'! CC.3' )IPNTGAUSSIAN PROBABILITY PLOT OF CITY_EFFECTS
CI
TV
EFFECIS
FIGURE 2. Finding Points with the CLOUDS Command FIND
CIffiJOB COSSOs )FDID 20 49 50;GAUSSIAN PROBABILITY PLOT OF CITY_EFFECTS
CIIV
EFFECIS
REGRESSION EQUATION IS: Y1.fl$05 X+0.305416
25
ROBUST EQUATION IS. Y=1.3?'24? X+0. 146025
5
DIUCAUSS
INUGAUSS

- 10 -
.FIGURE 3. Points with a Given Attribute are Given a Special Symbol
Using the MARK Command in CLOUDS
CLOIJOS CONIAND! >ZPNTADVERTISING DECAY DATA
15€.
RECALL3
ie.e
0
0 o 0•00.. S..
0• 0 U.S. •'0
0.0 -CU0 0 10.0 280 38.0 40.0 58.0 60.0
S I IITRST

— 11 —
a demonstration of interactive graphics applied to data in his area,
he rapidly becomes involved in the process of creating pictures for
his needs. Whereas many people are unwilling to propose new statistical
methods because of the mathematics that might be involved, they are
willing to suggest pictures and plots that might help. Many areas of
application (psychology, sociology, biology, medicine, management)
have more of a visual component than formal mathematics and statistics.
People working in these areas can help define what they would like to
see about their data. Given the tools to implement what they want,
significant progress has been and can be made. In the process, commu-
nication and feedback are greatly enhanced.
Complex Models. Important advances in numerical analysis [2,4] have
made reasonably effective nonlinear optimization routines available
on many computers. This makes it possible to consider the calibration
of nonlinear models using a least-squares loss function or, even better,
a loss function based on the philosophy of resistance. Some specialized
algorithms have been developed, and are becoming widely available.

- 12 -
A problem in linear models (and an equally serious but often less
obvious prQblem In nonlinear models) is collinearity. A major new attack
on this problem has been the concept of ridge regression introduced by
Hoerl and Kennard [ 8 1. Consider trying to calibrate the linear model
Y = X$ + e. If we assume that X has been scaled so that xTx is a corre-
lation matrix then one family of ridge estimates for is
= (XTx + kI)1XTY
and we note that is the least—squares estimate. A number of ways have
been proposed [5] to choose k including making a "trace" of the k as
a function of k. It is easy to see that if there is collinearity and
xTx is nearly singular, then (XTX + kI) will be better behaved. The price
we pay is that the ridge estimators are biased. However there are strong
theoretical results [10 ] and Monte Carlo studies [20] that indicate k is a
generally superior alternative to least—squares. At the very least, it
provides a family of estimates for examination as a function of k.
Progress has also been made on the problems of selecting variables,
especially for linear models. Ridge regression can be interpreted as a
form of selection in the principal component coordinate system, and the
proposals of Mallows [12 ] on C plots are also becoming more feasible
and useful as computer power increases and graphics displays become more
common.
Large Data Bases. We are learning to first explore data on its own terms
in a flexible mode, unencumbered by considerations of probability, signi-
ficance, and the like. For large data sets graphics is essential, because
plots can summarize large numbers of data points while still carrying
.

- 13 -
along enough fine detail where it is needed. Linking clustering techniques
with graphics has also proved to be a fruitful way to explore large data
bases.
But there is a more basic principle that is being applied on
large data sets. When taking a first look at data It is often not neces-
sary to use all of the data. Subsaniples and subsuinmarles may tell us a
great deal and they can be obtained more rapidly at less cost. We are
beglnrdng to see data-analysis systems designed so that getting subsamples
and subsuminaries is an integral part of the system and not something re-
quiring a great deal of programming effort.
For large discrete multivariate data sets exploratory techniques
based on the theory of log—linear models [ 3 ] are now used to sort out
the pattern of dependencies in a set of discrete variables. When there
are only two variables, there are only two basic situations: either the
variables are independent of each other, or they are not. When there are
more variables, complex conditionally independent relationships can be
studied. No longer are we limited to examining just pairwise correlations
and linear relationships.
One-Pass Processing. Today the emphasis is on an iterative approach to data
analysis. If we consider the relation
data = fit + residual
then Iterative (and increasingly interactive) data analysis proceeds by
first trying siniple fits (perhaps simple calibrated models) and then ex-
ploring the residuals, often as i they were a new data set. Successive
layers of structure can be peeled away and built into a more complex fit,

- 14 -
but the residuals at each step are carefully examined for further structure
or indications of poor fit. We are gradually learning how to pvovide
effective summaries (often graphic in nature) at the end of each of these
steps to guide us in taking the next step and to provide useful feedback
and communication. Interactive computing seems to provide the best frame-
work for this type of data analysis.
Rigid Assumptions. We are now more likely to let the data speak freely
and help us to determine reali,stic assumptions. The careful data analyst
is slow to make assumptions before he explores the data. Families of
estimators like those associated with ridge regression (and, as described
in the next section, robust estimation) are becoming available. These
families of estimators often provide ways to explore how various assumptions
might be affecting our conclusions and what the consequences might be.
Finally,I think we are searching for data-analysis techniques that
are good in a variety of situations rather than optimal in a few. If
they are good, they will survive even without a formal mathematical proof of
their optimality. This also means we shall probably have several good
techniques to use on a problem ra.tlr than one restricted optimal approach.
Resistance. Notice that the definition of resistance we gave in the last
section was based on the data — there was no mention of probability. When
we introduce probability and other modeling assumptions into the problem,
we often call the techniques robust rather than resistant. Robust methods
of data analysis either yield results and conclusions which are relatively
unaffected by moderate departures from the assumptions apparently under-
lying the analysis or, as methods, are highly efficient in the presence
.

- 1514
of auch departures, or (most likely) both.
Various mathematical formulations of robustness have been developed
by Hanipel [ ] and Huber [ 9 1. A major Monte Carlo study of robust
estimators was undertaken In [ 1 ]. Briefly, we can describe robust
calibration in terms of loss functions as follows. Assume we want to
find estimates for e in a model f(x,O) (perhaps nonlinear) where x.
denotes the independent variables. If y is the dependent variable then
we try to find
n y —f(x ,O)(4.1) mm Pc( )+ V logo
.'° 1=1
and use the values of e and o at the minimum as our estimates. One
family of loss functions proposed by Huber is
Ii 2 u <cPcU)= 1 2
LcIuI - ui >c
When c = we have least—squares and, in general, Pc(u) is like least—
squares in the middle and least absolute deviations for large values of u.
Except when c = , p.cu) provides robust estimates with the efficiency at
the Gaussian error model dependent upon c. (Least—squares is most eff i—
dent at the Gaussian but i very inefficient f or modest departures from
Gaussianity.) We have included scale in (4.1) because P(u) is not scale
invariant.
Thus we aga,n have created a family of estimators. There are
various ways to choose c, and by varying c we can examine how sensitive
our estimates are to large residuals. In Figures 1 and 2 we can see
the difference between the fit obtained using a least-squares regression
equation and a robust regression equation. We should note that there are other

- 16 -
forms of robust 108S functions, some of which are bounded and therefore
give effectively no weight to large residuals. Jany efficient routines
exist for solving (4.1) and the associated nOrmal equation forms.
Validity. We have already seen how the ridge and robust estimator families
provide ways to examine some of our assumptions and check the stability
of our estimates. A basic approach to validation is the jackknife [13,14].
The data is divided into r groups of approximately equal size.
Let O(.) be the result of a complex calculation (say calibrating a model)
on the portion of the sample that omits the th subgroup, i.e., on a pool
of r—1 subgroups. Let be the corresponding result for the entire
sample, and define pseudovalues by
=r011
—(r—1)e() j1,2,... ,r.
The jackknifed value O, the way we combine the pseudovalues, and
an estimate of its variance are given by
= j1
r(r—l) j=l*3— O)2.
The jackknife approach provides us with a form of internal valida-
tion and a rough estimate of variability. The basic principle is crucial —
by removing a portion of the data and calibrating on the rest we can study
the influence of small portions of the data on the resulting estimates.
Of course, if possible, we would like to hold some data completely aside.
for further validation.
Consider how we might use this idea to help determine a good value
S

- 17 -
for k or c. in the ridge or robust case. Drop one data point (or some sub-
set), calibrate on the rest, and then predict the omitted value of the
dependent variable using the calibrated model. Square the difference
between the actual and predicted value and repeat for each data point or
group. For a given value of say, c, we have a measure of internal pre-
dictive quality. R.epeat for several values of c and we have a plot that
can help us understand the quality and pred±ctive ability of our fit. Increased
computing power and good numerical analysis make such ideas practical
today.
Prior Information. Ridge regression can be viewed as a form of Bayesian
regression [ii], and this allows many possible extensions. In particu-
lar we can incorporate certain kinds of prior information in our cali-
bration process. One way to generalize the ridge idea is as follows.
Instead of using (4.1) we try to find
n —f(x1&) p
(4.2) mm Pc( ) +V logrj + k1=1 a j=l
The ó. are our prior values of O1and A1 is a precision or weight saying
just how strongly we feel about our prior, 5.. The parameter k determines
the relative importance of our prior information (the second sum) and the
data (the first sum). Notice when k=O we get a standard robust estimate.
Again we may wish to vary k and perhaps use the validation ideas discussed
above to gain further insight.
A special form of (4.2) which uses a robust and scale invariant
loss function is
n pmm Iy.-f(x.,O)I + k E /5T Ia. -
i=1 1 1-j=1

- 18 -
When f (x.,O) is linear this problem can be solved easily for all k
by parametric linear programming methods.
Robust estimates are nonlinear and loosely speaking, unbiased.
Ridge type estimates are biased, but linear. Recall that least-squares
estimates are often said to be the best linear unbiased estimates. We
have relaxed the linear and unbiased assumptions in (4.2) in order to
provide more flexible, sensitive and, I feel, better data-analysis tools.
Access to Methods. In the past ten years access to statistical computing
has been primarily provided by stand—alone programs like the BMD series
or various subroutine libraries. Packages like SPSS, PSTAT and others
are also being used increasingly by those who want to concentrate on the
analysis and not on the computer complexities.
Unfortunately most of these means of access suffer from portability
problems (although much progress has been made) and timeliness — they are
generally well behind the state—of—the—art. In fact, it is increasingly
important that experimental programs, properly denoted as such, be made
available for testing and feedback from various user groups.
Gradually algorithms (and in some cases programs) are being
published whicli, if you have the talent, can then be implemented on a
local computer. Publication is slow and validation a serious problem, but
it is at least a start.
Perhaps the best hope is through networks associated with regional
computing research centers. First, data could be entered via the network or
drawn from data banks maintained by public and private organizations.
Second, new methods of analysis can be put on the system by arrangement
.

18- 19 -
with the research center. In fact the center, probably with government
support, would make a constant effort to place new, even highly experi-
mental methods on the system. Third, in certain cases, widely used models
or classes of models would also be available for use with different data,
calibration, and prediction technologies. Finally, the analyst or researcher
could access all this via a local device, most likely a typewriter terminal
with an associated CRT display or a CRT terminal with a hard copy device.
}[owever, this is not enough. We need a flexible file system for
sharing data and programs, a convenient command language and perhaps above
all, a way to combine cotfimands to form macros. These macros make it pos-
sible to experiment with many different combinations of data-processing
components in order to provide good tools for analyzing particular types
of data.
If we have the building blocks contributed by a large number of
researchers, and a way to put them together, then we have a chance to
improve data analysis. In fact, we might hope that after some experience
certain macros would survive to become new data-processing building blocks
(and perhaps then fully coded for efficiency).
For the past three years I have been associated with the National
Bureau of Economic Research Computer Research Center where a group of data
analysts, computer scientists, numerical analysts and others have been
workiflg to create a research center and computer system like that I des-
cribed. All of its facilities are available via a local phone call to
the NBER network in most major cities in the U.S.

- 20 -
The NBER system now operating is called TROLL. A large number of
new programs and macros have been made available as TROLL Experimental
Programs (TEP [is 1). Many of the ideas discussed in earlier parts of
this paper are available viaTEP and the network.
We cannot forget minicomputers. A lot of data analysis is and
will be done on them. Some of these machines (and hopefully more in the
future) are a part of distributed systems based on a large host computer.
Again networks and regional centers could nrovide software research and
updates with appropriate portions fed to local minicomputers for specialized
use at a particular location.
Responsive Data-Analysis Research. Here I will draw especially on my own
experience. Users of a computer network data-analysis system can talk
back and they do. In fact, as more tools are made available, the more
possibilities users discover to combine and improve, and therefore more
new programs are designed and placed on the system. Most of the comments
relate to specific problems the user has - he feels he will be able to
investigate his data and model better if certain tools are available or
existing tools are modified. It is often a real challenge for the devel-
opers of data-analysis techniques to respond.
A particular example of this process concerns the graphics system,
CLOUDS, that was described earlier. While the basic system is still used
for point clouds, it is far more often used in macros to create special
plots and pictures for graphic data analysis. Many of these plots are a
result of direct interaction with users in application areas like economics
and management science.
.

— 21 -
5. Challenges
Each of the areas outlin1above contains room for research. Some
important areas have been omitted completely. When talking about challenges,
it is useful to group these topics together in a different way.
I feel that those involved with data analysis must pay particular
attention to the following three areas:
1. Developing new methodology and communicating it to others.
2. Understanding how data-analysis methodology affects the
communication channels and information flows in society.
3. Using what others have learned about social processes, communi-
cation, and artificial intelligence to examine the data-analysis
process itself and perhaps "improve" it.
In the first area we face the very real problem of integrating
old and new methods. We are only just starting to develop graphic and
robust methods. How do we interface these with the large body of existing
tools? We know how to find robust estimates, but very little about finding
confidence intervals for these estimates. Do we not use robust estimates
or can we use what we have combined with approximate confidence intervals
based on older methodologies? If so, hw do we tell others what this means?
In the second area, a basic problem is multiplicity. Gradually
(perhaps too gradually) data analysts are losing their fear of analyzing
a body of data in a number of different ways and then viewing the results
from different perspectives. As data analysts do change, the results of
data analysis will be communicated in different ways. We are going to be
living with multiplicity, and we are going to have to face reports that

— 22 —
show some contradictory results when different methods are used. It seems
better to have this than kidding ourselves that there is a single "best"
method.
It will take good people working very hard to figure out ways to
sunurize multiple analyses for public use. Accountants are starting
to face this problem. Physicians are struggling with ways to digest com-
plex observational and clinical studies so that they can communicate with
their patients about the risks of various treatments. The computer is
fostering an explosion of the possibilities for analyzing data. We data
analysts must provide more than just methods, if the new technology is to
have a really beneficial impact on society.
In the third area we consider the internal aspects of data analysis.
Most data analysis will involve a computer to help process data. But data
analysis is more than processing data. John Tukey [18] has used the term
"data investigation" to describe the process of data analysis. If we are
to work effectively, we need to interact with the raw data and processed
data so that we can control the flow of our investigation We feel that
it is almost never true that a data investigation can be completely pre-
scribed before the data is examined. Rather, the data will give us various
indications and we will proceed by choosing alternatives based on these
indications.
Our efforts with the EROLL system and TEP have taught us several
things. An important one is that if you provide a reasonably flexible
system, with good communication among its parts, and a macro language,
users will help to create the tools they need to do effective research.
- 23 -
But what about the person who wants to investigate data using the existing
supply of tools?
Well, I think we have a long way to go in this area. We need to
provide some guidance, after a particular tool has been applied, about
where a person might want to go next. A very experienced data analyst has
much of this in his head — can we put some of this experience into the
software to provide help for less experienced users? Perhaps a menu of
possibilities and online or documented examples would help. With so many
new tools available, and so much data generated by looking at the original
data in many ways, some help is clearly needed. This is the intermediate
area between having the data analyzed by a single large data processing
operation (hands off) and a collection of many data processing parts with
no guidance from the system on how to proceed with the investigation.
Some o us are starting to think about this intermediate course
where one could still link the parts of the analysis together in his own
way, but where there would be lots of signposts to help. We suspect that
we will need all the help we can get from current research in artificial
intelligence and cybernetics in order to make progress in this area.

- 24 -
References
.1. Andrews, D.F., Bickel, P.J., Hampel, F.R., Huber, P.J., Rogers, W.H.,
and Tukey, J.W., Robust Estimates of Location: Survey andAdvances, Princeton University Press, Princeton, N.J., 1972.
2. Becker, R., Kaden, N., and Klema, V., "The Singular Value Analysisin Matrix Computation", NBER Working Paper 46 (1974).
3. Bishop, Y.M.M., Fienberg, S.E., Holland, P.W., Discrete MultivariateAnalysis: Theory and Practice. M.I.T. Press, Cambridge, Mass., 1974.
4. Chambers, J.M.,"Fitting Nonlinear Models: Numerical Techniques."Biometrika, Vol. 60 (1973), pp. 1-13.
5. Efron, B. and Morris, C.','Stein's Estimation Rule and Its competitors -An Empirical Bayes Approach.",Journal of the Amer. Stat. Assoc.,
68, (1973), pp. 117-130.
6. Gilbert, J., Light, R., Mosteller, F., "Assessing Social Innovations:An Empirical Base for Policy Unpublished Manuscript, Dept. ofStatistics, Harvard University (1974).
7. Hampel, F.R. "Robust Estimation: A Condensed Partial Survey", Z.Wahrscheinlichkeitstheorie, Vol. 27, (1973), pp. 81-104.
8. Iloerl, A.E. and Kennard, R.W., "Ridge Regression: BiasedEstimation for Nonorthogoñal Problems", Technometrics, Vol. 12,
(1970), pp. 55-68.
9. 1uber, P.J. "RobuSt Regression: Asymptotics, Conjectures, and MonteCarlo", Annals of Statistics, Vol. 1, (1973), pp. 799-821.
10. James, W. and Stein, C., "Estimation with Quadratic Loss", in Pro-
ceedings of the Fourth Berkeley Symposium 1., University of
California Press (1961), pp. 91-105.
11. Lindley, D.V. and Smith, A.F.M., "Bayes Estimates for the LinearModel", J.R. Statist. Soc. B, Vol. 34 (1972),pp. 1-41.
12. Mallows, C.L., "Some Comments on C ", Technometrics, Vol. 15 (1973),
pp. 661-675.p
13. Miller, R.G., "A Trustworthy Jackknife", Ann. Math. Statist.,Vol. 35 (1964), pp. 1594-1605.
14. Mosteller, F. and Tukey, J.W.,"Data Analysis, Including Statistics",Handbook of Social Psychology, 2nd edition, Vol. 2, C. Lindzey and
E. Aronson, editors, Addison-Wesley, Reading, Mass., 1968.

- 25 —
References (cont 'd.)
15. TROLL Experimental Programs, NBER Computer Research Center DocumentationSeries D0070.
16. Tukey, J.W., Exploratory Data Analysis, Limited preliminary edition,Vol. I, II, III. Addison-Wesley, New York., 1971.
17. Tukey, J.W., "Some Graphic and Semi-Graphic Displays", T.A. Bancroft,Ed. Statistical Pa-pers in Honor of George W. Snedecor Ames, Iowa:Iowa State University Press, (1972), pp. 293-316.
18. Tukey, J.W.,"Data Analysis, Computation and Mathematics," Quarterlyof Applied Mathematics, (1972), pp. 51-65.
19. Welsch, R.E.,"Graphics for Data Analysis," National Bureau of EconomicResearch Working Paper No. 43, NBER Computer Research Center,Cambridge, Mass. To appear in Computers and Graphics, (1975)..
20. Wermuth, N., "An Empirical Comparison of Regression Methods", UnpublishedDoctoral Dissertation, Department of Statistics, Harvard University(1972).