NBER WORKING PAPER SERIES · Jorge Guzman and Scott Stern NBER Working Paper No. 22095 March 2016...
108
NBER WORKING PAPER SERIES THE STATE OF AMERICAN ENTREPRENEURSHIP: NEW ESTIMATES OF THE QUANTITY AND QUALITY OF ENTREPRENEURSHIP FOR 15 US STATES, 1988-2014 Jorge Guzman Scott Stern Working Paper 22095 http://www.nber.org/papers/w22095 NATIONAL BUREAU OF ECONOMIC RESEARCH 1050 Massachusetts Avenue Cambridge, MA 02138 March 2016 We are thankful for comments and suggestions by Erik Brynjolffson, Ankur Chavda, Matthew Claudel, Catherine Fazio, Joshua Gans, John Haltiwanger, Bill Kerr, Fiona Murray, Abhishek Nagaraj, Roberto Rigobon, David Robinson, and Hal Varian, as well as seminar and conference participants at Duke University, Harvard Business School, University of Toronto, the University of Virginia, the Kauffman Foundation New Entrepreneurial Growth Conference, and the NBER Pre-Conference on Entrepreneurship and Economic Growth. We also thank Open Corporates for providing data for New York and Michigan, and to RJ Andrews for his development of the visualization approach. Jintao Chen and Ji Seok Kim provided excellent research assistance. Finally, we acknowledge and thank the Jean Hammond (1986) and Michael Krasner (1974) Entrepreneurship Fund and the Edward B. Roberts (1957) Entrepreneurship Fund at MIT, and the Kauffman Foundation for financial support. All errors and omissions are of course our own. The views expressed herein are those of the authors and do not necessarily reflect the views of the National Bureau of Economic Research. At least one co-author has disclosed a financial relationship of potential relevance for this research. Further information is available online at http://www.nber.org/papers/w22095.ack NBER working papers are circulated for discussion and comment purposes. They have not been peer-reviewed or been subject to the review by the NBER Board of Directors that accompanies official NBER publications. © 2016 by Jorge Guzman and Scott Stern. All rights reserved. Short sections of text, not to exceed two paragraphs, may be quoted without explicit permission provided that full credit, including © notice, is given to the source.
Transcript of NBER WORKING PAPER SERIES · Jorge Guzman and Scott Stern NBER Working Paper No. 22095 March 2016...

NBER WORKING PAPER SERIES
THE STATE OF AMERICAN ENTREPRENEURSHIP:NEW ESTIMATES OF THE QUANTITY AND QUALITY OF ENTREPRENEURSHIP FOR
15 US STATES, 1988-2014
Jorge GuzmanScott Stern
Working Paper 22095http://www.nber.org/papers/w22095
NATIONAL BUREAU OF ECONOMIC RESEARCH1050 Massachusetts Avenue
Cambridge, MA 02138March 2016
We are thankful for comments and suggestions by Erik Brynjolffson, Ankur Chavda, Matthew Claudel, Catherine Fazio, Joshua Gans, John Haltiwanger, Bill Kerr, Fiona Murray, Abhishek Nagaraj, Roberto Rigobon, David Robinson, and Hal Varian, as well as seminar and conference participants at Duke University, Harvard Business School, University of Toronto, the University of Virginia, the Kauffman Foundation New Entrepreneurial Growth Conference, and the NBER Pre-Conference on Entrepreneurship and Economic Growth. We also thank Open Corporates for providing data for New York and Michigan, and to RJ Andrews for his development of the visualization approach. Jintao Chen and Ji Seok Kim provided excellent research assistance. Finally, we acknowledge and thank the Jean Hammond (1986) and Michael Krasner (1974) Entrepreneurship Fund and the Edward B. Roberts (1957) Entrepreneurship Fund at MIT, and the Kauffman Foundation for financial support. All errors and omissions are of course our own. The views expressed herein are those of the authors and do not necessarily reflect the views of the National Bureau of Economic Research.
At least one co-author has disclosed a financial relationship of potential relevance for this research. Further information is available online at http://www.nber.org/papers/w22095.ack
NBER working papers are circulated for discussion and comment purposes. They have not been peer-reviewed or been subject to the review by the NBER Board of Directors that accompanies official NBER publications.
© 2016 by Jorge Guzman and Scott Stern. All rights reserved. Short sections of text, not to exceed two paragraphs, may be quoted without explicit permission provided that full credit, including © notice, is given to the source.

The State of American Entrepreneurship: New Estimates of the Quantity and Quality of Entrepreneurship for 15 US States, 1988-2014Jorge Guzman and Scott SternNBER Working Paper No. 22095March 2016JEL No. C53,L26,O51
ABSTRACT
While official measures of business dynamism have seen a long-term decline, early-stage venture financing of new companies has reached levels not observed since the late 1990s, resulting in a sharp debate about the state of American entrepreneurship. Building on Guzman and Stern (2015a; 2015b), this paper offers new evidence to inform this debate by estimating measures of entrepreneurial quality based on predictive analytics and comprehensive business registries. Our estimates suggest that the probability of a significant growth outcome (either an IPO or high-value acquisition) is highly skewed and predicted by observables at or near the time of business registration: 69% of realized growth events are in the top 5% of our estimated growth distribution. This high level of skewness motivates the development of three new economic statistics that simultaneously account for both the quantity as well as the quality of entrepreneurship: the Entrepreneurial Quality Index (EQI, measuring the average quality level among a group of start-ups within a given cohort), the Regional Entrepreneurship Cohort Potential Index (RECPI, measuring the growth potential of firms founded within a given region and time period) and the Regional Entrepreneurship Acceleration Index (REAI, measuring the performance of a region over time in realizing the potential of firms founded there). We use these statistics to establish several new findings about the history and state of US entrepreneurship using data for 15 states (covering 51% of the overall US economy) from 1988 through 2014. First, in contrast the secular decline in the aggregate quantity of entrepreneurship observed in series such as the Business Dynamic Statistics (BDS), the growth potential of start-up companies (RECPI relative to GDP) has followed a cyclical pattern that seems sensitive to the capital market environment and overall economic conditions. Second, while the peak value of RECPI is recorded in 2000, the level during the first decade during this century was actually higher than the late 1980s and first half of the 1990s, and also has experienced a sharp upward swing beginning in 2010. Even after controlling for changes in the overall size of the economy, the second highest level of entrepreneurial growth potential is registered in 2014. Third, the likelihood of start-up firms for a given quality level to realize their potential (REAI) declined sharply in the late 1990s, and did not recover through 2008. These findings suggest that divergent assessments of the state of American entrepreneurship can potentially be reconciled by explicitly adopting a quantitative approach to the measurement of entrepreneurial quality.
Jorge GuzmanMIT Sloan School of Management100 Main Street, E62-343Cambridge, MA [email protected]
Scott SternMIT Sloan School of Management100 Main Street, E62-476Cambridge, MA 02142and [email protected]

3
I. Introduction
“There's too much entrepreneurship: Disruption running wild!" "There's too little
entrepreneurship: Economy stalling out!"
Marc Andreessen, Twitter, January 2015
Over the past two decades, economists have made significant progress in advancing the
measurement of entrepreneurship. The pioneering studies of Haltiwanger and co-authors (Davis
et al, 1996; Haltiwanger et al, 2013; Decker et al, 2014) moved attention away from simply
counting the density of small and medium sized firms towards the measurement of the prevalence
(and growth dynamics) of young firms (i.e., start-ups). These studies established that a
disproportionate share of new job creation has historically been linked to new firms, and
economic growth is grounded in measures of business dynamics (the process of firm entry,
expansion, contraction and exit). A separate stream of research focusing on more selective
samples of firms (e.g., high-performance entrepreneurial ventures) and the institutions (like
venture capital) that surround them reinforce this perspective: for example, Kortum and Lerner
(2000) find that venture capital is associated with higher levels of innovation, and Samila and
Sorenson (2011) find a robust positive effect of venture capital on aggregate income,
employment, and rates of new establishments.
Despite these advances, a sharp divide has emerged between systematic population-level
indices of entrepreneurial activity (such as the Business Dynamics Statistics database, hereafter
BDS) and measures based on the financing and activities of start-up firms, particularly in
hotspots such as Silicon Valley or Cambridge. On the one hand, Hathaway and Litan (2014a;
2014b; 2014c) use the BDS to document a secular decline in the rate of business dynamism and
the “aging” of US private sector establishments, a theme echoed in work emphasizing job growth

4
dynamics such as Decker, et al (2014). This stagnation has become a key piece of evidence
emphasized by those concerned with the prospects for long-term economic growth (Gordon,
2016). At the same time, a practitioner literature emphasizes the recent “explosion” of start-up
activity over the past half decade, including levels of venture capital investment not observed
since the late 1990s (PricewaterhouseCoopers, 2016). Not simply a matter of financing, recent
research documents a striking shift in the propensity for elite undergraduate engineering students
(based on a population sample of MIT graduates) to join startup firms upon graduation (Roberts,
Murray, and Kim, 2015). As aptly summarized by venture capitalist Marc Andreesen, there
seems to be a disconnect between population measurement of entrepreneurship and the founding
of start-up firms with significant ambitions for growth at founding (Andreesen, 2015).
To put these differences in perspective, it is useful to consider the historical gap between
these divergent views. In Figure 1A, we compare (for 15 US states which will form the basis for
our analysis) the rate (relative to GDP) of firm births per year as measured by the Business
Dynamics Statistics versus the rate (relative to GDP) of successful growth firms founded in a
particular year (i.e., the number of firms founded in a given year that achieved an IPO or
significant acquisition within six years of initial business registration).2 While the BDS shows
a slow and steady decline of approximately 40% (consistent with Hathaway and Litan (2014a)),
the realization of growth experienced a much sharper up-and-down cycle, with 1996 representing
the most successful start-up cohort in US history, followed by a relatively stable level from 2001
to 2008. This divergence is reinforced by comparing BDS firm births and economic growth.
Figure 1B compares BDS firm births / GDP per year with GDP growth in the five years
2 Though Figure 1 is based on data for only the 15 states that we use in our overall analysis, the broad patterns
documented in Figure 1 are qualitatively similar if we contrast the BDS birth rate, the incidence rate of entrepreneurial growth outcomes based on cohort founding dates, and overall economic growth for the entire United States.
5
following each observation year. Relative to the BDS, GDP growth exhibits a sharp up-and-
down pattern, with a high point beginning in 1995 (i.e., growth from 1995 to 2000).
How can we resolve this puzzle? How can we assess the State of American
Entrepreneurship? Building on Guzman and Stern (2015a; 2015b), this paper breaks through this
impasse by focusing not only on the quantity of entrepreneurship nor on highly selective
measures of the rate of successful entrepreneurs but instead focus on the role of entrepreneurial
“quality.” While it has long been known that the growth consequences of start-up activity are
concentrated in the outcomes associated with a very small fraction of the most successful firms
(Cochrane, 2005; Kerr, Nanda, and Rhodes-Kropf, 2014), prior attempts to use population-level
data to characterize the rate of entrepreneurship have largely abstracted away from initial
differences across firms in the ambitions of their founders or their inherent growth potential. As
emphasized by Hathaway and Litan, the challenge in directly incorporating heterogeneity is a
fundamental measurement problem: “The problem is that it is very difficult, if not impossible, to
know at the time of founding whether or not firms are likely to survive and/or grow.” (Hathaway
and Litan, 2014b). Likewise, the solution to this measurement challenge holds meaningful
promise in multiple areas of economic research. Systematic measures of entrepreneurial quality
would also allow researchers to characterize the underlying distribution of firm potential at birth
and inform the determinants of the skewed firm-size distribution; they would provide much-
needed nuance on the heterogeneity of new firms for industrial organization and strategic
management research; they would permit studying the determinants of high-quality
entrepreneurship (not only quantity) at the regional and local levels; and, they would allow
investigating the heterogeneous spatial organization of new firms beyond simple industry counts
—to name only a few examples.
6
Our approach to measuring entrepreneurial quality combines three interrelated insights.3
First, a practical requirement for any growth-oriented entrepreneur is business registration (as a
corporation, partnership, or limited liability company). These public documents allow us to
observe a “population” sample of entrepreneurs observed at a similar (and foundational) stage of
the entrepreneurial process (in this paper, from fifteen US states comprising ~ 51% of total US
economic activity over a 25-year period). Second, moving beyond simple counts of business
registrants (Klapper, Amit, and Guillen, 2010), we are able to measure characteristics related to
entrepreneurial quality at or close to the time of registration. These characteristics include how
the firm is organized (e.g., as a corporation, partnership, or LLC, and whether the company is
registered in Delaware), how it is named (e.g., whether the owners name the firm eponymously
after themselves), and how the idea behind the business is protected (e.g., through an early patent
or trademark application). These start-up characteristics may reflect choices by founders who
perceive their venture to have high potential. As a result, though observed start-up
characteristics are not causal drivers of start-up performance, they may nonetheless represent
early-stage “digital signatures” of high-quality ventures. Third, we leverage the fact that, though
rare, we observe meaningful growth outcomes for some firms (e.g., those that achieve an IPO or
high-value acquisition within six years of founding), and are therefore able to estimate the
relationship between these growth outcomes and start-up characteristics. This mapping allows
us to form an estimate of entrepreneurial quality for any business registrant within our sample
3 In our earlier work, we undertook preliminary explorations of the approach that we develop in this paper. In Guzman
and Stern (2015a), we introduced the overall methodology in an exploratory way by examining regional clusters of entrepreneurship such as Silicon Valley at a given point in time. We then focused on a single US state (Massachusetts) to see if it was feasible to estimate entrepreneurial quality over time on a near real-time basis (Guzman and Stern, 2015b). This paper builds on these earlier exercises to develop an analysis for 15 “representative” US states (comprising more than 50% of overall GDP) over a 30-year period, introduce new economic statistics that allow for the characterization of entrepreneurial quantity and quality over time and place, consider the relationship between alternative metrics of entrepreneurship and measures of economic performance, and consider the changing nature of regional entrepreneurship for selected metropolitan areas. Passages of text describing our methodology and approach, as well as the Data Appendix, draw upon these earlier papers (with significant revision for clarity and concision as appropriate).

7
(even those in recent cohorts where a growth outcome (or not) has not yet had time to be
observed).
We use this predictive analytics approach to propose three new statistics for the
measurement of growth entrepreneurship: the Entrepreneurship Quality Index (EQI), the
Regional Entrepreneurship Cohort Potential Index (RECPI), and the Regional Entrepreneurial
Acceleration Index (REAI). EQI is a measure of average quality within any given group of
firms, and allows for the calculation of the probability of a growth outcome for a firm within a
specified population of start-ups. RECPI multiples EQI and the number of start-ups within a
given geographical region (e.g., from a zip code or town to the entire five-state coverage of our
sample). Whereas EQI compares entrepreneurial quality across different groups (and so
facilitates apples-to-apples comparisons across groups of different sizes), RECPI allows the
direct calculation of the expected number of growth outcomes from a given start-up cohort
within a given regional boundary. As such, we will use RECPI (or RECPI / GDP) as our
primary measure of the potential for growth entrepreneurship for a given start-up cohort. REAI,
on the other hand, measures the ratio between the realized number of growth events for a given
start-up cohort and the expected number of growth events for that cohort (i.e.., RECPI). REAI
offers a measure of whether the “ecosystem” in which a start-up grows is conducive to growth
(or not), and allows variation in ecosystem performance across time and at an arbitrary level of
geographic granularity.
We calculate these measures on an annual basis for the fifteen states included in our
sample for the period from 1988-2014, documenting several key findings.4 First, in contrast to
4 We use a “nowcasting” index for the most recent cohorts which only use start-up characteristics available within the
business registration data, and compare that index to an “enriched” index which captures events that might occur early

8
the secular and steady decline observed in the BDS, RECPI / GDP has followed a cyclical
pattern that seems sensitive to the capital market environment and overall economic conditions.
Second, while the peak value of RECPI / GDP is recorded in 2000, the overall level during the
first decade of the 2000s is actually higher than the level observed between 1990 and 1995, and
we additionally observe a sharp upward swing beginning in 2010. Even after controlling for
change in the overall size of the economy, the third highest level of entrepreneurial growth
potential is registered in 2014. Finally, there is striking variation over time in the likelihood of
start-up firms for a given quality level to realize their potential (REAI): REAI declined sharply
in the late 1990s, and did not recover through 2008. Though preliminary projections show some
improvement after 2009, whether the most recent cohorts are able to realize their potential at
rates similar to those achieved during the mid-1990s is yet to be seen.
Relative to quantity-based measures of entrepreneurship, regional variation in
entrepreneurial quality appears to hold a stronger relationship to economic growth. Once one
controls for the initial level of GDP, MSA-level GDP growth between 2003 and 2014 is
uncorrelated with the baseline quantity of entrepreneurship but has a statistically and
quantitatively significant relationship with the baseline level of entrepreneurial quality.
Finally, there is striking variation across regions (and over time) in entrepreneurial
potential. Consistent with Guzman and Stern (2015a), we document an extremely high and
persistent level of entrepreneurial quality in regions such as Silicon Valley (and San Francisco
over time) as well as the Boston region, while other regions such as Miami with a high quantity
of entrepreneurship have yet to realize a meaningful level of persistent entrepreneurial quality.
within the life of a start-up such as the initial receipt of intellectual property

9
Before turning to more general interpretations, we emphasize that our approach, though
promising, does come with important limitations and caveats. First, and most importantly, we
strongly caution against a causal interpretation of the regressors we employ for our predictive
analytics – while factors such as eponymy and business registration form are a “digital signature”
that allows us to differentiate among firms in the aggregate, these are not meant to be interpreted
as causal factors that lead to growth per se (i.e., simply registering your firm in Delaware is not
going to directly enhance an individual firm’s underlying growth potential). And, while we are
encouraged by the robustness of our core approach across multiple states and time periods, we
can easily imagine (and are actively working on identifying) additional firm-level measures
(such as founder characteristics) which might allow for even more differentiation in quality, or
accounting directly for changing patterns over time and space in the “drivers” of growth.
Finally, while we focus here on equity growth outcomes, we do not provide any direct measure
of the potential of firms in terms of employment growth (while these are likely highly correlated,
it may be the case that a much more diverse range of start-ups contributes to employment growth
relative to the highly skewed nature of equity growth outcomes).
Keeping in mind these caveats, our findings nonetheless do offer a new perspective on
the state of American entrepreneurship. Most importantly, our results highlight that the recent
shift in attention towards young firms (pioneered by Haltiwanger and co-authors) is enriched by
directly accounting for initial heterogeneity among new firms. Even within the same industry,
there is significant heterogeneity among new firms in their ambition and inherent potential for
growth. Policies that implicitly treat all firms as equally likely candidates for growth are likely
to expect “too much” from the vast majority of firms with relatively low growth potential, and
might be focusing on a lever that is only weakly related to the economic growth they often seek.

10
Second, the striking decline in REAI after the boom period of the 1990s is the first independent
evidence for an often-cited concern of practitioners – even as the number of new ideas and
potential for innovation is increasing, there seems to be a reduction in the ability of companies to
scale in a meaningful and systematic way. Whether this is primarily a challenge for capital
markets, or reflects systematic reductions in various aspects of ecosystem efficiency remains an
important challenge for future research. Finally, our results highlight that the regional variation
in start-up performance reflects significant regional differences in both the underlying quality of
ventures started in different locations (Silicon Valley has by far the highest EQI in the nation)
and in the ability of these entrepreneurial ecosystems to nurture the scaling of high-potential
companies. Systematic and real-time measurement of both of these dimensions – entrepreneurial
quality and ecosystem performance – can serve as tools for policymakers and stakeholders
seeking to understand the impact of entrepreneurship on economic and social progress.
The rest of this paper is organized as follows. Section II provides an overview of
entrepreneurial quality in economics and briefly outlines the theoretical intuition for our
approach. Section III explains our methodology. In section IV we explain our dataset and
estimate entrepreneurial quality for our sample. Section V describes the geographic and time
variation of entrepreneurship in the United States since 1988. Section VI compares the potential
of cohorts to their performance to estimate the performance of the US entrepreneurship
ecosystem in helping firms scale. In Section VII, we study the correlation between our index and
future economic growth. And Section VIII studies variation of entrepreneurial quality and
potential for the regions of Silicon Valley, Boston, and Miami. Section IX concludes.
11
II. Entrepreneurial Quality: Do Initial Differences Matter?
Ever since Gibrat (1931), economists have sought to understand the role of firm-specific
characteristics in industry dynamics. In establishing the Law of Proportional Growth (more
commonly referred to as Gibrat’s Law),5 Gibrat provided a framework in which the primary
factor determining firm dynamics at a moment in time is the state of the firm at that moment in
time. In other words, firm dynamics are governed by a random process (Ijiri and Simon,
1977).6 Despite broad patterns consistent with Gibrat’s Law, a large literature beginning with
Mansfield (1962) instead emphasizes deviations from proportional growth. In its initial
formulation, this literature emphasized that smaller firms had both higher growth rates and lower
probabilities of survival (Mansfield, 1962; Acs and Audretsch (1988), among others); over time,
additional research emphasized that younger firms also had high average growth rates and lower
probabilities of survival (Evans, 1987; Dunne, Roberts, and Samuelson, 1988).7
Davis and Haltiwanger (1992) clarified this empirical debate by considering both the role
of size and age at the same time using a population-level sample from the US Census of
Manufacturers. Importantly, this line of research developed a systematic empirical case that
virtually all net job creation was in fact due to younger firms (which are small because they are
young) rather than smaller firms per se (Davis, Haltiwanger, and Shuh, 1996). Over the last
several years, population-level studies of (essentially) all US establishments have reinforced
these findings, and provided new and important insight into the sources and dynamics of net new
job creation (Jarmin, Haltiwanger, and Miranda, 2013). Building on these studies, Decker et al
5 Formally, Gibrat’s Law states that the growth rate of firms is independent of firm size (Gibrat’s Law for Means) and
that variance of the growth rate is independent of firm size (Gibrat’s Law for Variances) (see Sutton, 1997 for a review). 6 Gibrat’s Law serves as the foundation for key theoretical models across multiple fields within economics (see, for
example, Lucas and Prescott, 1971; Lucas, 1978; Kortum and Klette, 2004; and Luttmer, 2007). 7 Not simply a set of empirical regularities, these findings formed the foundations for important theoretical work,
notably Jovanovic (1982) and subsequent formal model of firm and industry dynamics (Ericson and Pakes, 19995; Klepper, 1996; Hopenhayn, 1992).

12
(2014) further uses this approach to document an overall decline in the rate of new business
formation (with at least one employee), which the authors characterize as a reduction in the rate
of business dynamism. In addition to its direct insight for our understanding of entrepreneurial
dynamics, these studies have been invoked as crucial pieces of evidence in entrepreneurial policy
analyses emphasizing the importance of a “shots on goal” approach that would focus on
reinvigorating the overall quantity of entrepreneurship in the US economy (Hathaway and Litan,
2014a).
However, the role of young firms in shaping job creation is not homogenous across the
population of new firms. The vast majority of new firms are associated with no net new job
growth, and consequently a very small fraction of new firms is disproportionately responsible for
net new job growth (Decker, Haltiwanger, Jarmin and Miranda, 2015). In other words, for many
questions for economics research and policy, a central difficulty is being able to systematically
account for “the skew”: the fact that the overall ability of entrepreneurship to facilitate
American economic prosperity depends disproportionately on the realized performance of a very
small number of new firms. Using surveys and aggregate economic comparisons, some have
suggested that these differences in growth are accounted for by underlying differences in the
firms themselves (Hurst and Pugsley, 2011; Kaplan and Lerner, 2010; Schoar, 2009). Yet,
systematic studies of firm dynamics have not been able to incorporate underlying differences and
still consider this variation unexplained (Angelini and Generale, 2008). But how do we identify
whether the economy at a given point in time is nurturing startups that have the potential for such
growth?
Accounting for the skew requires confronting a measurement quandary: at the time that a
company is founded, one cannot observe whether that particular firm will experience explosive

13
growth (or not). On the one hand, this challenge is fundamental, since by its nature
entrepreneurship involves a high level of uncertainty and luck. And, some outsized successes
certainly result from unlikely origins. Ben & Jerry’s, for example, was founded with the
intention to be a one-store, home-made ice-cream shop.8 With that said, there are many startups
that aspire to a specific level of performance and then achieve it, including startups that we refer
to as innovation-driven enterprises (IDEs), and more traditional small and medium size
enterprises (SMEs) (Aulet and Murray, 2013). Across all new business starts, firms span a wide
gamut in terms of their founders’ ambitions and potential for growth. A very large number of
new businesses aim to offer successful local services (such as a neighborhood handyman striving
to build a steady book of regular clients), while others have aspirations to be the next Google or
Facebook (classic IDEs). To the extent that the new firms that ultimately contribute to the skew
are disproportionately drawn from IDEs with significant growth ambitions and underlying
potential at their time of founding, mapping the skew requires accounting for these initial
differences in a systematic way.
To accomplish this task, we take advantage of the fact that entrepreneurs themselves
likely have information about their underlying idea and ambition, and make choices at the time
of founding consistent with their objectives and potential for growth. In Appendix A, we
develop a simple model outlining the logic of our approach. Essentially, we relate the ultimate
performance of start-ups to initial early-stage choices by the entrepreneur that are also
observable at or around the time of founding as a “digital signature” for each firm. By mapping
the relationship between growth outcomes and these digital signatures, we are able to form an
8 As Ben Cohen of Ben & Jerry’s fondly recalls: “[W]e took a $5 correspondence course in ice-cream technology and
started making ice-cream in our kitchen … When we first started, it was just a lark. We never expected to have anything more than that one home-made ice-cream shop …” How We Met: Ben Cohen And Jerry Greenfield, Interviews by Ronna Greenstreet, INDEPENDENT, May 27, 1995. Available at http://www.independent.co.uk/arts-entertainment/how-we-met-ben-cohen-and-jerry-greenfield-1621559.html.

14
estimate of initial entrepreneurial quality. To see the intuition behind this, consider a model
where all new firms have an underlying quality level q (e.g., the underlying quality of the idea or
the ambition and capabilities of the founder) that is observable to the entrepreneur but not to the
econometrician. Firms with a higher level of q are more likely to realize a meaningful growth
outcome g (for simplicity, we consider a binary growth outcome such as an IPO or meaningful
acquisition within a given number of years after founding). In addition, all entrepreneurs face a
set of binary corporate governance and strategy choices 𝐻 = {ℎ!,… , ℎ!}, such as how to
register the firm (e.g., as an LLC or corporation), what to name the firm (e.g., whether to name
the firm after the founders) and how to protect their underlying idea (e.g., whether to apply for
either a patent or trademark). Suppose further that while the cost of each corporate governance
choice h is independent of the quality of the idea (but might vary idiosyncratically across
entrepreneurs), the expected value of each of these choices is increasing in underlying quality
(i.e., firms with a higher q receive a higher marginal return to each element of H). Finally,
suppose that while the econometrician cannot observe underling quality, she is able to observe
both the corporate governance choice bundle 𝐻∗ as well as growth outcomes g. As we show in
the Appendix, a mapping between g and H allows us to form a consistent estimate of the
underlying probability of growth conditional on initial conditions H (we refer to this estimate as
𝜃) and moreover show that this mapping is a monotonically increasing function of the underlying
level of q.
III. The Measurement of Entrepreneurial Quality and Ecosystem Performance Indices
Building on this discussion, we now develop our empirical strategy. Our goal is to
estimate the relationship between a growth outcome, 𝑔, and early firm choices, 𝐻∗, in order to
form an estimate of the probability of growth (a 𝜃) for all firms at their time of founding. This

15
approach (and our discussion) builds directly on Guzman and Stern (2015a; 2015b).
We combine three interrelated insights. First, as the challenges to reach a growth
outcome as a sole proprietorship are formidable, a practical requirement for any entrepreneur to
achieve growth is business registration (as a corporation, partnership, or limited liability
company). This practical requirement allows us to form a population sample of entrepreneurs “at
risk” of growth at a similar (and foundational) stage of the entrepreneurial process. Second, we
are able to potentially distinguish among business registrants through the measurement of
characteristics related to entrepreneurial quality observable at or close to the time of registration.
For example, we can measure start-up characteristics (which result from the initial
entrepreneurial choices in our model) such as whether the founders name the firm after
themselves (eponymy), whether the firm is organized in order to facilitate equity financing (e.g.,
registering as a corporation or in Delaware), or whether the firm seeks intellectual property
protection (e.g., a patent or trademark). Third, we leverage the fact that, though rare, we observe
meaningful growth outcomes for some firms (e.g., those that achieve an IPO or high-value
acquisition within six years of founding). Combining these insights, we measure entrepreneurial
quality by estimating the relationship between observed growth outcomes and start-up
characteristics using the population of at-risk firms. Specifically, for a firm i born in region r at
time t, with start-up characteristics 𝐻!,!,! , we observe growth outcome 𝑔!,!,!!! s years after
founding and estimate:
𝜃!,!,! = 𝑃 𝑔!,!,!!! 𝐻!,!,! = 𝑓 𝛼 + 𝛽𝐻!,!,! (1)
This model allows us to predict quality as the probability of achieving a growth outcome
given start-up characteristics at founding, and so estimate entrepreneurial quality as 𝜃!,!,!. As
long as the process by which start-up characteristics map to growth remain stable over time (an

16
assumption which is itself testable), this mapping allows us to form an estimate of
entrepreneurial quality for any business registrant within our sample (even those in recent
cohorts where a growth outcome (or not) has not yet had time to be observed).9
We use these estimates to propose three new entrepreneurship statistics capturing the
level of entrepreneurial quality for a given population of start-ups, the potential for growth
entrepreneurship within a given region and start-up cohort, and the performance over time of a
regional entrepreneurial ecosystem in realizing the potential performance of firms founded
within a given location and time period.
The Entrepreneurial Quality Index (EQI). To create an index of entrepreneurial quality
for any group of firms (e.g., all the firms within a particular cohort or a group of firms satisfying
a particular condition), we simply take the average quality within that group. Specifically, in our
regional analysis, we define the Entrepreneurial Quality Index (EQI) as an aggregate of quality
at the region-year level by simply estimating the average of 𝜃!,!,! over that region:
𝐸𝑄𝐼!,! =!!!,!
𝜃!,!,!!∈ !!,! (2)
9 The practical requirement for estimating entrepreneurial quality in recent cohorts is the timeliness of observing the
start-up characteristics, H. As in Guzman and Stern (2015b), we consider two different indices – a real-time “nowcasting” index that only includes information directly observable from the business registration form (and so can be calculated for firms as they register), and an informationally richer index that includes early-stage start-up milestones such as the acquisition or grant of a patent within the first year after founding, the granting of a trademark in the first year after founding, or mention in local media or news in the first year after founding. When one aggregates individual firm results in to aggregate indices, there is a very high level of concordance between indices based on these two approaches.

17
where {𝐼!,!} represents the set of all firms in region r and year t, and 𝑁!,! represents the number
of firms in that region-year. To ensure that our estimate of entrepreneurial quality for region r
reflects the quality of start-ups in that location rather than simply assuming that start-ups from a
given location are associated with a given level of quality, we exclude any location-specific
measures Hr,t from the vector of observable start-up characteristics.
The Regional Entrepreneurship Cohort Potential Index (RECPI). From the perspective
of a given region, the overall inherent potential for a cohort of start-ups combines both the
quality of entrepreneurship in a region and the number of firms in such region (a measure of
quantity). To do so, we define RECPI as simply 𝐸𝑄𝐼!,! multiplied by the number of firms in that
region-year:
𝑅𝐸𝐶𝑃𝐼!,! = 𝐸𝑄𝐼!,! × 𝑁!,! (3)
Since our index multiplies the average probability of a firm in a region-year to achieve growth
(quality) by the number of firms, it is, by definition, the expected number of growth events from
a region-year given the start-up characteristics of a cohort at birth. This measure of course
abstracts away from the ability of a region to realize the performance of start-ups founded within
a given cohort (i.e., its ecosystem performance), and instead can be interpreted as a measure of
the “potential” of a region given the “intrinsic” quality of firms at birth, which can then be
affected by the impact of the entrepreneurial ecosystem, or shocks to the economy and the cohort
between the time of founding and a growth outcome.
The Regional Ecosystem Acceleration Index (REAI). While RECPI estimates the expected
number of growth events for a given group of firms, over time we can observe the realized
number of growth events from that cohort. This difference can be interpreted as the relative
ability of firms within a given region to grow, conditional on their initial entrepreneurial quality.

18
Variation in ecosystem performance could result from differences across regional ecosystems in
their ability to nurture the growth of start-up firms, or changes over time due to financing cycles
or economic conditions. We define REAI as the ratio of realized growth events to expected
growth events:
𝑅𝐸𝐴𝐼!,! =!!,!,!
!"#$%!,! (4)
A value of REAI above one indicates a region-cohort that realizes a greater than expected
number of growth events (and a value below one indicates under-performance relative to
expectations). REAI is a measure of a regional performance premium: the rate at which the
regional business ecosystem supports high potential firms in the process of becoming growth
firms.
Together, EQI, RECPI, and REAI offer researchers and regional stakeholders the ability
to undertake detailed evaluations (over time, and at different levels of geographic and sectorial
granularity) of entrepreneurial quality and ecosystem performance.
IV. Data and Entrepreneurial Quality Estimation
Our analysis leverages business registration records, a potentially rich and systematic
data for the study of entrepreneurship. Business registration records are public records created
endogenously when an individual register a new business as a corporation, LLC or partnership.
Section II of the data appendix in this paper provides a rich and detailed overview of this data
set, as do the data appendixes in our prior work (Guzman and Stern, 2015a; 2015b).
We focus on the fifteen states of Alaska, California, Florida, Georgia, Idaho,
Massachusetts, Missouri, Michigan, New York, Oklahoma, Oregon, Texas, Vermont,
19
Washington, and Wyoming, from 1988-2014. While it is possible to found a new business
without business registration (e.g., a sole proprietorship), the benefits of registration are
substantial, and include limited liability, various tax benefits, the ability to issue and trade
ownership shares, and credibility with potential customers. Furthermore, all corporations,
partnerships, and limited liability companies must register with a Secretary of State in order to
take advantage of these benefits: the act of registering the firm triggers the legal creation of the
company. As such, these records reflect the population of businesses that take a form that is a
practical prerequisite for growth.10
Concretely, our analysis draws on the complete population of firms satisfying one of the
following conditions: (a) a for-profit firm in the local jurisdiction or (b) a for-profit firm whose
jurisdiction is in Delaware but whose principal office address is in the local state. In other
words, our analysis excludes non-profit organizations as well as companies whose primary
location is not in the state. Thed resulting dataset contains 18,145,359 observations.11 For each
observation we construct variables related to: (a) a growth outcome for each start-up; (b) start-up
characteristics based on business registration observables; and (c) start-up characteristics based
on external observables that can be linked directly to the start-up. We briefly review each one in
turn and provide a more detailed summary in our data appendix.
Growth. The growth outcome utilized in this paper, Growth, is a dummy variable equal to
1 if the start-up achieves an initial public offering (IPO) or is acquired at a meaningful positive
10 This section draws on Guzman and Stern (2015a, 2015b), where we introduce the use of business registration records
in the context of entrepreneurial quality estimation. 11 The number of firms founded in our sample is substantially higher than the US Census Longitudinal Business
Database (LBD), done from tax records. For example, for Massachusetts in the period 2003-2012, the LBD records an average of 9,450 new firms per year and we record an average of 24,066 firm registrations. We have yet to explore the reasons for this difference. However, we expect that it may be explained, in part by: (i) partnerships and LLCs that do not have income during the year do not file a tax returns and are thus not included in the LBD, and (ii) firms that have zero employees and thus are not included in the LBD.

20
valuation within 6 years of registration12. During the period of 1988 to 2008, we identify 5,187
firms that achieve growth, representing 0.04% of the total sample of firms in that period.
Start-Up Characteristics. At the center of our analysis is an empirical approach to map
growth outcomes to observable characteristics of start-ups at or near the time of business
registration. We develop two types of measures of start-up characteristics: (a) those based
measures based on business registration data observable in the registration record itself, and (b)
measures based on external indicators of start-up quality that are observable at or near the time of
business registration.
Measures Based on Business Registration Observables. We construct ten measures based
on information observable in business registration records. We first create two binary measures
that relate to how the firm is registered, Corporation, whether the firm is a corporation rather
than an LLC or partnership, and Delaware Jurisdiction, whether the firm is registered in
Delaware. We then create five additional measures based directly on the name of the firm.
Eponymy is equal to 1 if the first, middle, or last name of the top managers is part of the name of
the firm itself.13 We hypothesize that eponymous firms are likely to be associated with lower
entrepreneurial quality. Our last measure relates to the structure of the firm name. Based on our
review of naming patterns of growth-oriented start-ups versus the full business registration
database, a striking feature of growth-oriented firms is that the vast majority of their names are at
most two words (plus perhaps one additional word to capture organizational form (e.g., “Inc.”)).
12 In our Data Appendix (Section III, Table A4) we investigate changes in this measure both in the threshold of growth
(e.g. only IPOs) as well as the time to grow, all results are robust to these variations 13 Belenzon, Chatterji, and Daley (2014) perform a more detailed analysis of the interaction between eponymy and firm
performance.

21
We define Short Name to be equal to one if the entire firm name has three or less words, and
zero otherwise.14
We then create several measures based on how the firm name reflects the industry or
sector within which the firm is operating, taking advantage of the industry categorization of the
US Cluster Mapping Project (“US CMP”) (Delgado, Porter, and Stern, 2016) and a text analysis
approach. We develop eight such measures. The first three are associated with broad industry
sectors and include whether a firm can be identified as local (Local), or traded (Traded), or
traded within resource intensive industries (Traded Resource Intensive). The other five industry
groups are narrowly defined high technology industries that could be expected to have high
growth, including whether the firm is associated with biotechnology (Biotech Sector), e-
commerce (E-Commerce), other information technology (IT Sector), medical devices (Medical
Dev. Sector) or semiconductors (Semiconductor Sector).
Measures based on External Observables. We construct two measures related to start-up
quality based on intellectual property data sources from the U.S. Patent and Trademark Office.
Patent is equal to 1 if a firm holds a patent application within the first year and 0 otherwise. We
include patents that are filed by the firm within the first year of registration and patents that are
assigned to the firm within the first year from another entity (e.g., an inventor or another firm).
Our second measure, Trademark, is equal to 1 if a firm applies for a trademark within the first
year of registration.
Table 1 reports the summary statistics and the source of each of the measures. A detailed
description of all variables as well as the specific set of US CMP clusters used to develop each
industry classification are provided in the Data Appendix.
14 Companies such as Akamai or Biogen have sharp and distinctive names, whereas more traditional businesses often have long and descriptive names (e.g., “New England Commercial Realty Advisors, Inc.”).
22
Estimation of Entrepreneurial Quality. To estimate entrepreneurial quality for each firm
in our sample, we regress Growth on the set of start-up characteristics observable either directly
through the business registration records or otherwise related to the early-stage activities of
growth-oriented start-ups.
In Table 2, we present a series of univariate logit regressions of Growth on each of these
start-up characteristics. All regressions are run on the full sample of firms from 1988 to 2008.
To facilitate the interpretation of our results, we present the results in terms of the odds-ratio
coefficient and include the McFadden pseudo R2. In all our models, we use logit rather than
OLS for our predictions for two reasons. First, a large literature documents firm sizes and growth
rates as much closer to log-normal than linear (Gibrat, 1931; Axtell, 2001). While we stress that
entrepreneurial quality is a distinct measure from firm size, it is still more natural to use a
functional form that best fits the known regularities of the data.15 Second, while OLS is known to
perform better than logit in estimating marginal effects (see Angrist and Pischke, 2008), logit
performs better than OLS in prediction (Pohlman and Leitner, 2003), consistent with the
objective of this paper.
Our univariate results are suggestive, and highlight a relationship between early firm
choices and later growth. Measures based on the firm name are statistically significant and
inform variation in entrepreneurial outcomes. Having a short name is associated a 3.6X increase
in the probability of growth, and having an eponymous name with an 82% lower probability of
growth. Corporate form measures are also significant. Corporations are 3.9 times more likely to
15 While it is also possible to estimate quality non-parametrically, it leads to a “curse of dimensionality” for predictive
purposes. The 14 observables we use can combine in 2!" = 16,384 ways, not all of which have a robust number of growth firms to estimate a value. In Guzman and Stern (mimeo) we investigate the non-parametric distribution of entrepreneurial quality outside of prediction, and its implications for firm performance. We have found preliminary evidence that quality is best approximated by a Pareto distribution, rather than log-normal. We consider this an important topic for future research.

23
grow and firms registered under Delaware jurisdiction (instead of the local jurisdiction) are 47
times more likely to grow. These magnitudes are economically important and have strong
explanatory power – the pseudo-R2 of a Delaware binary measure alone is 0.16 – indicating a
potential role of firm governance choices as a screening mechanism for entrepreneurial quality.
Intellectual property measures have the highest magnitude of all groups. Firms with a patent
close to their birth are 143 times more likely to grow, while firms with a trademark are 77 times
more likely to grow. Finally, the set of US CMP Cluster Dummies, implied from firm name, are
also informative. Firms whose name is associated with local industries (e.g. “Taqueria”) are 74%
less likely to grow, while firms whose name associated with traded industries are 1.4 times more
likely to grow, as are firms with names associated in specific resource intensive sectors (e.g. Oil
and Gas). Firms associated with the biotechnology sector are 16 times more likely to grow, firms
associated with ecommerce 1.9 times, associated to IT 6 times, medical devices 3 times, and 21
times for firms with name associated to semiconductor. These coefficients are large and highlight
the value of early firm name choices as an indicator of firm intentions and signals of a firm’s
relationship to an industry.
It is of course important to emphasize that each of these coefficients must be interpreted
with care. While we are capturing start-up characteristics that are associated with growth, we are
neither claiming (or even implying) a causal relationship between the two: if a firm with low
growth potential changes its legal jurisdiction to Delaware, this decision need not have any
impact on its overall growth prospects.16 Instead, Delaware registration is an informative signal,
16 It is of course possible that use of this approach might change firm incentives if they try to “game” the algorithm by
selecting into signals of high-quality (e.g., changing their name). Though real, this incentive is bounded by the objectives of the founders. For example, it is unlikely that a founder with no intention to grow would incur the significant yearly expense require to keep a registration in Delaware (which we estimate around $1000). And, firms that signal in their name that they are meant to serve a local customer base (e.g. “Taqueria”) are unlikely to change their names in ways that affect their ability to attract customers. Finally, we also note that any effects from “gaming” would be short-lived since, as low quality firms select into a specific measure the correlation between such measure and growth – and therefore the weight

24
based on the fact that external investors often prefer to invest in firms governed under Delaware
law, of the ambition and potential of the start-up at the time of business registration.
In Table 3, we turn to a more systematic regression analysis to evaluate these
relationships. In models 1 to 3, we begin by evaluating the joint role of small groups of
measures, which we then combine in models 4 and 5, which we then use as our core
specifications in the estimation of entrepreneurial quality. We include state fixed effects in each
of the models to account for idiosyncratic differences in corporate registration offices in each
state. While it is a reasonable assumption to expect business registration records to include all
firms with high quality (i.e. all firms with growth potential), it is not clear a-priori if the quality
of the marginal registering firm (which is of low quality) in each state is exactly the same. In
almost all cases, however, the magnitude of fixed effects is small relative to the coefficients of
our firm measures, suggesting large similarities across state registries.17
Columns 1-3 investigate the joint role of different groups of measures after including
state fixed effects. Column 1 investigates corporate governance measures, corporations are 6.3
times more likely to grow and Delaware firms are 51 times more likely to grow. Since these are
incidence-rate ratios (odds-ratios), the joint coefficients can be interpreted multiplicatively:
Delaware corporations are 321 times more likely to grow (51 × 6.3 = 321). Interestingly, both
of these coefficients are actually larger than their respective coefficient in the univariate analysis.
In column 2, we study the relationship of name-based measures to Growth. Firms with a short
name are 3 times more likely to grow while eponymous firms are 84% less likely to grow.
our prediction model would assign to it – would weaken (i.e., the gaming hypothesis is testable over time).
17 The only coefficient of an important difference in magnitude appears to be Vermont. Relative to Washington State (the excluded category), firms registered in Vermont are 90% less likely to grow. We view this result as indicative of other elements generally associated with Vermont, which is largely recognized as a highly innovative state (with the highest level of patents per capita) yet having relatively low entrepreneurial performance.
25
Finally, in column 3, we study the role of intellectual property measures to Growth. Firms with a
patent are 72 times more likely to grow and firms with a trademark are 11 times more likely to
grow.
In columns 4 and 5 we develop predictive models by including the measures in prior
models plus industry controls. Our first specification (Model 4) uses only business registration
observables. Corporate structure measures continue to be particularly informative even after
including other covariates. Corporations are 4.6 times more likely to grow and firms registered
under Delaware jurisdiction are 46 times more likely to grow. Our two industry agnostic name-
based measures are informative as well. Firms with a short name are 2.9 times more likely to
grow, and eponymous firms are 73% less likely to grow. Finally, industry controls indicating
association to particular US CMP industry clusters are significant. Firms whose names indicate
inclusion in a local industry (such as “restaurant”, “realtor”, etc) are 29% less likely to grow,
firms associated with traded industries are 14% more likely to grow, and firms specifically
associated with resource intensive traded industries are 29% more likely to grow. Names
associated with specific high-technology sectors are also associated with growth: firms related
to biotechnology are 3.1 times more likely to grow, firm associated with e-commerce are 26%
more likely to grow, firms associated with IT 2.4 times, firms associated with semiconductors 3
times more likely to grow. The relationship with firms names related to medical devices,
however, is insignificant. Finally, the state fixed-effects show that there exists some variation in
state-level corporate registration regimes, where the marginal firm to register (one that has all the
negative observables and no positive ones), has different quality depending on the state. The
marginal firm in California (the highest fixed-effect value) is 2.7 times higher quality than that in
Washington (the reference category), while the marginal firm in Vermont (the lowest value) is

26
90% lower quality and Wyoming (the second lowest) is 57% lower quality. Generally, we find
the magnitudes of these fixed effects small relative to the variation that can result from firm
observables, suggesting high stability across inter-region quality estimates (i.e. firms are much
closer in their quality within a type and across states, than within a state and across types).
We extend this specification in Model 5 to include observables associated with early-
stage milestones related to intellectual property. The coefficients on the business registration
observables are quite similar (though slightly reduced in magnitude), while each of the
intellectual property observables is highly predictive. Given that Delaware and Patent are highly
correlated, we separate the interaction including three different effects, firms with a patent and
no Delaware jurisdiction, firms with a Delaware jurisdiction and no patent, and firms with
both.18 In particular, receiving a patent is associated with a 35 times increase in the likelihood of
growth for non-Delaware firms, and the combination of Delaware registration and patenting is
associated with a 196 times increase in the likelihood of growth (simply registering in Delaware
without a patent is associated with only a 46X increase in the growth probability). Finally, firms
successfully applying for a trademark in their first year after business registration are associated
with a five times increase in the probability of growth.19
These two models offer a tradeoff. On the one hand, the “richer” specification (Model 5)
involves an inherent lag in observability, since we are only able to observe early-stage
milestones in the period after business registration (in the case of the patent applications, there is
an additional 18-month lag due to the disclosure policies of the USPTO). While including a
18 An alternative way of presenting this would be to include only an interaction for both. The Delaware and Patent
coefficients would stay the same, but the joint effect would require estimating 𝐷𝑒𝑙𝑎𝑤𝑎𝑟𝑒 × 𝑃𝑎𝑡𝑒𝑛𝑡 interaction rather than providing the effect directly.
19 It is worth noting that the coefficients in these two regressions are very similar to what we found in previous research in California (Guzman and Stern, 2015a) and Massachusetts (Guzman and Stern, 2015b).

27
more informative set of regressors, Model 5 is not as timely as Model 4. Indeed, specifications
that rely exclusively on information encoded within the business registration record can be
calculated on a near real-time basis, and so provide the most timely index for policymakers and
other analysts.20 We will calculate indices based on both specifications; while our main
historical analyses will be based off the results from Model 5, Model 4 can be used to provide
our best estimate of changes in the last few years. Building on recent work developing real-time
statistics (Scott and Varian, 2015), we use the term nowcasting in refererring to the estimates
related to Model 4 and refer to Model 5 as the “full information” model.
Robustness and Predictive Quality. In Table 4, we repeat our nowcasting and full
information models with a series of robustness tests. Since this paper uses the models to estimate
quality through time and region, our main interest is to verify that the magnitudes in our model
are not driven by variation across years or states. In columns 1 and 2, we repeat our models but
also include year fixed effects (note that these cannot be included in our predictive model as we
would not know the fixed-effect value for future years); in columns 3 and 4, we include year
fixed effects and state-specific time trends. While there is some variation in the magnitude of our
coefficients, the changes are relatively small, providing us confidence that our estimates are not
driven by changes across years or within year and states.
Further, in Figure 2, we evaluate the predictive quality of our estimates by undertaking a
tenfold cross-validation test (Witten and Frank, 2005). Specifically, we divide our sample into
10 random subsamples, using the first subsample as a testing sample and use the other 9 to train
the model. For the retained test sample, we compare realized performance with entrepreneurial
20 It is also worthwhile to note that we can compare the historical performance of indices based on each approach – as
emphasized in Figure 2 and 4, aggregate indices have a high level of concordance during the period in which a comparison is feasible, giving us some confidence in the trends predicted by the nowcasting index in the last few years.

28
quality estimates from the model resulting from the 9 training samples. We then repeat this
process 9 additional times, using each subsample as the test sample exactly once. This approach
allows us to estimate average out of sample performance, as well as the distribution of out of
sample test statistics for our model specification. We then report in Figure 2 the relationship
between the out-of-sample realized growth outcomes and our estimates of initial entrepreneurial
quality. The results are striking. The share of growth firms in the top 5% of our estimated
growth probability distribution ranges from 65% to 72%, with an average of 69%. The share of
growth firms in the top 1% ranges from 49% to 53%, with 52% on average (interestingly, these
results are extremely similar to the findings for California from Guzman and Stern (2015)). To
be clear, growth is still a relatively rare event even among the elite: the average firm within the
top 1% of estimated entrepreneurial quality has only a 2% chance of realizing a growth outcome.
V. The State of American Entrepreneurship
With this analysis in hand, we are able to move to the centerpiece of our analysis:
evaluating trends in entrepreneurial quality (EQI), entrepreneurial potential (RECPI), and
regional economic performance (REAI) in the United States over time and space.
We begin by studying the trends in US entrepreneurial potential (RECPI) from 1988 to
2014. Figure 3 shows two RECPI indexes, a full information index based on (3-5) using
information in intellectual property and business registration records which we simply call
RECPI, and a nowcasting index that uses only business registration records (3-4), which we call
Nowcasted RECPI. The U.S. RECPI we report is RECPI adjusted by the aggregate yearly GDP
of our sample of fifteen states (Alaska, California, Florida, Georgia, Massachusetts, Michigan,
29
New York, Oregon, Texas, Vermont, Washington, and Wyoming). Finally, we also include a
confidence interval estimated through a Monte Carlo process repeating our procedure for 100
bootstrapped random samples (i.e. with replacement) of the same size as our original sample.
Before analyzing trends in the indexes, we note that both indexes move very close to each other
and that the confidence interval of RECPI is narrow.
The expected number of growth outcomes (think successful startups) in the United States (RECPI relative to GDP or “U.S. RECPI”) has followed a cyclical pattern that appears sensitive to the capital market environment and overall market conditions.
Both indexes indicate a rise of entrepreneurial potential in the 1990s through the year
2000, with a rapid drop between 2000 and 2002. However, the level observed through 2008
during the 2000s is consistently higher than the level observed during the first half of the 1990s.
After a decline during the Great Recession (2008 and 2009), we observe a sharp upward spring
starting in 2010.21 Interestingly, Nowcasted RECPI divided by GDP is observed at its third
highest level in 2014. Relative to quantity-based measures of entrepreneurship such as the BDS,
these estimates seem to reflect broad patterns in the environment for growth entrepreneurship,
such as capturing the dot-com boom and bust of the late 1990s and early 2000s, and capturing
the rise of high-growth start-up over the early years of this decade.
Our index of entrepreneurial potential does show gaps relative to realized entrepreneurial
performance, though the statistics of GDP Growth in Figure 1B as well as the number of growth
firms in Figure 1A peak in the years 1995 and 1996 (respectively), RECPI instead peaks in the
year 2000. This offers insight into the potential sensitivity of entrepreneurial potential to credit
21 These broad patterns closely accord with the patterns we found for Massachusetts in Guzman and Stern (2015b).
30
market cycles. While the 1996 cohort may have had lower initial potential, those firms were able
to take advantage of the robust financing environment during the early years of their growth; in
contrast, the peak RECPI start-up cohorts of 1999 and 2000 may have been limited in their
ability to reach their potential due to the “financial guillotine” that followed the crash of the dot-
com bubble (Nanda and Rhodes-Kropf, 2013, 2014).
RECPI USA offers a new perspective on the “state” of entrepreneurship (at least for these
fifteen states). Specifically, our Nowcasting index suggests that there has been a steep rise in
entrepreneurial potential over the last several years, and 2014 is the first year to begin to reach
the peaks of the dot-com boom. Indeed, it is useful to recall that our measure is relative to GDP:
on an absolute scale, RECPI 2014 is at the highest level ever registered (327 in 2014 versus the
previous peak of 312 in 2000). Finally, we emphasize that, though there are small deviations,
both the nowcasted and full information indexes have a very high concordance.
Geographic Variation in Entrepreneurial Quality. We also study the geographic variation
in entrepreneurial quality for our 15 states. Figure 3 shows our estimate of quality in 2012 (the
last year for which we have full data) by ZIP Code, with the size of each point representing to the
number of firms in that ZIP Code and the color capturing its average quality (EQI) (with darker
coloring indicating a higher level of entrepreneurial quality). Starting from the southwest region
of the contiguous 48 states, entrepreneurship potential is clearly high in California, and is
particularly high around the Bay Area. Potential drops quickly once we move into Oregon,
except for a cluster of entrepreneurial quality around Portland and a smaller one around Eugene.
Washington has an overall high level of quality (we are unable to estimate ZIP Code level scores
as we lack addresses for our firms in Washington). Idaho and Wyoming show much less density

31
and generally lower entrepreneurship, through there is still a small pocket of quality around
Boise (albeit much lower than the West Coast cities), and a high level of quantity (though not
quality) around Cheyenne in Wyoming. Texas shows important clusters of high mass of
entrepreneurship potential around Dallas and Houston, followed by Austin (a much smaller city,
but of high quality). The area around San Antonio and the Rio Grande Valley shows a high
number of firms but mostly low quality and the areas of El Paso and the Southern Plains (which
houses important oil investments) have a smaller but visible mass of entrepreneurship potential.
In Oklahoma and Missouri, it is possible to see Oklahoma City, Springfield, St. Louis, Kansas
City and Columbia, all of which have low quality except for a small pocket in Columbia (where
the University of Missouri is housed). In the Midwest, Michigan has small clusters of high
quality around Detroit and Ann Arbor. In the Southeast, there is substantial entrepreneurship in
both Florida and Georgia, thought the quality appears to be low, except, perhaps, for a slightly
higher quality area around Atlanta, GA. In the Northeast, New York has a medium level of
quality and we are once again unable to study micro-geography in this state as we do not have
the ZIP Code of each individual firm. It is possible to appreciate the important mass of
entrepreneurship potential around the Boston area, with a smaller but still visible mass around
Central Massachusetts. For Vermont, there is little indication of high entrepreneurial quality
across the state. Finally, Alaska shows virtually no entrepreneurship except for a very small
pocked of high quality around Juneau and another south of Anchorage.
Overall, this evidence supports three interrelated conclusions. First, relative to a
perspective emphasizing a worrisome secular decline in “shots on goal” (Hathaway and Litan,
2014b), our approach and evidence suggest that there has been a more variable pattern of
entrepreneurship over the last 25 years, and that the last five years has been associated with an
32
accumulation of entrepreneurial potential similar to that which marked the late 1990s. Second,
this variation in potential has a clear relationship with later entrepreneurship performance of such
cohorts using both measures of number of realized growth firms as well as market value created
by firms in those cohorts. Finally, given the more gently sloped level of the entrepreneurial boom
of recent years, it may be the case that this accumulation of entrepreneurial potential is more
sustainable than earlier periods.
VI. Trends in the Effect of the US Entrepreneurial Ecosystem (REAI)
Entrepreneurship performance depends on more than simply founding new enterprises,
but also scaling those enterprises in a way that is economically meaningful. This insight
motivates our second set of findings where we examine “ecosystem” performance across the
United States, as measured by the Regional Ecosystem Acceleration Index (REAI). REAI
captures the relative ability of a given start-up cohort to realize its potential, relative to the
expectation for growth events as measured by RECPI (i.e., REAI = Growth Events / RECPI). A
value of 1 in the index indicates no ecosystem effect. A value above 1 indicates a positive
ecosystem effect, and a value under 1 indicates a negative effect. In contrast to RECPI, this
index reflects the impact of the economic and entrepreneurial environment in which a start-up
cohort participates (i.e., the “ecosystem” in which it participates). This ecosystem will include
the location in which the firm is founded (e.g., Silicon Valley versus Miami) as well as the
environment for funding and growth at the time of founding. In Figure 5, to examine the
changing environment for entrepreneurship in the United States (i.e., change in the US
33
Ecosystem, as reflected in the twelve states for which we have data), we plot REAI over time
from 1988-2008, and developed a projected measure of REAI for years 2009-2012. 22
Three distinct periods stand out. The early portion of our sample saw a significant
increase in REAI from a slight negative level to a peak of 1.98 for the 1996 cohort. This is
consistent with our evidence from Figure 1, in which the 1996 start-up cohort was indeed the
most “successful.” This peak was followed by a steady decline through 2000, in which,
conditional on the estimated quality of a given start-up, the probability of growth was declining
as the result of the environment (i.e., time) in which that start-up was trying to grow. From
2001-2008, there is a period of stagnation, with REAI going slowly form 0.7 down to 0.52.
These differences are economically meaningful: a start-up for a given quality level is estimated
to be 4 times more likely to experience a growth event in the six years after founding if they
were founded in 1996 rather than in 2005. Finally, though still a preliminary estimate, we
observe a weak resurgence the first increase in REAI for cohorts in 2009 to 2011, highlighting a
potential improvement in the entrepreneurial ecosystem in recent years in parallel with the boom
in the availability of entrepreneurial finance. While this rise is economically important, its
realization once all growth outcomes realize is still to be seen.
This pattern is both striking and worrisome. Over the past years, there has been
increasing understanding of the role that successful entrepreneurship plays as an engine for
economic progress, and increased public involvement in supporting start-up activity and
nurturing regional entrepreneurial ecosystems. Yet, despite that attention, the emergence from
the Great Recession seems to have not been driven by (nor helped) the start-up cohorts founded
22 Because our approach requires that we observe the realized growth firms we can only measure our index with a 6
year lag, thus, up to 2008. For years 2009 to 2012, we estimate our model with a varying lag of 𝑛 = 2014 − 𝑦𝑒𝑎𝑟 and calculate RECPI using such lag.
34
in the late 2000s. Preliminary evidence shows that more recent cohorts experience a more
favorable set of outcomes, but how favorable still remains an open question, and understanding
the factors that facilitate more favorable outcomes for a given level of RECPI are an important
agenda for future research.
VII. Do Changes in Entrepreneurial Quality Correlate To Future Economic Growth?
We now shift our focus to the relationship between entrepreneurial quantity and quality
and measures of subsequent economic performance. To do so, we build an MSA-level dataset of
measures of the total quantity of entrepreneurship (OBS), EQI, as well as MSA GDP measures
obtained from the Bureau of Economic Analysis. We focus on the 63 largest MSAs, each of
which register more than 1000 yearly firm births on average (we include all MSAs in our
geographic coverage in the robustness checks). Our core specification is a simple “long
differences” analysis, in which examine the relationship between growth between 2003 and 2014
as a function of the initial level of GDP (average between 2001-2003), as well as the initial
quantity and quality of entrepreneurship (both measured as an average between 2001-2003 for
OBS and EQI).
Figure 6 shows the scatterplot and correlation between log GDP growth and our two
entrepreneurship measures, ln (𝐸𝑄𝐼) (Panel A) and ln 𝑂𝑏𝑠 (Panel B). The relationship between
EQI and GDP growth is positive, with a slope of .08, and significant at the 1 percent level. The
relationship between quantity and GDP growth, though noisier and lower in magnitude, is also
positive, with a slope of .038, and significance at the 5 percent level.
In Table 5 we measure this relationship in a regression framework. Columns 1 and 2
repeat the relationships represented graphically in Figure 6. Columns 3 and 4 include the level

35
of GDP (ln (𝐺𝐷𝑃!""#!!""!)) as a control. Once one accounts for initial GDP level, there is no
relationship between GDP growth and the quantity of entrepreneurship.
Column 5 is our main specification, including initial levels of GDP, OBS, and EQI at the
same time.23 The results are striking. While the initial level of GDP and OBS have no
relationship to subsequent GDP growth, there is a strong relationship with our measure of initial
entrepreneurial quality: a doubling of entrepreneurial quality predicts an increase of 6.8% in
GDP 11 years in the future. Given the skewed nature of entrepreneurial quality by region
(moving a region from the 5th to the 95th percentile represents an 11X increase in quality),
moving from the bottom to the top of the distribution of initial entrepreneurial quality is
associated with a 75% increase in GDP growth.
Finally, in Column 6 we include all cities as a robustness test. The overall pattern is
basically the same. Though the results are noisier and the coefficient for EQI slightly lower (.049
rather than .068), the coefficient is still significant at the 5% level while quantity is not
distinguishable from zero.
We emphasize that these results are not causal estimates. Entrepreneurial quality (and
quantity) are themselves endogenous outcomes resulting from the underlying strength and
environment in a given region, and so a causal analysis would focus on whether factors shifting
the environment for entrepreneurship (and resulting in an increase in OBS or EQI) could then be
linked over time to overall changes in regional economic performance. With that said, these
measures do provide some new insight into the relationship between entrepeneurship and
economic growth. If entrepreneurial quality correlates to later economic growth, then measures
23 Notably, this result also nests the relationship of RECPI and GDP. Since RECPI is defined as the product
of EQI and quantity, regressing ln (𝑅𝐸𝐶𝑃𝐼) implies regressing ln 𝐸𝑄𝐼 + ln (𝑂𝑏𝑠) on GDP. An unreported regression including RECPI instead of EQI in column 5 results in the exact same elasticity between RECPI and GDP than that of EQI and GDP.

36
of quality can serve as a useful leading indicator of the economic performance of regions.
Policymakers for example can use quality-adjusted entrepreneurship index to gauge whether a
particular region is encouraging the type of entrepreneurship that might yield significant
economic dividends. The analysis also highlights the role of alternative indices for evaluating
the role of entrepreneurship: given the focus of entrepreneurship as a pathway to economic
performance, our analysis suggests that measures that explicitly incorporate quality are likely to
accord more closely with certain types of economic phenomena.
37
VIII. Entrepreneurial Quality Across Metropolitan Areas
RECPI Silicon Valley: A Case Study. While our results so far have focused on the
aggregate experience across fifteen (relatively diverse) US states, many questions about the state
of entrepreneurship are particularly concerned with specific regional ecosystems, perhaps none
more so than Silicon Valley. We therefore calculate RECPI over time solely for the combined
counties of Alameda, Contra Costa, Marin, Napa, San Francisco, San Mateo, Santa Clara,
Solano, and Sonoma, and plot the results (on an absolute scale) in Figure 7.24 The overall pattern
of results is quite similar to that of the aggregate RECPI in Figure 2, with a sharp increase in
RECPI Silicon Valley during the dot-com boom, an equally sharp drop from 2000-2002, a
higher but constant level through 2010, followed by a sharp increase over the last few years.
While the overall directional shifts are the same, the levels are quite different. In particular, the
boom in RECPI since the bottom of the Great Recession has been as steep (if not steeper) than
during the late 1990s, and Nowcasted RECPI Silicon Valley is more than 50% higher than was
ever realized during the dot-com boom (indeed, RECPI Silicon Valley has exceeded its dot-com
peak every year since 2011). Of course, the very rapid increase in recent years may indeed be
cause for concern (suggesting a bubble that, like the 1990s, cannot be sustained).
The Micro-Geography of Entrepreneurial Quality. As a final piece of analysis, we look at
the changing nature of the micro-spatial distribution of average entrepreneurial quality (EQI) for
a few key geographic areas in our sample. Figures 8A-8C show maps of EQI at the ZIP Code
level, for five areas across 4 different years: the Boston metropolitan area, the San Francisco Bay
area, the City of San Francisco, and the Miami metropolitan area. Each map represents a
24 While a full analysis of economic impact would properly “deflate” RECPI by the overall size of the economy (as we
did in Figure 2), it is useful to consider the absolute numbers to capture the perspective of individual observers of a regional ecosystem who may be benchmarking their experience against an earlier time period.
38
snapshot of entrepreneurial quality during the year in question. Looking across snapshots of
quality for a particular city gives a sense of the evolution of the ecosystem. While one might
expect each region to follow a similar pattern, we see important heterogeneity in changes in
entrepreneurial quality across regions and time periods.
Figure 8A shows the Boston metropolitan area. In 1988, we find entrepreneurial quality
concentrated around the Route 128 corridor, a pattern documented in the detailed analyses of
Massachusetts growth entrepreneurship by Saxenian (1992) and Roberts (1991). As the Boston
area moves into the dot-com boom, the amount of entrepreneurial quality increases in both the
central and neighboring districts while continuing to be centered around Route 128. However,
over the past decade, the center of high-quality entrepreneurship has shifted. There is still high
quality entrepreneurship around Route 128, but Cambridge (particularly Kendall Square) and
areas of Boston (such as the Innovation District) have emerged as the leading areas in terms of
intensive entrepreneurial quality in the Boston region.25
Figures 8B looks at the San Francisco Bay Area. First, the initial state of entrepreneurial
quality in 1988 is relatively modest, with a narrow set of areas near San Jose and Sunnyvale
accounting for the entirety of a “Silicon Valley” effect. The 1990s saw both an upgrade of
entrepreneurial quality in the South Bay, with a boom particularly around Stanford and Berkeley.
Consistent with Figure 3, the drop-off in entrepreneurial quality was much more muted after the
dot-com crash than in many other places, with a particular striking rise in overall quality by
2012. More importantly, we see a shift over the past decade in the rise of entrepreneurial quality
25 In Guzman and Stern (2015b) we have also documented this pattern of migration from Route 128 to Cambridge by
estimating yearly average quality for both regions, We also document micro-geographical patterns at the level of individual addresses, highlighting the heterogeneity that exists around the “MIT Ecosystem” (e.g., comparing buildings around Kendall Square from the more retail entrepreneurship around Central Square and Cambridgeport.
39
in San Francisco, extending beyond a few districts (as in 2000); by 2012, more than half of the
zip codes in San Francisco registered a level of entrepreneurial quality that places them in the top
5% of the distribution of all zip codes throughout the 25-year sample period.
Beyond these hotspots, Figures 8C documents the pattern of a regions that has yet to
experience the type of entrepreneurial ecosystem development as Boston or the Bay Area: Miami
and its surrounding metropolitan area. In the entrepreneurial ecosystem of Miami, even during
the height of the dot-com boom, there was relatively little shift in the overall entrepreneurial
quality of any region, and over time, there has been an erosion of relative quality in this region.
By 2012, most of the Miami area has low entrepreneurial quality (outside the top quartile). This
result stands in sharp contrast to previous results that have found this same area to have the
highest level of self-employment (e.g. Glaeser, 2007),26 thus highlighting the importance of
focusing on quality rather than intensity of new firm formation in analyses of entrepreneurial
ecosystems.
IX. Conclusion
Using a quality-based approach with business registration records for fifteen states, we
focus on the systematic measurement of entrepreneurial quality to create synthetic
entrepreneurship indexes at the national level. Not simply a matter of data, a focus on
entrepreneurial quality allows us to focus on a more rigorous examination of variation over time
and across places in the potential from a given start-up cohort (RECPI) and the ability of an
entrepreneurial ecosystem to realize that potential over time (REAI).
26 Specifically, Gleaser (2007) finds that the top three MSAs (using the 2000 Census definitions) in the United States
by rates of self-employment are West Palm Beach-Boca Raton-Delray Beach, FL, Miami-Hialeah, FL, and Fort Lauderdale-Hollywood-Pompano Beach, FL. Here we use the updated 2012 MSA definitions and present the Miami-Fort Lauderdale-West Palm Beach, FL MSA, which is (basically) the same area.
40
This approach presents a different view into the state of American entrepreneurship, highlighting
several interrelated patterns:
• The expected number of growth outcomes in the United States has followed a cyclical
pattern that appears sensitive to the capital market environment and overall market
conditions. U.S. RECPI reflects broad and well-known changes in the environment for
startups, such as the dotcom boom and bust of the late 1990s and early 2000s.
• While the expected number of high-growth startups peaked in 2000 and then fell
dramatically with the dot-com bust, starting in 2010 there is a sharp, upward swing in the
expected number of successful startups formed and the accumulation of entrepreneurial
potential for growth (even after controlling for the change in the overall size of the
economy).
• Notwithstanding the cyclical nature of U.S. RECPI trends, U.S. RECPI has exhibited an
overarching upward trend across the full time-series of our sample (Figure 3). The rate
of expected successful startups fell to its lowest point in 1991 at a level which has not
been approached again. U.S. RECPI downturns in the wake of the dotcom burst (from
2000-2004) and Great Recession (from 2007-2009) ebbed at levels significantly above its
1991 nadir. U.S. RECPI thus provides a strong signal that the State of American
Entrepreneurship is not imperiled by a lack of formation of high-growth potential
startups, but instead by other dynamics or ecosystem.
• There is striking variation in entrepreneurial potential for growth (EQI) across regions
and over time. There are extremely high and persistent levels of entrepreneurial quality in
areas such as Silicon Valley and Boston, while other regions with high rates of self-

41
employment such as Miami have yet to achieve a high measured level of entrepreneurial
quality.
• REAI—the likelihood of startups to reach their potential—declined sharply in the late
1990s and did not recover through at least 2008. During this time period (which
preceded the Great Recession), the American ecosystem for entrepreneurship was not
conducive to startup growth. For example, conditional on the same estimated potential, a
1996 startup was 4 times more likely to achieve a growth event in 6 years than a startup
founded in 2005.
• Relative to quantity-based measures of entrepreneurship, regional variation in
entrepreneurial quality appears to hold a stronger relationship to economic growth. Once
one controls for the initial level of GDP, MSA-level GDP growth between 2003 and 2014
is uncorrelated with the baseline quantity of entrepreneurship but has a statistically and
quantitatively significant relationship with the baseline level of entrepreneurial quality.
Our analysis thus indicates that both changes in entrepreneurial potential and ecosystem
effects are economically important in US entrepreneurial performance. Relative to the 1990s
(without the dot-com boom and bust of 1998-2002), we observe a three to four-fold drop in the
US ecosystem performance while observing very little drop in overall entrepreneurial potential.
Changes in both entrepreneurial potential and ecosystem effects are important for understanding
the state of American entrepreneurship. While the supply of new high-potential-growth startups
appears to be growing, the ability of U.S. high-growth-potential startups to commercialize and
scale seems to be facing continuing stagnation.

42
Entrepreneurship is often identified as a key factor driving long-term economic
performance, with significant policy attention and investment. To date, most entrepreneurship
policy has emphasized an increase in “shots on goal” and abstracted away from significant
differences across firms at founding (except for sectoral differences). However, to the extent
that heterogeneity across firms matters, policy interventions to enhance the process of scale-up
may be more impactful than those that simply aim to increase shots on goal. More generally, our
analysis suggests that directly taking a quantitative approach to the measurement of
entrepreneurial quality can yield new economic statistics to help provide a more granular
analysis of entrepreneurial ecosystems and the impact of entrepreneurship on economic and
social progress.

43
REFERENCES
Angelini, Paolo & Andrea Generale. 2008. "On the Evolution of Firm Size Distributions," American Economic Review, American Economic Association, vol. 98(1), pages 426-38, March.
Angrist, Joshua D., and Jörn-Steffen Pischke. 2008. Mostly harmless econometrics: An empiricist's companion. Princeton University Press.
Axtell, Robert L. 2001. "Zipf distribution of US firm sizes." Science 293.5536: 1818-1820. Belenzon, Sharon, Chatterji, Aaron and Brendan Daley. 2014. “Eponymous Entrepreneurs”
Working Paper Cochrane, John H. (2005) “The risk and return of venture capital” Journal of Financial
Economics. 75. 3-52 Davis, Steven, and John Haltiwanger. 1992. “Gross Job Creation, Gross Job Destruction, and
Employment Reallocation”. The Quarterly Journal of Economics. 107 (3): 819-862 Davis, Steven, Haltiwanger, John, and Scott Shuh. 1996. “Job Creation and Destruction”. MIT
Press. Decker, Ryan, Haltiwanger, John, Jarmin, Ron and Javier Miranda. 2014. “The Role of
Entrepreneurship in US Job Creation and Economic Dynamism”. Journal of Economic Perspectives. 28(3): 3-24
Decker, Ryan, John Haltiwanger, Ron Jarmin and Javier Miranda. 2015. “Where Has All The Skewness Gone? The Decline in High-Growth (Young) Firms”. NBER Working Paper #21776.
Delgado, Mercedes, Michael E. Porter and Scott Stern. 2016. “Defining Clusters of Related Industries” Journal of Economic Geography. 16 (1): 1-38
Dunne, Timothy, Mark J. Roberts amd Larry Samuelson, 1988. "Patterns of Firm Entry and Exit in U.S. Manufacturing Industries," RAND Journal of Economics, The RAND Corporation, vol. 19(4), pages 495-515, Winter.
Evans, David S. 1987. “The Relationship Between Firm Growth, Size, and Age: Estimates for 100 Manufacturing Industries”. The Journal of Industrial Economics 35 (4). Wiley: 567–81. doi:10.2307/2098588.

44
Gibrat, Robert. 1931. Les Inégalités Économiques, Paris, Librairie du Recueil Sirey Glaeser, Edward. 2007. “Entrepreneurship and the City”. NBER Working Paper #13551.
Glaeser, Edward, Sari Pekkala Kerr, and William R. Kerr. 2012. “Entrepreneurship and Urban Growth: An Empirical Assessment with Historical Mines”. NBER Working Paper #18333
Guzman, Jorge, and Scott Stern. 2015a. “Where is Silicon Valley?” Science. Vol. 347. Issue #6222.
Guzman, Jorge, and Scott Stern. 2015b. “Nowcasting and Placecasting Entrepreneurial Quality and Performance” NBER Working Paper #20954
Guzman, Jorge, and Scott Stern. 2016. “Zipf’s Law in Entrepreneurial Quality” mimeo
Haltiwanger, John, Ron Jarmin, and Javier Miranda. 2013. “Who Creates Jobs? Small versus Large versus Young” The Review of Economics and Statistics. 95 (2). 347-361.
Hathaway, Ian, and Robert E. Litan. 2014a. “Declining Business Dynamism in the United States: A Look at States and Metros”. Economic Studies at Brookings Series. May, 2014.
Hathaway, Ian, and Robert E. Litan. 2014b. “Declining Business Dynamism: It’s For Real,” Economic Studies at Brookings Series. May, 2014.
Hathaway, Ian, and Robert E. Litan. 2014c. “The Other Aging of America: The Increasing Dominance of Older Firms,” Economic Studies at Brookings Series. July, 2014
Holtz-Eakin, Douglas, Whitney Newey and Harvey S. Rosen. 1988. "Estimating Vector
Autoregressions with Panel Data" Econometrica. Vol. 56, No. 6 pp. 1371-1395
Hurst, Erik & Benjamin Wild Pugsley, 2011. "What do Small Businesses Do?," Brookings Papers
on Economic Activity, Economic Studies Program, The Brookings Institution, vol. 43(2
(Fall)), pages 73-142
Ijiri, Yuri, and Herbert Simon. 1977. Skew Distributions and the Sizes of Business Firms. 231 pages.
Jovanovic, Boyan. 1982. “Selection and the Evolution of Industry”, Econometrica, 50, issue 3, p. 649-70
Kaplan, Steven, and Josh Lerner. 2010. “It Ain’t Broke: the Past, Present, and Future of Venture Capital”. Journal of Applied Corporate Finance. 22 (2). 36-47
Kerr, William, Nanda, Ramana, and Matthew Rhodes-Kropf. 2014. “Entrepreneurship as Experimentation”. Journal of Economic Perspectives. 28 (3): 25-48.
Kortum, Samuel, and Josh Lerner. 2000. “Assessing the contribution of venture capital to innovation” RAND Journal of Economics. 31 (4). 674-692
Lerner, Josh. 2009. “Boulevard of Broken Dreams: Why Public Efforts to Boost Entrepreneurship and Venture Capital Have Failed--and What to Do About It” Princeton University Press. 240 pages.

45
Lucas Jr, Robert E., and Edward C. Prescott. 1971. "Investment under uncertainty." Econometrica: Journal of the Econometric Society: 659-681.
Lucas Jr, Robert E. 1978. "On the size distribution of business firms." The Bell Journal of Economics: 508-523.
Luttmer, Erzo G. J. 2007. “Selection, Growth, and the Size Distribution of Firms” The Quarterly Journal of Economics 122 (3): 1103-1144.doi: 10.1162/qjec.122.3.1103
Mansfield, Edwin. 1962. “Entry, Gibrat’s Law, Innovation, and the Growth of Firms.” American Economic Review. 52(5), pp. 1023–51.
McFadden, Daniel. 1974. “Conditional logit analysis of qualitative choice behavior”. Frontiers in Econometrics. Chapter 4. Academic Press. p. 105-142.
Nanda, Ramana, and Matthew Rhodes-Kropf. 2014. “Financing Risk and Innovation”. HBS Working Paper 11-013.
PricewaterhouseCoopers. 2016. “PwC/NVCA Money TreeTM Report”. Retrieved from https://www.pwcmoneytree.com/HistoricTrends/CustomQueryHistoricTrend on March 2, 2016.
Reif, Rafael. 2015. “A better way to deliver innovation to the world”. The Washington Post. Opinions. May 22, 2015.
Roberts, Edward. 1991. Entrepreneurs in High Technology: Lessons from MIT and Beyond. Oxford University Press. 1st Edition.
Sutton, John. 1997. “Gibrat’s Legacy” Journal of Economic Literature. Vol. XXXV March pp. 40-59
Samila, Sampsa, and Olav Sorenson. 2011. “Venture Capital, Entrepreneurship, and Economic Growth”. The Review of Economics and Statistics. 93(1). 338-349.
Saxenian, Anna Lee. 1992. “Regional Advantage: Culture and Competition in Silicon Valley and Route 128”. Harvard University Press.
Schoar, Antoinette. 2010. "The Divide between Subsistence and Transformational Entrepreneurship" Chapter in NBER book Innovation Policy and the Economy, Volume 10. Edited by Josh Lerner and Scott Stern. p. 57 - 81
Witten, Ian H., and Eibe Frank. 2005. Data Mining: Practical machine learning tools and techniques. Morgan Kaufmann.
UPSTART Business Journal. 2014. “The great VC bubble fight of 2014: Tim Draper says yes, Marc Andreessen says no”. January 13, 2014. Accessed on June 5, 2015. http://upstart.bizjournals.com/money/loot/2014/01/13/tim-draper-says-bubble-marc.html

46
TABLE 1
Variable Definition and Summary Statistics (1988-2014) (1) (1) All variables are dummy variables with values of 0 or 1. A detailed description of how each measure is built is available in our data appendix, as well as in the main paper (in a less detailed manner). (2) US CMP Cluster Dummies are estimated by using a sample of 10M firms and comparing the incidence of each word in the name within and outside a cluster, then selecting the words that have the highest relative incidence as informative of a cluster. Firms get a value of 1 if they have any of those words in their name. The procedure is explained in detail in our Data Appendix. (3) Note that there are also firms that we cannot associate with local nor traded industries. (4) All values for mean and standard deviation are presented as percentage values for ease of exposition.
Definition Source Mean (4) Std Dev Outcome Variable
Growth 1 if a firm achieves an equity growth outcome (IPO or acquisition) within
6 years or less, 0 otherwise. SDC Platinum
0.0003 0.0177
Corporate Form Observables
Corporation 1 if a firm is registered as corporation, 0 if registered as LLC, or partnership. Bus. Reg. Records 0.5318 0.4990
Delaware 1 if registered under Delaware jurisdiction, 0 if registered under local (focal state) jurisdiction
Bus. Reg. Records 0.0281 0.1652
Name Observables
Short Name 1 if the firm name is two words or less, 0 otherwise. Bus. Reg. Records 0.4598 0.4984
Eponymous 1 if first or last name of top manager (president, CEO, partner) is part of firm name, 0 otherwise.
Bus. Reg. Records 0.0981 0.2975
Intellectual Property Observables
Patent 1 if firm obtains a patent within a year of founding (either application of new patent or assignment of existing patent), 0 otherwise.
USPTO 0.0018 0.0420
Trademark 1 if firm obtains a trademark within a year of founding, 0 otherwise. USPTO 0.0012 0.0350
US CMP Cluster Dummies (2)
Local 1 if firm name is associated to local industries, 0 otherwise. Estimated from name 0.1877 0.3905 Traded (3) 1 if firm name is associated to traded industries, 0 otherwise. Estimated from name 0.5451 0.4980 Traded Resource Int. 1 if firm name is associated to resource intensive industries, 0 otherwise. Estimated from name 0.1374 0.3443
Biotech Sector 1 if firm name is associated to industries in the biotechnology sector, 0 otherwise. Estimated from name 0.0020 0.0443
Ecommerce Sector 1 if firm name is associated to industries in the ecommerce sector, 0 otherwise. Estimated from name 0.0491 0.2160
IT Sector 1 if firm name is associated to industries in the IT sector, 0 otherwise. Estimated from name 0.0221 0.1470
Medical Dev. Sector 1 if firm name is associated to industries in the medical devices sector, 0 otherwise. Estimated from name 0.0288 0.1673
Semiconductor Sector 1 if firm name is associated to industries in the semiconductor sector, 0 otherwise. Estimated from name 0.0005 0.0215
Observations 18,145,359

47
TABLE 2
Logit Univariate Regressions
Logit univariate regressions of Growth (IPO or Acquisition within 6 years) with each of the observables we develop for our dataset. Incidence rate ratios reported; Standard errors in parentheses * p<0.05 ** p<0.01 *** p<0.001
Firm Name Measures:
US CMP Cluster Dummies:
Variable Univariate Coefficient
Pseudo R2
Variable
Univariate Coefficient
Pseudo R2
Short Name 3.608*** 0.021
Local 0.261*** 0.008
(0.116)
(0.0157)
Eponymous 0.179*** 0.006
Traded Resource Intensive 1.321*** 0.001
(0.0177)
(0.0478)
Corporate Form Measures:
Traded 1.428*** 0.002
Variable Univariate Coefficient
Pseudo R2
(0.0412)
Corporation 3.933*** 0.017 (0.162)
Biotech Sector 16.16*** 0.006
(1.331)
Delaware 46.93*** 0.157
(1.318)
Ecommerce Sector 1.896*** 0.002
(0.0899)
IP Measures:
Variable Univariate Coefficient
Pseudo R2
IT Sector 5.988*** 0.013
Patent 142.7*** 0.093
(0.248)
(4.926)
Medical Dev. Sector 3.017*** 0.004
Trademark 76.41*** 0.030
(0.150)
(3.968)
Semiconductor Sector 20.74*** 0.002
(2.932)
Observations 12162777
Observations 12162777

48
TABLE 3
Growth Predictive Model - Logit Regression on IPO or Acquisition within 6 years We estimate a logit model with Growth as the dependent variable. Growth is a binary indicator equal to 1 if a firm achieves IPO or acquisition within 6 years and 0 otherwise. This model forms the basis of our entrepreneurial quality estimates, which are the predicted values of the model. Incidence ratios reported; Robust standard errors in parenthesis.
Preliminary Models
Nowcasting Model
(Estimated up to real-time)
Full Information Model
(2 year lag) (1) (2) (3) (4) (5)
Corporate Governance Measures Corporation 6.346***
4.565*** 4.055***
(0.268)
(0.191) (0.171)
Delaware 51.14***
40.37***
(1.579)
(1.297)
Name-Based Measures Short Name
3.160***
2.862*** 2.478***
(0.101)
(0.0939) (0.0836)
Eponymous
0.161***
0.270*** 0.298***
(0.0160)
(0.0270) (0.0298)
Intellectual Property Measures Patent
71.97***
(3.249)
Trademark
10.94***
5.014***
(0.888)
(0.335)
Patent - Delaware Interaction Delaware Only
44.70***
(3.161)
Patent Only
35.34***
(1.257)
Patent and Delaware
196.4***
(10.66)
US CMP Cluster Dummies Local
0.705*** 0.755***
(0.0432) (0.0468)
Traded Resource Intensive
1.292*** 1.283***
(0.0507) (0.0512)
Traded
1.145*** 1.256***
(0.0380) (0.0426)
US CMP High-Tech Clusters Biotechnology
3.139*** 2.288***
(0.280) (0.221)
E-Commerce
1.255*** 1.136*
(0.0638) (0.0591)
IT
2.401*** 1.971***
(0.123) (0.104)
Medical Devices
1.100 0.886
(0.0663) (0.0551)
Semiconductors
3.025*** 1.835*** (0.480) (0.313) (Continues on next page)

49
(Table 3: Continued from prior page) State Fixed Effects
Alaska 0.465 0.179 0.220 0.461 0.481
(0.465) (0.179) (0.221) (0.461) (0.481)
California 2.854*** 2.937*** 2.668*** 2.652*** 2.320***
(0.217) (0.222) (0.204) (0.203) (0.179)
Florida 0.642*** 0.392*** 0.447*** 0.685*** 0.706***
(0.0574) (0.0339) (0.0390) (0.0613) (0.0636)
Georgia 1.229* 0.669*** 0.754** 1.282* 1.263*
(0.125) (0.0665) (0.0756) (0.130) (0.129)
Idaho 0.965 0.333*** 0.394*** 0.832 0.741
(0.245) (0.0842) (0.0997) (0.212) (0.190)
Massachusetts 2.226*** 2.970*** 2.520*** 1.999*** 1.763***
(0.194) (0.257) (0.224) (0.175) (0.158)
Michigan 0.503*** 0.388*** 0.466*** 0.483*** 0.513***
(0.0562) (0.0432) (0.0522) (0.0541) (0.0577)
Missouri 0.917 0.435*** 0.531*** 0.855 0.850
(0.124) (0.0583) (0.0714) (0.116) (0.116)
New York 0.744*** 0.793** 0.940 0.741*** 0.777**
(0.0637) (0.0675) (0.0808) (0.0638) (0.0673)
Oklahoma 1.614*** 0.651** 0.828 1.470** 1.461**
(0.228) (0.0905) (0.116) (0.208) (0.208)
Oregon 1.608*** 0.730* 0.791 1.565** 1.424**
(0.218) (0.0976) (0.106) (0.213) (0.195)
Texas 2.525*** 1.757*** 1.795*** 2.404*** 2.289***
(0.204) (0.140) (0.145) (0.194) (0.187)
Vermont 0.0901*** 0.294** 0.292** 0.0950*** 0.110***
(0.0374) (0.122) (0.121) (0.0395) (0.0458)
Washington 1 1 1 1 1
(.) (.) (.) (.) (.)
Wyoming 0.420* 0.975 1.121 0.430* 0.492
(0.175) (0.405) (0.468) (0.180) (0.206)
N 12162777 12162777 12162777 12162777 12162777 pseudo R-sq 0.210 0.060 0.130 0.235 0.272
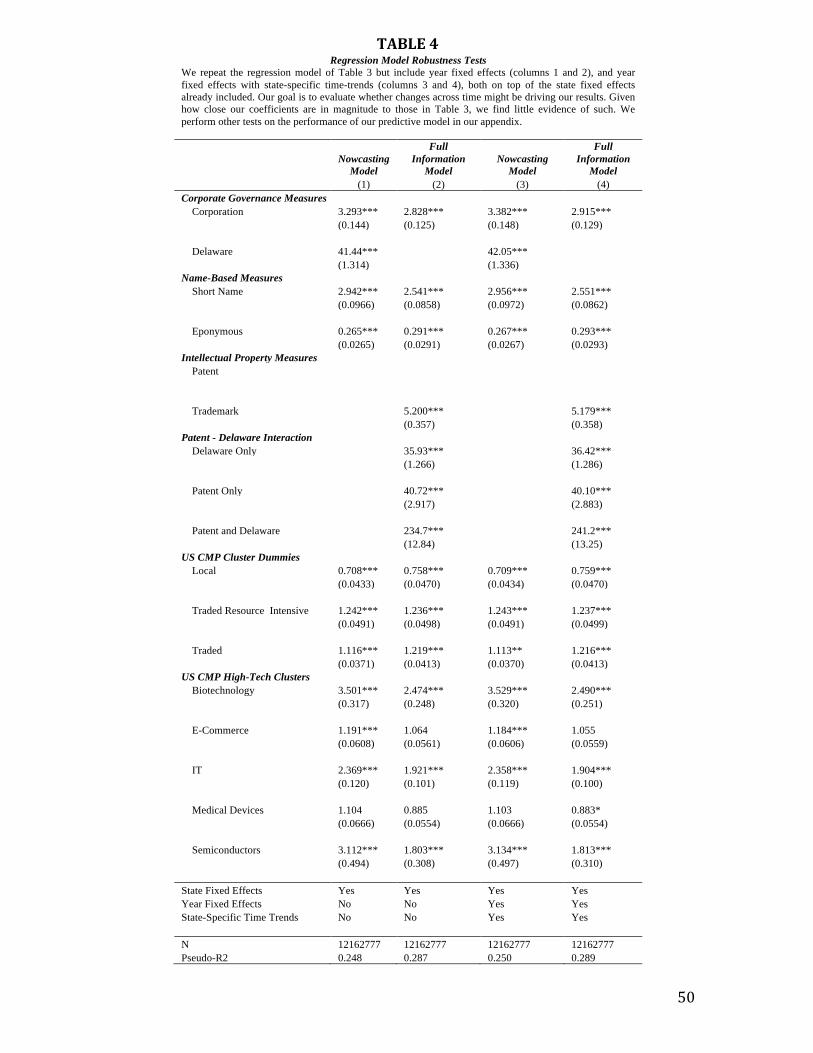
50
TABLE 4 Regression Model Robustness Tests
We repeat the regression model of Table 3 but include year fixed effects (columns 1 and 2), and year fixed effects with state-specific time-trends (columns 3 and 4), both on top of the state fixed effects already included. Our goal is to evaluate whether changes across time might be driving our results. Given how close our coefficients are in magnitude to those in Table 3, we find little evidence of such. We perform other tests on the performance of our predictive model in our appendix.
Nowcasting Model
Full Information
Model Nowcasting
Model
Full Information
Model (1) (2) (3) (4)
Corporate Governance Measures Corporation 3.293*** 2.828*** 3.382*** 2.915***
(0.144) (0.125) (0.148) (0.129)
Delaware 41.44***
42.05***
(1.314)
(1.336)
Name-Based Measures Short Name 2.942*** 2.541*** 2.956*** 2.551***
(0.0966) (0.0858) (0.0972) (0.0862)
Eponymous 0.265*** 0.291*** 0.267*** 0.293***
(0.0265) (0.0291) (0.0267) (0.0293)
Intellectual Property Measures Patent
Trademark
5.200***
5.179***
(0.357)
(0.358)
Patent - Delaware Interaction Delaware Only
35.93***
36.42***
(1.266)
(1.286)
Patent Only
40.72***
40.10***
(2.917)
(2.883)
Patent and Delaware
234.7***
241.2***
(12.84)
(13.25)
US CMP Cluster Dummies Local 0.708*** 0.758*** 0.709*** 0.759***
(0.0433) (0.0470) (0.0434) (0.0470)
Traded Resource Intensive 1.242*** 1.236*** 1.243*** 1.237***
(0.0491) (0.0498) (0.0491) (0.0499)
Traded 1.116*** 1.219*** 1.113** 1.216***
(0.0371) (0.0413) (0.0370) (0.0413)
US CMP High-Tech Clusters Biotechnology 3.501*** 2.474*** 3.529*** 2.490***
(0.317) (0.248) (0.320) (0.251)
E-Commerce 1.191*** 1.064 1.184*** 1.055
(0.0608) (0.0561) (0.0606) (0.0559)
IT 2.369*** 1.921*** 2.358*** 1.904***
(0.120) (0.101) (0.119) (0.100)
Medical Devices 1.104 0.885 1.103 0.883*
(0.0666) (0.0554) (0.0666) (0.0554)
Semiconductors 3.112*** 1.803*** 3.134*** 1.813***
(0.494) (0.308) (0.497) (0.310)
State Fixed Effects Yes Yes Yes Yes Year Fixed Effects No No Yes Yes State-Specific Time Trends No No Yes Yes
N 12162777 12162777 12162777 12162777 Pseudo-R2 0.248 0.287 0.250 0.289
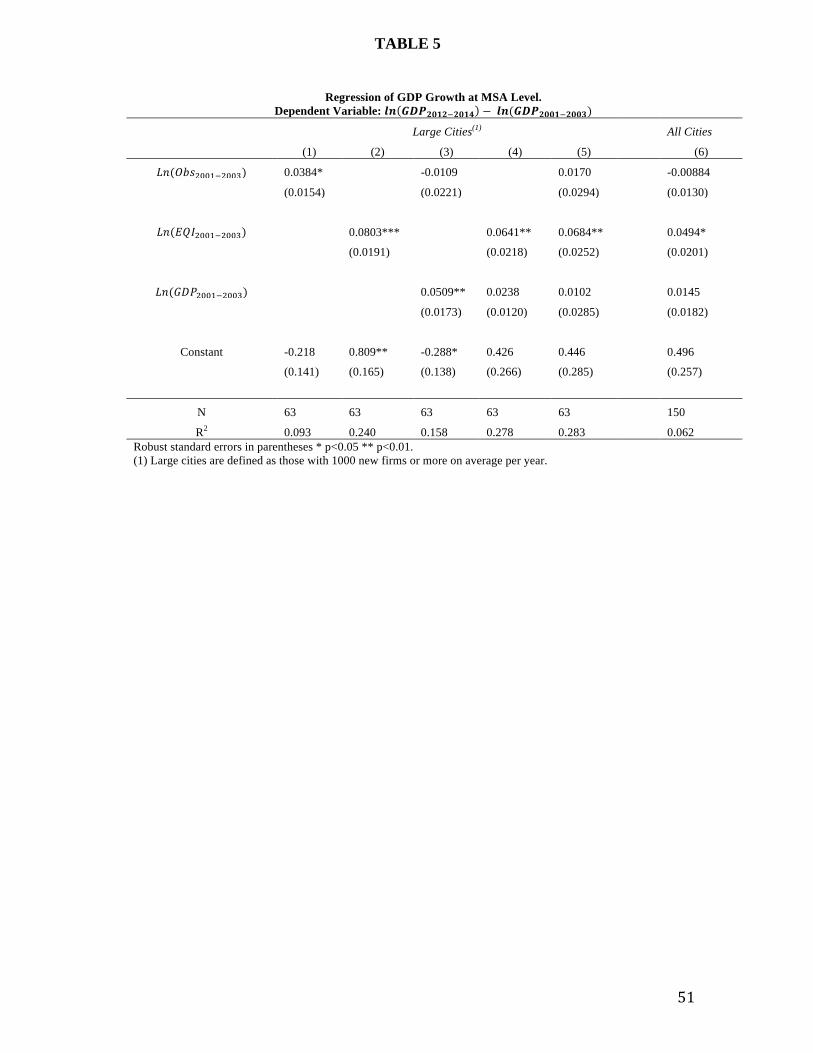
51
TABLE 5
Regression of GDP Growth at MSA Level. Dependent Variable: 𝒍𝒏 𝑮𝑫𝑷𝟐𝟎𝟏𝟐!𝟐𝟎𝟏𝟒 − 𝒍𝒏(𝑮𝑫𝑷𝟐𝟎𝟎𝟏!𝟐𝟎𝟎𝟑)
Large Cities(1) All Cities
(1) (2) (3) (4) (5) (6)
𝐿𝑛(𝑂𝑏𝑠!""#!!""#) 0.0384*
-0.0109
0.0170
-0.00884
(0.0154)
(0.0221)
(0.0294)
(0.0130)
𝐿𝑛(𝐸𝑄𝐼!""#!!""#)
0.0803***
0.0641** 0.0684**
0.0494*
(0.0191)
(0.0218) (0.0252)
(0.0201)
𝐿𝑛(𝐺𝐷𝑃!""#!!""#)
0.0509** 0.0238 0.0102
0.0145
(0.0173) (0.0120) (0.0285)
(0.0182)
Constant -0.218 0.809** -0.288* 0.426 0.446
0.496
(0.141) (0.165) (0.138) (0.266) (0.285)
(0.257)
N 63 63 63 63 63 150
R2 0.093 0.240 0.158 0.278 0.283 0.062 Robust standard errors in parentheses * p<0.05 ** p<0.01. (1) Large cities are defined as those with 1000 new firms or more on average per year.

FIGURE 1
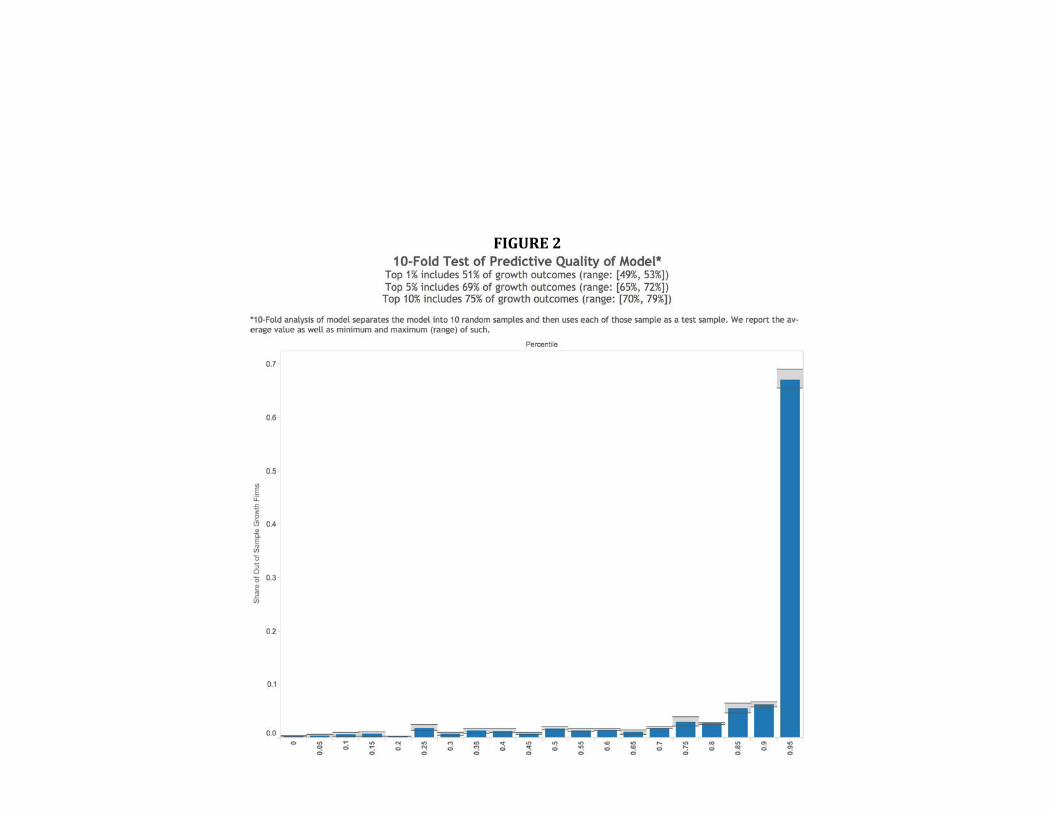
53
FIGURE 2
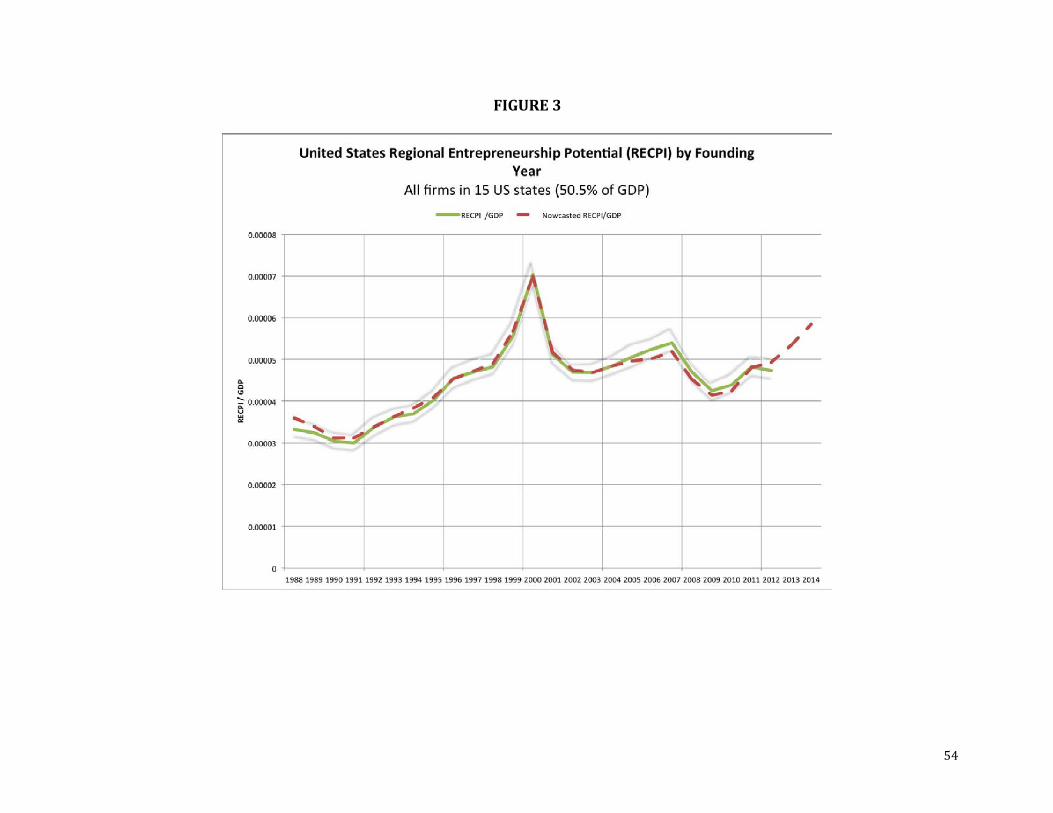
54
FIGURE 3
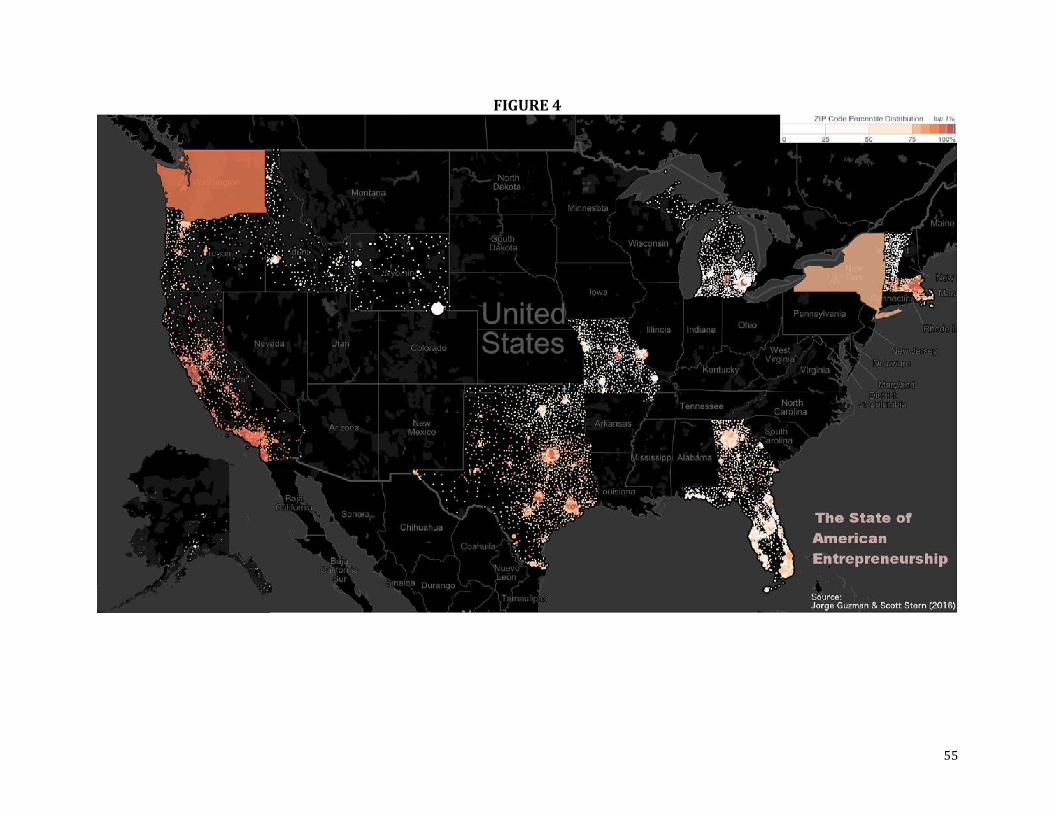
55
FIGURE 4

56
FIGURE 5
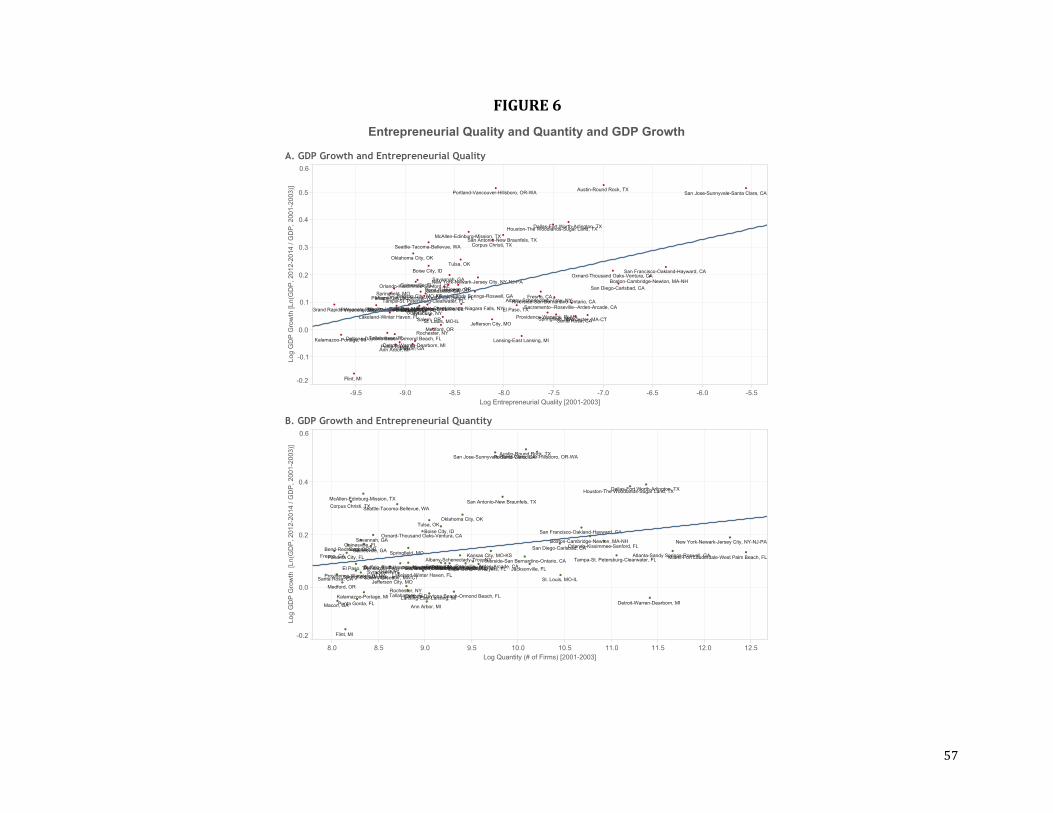
57
FIGURE 6

58
FIGURE 7

59
FIGURE 8A

60
FIGURE 8B

61
FIGURE 8C

The State of American Entrepreneurship:
New Estimates of the Quantity and Quality of Entrepreneurship for 15 US States, 1988-2014
Jorge Guzman, MIT Scott Stern, MIT and NBER

63
APPENDIX A
Modeling Entrepreneurial Quality Through Governance Choices.
We begin our framework by developing a simple model to map early firm choices
observable in business registration records to the underlying quality and potential of the firm.
Our goal with this model is suggestive: its purpose is to provide clarity on the intuition through
which we can use ex-ante firm choices and ex-post growth outcomes to measure underlying firm
quality27.
Suppose a firm has positive quality at birth, 𝑞 ∈ ℝ!. This quality creates firm value
𝑉(𝑞), a measure of the net-present value of its opportunities, which is also positive and
increasing in 𝑞 (i.e. !"!"> 0). Both quality and value are unobservable to the analyst.
At birth, the firm must choose whether to use each of N independent binary governance
options. These governance options reflect early choices that must be done around the birth of a
firm such as whether to register as a corporation, whether to register locally or in Delaware, or
the name of the firm28. The firm thus much choose a set 𝐻 = ℎ!,… , ℎ! , ℎ! ∈ 0,1 ∀ℎ!.
Each option offers benefit 𝑏(𝑞, ℎ). The benefit is increasing in ℎ, and the marginal
benefit is also increasing in 𝑞. The option also has constant cost 𝑐(ℎ) plus an idiosyncratic
component that is uncorrelated with quality and specific to this firm and option. This
idiosyncratic component represents the different costs entrepreneurs could face due to
heterogeneous preferences, institutional variation across corporate registries, local institutions
(e.g. available financing), and firm characteristics (e.g. industry). Therefore:
Benefit of h is 𝑏 𝑞, ℎ
27 We model the governance decisions of firms in a sophisticated model in Guzman and Stern (mimeo). 28 In this model, we focus on corporate governance options only, but the model naturally applies to other firm choices
such as patenting, registering trademarks, and any other observable at birth.

64
𝜕𝑏𝜕ℎ ≥ 0 ,
𝜕!𝑏𝜕ℎ𝜕𝑞 ≥ 0
Cost of h is 𝐶 𝑞, ℎ = 𝐶 ℎ = 𝑐 ℎ + 𝜖
𝐸 𝜖 = 0, 𝐸 𝜖𝑞 = 0
The Entrepreneur’s Problem. The entrepreneur maximizes the value of the firm given the firm’s
quality, the available choices, and the idiosyncratic components:
𝐻∗ = argmax!! !!,…,!!
𝑉 𝑞 + [𝑏 𝑞, ℎ! − 𝑐 ℎ! − 𝜖!]!
!!!
Since these choices are binary, the entrepreneur takes option ℎ! if 𝑏 𝑞, ℎ! ≥ 𝑐 ℎ! + 𝜖!.
In this problem, for a given 𝑞 and a given menu of governance choices, different values
of 𝐻∗ will occur. Since alx`l firms face the same set of options by assumption, the values of 𝐻∗
will differ only due to 𝑞 . Our goal is to understand what can be learned about true
entrepreneurial quality q by looking at these choices.
Our first proposition studies how the value of 𝐻∗ changes as 𝑞 changes.
Proposition 1: 𝐸[𝐻∗] is weakly increasing in 𝑞.
Proof. First, note that the term 𝑉(𝑞) does not matter in the entrepreneur’s problem, as it
is constant given an original value of 𝑞 . Therefore, the entrepreneur only maximizes
[𝑏 𝑞, ℎ! − 𝑐 ℎ! − 𝜖!]!!!! , where the only terms that depend on 𝑞 are 𝑏 𝑞, ℎ! . Since the
marginal return to each ℎ! is increasing in 𝑞 (i.e. !!!
!!!"≥ 0), then, for any two values 𝑞!! > 𝑞′ ,
𝑃 𝑏 𝑞′′,ℎ! ≥ 𝑐 ℎ! + 𝜖! ≥ 𝑃[𝑏 𝑞!, ℎ! ≥ 𝑐 ℎ! + 𝜖!] which implies 𝐸 𝐻∗ 𝑞!! ≥ 𝐸[𝐻∗|𝑞!] .
QED
The relationship between 𝐻∗ and 𝑞 , in which the early entrepreneurial choices are

65
determined in part by the firm quality, is the key insight on which we build our empirical
approach. Entrepreneurs must make choices early on, and they do so given their own potential
and intentions for firm growth (their quality) as well as some idiosyncrasies. These choices, in
turn, are observable in public records such as corporate registries, patent databases, or media, to
name a few, and observing them for a firm can allow us to separate firms into different quality
groups. To learn how we can do that we add more structure.
Firm growth outcomes. While the analyst cannot observe firm quality or value, we
assume she is able to observe a growth outcome 𝑔, such as employment, IPO, or revenue with a
lag. This growth outcome is more likely at higher values of 𝑉(𝑞), such that 𝐸 𝑔 𝑞 is increasing
in 𝑞, exhibiting first order stochastic dominance.
Since 𝐸[𝐻∗|𝑞] is also increasing in 𝑞 and is first order stochastic dominant, it follows
from the transitivity of first order stochastic dominance (see Hadar and Russell, 1971) that
𝐸[𝑔|𝐻∗] is also exhibits first order stochastic dominance in q.
Lemma 1 (𝐄[𝐠|𝐇∗] is an increasing function of q): For any two 𝑞!! > 𝑞′, if 𝐻∗(𝑞) is a solution
to the Entrepreneur’s Problem, 𝐸 𝑔 𝐻∗ 𝑞!! ≥ 𝐸[𝑔|𝐻∗(𝑞′)]
Proof. See above.
Now, consider a mapping 𝑓!! which estimates the expected value of growth given 𝐻∗,
𝑓!! 𝑔,𝐻 → 𝜃. Then, if 𝜃 is the expected value of 𝑔 given 𝐻∗, then 𝜃 identifies a monotonic
function of 𝑞.
Proposition 2 (Mapping g and H to Quality): If a mapping 𝑓!! 𝑔,𝐻 → 𝜃 is an estimate of
𝐸 𝑔 𝐻∗ , and 𝐻∗ is a solution to the Entrepreneur’s Problem, then 𝜃 is a monotonic function of
𝑞.
Proof: The proof is simple, since Lemma 1 shows that all mappings 𝐸 𝑔 𝐻∗ 𝑞 are monotonic

66
in 𝑞, then if the value we use of 𝐻∗ is a solution to the entrepreneur’s maximization problem,
then the values from function 𝑓!! also need to be monotonic in 𝑞.

67
APPENDIX B
DATA APPENDIX

68
I. Overview of Data Appendix
This data appendix to the paper The State of American Entrepreneurship, by Jorge Guzman
and Scott Stern, outlines in detail the use of business registration records in the United States, the
steps and decisions we took when converting those records into measures for analysis, and
robustness tests we ran to validate the potential for bias both due to specific assumptions about
each measure as well as heterogeneity in our sample across geography and time. It serves the
dual purpose of serving as an introduction for future users of business registration data while also
providing detailed robustness verification and explaining the logic of specific decisions on many
aspects of our data.
Section II of this appendix explains the development of our measures and dataset, including
how we matched multiple datasets for analysis, how we built our measures using the merged
dataset, and the economic rationale for the production of each one. Section III explains the
differences between business registration records across the United States, their ease of access,
and variation in the data they provide. It also highlights the potential for bias given the time
when different data is observe (i.e. whether we observe the most recent value of a business or the
original one) and performs numerous robustness tests to rule out the potential for bias driving our
results given these differences. Section IV analyzes the potential for bias in our aggregate RECPI
with a focus on guaranteeing that the predictive value of our indexes is high across geographies
and time, and is not driven by a particularly large startup period (e.g. the dot-com bubble) nor
driven by a particular area with many growth startups (e.g. Silicon Valley).

69
II. Using Business Registration Records to Find Signals of Quality
Our data set is drawn from the complete set of business registrants in twelve states from
1988 to 2014. Our analysis draws on the complete population of firms satisfying one of the
following conditions: (i) a for-profit firm whose jurisdiction is in the source state or (ii) a for-
profit firm whose jurisdiction is in Delaware but whose principal office address is in the state.
The resulting data set is composed of 18,145,359 observations. For each observation, we
construct variables related to (i) the growth outcome for the startup, (ii) measures based on
business registration observables and (iii) measures based on external observables that can be
linked to the startup.
Growth outcome. The growth outcome utilized in this paper, Growth, is a dummy
variable equal to 1 if the startup achieves an initial public offering (IPO) or is acquired at a
meaningful positive valuation within 6 years of registration. Both outcomes, IPO and
acquisitions, are drawn from Thomson Reuters SDC Platinum29. Although the coverage of IPOs
is likely to be nearly comprehensive, the SDC data set excludes some acquisitions. However,
although the coverage of significant acquisitions is not universal in the SDC data set, previous
studies have “audited” the SDC data to estimate its reliability, finding a nearly 95% accuracy
(Barnes, Harp, and Oler, 2014). We observe 5,187 positive growth outcomes for the 1988–2008
start-up cohorts), yielding a mean for Growth of 0.0004. In our main results, we assign
acquisitions with an unrecorded acquisitions price as a positive growth outcome, because an
evaluation of those deals suggests that most reported acquisitions were likely in excess of $5
29 Thomson Reuters’s SDC Platinum is a commonly used database of financial information. More details are available
at http://thomsonreuters.com/sdc-platinum/

70
million. We perform a series of robustness tests on different outcomes in the next section of this
data appendix.
Start-up characteristics. The core of the empirical approach is to map growth outcomes
to observable characteristics of start-ups at or near the time of business registration. We develop
two types of measures: (i) measures based on business registration observables and (ii) measures
based on external indicators of start-up quality that are observable at or near the time of business
registration. We review each of these in turn.
Measures based on business registration observables. We construct six measures of start-
up quality based on information directly observable from the business registration record. First,
we create binary measures related to how the firm is registered, including corporation, whether
the firm is a corporation (rather than partnership or LLC) and Delaware jurisdiction, whether the
firm is incorporated in Delaware. Corporation is an indicator equal to 1 if the firm is registered
as a corporation and 0 if it is registered either as an LLC or partnership.30 In the period of 1988
to 2008, 0.06% of corporations achieve a growth outcome versus only 0.01% of noncorporations.
Delaware jurisdiction is equal to 1 if the firm is registered under Delaware, but has its main
office in the source state (all other foreign firms are dropped before analysis). Delaware
jurisdiction is favorable for firms which, due to more complex operations, require more certainty
in corporate law, but it is associated with extra costs and time to establish and maintain two
registrations. Between 1988 and 2998, 2.8% of the sample registers in Delaware; 57% of firms
achieving a growth outcome do so.
Second, we create four measures that are based on the name of the firm, including a
measure associated with whether the firm name is eponymous (named after the founder), is short
30 Previous research highlights performance differences between incorporated and unincorporated
entrepreneurs (Levine and Rubinstein, 2013).

71
or long, is associated with local industries (rather than traded), or is associated with a set of high-
technology industry clusters.
Drawing on the recent work of Belenzon, Chatterji, and Daley (2014) (BCD), we use the
firm and founder name to establish whether the firm name is eponymous (i.e., named after one or
more of the founders). Eponymy is equal to 1 if the first, middle, or last name of the top
managers is part of the name of the firm itself.31 We require names be at least four characters to
reduce the likelihood of making errors from short names. Our results are robust to variations of
the precise calculation of eponymy (e.g., names with a higher or lower number of minimum
letters). We have also undertaken numerous checks to assess the robustness of our name
matching algorithm. 9.4% of the firms in our training sample are eponymous [an incidence rate
similar to BCD], though less than 2% for whom Growth equals one. It is useful to note that,
while we draw on BCD to develop the role of eponymy as a useful start-up characteristic, our
hypothesis is somewhat different than BCD: we hypothesize that eponymous firms are likely to
be associated with lower entrepreneurial quality. Whereas BCD evaluates whether serial
entrepreneurs are more likely to invest and grow companies which they name after themselves,
we focus on the cross-sectional difference between firms with broad aspirations for growth (and
so likely avoid naming the firm after the founders) versus less ambitious enterprises, such as
family-owned “lifestyle” businesses.
Our second measure relates to the length of the firm name. Based on our review of
naming patterns of growth-oriented start-ups versus the full business registration database, a
striking feature of growth-oriented firms is that the vast majority of their names are at most two
words (plus perhaps one additional word to capture organizational form (e.g., “Inc.”). Companies
31For corporations, we consider top managers only the current president, for partnerships and LLCs, we allow for any of the two listed managers. The corporation president and two top partnership managers are listed in the business registration records themselves.

72
such as Google or Spotify have sharp and distinctive names, whereas more traditional businesses
often have long and descriptive names (e.g., “Green Valley Home Health Care & Hospice,
Inc.”). We define short name to be equal to one if the entire firm name has three of less words,
and zero otherwise. 46% of firms within the 1988-2008 period have a short name, but the
incidence rate among growth firms is more than 76%. We have also investigated a number of
other variants (allowing more or less words, evaluating whether the name is “distinctive” (in the
sense of being both noneponymous and also not an English word). While these are promising
areas for future research, we found that the three-word binary variable provides a useful measure
for distinguishing entrepreneurial quality.
We then create four measures based on how the firm name reflects the industry or sector
that the firm within which the firm is operating. To do so, we take advantage of two features of
the US Cluster Mapping Project (Delgado, Porter, and Stern, 2016), which categorizes industries
into (a) whether that industry is primarily local (demand is primarily within the region) versus
traded (demand is across regions) and (b) among traded industries, a set of 51 traded clusters of
industries that share complementarities and linkages. We augment the classification scheme
from the US Cluster Mapping Project with the complete list of firm names and industry
classifications contained in Reference USA, a business directory containing more than 10 million
firm names and industry codes for companies across the United States. Using a random sample
of 1.5 million Reference USA records, we create two indices for every word ever used in a firm
name. The first of these indices measures the degree of localness, and is defined as the relative
incidence of that word in firm names that are in local versus non-local industries (i.e., ρ! =
![!! ⊆ !"#$!]!!{!"#!" !"#$%}
![!! ⊆ !"#$!]!!{!"!!!"#$! !"#$%} ). We then define a list of Top Local Words, defined as those words
that are (a) within the top quartile of ri and (b) have an overall rate of incidence greater than

73
0.01% within the population of firms in local industries (see Guzman and Stern, (2015, Table
S10) for the complete list). Finally, we define local to be equal to one for firms that have at least
one of the Top Local Words in their name, and zero otherwise. We then undertake a similar
exercise for the degree to which a firm name is associated with a traded name. It is important to
note that there are firms which we cannot associate either with traded or local and thus leave out
as a third category. Just more than 19% of firms have local names, though only 5.6% of firms
for whom growth equals one, and while 55% of firms are associated with the traded sector, 64%
of firms for whom growth equals one do.
We additionally examine the type of traded cluster a firm is associated with, focusing in
particular on whether the firm is in a high-technology cluster or a cluster associated with
resource intensive industries. For our high technology cluster group (Traded High Technology),
we draw on firm names from industries include in ten USCMP clusters: Aerospace Vehicles,
Analytical Instruments, Biopharmaceuticals, Downstream Chemical, Information Technology,
Medical Devices, Metalworking Technology, Plastics, Production Technology and Heavy
Machinery, and Upstream Chemical. From 1988 to 2008, while only 5% firms are associated
with high technology, this rate increases to 16% within firms that achieve our growth outcome.
For our resource intensive cluster group, we draw on firms names from fourteen USCMP
clusters: Agricultural Inputs and Services, Coal Mining, Downstream Metal Products, Electric
Power Generation and Transmission, Fishing and Fishing Products, Food Processing and
Manufacturing, Jewelry and Precious Metals, Lighting and Electrical Equipment, Livestock
Processing, Metal Mining, Nonmetal Mining, Oil and Gas Production and Transportation,
Tobacco, Upstream Metal Manufacturing. While 14% of firms are associated with resource
intensive industries, and 17% amongst growth firms.

74
Finally, we also repeat the same procedure to find firms associated with more narrow sets
of clusters that have a closer linkage to growth entrepreneurship in the United States. We
specifically focus on firms associated to Biotechnology, E-Commerce, Information Technology,
Medical Devices and Semiconductors. It is important to note that these definitions are not
exclusive and our algorithm could associate firms with more than one industry group. For
Biotechnology (Biotechnology Sector), we use firm names associated with the US CMP
Biopharmaceuticals cluster. While only 0.19% of firms are associated with Biotechnology, this
number increases to 3% amongst growth firms. For E-commerce (E-Commerce Sector) we focus
on firms associated with the Electronic and Catalog Shopping sub-cluster within the Distribution
and Electronic Commerce cluster. And while 5% of all firms are associated with e-commerce,
the rate is 9.5% for growth firms. For Information Technology (IT Sector), we focus on firms
related to the USCMP cluster Information Technology and Analytical Instruments. 2.4% of all
firms in our sample are associated with IT, and 13% of all growth firms are identified as IT-
related. For Medical Devices (Medical Dev. Sector), we focus on firms associated with the
Medical Devices cluster. We find that while 3% of all firms are in medical devices, this number
increases to 9% within growth firms. Finally, for Semiconductors (Semiconductor Sector), we
focus on the sub-cluster of Semiconductors within the Information Technology and Analytical
Instruments cluster. Though only 0.05% of all firms are associated with semiconductors, 1% of
growth firms are.
Measures based on external observables. We construct two measures related to start-up
quality based on information in intellectual property data sources. Although this paper only
measures external observables related to intellectual property, our approach can be utilized to

75
measure other externally observable characteristics that may be related to entrepreneurial quality
(e.g., measures related to the quality of the founding team listed in the business registration, or
measures of early investments in scale (e.g., a Web presence).
Building on prior research matching business names to intellectual property
(Balasubramanian and Sivadasan, 2009; Kerr and Fu, 2008), we rely on a name-matching
algorithm connecting the firms in the business registration data to external data sources.
Importantly, because we match only on firms located in California, and because firms names
legally must be “unique” within each state’s company registrar, we are able to have a reasonable
level of confidence that any “exact match” by a matching procedure has indeed matched the
same firm across two databases. In addition, our main results use “exact name matching” rather
than “fuzzy matching”; in small-scale tests using a fuzzy matching approach [the Levenshtein
edit distance (Levenshtein, 1965)], we found that fuzzy matching yielded a high rate of false
positives due to the prevalence of similarly named but distinct firms (e.g., Capital Bank v.
Capitol Bank, Pacificorp Inc v. Pacificare Inc.).
Our matching algorithm works in three steps.
First, we clean the firm name by:
• expanding eight common abbreviations (“Ctr.”, “Svc.”, “Co.”, “Inc.”, “Corp.”, “Univ.”,
“Dept.”, “LLC.”) in a consistent way (e.g., “Corp.” to “Corporation”)
• removing the word “the” from all names
• replacing “associates” for “associate”
• deleting the following special characters from the name: . | ’ ” - @ _

76
Second, we create measures of the firm name with and without the organization type, and with
and without spaces. We then match each external data source to each of these measures of the
firm name. The online appendix contains all of the data and annotated code for this procedure.
This procedure yields two variables. Our first measure of intellectual property captures
whether the firm is in the process of acquiring patent protection during its first year of activity.
Patent is equal to 1 if the firm holds a patent application in the first year. All patent applications
and patent application assignments are drawn from the Google U.S. Patent and Trademark Office
(USPTO) Bulk Download archive. We use patent applications, rather than granted patents,
because patents are granted with a lag and only applications are observable close to the data of
founding. Note that we include both patent applications that were initially filed by another entity
(e.g., an inventor or another firm), as well as patent applications filed by the newly founded firm.
While only 0.2% of the firms in 1988–2008 have a first-year patent, 21% of growth firms do.
Our second intellectual property measure captures whether a firm registers a trademark
during its first year of business activity. Trademark is equal to 1 if a firm applied for a trademark
within the first year, and 0 otherwise. We build this measure from the Stata-ready trademark
DTA file developed by the USPTO Office of Chief Economist (Graham et al, 2013). Between
1988 and 2008, 0.12% of all firms register a trademark, while 8% of growth firms do.

77
III. Observing Entrepreneurship Across States using Business Registration
Records
III.A Business Registration Records State by State
While the act of registering a business is essentially the same across the United
States, and carries basically the same benefits, corporation registries do vary in their
internal operation across jurisdictions. While we have high confidence that firms register at
the same point in their lifespan independent of state, the exact information we are able to
get from each state is more nuanced. Business registration records vary in accessibility of
the data, fields available, the exact definition and information within each field, and ease of
use of data files. Each of these creates considerations in our use of business registration
files, and has shaped the definition of our final sample.
Though business registration records are a public record, access to full datasets of
registration records varies substantially in availability, cost and operational procedures
required to get the files. In one end of the spectrum, we found several states that posted
bulk data files publicly and allowed anonymous download of such files (Alaska, Florida,
Washington, Wyoming, and Vermont). There was also another set of states for which access
to these files required interfacing directly with the corporations office and filing some
forms, but the procedure to access the data was relatively straightforward, and the costs
where reasonable and appeared in line with a principle of trying to simply recuperate the
costs of an administrative task (California, Massachusetts, Ohio, and others). There were
other states that charged costs that we found higher than what would appear to be the

78
appropriate to cover an administrative cost, and while we decided to pay for some of those
in the low end (e.g. $1,250 for Texas) we avoided others that where substantially higher
(e.g. $59,773.42 for New Jersey). Finally some states appeared to be outright evasive on
fulfilling requests for data that is supposed to be public record, and suggested that either
providing such data was impossible for them (e.g. Wisconsin) or deflected multiple
attempts to contact individuals in their corporations division, through both phone and
email, to ask for the records (e.g. Illinois). In selecting our sample states, we tried to
balance ease of access with economic importance, spending extra effort to get the top 4 by
GDP (California, Texas, New York, and Florida). We do note, however, that there did not
appear to be any discernible pattern as to which states fell under different access regimes
for their registration data. In prior work (Guzman and Stern, 2015b) we have called on
business registration offices to open access to such data.
The state corporations offices also vary in the fields that they provide or that can be
generated from the information in their records. There were a number of fields which we
were only able to get for a small number of states, such as date the firm becomes inactive
(though most states record it, many where do not do consistently), firm industry, and
stated mission of the firm, and as such decided not to use these fields in our national
analysis even though their ability to explain growth seemed promising. There were also
states that did not have fields that are important in our analysis and had to be dropped. In
two cases (North Carolina and Ohio) we received the data from the corporations office but
found they did not record the jurisdiction of foreign firms (firms registered in a different
state), and we were unable to know which firms were from Delaware and which were from
other states. We decided to drop these two states from our analysis. For two other states

79
(New York and Washington) we found many firms had a missing address or had the
address of their registered agent rather than the firm. We were able to keep these states for
our national indexes, but unable to do any micro-‐geography analysis for them and included
a caveat in our national map (note that state-‐level indexes are not affected by this issue
since we do record the firm in the state correctly). Finally, not all states provided the
current manager or president of the firm, and as such we were unable to estimate eponymy
for all states and did not include it in the main prediction model.
The state corporation offices also differ in the exact specification of each field and
only provided exactly equivalent fields for jurisdiction and registration date in all states.
States vary, for example, in the specific set of corporate types that they allow. Specifically,
only some states include an extra type of corporation or LLC for trade services (e.g.
plumbing, law, etc) called a “Professional Corporation” or “Professional LLC”. While a
promising category, we are unable to take advantage of this extra categorization since it
doesn’t exist in all states, and instead only split into corporation and non-‐corporation firms
in our analysis. Within corporations, the share of firms that registers a corporation changed
through time due to the introduction of the LLC. LLC as a legal form was introduced at
different times in different states, and in some states the introduction occurs within our
sample years (for example, it was introduced in Massachusetts in 1995). As such, the role of
corporations varies across years with the main effect being adverse selection of low-‐quality
firms that would have registered as LLC but are instead corporations in the early years. We
view this as a bias that only works against our results and do not control for it. We are also
unable to differentiate between S-‐Corporations and C-‐Corporations since those are tax
statuses rather than legal forms, and corporations can change from one to the other year to

80
year. Finally, while non-‐profit status is also a tax status (e.g. as a 501(c) organization), all
states also allow firms to registered specifically as a non-‐profit corporation and we are
hence able to drop these firms (and the related benefit corporations, cemetery
corporations, religious corporations, and trusts) directly through registration data before
our analysis.
States also vary in the firm name information they provide. Only some states
provided the list of all names an entity has had (e.g. Massachusetts and Texas). For those
states, we are able to recover the original name of the firm and use such name when
matching to intellectual property records and when creating our name-‐based measures. In
cases where we did not have the original name, we used instead the current (provided)
name. Only one state (Massachusetts) provides information to recover the original address
of firms, and only for a subsample, while all other states only provide the current firm
address. We investigate the possibility of any bias that could incur in our analysis by using
the current address and firm name, rather than original ones, in the next section.
Furthermore, states only provide the name of the current president or manager, and not
the original firm founding, an issue we also evaluate in the next section.
Finally, states also vary in the ease of use of the data they provide, and no two states
provide the data in the same format. Some states provide simple comma-‐delimited files
that are easy to import in Stata, or fixed-‐length fields that can be imported through a Stata
dictionary, while other states provide lists of transaction records that then need to be pre-‐
processed through scripts that then produce the files that can be added to Stata.

81
III.B Estimating Potential Biases from Changes in Firm Location.
A main concern in our analysis is the potential of bias from changes in firm location.
The data we receive from business registries holds the current location of the firm, but our
goal in understanding entrepreneurial quality geography is to understand the initial
location of the firm. (Importantly this does not impact our firm-‐level quality estimates, and
hence we can analyze variation across different unbiased ex-‐ante quality levels of firms.)
Firms are likely to move for many reasons. Ex-‐ante better firms might be more likely to
start close to the center of an entrepreneurial cluster as it might have more value for the
local externalities and move out of high potential clusters if unsuccessful, while ex-‐post
successful firms (with lower quality ex-‐ante) might be more likely to move into such
clusters. The potential direction and effect of this bias is in principle unclear.
While we are unable to study the extent of this bias in all states, we are able to
perform a sub-‐sample study in Massachusetts. Using Massachusetts offers several
important benefits that support the robustness of any forthcoming conclusions. First, our
samples are beneficial: We are able to obtain two samples in Massachusetts that are almost
exactly two years apart (one from January 06, 2013, and one from November 24, 2014);
furthermore, a sample from January 2013 provides the earliest possible snapshot that
includes all 2012 firms (the most recent firms for which we estimate our full quality model,
and the data we use for our full US snapshot), and hence includes the address in the firm’s
actual registration. Second, Massachusetts requires firms to update their address (among
other things) in a yearly annual report guaranteeing we observe the new address for all
firms that move. In other states, such annual report is not necessary. If a firm doesn’t report
82
its new address, we would continue to observe the original business address even after it
moves, and our analysis will hold no bias. And third, the period we consider is a period in
which there is considerable geographic migration of high-‐quality firms within
Massachusetts, from Route 128 to the Cambridge and Boston area (see Guzman and Stern,
2015b for further details). Each of these details guarantees that our estimate is most likely
to be an upper bound, and the extent of bias identified in this analysis is, if anything, likely
to be lower in our national sample.
For this analysis, given that the ZIP Code is the smallest unit of geographic
measurement that we use in this paper, we focus all of our analysis in ZIP Code level
variation32. First, for each firm, we keep their 2013 ZIP Code (observed in January 06,
2013) their 2015 ZIP Code (observed in November 24, 2014). We also geocode each ZIP
Code to assess the distance of any geographic move and remove all firms that have an
invalid ZIP Code (e.g. due to typos)33. Finally, we estimate the leave-‐self-‐out quality of each
ZIP Code for each firm using the average quality of all firms from 1988-‐2012 in our sample
period.
We begin by documenting the extent to which a firm changes location at all. Table
A3 presents the rates of change in ZIP Code for each 2 year group in our data. The first
column indicates the age of the firm in 2013, when we first observe it, and the second
column the share of firms that stay in the same ZIP Code in the next to years for the group.
These estimates are not conditional on survival, and thus capture the share of total firms
that will change from one category to the next in the total sample (i.e. it controls for
32 This also helps protect from noise that could occur from “fuzzy” address matching approaches rather than exact ZIP
Code matching. 33 We consider all ZIP Codes we cannot geocode through the Google API to be invalid.
83
changes in survival probability), the quantity we are interested on. Firms under 4 years or
less (at 2013) are most likely to change address, with a probability of change between 2.4%
and 3.3%. This probability then drops quickly, and in the 26-‐year-‐old cohort the probability
of change is only 0.3%. Because our measure implicitly also includes likelihood of survival
at different cohorts, we can estimate the overall likelihood that a firm record will have a
different address after N years by simply doing the running product of the probability of
same ZIP Code (under the assumption the migration dynamics have been the same
historically). Column 4 includes this result. For the cohort of 10 year old firms, we estimate
88% of the records to still contain the original ZIP Code, and for 26 year old firms we
estimate this share at 83%. We repeat this exercise with only the top 10% of quality firms
in the distribution. While the likelihood of change of ZIP Code for a high quality firm is
higher, even within this group, we estimate 76% of records still contain the original ZIP
Code by 10 years and 72% by 26 years. In unreported tests, we find the share of firms that
move in the top 1% is not meaningfully higher than the top 10%.
In our paper, most of our micro-‐geography results are done based on spatial
visualizations. We therefore would also like to know how far are the firms moving. If firms
are moving to contiguous ZIP Codes around the same high quality cluster, perhaps due to
small relocations or even ZIP Code redistricting, then the impact of those moves on our
maps is small. On the contrary, if they move over large distances, then the impact is large.
Using geocodings for each ZIP Code we estimate the distance of each ZIP code to another.
We find 25% of all firms move less than 4 miles (25th percentile is 3.8), 50% of all firm
moves are on less than 8 miles (50th percentile is 7.8), and 90% of all moves are 35 miles or
84
less (90th percentile is 35.24). The top 10% has a similar median (6.8) though higher
variance (90th percentile is 330 miles).
Finally, any firm movement across ZIP Codes can only bias our results if it is
systematic. If the moves are instead random, then average ZIP Code quality (our measure)
would be constant even after there is firm migration. We estimate the difference in ZIP
Code quality before and after a firm move (ZIP Code quality is estimated using all firms in
that ZIP Code in November 24, 2014, without the moving firm included in either the source
of destination ZIP Codes), and present a histogram of this measure in Figure A2. This
difference in ZIP Code quality has a mean and median both basically centered at zero,
therefore suggesting these moves are unbiased.
As a final test, we investigate whether this difference can vary by firm quality or age
– i.e. if firms of higher or lower quality (or age) can systematically move to higher or lower
average quality ZIP Codes. To do so, we run an OLS regression of firm quality on difference
in ZIP Code (both in natural logs to account for the substantial skewness in entrepreneurial
quality measures and be able to interpret this as an elasticity). The coefficient is .017 with
a p-‐value of .27 using robust standard errors and an R2 of .0005. This effect is (basically)
indistinguishable from zero. We also regress log-‐age on difference in ZIP Code quality to get
a coefficient of -‐.016 with a p-‐value of .40 and and R2 of .0002.
III.C Analyzing Other Potential Sources of Bias in the Use of Business Registration Records
We now turn to analyzing the potential for bias in our estimates due to the specific
nature of our sample. We specifically comment on six specific areas where there exists the
possibility of bias: the impact of unobserved name changes, the role of re-‐incorporations on

85
our data, the impact of spin-‐offs vs new firms, changes of ownership, changes in firm
location, and the role of subsidiaries as separate corporate entities. We review each one in
turn.
Name changes. As mentioned in section I of this appendix, we receive the original
name for only some states in our dataset and only the current name in the rest of the states.
While changes in name that correlate to growth could bias the relationship between our
name-‐based measures and growth, it is unlikely to bias our most important measures.
Specifically, changes in name cannot impact firm legal type (corporations vs non-‐
corporations) or firm jurisdiction (Delaware). Our name-‐matching algorithm to match
patents and trademarks uses firm names and assumes that the name we use is the same
name as in the patent. While this can result in bias, it is only a bias that would work against
our results – since we look for patents around the registration date, we can have false
negatives for firms where we are looking for the wrong (new) name in the patent record
but the firm had a previous name, but false positives are much less likely. These
governance and intellectual property measures are, in fact, the most important in our
study, and we find the fact that they cannot be affected by name changes assuring. Perhaps
a risk in using only original names in some states is that the rate of false negatives will
change depending on states. In unreported robustness tests, we have found the variation in
results from using always the final name for all states (and hence implicitly having the
same bias for all states) to be immaterial for our results.
Change of Ownership. Our dataset differs from other datasets in what is a firm and
how it changes depending on ownership. The Longitudinal Business Database is built using
tax records from corporate entities. As such, establishments that change ownership might
86
bias the sample in different way and users of this data take substantial care to make sure
changes in ownership do not drive their results (e.g. see the data appendix of Decker,
Haltiwanger, Jarmin, and Miranda, 2014). Our data is different. Changes in ownership do
not affect the registered firm and, unless the firm is closed down and re-‐incorporated,
changes in ownership do not change anything in registration records.
The potential for re-‐incorporations. We argue in our analysis that we identify the
extent to which firms are born with different quality, which is observed to the
entrepreneur. An alternative hypothesis would be that entrepreneurs change their firm
type once they observe their potential, at which point they re-‐incorporate the firm
differently (e.g. as a Delaware corporation). To study the possibility of this bias we take
advantage of institutional details of the process through which firms re-‐incorporate to
observe the instances when it occurs. When a low potential firm (e.g. a Massachusetts LLC)
re-‐incorporates as a high quality firm (e.g. a Delaware corporation), it is done in two steps.
First, a new firm is registered under the high quality regime; then, the old firm is merged
into the new firm so that the new firm holds the old firm’s assets and other matters (note
that it is not possible to just “convert” the firm among firm types without creating a new
target firm).
Once again, we use our Massachusetts data, which also includes a list of all mergers
that have occurred among registered firms and the date of each merger. Obviously, firms
can merge for many reasons and re-‐incorporation is only one of them. We create a measure
Re-‐registration, which is equal to 1 only when the target firm was registered close to the
merger date (90 days window). The facts we identify are included in Table A4. We review
each in turn.
87
We identify a total of 7,485 mergers where the target firm is in Massachusetts (we
drop all other firms earlier in our data, including firms registered before 1988 and firms
with domicile outside Massachusetts). Of those, 3,348 firms (44.73%) are re-‐registrations,
which are 3,035 new firms (sometimes multiple firms merge into one), while the rest are
not. This total is low relative to the total firms in our sample for Massachusetts, 591,423
firms, suggesting that at most 0.5% of firms can potentially have a bias. We identify 1,932
cases in which both the source and target are in our dataset, with the rest likely being firms
either registered before 1988 or with a foreign domicile.
We now proceed by studying our five most significant variables in this transition:
patent, trademark, Delaware Jurisdiction, Corporation). Our main goal is to understand the
extent to which founders of low quality firms might later on re-‐register as high quality
firms. To do so, we estimate the number firms that “gain” each of these observables, where
a “gain” means the source firm did not have the observable, but the new firm does (e.g. the
source firm is not a Corporation but the new firm is). We also compare this number with
the total number of firms with this measure equal to 1 in our Massachusetts sample. As can
bee seen in Table A5, in all cases, the share of firms that gain a positive observable is
always less than 3%. In Delaware, the observable which might hold the most bias, only
0.76% of all Delaware firms are re-‐registrations of firms changing corporate form,
while the other 99.4% is not.

88
III.D Robustness Tests on Variations of Growth Outcome
In this section, we document a number of robustness tests done on our main
predictive model and variations of our growth outcome variable. Our goal in these tests is
to guarantee our sample is not sensitive to specific sub-‐sample issues in our definition of
growth, such that small variation in the growth criteria would lead to widely different
results, and to validate that spurious correlations are not driving our estimates. Given our
focus on predictive value of our early stage measures rather than causal inference, we will
look at the difference in coefficient magnitudes when comparing other coefficients to this
baseline model, rather than statistical significance. That is, we seek to know whether
changing our definition of growth would lead to different spatial and time-‐based indexes of
EQI, RECPI and REAI rather than understanding if the magnitude itself is equal to one
another in a statistical sense. We present all regressions in Table A4, with column 1
presenting our baseline model, columns 2-‐5 presenting alternate robustness models, and
columns 6-‐9 presenting the absolute percentage difference between the coefficients of the
baseline model and the alternative model.
Model (1) is our existing full information model presented in Table (5), with growth
defined as an IPO or acquisition within six years, which we include here as a baseline
model.
In Models 2 and 3 we focus on increasing the threshold of growth for which we
measure a firm as having achieved growth. In Model 2, we investigate whether our results
could be driven by a large number of low value exits that are sold at a loss for stockholders.
We use a different growth measure that is equal to 1 only for IPOs and acquisitions with a

89
recorded firm valuation of over $100 million dollars. The number of growth firms drops
from 4,205 growth firms to 3,511, a drop of 17%. Delaware Only and Patent and Delaware
have the highest percentage difference, with the Delaware Only coefficient being 12%
higher than the baseline model and the Patent and Delaware coefficient being 15% higher.
All other coefficients vary by less than 10%. Importantly, we highlight that our use of SCC
Platinum as a source of acquisitions is likely to lead to a positive selection in our sample:
SCC Platinum is already more likely to include transactions that are significant in value and
less likely to represent mergers that are only a sell of small assets of a firm.
Model 3 increases our threshold of quality further and includes only IPOs. IPO
outcomes represent the top-‐end of growth successes in our sample, and understanding if
our dynamics hold in this set might prove a particularly useful regularity. The number of
growth firms drops substantially to 1,278, a share that appears broadly in line with
patterns of exit of venture backed events in Kaplan and Lerner (2010). We also drop our
Corporation measure before running this regression since it is endogenous – all IPOs are
necessarily corporations, as it is not possible for non-‐corporations to sell shares. Our
coefficients exhibit more variation than those in Model 2, with the most notable differences
in Patent measures and Delaware measures. They independently increase almost 30%
while the interaction term increases by 100%. The importance of name based measures
also increases, with firms with short names being 34% more likely to grow in the IPO
model than the baseline model, as well as some sector measures, particularly an
association to Traded industries, increases the likelihood of IPO by 19%, an association to
Local industries (already a negative correlation to growth), which further reduces the
likelihood of IPO by 35% relative to the baseline model, and being a biotechnology firm,
90
which is 34% more likely to grow relative to the baseline. Assuming IPO measures are a
higher value version of our growth outcome, it would appear that the effect of our
measures is even starker in this high value growth outcome compared to our main growth
measure. This further supports our view that our measures relate to real outcomes where,
if anything, we could have even larger variation in quality when selecting stricter growth
measures.
Models 4 and 5 test for biases that could relate to the window of growth in 6 years
rather than a longer number of years. Changing the number of years allows us to
investigate potential differences in dynamics of firms depending on their observables and
industry sector and investigate to what extent this could bias our results. In Model 4, we
define growth as an IPO or acquisition within 9 years instead of 6 years. Given that the
time-‐window is three years longer, we drop the last three years (2006-‐2008) in our
training sample from this regression, since the full growth window will not have elapsed
for those years. The number of growth firms in these years increases by 28% from 3,551 to
4,543 after excluding these extra years. This might appear to be lower than would be
expected since the average years to IPO or close to six, but we note that growth outcomes
are skewed and the median is much lower than six years. The largest variation in relative
magnitude is for firms in the semiconductor industries, which are 33% more likely to grow
than in the 6 year window, and for firms with a trademark which are 23% more likely to
grow relative to baseline. Semiconductors is an industry that is likely to take a longer time
to grow due to the time it takes to make large firm-‐specific investments. Having a
trademark in the first year suggests that the firm holds a commercial strategy, and, as such,
might be able to take more time to get an equity exit event due to having a less pressing

91
need for outside financing. These differences, however, are relatively small and do not
create any material differences in our results.
Finally, in Model 5 we use an unbounded IPO outcome that is equal to 1 if a firm
ever has an IPO. We run this regression on our 1995-‐2005 sample, implicitly allowing the
most recent firms at least 9 years to achieve such outcome. As in Model 3, we find looking
at IPO growth basically makes our estimates starker and highlights the ability of our
measures to correlate significantly to growth outcomes at the very top end.

92
IV. Evaluating Entrepreneurial Quality Estimates
Even if our model has strong predictive capacity, another potential source of concern
could be heterogeneity within subsamples. Specifically, if one state (California) holds a
disproportionate number of growth outcomes, or if growth outcomes occur disproportionately on
a small number of years (the late 1990s), it is possible that our model is mostly fitting that region
or time-period but does not have the external validity to work outside of the training years and
states. If so, our prediction of quality in future years would be poor even if such predictions are
good in the sample years.
We begin testing the accuracy across states in Table A1. We perform three different tests.
In Column 3, we estimate the share of state growth firms in the top 5% of the state quality
distribution using our 30% training sample. All states appear to separate growth firms in an
within a small percentage at the top of the distribution34. The share of firms in the top 5% is
highest in New York (85%) and Oregon (83%), and lowest in Florida (46%) and Washington
(62%); California (68%) is only around the median, and there does not appear to be a discernible
relationship between this statistic and the distribution of venture capital or high technology
clusters. Our second test evaluates to what extent do our observables characterize the growth
process in a region. To do so, we re-run our full information model (Model 1 of Table 4)
separately for each state and calculate the pseudo-R2 of each model. Once again, variation in this
measure appears to be stable, with our measures having important relationship to growth
outcomes in all states. The highest R2 value is for Massachusetts (32%) and the lowest for
Florida (18%), with all other states being between 23% and 31%. Finally, we measure the
relationship between entrepreneurial quality estimated from these states specific models to our
34 We are unable to estimate this measure for Alaska, Vermont and Wyoming due to the low number of growth firms
that the states have.

93
global quality measure. In column 5 we report the correlation between the two. 35 All correlation
measures are high, with the highest one being in California (.902) and the lowest in Michigan
(.572), all other states are between .740 and .888. In conclusion, while there is variation in state
performance each of these three test, we find our estimate of quality with a national index to hold
good predictive capacity at the state level.
We repeat the same three tests for each year in Table A2. The robustness of our model
across years appears to be even higher than the robustness across states. The share of top 5%
varies from 59% to 80%, the pseudo R2 from 21% to 32% and the correlation of predicted quality
from .822 to .953. Interestingly both the best predictive accuracy (share in top 5%) and the best
fit between our observables and growth do not occur in the late 1990s but in the years 2005 to
2008. Both the stability across a long period of time and the fact that this accuracy appears to be
improving gives us confidence in the quality of our predictions in the years following 2008,
where growth is unobserved.
35 Another potential approach to test the difference in predictive measures between quality estimated with a state and
national model would be to look at the distribution of the difference between these two measures (𝑑! = 𝜃!,!"#"$ − 𝜃! and test for H0 : 𝑑! = 0. However, because the state model implicitly includes a state fixed effect this would
counfound quality and ecosystem effects.

94
REFERENCES
N. Balasubramanian, J. Sivadasan, (2009) “NBER Patent Data-BR Bridge: User guide and
technical documentation” SSRN Working paper #1695013
B. Barnes, N. Harp, D. Oler, (2014) “Evaluating the SDC mergers and acquisitions database”
SSRN Working paper #2201743
S. Belenzon, A. Chatterji, B. Daley. (2014) “Eponymous entrepreneurs” Working paper,
M. Delgado, M. Porter, S. Stern, (2016) “Defining clusters in related industries” Journal of
Economic Geography. 16 (1): 1-38
S. Graham, G. Hancock, A. Marco, A. F. Myers, (2013) “The USPTO case files data set:
Descriptions, lessons and insights” SSRN Working Paper #2188621
W. R. Kerr, Shihe Fu, (2008) "The Survey of Industrial R&D--Patent Database Link
Project." J. Technol. Transf. 33, no. 2
V. I. Levenshtein, (1965) "Binary codes capable of correcting deletions, insertions, and
reversals." Doklady Akad. Nauk SSSR 163(4): 845–848
R. Levine, Y. Rubinstein, (2013) “Smart and illicit: Who becomes an entrepreneur and does
it pay?” NBER Working Paper #19276
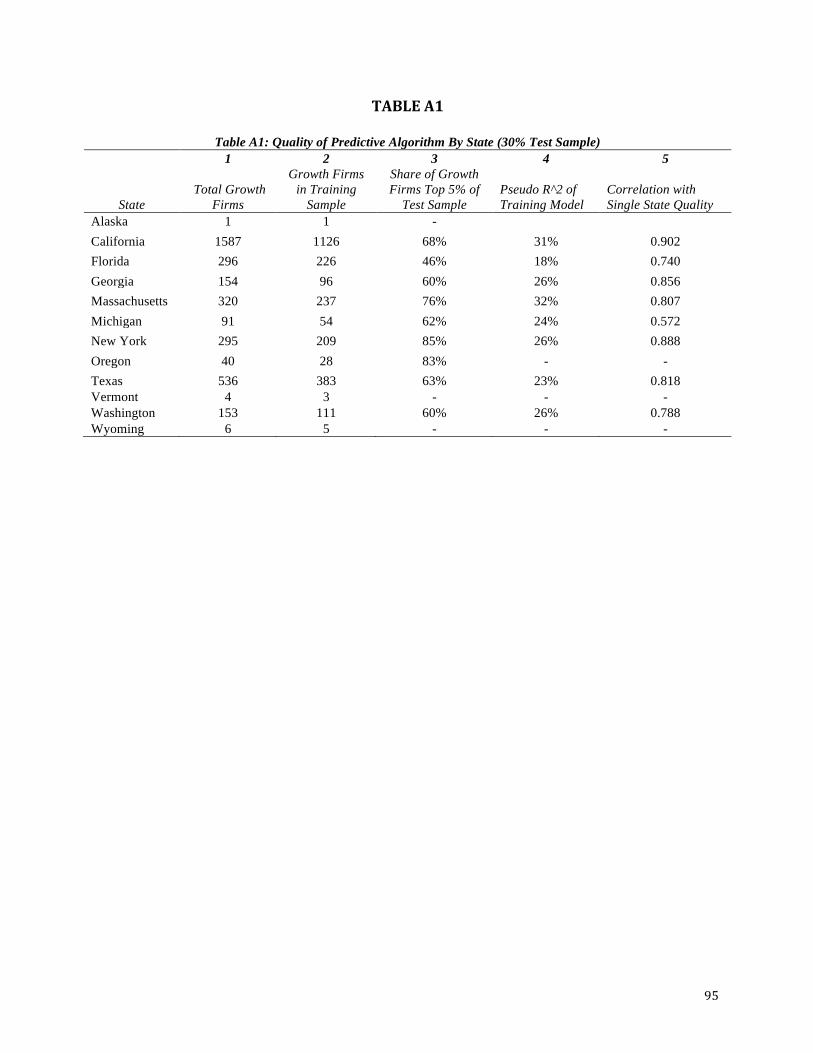
95
TABLE A1
Table A1: Quality of Predictive Algorithm By State (30% Test Sample) 1 2 3 4 5
State Total Growth
Firms
Growth Firms in Training
Sample
Share of Growth Firms Top 5% of
Test Sample Pseudo R^2 of Training Model
Correlation with Single State Quality
Alaska 1 1 - California 1587 1126 68% 31% 0.902
Florida 296 226 46% 18% 0.740 Georgia 154 96 60% 26% 0.856 Massachusetts 320 237 76% 32% 0.807 Michigan 91 54 62% 24% 0.572 New York 295 209 85% 26% 0.888 Oregon 40 28 83% - - Texas 536 383 63% 23% 0.818 Vermont 4 3 - - - Washington 153 111 60% 26% 0.788 Wyoming 6 5 - - -
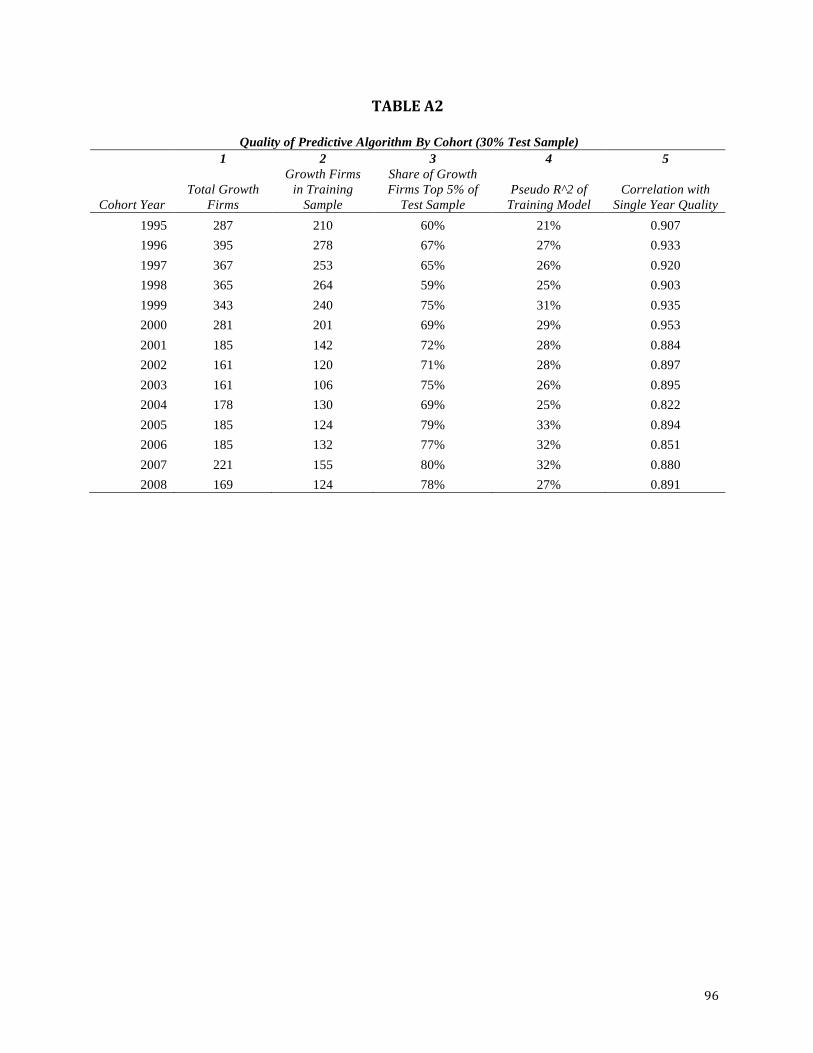
96
TABLE A2
Quality of Predictive Algorithm By Cohort (30% Test Sample) 1 2 3 4 5
Cohort Year Total Growth
Firms
Growth Firms in Training
Sample
Share of Growth Firms Top 5% of
Test Sample Pseudo R^2 of
Training Model Correlation with
Single Year Quality 1995 287 210 60% 21% 0.907 1996 395 278 67% 27% 0.933 1997 367 253 65% 26% 0.920 1998 365 264 59% 25% 0.903 1999 343 240 75% 31% 0.935 2000 281 201 69% 29% 0.953 2001 185 142 72% 28% 0.884 2002 161 120 71% 28% 0.897 2003 161 106 75% 26% 0.895 2004 178 130 69% 25% 0.822 2005 185 124 79% 33% 0.894 2006 185 132 77% 32% 0.851 2007 221 155 80% 32% 0.880 2008 169 124 78% 27% 0.891
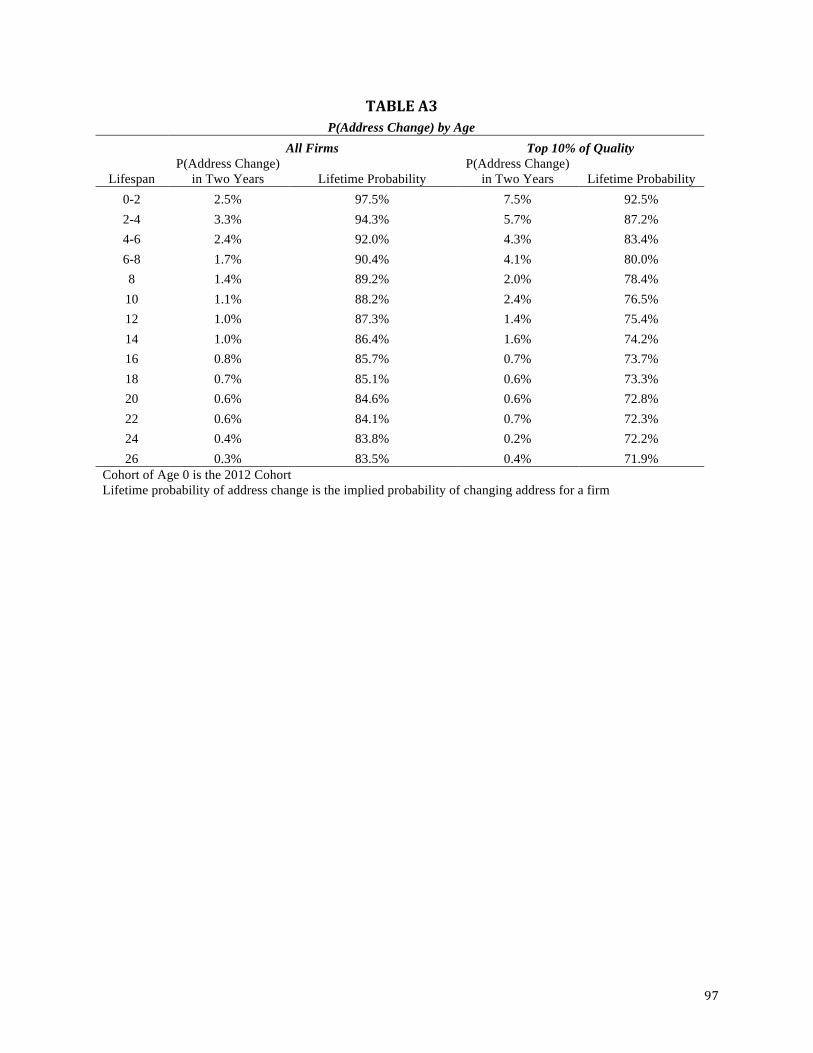
97
TABLE A3 P(Address Change) by Age
All Firms Top 10% of Quality
Lifespan P(Address Change)
in Two Years Lifetime Probability P(Address Change)
in Two Years Lifetime Probability 0-2 2.5% 97.5% 7.5% 92.5% 2-4 3.3% 94.3% 5.7% 87.2% 4-6 2.4% 92.0% 4.3% 83.4% 6-8 1.7% 90.4% 4.1% 80.0% 8 1.4% 89.2% 2.0% 78.4%
10 1.1% 88.2% 2.4% 76.5% 12 1.0% 87.3% 1.4% 75.4% 14 1.0% 86.4% 1.6% 74.2% 16 0.8% 85.7% 0.7% 73.7% 18 0.7% 85.1% 0.6% 73.3% 20 0.6% 84.6% 0.6% 72.8% 22 0.6% 84.1% 0.7% 72.3% 24 0.4% 83.8% 0.2% 72.2% 26 0.3% 83.5% 0.4% 71.9%
Cohort of Age 0 is the 2012 Cohort Lifetime probability of address change is the implied probability of changing address for a firm

98
TABLE A4 We estimate a logit model with Growth as the depent variable, under different definitions of Growth. Incidence ratios reported; Robust standard errors in
parenthesis.
Models Share Difference with Baseline
1 2 3 4 5
6 7 8 9
Original
Regression
Growth (Only Acq >= 100M)
IPO in 6 Years
Growth in 9 Years
IPO (Ever)
Original Regression
Growth (Only Acq >= 100M)
IPO in 6
Years
Growth in 9
Years Short Name 2.386*** 2.295*** 3.080*** 2.404*** 3.294***
4% 29% 1% 38%
(0.0743) (0.0772) (0.157) (0.0664) (0.144)
Eponymous 0.315*** 0.368*** 0.269*** 0.303*** 0.256***
17% 15% 4% 19%
(0.0290) (0.0348) (0.0412) (0.0243) (0.0325)
Corporation 4.564*** 4.674***
4.425***
2%
3%
(0.185) (0.206)
(0.156)
Trademark 5.243*** 5.377*** 5.475*** 5.682*** 6.037***
3% 4% 8% 15%
(0.318) (0.341) (0.467) (0.324) (0.451)
Patent Only 52.69*** 57.07*** 69.87*** 50.03*** 60.31***
8% 33% 5% 14%
(3.412) (4.039) (6.860) (2.788) (4.705)
Delaware Only 40.40*** 45.56*** 45.65*** 33.92*** 32.69***
13% 13% 16% 19%
(1.349) (1.677) (2.536) (0.989) (1.455)
Patent and Delaware 239.6*** 276.8*** 407.2*** 207.5*** 279.1***
16% 70% 13% 16%
(11.91) (14.82) (31.43) (9.223) (17.82)
Local 0.791*** 0.808*** 0.710*** 0.703*** 0.610***
2% 10% 11% 23%
(0.0449) (0.0496) (0.0730) (0.0362) (0.0538)
Traded Resource Intensive 1.248*** 1.306*** 1.261*** 1.204*** 1.274***
5% 1% 4% 2%
(0.0465) (0.0524) (0.0760) (0.0401) (0.0636)
Traded 1.254*** 1.221*** 1.362*** 1.210*** 1.275***
3% 9% 4% 2%
(0.0391) (0.0414) (0.0668) (0.0332) (0.0521)
Biotech Sector 2.059*** 2.052*** 2.401*** 2.146*** 3.241***
0% 17% 4% 57%
(0.189) (0.203) (0.312) (0.177) (0.333)
Ecommerce Sector 1.117* 1.060 1.355*** 1.212*** 1.474***
5% 21% 9% 32%
(0.0538) (0.0558) (0.101) (0.0511) (0.0898)
IT Sector 1.832*** 1.751*** 2.053*** 1.883*** 2.165***
4% 12% 3% 18%
(0.0908) (0.0950) (0.158) (0.0832) (0.140)
Medical Dev. Sector 0.845** 0.791*** 0.842 0.906 0.829*
6% 0% 7% 2%
(0.0496) (0.0511) (0.0758) (0.0469) (0.0633)
Semiconductor Sector 1.688** 1.550* 1.557 2.064*** 2.129***
8% 8% 22% 26%
(0.273) (0.272) (0.363) (0.293) (0.405)
State Fixed Effects Yes Yes Yes Yes Yes
Observations 12164697 12164697 12134777 12164697 12134777
Pseudo R-squared 0.293 0.300 0.300 0.288 0.288

99

100
TABLE A5
Re-Registrations in Massachusetts
General Statistics
Total Massachusetts Firms in Sample 591,423
Firms founded through a re-registration 3,035
Share of Firms Founded through re-registration 0.51%
Re-incorporations with source and destination firm in sample 1,932
Corporations
Firms that Gain Corporation = 1 640
Total Corporations in Sample 358,978
Share 0.18%
Delaware Jurisdiction
Firms that Gain Delaware = 1 245
Total Delaware Firms in Sample 32,194
Share 0.76%
Patents
Firms that Gain Patent = 1 43
Total Patent Firms in Sample 2,373
Share 1.81%
Trademark
Firms that Gain Trademark = 1 30
Total Trademark Firms in Sample 1,365
Share 2.20%
Short Name
Firms that Gain Short Name = 1 222
Total Short Name Firms in Sample 265102
Share 0.08% A firm is coded as gaining an observable if the source firm of the re-registration did not have such
observable at birth but the new firm does.

101
TABLE A6
US States with Business Registration Records Rank State GDP Share of GDP Cumulative GDP Cumulative Share
1 California $2,287,021 13.1% $2,287,021 13.1% 2 Texas $1,602,584 9.2% $3,889,605 22.3% 3 New York $1,350,286 7.8% $5,239,891 30.1% 4 Florida $833,511 4.8% $6,073,402 34.9%
10 Georgia $472,423 2.7% $6,545,825 37.6% 12 Massachusetts $462,748 2.7% $7,008,573 40.3% 13 Michigan $449,218 2.6% $7,457,791 42.8% 14 Washington $425,017 2.4% $7,882,808 45.3% 22 Missouri $285,135 1.6% $8,167,943 46.9% 25 Oregon $229,241 1.3% $8,397,184 48.2% 29 Oklahoma $192,176 1.1% $8,589,360 49.3% 41 Idaho $66,548 0.4% $8,655,908 50.1% 46 Alaska $60,542 0.3% $8,716,450 50.1% 49 Wyoming $48,538 0.3% $8,764,988 50.3% 52 Vermont $30,723 0.2% $8,795,711 50.5%
Aggregate Statistics
Total States 15
Total GDP $8,795,711
US GDP $17,411,875.00
Share GDP 50.5% All states are included from year 1988 to 2014. Future versions of this paper are expected to have further coverage of the United
States. Source for GDP values: Bureau of Economic Analysis
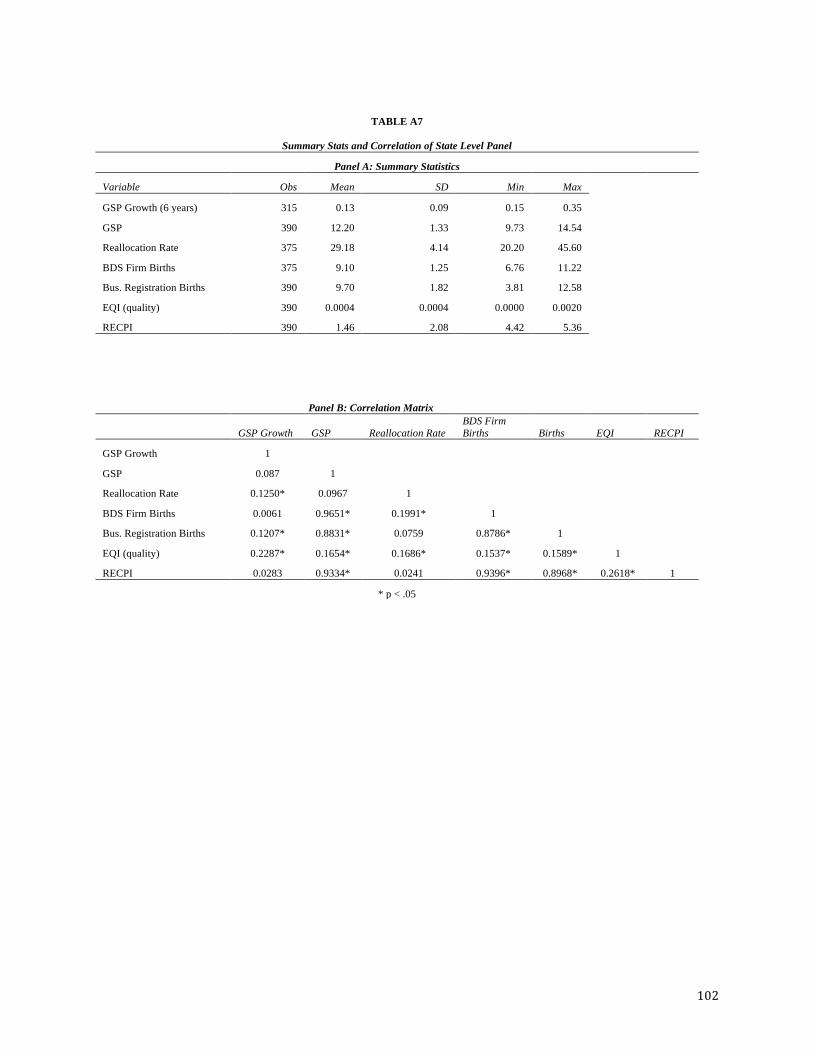
102
TABLE A7
Summary Stats and Correlation of State Level Panel
Panel A: Summary Statistics
Variable Obs Mean SD Min Max
GSP Growth (6 years) 315 0.13 0.09 0.15 0.35
GSP 390 12.20 1.33 9.73 14.54
Reallocation Rate 375 29.18 4.14 20.20 45.60
BDS Firm Births 375 9.10 1.25 6.76 11.22
Bus. Registration Births 390 9.70 1.82 3.81 12.58
EQI (quality) 390 0.0004 0.0004 0.0000 0.0020
RECPI 390 1.46 2.08 4.42 5.36
Panel B: Correlation Matrix
GSP Growth GSP Reallocation Rate
BDS Firm Births Births EQI RECPI
GSP Growth 1
GSP 0.087 1
Reallocation Rate 0.1250* 0.0967 1
BDS Firm Births 0.0061 0.9651* 0.1991* 1
Bus. Registration Births 0.1207* 0.8831* 0.0759 0.8786* 1
EQI (quality) 0.2287* 0.1654* 0.1686* 0.1537* 0.1589* 1
RECPI 0.0283 0.9334* 0.0241 0.9396* 0.8968* 0.2618* 1
* p < .05

103
FIGURE A1
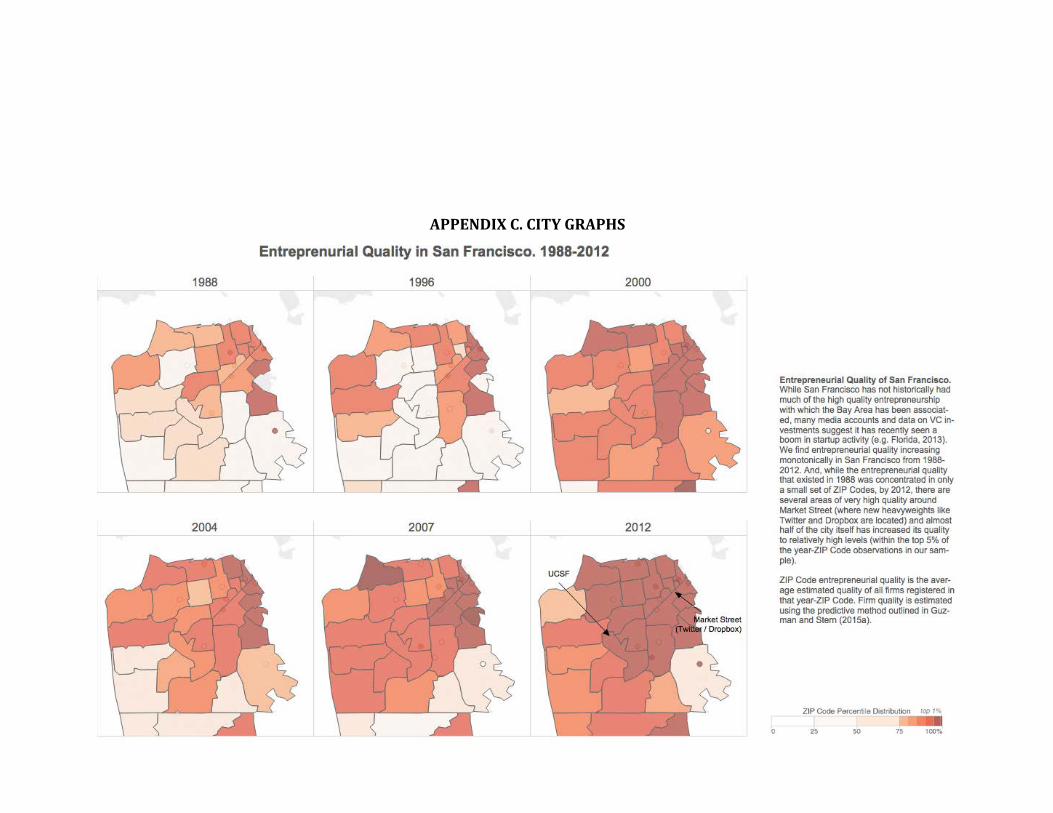
104
APPENDIX C. CITY GRAPHS

105

106
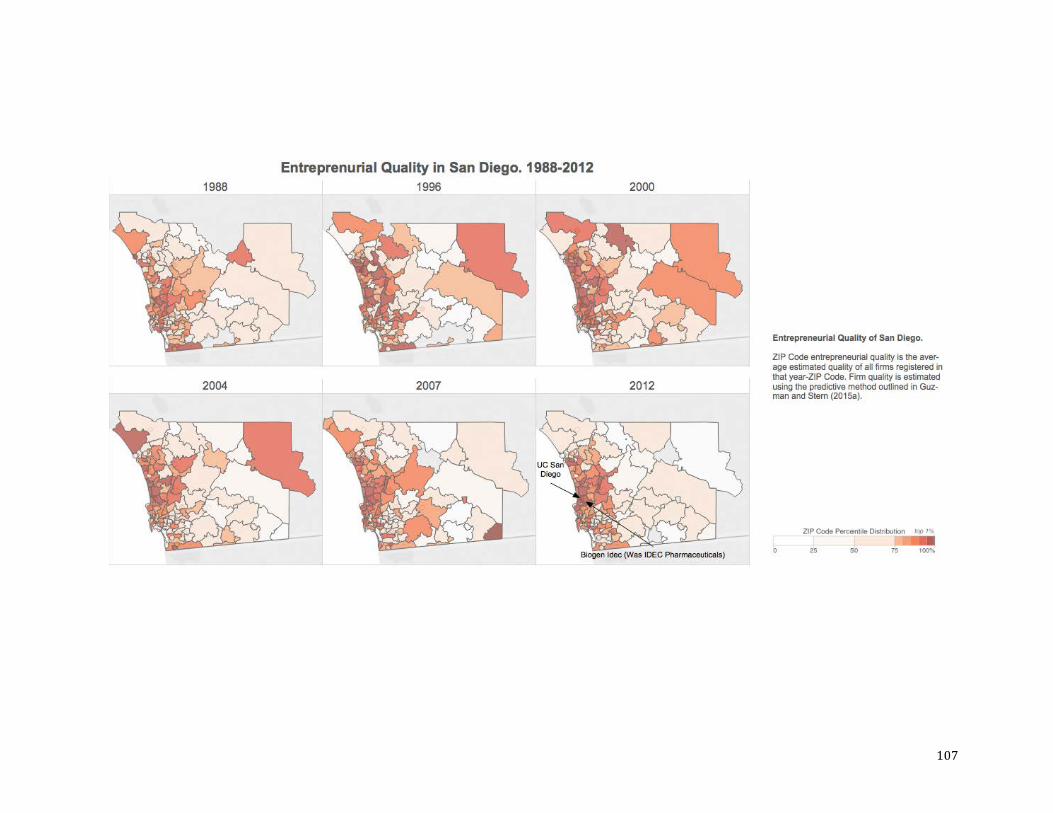
107

108