NavWepa Report 7411 - Defense Technical … Report 7411 procedures In each of these fields may have...
167
NavWepa Report 7411 VARICOMP - A MEZHODFOR DETERMINING DETONATION-TRANSFER PROBABILITIES Prepared by: J. N. Ayres L. D. Hampton I. Kablk. A. D. Solem Approved by: ch-f, ABSTRACT2 VARICOMP Is a method for determining the detonatlon- transfer exploelve P robabilities of an explosive train by substitution of a) explosive. of varied seneltlvltiea or energies for the design These substituted--VARICOMP--explosives (whose response or output probability distribution functions have been calibrated relative to the design explosive) are used to measure the exploslve drive Inherent in the design system. Methods of calibrating explosives and carrying out VARICOMP performance tests are given along with statistical procedures for comblnlng performance test and callbratlon data. basis for predlctlons, These procedures are the at high confidence levels, of very high reliability (or "safety) of an explosive system based on a relatively small number of tests carried out on the explosive system. Computational aids and a number of Illustrative examples are included. PUBLISHED JULY 1961 Explosions Research Department U. S, NAVAL ORDNANCE LABORATORY WHITE OAK, MARYLAND I
Transcript of NavWepa Report 7411 - Defense Technical … Report 7411 procedures In each of these fields may have...

NavWepa Report 7411
VARICOMP - A MEZHOD FOR DETERMINING
DETONATION-TRANSFER PROBABILITIES
Prepared by:
J. N. Ayres L. D. Hampton
I. Kablk. A. D. Solem
Approved by: ch-f,
ABSTRACT2 VARICOMP Is a method for determining the detonatlon- transfer exploelve P
robabilities of an explosive train by substitution of a)
explosive. of varied seneltlvltiea or energies for the design
These substituted--VARICOMP--explosives (whose response or output probability distribution functions have been calibrated relative to the design explosive) are used to measure the exploslve drive Inherent in the design system. Methods of calibrating explosives and carrying out VARICOMP performance tests are given along with statistical procedures for comblnlng performance test and callbratlon data. basis for predlctlons,
These procedures are the at high confidence levels, of very high
reliability (or "safety) of an explosive system based on a relatively small number of tests carried out on the explosive system. Computational aids and a number of Illustrative examples are included.
PUBLISHED JULY 1961
Explosions Research Department U. S, NAVAL ORDNANCE LABORATORY
WHITE OAK, MARYLAND
I

NavWeps Report 7411 30 ~une 1961
The problem of prediction of high reliability or high safety for weapon systems has become of critlcal Importance. These systems have beeh developed to such a high state of destructive capability and w+th such a high cost per weapon that it is Imperative that malfunctioning be eliminated. At the same time they have bbcome so complex that essentially perfect per- formance must be'assured for the components of the system to assure that the Fystem is safe and reliable.
This report surmqrizes an effort that has been carried out at the Naval Ordnance Laboratory that would lead to a satisfactory method for prediction of high reliabilities of (or safeties from) detonation! transfer in explosive train systems.
i
The work leadlng'up to this report has been going on for a number of years carried out under several Tasks. This Included early testing of' the concepts using standard military explosives on several weapops; efforts to develop a series of explosive mixtures of graded aenaitlvltles whose manufacture, qomposltlons, and sensltlvitle~ could be well controlled; and a standardized test procedure for calibrating the explosives as well as development of the concepts of the VARICOMP procedure Itself. Most recently th'e work has been supported by WEPTASK RUMEsEol2/ 212 l/FOO8/10004, Properties of Explosives and NOL-409, Guided Mlasile Fuze Explosive Train Research.
It ia believed that this work should prove of interest In the fields of explosives sensitivity, reliability and safety estimation, and applied statistics. Established concepts and
ii
-,,,
NavWeps Report 7411
procedures In each of these fields may have been given violent adjustments to meet the exigencies of combining them Into a nlngle test procedure. This report la by no means considered a final word for this approach to safety and rellablllty estlmatlon. It Is to be hoped that It will stimulate lmprove- menta in this Important area.
Numerous acknowledgements are in order. The moat Important, but by no meana the only, crltlclsms, comments and dlscusslona came from Mr. R. H. F. Stresau, Mr. W. Slle, Mr. M. Rowan, and Mr. A. M. Corbln of this Laboratory. Valuable dlscusslona also came from personnel at the Naval Ordnance Laboratory, Corona, California and Bulova Research and Development, Inc., who have applied the method In assessing fuze train reliabllltles.
111
W. D. COLEMAN Captain, USN Commander
By direction

NavWepa Report 7411
TABLB OF CONTENTS
Page 'i 1. INTRODUCTION )
1.1 Performance Requirements of Modern Weaponry. . . . 1 1.2 Need for ~erlflcatlon of Performance Capabilities
of Individual Components. . . . . . . . . . , . . . 1 1.3 Explosive Components and Detonation Transfer
Performanbe Capabilities. .l 1.4 Qualitative Description of'VkiC6Mi : : : : : : : . 2 1.5 Previous Experience with VARICOMF' -. . . . . . . . . 2 1.6 The Scope and Arrangement of thls Report. . . . . . 3 1.7 Report Numbering System . . . . . . . . . . . . . . 3
2. THE PROBLEM AND THE APPROACH 2.1 Definitions of Weapon Safety and Rellablllty. . . l 4 2.2 Series Action of Individual Components. . . . . . . 4 2.3 Rellablllty Demands Imposed on Individual Components 5 2.4 Sample Size Required to Demonstrate High Performance 7 2.5 Indirect Demonstration of High Performance. . . . , 9 2.6 The Idea of Penalty Testing . . . . . . . . . . . . 9 2.7 Illustration of Penalty Testing of a Mechanical
System. .N. . . . . . . . . . . . . . . . . . . . . 9 2.8 Effect of Variation of Environment and Performailce
Capabilities on Rellablllty . . . . . . . . . . . . 9 2.9 Comparison of Mechanical Penalty Testing and
Exploslve~Penalty Testing . . . . . . . . l . . . . 11 2.10 Complementary Nature of Safety and Rellablllty. . . 11 2.11 Implementation of Penalty Testing . . . . . . . . . . 11 2.12 Deflnitlori of Explosive Safety and Rellablllty. . . 13
3. PHILOSOPHY OF'PENALTY TESTING 3.1 The Logic of Penalty Testing. . . . . . . . . . . . 15 3.2 Assumptions . . . . , + . . . . . . . . . . . . . . 15 3.3 Utilization of Previous Knowledge . . . . . . . . . 16 3.4 Penalty Testing of Explosive Systems by Geometrical
Modification. . . . . . . . . . l . . . . . . . . . 16 3.4.1 Out of Line . . . . . . . . . . . . . . . . . . 16 3.4.2 Non Linear Behavior . . . . . . + . . . . . . . 16 3.4.3 Air Gaip Anomalies . . . . . . . . . . . . . . . 17
4. EXPLOSIVE PENALTY TESTING BY VARICOMP 4.1 Comparison of Variably Loaded Donors and Acceptors. 19 4.2 Illustration of Variable-Acceptor VARICOMP. . . . . 19
5. THE STATISTICAL ASPECTS OF EXPLOSIVE SENSITIVITY 5.1 The Detonation Process. . . . . . . . . . . . . . . . 20 5.2 Inltlatloli of Detonation. . . . . . . . . . I . . . 20
.lV

NavWepe Report 7411
CONTENTS (CAN'T) Page
-. c 5.3 Parameters of Sensltlveness . . . . . . . . . . . . 21 5.4 Mechanisms of Desenaltlzatlon . . . . . . . . . . . 2222 5.5 Dosage vs. Stimulus . . . . . . . . . . . . . . . . 5.6 Sensitivity Testing . . . . . . . . . . . . . . . . 23 5.7 Rules of Sensitivity Testing. . . . . . . . . . . . 23 5.8 Criterion of Fire . . . . . . . . . . . . . . . . . 24 5.9 Sensitivity Tests . . . . . . , . . . . . . . , . . 25 5.10 Sources of Variability. . . . . . . . . . . . . . . 25 5.11 Distribution of Response. . . . . . . . . . . . . . 27 5.12 The Statistical Distribution Function . . . . . . . 27
5.12.1 Gaussian . . . . . . . . . . . . . l . . . . . '278 5.12.2 Logistic . . . . . . . . . . . . . . . . . . . 5.12.3 Ash-Lacugna. . . . . . . . . . . . . . . . . . 28
5.13 Population Parameters and Estimates Thereof. . . . 29 5.14 Logarithmic Dosage-to-Stimulus, Transform. . . . . . 29 5.15 Statistical Model . . . . . . . . . . , . . . . . . 29 5.16 Probability Spaces. . . . . . . . . . . . . . . . . 30 5.1 Methods of Presentation of Statistical Informatlon, 31 5.1 i!? Restriction to Gaussian Distributions . . . . . ; l 31 5.19 The Procedural Steps for a Statistical Operation. . 31
6. THE VARICOMP METHOD 6.1 Analysis of the Method. .............. 35
6.1.1 Given ..................... 35 6.1.2 The Problem .... .'. ............ 35 6.1.3 The Approach. ................. 35 6.1.4 The Answer
.. .................. ............ ... ...
.. ... ...
..........
37 E.2 Plan of Action.
Calibration Tests 6.2 Performance Tests
zg
615 Performance Test &l~e~l&*o~ &e* : : : : : : . :90 6.6 Assumptions of Analogy.
............................................
40 6.7 Data Collection Methods 40 6.8 Inferential Methods 41
7. THE CHOICE OF THE VARICOMP EXPLOSIVES 7.1 General Requirements. .. . .... 42 7.2 Description of RDX Calcium Stearate Mixtures.
/ ............... 42
7.3 Properties of RDX Calcium Stearate Mixtures 42 7.4 Analysis of RDX/Calclum Stearate Mixtures 44 7.5 Effect of Density on Sensitivity. 7.6 A VARICOMP Series Made from Conventional Explosives 44
.....
44
7.7 Advantages of a Binary VARICOMP Series. ............... 46 7.8 Comparison of Inert Dlluents with very Insensitive
Explosives as the Secondary Component . ...... 46 7.9 Requirements for Explosives Suitable for a
VARICOMP Series . ..... ..... .. ..... 46
. V

NavWeps Report 7411
8. THE
CONTENTS (CON'T) 1
CALIBRATiON TEST Page
Callbratqon of EXplosives ............. 48 Calibratfon Tests, Sensltlvlty, .......... 48 Calibration Tests, Output ............. Small Di$meter Systems.
49 ..............
Large Scale Systems 50
................ Extent of Calibration
51 ...............
Presentation of Data. 51
.... . Transformation to Probability Spk : 1-1 : : : : ..
53
Ramifications 53
Centering of Callb~ak&~T~s~s: ...................... 57
Example .1 57
..................... 58
.. ‘a
9. UP-A.~~D-D~WN P;ERPORMANCE TESTS 9.1 Choice of Plan. . . 9.2 Test Requirements ani hbjeEtiv;s: : : : : : : : : ..
62 62
9.3 A Sophistication. ................. 9.4 Bruceton Test Plan.
62 ................
9.5 Biasing the Data. 63
.... . . 9.6 Data Reduction, Estimate of th; Mein: : : : : : :
.. 66 66
9.7 Data Reduction, Computatlon of Confidence Llmlts. . 67 9.8 Analytical Requirements .............. 71 9.9 Example Bruceton Method .............. ,72
9.9.1 Data Collection ................ 72 9.9.2 Data Reduction. ................ 73 9.9,3 Reliabality Estimate. .. .. .... .. 79
9.10 Errors Due to Unequal Spacing of VARICOMP Explk;vis79 9.11 Errors Due to Variation In the Standard Deviation
of VARICOMP Exploslves. .............. 81 9.12 Errorn Due to Small Sample Size .......... 82
10. RUN-DOWN PERF'ORMANCE TEST 10.1 Data Collectlon. 10.2 Acceptable Test Midificitiok:
. . . . . . . . . .
10.3 Single Ekploslve, .E
Data Collecti~nga~dgR~d;c~~~n: . 84 10.4 Single Explosive, Reliability Estimate . . . . . . 87 10.5 Single Eiplosive, Confidence of Reliability. . . . 89 10.6 Multiple! Explosive, 10. Multlple~ Exploelve,
Data Reduction, Probit Analysis91
10. i Data Reduction, Non-Iterative. 91
Errors Due to Calibration Uncertainty. . . . . . . 92 10.9 Example, Run-Down Method. . 95
10.9.1 Single VARICOMP Exploslv~,gD~t~ 6oildc&'.'. 95 10.9.2 Sing&e VARICOMP Explosive, Algebraic Data
Reduction. . . . . . . . . . . . 10ig.3 Single VARICOMP Explosive, Oraphliai ia;a* l
l 95
Reduction. 10.9.4 TWO VARIC~M; &G&~
l . . 97 &a'c~ii&tio~ . . . gg
10.9.5 Two VARICOMP Explosives, Data Reduction, . . . 99 VI

NavWepa Report 7411
CONTENTS (CON'T) Page
10.10 Small Sample, Errors and Limitations, Single Exploeive . . . l l l l l l . . . . . . . . . . . .103
10.11 Small Sample Errors and Llmltatlons, More than One Explosive . . . . . . . . . . . . . . . . . . .103
11. COMPARISON OF VARIOUS DATA COLLECTION SCHEMES 11.1 Choice- Between Staircase and Run-Down Method. . . .105 11.2 Other.Staircase Testing Methods. . . . . . . . . . .105
12. DESIGN OF EXPERIMENT 12.1 Recapitulation of VARICOMP Process . . . . . . . . .107 12.2 Calibration Test . . . . . . . . . . . . . , . . . .107
E: 2 Mock-up Calibration Test . . . . . . . . . . . . . .107 Lack of Analogy Between Calibration and Performance Tests. . . . c . . . . . . . . . . . . . . . . . . .109
12.5 Combination of Reliability Data Derived from Various Sources, . .1og
12.6 The Power of the VA&dOM.P*M%oi : : : : : : : : . l llO
13. APPLICATIONS AND EXAMPLES 13.1 Lead-to-Booster Example. ............. .115 13.2 A Booster-to-Warhead Example ........... .115 13.3 Calibration Tests, Seoond Example. ........ .115 13.4 Performance Tests, Second Example. ........ .121 13.5 Rellablllty Estimates, Second Example. ...... .121 13.6 Comparison of Linear and Logarithmic Dosage-to-
Stimulus Transforms, Second Example. ....... .124
APPENDIX A Procedure for Preparing a loo-Pound Bstch of Desensitized RDX . . . . . . . . . . . .126
APPENDIX B Anaiytlc Procedure for RDX/Calclum Stearate Mixes . . . . . . . . . . . . . . . . . . .127
APPENDIX C Standard Detonation Sensitivity Tests. . . . . .129
APPENDIX D Monte Carlo Experiment to Assess Errors,Due to Unequal Spacing of Explosives. . . . . . .136
APPENDIX E Statistical Tables . . . . l . . . . . . . . . .137
REFERENCES. . . . . . . . . . . . . . . . . . . . . . . . . ,140
c VII

NavWepa Report 7411
Frontispiece
Figure 2.4
Figure 2.7
Figure 3.1
Figure 3.4.1
Figure 4.2
Figure 5.11
Figure 5.16
Figure 5.17
Figure 6.1.1
Figure 6.2
Figure 8.7
Figure 8.8
Figure 9.3A
Questions Concerning an Explosive Train
95-F/ercent-Confidence Single-Sided Estimate of the Lower Limit of Rellablllty for N Trials with zero, one, or two failures
Symbolic Representation of the Ability of Various Mechanical Designs to Withstand an Adverse Stress En3lronment
Explosive Penalty Testing by Variation of Frrler Thickness
Rot&-Alignment Arming System
Explosive Penalty Testing by Variation of Acceptor Sensitivity
Response to Dosage, Cumulatlve Distribution Fun$tlon
Comparison of aausslan and hglstlc Dlstrubutlons
Senziltlvlty of Various RDX/Calclum Stearate ComposItiona
The ~Exploelve System
Flow Dlagram for VARICOMP
Sensitivity Versus Composition for Various RDX/Calclum Stearate Mixtures
Observed and Adjusted Sensltlvltlee of Various RDX/Calclum Stearate Mlxturea
The 'Bruceton Calibration Test--Variable Stltiulus; Fixed-Sensitivity Explosive
Figure 9.3B The Bruceton Performance Test--Fixed Stimulus; Explosives of Various Senaltlvltles
Figure -9.6 VARXCOMP Estimate Based on Bruceton Performance Test Data
1
I ILLUSTRATIONS Page XII
8
10
14
17 18
26
33
34
35
36
54
56
64
65
68
I I VIII
NavWepa Report 7411
! ILLUSTRATIONS (CON'T)
Figure 9.7A (Graph III of AMP Report)
Figure 9.7B (Graph I of AMP Report)
Figure 9.9.1 Data From Typical Bruceton Test
Figure 9.9.2A Calibration of VARICOMP Explosives
Figure 9.9,2B Calibration of Design Expl~slve
Figure 9,903
Figure 9.11
Figure 10.3
s Figure 10.4
Figure 10.9
Prediction of the Rellablllty of an Exploslvq System on the Basis of Bruceton Plan Performance Tests with VARICOMP Exploslves
The Effect of VARICOMP Explosive Non- Parallelism Errors on Step Spacing In the Bruceton Performance Test
Treatment.of Single VARICOMP Explosive Run-Down Performance Test Data
Estimate of Response of a System Loaded with the Desigh Explosive, Based on Slngle- VARICOMP-Explosive Run-Down Performance Test Data
Calibration of the Design and the Two VARSCOMP Explosives
Figure 10.9.3 Analysis of Run-Down Performance Test with One VARICOMP Explosive
FIgwe 10.9.5 Anllyals of Run-Down Performance Test with Two VARICOMP Explosives
Figure 10.10 Effect of Sample Size and arid Spacing on Single-VARICOMP-Explosive Run-Down Rellablllty Estimates
Figure 12.3 Possible Lack of Analogy Between Conditions of Performance and Calibration Tests
-? Figure 12.6 The Effect of the Choice of VARICOMP
Explosive on the Efficiency of Estimate of Reliability of Design
Page 69
70
73
74
75
78
80
86
88
96
98
101
102
108
114
c ix

NavWeps Report 7411
ILLUSTRATIONS (CON'T)
Figure 13.2 Booster-to-Warhead Transfer Rellablllty Study by VARICOMP
Page 116
3
l
118
119
120
122
123
Figure 13.3A Calibration of Comp B
Figure 13.3B Cal+bratlon of H-6
Figure 13.3C Calfbratlon of TNT
Figure 13.4A Performance Test and Reliability Estimate
Figure 13.4B Calibration Tests, Performance Tests,and Estimate of Reliability
Figure 13.6 Calibration Testa, Performance Teets,and Estimate of Rellablllty BaBed on Logarithmic Dosage-to-Stimulus Transform
Figure C.2.1A Small Scale Gap Teat
Figure C.2,lB Small Soale Gap Teat Setup
Figure C.3.1 NOL Booeter Senaltlvlty Test
Figure C.4.1 NOL Propellant Sensitivity Test
Table 2.4
Table 2.9
Table 5.16
Table 7.2
Table 7.6
95-Percent Confidence Single-Sided Eertlmate of the Lower Limit of Rellablllty for N Trials with Zero, One, or Two Fallurea
Penalty Testing aa It la Used to Aehleve Various Design Objeatlves
Cmbarlson of Gausalan and bglstic Distributions
Properties of the RDX/Calclum Stearate Binary Explo8lve Syntem In the Small Saale Gap Test When Loaded at 10 KPSI
Typical Yaluee of High-Explosive Senaltlvltlea
125
130
131
133
135
6
12
32
43
45
X

NavWeps Report 7411
ILLUSTRATIONS (CON'T) Table 8.4 The Calibration and Utlllzatlon of
Page
A VARICOMP Explosive Series (Conjecture) 50
Table 8.7 Fitted Valuea of the Senaltlvltlee of Varloua RDX/Calclum Stearate Compositlons
55
Table 8.11~ Calibration Data for Design Explosive 60
Table 8.11~ Computation of Design Explosive Reraponse 60 Expected Value and Lower g+Percent Confi- dence Limit
Table 9.9.2 Calculatlogs Used In Bruceton Data Reduction (Based on Fire8 Observed In
77
Figure 9.9.1)
Table 9.12 Effect of Sample Size on the Estimate of 83 the Minimum Reliability, at 95-Percent Confidence Predicted from Brudeton Data Giving Observed Rallabllltles of 99 Percent
Table 10.3 The System of Notation 85
Table 10.5 Composite Confidence of Combined Estimates 90
Table 10.9.5 Computation of the Average Observed Stimulus Intenelty
loo
Table 12.6 Relatlve Sensltlvltles of a Series of 111 Exploslvea
Table 13.3 Calibration Data And Results 117
Table E-l Relationship Between Normlt, Probability, 137 Ordinate, and Weighting Factor
Table E-2 Cumulative "Student's' Distribution 138
Table E-3 95-Percent Confidence Single-Sided Estimate 139 Lower Limit of the Rellablllty, Sample Sizes of 20 or Less
LR t for
xl

NAVWEPS REPORT 74 I I
DETONATOR
A
B
,I
C
I ( D E
A
i
B 1.
C
I
E D

NavWeps Report 7411
VARICOMP
A METHOD FOR DETERMINING DETONATION-TRANSFER PROBABILITIES
1. INTRQDUCTION
1.1 Modern weaponry, because of the extreme complexity of weapssystems and the lethal potential they carry, Imposes very high rellablllt system for -msgd
requirements on the components of the Imposes very high safety requirements
otherwise. The difficulty of attaining such high performance capabilltles Is obvious, and much effort has been expended toward achieving them.
1.2 It la Imperative that verification of the performance capamities of each system becomeL part of Its design (l,2,3). Such verification Introduces additional problems for the weaponeer. Brute force testing of the whole weapon, or &f Its components, to establish the weapon system's rellablllty and safety is usually not feaslble. The rellablllty and sa-fety characteristics of the components that make up the system must therefore- be determined by overtesting and combined In order to estlmate the system's overall performance. Even such determinations pose serious dlfflcultles, especially In the case of consumed one-shot Items which cannot be repeatedly exercised to establish probability characteristics, e.g.,
warheads explosive trains explosive components propulsion systems chemical power packs.
Suitable combined experimental-statistical techniques must be used to provide the required demonstrations,
1.3 In perhaps all weapon systems, some form of explosive actiris employed. In many cases (for lnstaiice, fuzea and safety-and-arming mechanisms) the explosive action Involves the transfer of detonation from one explosive component to another such as:
Detonator -Lead -Relay -Booster -Warhead.

NavWepa Report 7411
The Important point in rellablllty and safety estimates for the system la verification of whether or not the detonation will progress along the chain. This report presents the VARICOMP pr.ocedure for evaluating the probability of transfer of detonation across explosive Interfaces, thus yielding data necessary for predicting explosive component rellabllltles. In the past, penalty testing (overtestlng) by geometrical modlflcatlon has been the experimental approach to evaluation of detonation transfer p6obabllltles (4). The novelty of the VARICOMP procedure of evaluation lies In the Ideas of penalty testing by alteration of explosive loading (VARIatlon of explosive COMPoeiFlon) rather than by geometrical modification.
1.4 The VARICOMP procedure Is a combined experimental and anal-Cal methodifor estimating very high, detonation transcer rellablllty (or safety) at a high level of confidence on the basis of relatively scanty direct experimental evidence. It depends upon a syitematic synthesis of previous experience and current experimentation to develop trends applicable to the system under study. The VARICOMP method Is not a magic Incantation, nor is It a cook-book procedure for ascertaining detonation transfer probabilities. It Is not even an across- the-board best way of finding the answer. It Is to be expected that each time VARICOMP Is applied, novel and unique differences from previous applications will be found. The cleverness and Ingenuity of the experimenter can be greatly supplemented .but not supplanted by ~VARICOMP. Its llmltatlons and potentlalltles have not yet been :fully explored because of its recent develop- ment. So far, It scan be said that each time VARICOMP has been utlllzez rappe$re to have answered more questlons.than It has raised.
1.5 The first use of this approach at the Naval Ordnance Laboxory occurred In late 1952 and early 1953 (5) In a program which compared the abllltlen of a number of different detonators to Initiate charges of booster-like configurations, the charges being made of different sensitivity explosives. The condept of tallor-making explosives for use In such studies was explored rather fully (6) at about the same time. This technique of assessing the detonation transfer probabilities of a weapon system has'been applied a number of times.* The term VARICOMP was first applied PO the process In 1959.
hi technique hab been used for lnstance,at NOL In estibllshlng detonation tra&fer rellabllitles In the TALOS safety-and-arming mechanism and warhead, the experimental ~~-38 warhead, and the SHADOW explosive train. It has been further used by the Navy and Army to establish detonation transfer In explosive trains for a number of guided missiles.
2

NavWeps Report 7411
1.6 The assum tions VARImP method wi P
concepts and ap licatlon of the 1 be iiven here’along w E th such tools as
aensltlvity data and specialized statistical procedures needed to apply the method to practical ca8eB. (It is assumed that the u8er will have available the necessary statistical experl- ence to find and utilize the more conventional techniques as found In any standard statistical reference (7)). Attempts will be made to guide potential users of this process by the inclusion of suitable references, examples, and admonitions. The discussion here will cover In Sectlons 2, 3, and 4 the problem, the approach, and the philosophy of explosive penalty testing; In Section 5 the statistical aspects of exploslve sensitivity; in Sections 6 and 7 the VARICOMP explosives and experimentation; in Sections 8, 9, 10, and 11 various VARICOMP calibration and performance tests; In Section 12 problems associated with design of the VARICOMP experiment; and in Section 13 application and examples. Specific Information found important to utilization of the VARICOMP process but not necessary to the understanding thereof Is given In a series of Appendices.
1. -4 In order to facilitate referral, Figures and Tables have een given the same number as the paragraph In which they are. first mentioned. In addition, they are bound In a physical location as close as possible to the paragraph of this same number.
3

NavWeps Report 7411
2. THE PROBLEM AND THE APPROACH
2.1 A weapon 'system will accomplish Its Intended purpose onlyT it functions as intended at the place and Instant intended. Prediction of,the weapon system performance can be carried out In part by evaluating the -following probabilities:
Weapon Reliability -- The probability that the weapon will function where and when intended.
Weapon Safety -- The probability that the weapon will not function except where and when intended. (The safety Is customarily reported as the comple- mentary function -- the Probability of Unsafe Action).
Note that the above probabilities are Independent of any predictions, except dud rate, involving how well the weapon performs, such as 'limited yields, kill probabilities, or functioning on unsuitable targets.
2.2 Most weapon systems are complex, requiring the concate- natlKof many factors for proper functioning, The Wea on
probability figure can be computed by wombination
K-+ t e mu .tl- * of the individual probabilities of the
series elements. 'For instance, the explosive train pictured in the frontispleae 1s composed of a number of components. Each of these components will exhibit a certain performance with probability of individual action:
h Detdnator bridgewire will be intact.
p, Detonator flash charge will be in contact with bridgewire.
s Flash charge will initiate base charge.
4 cl Det nator base charge will give at least spediflcatlon minimum output.
P I
5 Rotor will be lined up within tolerance.
Pb Lead will respond to detonator output of spedlflcation quality.
*This-implies that each of the series elements functions lndepend- 5 ently of the others upon receipt of the proper firing impulse,
4
NavWeps Report 7411
Lead will give specification output.
Relay lead will respond to lead output of specification quality.
Relay output will give specification output.
Booster will respond to relay lead output of specification quality.
Booster will give specification output.
Warhead will respond to booster output of specification quality.
The probability that the warhead of delivery of the proper firing is:
i*ll,
will be initiated as a result slgnal into the explosive train
2. -4
Because of this multiplicative combination of the lndlvl ual reliabilities, the rellablllty of the entire system will be less than the rellabilit of the cGon=.
; of the least reliable g any Even where a 1 of-e components are of
xmnr&ty, the system rellablllty will be found to decrease seriously as the number of components Increases. In order to estimate this increased Individual reliablllty Imposed by the required reliability of the complete chain, the following reaeonlng can be used:
where
P is the system reliability id
p{ls the reliability of the - component
n is the number of individual components.
Assume
5

NavWepa Report 7411
Table 2.4
g+PERCENT CONFIDENCE SINGLE-SIDED ESTIMATE OF THE LOWER LIMIT OF RELIABILITY FOR
N TRIALS WITH ZERO, ONE, OR TWO FAILURES
N LR, Estimated Lower Limit of Reliability, Number of I for
Trials No Failures One Failure Two Fallurea
9
iz 14
16 82.94 73.60 18 84.67 76.23
;: z*:: . ;08% .
100 200 500
1000
2000 5000
10,000
>10,000
71.71 74.13 787o.g .
34.25 18.94 41.81 27.14 47.92 34.11 52.95 40.00
z*;z 66:ll 70.35
45.02
:xi f&44
95.34 93 .& 97.65 96.88 99.06 98.74 99.53 99.37
65.57 68.97 71.77 87.96
6

t
NavWepa Report 7411
If
then
This can be Interpreted: "In order to achieve a system failure rate no greater than Q for a series of h, equally reliable components, each compqnent failure rate must not exceed Q/b .' Experience has shown (2) that a certain small portion of the components cannot achieve the necessary high rellablllty. These components "use up" so much of the available margin that a more realistic value of ) might be given by:
2.4 The Indirect demonstration of very high rellabllltles for anelement, by testing to failure or by penalty testing, Is difficult. The demonstration of high rellablllty by direct, brute-force testing Is usually prohibitive, This Is true because a very large number of successful tests must be carried out to give sufficient authority to a statement 'of high rellablllty. Table 2.4 and Figure 2.4 Illustrate just how large a sample size would be needed to permit the following typical statistical statement:
"On the basis of no failures out of N trials, the population from which the sample Is drawn can be said, at g5-percent confidence, to be at least Lo reliable".
Note that the statement Is made In the approved style with the usual statlstlcal qualification "at
for this sample (size N 5-percent confidence". In
other words, Is considered pro'v';rsfonally to be P
the minimum reliability Only after many, many
samples had been tested, or else aftei the whole population had been expended, would It be possible to tell whether or not the rellablllty of the populatlon was truly equal to or greater than P Lacking such omniscience, the experimenter knows that he runs.8 l/20 risk of overestimating the true population proba- bility when using the above procedure. *The error of this estimate Is less than(hS?/Z
7

99.9
9.
99.9
%
- 99
.95
- 99
.9
- 99
.8
-
99.5
-
99.0
-
98.0
-
c95.
0 -
Ego.
0 -
au
k!
-80.
0 -
bo.0
-
3 z60.
0 -
a”35
0.0
- k!
40.
0 -
. 30
.0
-
20.0
-
.
10.0
t
5.0
2.0
L .
.
I.0
1 I
I I
, ,
, ,
, ,
I I
I I
, ,
, ,
, I
1 I
, ,
, ,
, ,
I I
I ,
k,,l,
2
3 4
5 67
8910
20
30
40
50
6070
80
100
200
300
500
IO00
20
00
5000
10
000
NUM
BER
OF T
RIAL
S,
k
FIG
UR
E
2.4
95-P
ER
CE
NT-
CO
NFI
DE
NC
E
SIN
GLE
-SID
ED
E
STI
MA
TE
OF
THE
LO
WE
R
LIM
IT
OF
RE
LIA
BIL
tTY
FO
R
N
TRIA
LS
WIT
H
ZER
O,
ON
E,
OR
TW
O
FAIL
UR
ES
NavWeps Report 7411
2. 9 If rellablllty prediction by direct demonstration is not easlble, then the answer must be obtalned by some other approach. One such approach Is by the synthesis of relevant data such as past experience , penalty testing results, or collnear studies to give a quantitative basis for statistical Inference. Such a process, though usually not formalized, IS what la meant by the phrase “engineering judgement’!. The relevant data, then,’ are taken from almllar devices or sltua- tlons’..to augment the limited Information that c&n be obtained by direct experimentation. Such similarity data must be handled skillfully in order to prevent Invalidation of Inferences because of the dlsslmllarltles that do exist.
2.6 Penalty testing (overtesting, testing-to-destruction) Is a=xact source of relevant data only when the conditions of the penalty test differ in intensity but not in kind from the natural environment. This Is an Ideal which, for detonation transfer systems, may be very difficult to attain. It .ls possible to use data which are gathered from systems whose conditions are not exactly the same but are analogous. Provided the analogies do apply, penalty testing offers a method for obtaining dataxlch will permit higher probability estimates for a given sample size than would be possible by direct testing.
2,r(_ Figure 2.7 is a symbolic presentation of the concept of penalty testing as It might apply to a mechanical system sub- jected to adverse environmental stresses. It shows to some extent the statlstlcal nature of the problem. Four designs, A, B, C, and D, are shown as having different capablllties for resisting the adverse environment. Because of the unavoidable and Inherent differences between Individual items of a sample taken from the parent population, the “strengths” (abilities of the design to resist an adverse environment) are shown as being distributed about a characteristic central value. In this example, design A has a failure response to relatively low Intensities of the adverse environments. Design B is somewhat more reslstlve. Designs C and D are still more resistive. They show about the same central values of failure response to adverse environment& However, the response of design C Is much more scattered than that of design D and Is, in fact, marginal whereas design D Is alearly reliable.
2.8 The environment Intensity with which the design must copeT also random in nature and IS therefore shown as being distributed about a central (average) value. Whether or not a particular design is sufficiently reliable depends upon how much more durable the design actually Is than the environment.
9

NAVWEPS REPORT 741 I
DESIGN 0, RELIABLE
DESIGN C, MARGINAL
f DESIGN 8, MARGINAL
DESIGN A, UNACCEPTABLE
INTENSITY -
OF ADVERSE ENVIRONMENT
f = RELATIVE FREQUENCY
~~~ : PROBABILITY DENSITY
ENVIRONMENT THAT THE DESIGNS WILL ENCOUNTER IN USE.
FUNCTION DESCRIBING THE ADVERSE STRESS
PROBABILITY DENSITY FUNCTION DESCRIBING THE FAILURE RESPONSE
OF VARIOUS MECHANICAL DESIGNS TO THE ADVERSE STRESS ENVIRONMENT.
FIGURE 2.7 SYMBOLIC REPRESENTATION OF THE ABILITY OF VARIOUS MECHANICAL DESIGNS
TO WITHSTAND AN ADVERSE STRESS ENVIRONMENT
IO
NavWeps Report 7413
f
it will meet. In the case of designs A, B, and D, the position of the mean (SO-percent response) lntensltles has a major effect on the rellabillty. It is evident that design A will not be able to cope with the expected environment. About 10 percent of these items would be. expected to fall. Design B would be considered marginal because a slight Increase in stress and/or decrease In design capability would lead to failures. Design D could be considered to be adequately reliable. Design C, on the other hand, Is marginal even though Its average capability Is equal to that of design D. Some of the worst Items of design C are no better than the worst of design B.
2.q Penalty testing, as It would be applied to explosive systems and in particular to detonation-transfer studies, appears to be different in nature from the mechanical concepts Indicated above. Yet this difference can be resolved by proper definition of terms and goals as In Table 2.9.
2.10 From Table 2.9 It can be seen that detonation- tran= safety and detonation-transfer rellablllty are comple- mentary In concept and In testing approach. However, the safety tests and the reliability tests often differ In matters of Interpretation of evidence , particularly in the case of margln- allty . After a marginal explosive safety test, there will often be enough witnessing of the explosive vigor and action from the appearance of the Inert parts that marginality can be deduced. In fact, it Is often possible to deduce the cause of marginality. On the other hand, the uproar and damage produced by imperfect functlonlng of a marginally reliable system may not be dis- tinguishable from the performance of a fully reliable system.
2.11 The general method of penalty testing, mechanical or explGEe, response or non-response, Is:
Find the severity of conditions that will Induce system failure.
Find the severity of conditions which will ordinarily be encountered by the system.
Take the separation between the severity of conditions which the system can resist and the severity that actually e=tsto the measure of the conservatismwent In the system design.
11

Tabl
e 2.
9
PEN
ALTY
TEST
ING
AS
IT
IS
USE
D T
O A
CH
IEVE
VA
RIO
US
DES
IGN
OBJ
ECTI
VES
Fact
ors
I M
echa
nica
l D
esig
n
Jsnt
i-wt--
Vib
ratio
n,
tens
ion,
co
mpr
essi
on,
etc.
D
esig
n Be
abl
e to
w
ithst
and
Obj
ectiv
e ex
pect
ed
envi
ronm
ent.
G
Syst
em
Failu
re
Fatig
ue
failu
re,
fract
ure,
sh
ear,
etc.
Syst
em
I N
o da
mag
e or
In
cipi
ent
Suc
cess
fa
ilure
. M
etho
d O
f Te
st
to
failu
re.
Test
ing
Find
th
e en
viro
nmen
t In
tens
ity
that
w
ill
caus
e sy
stem
fa
ilure
.
Que
nchi
ng
of
deto
natio
n.
deto
natio
n tra
nsfe
r. io
ns
to
trans
fer.
How
muc
h w
eake
ning
ca
n ow
muc
h ex
tra
can
occu
r w
ithou
t su
ppor
ting
he
shoc
k ov
erco
me?
de
tona
tion?
---
------
---
---
---
- --
- Lo
ad
targ
et*
with
ov
er
oad
targ
et*
with
se
nsiti
ve
expl
osiv
e.
nsen
sltlv
e ex
plos
ive.
H
ow s
ensi
tive
can
the
ow I
nsen
sitiv
e ca
n ex
plos
ive
be w
ithou
t he
ex
plos
ive
be
wlth
- su
ppor
ting
deto
natio
n?
ut
quen
chin
g de
tona
tion?
*Tar
get
Is
here
us
ed
to
desi
gnat
e th
at
com
pone
nt
who
se
prob
abili
ty
of
bein
g In
itiat
ed
Is
bein
g st
udie
d.
1 *
1, ‘?I
. ‘1
NavWeps Report 7411
.
It can be seen that penalty testing la but a new name for a time-honored approach to engineering problems. The structural engineer uses penalty testing to find failure levels for the materlala he will specify. He finds out how much more durable the material is than 3s necessary for the intended application. That is, he designs so that the structure will be able to withstand much greater static and dynamic loads than It will ever experience. The capability of the structure Is a measure of how conservatively designed (over-designed) the structure is, It Is In some fashion a measure of how reliable the design la.
2.12 Specifically, penalty testing can be applied to explse systems to evaluate quantitatively their safeties and rellabllitles:
EF l A true probability of response (usually very which Is less than some specified value for a
given stimulus.
Fi;,':a;;;;;y .* A true probability of response (usually which Is greater than some speclfled value
for a given stimulus.
In order to facilitate treatment of the material in this report, rellablllty concepts will be considered primarily, with the understanding that complementary safety concepts will ordinarily apply In similar fashion.
*A confidence limit must also be specified (usually quite high) to allow the estimates to Incorporate the correction necessary to compensate for component manufacturing variations and possible errors In the penalty testing determinations.
13
NAVWEPS REPORT 741 I
DESIGN CONFIGURATION
A
S
EXPLOSIVE a, A I\ 45-MIL BARRIER
EXPLOSIVEa, 6+vllL B+RRlER f
S
SHOCK INTENSITY NEEDED TO FIRE THE LEAD WHEN LOADED WITH EXPLOSIVE Q
SHOCK INTENSITY AVAILABLE TO THE LEAD FROM THE DETONATOR ACTING THROUGH A l5-MIL BARRIER
SHOCK INTENSITY AVAILABLE TO THE ACTING THROUGH A 30-MIL BARRIER
SHOCK INTENSITY AVAILABLE TO THE A’CTING THROUGH A 45- MIL BARRIER
SHOCK INTENSITY AVAILABLE TO THE ACTING THROUGH A 60-MIL BARRIER
RiELATlVE FREQUENCY
R;ELATlVE SHOCK INTENSITY I
LEAD FROM THE DETONATOR
LEAD FROM THE DETONATOR
LEAD FROM THE DETONATOR
3.1 EXPLOSIVE PENALTY TESTING BY
VARIATION OF BARRIER THICKNESS I
14

NavWepa Report 7411
3. PHILOSOPHY OF EXPLOSIVE PENALTY TESTING
3.1 The basic Idea of penalty testing la in some ways anal-us to handicapping as it Is used in sporting events, although for a different reason. A handicap Is Imposed In an attempt to make an equal match between otherwise unequal contestanta. The magnitude of the handicap Is a masure of how much better one contestant la expected to be than another on the basis of past experience. If an exploalve transfer Is penalized by some alteration ln the system, the amount of penalization should give a measure of how much the original system would outperform the penalized system. For Instance, In Figure 3.1 a typical detonator-to-lead arrangement Is shown In which the lead is separated from the detonator by a metal barrier (design A). Penalization of the detonator- to-lead transfer can be accomplished geometrically by thickening the barrier as In dealgns B, C, and D. If In designs B, C, and D detonation transfer occur8 as ahown and It can be assumed that the increase of the barrier thickness In no way enhances the transfer but in fact degrades It, then it can be seen that the detonator han conalderable reserve In the dealgn configuration. It will be shown later how to measure the magnitude of this apparent reserve and convert It Into a rellablllty eatlmate.
3.2 The generalized aaaumptlons underlying the methods of pZZlty teatlng are:
ASSUMPTION 1 A response la caused by an environment.
ASSUMPTION 2 The environment exists in various Intensities or dosages.
ASSUMPTION 3 The experimenter can control, or at least measure, the dosages.
ASSUMPTION 4 The test environment can be related meaningfully to the actual weapon system environment.
ASSUMPTION 5 The probablllty of response Is a monotonically Increasing function of the donage.
These statements may appear a bit obvloua or trivial. Yet the validity of the penalty testing approach depends upon the verity of each of them.
15

NavWeps Report 7411
3.3 It now becomes obvious that penalty testing Is not a way of'gettlng something for nothing. The above listed assump- tions are tenable only If the technology, knowledge, and previous experience bear them out. The last sentence of Paragraph 2.6 ~
I II penalty testing offers a method for obtkkngidata which will permit higher proba- bility estimates for a given sample size than would be bosslble by direct testing . . .'
Is lmpllcltly augm nted by the phrase II bebause of the previous existence of a'l&e b+dy of relevant Information."
G .4 Consldera~le experience with the penalty testing of explos ve systems 8 y geometrical modification has been amassed by using such techniques as mlsallgnment of train and lnter- position o,f barrleTs. In many cases this has been an effective approach. However, In some Instances, erroneous results have been obtained because the modification of the geometry of the explosive system has violated one or more of the basic assumptions, as Indicated by the following examples.
method for demonstrating the of a rotor-arming fuze train (Figure 3.4.1)
much angular mlsallgnment, e detonation transfer fall&es
the value of g (the angle at which the lead In 50 percent of
the trials) will be a measure of how reliable the system wllJ be in terms of the mechanical alignment errors tolbe expected In the arming process. However, the angle IB Is so strongly dependent upon the physl- cal allgqent of the_ charges that there may be little difference between 8 for a rotor lead which has fully reliable $ensltlvlty and the 5 for a rotor lead which Is mar
7 lndlly sensitive. The work done by Stresau and
Starr 8) 'on transfer between misaligned explosive columns loaded Into heavy-walled containers is an Illustration of this effect.
3.4.2 A different type of Irrelevant effect has been recorded where a partially aligned train was reliable but a fully aligned train failed because the explosive components could be dislodged rather than lnltlated by the explosive action.
NavWepe Report 7411
3.4.3 Variable air gaps introduced between the donor and acceptor charges to measure reliability can lead to erroneous conclusions because maximum reliability can occur at intermediate values of air spacing. For both lesser and greater air spacings the reliability may fall off sharply. This has usually been observed with cased donor charges. This stand-off effect Is therefore attributed to the fact that the donor case forms fragments (g,lO,ll). During the transit across the air gap, the fragments are accelerated by the detonation process. An optimum gap can be found wherein the fragments have enhanced the Initiation process. Beyond this optimum gap the Initiating pulse has been attenuated to such an extent that Initiation becomes more difficult. In such cases, the assumption of monotonic increase of the shock attentuation (and therefore of the penalty)wlth increasing gap is lnvali- dated. Before this nonmonotonlc tendency of air gaps was recognized, variable air gap penalty testing was frequently used to evaluate explosive systems. In one Instance, a design which had been accepted on the .basis of such data, exhibited a 40-percent dud rate In the pilot lot.
DETONATOR
ROTOR LEAD
IN-LINE 45-DEGREE (ARMED) OUT-OF-LINE
l/l 63 go-DEGREE
OUT- OF-LINE (SAFE01
FIGURE 3.4.1 ROTOR -ALIGNMENT ARMING SYSTEM
17
NAVWEPS REPORT 741 I
I I
f=
s=
DESIGN CONFIGURATION
EXPLOSIVE& l5-MIL BARRIER
EXPLOSIVE p, 15-MIL BARRIER
EXPLOSIVEy, I5- MIL BARRIER
EXPLOSIVE 8, 15-MIL BARRIER
SHOCK INTENSITY AVAILABLE TO THE LEAD WHEN ACTING THROUGH A l5-MIL BARRIER
SHOCK INTENSITY NEEDED TO FIRE THE LEAD WHEN LOADED WITH EXPLOSIVE Q
SHOCK INkENSITY NEEDED TO FIRE THE LEAD WHEN LOADED WITH EXPLOSIVE p
SHOCK IbjTENSITY NEEDED TO FIRE THE LEAD WHEN LOADED WITH EXPLOSIYE y
SHOCK IN~TENSITY NEEDED TO FIRE THE LEAD WHEN LOADED WITH EXPLOSIV~E 6
RELATlVd FREQUENCY
RELATIV? SHOCK INTENSITY
FIGURE 4.2 EXPLOSIVE PENALTY TESTING BY
VARIATION OF ACCEPTOR SENSITIVITY I I8

NavWeps Report 7411
4. EXPLOSIVE PENALTY TESTING BY VARICOMP
4.1 The discussion so far has been limited to pensllza- tion7 detonation transfer by geometrical modifications. The effect of such changes Is to reduce the shock strength which has arrived at the acceptor. The reduction has been accom- plished by out-of-line, barrier, or gap modifications. Another method of penalization of a detonation transfer (another way to reduce the probability of transfer) would be to modify the explosive in a way that would make It more difficult for detonation transfer to take place. Two methods of VARIatlon of explosives COMPosition can be used to penalize a detonation transfer:
The donor charges can be made from explosives of different output. Output variation can be accomplished by changing charge density, quantity, or formulation.
The acceptor charges can be made from explosives of different lnltiabilities (sensitivities). The sensitivities can be varied by varying charge density or formulation.
4.2 Figure 4.2 Illustrates the VARICOMP method for evalzlon of a detonator-to-lead transfer. The example has been chosen intentionally so that the design configuration is identical with the design configuration of Figure 3.1. A careful comparison of these two examples will delineate some of the slmllaritles and some of the differences between the two methods of detonation-transfer penalty testing:
Geometrical Modification
VARICOMP.
In the example shown in Figure 4.2 the design conflguration is loaded with Explosive # . Penalization in the test is accomplished by the use of successively less sensitive explosives --Explosive p Explosive Y and Explosive s -- as a method of imposing &easing penally. Note that in this case the magnitude of the shock arriving at the lead is the same In all configurations, whereas in Figure 3 .I the ma nitude of the shock was varied while the explosive target (lead B sensitivity was held constant (Explosive Oc ). One version of VARICOMP, namely, variation of donor explosive, is very similar to Figure 3.1 in that the shock strength Is varied while the acceptor sensitivity is held constant.

NavWeps Report 7411
5. THE STATISTICAL ASPECTS OF EXPLOSIVE SFNSITIVITY
5.1 Since this report deals with the transfer of detozlon from one explosive charge to another It Is appropriate to describe the detonation process and how it Is established. Detonation In solid explosives is a steady, hlgh-speed reaction sweeping through the material as a wave. As thls wave passes each point in the charge there occurs:
First, the passage of an Intense compresslonal shock.
Next, after an adequate Induction time* the reaction -the compressed explosive. This reaction is accomplished In a fraction of a microsecond with the formation of gaseous detonation products which are at very high temperatures and pressures.
the expansion and %%%iation products
further recombination of (The work from the detonation
Is obtained during thls'stage of the process.)
The detonation wave progresses at 7000 to 8000 meters per second; the detonation pressures obtained are on the order of 200,000 to 300,000 atmospheres; the maximum temperatures of the gases are on the order of 3500 to 4000' Centigrade.
5.2 A detonation wave In an explosive is normally self- sus tZZlng. A detonation wave entering an explosive must be re'&stablished In the new charge even though It had been stable at all points up to the Interface. (Any transition across an Interface is considered entering a new charge.) The reestab- lishment of detona~tlon Is accomplished by starting a chemical reaction in the explosive with an external stimulus. If conditions are right, detonation will result. A stimulua which would start the reaction would normally be a heat pulse, a shock, or both.
Heat Stimulus. Initlation by a heat pulse would occur from exposure to a wire bridge or s heat bath at a high enough temperature. Explosives are classified as primary or secondary on the basis of their response to such a stimulus. Reaction of a primary explosive initiated by heat grows rapidly to a detonation.
*The induction time may vary from a fraction of a microsecond for a material like RDX to-several microseconds for other lass sensitive explosives.
20

NavWeps Report 7411
t
Reaction of a secondary explosive initiated by heat would be burning without detonation. Detonation would occur only if pressures could build up to develop the shock that must preceed the detonation. (By practical tests the primary explosives are also much more sensitive than the secondary explosives to shocks.) Since this Initiation mechanism will not generally yield detonation in secondary explo- sives (high explosives) It ~111 not be considered further.
Shock Stimulus. Shock or Impact on the charge surface will send a shock wave Into the explosiVie. If the shock is intense enough the explosive behind the shock will start reacting rapidly, the energy released will feed the shock, and the reaction will grow to detonation. If the shock Is weak, little or no reaction will occur behind it and the shock wave will die out without producing detonation. All intermediate degrees of reaction might occur for Intermediate Intensities of shock.
Numerous references to this subject are available. The most pertinent are: A discussion on the initiation and growth of explosion In solids under the leadership of F. P. Bowden, F.R.S. (12), the Gilbert B. L. Smith Memorial Conference on Explosive Sensitivity (13), and the Third Detonation Symposium (14).
5.3 The Intensity of the shock stimulus needed to initiate detomion In an explosive charge Is a function of many factors. These Include, among others:
Type of explosive
Impurities present and their dlatrdbution within the charge
Dlluents present In the charge
State of the explosive (cast, pressed, particle size)
Density of the charge
Ambient conditions
Confinement
Method of application of the stimulus.
21

NavWeps Report 7411
Each of these fac;tora in its place might be important in affect- ing the response of the explosive to a stlmulus. If precise
. control of these various factors could be maintained, then presumably, a quantitative relationship of explosive response to initiating stimulus could be described. This control is not posalble, Further, In detonation transfer considerations the quantitative response of the explosive Is not needed but only knowledge of whether or not the charge detonated. The problem of characterizing the response of the charge Is thus simplified to the,determlnatlon, by a statlstlcal experiment, of the percentage of detonations that will occur for stimuli of various lntensltles.
5.4 The sens$tlvlty or, more precisely, the order of sensmvlty, of explosives can be characterized by a sensl- tlvlty test. (A number of such tests will be Indicated later.) Explosive compounds can be found that fall almost anywhere on the sensitivity scale from spontaneous explosion to practically non-explodable. With the proper precautions and procedures common explosives are insensitive enough to be handled (compounded, loaded, stored, deployed, and launched) with little risk. Yet they are sensitive enough to be lnltla- table with nominal magnitudes of stimuli. Sensitive explosive compositions can be desensitized by addlng homogeneously dls- trlbuted dlluents. These dlluents are soft Inert materials such as waxes. The desensitizing process Is:
Coating of the explosive grains
Providing heat sinks to absorb energy that would otherwise Initiate the explosive
Fllllnginterstitialvolds, thus distributing the heat Of compression more uniformly so that the hot- spots are less hot.
In the reverse direction, Insensitive explosive compositions can be sensitized by the addition of small amounts of some sensitive explosive.
u In previous paragraphs of this section, the explosion process has been described as being caused by some form of external stimulus. Because the Initiation process takes place at the molecular level Inaccessible to direct sensing by instruments and observation, the nature, amount, and character of the stimulus can only be Inferred. It cannot be measured. What can be measured (and usually also controlled) Is the dosage. The dosage is deftned as the Intensity of an environment which
NavWeps Report 7411
can Initiate explosive action. Note that dosage Is measurable while stimulus Is not. Yet, as will be brought out later, the statistical techniques of VARICOMP are based on the predictions of performance as related to stimulus rather than dosage.
5.6 The sensitivity of an explosive Is therefore determined In t=s of the physical variable--the dosage--which Is the measurable parameter In the experimental method. It Is custom- ary to report the sensitivity as the Intensity* of the parameter at which 50-percent response is observed. As a consequence, In cases such as drop sensitivity, electrical pulse sensitivity, bullet sensitivity, etc., the larger the 50-percent response Intensity, the less sensitive the explosive. (It might be said that these are "explosive insensitivity figures".) In other tests, wherein a standard input signal Is moderated by a variable attenuator and the size of the attenuator Is the physical variable, the numerical value will vary in the same sense with sensitivity unless a transformation function such as reciprocal gap or logarithm of the reciprocal gap (15) 1s used. Many different sensitivity tests (6,15,16,17,lb,19,20,2~) have been developed, some oriented more toward ordering explosive sensitivities with respect to loading conditions, anA others with respect to performance in explosive end items. Part of the technique of VARICOMP lies In the appropriate choice of sensitivity test.
5.7 The technique of making explosive sensitivity determlna- tlonzn a sample of explosive charges or items must accomodate rather unusual restrictions which arise from the inherent nature of explosives. These restrictions become evident from the following tabulation of possible results and Inferences of a sensitivity test.
An explosive Item when subjected to a sensitivity test will either be initiated (In the desired fashion), or be not initiated.
When the Item Is initiated, It Is not possible to determine how much less the dosage could have been and still have caused Initiation.
*In some cases a mathematical transformation of the intensity figure Is use,j., the transformation being an attempt to state the sensitivity as a function of stimulus.
23

NavWeps Report 7411
When the item iS not initiated, it should not be retestedi- the Item (If not destroyed) may have been altered as a consequence of the test. It can no longer be considered to be from a true sample of the parent population. It Is therefore not permissible (or even possible) to determine from a failed item the dosage* that would have caused Initiation.
Thus it can be seen that each item can be tested only once, and that for each test it can be said only that the item fired or did not fire. testing.
This type of testing is called Go/No-Go The statistical methods of treating data from such
tests are classed as the "Analysis of Attributes" (7,22,23),
5.8 It would seem that the alternative nature of the possETe results of a sensitivity test--fire or not flre-- would at least simplify the problem of Identifying the outcome of each test. Unfortunately, In some cases, there exists a gray area that requires aophlstlcation in the determination of whether or not the item responded In the design mode as differentiated from another mode of explosive action. The choice of criterion of fire can affect the interpretation of the observed behavior and can also affect, the final values of sensitivity deduced from the data (15,24), As a phllo- sophical digression, consider the poaslblllty of errors In the assessment of the data resulting from changes In the observer's knowled~ge:
The asseeisment depends upon the acuteness of the observer land upon his evaluation of what he observes. His evaluation and judgement Is based on his knowledge and experience. But his knowledge and experience are being amplified even as he ia carrying out the test. Is It possible that his knowledge can be so altered during the test and by the test results that his basis of judgement changes materially during the test?
*If it can be assumed that the subjection of an item to a sensitivity test cannot convert that Item from a 'dud" to a "fireable unit", then the failed item can be retested at a high Intensity level w$th the following possible results and lnfer- ences therefrom:
Did Fire ~ i
-- Therefore was not a dud. . . ..-.
Did Not Fhre i- No conclusive answer (The Item may have been dudded by the first test).
24

NavWeps Report 7411
While the above interaction probably Is in most cases a second- order effect, the possibility of Its occurrence should not be forgotten.
5.9 The factors which control the response of a particular explxve to a particular firing Input are manifold as men- tioned in Paragraph 5.3. As a consequence, the statement of the sensitlvlty of an explosive becomes meaningful only when the kind of sensitivity under the specific test conditions Is also specified, For Instance, 'gap test sensitivity" is not a sufficient designation since there are, among others,
The small scale gap test (15)
The propellant sensitivity test (20)
The wax gap boosterlng sensitivity test (18)
A number of different sensitivity tests are useful in the VARICOMP procedure. Depending upon the relative Importance of the factors which would differentiate the way the explosive would respond under the different test conditions, it Is logical to seek a correlation between results of different sensitivity tests. In fact, the VARICOMP approach becomes particularly effective when good correlations between appro- priate sensitivity tests exist. As a word of cautlon-- Impact or drop sensitivity data should not be expected always to be relevant in this general area of detonation transfer. In general, however, the correlation between Impact sensitivity and gap sensitivity of many explosivea is often good enough to permit the use of the Impact sensitivity test in a search for likely candidates to consider in a VARICOMP program.
l
5*10 The sensitivity of an explosive Is measured experl- mentw by subjecting a number of explosive charges or Items to various dosages. In such a program there are unavoidable differences in the items, each from the other; the ambient environment varies throughout the course of the test; there are unavoidable differences between the intended and the achieved dosages of each successive trial. As a consequence of these and other variabilities there exists a certain band or zone of dosages within which the Items will be found some- times to respond and sometimes not to respond. The less the variability, the narrower will be this zone of chance response. In the limit (absolute control of charge, environment, and dosage) it might be expected that there exists a single value of dosage below which none would respond and above which all would respond. This model la an over simplification in that the lnltlatlon process Is In itself random in nature.
25

NAVWEPS REPORT 7411
.
F
P
DOSAGE,D
FIGURE 5.11 RESPONSE TO DOSAGEJUMULATIVE DISTRIBUTION FUNCTION
26

NavWepa Report 7411
.
5.11 Finer detail can be resolved within the zone of chance response. As shown qualitatively In Figure 5.11, there Is a level of dosage * at which one half of the population would be expected to respond. This particular dosage is termed the 50-percent point.
For progressively less than the so-percent point the response asymptotically approaches zero. Slmllarlly above the SO-percent point as the dosages are Increased the response asymptotically approaches a probability of 100 percent.
L
Because of this asymptotic behavior, concepts of a "no-fire level" or an "all-fire level" are of dublouer value. They lead to amblgultlen, particularly when attempting to predict population parameters from the sample parameters. In particular, the term "all-fire level" Implies that the devices are 80 perfectly made that all will function--that there are no duds. Actually, It is not possible to tell whether or not the response-dosage relationship Is truly asymptotic In the extreme. For Instance, It Is beyond human capabllitles to differentiate by any experlment between the dosage which will give 99.9990- percent functioning and the one that will give 99.9995-percent functioning.
5.12 The Statistical .Dlstrlbution Function. There are manywatlons which might be considered to express relationship such as Is shown In Figure 5.11,
5.12.1 The moat generally encountered distribution n normal, or Gaussian, whose probability density function Is:
The Gaussian cumulative distribution function Is:
aUsually Indicated mathematically by drawing a bar over the symbol for the dosage.
27

NavWeps Report 7411
+-- 12.2 More recently the logistic distribution has
een studied and found of use In a number of explosive systems (25). It Is defined In cumulative form as
or In a form particularly useful for computation
Expressed In the symbolism used in this report It can be written as
where represents the mean, and x = ' b 4
3iw in certain cases both Gausslan and logistic s r bu$lons have been found not fully satisfactory
as a deshrlptlon of explosive systems. In general, the obseived sample responses at high dosages are less than would be predicted by observatlons near the mean firing levels. Similarly, responses at low dosages are greater than would be predicted. Work by Ash and Lacugna (13) suggests that the following distribution might be of particular value for those dlstrlbutlons which appear to have much longer tails than the Gaussian. The probability denslty function Is:
*Fisher and with
Yates'(26) discuss this type of distribution function
,
28 m

NavWeps Report 7411
where A and B are arbitrary constants. The cumulative distribution function Is:
2.13 In the above equations the symbols y ,g,$, and1 represent population parameters:
b is the value of the stimulus, % , at which 50 percent of the population will respond.
6, $snd f are Inversely proportional to the slope of the cumulative distribution function when the value of % Is equal to 1~ .
The parameters,a,‘r,and $ are measures of the variability of the population. The bigger their values, the more variable Is the population, Greek symbols p ,6,$ , and f are reserved for the population parameters. The corresponding sample properties are represented by 'E (the value of stimulus at which 50-percent response was noted), and ,4 and 9 (the measures of the observed sample variability). In the case of the Gaussian distribution, #- Is the “standard deviation’ (the square root of the sample variance).
.14 All of the above dlstributlon functions relate func k- oning probability to stimulus. As was mentioned In Paragraphs 5.5 and 5.6, the stimulus is not necessarily the same as the dosage. Experience has generally shown that these two things are not the same. Some transformation function has to be fox to relate the physlcal variable to the stimulus (27). In a number of Instances the logarithmic transform has been chosen as the most suitable,
5.15 Statistical Model. The term “statistical model” is used to refer to the mathematical relationships which describe the response of an explosive system to the environment being studied. The statlstlcal model therefore is made up of
The probability distribution function,
The dosage-to-stimulus transform.
29

NavWeps Report 7411
The term 'probability distribution function" as used herein does not dlstingulsh between the probability density function (the bell-shaped $urve such as.Flgure 3..1) and the cumulative function (the sl&oldal curve such as In Figure 5.11). The term Is used-to dffferentlate between distributions such as Gaussian, logistic, etc.
5.16 Probability Spapes, By using specialized coordinate systxit Is poasLble to devise methoda for plotting statlsti- cal Information in a manner which will facilitate computatlone and demonstrate relationships, The nigmoldal plot supresses the detail above 98 percent and below 2 percent--the zones of particular Interest. It Is also not amenable to eye-fitting of observed data--It In much simpler to fit data with a straight line than with a compound curve. Probability graph paper has been delblgned to display details of extreme proba- bllitiea and to facllltate fitting of data. The vertical coordinates are symmetrically arranged about a midpoint on the vertical axis,representlng a probability of 50 percent. The probability l&reases upward approachlng,but not reaching, 100 percent; and +mllarly It approaches 0 percent as It decreases downward from the midpoint. In graphical displays of this form, the'vertical coordinates are often presented in units of problts, normlts, .or loglts In addition to, or Instead of, the probability values .
The normqt Is based on a Gauaalan distribution whose mean, jJ ~, Is zero, and whose standard deviation, Q is unity. Its probability density function therefore' Is: ;
The normlt and the problt are cumulative response units, and are of Identical size. However, the number of problta corresponding to a glwh'pe-Fcaht response ,la 5.0 greater than the number.of ndrmlts,
The logit' Is related to the logistic distribution as the normit Is to be the Gaussian; the probability density function being:
30

NavWeps Report 7411
Note that in the case of the logistic function, 5 Is a measure of the variability but 1s not the stanaard deviation.
The Gaussian and logistic distributions are compared In Table 5.16 and presented In a probablllty space (to Illustrate the forgoing concepts) In Figure 5.16.
5.17 Two methods will ordinarily be used to present statistical Information graphically In this report. Figure 5.17 shows the sensitivity of the same three typical explosives to Illustrate the two methods of presentation.
5.18 For the purposes of this report, the Gaussian dlstrl- butaons will be used throughout --It being left to the reader to adept the techniques as necessary, should some other dlstrl- butlon function be Indicated.
In order to systematize the methods of presenting and judgement three basic steps must be taken:
Assumption of a statistical model for the response of the explosive as a function of stimulus.
By experiment, determination of the sample properties.
In terms of the statistical model, estimation of the limits for the population parameters, using the sample propertles as data.
31
2.5 2.0
1.6
2: 0:4
-2.0 -2.5 -3.0
:;*z .
NavWepa Report 7411
Table 5.16 .
COMPARISON OF GAUSSIAN AND LOGXSTIC DISTRIBUTIONS
94-v 88.49
z;*;i .
2~27 0162 oh35 oLo23 01003
Loglstlc (1)
99.87 99.71 99.33
;:*;6' .
93.51 88.10
3.44 1.68
3.95 1.82
0.67 0.83 0.29 0.37 0.13 0.17
Logistic (2)
;;*t; 99: 17 98.18 96.05
92.77 87.15
gE! l
;:*;i 21182 12.85
7.23
Notes:
u 1s the normalized variable
The Gaussian distribution 1s computed for the case of u = 0 and Q ='I,0
Logistic (1) Is computed for u - 0 and fl = 0.6 (so that the Gaussian and logistic distributions coincide at l5.87- percent, SO-percent, and 84.13-percent responses)
Logistic (2) Is computed for c = o and G = 0.623 (so that the Gaussian and logistic distributions are tangent at 50- percent response. '5
E
32

NAVWEPS REPORT 7411
9-
B-
'0 -
10 -
IO -
IO -
- - - GAUSSIAN DISTRIBUTION FOR CASE OF u=O AND o- = I
5- / - - - GAUSSIAN DISTRIBUTION FOR CASE
2” OF u=O AND o- = I
I - LOGISTIC DISTRIBUTION FOR CASE OF
/ / i=O AND 7 = ,623 (LOGISTIC AND
/ / GAUSSIAN TANGENT AT 50-PERCENT 4 RESPONSE)
I. I - //
LOGISTIC DISTRIBUTION FOR CASE OF
3.0
2.5
2.0
I. 5
I. 0
0.5
zt; I+
0 $i
go z OE:, -0.5 n
-1.0
- I.5
-2-o
- 2.5
- 3.0
/ I I I I I I I I -4 -3 -2 -I 0 +I +2 +3 +4 +5
NORMALIZED VARIABLE, U
FIGURE 5.16 COMPARISON OF GAUSSIAN AND LOGISTIC DISTRIBUTIONS
33

4. 2
4.0 /
Q
Q
3 1.0
2.0
3.t
COMP
OSIT
ION
(PER
CENT
CA
LCtU
M ST
EARA
TE)
I -R+k
--
9:
x + IS
, --
R
- x -
lsm
si
- Is
STIM
ULUS
tN
TENS
tTY
(OBg
l
FIG
UR
E 5.
17 S
ENSI
TIVI
TY
OF
VAR
IOU
S R
DXK
ALC
IUM
ST
EAR
ATE
CO
MPO
SITI
ON
S
99.9
99.8
99
98
95
90
2 I x3
12
3. I
\

NavWeps Report 7411
6. THE VARICOMP METHOD
6.1 The basic approach and application of the VARICOMP methwia:
6.1.1 Given: Two explosive charges In a weapon system separat- some demarcation such as a metallic or plastic membrane, an air gap, or perhaps just a surface of physical contact between the two charges. The
INTERFACE
FIGURE 6.1 .I
THE EXPLOSIVE SYSTEM
demarcation is termed the interface. The donor Is the charge which is initiated externally and is the source of detonation which Is to be.traneferred across the interface into,the acceptor (Figure 6.1.1).
6.1.2 The Problem: What la the probability that detonation will be transferred from the donor, across the interface, Into the acceptor? What is the confidence that can be associated with the estimated transfer probability?
6.1. 32 The Approach: The explosive system Is tested
W the acceptor made from one or more explosive compositions which are bown to be less sensitive than the design explosive. (Alternatively, the system can be tested with the donor made from one or more explosive compositions which are known to have less output than the design explosive .) These trials, termed Performance Tests, are to be carried out with a minimum deviation from the configuration of the weapon both as to the interface and the surrounds for donor and acceptor. Here again the skill of the
35
NAVWEPS REPORT 7411
DECIDE GOAL , +--~~~~,L,,,
SERIES I t STANDARD EXPLOSIVES
01 5 CARRY OUT CALIBRATION
DOES CALIBRATION
t
IF NO 4 DESIGN AND CARRY OUT
a TEST CONFIGUR/iTION MOCK - UP CALIBRATION c RESEMBLE 0 ENOUGH? IF YES 1 OF VARICOM P EXPLOSIVES
0 9
0 IO
DATA REDUCTION
DETERMINE MEANS, STANDARD DEVIATIONS FROM STANDARD
ESTIMATE ERRPRS DEVIATIONS AND *O I2 ERRORS
I 1 EST1 MATE DETONATION TRANSFER PROBABILITY
COMPUTE CONFIDENCE
LIMIT ON II 0
FIGURE 16.2 FLOW DIAGR$l FOR VARICOMP

NavWeps Report 7411
experimenter is drawn upon. In the interests of economy of material and time, as little hardware as possible would ordinarily be used other than that which affects the detonation transfer. The performance tests are use,3 to determine how reliable the weapon will be, even when loaded with the less sensitive (or less vlg- orous) explosives.
6 .I .4 The Answer: By knowing how reliable the weapon is under the adverse conditions of the performance tests, It should be possible to estimate how much more reliable It would be under the standard conditions.
6.2 Plan of Action. Figure 6.2 shows the various segments of theVA'RICOMP process, although not necessarily in the order of accomplishment in a specific application. Some of these steps have already been discussed and explained in detail. Others will be amplified In ensuing sections. Enough back- ground has now been given and terms defined to permit classlfl- cation of the various portions of the process before describing them. Capsule explanations of each step are given In order to
! prepare the reader for the detailed discussions that will follow.
l- w: Establish exactly the essential geometry
an ma erials of the components or explosive ,* charges acting as donor and acceptor. Determine the confinement of the explosive components and of the interface. Determine the geometry and materials of the Interface. Determine tolerances, allowances, and sources of variability that might affect the detonation transfer.
2. Decide Goal. Is the problem to establish the certainty with which the detonation will transfer, or Is It to establish the certainty that It will not? How reliable (or safe)? With what confl- dence?
3. Choose General Method. Will the explosive loading be varied in the donor or in the acceptor? Here a balance will have to be made for each of the follow- ing factors:
How much variability Is attainable compared to what is needed?
Difficulty of loading and of testing.
. 37

NavWeps Report 7411
Avallablllty of calibrated VARICOMP explosives.
4.
5.
6.
6A.
7.
8.
Crlt&rlon technique asse$sment,
--slmpllclty of response
Select VARICOWP Explosive Series. This goes hand- In-hand with Step 3 and the general strategy of tackling the whole problem.
Carry Out Calibration. been done previously.
Ordinarily this will have Explosives to be used In
a specific problem will already have been procured and tested for sensitivity (or output). The data from these tests would usually be
Observed composition: Analysis and density expressed in terms of their means and standard dellatlons.
Observed sensitivity (or output): The mean Stimulus and the standard deviation of the stimulus.
Adjusted sensitivity (or output): Corrections made iby curve fitting.
Does Calibration Test ConflRuratlon Resemble Step 'EnouR;? ~How much of a guess? How much risk? liow much altih?
Mock-Up Calibration, of a no t t1
This will be the consequence Step 6 This type of testing
Is llIFZly"tYy~eldOniess lnf&matlon for effort expended to obtain It than the case where the answer to question, Step 6, Is E.
Select Performance Test Configuration. In all llke- llh d this will b pocEzt;obk and allo~a~~~
t 11 d by the size of the fzadetlme The closer
this resembles the true weapon, th; less change of Invalidation of assumptions.
Select Data Collection Plan. A properly designed experimental plan should take Into account the possible ~outcbmes and should map out lnterpreta- tlons and further work to be done for each of the outcomes. Changing of test plans and ground rules In the middle of an experiment usually fall& In the category of lng-the-data".
"statistical hanky-pan@" or "cook- Uncontrollable bias Injected Into
the progrhm can Introduce serious distortions. 38

NavWepn Report 7411
9. Carry out Performance Test.
10. Data Reduction.
11. Estimate Transfer Probability.
12. Compute Confidence Limit.
6.3 Calibration Tests. The quantitative comparison of the propxles of the design explosive with the VARICOMP explosives Is done by calibration tests. Such data collected in previous and. current programs represent at least part of the organized experience upon which engineering judgement can be based. The various tests represent yardsticks for comparing various explosives. It is too much to hope that a single yardstick will serve for all applications. The Ideal situation is to have as many explosives as possible measured on as many of the necessary yardsticks as possible and with as much experimental determination of their Inherent accuracy as possible.
u Performance Tests. As has been previously stated, the performance tests should be carried out with a minimum deviation from the configuration of the weapon. In some cases, the complete weapon might be tested, the only changes from the standard weapon being different loading of the acceptor ( or donor). It Is more probable that some portion of the weapon (a portion which, of course, will include completely the transfer elements) will be selected. It will be necessary in the flnal analysis to decide whether or not enough of the weapon hardware had been included in the setup so that there IS really no difference as far as the transfer of detonation Is concerned. In many cases, the exact hardware and complete charge cannot be used for the-performance tests (too expensive, too much explosive). If this is the case, some form of simu- lated performance test will have to be devised. The experience and skill of the experimenter will have to be drawn upon heavily. Each point of difference will have to be assessed. The best approach to the problem will be to adjust the differences so that If any significant effect on the transfer can be expected, It will be In the direction of further penalty on the system. The quantitative measure of such penalties cannot be hoped for and therefore cannot be cranked Into the reliability estimates. They probably can be converted into extra peace-of-mind for the experimenter.
. 39

NavWeps Report 7411
6.5 Performance Test, Criterion of Fire. Acceptors loaded wlthxfferent compositions may diff in output as well as in sensitivity. Thid could lead to con&on when judging whether or not initiation Itook place. A reduced output of a desensitized explosive may result from either of two conflicting reasons:
The diluent has reduced the total energy available For instance, the reduced output of a fully lnltlaied explosive may be judged as. a partial detonation.
The acceptor is being initiated marginally by the donor.
6.6 There ar a number of assumptlons of similarity e (analogy) upon which the validity of the VARICOMP process depends. These asisumptions are in turn dependent upon the five listed In Paragraph 3.2 and will therefore be numbered In continued sequence; The assumptions are that:
ASSUMPTICN 6 The mechanism of Initiation of the VARICOMP and design explosives in the calibration test is the same throughout the range from the least to the most sensitive, and that the calibration test statistical model is applicable.
ASSUMPTI& 7
ASSUMPTIC& 8
The mechanism of initiation of the VARICOMP and deslgn explosives in the performance test is the same throughout the range from the least to the most sensitive, and that the perfdrmance test statistical model is applicable.
There is a linear transform between the two statistical models.
6. 4 There are a number of methods which might be used for co lectlng datb in the performance test. These methods refer to the scheme for selecting and sequencing the explo- sives to be used in the test. Two of these methods will be discussed* In detail:
The Bruce;ton up-and-down or stair-step data collection plan (7,2~2,29), (Section 9).
The run-drown data collection plan (Section 10).
"These discuaeions; for simplicity and brevity, will be restricted to performance testing using variable acceptor explosives. I
40

NavWeps Report 7411
Other schemes such as modified stair-step (30) and the Bartlett plan (31) could be handled with appropriate modifications. Because of the differences In the procedures and assumptions, Section 11 Is Included to aid the experimenter In designing the experimental program and in deciding just what data collection plan should be used. The final estimate of the weapon system probability figures should be based on all pertinent data. The VARICOMP test data will ordinarily not be the sole source of lnformatlon.
6.8 Inferential Methods. Graphical methods will be given for satlnu performance and calibration test data and for making estl&tes of detonation transfer probabilities. The graphical method is not the only way to the answer, but It does offer a valuable assistance in visualizing the reasoning process and understanding the relatlonshlps. For the remainder of this report It will be assumed that the calibration data are In graphical form. The discussion will be concerned with the -methods of plotting the performance data and of obtaining final answers by appropriate graphical and computational operations.
43

NavWeps Report 7411
7. THE ,CHOICE OF THE VARICOMP EXPLOSIVES
7.1 RDX, diluted to varying degrees with wax or wlth calcm stearate, ~has been used to study detonator-to-lead and lead-to-booster transfer reliabilities (5,32). Considerable effort has been expended to develop procedures for making such RDX mixtures. It '1s most important that any particular batch of such mixtures (lsometimes referred to as degraded RDX) be homogeneous from the standpoint of sensitivity. It Is also highly desirable, though not quite as important, that these mixtures be reproducible, batch-to-batch. Aa will be indicated, the lack of batchito-batch reproducibility will lead to an increased within-batch calibration testing in order to realize an equivalent preclision from the VARICOMP process. For explosive train applications the ordinary loading procedures involve pressing $nto inert containers, or perhaps the formation of pressed pellets. Therefore, in addition to the above requlre- ments, the explosive mixes must be loadable.
z The RDX/Calcium Stearate mixtures have been found to be more useful than RDX/wax mixtures. They appear to be more uniform withln-bat,ch and to be more reproducible batch-to-batch, This may be because greater quantities, by weight, of the calcium stearate have to be used to give the same desensltlza- tion. As a consequence, the sensitivity of a mix could be expected to be less subject to errors In composition. Various stearate salts and various methods of compounding have been tried. A chemical precipitation of calcium stearate onto RDX suspended In water slurry has been found the most satisfactory. The process (Appendix A) is adapted from the manufacturing specifications for explosive CH-6. Batch sizes to date have been 5 to 20 pounds. Pilot batches of considerably greater quantity are being manufactured. These will be studied for uniformity, loadability, etc. Table 7.2 shows a typical series of such RDX/Calclum Stearate mixtures with indications of how their sensltlvltles to Initiation by shock vary with composition.
7.3 There are certain generalized relationships character- IstiGf the stearated-RDXla:
The sensitivities of the mixesarea function both of the composition and the density of the mixes.
At a glve~n consol1datlon pressure, the greater,the proportion of calcium stearate, the more nearly does the density approach the TMD (Theoretical Maximum Denalty).
42

NavWeps Report 7411
Table 7.2
PROPERTIES OF THE RDX/CALCIUM STEARATE BINARY EXPLOSIVE SYSTEM IN THE SMALL SCALE GAP TEST
WHEN LOADED AT 10 KPSI
Composition Density Sensltivit &n
Output*+ Mean
($ Ca St) ($TMD)* (Mils) (DBd (DBd (Mils)
0.00 0.67 1.36 1.35 :*:; . 2.57 2.66
‘,*;g 4197 5.28
a*",: 11:06 10.81 13.96 13.99 14.32
86.5 88.1 89.8 90.1 90.3 90.9 91.9 glh
;z 93:4
32 .
470 ;49: ;z: 313 306 299 297 283 278 276 261 262 245 250 239 237 230
3.28 4.07 4.66 4.79
5.25 5.28
0.01 0.01 0.02 0.01 0.02 0.02 0.01 0.01 0.02 0.03 0.01 0.02 0.01 0.02 0.02 0.02 0.01 0.02 0.05
l TMD means theoretlcal maximum density.
**Output measured by depth of dent in a steel block as described in reference 28.
Note: The Declbang (DBg) Is defined in Appendix C,

NavWepa Report 7411
The greater the proportion of calcium stearate, the more variable is the sensitivity and the more difficult la the analysis.
7.4 Considerable difficulty has been encountered In the anal-s of what appears, on the-surface, to be a slmple-two- component system. Gross discrepancies have been discovered between results obtained on supposedly the same mix from different analyses (different analysts). The exercise of the utmost care and good technique Is necessary In order to obtain reliable results. If It is necessary to analyze RDX/Calclum Stearate mixtures,: the analytical procedure in Appendix B la recommended.
u In some circumstances It has been found that changes In the density of an explosive charge will make a great change in the charge sensitivity (15) even to the extent of masking differences which can be attributed to composition (34), The general trend is towards decreasing sensitivity with Increasing charge density. To a lesser degree, the output of an explosive charge will also be affected by density. The output will Increase with density providing the ability of the charge to be detonated and to support detonation will not be adversely affected at the v4ry low or very high densities, Within the
charge fabrication there may be instances the charge density, the VARICOMP procedure Variation of charge density could be used to
or to control donor output.
7.6 It will not be feasible to employ the RDX/Calclum Stearate series In all applications. Certainly it should be possible to establish an alternative series using different conventional explosives. explosives,
Table 7.6 Indicates a group of with their different sensitivities, that might be
suitable for a castable series, Some thought has been given to the possibility of producing a series of piare chemical com- pounds which are molecular homologs (14, 35, 36). Such a series might in addition be quite valuable in furthering knowledge of the relationship between molecular structure-and sensitivity. Unfortunately, sucmh a series may be expensive to establish, since in many case:8 the pilot production synthesis process must also be developed.
44

NavWepa Report 7411
.
. Table 7.6
Typical Values of High-Explosive Sensitlvltles
NOL NOL Propellant Booster
Impact Sensitivity Test Sensitivity Test Explosive (cm) (Inches) (Inches) HEX-3 87 1.41 -a--
TNT 150 t0 215 1.38 0.02
TRITONAL 87 to 104 1.26 0.58
BARATOL w--c 1.18 0.32
PENTOLITE 38 2.66 2.06
COMP B 82 2.01 1.39
Note: The above values were obtained from references 18, 38, 39, 40, and 41.

NavWeps Report 7411
% .7 A VARICOMP series of explosives made by varying the
propor Ions in a mixture offers an advantage over one made from a collection of different standard explosives. (This statement Is made on the assumption that the mixture properties will vary In a systematic fashion with the proportions of the components of the mixture.) /The advantage lies In the fact that the total sample size needed for measurement of the sensitivities should be less for the vzirlable proportion mixes than for a series of different standard explosives, Data obtained on the individual mixes of a binarylmlx system can be plotted against the compo- sition. Then a smooth curve fitted to the SO-percent firing points would be expected to compensate partially for the experlmantal error In determination of Individual 50-percent firing points. Sllmilarly the individual observed standard deviations might well be combined to give a better estimate of a standard deviation characteristic of all the mixes.
53 .8 One drawback of mixtures such as RDX/Calcium Stearate, which epend on desensitization of a sensitive high explosive by the addition of an inert dlluent, is that the more desensitized mixes are less explosive in character: their outputs fall off; their abilities to sustain detonation diminish. It may therefore be logical to use an insensitive explosive as the dlluent.. With this arrangement It would be expected that the members of the series would respond with more nearly the same dynamic performance. Nitroguanldlne is suggested a8 a possible insensitive component. Nltroguanidlne/kDX or Nltroguanldine/PETN binary mixtures might nave good pressing or of Nltroguanidlne/RDX R
elletlng properties. A ternary mixture NT (suggested name: Cycloguanitol) might
either be castable’, or when granulated, suitable for press- loading. PETN/?NT.
A similar ternary mixture might be Nltroguanidlne/
c v Explosives suitable for use in a VARICOMP series must have he followlng~propertles:
Maximum within-batch homogeneity (COrnposItIon, particle size, sensitivity)
Good batch-to-batch reproduciblllty
Good mechanical durability (must not segregate as a result of'shipping vibration; screening; handling)
Non-hygroscoplc
Stable up,to 70’ Centigrade
46

NavWepa Report 7411
For press loading the axploelve Bhould be fine enough to paaa through a No. 35 screen. However, If the explosive la extremely fine, problems may arise In handling: exceaalve duatlng, caking on loading tools, having too 3ow a bulk density, etc.
Certain other requlremente usually apeclfled for high-performanue exploalvea, such II dlmenalonal stability at high temperatures, high energy content, and high detonation velocity, may be abrogated In favor of the above requirements.
47
NavWeps Report 7411
8. THE CALIBRATION TEST
8.1 Callbratlon of Explosives. The VARICOMP method Is an eXFapolatlon
From the iobservable behavior of the VARICOMP ~oalve( a)
To a prediction of the behavior of the design explosive
In the p$rformance test system
Based o&data which compare the VARICOMP explosive(a) xthe 'design explosive,
These comparative data are obtained from the calibration of the explosives under consideration. The precision and accuracy of the extrapolation is obviously enhanced as the extent and accuracy of the calibration are increased. The ultimate goals of the calibration are:
Identification of the distribution functions of each of the explosives
Measurement of the statlstlcal parameters of the VARICOMP 'explosives. (It is assumed that this Is done for :each batch or lot.)
Measurement of the statistical parameters of enough different lots or batches of the design explosive to yield data representative of the expected pro- duction process variability.
8.2 Calibration Tests, Sensitivity. There are a number of sensmvlty tests (see Appendix C) such as the small scale gap test (15), the propellant sensltlvlty test (20), and the boosterlng sensltlvlty test (18), which might be used to call- brate the sensltl&ty of the acceptor explosives, Although It Is desirable to use standard senaltlvlty tests for the callbra- tion of the acceptor explosives, there will be In some Instances so much difference: between the weapon configuration and the ordlnary test conflguratlon that the sensitivity data may not be relevant. In such cases, mock-up calibration tests might be Indicated. These :would be compromise variants having as much as possible the adrangement of some standard sensitivity test
1 48

NavWeps Report 7411
but modified to represent the salient aspects of the weapon system Interfaces and donor-and-acceptor-surrounds. The mock- up-calibration tests would be used to search for correlations of the sensltlvltles of the VARICOMP explosive in the calibra- tion and performance configurations. When the correlation Is considered to be aufflciently good, the doubt as to relevance of sensitivity data to the weapon system can be discarded.
Calibration Tests, Output. When the VARICOMP method led with only the design explosive in the acceptor but
with modification of the donor explosive, the donor explosives might be calibrated by measuring the dent produced in a witness plate (28), or perhaps by high-speed camera measurements of detonation parameters. Such calibrations will yield continuous data rather than the Goho-Go data characteristic of sensitivity testing, Because continuous-data tests are considerably more efficient than Go/No-Go tests (they yield more information per shot) it would seem sensible to carry out the VARICOMP proce- dure using the degraded approach. Unfortunately, the main point of Gcertalnty has not been reduced. It merely has been moved to a different location:
Variable Acceptor Sensitivity: Is the mechanism of initiation in the calibration test the same as in the weapon? Is the proper calibration dosage-to-weapon acceptor stimulus transform being used?
.
0.4 (andTn
Small Diameter Systems. The calibration of explosives fact, the whole VARICOMP process) is most easily and
quickly carried out with the smaller diameter explosive systems. Because their charge diameters rarely exceed 0.25 inch, detona- tor-to-lead transfer systems will require relatively small quantities of explosives to carry out VARICOMP studies. The practical explosive batch size (25 to 100 pounds of an RDX/ Calcium Stearate mix, for instance) appears to be large enough so that rather extended calibrations can be carried out with an expenditure of only a minor portion of the ,batch. The cost of the calibration can be amortized over a goodly number of different systems. Calibration by the revised small scale gap test would probably give relevant sensitivity data for detona- tor-to-lead studies provided its characteristics (heavy confinement, Initiation by shock through condensed medium, bare charges) are near enough to the system under study.
Variable Donor Strength: Is the dent producing ability of the donor a measure of Its ability to initiate the acceptor? Is the proper being used?
output-to-stimulus transform

NavWepa Report 7411
Table 8.4
THE CALIBRATION AND UTILIZATION OF A VARICOMP EXPLOSIVF, SERIES (CONJECTURE)
1. 10 mixes at 50 pounds per mix Totalt 500 pounds
2. Calibration 200 small scale gap Totalt teat ehots pe+ batch
10 pounds
31 Detonatorrto-lead system. (200 trials or less loaded
From 0.1 to 0.5
from the various batches) pound per 8yBtem
4. Lead-to-booster 8y8tem (probably both mock-up-
From 5 to 20 pounds
calibration and performawe per system
ts8t8)

NavWepa Report 7411
l Lead-to-booster studies represent a greater departure from the conditions of the small scale gap test. In general, this Is because there Is a donor-to-acceptor diameter transition ratio
or lesa and because the acceptor Is essentially uncon- r of 0.2 fined 7 semi-infinite solid). Mock-up-calibration Is therefore more likely to be required for lead-to-booster studies. Yet, even with mock-up-calibration tests as well as performance tests, the total explosive requirements for lead-to-booster studies should ordinarily use limited quantities of the explosives. Strictly subjective guesses of the quantities of explosives that might bed In small diameter VARICOMP experiments are given in Table 8.4.
8.5 Large Scale Systems. One of the difficulties with largficale system (booster-to-warhead) studies by the VARICOMP method Is the difficulty of maintaining charge uniformity. For Instance, at the Naval Ordnance Laboratory the limit for a single melt of castable explosive t&about 100 pounds. A call- bration by the Naval Ordnance Laboratory booster sensitivity test requires about 0.5 pound of the explosive per trial. Frequently, the performance test will use from 1 to 3 pounds of the VARICOMP explosive per trial. Thus, It can be seen that a relatively few experiments will expend the explosive from a single melt. Bitter experience has shown that there is aome- times much greater variability between successive melts of an explosive than there Is within a.melt. .The chllbration effort must recognize the following llmltatlons:
Too Few Trials -- Low precision.
Large Number of Trials -- Not enough explosive left to do performance tests.
Batch-to-Batch Nonuniformity.
8.6 Extent of Callbratlon. The.cholce of the magnitude of the calibration effort (the number of shots per explosive) la governed by the gain In precision versus the Increase In aost as the number of trials Is Increased, The gain In precision (decrease In varlablllty as evidenced by the decrease In the
'standard deviation of the mean, &, and of the standard devla- tlon of the standard deviation, PA , la proportional to the square root of the number of trials. Thus a determination of the aensl- tlvlty based on a two hundred-shot Bruceton run would be expected to be twice as precise as a fifty-shot determlnatlon, Another way of looking at this relationship Is to see that a two-fold Improvement In accuracy wlll cost four times as much. At this point the advantage of the binary-mix system of VARICOMP explosives becomes very attractive, If the following assumptions are valld--
51

NavWeps Report 7411
ASSUMPTION 9 The sensitivity Is a continuous smoothly- 1 varying function of the composition
ASSUMPTION 10 The standard deviations of each of the mixes Is not a function of the composition, and Is the same for all mixes
--then each of the determinations of the standard deviation (one for each mix) can be considered as an Individual estimate (repll- cate determinations) of the standard deviation characteristic of the system. The system standard deviation can be computed by combining the Individual variances of the sensitlvltles:
where ML Is the effective sample size* of the i$ mix,
ki Is the standard deviation of the is mlx,
N Is the total effective sample size,
j is the number of mixes.
This having been dbne the system standard deviation of the mean, 5, , and,the system standard deviation of the standard deviation,
,1 5, ’ can be compu ;ed by
and c - s JP=&-’ ,
l-- ~ I From this It can b$ seen that If ten mixes were tested with an equal number of trials for each, the precision of the system parameters, Sk\, and $A , Is better than three-fold improved over the preclslona of the determinations for indlvldual mixes, Standard statlstlcal procedures can be used to test the validity of the above assumptions for.speclflc collections of data.
*The term "effective sample size" Is used to denote the <fact that for Bruceton rather the number least.
data,-Ri Is not the number of trials, but 1s of fires or the number of falls, whichever 2
I 52

NavWeps Report 7411
8.7 Presentation of Data. Ordinarily the measured and reposd sensitivity data for Individual mixes are
x f the SO-percent point
k J the standard deviation
k , the effective sample size.
For fitted data the corrected 50-percent points, the system standard deviation, s , and the total sample size, N , would be given. Figure 8.7 shows the observed sensltlvltles for a typical*RDX/Calclum Stearate series (Table 7.2). The corrected (fitted) data are also Indicated (Table 8.7). Sometimes It will not be possible to adjust, or fit, the data for a number of explosives. For Instance, a series of standard ilrploslves would yield lndlvidual means and standard deviations that are essentially Independent--e.g., the standard deviation of TNT Is not necessarily characteristic of various cyclotols. In such cases, only observed data would be given. Whether smoothed or observed data are reported, the composition and density, plus any other charge preparation or special con- figuration Information, should also be given for each sensl- tlvlty figure.
8.8 Transformation to Probability Space. In order to applvhe VARICOMP process the data'must be converted to straight-line relationships of response versus stimulus. This c&n be done by plotting them on appropriate probability graph paper. For Instance, the fitted data of Figure 8.7 are plotted In this manner In Figure 8.8. Mathematically the equivalent (and alternative) method Is to generate the equations of the line In the general form
where A = '/j#
and B z- VA '
Here R Is the probablllty expressed In normlts, and c and /-
% the stimulus revlously defined) are expressed In the units characteristic
.
53

NAVWEPS REPORT 741 I
6.
6.
6.
4.t
LINE ‘FITTED TO DATA ACCORDING TO
x= l.k53 LOG C+4.510 (ERROR ASSUMED TO BE ONLY IN DETERMINATION OF X)
KEY
r-5”” / A
IO I2 CO:POSlTl06N, C ( %%ALCIUM STEARATE)
14 I6
FIGURE g.7 SENSITIVITY VERSUS COMPOSITION FOR VARI/OUS RDX/ CALCIUM STEARATE MIXTURES

Navweps Report 7411
Table 8.7
FITTED VALUES OF THE SENSITIVITIES OF VARIOUS RDX/CALCIUM STEARATE COMPOSITIONS
c, Composition $ Ca Stearate)
X, 50 Percent Point (DB~)
'Observed Fitted .- 0.67 4.07 1.35 3; z*gg . 4168
1.87 5.04
2% 5.14
3:69 5.25 5.28
3.76 4.96 ;*g
z$ 5:59
. 5.82
7.47 5.84 10.81 6.03 11.06 6.11 13.96 6.22
13 099 6.25 14.32 6.38
4.24 4.71 $.7&
.
4.93
;*:; 5:39
5.40
;*z; 5:82
Values fitted according to
x - 1.553 log c + 4.150.
Composlte standard deviation of the sample, 5 , Is 0.087 DBg.
Composite standard deviation of the mean, Sk, is 0.02 DBg.
55

+3
+2 -2 -3
)9.8
eh
*
VOTE
: DA
TA P
UTTE
D HE
RE-
IN A
RE
FRO
M
TABL
Em8.
7 39
38
- OB
SERV
ED
- AD
JUST
ED
3.8
4.0
4.2
4.4
4.6
4.8
5.0
5.2
5.4
5.6
5.8
6.0
6.2
6.4
66
STIM
ULUS
I N
TENS
lTY
(08
g )
FIG
UR
E 8.
8 O
WER
VED
AN
D
ADJU
STED
SE
NSI
TIVI
TIES
O
F VA
RIO
US
RD
XKAL
CIU
M
STEA
RAT
E M
IXTU
RES

NavWeps Report 7411
8.9 When the sensitivity picture cannot be presented as slmpFas above, because of batch-to-batch variation, limited sample size, or suspected or detected inaccuracies of the test method, It will be necessary to present additional lnformation-- confidence Intervals about the various parameters, statements of experimental and inherent error in the determinations, qual- ifications, etc.
8.10 Centering of Calibration Tests. Ideally, the calimlon of the design explosive should be carried out by some test plan which will have the greatest precision at the level of performance which the design is expected to exhibit. Thus, if a reliability figure is to be estimated at some level’ (such aa 99 percent) it would be desirable to establish, with most precision, the stimulus which will cause this response. It is very difficult, if not prohibitive, to calibrate In this fashion at the higher reliabilities. The practical alternative is to find a compromise centering level which approaches, but may not reach these reliabilities. Therefore, It would be best to try for the least variability at a 70-, 80-, or even go-percent functioning level (30, 20, or even 10 percent for safety testing). An example of off-center calibration is given In Paragraph 8.11. The extrapolation from VARICOMP performance test data to the response to be expected from the design explosive will be much less tenuous when the design explosive sensitivity Is extended not from 50-percent response data but from go-percent response data. Certain speolalized stair-step plans can be.usdd for estimating other than 50-percent response data. However, the more generally effective approach appears to be a carefully planned run-down series. If both reliability and safety estimates are to be made using the same calibration test data for the design explosive, it may well be that the familiar Bruceton test plan will turn out to be the most efficient approach. The centering of the calibration of the VARICOMP explosives is optimum at the 50-percent level. This Is because the total sample size of each VARICOMP explosive will be relatively small. The observed responses will ordinarily fall in the range of 5 percent to 95 percent ,and will, In general, be centered about 50 percent. It is therefore sen- sible to calibrate the VARICOMP explosives with greatest precision at the expected level of per-formance.
57

NavWeps Report 7411
8.11 Example. As an example of handling the data a hypo- * thet;Tc’aT calibration of an explosive will be analyzed using Probit
techniques. This Iexample will be used in the analysis of stalr- step performance test data In the next two sections so that the details will be followed through step by step. (This type of .
calculation is didcussed in reference 23.)
The first step In the calibration of an explosive Is to decide the levels at which tests are to be made, the total number of trials, and the way in which these trials are to be alloted to the different test levels. As has been pointed out in paragraphs 8.6 and 8.10 the total number of trials should be large and the test levels should be centered at or above the expected TO-percent level. Since the welghtlng factor (given In Table E-l) decreases for higher values of probability (response) It is desirable to assign the higher levels a greater number of trials than the lower levels In order to compensate for this decrease. The test Is then carried out and the percent of fires observed at each level Is recorded. These values are then converted into problts or normits using a table such as Table I, page 264, of reference 23. (Table E-l of this report could be used if no other is c available. )
For the present example it has been decided to make five- _ hundred trials. The levels used for testing have stimuli with intensitles‘ranging from 4 to 8, these levels being chosen since previous experience lndlcates that the 50- percent response will occur at a stimulus of about 4 or 5. (Corresponding dosage levels might be 398, .,.. 16, 251, 200, and 158 mlls gap in a small scale gap test. 3 The number of trials assigned to each of these levels ranges from 85 to 135 to compensate for the expected decrease In the welghting'factor. These data together with the observed number of fires and the res normits are given In Table 8
onse In percent, probits and .llA.
For the calculations based on these data It is convenient to form a table such as Table 8.11s. It is also convenient to change the Independent variable from the stimulus x to x- %a where 3~, la one of the central values of % . In the case’ of are ente 4
this example x0 was taken as 6. In Table 8.11B ed the values at each testing level of the stimulus,
X the ~ adjusted stimulus, X - X, , the response, RD , In no&its , ~ the number of trials, N obtained~ from a table such as Table
the weighting factor,u, E-l, and the value
58

NavWeps Report 7411
The next step Is to find the cum of each column of these products. (If d desk computer Is available not all of these columns need to be written down. The products are obtained and summed in one operation.) The computation proceeds as follows:
Compute the mean value of X-Y,, ~~N~b-u.i!~/L NW
b= "k/A,
The best straight line fit for the expected reeponse 1s then
The computation of this equation can be checked by sub- stituting the mean values of the variables, These should satisfy the equation. If they do not, some error has been made In the computation. The equation for the lower llmlt of the response at a specified confidence level la
where t Is the Student's t (given in Table E-2). In this table F la the desired confidence level and n Is the number of degrees of freedom which 1s two less than the number of trlale.
59

DosaKe
398
316
251
200
158
NavWeps Report 7411
The straight line for the expected response can be obtained ' aphlcally.
T However this 1s not recommended
for two re sons: first, It Is difficult to give the proper wel'ghts to the points In fitting by eye; second, It would ble Impossible to obtain the estimate of the .lower limiit by this method.
The weights used In this example are based on the observed responses rather than the expected responses as described In refere n ce 23. In using the method described there the computati& should be repeated using weights based upon responses as predicted from the equation obtained above. Thls Iteration would continue until there was no longer an apprec$able difference In the result obtained.
Table 8.11~ Calibx?atlon Data for Design Explosive
No. of No. of Re aponee Stimulus Trials Fires Percentoblts Normlts Ix)ym-- [a,)
4 85 36 42.4 4.81 -0.19
5 85 47 55.3 5.13 0.13
6 95 65 68.4 5.48 0.48
7 I 100 80 80.0 5.84 0.84
8 ) 135 llg 88.1 6.18 1.18
Table 8.11~ Compui$atlon of Design Explosive Response
Expected Value and Lower 95-Percent Confidence Limit
x s-r, Ao ---
4 -2 -0.19
5 -1 0.13 6 0 0.48
7 1 0.84
8 2 1.18
y w Md w(wr) kJJwl%-d IhrR, MdRD b-%J
85 0.536 45.56 -91.12 182.24 -8.656 17.312
85 0.600 51.00 -51.00 51.00 6.630 -6.630
95 0.530 50.35 0.00 0.00 24.168 0 .ooo
l?o 0.477 47.70 47.70 47.70 40.068 40.068
15 + 0.368 49.68 39.36 198.72 58.622 117.244
244.29 4.94 479.66 120.832 167.994
c
60 F
NavWeps Report 7411
The mean value of Y-& ia * m 0.02 244.29
Therefore, the mean value of % ia 6.02
The mean value of R, is e - 0.495 .
n = (479.66)(244.29) - (4.94)' - 117151.7378
A,= (W'mW244.w) - (4.94)(120,832) - 40442.3442
$,p (12o.832)(479.66) - (4.94)(167.994) = 57128.3868
C - 244.29/117151.7378 = 0.0021
D= l/244.29 = 0.0041
The equation for the expected response Is
R,- 0.345 (X - h) + 0.488 = 0.345~ - 1.582.
To check this equation substitute the mean values of y and R, given above
0,495 = (0.345)(6.02) - 1.582 - 0.4949.
The check is satisfactory.
The equation of the lower limit for the response at g5-percent confidence is
R,- 0.345% - 1.582 - 1.65 ~0.0021(~-6.02)2+0.0041]1/2
The value of 1.65 is used for t since we wish to have a statement, at a g5-percent confidence level and we have 500 trials.
61

NavWeps Report 7411
9. UP-AND-DOWN PERFORMANCE TEST
g,l Choice of Plan. The Bruceton test plan (4,7,22,29,30) is the most generally used up-and-down data collection plan for explosives testing. Other plans have been develo ed specific and specialized applications (Section 11 P
for . The
Bruceton test plab and analytic procedure will be the only up-and-down method treated in detail.
.2 Test Requirements and Objectives. The test method that there be an array of equally spaced test levels
In-the normalized probability space, from which can be chosen any level at any time in the test sequence. It is the expecta- tion that:
At low levels few If any test subjects will respond.
At high levels nearly all will respond.
At some very high level all will respond (no duds).
The purpose of the experiment is to deduce the test level at which 50 percent ~of the population would respond. This deduced level Is pot required to be any of the test levels. and, In fact, is usually anything but. In addition to the estimate of the l&e1 at which SO-percent response is to be expected, it Is a~lso the purpose of the experiment to obtain an estimate of the variability of the test subjects--the precision of the experiment.
u A Sophistication. There is a very fundamental difference betwee!n the performance test as used in the VARICOMP method and the usual explosive sensitivity test.
In the usual sensitivity test, which would include the calibration test of the VARICOMP method, the explosive is kept the same and the stimulus Intensity is varied. The object of the test is to estimate the response of the exploslve to any stimulus intensity. The'results of a test might show, for example, that If the stimulus intensity were 3 units the response would be 40 percent; if the stimulus were raised to 4 units the response would be 55 percent; If the stimulus were increased to 5 units the response might be 63 percent.
62

NavWepe Report 7411
The results of the test would give the response as a function of the stimulus.
In the VARICOMP performance test, explosives of different sensltlvitles are subjected to the same stimulus and their responses given as a function of their sensltlvltles. These sensltlvltles might be expressed as the stimuli required for SO-percent response or possibly by purely arbitrary units.
Figure 9.3 shows the difference between the tests graphically. The responses of the explosives are represented by diagonal lines. A fixed stimulus Is represented by a vertical llne (EH, Figure g,sB).There are many different explosives and many different stimulus lntensltles, These would be represented by families of diagonal and vertical lines.
In the usual sensitivity test the varying Intensity could be considered as a moving vertical line which intersects a fixed diagonal line (Figure 9.3A). The observed data give estimates of the positions of these Intersections. The fixed diagonal line Is obtained from observations with a variable vertical line representing the varlable Intensity.
In the VARICOMP performance test the explosive 1s varied: the diagonal line Is the moving line (Flg- we 93). The observed data give the Intersections of the moving diagonal line with the fixed vertical line representing the fixed Intensity. In this case the vertical line Is obtained using observations with a variable diagonal line (varlable exploslve).
9.4 Bruceton Test Plan. Make up an array of test levels ranging In order from the lowest to the highest probability of response. Select, for the test on the Initial Item, a test level at which approximately SO-percent response Is antlclpated. Test the remaining Items, one by one, at test levels which are chosen on the basls of the observed response of the Immediately preceedlng item according to the following rules:
If the Item responds, set the next test level one t 1 th the preceedlng level. Customarily
inei r%bll~zy test, a response ( a fire) Is lndi- cated by x .
If the Item does not respond, set the next test level one step higher than the preceedlng level. A non- response In a rellablllty test (a fall) Is Indicated bye .
63

NAVWEPS REPORT 7411
.-
,A w > W J
.- *
/ J
-
/ K
E
/ L
c
/ M
a
/ N
- STIMULUS
NOTE : THE EXPECTED RESPONSE OF EXPLOSIVEB TO TEST LEVELS
i,j,k,l,y,n,p IS GIVEN BY THE ORDINATES OF POI NTS I,J,K,L,M,N,P,
FIG’URE 9.3 A THE BRUCETON CALIBRATION ~ TEST--- VARIABLE STIMULUS; I FIX ED- SENSITIVITY EXPLOSIVE
64
NAVWEPS REPORT 7411
NOTE: TEST LEVELS ARE EXPLOSIVES D, p, y, AND 6 WHOSE 50 PERCENT POINTS ARE A,B,C,AND D, AND WHOSE EXPECTED RESPONSES TO THE PARTICULAR STIMULUS ARE GIVEN BY THE ORDINATES OF POINTS E,F,G, AND l-l.
STIMULUS
-STIMULUS AVAILABLE FROM THE DONOR ACTING THROUGH THE INTERFACE.
FIGURE 9.3 B THE BRUCETON PERFORMANCE TEST--- FIXED STIMULUS; EXPLOSIVES
OF VARIOUS SENSITIVITIES
65

NavWeps Report 7411
As it is applied to the variable-sensitivity VARICOMP process, the test level is the performance test configuration loaded with some particular VARICOMP explosive. The higher proba- bility test levels are those performance test devices loaded with the more sensitive explosives; the lower levels are those loaded with ~the less sensitive explosives.
g. .5 Biasing the Data. A predetermined number of items
shou be tested in the Bruceton plan. The total number of trials should not~be changed on the basis of results being obtained. For inqtance, an experimenter might be tempted by the following reasoning:
"Normally In a twenty-five-shot Bruceton run, the number of test levels does not exceed four. If six or more levels are required there must be some difference from normal circumstances. Probably the material is more variable. In order to compen- sate for'the loss of efficiency because the step size is too small for this varlabillty, increase the Bruceton run to fifty shots.'
The experimenter is trapped. He Is Injecting a personal bias by accepting data when he thinks the variability Is low enough and by Insisting on additional testing when he thinks the variability Is too large. This particular practice will probably not blas~the 50-percent point estimates but can be expected to underestimate the standard deviations by rejecting those cases when the standard deviations are properly large. There are many ways to distort the results at any point in the data collection and reduction process. One of the best general methods of avoiding such trouble is to decide beforehand
How the test program shall be carried out, including result-dependent sequencing of alternatives,
The interpretation of the various possible outcomes.
The confidence levels that will be used for consistency checks and final estimates.
.6 Data Reduction, Estimate of Mean. The analysis of Bruce on data canbe carried out by the following stepwlse + procedures which can also be found in the literature (4,2'2,2,9,30):
I F I
NavWeps Report 7411
Assign consecutive integral numbers to the array of regularly increasing test levels. The consecutive Integers can be arranged in either increasing or decreasing order.
Eliminate from further consideration any trials which were made before the first reversal in the sequence of observed data. A reversal is defined as being either a response followed by a non-response or a non-response followed by a response.
Beginning with the two trials which constitute the first reversal, count the number of S's andO' at each test level (i.e., for each VARICOMP explosive).
Determine whichever of the total number of X's or of O's Is the least. Let W\o,k, ,""" '*\h denote the
frequencies of this lesser event at each of the levels for which the event occurred where ylo denotes the frequencies at the lowest level and nk at the highest.
Compute the mean according to
where y. Is the lowest level at which a t@St is recorded. (Associated with i:o >
> is the next higher level. (Associated with isi>
A is + l/2 If the lesser event Is a non-response
and A Is - l/2 If the lesser event is a response.
This process has developed a value, 3 which Is a measure of the stimulus, 3s delivered to the acciptor In the performance test system. If this value of stimulus Is substituted In the design explosives calibration equation, the value for the expected system reliability, Rb-, will be found (designated as point Q In Figure 9.6).
9.7 Data Reduction, Computation of Confidence Limits. Ino-r to place upper and lower limits on the estimate it is necessary to compute the standard deviation of the rnean,A-, which in turn is derived from& . Because of the particular method of obtaining the data, the use of correction term G
the calculation of B-requires , given in Figure 9.7A so that
67

NAVWEPS REPORT 74 II
LOWER LIMIT FOR --j
t AT 95.PERCENT
STIMULUS AVAILABLE FROM THE DONOR ACTING THROUGH THE INTERFACE
FIGURE 9.86 VARICOMP ESTIMATE BASED ON BRucEhN PERFORMANCE TEST DATA
68

NAVWEPS REPORT 7411
69

3
GRAP
H I
CURV
ES
FOR
ESTI
MAT
ING
TH
E ST
ANDA
RD
DEVI
ATIO
N TH
IS
CURV
E GI
VES
THE
VALU
E OF
S
(COR
RESP
ONDI
NG
TO
THE
NUM
BER
M
TO
BE
USED
IN
DET
ERM
ININ
G
THE
ESTI
MAT
E OF
THE
ST
ANDA
RD
DEVI
ATIO
N ,d
, M
ORE
ACCU
RATE
VA
LUES
CO
RRES
POND
ING
TO
TH
IS
CURV
E M
AY
BE
OBTA
INED
FR
OM
TA
BLE
I..
AN
ENLA
RGEM
ENT
OF
THE
PORT
ION
IN
THE
DOTT
ED
RECT
ANGL
E IS
GI
VEN
IN G
RAPH
II ON
A
LARG
ER
SCAL
E,
WHI
CH
SHOU
LD
BE U
SED
lFM
70.4
0.
FIG
UR
E 9.
7B
GR
APH
I
OF
AMP
REP
OR
T

NavWeps Report 7411
where i&
To obtain k* compute first
If M> 0.5 & can be obtained from Figure 9.7B or from the expression
R= (I;-j,)(l:bOl k + 0,064),
Special methods for computation of k when M is less than 0.5 can be found In the literature (4,22). The confidence Interval for the estimate of the population Is then obtainable by computing the limits according to *i ttgm where t Is the Student's t When the llmlt x- tbk, Is converted Into the proper stimulis units (indicated by the x-coordinate of point L of Figure 9.6) the corresponding pessimistic estimate of the system reliability LRb (Indicated as the R-coordinate of point N of Figure 9.6) can be found graphically or by substi- tution in the design explosive calibration equation. The method of combining the confidences of this pessimistic estimate as discussed in Paragraph 10.5 also applies in the present case.
9.8 This analysis depends upon the following conditions:
The levels are equally spaced.
The number of Xi and O'S In the usable part of the test is at least 50.
71

NavWeps Report 7411
The standard deviation, /, , is at least one half the difference between two consecutive levels.
Even if these conditions do not hold, the Bruceton analysis can cometimes still be used with these variations:
The effect of unequal spacing is discussed in Para- graph 9.10. If the spacings must be considered as unequal'the data must be analyzed by the Problt method (23).
If the total sample size condition cannot be met, less accurate, but still reasonable, estimates of ? and ,& are obtained. Alternate schemes for
analysis for smaller sample size estimates are given in the AMP report (22).
When the step size is greater than 2 standard devla- tions the AMP report should be consulted (22).
inde~dexampl;~yB~;;t~; M;t&ozm This example is given, t of h il t to illustrate the approach
to testing, data collecting, and d;ta reduction. In this Illustration a fire Is considered as a response and a fail as a non-response since this is a reliability test.
9.9.1 For this example it is assumed that a series ofveVARICOMP explosives has been calibrated. This calibration has shown that their sensitivities can be -- regarded as equally spacesand that It Is reaso%lr to expectThat when used In the ordnance design they will cover the range of sensitivities from high to low reliabilities. It has been decided that the test will be made having twenty trials, the count to begin with the first reversal. The first trial is made with VARICOMP Explosive Four and results in a non-fire. This is recorded by entering an o in Line Four of the record, Figure 9.9.1. Moving in the direction of the more sensitive explosives, the next trial is made with Explosive Three. This also gives a non-fire so an 0, is entered in Line Three of the record. The next trial is with Explosive Two and a fire is observed. This Is recorded as an X in Line Two of the record. This gives the first reversal. The previous trial
*Note that sensitivities are equally spaced in the stimulus scale. The distribution between stimulus and dosage (5.14 and 5.15)
+
should -be kept in mind.
72 f

NavWepa Report 7411
(the one with Explosive Three) is the first trial of the twenty to be made in the test. The next trial is with Explosive Three. This Is a fire: an x is entered in Line Three. .The next trial is made with Explosive Four. Testing is continued in this way until the twenty trials have been made. This completes the data collection of the performance test.
XPL F FIRST USED DATUM POINT
x 0 I I I I I I I I I I I I I I I I I I I I I I I
5 0 0 o-2 6
X= FIRE 0 q NON-FIRE
FIGURE 9.9. I
DATA FROM TYPICAL BRUCETON TEST
r
.
9.9.2 Data Reduction. For the calculations based on the data collected In this example it is assumed that the calibration has given the following information:
The 50-percent points of VARICOMP Explosives One to Five are 6, 8, 10, 12, and 14 In the intensity units chosen in the stimulus scale (Figure 9.9.2A).
A five hundred-trial calibration of the design explosive with stimuli havlng Intensities from 4 to 8 gives the best straight line for the prediction of Its response to be as given In Paragraph 8.11
RD =0.345y- \.S82
where kLo is the response In the normIts* and X Is the stimulus intensity In the units chosen (Figure 9.9.2B).
The 95-percent lower confidence llmlt for the response of the design explosive is
&=0.345y-I*58Z- 1.65 [f'.002l(x-&.o# +~~~o~,]'~ l
*For the relationship between the normlt and the cumulative normal distribution function see reference 37, Table E-l and Figure 5.16.
Y 73

NAVWEPS REPORT 74 I I
I I I I I 6 ~ 0 IO 12 I4
STIMULUS I t ARBITRARY UNITS)
FIGURE 9.9.2 A CALIBRATION OF VARICOMP
EXPLOSIVES
74
NAVWEPS REPORT 7411
.
I I I I I
4 6 6 IO 12 I4
STIMULUS (ARBITRARY UNITS 1
FIGURE 9.9.2 B CALIBRATION OF DESIGN EXPLOSIVE
75

NavWeps Report 7411
Note that since the testing was concentrated at stimulus levels which give 55- to 85-percent response, the greatest precision (and the closest1 approach of the lower limit hyperbola to the straight line) is at 70 percent rather than 5O'percent. Paragraph 8.10 discusses the reasons,for this off-center testing.
Before beginning the computation it is decided that the expected reliability and the lower 95-percent confidence limit of this reliability shall be computed. The first step In the data reduction is to count the number of fi es and non-fires recorded In the test
f for each of !he VARICOMP explosives. In this example the results
t re: for Explosive Two, four fires and
zero non-f&r, s; for Explosive Three, four fires and four non-fires; for Explosive Four, two fires and four non-fires; for Explosive Five, no fires and two non-fires. since the results of the twenty trials are equally divibed between fires and non-fires, either may be used in the calculations, For this example, the fires.will be chosen. Table 9.9.2 shows a con- venient way of forming the required sums and products. In this table, xi Is the number of fires (or non-fires) and N is the total of all the values of n; . The mean step number 1.2 corresponds to a hypothetical Explosive Two-Point-Eight whose number Is 2.8, the mean explosive number for the fires. A correction of 0.5 must be added to the explo lve number giving 3.3 as the mean explo- sive number. B Had the non-fires been used their mean explosive number would have been 3.8 and the correction of 0.5 would~ be subtracted giving the same final result. If the equatbon in Paragraph 9.6 were used to compute the mean expPosive number, the arithmetic would be
In agreement with that obtained above.
To convert the mean square deviation, M (given above and in Paragraph 9.7), to a standard deviation use Figure 9.7B.m The result in this case is 0.95.. The standard deviation of the mean,p$,would be
76

NavWeps Report 7411
Table 9.9.2
Calculations Used In Bruoeton Data Reduction (Based on Fires Observed In Figure 9.9.1)
Exploeive Title
t-
Number
Two 2
I Three 3 1 4 4 4
FOUX 4 0 2 0 0
I SURIB 10 12 20
Find the correction term - ITin;l’ w 1Z2 = 14 4
1%; 10 l
Find the mean step number = I' LVi = 12 = 1.2 x hi 10
Find the mean square deviation, M = te Phi - correction term L hi
- 20 - 14.4 = 0.56 10
*In this table 1 deslgnates an arb.itrary naming of the explosives used In the test where L = 0 is assigned to the 1oweeJt explosive at which a renponse occurred.
77
NAVWEPS REPORT 741 I
/ , / /‘Lip / ,j$
1 ,’ ,’ / / /
/
I
/ ,
/
J I I I I L 4 6 6 IO 12 14
STIMULUS (ARBITRARY UNITS)
FIGURE; 9.9.3 PREDICTION OF THE RELIABILITY OF AN EXPLOSIVE SYSTEM ON THE BASIS OF BRUCETON PLAN PERFORMANCE TESTS *
WITH VARICOMP EXPOSIVES =
78

NavWeps Report 7411
G Is found by use of Figure 9.7A. The values of the mean and Its standard deviation above are In terms of explosive numbers as units and must be changed to the stimulus Intensity units, Making this change they become 10.6 for the mean and 0.60 for the standard deviation of the mean. The lower confidence limit for the value of 7 can be found using Student's t dlstrlbutlon
where the value of t depends upon N and the degree oY confidence desired. For a one-sided 95-percent confidence and N equal to 10, t Is 1.8+. Thus the lower 95-percent confidence limit for X Is 9.52 In this example. This Is the x coordinate of the point L in Figure 9.9.3 and the mean, 10.6, Is the % coordinate of the polntM .
Reliability Estimate. The estimates of design and Its lower limit may be obtained graphl-
tally (Figure 9.9.'3) or by substltutlng these values of % In the equations for the expected rellablllty and its lower limit. This gives an expected rellablllty of 2.08 normlts with a lower limit of 1.42 normlts. The estl- mated rellablllty Is therefore 98.1 percent with a lower 95-percent confidence limit of 92..2 percent.
.lO Errors Due to Unequal Spacing of the VARICOMP Explosives. A fun amental assumption In the analysis of data by the Bruceton %- technique Is that the stimulus steps-are equally spaced*+, This condition will be satisfied If the VARICOMP explosives have equally spaced 50-percent sensitivity values and If the slopes of their sensitivity lines are the same. That is, the lines representing the VARICOMP explosives In Figures 9.3 and 9.9.2A must be equally spaced and parallel. The 50-percent points of the VARICOMP explo- sives will probably not be equally spaced because of uncontrollable variations In their preparation. A statlstlcal desk-top experl- ment has been carried out by the Monte Carlo technique (Appendix D) to Investigate the effect of unequal spacing. This experiment showed that, If the differences in the locatlonsof the SO-percent
*See, for lnatance, Mood "Introduction to the Theory of Statistics" Table IV, MC Graw-Hill Book Co., 1950. Also Table E-2 of this report.
l
**Note that as previously stated, the stimulus 1s the transformed dosage which normalizes the response of the system,
. 79

NAV WEPS REPORT 74 I I
- - -- OBSERVED
SENSITIVITIES
STIMULUS AVAILABLE I FROM THE DONOR ACTING
THROUGH THE INTERFACE
STEP SPACING : EF> FG> G;H
NOTE : COMPARE WITH FIGURE, 9.6
FIGURE 9.1 I# THE EFFECT OF VARICOMP EXPLOSIVE NON PARALLELISM ERRORS ON STEP SPACING
IN THE BRUCETON PERFORMANCE TEST
80

NavWeps Report 7411
point8 of a series of unequally spaced explosives with respect to the locations of the 50-percent points of a series of equally spaced explosives is taken as normally distributed (mean equal to zero, standard deviation equal to some fraction of the spacing between explosives), the effect of unequal spacing would be small for standard deviations less than one-tenth the explosive spacing. The effect would be appreciable If the standard devla- tlon were larger than one-fifth the step size.
9.11 Errors Due to Variation In the Standard Deviations of tmAR1COMP Explosives. The variation within any one of the VmOMP explosives is measured by the standard deviation of its sensitivity. This variation is inversely related to the slope of the sensitivity line of the appropriate explosive. It has been assumed that these lines are parallel, i,e., the standard deviations of the VARICOMP explosives are equal. This seems to be a reasonable assumption for a series of similar explosives such as RDX/Calcium Stearate in different proportions. However, it might b8 that the standard deviation changes in some systematic way with the composition. It might, for instance, Increase with increasing dlluent, If the VARICOMP series were, made up of unrelated explosives, a possibility which has already been pointed out, the standard deviations might be unrelated. Experience in sensitivity testing gives some indication that the standard deviatlon Is a characteristic of the test system rather than of the explosive. In Figure 9*9.3 the vertical line through M represents the constant stimulus to which the acceptor is subjected. The testing procedure measures the response of the VARICOMP explosives to this constant stimulus. In other words, It deals with the intersection of the vertical line through H with the line of the VARICOMP explosive tested. If, as shown In Figure 9.11, the VARICOMP lines are not parallel, the actual test levels will not b8 equally spaced for the constant stimulus even though the 50-percent points are equally spaced. The effect of parallelism errors will be similar to the errors in the SO-percent points. The effect will be smaller for explosives whose 50-percent points are closest to the constant stimulus characteristic of the par- ticular test--for instance, Explosives Three and Four of Figure 9.11. If the slopes of the lines decrease Steadily (the standard deviations increase) from the more to the less sensitive explosives the effect Is to make the steps closer together with the less sensitive, and farther apart with the more sensitive 8xplosiv8s. The result of this would be to predict a somewhat higher performance of the ordnance item than the correct value (overestimate Its reliability). The error does not seem to be great, although not enough work has been done to give an exact statement concerning Its magnitude.
81

NavWeps Report 7411
9.12 Errors,Due to Small Sample Size, The point M In Figum.9.3 is determined by the mean obtained from the Bruceton test results. The standard deviation of the mean, which is the measure of the precision, varies inversely with the square root of the number of trials in the test. Two situations were studied and are presented in Table 9.12 to give an indication of the magnitwAe of uncertainty which can be expected as the sample size is changed.
82

NavWepa Report 7411
Table 9.12
Effect of Sample Size on the Eatlmate of the Minimum Rellablllty, at 95-Percent Confidence
Predicted from Bruceton Data Giving Obaerved Rellabllltlea of 99 Percent
I Test I Test II: Normlt Space
Between Levels (Vertical Spacing) I
I Number of Levels
0.25 1.00
Maximum Level (Normlts)
+l.lO +1.40
P lnlmum hvel
Number of Ltema Teated
25
Single-Sided Lower Limit 95-Percent Confidence Estimate, at g5-Percent Confidence, of Rellablllty (in percent
Test I Test II
97.6 97.2
50 98.2 98.0
100 98.5 98.3
83

NavWeps Report 7411
10~. RUN-DOWN PERFORMANCE TEST
10.1 Data Collection. Run-down performance tests can be madewith one or with more than one VARICOMP explosive. The number of explosives and the number of trials with each explo- sive should be decided upon before the run-down phase of the experimentation begins. It Is often good strategy to run a preliminary up-and-down type of test in order to select the run-down test levels. Note that the stipulation of a prede- termined number of trials at each level is in contradiction to the Bruceton plan where only the total number of usable trials is predetermined. ~ The number of test levels and trials at each level is not at the option of the experimenter. For the run- down method the choice of explosive(s) from the series should be made with the objective of observing mixed responses (fires and non-fires). The optimal choice will ordinarily be the explosive(s) giving the closest to 50-percent response In the performance test system.
10.2 Acceptable Test Modifications. The stipulation of a pred=mined number of trials at predetermined test level(s) can be set aside for certain legitimate reasons. For instance, assume that a leve~l is being studied wherein the performance test results must bxhiblt a high percentage of functioning In order for the design system to be reliable. If in the first few trials some ori all fall, Indicating an unreliable system, there is no point In expending any more time or material. At this point a redes,ign, and/or a reevaluation of the goals is In order. This approach has been used profitably in the past wherein unreliable systems were quickly detected, often with less than ten, or ,even less than five, trials.
10.3 Single Eiploslve, Data Collection and Reduction. ThlsFthe simplemst possible application of th VARICOMP method. The notation used here is explained ineTable 10.3.
Let the performance test be carried out for ti trials with one ;VARICOMP explosive, with the observation of h, successes and no failures, where y Is the sum of %, and n, .
Compute the observed probability of response, .R; , as -x/N Thls locates point M on the calibration line of ihe VARICOMP explosive shown in Flgurie 10.3.

NAVWEPS REPORT 7411
J
RESPONSE COORDINATE
DESIGN VARICOMP EXPLOSIVE EXPLOSIVE
STIMULUS CATEGORY COORDINATE
IRi x POPULATION
OBSERVED R 0 0 R 0 i
OX 1 EXPECTED OR
MOST LIKELY 1
OR0 Oni SINGLE-SIDED
LX LOWER-LIMIT
ESTIMATE
R L D R L i
LflD
COMPOSITE SINGLE-SIDED LOWER-LIMIT
ESTIMATE
NOTE : CONFIDENCE OF ESTIMATES MADE ON THE BASIS OF PERFORMANCE TEST DATA ( SIGNIFIED BY LEADING SUBSCRIPT L--eg. LRD) IS Cp
NOTE : CONFIDENCE OF ESTIMATES MADE TO ALLOW FOR LIMITED CALIBRATION SIZE AND /OR MULTIPLE BATCHES (SIGNIFIED BY AN UPPER CASE-SCRIPT R ) IS Cc
I Rn)
r I - LOWER LIMIT ESTIMATE
AT CONFIDENCE Cc
ESTIMATE AT CONFIDENCE Cp
TABLE 10.3 THE SYSTEM OF NOTATION
85

NAVWEPS REPORT 741 I
R OBSERVED PROBABILITY 0 B OF RESPONSE
R l&WER LIMIT OF RESPONSE AT L P CONFIDENCE Cp
(
/
LOWER LIMIT OF STIMULUS DERIVED- FROM THE INTERSECTION OFTHE LINE REPRESENTING THEOBSERVED RESPONSE WITH THE CALIBRATION LINE FOR EXPL&
/
/ L
0 L
oR,= F
LRB IS COMPUTE
AT CONFIDENCE, Cp,USING BI-
NOMIAL STATISTICS
L 1
STIMULUS
+OBSERVED STIMULUS DERIVED FROM THE INTERSECTION OFTHE LINE REPRESENTING THE OBSERVED RESPONSE WITH THE CALIBRATION LINE FOR EXPL.13
FIGURE IO.3 TREATMENT OF SINGLE-VARICOMP EXPLOSIVE RUN-DOWN PERFORMANCE TEST DATA
86

NavWeps Report 7411
Select a confidence level, CP , which will beassociated with $i , the estlmate of the lower limit of the response of the performance test system when loaded with the VARICOMP explosive.
Select a confidence level, Cc , which will be associ- ated with estimates based on the calibration equation for the design explosive.
Compute the lower confidence limit, LR~ , for the estimated probability of response, R., in the perform- ance test system using binominal stakistics. Tabulated values as in Table 2.4, can be found in standard books on statistics
'one tailed" are must be exercised to identify
whether - or 'two tailed" limits are tabulated, and to decide which of these limits is appropriate to the task In hand.) This lower confl- dence limit, ipi, Is plotted at pointL on the calibration line in Figure 10.3. Corresponding to the limit,rRi , determine the value of the stimulus, ,Ic , which is the estimate of the stimulus, &L , derived from the donor, the estimate being made at a confidence CP l
The value of,% can be read from Figure 10.3, or else by converting &R; into normlts followed by substitution into the VARICOMP explosive calibration equation. In those cases where a saturated response is observed (all-fires or all-fails) ofti becomes either *B The lower lim~f,~R~,
when transformed to normlts. for the all-fire case (the upper
limit &; , for the all-fail case) is tabulated the same as for mixed responses. The stimuli associated with such limits can be computed as described above.
10.4 Single Explosive, Reliability Estimate. The performance testabove has yielded a value of stimulus, L~ , which is taken to be the least intense stimulus which can be expected from the donor at a confidence Cp . The expectation of response of the design system when exposed to the stimulus can be found from the design explosive calibration equation. Again, this estimate can be made either graphically, as in Figure 10.4, or algebral- tally. When the observed stimulus,.% , is substituted In the equation for the observed calibration of the design explosive, an estimate of the most likely rellabillty, JZ. , will be obtained (point Q In Figure 10.4). When the lower limit of the stimulus, Lx Is substituted in the equation for the lower limit of the ieslgn explosive the most pessimistic esti- mate, Lko , Is obtained (point N in Figure 10.4).
Y

NAVWEPS REPORT 7411
hl
/
/ L
0
RESPONSE OF DESIGN
ESTIMATED LDWER LIMIT OF RESPONSE OF DESIGN EXPLOSIVE (AT CONFIDENCE CC )
/ R 0 P
. . . STIMULUS
FIGURE 10.4 ESTIMATE OF RESPONSE OF A SYSTEM LOADED WITH THE DESIGN EXPLOSIVE, BASED ON SINGLE-VARICOMP-
EXPLOSIVE RUN-DOWN PERFORMANCE TEST DATA
88

NavWeps Report 7411
10.5 Single Explosive, Confidence of Rellablllt eSti* LuD 19 a two-step Conservative eStimte. it Is a minimum limit for the Value of mD , given the Value of LX . But LX is in itself a lower limit for the estimate of = . The computation of the confidence of the composite estimate is not simple. The true confidence value can be bracketed partially:
The total estimate of RDls made up of two Independent sub-estimates, one R. and the other Ly .
There are four possible situations for these estimates. Either of the two estimates can be right or either of them can be wrong, each independent of the other. The probability of each estimate being right is given by Its confidence level. The Individual and joint probabilities are listed In Table 10.5. From this table It can be seen that
The probability that the final joint estimate Is wrong will be at least as great as Pm (both estimates wrong).
The probability that the final joint estimate is right will be at least as great as PA (both estimates right).
In those sltuatlons wherein one estimate 1s right and the other Is wrong, it Is not possible to tell whether or not the joint estimate Is right or wrong. The probability of this ambiguous situation Is P,ap, l
The derlvatlon of the distribution of
may require the use of Monte Carlo techniques. There Is some basis for a suspicion that the above distribution function may be Influenced by the conditions of the test. For Instance, It may be altered by the relationship between the slopes of the two calibration curves. In any case, It Is proper to say that the-confidence of the combined estimate falls between the two limits cc-C, and (bC,)(l-Cp) .
"rhls symbolism expressed in words Is The probability that the true rellablllty,TP , Is equal to or greater than the joint conservative estlmate.of the rella- blllty, +, , given the confidences,C, andC, , of the sub- estlmate.
89
NAVWEPS REPORT 74 II
CONSERVATIVE ESTIMATE OF RESi’ONSE OF DESIGN EXPLOSIVE,
CONSERVATIVE ESTIMATE
SITUATION GliEN THE STIMULUS OF STIMULUS
CONDITION PROBABILITY CONDITION PROBABILITY
WITHIN LIMIT WITHIN LIMIT
A I xbn,) cp x hLX ) cc
OUTSIDE LIMIT WITHIN LIMIT
B (,IR,<n,) ‘-% * (=Lxj c,
WITHIN LIMIT OUTSIDE LIMIT
C
I
CP
XRD’ D RI
{ X<LX 1 I-C,
OUTSIDE LIMIT OUTSIDE LIMIT
D XRD<
i-c p I-C,
R z LeD = PA 1 = Cp’Cc
P [ R ? L Ml D’= pB = U-C,) c,
P i R ? L D = PC = cp U-C,) n 1 P R < = PD = (I- &)(I - c,)
NOTE: THE SYMBOL, R D DENOTES THE TRUE RESPONSEOFTHE DESIGN EXPLOSIVE FOR A SPECIFIC STIMULUS, x
TABLE 10.5 COMPOSITE CONFIDENCE OF COMBINED ESTIMATES

NavWeps Report 7411
10.6 Multiple Explosive, Data Reduction, Problt Analysis. If more than one ti all of the explosives must be Included.
e results for The determlnatlon of
the probability of the response for each explosive will have 8 certain precision. This precision will depend upon the expected probability ,of response for each particular explosive. Note that this Is the expected probability and not the observed probablllty. The separate observations or determinations should be combined as a weighted average wherein the weighting takes Into account the Individual preclslons, and therefore the individual expected probabilities. The expected probabilities cannot be determined until the stimulus which will cause them has been found. But the computation of the stimulus depends upon weighting of the data according to this expectation. The te-chnlque of problt analysis as developed by Flnney (23) converges on the correct answer by using the observed data as a first guess of the expected values. A provisional stimulus la found from which new expected probabilities will generate new weights for the observed data. This process Is continued In an Iterative fashion until an answer Is obtained.
10.7 Multiple Explosive, Data Reduction, Non-Iterative. If t=robablllty of the system la distributed according to the logistic function, the one-shot, non-iterative logit- analysis (25) gives efficient estimates with very little computational effort. An equivalent method In the Gaussian probability space, called the normit analysis (37), Is somewhat more complex. A slmpllfled one-shot weighted average can be used which borrows from the problt analysis by using the weighting factor:
where:
p is the observed probability of fire*
-or a saturated level (where the trials are either allx'r or all O'S >, the practice Is to convert one of the trials to a l/2 x and a l/2 0 For Instance, If slx out of six fired, then xS would be 5.5.and *,, would be 0.5.
91
1 NavWeps Report 7411
3 la the observed probability of non-fire I
't is the ordinate of the probability density function associa ed wlth p K (See Table V reference 23 and
4 Table E,l of this report.)
This weighting factor, when rewritten In the notation of Paragraph 10.3, becomes
The analysis which will use this weighting factor could be carried out in the following sequence:
For each VARICOMP explosive compute the observed probability, aR; , and find the corresponding normlt values.
From theNcalibration equations compute the observed stimuli, &; , corresponding to the normits just computed.
The weighted average of all of the stimuli Is computed according to
where j is the number of VARICOMP explosives used In the performance test. This average is the estimate of the stimulus derivable from the donor through the Interface Into the acceptor.
The substitution of the estimated stimulus value in the call- bratlon equation for the design explosive will yield an estimate of the reliability of the performance test system when loaded with the design explosive.
10.8 Errors Due to Calibration Uncertainty. As was mentEd previously the calibrations of the design and VARICOMP explosives will be subject to errors--errors in determination of the standard devlatlon (slope of the line) and of the 50-percent point ( X -axis intercept). The computation of the combined effect of these errors on the pre- cision of the reliability estimate will be given for the case

NavWeps Report 7411
of a single VARICOMP explosive used in a run-down performance test. The following derivation of the procedure for computing this effect is based on a generalized system. billties are expressed in normits,)
(All rella-
Let the true calibration equation for the design explosive be:
(10.8.1)
Let the calibration equation, based on experiment, have errors in slope, bm, and in the SO-percent point, AD .
(10.8.2)
Let the true calibration equation for the VARICOMP Explosive A be:
(10.8.3)
Let the experimentally determined equation for the VARICOMP Explosive A be:
(10.8.4)
Note that the true slopes of the sensitivity lines of the two explosives are taken equal, and that the error In determination of the slopes is the same for both.
The true value of stimulus, X , can be taken as zero wlthout loss of generality. Therefore,
(10.8.14
(10.8.34
Since Only the effect of calibration error Is being studied, It can be assumed for the present that ,,RA, and 1Rh are equal. The description of the observed stimulus for the VARICOMP Explosive A can therefore be obtained by comblnlng Equations (10.8.3) and (10.8.4):
93
NavWeps Report 7411
That is, any depa$ture of the value of the observed stimulus, CJ , from the true value, X , must be due to the VARICOMP
explosive calibration errors Am and DPI When the above observed value of~stimulus Is substituted'ln the calibration equation for the design explosive, the value for the estimated observed design reliability becomes
IA = Aham+~bA+AA-M-h-b /h-~lJbADn~, (10.8.6)
The reliability estimation error, E , Is given by ,R, -R o . Therefore,
This equation expresses a relationship which will hold for each experiment in this system. To generalize for all experiments this equation Is more properly written
The last term can be neglected since It is of the second order and therefore small compared to the other terms. By squaring and summing the remaining terms for all possible errors (for cases i=t to i=% ) and by dividing the sum by 'K the variance of Pp (neglecting performance test reliability) is found to be
In Equation 10.8.8 the sums of the cross products of the errors AA f rflD J andAs*\Ihave been‘omltted on the assumption that the Individual errorslare uncorrelated. For this reason these sums are equal to zeroi Equation 10.8.8 gives the variance of the reliability estimate due to calibration errors. If now the variance, VP , of the determination of the VARICOMP explosive response In the performance test is also Included (that is if l?ZA is taken equel to the sum of K* andaK, ) the complete
equation Is I
These variances must be expressed in (logits)2, or similar units And not In percentages.
(n-ormits)2,
94

NavWeps Report 7411
10. -9 Example, Run-Down Method. Asauma that there exists a sys em for the study of which the design explosive and two VARICOMP ex losives,
P Ex
P losive
calibrated A and Explosive B, have been
Figure 10.9 . The calibration equation of the design explosive Is:*
RD = 0.345$- l.%f.
with Its lower limit, at g+percent confidence, given by
The calibration of Explosive A is
RR = 0.35')1- L5 and of Explosive B is
R, = 0.2.5Y - 3.0, In the above equations the response is expressed In normits.
10.9.1 Single VARICOMP Explosive, Data Collection. mires are observed In seven trials wlth VARICOMP Explosive A In the performance test, The observed response is therefore 71 percent. The lower one-sided 95,percent confidence Unit for the estimate of the true response in this case Is 34 percent (from Table 2.4 or reference 42).
:i ~~~le"~~e,o~~~~bVr~~ca~ao~~ may
be used to obtain the reliability predictions. Since the values of Qo,&P and RA in these equations are In normits, the observed response and Its lower limit must be changed to these units, Thus 71 percent becomes 0.55 normlts and 34 percent becomes -0.41 normits. The va.lues of X which correspond to the observed response and to the l-ower limit of the estimate of the response with the VARICOMP Explosive A are found to be 8.72 and 5.97 by substltutlon in the equation of the line for this explosive. Substitution of the first of these values of x In the equation for the expected response
*This is the same design explosive as was used in the Bruceton example, Paragraph 9.9.2 and Figure 9.9.2A.
95

I NAVWEPS REPORT 7411
0 +-4 $8 +12 STIMULUS
(ARBITRARY UNITS I
39.8
39 .5
39
35
90
30
5
I
3.5
0.2.
\
3
FIGURE 10.9 ~ CALIBRATION OFTHE DESIGN AND THE TWO VARICOMP EXPLOSIVES
96
NavWeps Report 7411
of the design explosive gives 1..43 normits which is equivalent to g-2.,4 percent as the expected reliability of the ordnance design. Substitution of the lower limit for the value of )I In the equation for the lower limit for the response of the design explosive gives a value of 0.37 normits or 64.4.percent for this lower limit. The estimate of at least 64,4-percent reliability is made at a confidence between go.25 percent and 99.75 percent.*
A short cut can be taken if the responses of the design explosive and the VARICOMP explosive can be represented by parallel lines spaced a known distance, say 1 normit, apart. In such a case the final estimates could be obtained by adding this amount to the values of the responses for the VARICOMP explosive. If this technique were used in the above example, for Instance, the expected rellablllty would be 1.55 normits or 94 percent with a lower limit of 0.59 normits or 72 percent. These results, which are based on the assumption that the sampling error of the design explosive can be neglected, are In error. Since the two explosives are not represented by parallel lines the short method should not be used here. In this case, the result would be too optimistic because of the upward convergence of the two calibration lines.
Single VARICOMP Explosive, Graphical Data Wion. T he Intersection of the 71-percent response
with the calibration line (point l~~"$'~ields an observed stimulus X
M of Figure of 8.7.
loiei one-sided 95-percent confiden6e'llmit for the The
estimate of the true response of VARICOMP Explosive A, Lab , Is 34 percent. The Intersection of the 34-per-
cent response line with the calibration line (point L of Figure 10.9.3) yields a stimulus, LX J of 5.9. Drawing vertical lines from these points to Intersect the band for the design explosive, the predictions of 92.4 percent (point Q of Figure 10.9.3) and 64.4 percent (point N of Figure 10.9.3) are obtained for the expected reliability and its lower limit at greater than go-percent confidence.
*These confidence levels are obtained from
C,*L - 0.95 R 0.95 = 0.9025 I-Cl-C,)(l-C,) = 1 - (0.05)(0.05) = 0.9975
97

NAVWEPS REPORT 7411
OR, : EXPECTED RELIABILIT
IS 92.4 PERCENT
5/7 FIRES
SINGLE-SIDED LOWER LIMIT 95-PERCEr
ORA , 4 I T
LOWER
n RELIABILIl L D pPE;i;\;t
CONFI DEh
R : LA CONFIDENCE ESTIMATE FOR 5/7 FIRES
+4 +8 +12 STIMULUS
(ARBITRARY UNITS 1
-!
1
I
-(
-f 7 tl6
I
99.8
99.5
99 ?
90
80
w
tz 0 a
!O t cc
IO
5
I
M
3.2
\
FIGURE 10.9.3 ANALYSIS OF RUN-DOWN PERFORMANCE TESi WITH ONE VARICOMP EXPLOSIVE
98

NavWeps Report 7411
,
10.9.4 Two VARICOMP Explosives, Data Collection. For an example of collection and analysis of data when using two VARICOMP explosives with the run-down scheme it is assumed that the design tested in the previous example has been modified geometrically in an effort to improve Its. reliability. The improved design Is to be tested by making ten trials with the VARICOMP Explosive A and five trials with VARICOMP Explosive B. (The equations of the responses of the explosives are given In Paragraph 10.9.) The results of the perform- ance test, made according to the above plan, show all ten trials with VARICOMP Explosive A as fires and two of the five trials with VARICOMP Explosive B as fires.
10.9.5 Two VARICOMP Explosives, Data Reduction. -the observed loo-percent response with VARICOMP Explosive A cannot be expressed In normits, the data are treated as suggested in Paragraph 10.7. Calcu- lations are made using 9.5 fires in ten trials with this explosive. The computation follows the steps in Paragraph 10.7 and is outlined in Table 10.9.5. Substitution of the average value of .X in the equation for the expected response of the desi n explosive gives 2.24 normits which is equivalent to 9 % .7 percent. Figure 10.9.5 shows the plot of the observed data and the expected response of the system with the design explosive.
99

NavWeps Report 7411
I 1 Table 10.9.5
Fomputation of the Average Observed Stimulus Intensity
.
Nun&r of Observed Response Stimulus x from Explosive Trials percent normits Calibration Curvee
A 10 95 1.64 11.8
B 5 40 -0.25 11.0
Fixploslve 4 x w CYIW %lJS
A 11.8 0.22 2.20 25 0%
B 1l.b 0.62 3.10 34.10 A
100
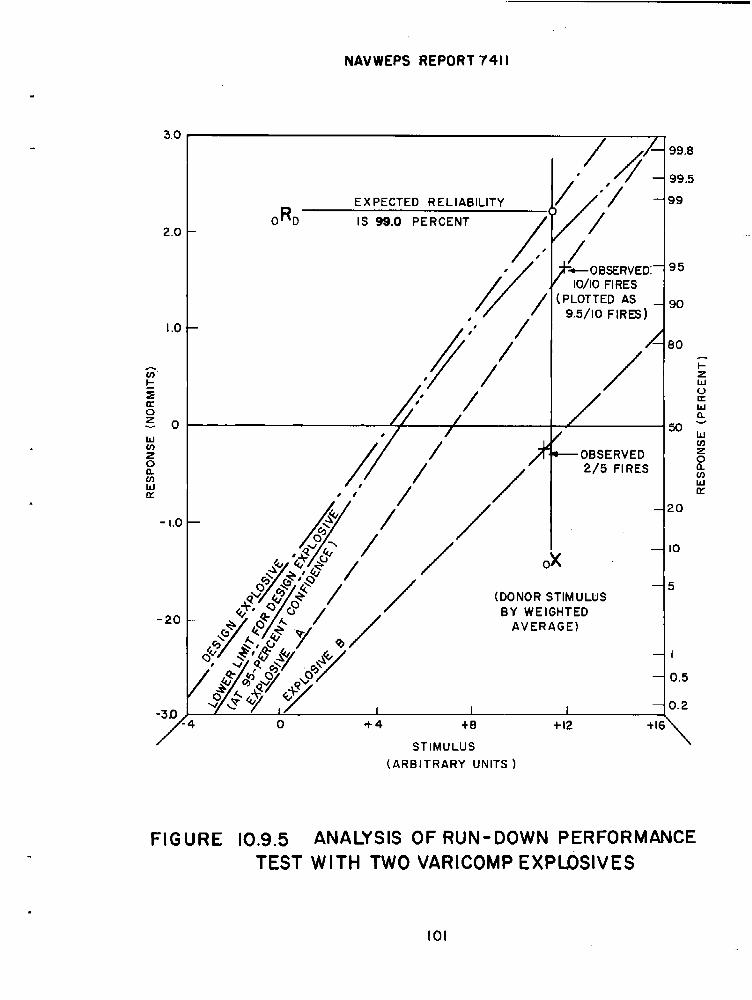
NAVWEPS REPORT 741 I
3.0
2.0
1.0
P z E e 0
E s El E
- I.0
-20
-30
/
R EXPECTED RELIABILITY
0 D IS 99.0 PERCENT /
, - ,
/
I’ /
/
I /
/
I /
/ ~-OBSERVED:-
IO/IO FIRES PLOTTED AS 9.5/10 FIR=) -
-OBSERVED 2/5 FIRES
/ ox - (DONOR STIMULUS
BY WEIGHTED AVERAGE)
0 +4 +a +I2 +I
STIMULUS (ARBITRARY UNITS )
99.8
99.5
99
95
90
80
r 2
i w
505 ii
H : LL:
20
IO
5
I
0.5
0.2
\
FIGURE 10.9.5 ANALYSIS OF RUN-DOWN PERFORMANCE TEST WITH TWO VARICOMP EXPtiSIVES
101

3.0
00
-1.0
3.0
2.0
0.0
- IO
NAVWEPS REPO,RT 741 I
I I
95.0 PERCENT
LnD= 86.9 PERCEN
STIMULUS -
PO’ 98.4 PERCENT
-7
‘6;1= ‘94.8 PERCENT L D
= 54.9 PERCENT OBSERVED 5/5
i; 74. I PERCEh OBSERVEO to/ IO
STIMULUS -
IT
99.8
99.5
99
20
99.8
99.5
99
l- z
95 p
E go -
8o w v)
E e
:
5om
20
P
FIGURE IO. IO EFFECT OF SAMPLE SIZE AND GRID SPACING ON SINGLE VARICOMP,- EXPLOSIVE RUN-DOWN RELIABILITY ESTIMATES
102
-
.
NavWeps Report 7411
10.10 Small Sample Errors and Limitations, Single Explosive. The observed response obtained from a small number of trials will not be the true value for the probability of fire. -First, the sample will not be perfectly representative of the general population (sampling error). Second, a sample of five, for instance, can only show a percent response of 0, 20, 40, 80, or 100 while the true value might be anything between
60,
0 and 100 percent. The amount of this uncertainty when one VARICOMP explosive Is used and no more than two non-fires occur Is shown in Table 2.4. This Is the effect on the performance of the ordnance Item with the VARICOMP explosive In place of the design explosive. The effect on the final estimate will depend on the difference In sensitivity between the two explo- sives. For instance, with a VARICOMP explosive whose sensi- tivity line Is
P arallel to the design line and spaced 1 normit
less sensitive measured on any vertical line), an observation of no non-fires In five shots with the VARICOMP explosive would Indicate a weapon rellablllty of at least 86.9 percent (Figure 10.10). An observation of no non-fires In ten trials would Indicate a reliability of at least 95.0 percent. If the VARICOMP explosive is spaced 1.5 normits less sensitive than the design explosive, minimum rellabilltles for the above observations would be -94.8 percent and 98.4 percent, respectively (Figure 10.10). These are the highest reliabilities that can be demonstrated for these sample sizes and spacings regardless of how reliable the system might be.
10.11 Small Sample Errors and Limitations, More than One Explosive. When more than one VARICOMP explosive Is used in the performance test the effect of the small samble size will be-a combination of the separate errors of thii sort for each explosive. The Monte Carlo approach has been used to estimate the magnitude of this effect in desk-top tests. Four VARICOMP explosives were simulated. Their sensl- tlvltles to a stimulus for which the design explosive was set at a response of 97.5 percent were 93, 79.9, 55.6, and 28.8 percent.
Eight replicates were performed In which ten trials were made with each VARICOMP explosive. For those cases In which all fires occurred the data were corrected as described in Paragraph 10.7.
The computed standard deviation of the weapon rella- blllties In terms of normlts was 0.185. Three standard deviations below the central value gives a predicted reliability of 92.0 percent (to be compared with the assumed 97.5 percent response).
103

NavWeps Report 7411
A set of sixteen replicates was carried out In which five trials were made with each VARICOMP explosive. The standard deviation of the predicted rellabllitles was 0.277 normits. Three standard deviations below the central value gives a rellablllty prediction of 89.5 percent (to be compared with the assumed 97.5 percent response).
The magnitude of this effect will undoubtedly depend upon the number of VARICOMP explosives used, on the spacing of their sensltlvltles, and probably on other factors. The results quoted above can fherefore be taken only as an Indication of the effect of thlg uncertainty.
104

NavWeps Report 7411
.
Il. COMPARISON OF VARIOUS DATA COLLECTION MEZHODS
11.1 Choice Between Stairstep and Run-down Methods. The choiaetween the use of a stairstep or up-and-down procedure and the use of a run-down procedure will depend upon bne or more of several factors. Each type of test has certain features which may make its choice desirable. The analysis of any up-and- down test, such as the Bruceton test, ordinarily assumes that the test levels are equally spaced. This requires that the 50- percent points of the VARICOMP explosives be equally spaced and that the slopes of their sensitivity lines be equal. The slopes of the lines need not be known. With the run-down method the 50-percent points do not need to be equally spaced nor do the lines need to be parallel. However, both the 50-percent points and the slopes of the VARICOMP lines must be known. The up-and- down method requires the use of several VARICOMP explosives arranged In a regular graded series of sensitivities, The run- down method may use several explosives if this appears desirable, but it may be used,with only one VARICOMP explosive. In an up-and-down test the result of one trial must be hewn before the set-up for the next trial can be made. In a run-down test the trials are made Independently of each other. The set-ups could all be made In advance and randomized, Such randomization would not be possible with an up-and-down test. The up-and-down test would therefore be subject to errorsdue to trends which might occur In the loading of test Items. The design of an up-and-down test will concentrate the trials at a certain point. For Instance, the Bruceton test concentrates the trials near the 50-percent point. In the run-down test the levels used are chosen entlrely according to the judgement of the experi- menter. On the other hand, the run-down test can be designed to center about some other point. As has been pointed out in Paragraph 8.10, It Is often desirable to calibrate the design explosive with most of the trials (and therefore the greatest precision) In the vicinity of the 70-, 80-, or go- percent point. The up-and-down methods require a series of several explosives equally spaced In sensitivity represented by parallel lines In the calibration, If It Is not possible or desirable to use such a series of explosives the run-down method should be used.
11.2 Other Staircase Testing Methods. For most testing, eithsn the calibration or performance tests, the best method will be either a run-down or a Bruceton test. However, there may be situations in which some one of the other staircase
105

NavWeps Report 7411
methods of sensitivity testing-may be advantageous. This would be the case, for instance, If a-trial which resulted In a fire was very much more expensive than one which resulted In a non- fire, In thl's situation, the single explosion method as described In reference 30 might be used to estimate the VARICOMP explosive number which would have a response of 10 percent In much the same way as the Bruceton method estimates the explo- sive having a SO-percent response. The result of a teet carried out by this method would be plotted In the same way as the point
M In Figure 9.9.3 except that It would be located on the lo-percent line rather than the 50-percent line. Other methods described In this reference might be desirable In some cases.
106

NavWeps Report 7411
12. DESIGN OF EXPERIMENT
12.1 In the use of the VARICOMP procedure the reliability of an ordnance item is evaluated using one or more of the VARICOMP explosives. Then, in terms of the calibration tests, an estimate is made of the Increase in reliability which can be expected when the design explosive Is used In place of the VARICOMP explosives.
12.2 The calibration test should be an extensive test whichwould determine very accurately the comparative sensi- tivities of the VARICOMP explosives and the design explosives, such as Tetryl, CH-6, and TNT. This calibration, like any other calibration, would ordinarily have been done before the performance test program is formulated and by a different person. The type of test used In the calibration should be one which would glve results applicable to as wide a variety of practical systems as possible. The small scale gap test is worthy of consideration. However, since the Interface between donor and acceptor Is a solid barrier In this test, it may not be exactly applicable to a system In which the transfer mechanism depends largely upon fragments striking the acceptor, There might also be other conditions which affect Its applicability, The person using the VARICOMP method of evaluating a practical system should be sufficiently well acquainted with the calibration test to be able to decide whether or not the calibration Is applicable to his system.
12.3 If the experimenter decides that the existing cali- brat=cannot be used with his system, a new calibration must be made using a mock-up of his system. If several VARICOMP explosives are used In the performance test, and If the best straight line through the points representing their responses departs significantly from the vertical (Figure 12.3), this may be an Indication that the conditions of the calibration test differ significantly from those of the performance test. It should be remembered that If It is necessary to discard the extensive calibration much of the advantage of the VARICOMP procedure will be lost. The error in the final reliability estimate will be a combination of the error of the performance test and the error of the calibration. If the precision lnher- ent in an extensive calibration must be abandoned this loss can only be made up by a considerable increase In the number of trials In the performance test. To this must be added the
107

NAVWEPS REPORT 7411
FIGURE 12.3 POSSIBLE LACK OFANALOGY BETWEEN CONDITIONS OF ~PERFORMANCE AND CALIBRATION TESTS.
108

NavWeps Report 7411
c
.
increased effort of recalibration with the mock-up tests. It should also be remembe-red that the objections listed against changing the geometry of the ordnance item will probably apply to the mock-up calibration tests. In some cases, In spite of the above llmitatlons, it Is possible to use the VARICOMP process to demonstrate clearly that a system Is adequately reliable or that it is not reliable and therefore needs improvement.
12.4 The mechanism by which transfer of detonation takes placemay not be the same in the ordnance design as In the calibration test. If the relative sensitivities of the explosives considered are not affected by this difference, the results of the calibration test are still applicable. It might be that the effect of this difference between the two tests would be proportional to the sensitivities of the explo- sives. In this case the best straight line through the points representing the responses of the VARICOMP explosives will depart from the vertical. If the calibration and performance tests are different there are several choices open to the experimenter,
He can assume that the sensitivity of the design explosive Is affected by the difference between the two tests In the same way as the VARICOMP explo- sives. In this case he can extend the oblique line which best represents the responses of the VARICOMP explosives until It intersects the response line of the design explosive.
If the departure of the line from the vertical is not great he can Ignore it and proceed as described before by using a vertical line.
If he is in doubt between these two choices he can make both estimates and accept the more pessimlstlc of the two.
If none of these alternatives Is acceptable a new calibration must be made using a test which more nearly simulates the essential features of the ordnance design.
12.5 It Is possible for the experimenter to use several methsof measuring the desired reliabilities, and then to combine the results of these investigations, thus obtaining the final estimate. It should be fairly obvious that the rules for obtaining these combined results should be firmly established before the experimentation begins. If he waits until after
109
NavWeps Raport 7411
the results are In, he could v&y easily find a way of combining them so as to get almost any answer he wishes. The rules for combining these results should take Into consideration such things as the expected precision of the methods used. It is obviously Impossible to make more than general statements of this kind concerning the problem of combining the results of several methods. The experimenter must make his own decisions In the light of his own knowledge and judgement.
12.6 The strategy of the VARICOMP method can be considered as axhodlcal s&arch for an explosive which can be used to estimate the magnitude of the explosive drive, X , available across the Interface. The sought-for explosive, being less sensitive than the design explosive, will exhibit a lower proba- bility of fire. In fact, the explosive should be chosen so that It will exhibit a mixed response--both fires and falls--In the performance test. The greatest precision in the determination of the response of the VARICOMP explosive to the stimulus and the greatest efficiency In the extrapolation to the expected reliability of the design explosive will be achieved when the VARICOMP explosive response to 3~ Is near 50 percent. An illustrative examfjle follows,ln which the experimenter will fire only six shots In the performance test. The most probable observation, and the Inference therefrom, will be explored as a function of the~exploslve that might be chosen.
The design explosive, and ten VARICOMP explosives are available to the experimenter. The true responses of these explosives to the stimulus, y are not known to the experimenter. The experimenter &ows the relative ~senaltlvltles, These relative sensltlvltles are expressed In terms of the normlt spacing below the design explosive, Let the true responses and relative spacings be as given In Table 12.6. For computational ease, the responses are given In problts rather than normits.,
The explosive chosen as the VARICOMP material will exhibit one of seven possible responses-- 6/6, 5/6 . . . o/6. The probability of each of these responses can be computed from the binomial dlstrlbutlon according to
110
NavWeps Report 7411
Table 12.6
Relative Sensitivities of a Series of Explosives
Explosive True Response To Relative Spacing Below
x Design Explosive percent problts (problts or normita)
A 99.9 8.0902
A 98 7.0537 B 80 6.1750
C 80 5.8416
D 70 5.5244
E 63 5.3319
P 50 5.0000
0 37 4.6681
H 30 4.4756
I 20 4.1584
J 12 3.8250
1.0365
1.9152
2.2486
2.5658
2.7583
3 l 0902
3.4221
3.6146
3 l l8 4.2652
.
111

NavWeps Report 7411
where fk Mthe number,of trials
3~ ls~the number of successes
P is:the probability of response
Thus for explosive E (the probability of firing from stimulus X; being 63 percent) and for a great number of six-shot trials,
6/6 would be observed 6.25 percent of the time,
5/6 would be observed 22.03 percent of the time,
4/6 would be observed 32.35 percent of the time,
3/6 would be observed 25.33 percent of the time,
2/6 would be observed 11.16 percent of the time,
l/6 would be observed 2.62 percent of the time,
0/6 would be observed 0.26 percent of the time.
Whenever 6/b responses are observed a lower limit estimate of~60.67 percent (at 95-percent confidence) would be mage for the response of the VARICOMP explosive. Similarly, 22.03 percent of the time (for the 5/6 case) the corresponding estimate would be 41.81. For all possible cases, and for a great number of six-shot runs, the average~minimum response would be computed as
which is 26.39 percent (4.3686 problts or -0.6314 normits).
112
NavWeps Report 7411
When the explosive spacing (in this case 2.7583 normits) ia added to the average minimum response of the VARICOMP, the average minimum predicted reliability of the design expioaive la obtained 98.33 percent.
--In this case 7.1269 problts or
Suppose this general procedure has been carried out for explosive A through J for two weapon rellabllities-- 99.9 percent when loaded with Explosive 4 and 98 percent with Explosive A (Figure 12.6). It is apparent that the greatest efficiency of extrapolation will be achieved when the VARICOMP explosive has been chosen so that its true response to x is between 30 and 70 percent. Note that for six trials a reliability of about 98.5 percent can be demonstrated in the case shown as curve 1. About 225 shots would be required with the system loaded with the gg.g-percent reliable explosive In order to exhibit a 98.5-percent response. Thus, the "power" of the VARICOWP technique in this particular case Is 22 , or about 37.
-2
113

EXPL
OSIV
E RE
SPON
SE
OF
CHOS
EN
VARI
COM
P EX
PLOS
IVE
TO
x (P
ERCE
NT)
IO
20
50
80
90
95
97
98
99
99.5
99
.9
2 I
I I
I I
I 1
I E
CURV
E I
SING
LE-V
ARIC
OMP
EXPL
OSIV
E E
-99
CL
ESTI
MAT
ES
OF
SYST
EM
RELI
ABIL
ITY
- W
HEN
THE
DESI
GN
EXPL
OSIV
E IS
5
EXPL
OSIV
E n
(TRU
E RE
LIAB
ILIT
Y -g
8 E
99.9
PE
RCEN
T)
e -9
7 * El
i z a
CURV
E 2
SING
LE-
VARI
COM
P EX
PLOS
IVE
ESTI
MAT
ES
OF
SYST
EM
RELI
ABIL
ITY
WHE
N TH
E DE
SIGN
EX
PLOS
IVE
IS
EXPL
OSIV
E A
(T
RUE
RELI
ABIL
ITY
98
PERC
ENT)
n Y
g
5.0
I I
I I
I I
I 2
* 5o
w
a 3.
5 4.
0 4.
5 5.
0 5.
5 6.
0 6.
5 7.
0 7.
5 8.
0 g
FIG
UR
E
EXPL
OSIV
E RE
SPON
SE
OF
CHOS
EN
VARl
c0M
p EX
PLOS
IVE
To
x (P
ROBI
TS)
t2.6
TH
E EF
FEC
T O
F TH
E C
HO
ICE
OF
VAR
ICO
MP
EXPL
OSI
VE
ON
TH
E EF
FIC
IEN
CY
OF
ESTI
MAT
E O
F R
ELIA
BILI
TY
OF
DES
IGN
c l

NavWeps Report 7411
13. APPLICATIONS AND EXAMPLES
I l
13.1 The first use of the VARICOMP procedure was In 1953 (5). In tKKcase, a detonator was expected to initiate a tetryl booster in a certain fuze system. A series of several explosives less seneltlve than tetryl was used in performance tests. Using an acceptor of RDX/wax (96/4) one experimental Initiator was successful In detonating the acceptor in seventeen out of twenty-five trials while another Initiator was successful in five out of nine trials, Each initiator was successful In initiating Comp A In- one out of six trials. On the basis of these results and a knowledge of the comparative sensitivities of RbX/wax (96/4), Comp A,and tetryl, it was predicted that these initiators would be successful In Initiating a tetryl booster at least 95 percent of the time. Reference 6 describes briefly the idea of the VARICOMP procedure and then describes several varlatlons of a test which was used to calibrate a series of RDX/wax mixturesalong wlth tetryl. The results of this calibration were used in a VARICOMP performance test of a certain fuze*(jj). The performance test Indicated a reliabil- lty of well above 99 percent.
13.2 Another example of the use of the VARICOMP method Is the xuation of the reliability of detonation transfer between a booster and a main charge separated by a steel tube containing several holes (Figure 13.2). This complication of design made It quite difficult to assess the reliability by geometric modification without tampering with the mechanism of transfer. It was therefore decided to use a VARICOMP approach to the problem. At this stage of the design development, the final choice of the explosive to be used In the main charge had not been made. Bbth Comp B and H-6 were being considered. The. plan used In the test was to estimate the reliability of the design with each of these explosives using TNT as the VARICOMP explosive.
13.3 Since it was not considered desirable to make an extensive calibration test, It was decided to attempt to use a less precise test. The lack of precision was compensated for by taking the most pessimistic interpretation of the experl- mental results which would be consist&t with the data. The calibration was made using a variable barrier test with the response of the explosive being expressed as a function of the barrier through which it was Initiated by a standard donor.
115

NAVWEPS REPORT 741 I
STEEL WITNESS PLATE ( 6’X 2” X 5” )
CAST EXPLOSIVE BLOCK
MOCK-UP CALIBRATION TEST ARRANGEMENT
A- 118”STEEL PLATE, B- AIR GAP
C - VARIABLE THICKNESS
STEEL BARRIER
THIS TUBE HAS 4 HOLES, 318” DIA,
SPACED 314” ON CENTERS, ALONG
THE HORIZONTAL
PLANE A-A-A,
BETWEEN THE TWO
PERFORMANCE TEST ARRANGEMENT
l/8” STEEL SHELL 2”0.D.
l/16” HOT ROLLED STEEL CASE
FIGURE 13.2 BOOSTER-TO-WARHEAD TRANSFER RELIABILITY STUDY BY VARICOMP I
116
NavWeps Report 7411
I Each explos$ve was tested st two levels of intensity represented by barrier thickness. Twenty-five trials were made in each test with Comp B, ten trials In each test with H-6, and six trials in each test with TNT, Using an available table which gave two- . sided 95-percent confidence limits for the probability In a blnomlnal distribution, a range was obtained from each observed response within which the true value could be expected to lie. The observed data, together with this expected range for each observed response, are given in Table 13.3.
Table 13.3
Calibration Data and Results
f
Explosive T;r;i’ No. No. Response (p)
Trials Fires Observed 95$-Conf Interval Lower Upper
Comp B :;46 25 4 35.2 25 22
Ai 6::: 97.5
H-6 205 E 1: 0 165 100
6;:: 30.8 100.0
TNT 31: 6 0 45.9 6 5
8; 3% 99.6
The confidence intervals for the expected responses of Comp B are plotted in Figure 13.3A as the vertical lines AB and CD. The graph of the expected response could be any straight line which cuts both Ae and CD The most pessimistic estimate of the reliability of this e;ploslve for different stimulus intensities would consist of the broken line made up of
The part of the line DA which extends beyond A ,
The line segment AC ,
That part of Bc which extends beyond C .
Figure 13.3B shows the calibration results for the other design explosive H-6, in a similar way except that only the line I=G can be drawn since the other confidence limits cannot be plotted. The results for the calibration of the VARICOMP explosive, TNT, are treated differently In one respect. The most pessimistic prediction of the reliability of the design explosive in the
117 ,..,-

NAVWEPS REPORT 7411
/
/
/
/
I I I I 300 200 100
BARRIER ( MI LSI
FIGURE 13.3.A CALIBRATION OF COMP B
f

.
NAVWEPS REPORT 74 II
300 zuu IUU BARRIER (MILS)
FIGURE 13.3 B CALIBRATION OF H-6
119
NAVWEPS REPORT 7411 I I I
W LVV I”” BARRIER ( MI LS )
FIGURE 13.3C CALIBRATION OF TNT
f
120

NavWepa Report 7411
ordnance item will be made by taking the highest acceptable estimate of the response for TNT in the calibration since this makes the difference between the TNT and the design explosive the least. The line to be used is therefore the one passing through JL . This Is the upper rather than the lower, boundary of the zone representing the possible predictions, Figure 13.3C shows the calibration of TNT with this boundary. Again, aa was the case for H-6, only part of this boundary can be drawn since the lower end of one of the ranges cannot be plotted.
13.4 For the performance test, ten trials were made In which- performance of the ordnance design was observed with TNT substituted for the design explosive, All ten of these trials resulted in fires. The two-sided 95-percent confidence limits associated with this result are 69.2 percent and 100 percent. Using the calibration graph for TNT the stimulus Intensity which corresponds to 69.2 percent response for TNT is found to be that obtained with a barrier thickness of 43 mlls as shown on the TNT line In Figure 13.4A (point T ). The vertical line through this point Intersects the lower limit of the response expected wlth H-6 at 99.95 percent (point v ). The corres (point u P
onding prediction with Comp B is 99.83 percent The confidence associated with these predictions
is high. The lower limit which was used in the prediction for Comp B, for instance, was obtained,by combining the upper limit of the response range for a 306-mil barrier with the lower limit for the range with 234-mil barrier. Since the results of these tests would not be expected to be correlated in this way, It seems reasonable to expect the lower limit obtained in this fashion would be associated with a werdegree of confi- dence than the 95-percent confidence of the ranges. A one- aided limit would be more appropriate for the results of the performance test since the final prediction Is to be in the form: "The reliability of the ordnance design is at least as great as . . .'. Table 2.4 gives this one-sided g+percent confidence limit as 74.13 percent when all ten trials are fires. Using this value the final prediction becomea: 'The reliability of the Item Is at least 99.85 percent with Comp B and 99.96 percent with H-6. The complete VARICOMP process, going from calibration and performance test data to the final reliability estimate Is shown as a composite graph in Figure 13.4s.
The estimate of the lower limit of the weapon relia- made on the basis of a chain of independent conservative
estimates:
121
NAVWEPS REPORT 741 I
DE;? NCo’Ep”B” IVE
B) H6
VARICOMP EXPLOSIVE TNT
0 30,o 200 100
BARRIER (MILS)
FIGURE 13.4 A PEIRFORMANCE TEST AND RELIABILITY ESTIMATE
122
NAVWEPS REPORT
99.9
99
95
F i5 E w LB0 W
z
2
E
50
20
5
6
/ /
22 I25
/
/
/
I/ ,
/
3 300 200 100
BARRIER (MILS)
FIGURE 13.4 B CALIBRATION TESTS, PERFORMANCE TESTS,AND ESTIMATE OF RELIABILITY
123
NavWeps Report 7411
Warhead explosive calibration--two separate 95-percent confidence estimates. TNT (VARICOMP explosive)--two separate 95-percent confidence estimates.
Performance test-- one separate 95-percent confidence estimate.1
Performance test configuration (Judged to be more difficult~to Initiate than the warhead system)--one separate ;z -percent confidence estimate.
The computation of~the combined confidences is much less accesd slble In the present instance than as indicated in Paragraph 10.5. However, it is difkicult to believe that the above circumstances can lead to anything but a highly conservative estimate--probably much higher than 95-percent confidence.
13.6 A higher reliability is Indicated for H-6 than for Comp Ben though, comparison of the 50-percent points shows Comp B to be the more sensitive. The result is brought about by the apparent difference in the variability of the two explosives. An element of conservatism not pointed out In the previous discussion is the use of a linear scale for the barrier thickness as the measure of stimulus intensity. As has been mentioned in Paragraph 5.14, there is considerable evidence that the logarithm of the barrier thickness would fit the facts better than the linear scale. The effect of making the change from a linear to a logarithmic scale would be to accentuate the difference between the TNT and the design explosives. Thus, the final predictions would be much higher. They would, in fact, be greate!r than 99.99999 percent for either H-6 or Comp B as shown in Figure 13.6 which can be compared directly with Figure 13,4A,~ It is also worth noting that the design reliability would be high even if two of the ten trials in the performance test hbd been non-fires. In this case,, the lower 95-percent confidehce limit, given in Table 2.4, is 49.32 percent for TNT. kI'he corresponding lower limits of design reliability are gg~.8 percent for Comp B and 99.92 percent for H-6. The linear slcale -was used for the stimulus in this case.
124
NAVWEPS REPORT 7411
2v 25
r
‘i 1 I
, * ‘9 IO
I
I I
I
/
J I too 100
BARRIER (MILSI
J,$ND V OFF SCALE ’ / IO /
/ I
/ /
/ I
/ /
/ 1
T
FIGURE 13.6 CAL1 BRATION TESTS, PERFORMANCE TESTS, AND ESTIMATE OFRELIABILITY BASEDON LOGdRlTHMlC DOSAGE-
TO-STIMULUS TRANSFORM. 125
L.

NavWeps Report 7411
APPENDIX A
PROCEDURE FOR PREPARING A loo-POUND 'BATCH OF DESENSITIZED RDX
A.1 Let X be the numerical value of the desired percentage of RDmn the final product.
A.2 Prepareian RDX-water slurry by adding X pounds of RDX (m-R-398 Type B, Class A) to 10X pounds of distilled water at 70 to 80, Centigrade.
A.3 Prepare'a sodium stearate solution by dlsolving lOO-rpounds of'sodium stearate (Technical Grade) In 1300-13X) poundsof distilled water at 70 to 80" Centigrade.
A.4 Prepare:a calcium chloride solution by dissolving 75-Om pounds of calcium chloride (O-C-104 Class 1) in 1500-15X pounds of d.isti-lled water at 70 to boo Centigrade.
!Q Add the sodium stearate solution to the RDX slurry with rapid stirring.
A.6 With rapid stirring, add the calcium chloride to the Rmsodium stearate mixture (addition should take from 15 to 30 minutes),
A.7 Filter and wash with distilled water until the efflux wash water is free of chloride ion. This can be detected by testing the wash water with a silver nitrate solution.
A.8 Dry the filtered on tr= over steam coils.
and washed.product at 70" Centigrade
126
4

NavWeps Report 7411
APPENDIX B
ANALYTIC PROCEDURE FOR RDX/CALCIUM STEARATE MIXES
B,1 Procedure
B.l.l Sample size should be set to yield approxi- mately 0.3 gram of calcium stearate after the extraction of the RDX. From the standpoint of safety an upper limit of 3- to 5-gram sample size is recommended.
B.1.2 Standard dry powder sampling and sample blending procedures should be employed.
B.1.3 Medium porosity sintered glass should be thoroughly washed, soaked in boiling acetone, dried and tared.
B.1.4 Sample should be weighed in the tared sintered glass crucible.
8.1.5 The weight loss by volatiles should be deter- mined by weighing the sample and crucible after vacuum drying for one hour at 70' Centigrade and 50-millimeters Hg absolute pressure.
B.1.6 The RDX should be extracted by 8 washings of 20 milliliters each of boiling acetone. During each washing the sample should be triturated continu- ously with a tared glass stirring rod, in order to break all lumps.
B.1.7 The calcium stearate residue, crucible, and stirring rod should be vacuum dried for one hour at 700 Centigrade and 50-millimeters Hg absolute pressure.
B.1,8 The residue and glassware should be weighed after being allowed to cool for 30 minutes in a desiccator. The weight loss from the acetone extraction is taken as the amount of RDX and the weight of the residue as calcium stearate.
127

NavWeps
B,2 Precautionary Notes
Report 7411
B.2.1 Particularly above about 8 percent of calcium stearate the analysis becomes rather difficult and subject to gross error due to poor analytic technique. The error seems to be due to incomplete RDX extraction which apparently is due to the tendency of the calcium stearate to form a protective coating on the surface of the RDX phrticles. The obvious approach of increasing the amount of washing with hot acetone is not considered advisable beoause of the increased chance of loss of calcium stearate.
B.2.2 Particularly when there seems to be an unacceptably~high volatile content, (above 0.2 percent shouId be viewed with suspicion) there may have not been adequate washing of the mix during its manufacture. In such case& the presence of calcium chloride should be suspected~since such a material would lead to hygroscopicity of the mix.
B.2;3 At the present time a specific procedure has not been developed for the quantitative determination of the chloride ion. A number of approaches seem promising, Perhaps the best one is to perform a replicate analysis as above except for the inclusion of an extra step between steps B.l.5 and B.1.6 which would include a water wash followed by a vacuum drying and reweighing of the residue and a q-uantitative precipitation of chloride ion from the filtrate.
128

NavWeps Report 7411
APPENDIX C
STANDARD DETONATION SENSITIVITY TESTS
C.1 As a matter of convenience to the reader, three of the szdard sensitivity tests will be described to facilitate an understanding and comparison of test conditions.
c.2 The Small Scale Gap Test.
C.2.1 This test (15) is an arbitrary configuration mudy the transfer of detonation between small- diameter charges loaded into heavy-walled containers. The initiating shock (derived from a standardized RDX-loaded donor) is varied by changing the thickness of lucite interposed between the donor and acceptor. The acceptor charges are 1.5 inches long and 0.2 inch in diameter, loaded into l.O-inch diameter brass cylinders. Usually the explosive is in powder form and pressed into the acceptor at a pressure which will give a desired charge density. The firing is normally done at room temperature, but has been carried out at temperatures ranging from -60" Centi- grade to i-120* centigrade.* The general arrangement and individual component configuration for the small scale gap test are shown in Figures C.2,lA and C.2.1B. The data are reported in units of DBg (Gap Decibang) which is taken as the proper dosage-to- stimulus transform. The DBg is computed by:
E reference gap In mila DBg = 10 log observed gap in mils \
and with a reference gap of 1.00 inch,
DBg = 30 - 10 log[observed gap in mlls\#
*The elevated temperatures were achieved by individual heating of each acceptor by means of a disposable nichrome wire heating jacket fashioned onto the acceptor body.
129
NAVWEPS REPORT 74 I I
MK 70 MOD 0 DETONATOR I INCHES DETONATOR ADAPTER
/- ’ 0’ 0-,r , , C /’ ’ 0# m I , 0 ,I ’ ,c’ ’ ,’ , M/M ACCEPTOR EXPLOSIVE
STEEL DENT BLOCK
FIGURE C.2.1 A SMALL SCALE GAP TEST
130

REM
OVAB
LE
SAFE
TY
SHUN
T \
-ZIP
e CO
RD L
EADS
br
-YK
70
DETO
NATO
R
We
DETO
NATO
R HO
LDER
INO
R
1 r.
.+-,
ATTE
NUAT
OR
g L-
1 AC
CEPT
OR
DETO
NATO
R HO
LDER
MK
70
DETO
fQAT
OR
DETO
NATO
R RE
CESS
LU
CITE
AT
TEM
UATO
A
\
t DO
NOR
ASSE
MBL
ED
VIEW
FIG
UR
E C
.2.1
El S
MAL
L SC
ALE
GAP
TES
T SE
TUP
NavWeps Report 7411
C.2.2 The ismall scale gap test is most closely related to ~detonator-to-lead situations. Because the charges are bare-ended, and because the attenu- ation Is achieved by a condensed medium rather than by an air gap, the input slgnal applied to the acceptor is almost pure detonation shock. In explosive trains the inert materials enclosing, or immediately surrounding, the donor charge often enter lnto,the initiation process by being a source of high spqed fragments. This difference may be very impor ant particularly in safety considerations
i when fragm nts might occasionally cause initiation over unexpdctedly large air gaps.
C.2.3 The 'small scale gap test Is not well suited to explosive Soading by casting or by molding at elevated temperatures. Although TNT and TNT bearing compositions have been cast into the acceptor bodies, there Is strong reason to suspect that the crystal growth and arrangement would be grossly different from larger diameter cast charges. Cylinders of pre-cast or pre- molded material slipped into the acceptor are dubious representations of a realistic system since some air gap is to be expected between the cylindrical surfaces of the explosive pellet and the acceptor body wall. Such gaps, even if only a ml1 or so, would be expected to have significant effects on the way the explosive would accept and sustain detonation and mlght,therefore, give data representative of uncontrolled experimental conditions. As a stop-gap measure It might be possible to fill the airspace by coating the pellets with a grease which would be much closer to explosive hydro- dynamically than an air filled void.
C.3 NOL Booster Sensitivity Test.
C.3.1 This test (Figure C.3.1) has been in use for ZlGiE 15 years. The acceptor charge size was selected to be large enough to suppress effects due to failure dlameter and to build up to detonation. The wax spa#cer was cast in the 1 5/8-inch diameter and machined to length. The spacer lengths were normally made In 0.05-inch steps, and where possible in one piece for each test rather than stacked up to the desired length.
e
132

NAVWEPS REPORT 741 I
NO.8 BLASTING CAP
I I-
BOOSTER - 100 GRAMS 1.625”DIA X 2” HIGH (2 TETRYL PELLETS)
WAX SPACER
TESTCHARGE I .625” X 5”
/
STEEL TEST PLATE
FIGURE C.3.1 NOL BOOSTER SENSITIVITY TEST
133

NavWeps Report 7'411
C.3.2 This test is suitable for those explosives m when cast, pressed or molded will form a charge which will have sufficient mechanical strength to support itself and the initiator-booster-attenuator assembly above it. The test has been run in a modi- fied form to test liquid assemblies. The test arrange- ment is Inverted with the test explosive being poured into a, wax-coated and wax-sealed cardboard tube which rests on the wax gap attenuators and which In turn supports the steel witness plate. Presumably powders or fragile pressed pellets might be tested In similar fashlonl
C.4 Propellant Sensitivity Teet. test isdescribed in reference 20.
The propellant sensitivity e experimental set-up is
shown in Figure C.4.1. It Is quite similar to the NOL booster sensitivity test described in reference 18 and in Appendix C.3, The wax spacer is replaced by a suitable number of cellulose acetate cards 0.010 inch thick. The acceptor propellant or explosive is confined in a steel tube rather than being uncon- fined as In the booster sensitivity test. The donor consists of two tetryl pellets 1.0 inch thick with a diameter of 2.0 inches pressed to a density of 1.63 gm/cc. The weight of each pellet would be about 84 grams. Although used prlnclpally to determine the sensitivities of propellants it has also been used to some extent to measure the sensitivities of high explosives.
134
NAVWEPS REPORT 741 I
(ACCEPTOR)
I
PROPELLANT CHARGE r\\‘l
COLD-ROLLED STEEL TUBE
CARD GAP-,
TETRYL PELLETS<
DETONATOR
?
t
A
5.5”
I
FIGURE C.4.1 NOL PROPELLANT SENSITIVITY TEST
135

NavWeps Report 7411
APPENDIX D
MONTE FARLO EXPERIMENT TO ASSESS ERRORS DUE TP UNEQUAL SPACING OF EXPLOSIVES
D.1 It was amssumed that there was a series of explosives whose-%-percent p,oints differed from equal spacing by amounts which were randomly distributed according to the normal law. A table of random 'numbers was used to determine a group of such difference -amounts chosen from a population having a mean of zero and a known standard deviation. These errors were then added to the intenlded 50-percent values for a set of VARICOMP explosives to give1 a set of true 50-percent values. The results which coula be expected, if these explosives were used for the steps of a; Bruceton test, were then computed, The difference between~ the mean thus obtained and that which would be expected,had thb steps been equally spaced, was noted. This was done ten times for each of four different combinations of step size and standard deviation of the random difference- amounts. The standard deviation of these difference-amounts was assigned values from one-twentieth to one-fifth of the distance between steps, For each of the four groups the standard deviation of the shift in the mean of the test caused by the irregular spacing was computed. The smallest of these was one-fifteenth and the largest slightly more than one-tenth of a step. Although not enough work was done to be able to make a very definite statement it would seem that the effect of this type of error would be small if the standard deviation of the difference-amounts of the 50-percent points of the VARICOMP explosives was less than one-tenth of the difference between two consecutive explosives. llowever, it would be appreciable if thi's standard deviation became as large as one-fifth of the step size. A more extended investigation would make it possible to make a more definite statement of the magnitude of this effect.
136
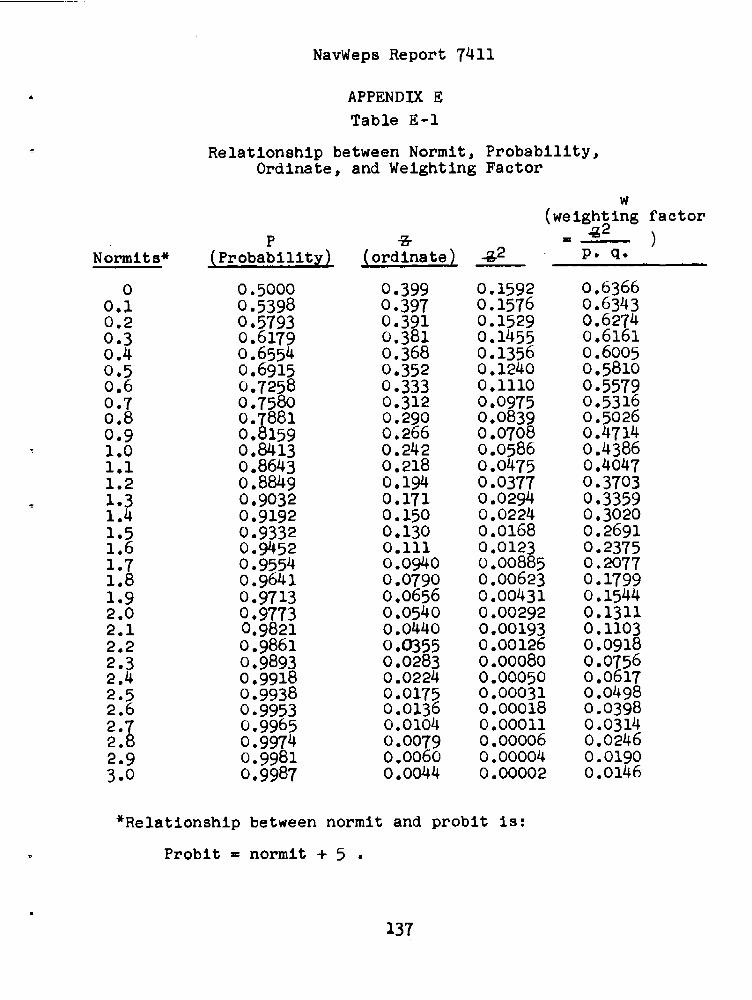
.
Normits*
2," o:a
?09 1:1 1.2
3 1:5 1.6 1.7 1.8 1.9 2.0 2.1
NavWeps Report 7411
APPENDIX E Table E-l
Relationship between Normlt, Probability, Ordinate, and Weighting Factor
P 3k (Probability) (ordinate)
0.5000
:m;:;: ok179 0.6554 0.6915 0.7258 0.7580
:%~; oh13 0.8643 0.8849 0.9032 0.9192
:*E: 0:9554 0.9641
c;;,‘; 69821 0.9861 0.9893 :*g;: 0:9953 0.9965 0 0 9974 om81 0.9987
0.399 0.397 0.391 0.381 0.368 0.352 0.333 0.312 0.290 0,266 :*2241zi 0:194 0.171 0.150 0.130 0.111 0.0940 0.0790 0.0656 0.0540 0.0440 :*3; 0:0224 0.0175
(wIlg$lU,g factor 1
42 p. g. '
0.1592 0.1576 0.1529
:*;;;z 0:1240 0.1110 0 00975 o l 839 0.0708 0.0586 0.0475
:=::z 0:0224 0.0168 0.0123 0.00885 0.00623 0.00431 0.00292 0.00193 0.00126 o.00080 0.00050 0.00031 0.00018 0.00011 o.00006 0.00004 0.00002
:*z;t; 0:6274 0.6161 0.6005 0.5810 :*;;2 015026 0.4714 x2:,” 0:3703 0.3359 0.3020 0.2691 0.2375 0.2077 0 l 1799
0.1544
0.1311 0.1103 o .og18
:*:ig o:o4g8 o .o3g8 0.0314 0.0246
: l iE l
"Relationship between normlt and problt Is:
Problt = normlt + 5 .
137

NavWeps Report 7411
Table E-2
Cumulative ' Studentls'l Distribution
7
F n 0.75 0.90 0*95 0 &!9 1 2 3 4
2 7 8
1: 11 12
2 15 16 1 1 ;: 19 20 21
:o 24
$2 2 2 I3
1.000 0.816
:*g: 0:727 0.718 0.711 0.706 0.703 0.700 0.697 y@& 0:6g2 0 .~6gl 0.690 0 .'68g 0.688 01688 0.687 0.686
1.372 1.363 1.356 1.350 ?FZ . 1.337 1.333 I.330 1.328 1.325 1,323 1.321
1.313 1.311 1.310 1.303 1.296
?% l
6.314 2.920 2.353 2.132 2.015
3;; L860 1.833 1.812
?38Z .
1.725 1.721 1.717 1.714 1.711 1.708 1.706 1.703 1.701
z;; 1:684 1.671 ;*245; .
2.583 2.567 2.552 2.539 2.528 2.518 2.508 2.500 2.492 2.485
z;; 21467 2.462
2~~; 2:390 2.358 2.326
138
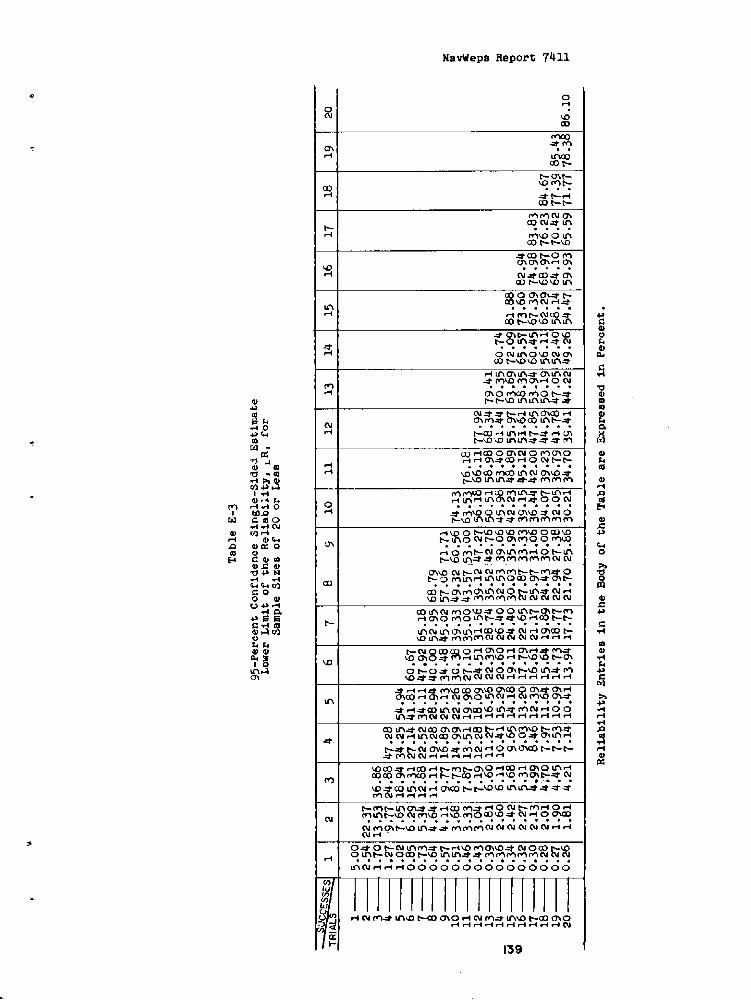
Tabl
e E-
3
g5-P
erce
nt
Con
fiden
ce
Sing
le-S
ided
Es
timat
e Lo
wer
Li
mit
of th
e Re
liabil
ity,
LR,
for
Sam
ple
Size
s of
20
or
Lea8
2 3
22.3
7 13
.53
36.8
6
2.42
5.
6E
41
5 6
7 8
g 10
11
12
13
14
15
16
17
18
19
20
47.2
8 34
.25
54.9
4 27
.14
41.8
1 22
.52
34.1
1 lg
.28
28.9
4 16
.89
25.1
3 14
.99
22.2
6 13
.51
lg.9
8 ;;.
2$
;pg
. *
39.3
3 49
.32
35.0
0 43
.57
31.5
6 39
.12
22.6
5 27
.87
21.1
7 25
.97
lg.8
9 24
.43
18.7
7 22
.94
17.7
3 21
.70
76.1
8
80.7
4
56.1
1 62
.29
68.9
7 52
.40
58.1
4 64
.lC
49.2
6 54
.47
59.9
3
34.6
7 77
.35
71.7
7 36
.10
Rel
iabi
lity
Entrl
ee
In
the
Body
of
th
e Ta
ble
are
Expr
esse
d in
Pe
rcen
t.

NavWeps Report 7411
REFERENCES
1. H. E. Lacey, D. W. Sencenbaugh, "A Natural Approach to the Calculation of Systems Reliability", NavOrd Report 5660, 31 October 1957
2. "A Study of Methods for Achieving Reliability of Guided Missiles", NAMTC Technical Report No. 75, 10 July 1950, Restricted
3. D. E. Allmand, J. H. Armstrong, R. H. Blair, E. W. Blevlns, A. H. Corbin, and M. B. Rowan, Analysis++,
"Relative Accident Reliability NavOrd Report 4135, 1 November 1955, Confidential
4. H. P. Culling, "Statistical Methods for Evaluation of Fuze Explosive Trafn Safety and Reliability', NavOrd Report 2101, 13 October 1953 (U. S. Department of Commerce, OTS, PB 122070)
5. L. D. Hampton, W. M. Slie, and R. H, Stresau, "Direct Initiation of Boosters by Electric Initiators", NavOrd Report 2815, 13 March 1953, Confidential
6. L. D. Hampton, "Comparative Sensitivity of Tetryl and of RDX/Wax Mixtures as Booster Explosives , NavOrd Report 3551, 14 October 1953, Confidential
7. W. J. Dixon, F. J. Massey, Jr., 'Introduction to Statistical Analysis++, McGraw-Hill Book Company, Inc., New York, N. Y.
8. R. H. Streaau,, Jr,,,L, E. Starr, Jr., 'Some Studies of the Propagation of Detonation Between Small Confined Explosive Charges++, NOLM 10577, 15 July 1950, Confidential
9. R. H. Stresau,, L. D. Hampton, and L. E. Starr, 'Boosterlng Requirements of Mines", NavOrd Report 4277, 7 August 1956 Confidential
10. R. L. Graumann, A. E. Robertson, "The Effect of Air Gaps on the Initiation of a Lead by a Detonator?, NOLM 9707 25 June 1956, Confldentlal
11. L. D. Hampton, 'Sensitivity and Pelleting Characteristics of Certain Desensltlzed RDX Mixtures", NavOrd Report 4320, 25.June 1956, Confidential
12. F. P. Bowden, et.al., Proceeding of the Royal Society, A 246, 146-247, 1958
140

NavWeps Report 7411
.
REFERENCES
13. "Proceeding of the Gilbert B. L. Smith Memorial Conference on EXplOBiVe Sensitivity", Edited by R. McGill and P. L. Holt, NavOrd Report 5746, 2 June 1958, Confidential
14. Third Detonation Symposium on Detonation, James Forrestal Research Center, Princeton University, 26-28 September 1960, Office of Naval Research Symposium Report ARC-52, Volumes 1 and 2, Unclassified, and Volume 3, Confidential
15. J. N. Ayres, "Standardization of the Small Scale Gap Test", NavWeps Report 7342, 16 January 1961
16. E, H. Eyster, R. F. Davis, 'Sensltlvlty Studies with the Drop-Weight Impact Machine", OSRD 5744,,,19 November 1945, Confidential, Booster Sensitivity Test , OSRD 5746, Confidential
17. E. H. Eyater, L. C. Smith, "Studies of the ERL Type 12 Drop Weight Impact Machine at NOL", NOLM 10,003, 25 January 1949, Confidential
10. E. H. Eyster, L. C. Smith, and S. R. Walton, "The Sensi- tivity of Hlgh Explosives to Pure Shocks", NOLM 10,336, 14 July 1949, Confidential
19. J. H. Majowlcz, S. J. Jacobs, 'Initiation to Detonation of High Explosives by Pure Shocks", NavOrd Report 5710, 1 March 1958, Confldentlal
20. A. B. Amster, R. L. Beauregarde, G. J. Bryan, an1 E. K, Lawrence, "Detonability of Solid Propellants; I. Test Methods and Instrumentation', NavOrd Report 5788, 3 February 1958
21. H. Dean Mallory, 'The Development of Impact Sensitivity Tests at the Explosives Research Laboratory, Bruceton Pennsylvania, During the Years 1941-1945", NavOrd Report 4236, 16 March 1956, Confidential
22. Statistical Research Group, Princeton University, 'Statls- tlcal Analysis for a New Procedure In Sensitivity Experl- ments", AMP Report lOl.lR, SRG-P No. 40, (OSRD Report 4040) July 1944
23. D. J. Flnney, "Problt Analysis, A Statistical Treatment of the Slgmold Response Curve , Cambridge at the University Press, 1952.
141

24.
25.
26.
27.
20.
29.
30.
31.
32.
33.
34.
35.
NavWeps Report 7411
REFERENCES
J. Savltt, "Some Observations on the Growth of Detonations', NavOrd Report 3753, 25 August 1954, Confidential
J. Berkson, “A Statistically Precise and Relatively Simple Method of Estimating the Blo-Assay with Quanta1 Response, Based on the Logistic IXntrlbutlon Function', Journal of the American Statistical Association, 48, 565-599, September 1953
R. A. Fisher, F. Yates, "Statistical Tables for Blologlcal, Agricultural, and Medical Research", Introduction, Oliver and Boyd, Edinburgh, 1938
M. S. Bartlett, "The Use of Transformations", Biometrics, Volume 3, No. 1, 22 - 38, March 1947
W. M. Slle, R. H. F. Stresau, "Small Scale Dent Tests for Confined Charges", NavOrd Report 2422, 23 April 1952, Confidential:
W. J. Dixon, 'A. M. Mood, "A Method for Obtaining and Analyzing Sensitivity Data", Journal of the American Statistical Association, 43, 109 - 126, March 1948
T. W. Anderson, P. J. McCarthy, and J. W. Tuksy, "Stair- case' pethod of Sensitivity Testing", NavOrd Report 65-46,. 21 March 1946
M. S. Bartlett, Probabllltles",
"A Modified Problt Technique for Small Supplement,Journal Royal Statistical
Society, Volume VIII, No. 1, p 113, 1946
J. Savltt, 'The Propagation of Detonation In Some Special Explosive Systems", NavOrd Report 2844, 13 April 1953, Confidential
L. D. Hampton, "The Effects of Gate Size on the Rellablllty of a Leadless Fuze", NavOrd Report 3628, 29 January 1954, Confidential
J. N. Ayres, "The Effect of Composition and Density on the Sensitivity and the Output of DATB and DATB/Zytel 95/5 (U)", NavWeps Report 7348, 15 January 1961, Confidential
M. J. Kamlet, Variation of Heat of Detonation with Oxidant Balance for Structurally Related Compounds', NavOrd Report 6117, 21 September 1958, Confidential
142

NavWepa Report 7411
.
REFERENCES
36. M. J. Kamlet, "A Correlation of Impact Sensitivities of Explosives with Oxidant Balances", NavOrd Report 6126, 26 September 1958, Confidential
37. 3. Berkaon, "Estimate of the Integrated Normal Curve by Minimum Normit Chl-Square with Particular Reference to Blo-Asaay", Journal of the American Statistical Association, 50, 529-549, 1955
38. 'Explosion Effects Data Sheets", NavOrd Report 2986, 14 June 1955, Confidential
39. George Svcdcba, "Sensitivity of Explosives to Impact, Period 1 May 1952 through 1 July 1953", NavOrd Report 2940, 1 July 1953, Confidential
40. George Svedeba and Sarah Duck, "Sensltlvlty of Explosives to Impact, Period 1 July 1953 through 1 November 1954", NavOrd Report 3955, 27 November 1955, Confidential
. 41. R. A. Clalrmont, Jr., I. Jaffc, D. Price, and G. Roberson,
"Large Scale Qap Test: Propellants",
Interpretation of Results for NavWeps Report 7401, 15 March 1961,
Confidential
42. R. M. McClung, "First Aid for Pet Projects Injured in the Laboratory or on the Range, or What to Do Until the Statla- tician Comes", NCTS Technical Memo 1113, 29 January 1952
143

NavWeps Report 7411
l
DISTRIBUTION LIST
Chief, Bureau of Naval Weapons Department of Navy Washington 25, D. C.
DIS-32 RRRE-8 RUNE-3 RUME-32 RMMO-2 RMMO-5 RREN-312
Director Special Projects Office Department of Navy Washington 25, D. C.
~~-27 Code 20
Chief Bureau of Ships Department of Navy Washington 25, D. C,
Chief Bureau of Yards and Docks Department of Navy Washington 25, D. C.
Chief of Naval Research Department of Navy Washington 25, D. C.
Chemistry Branch
Commander Operational Development Force U. S. Atlantic Fleet U. S, Naval Base Norfolk 11, Virginia
Commander U, S. Naval Ordnance Test Station China Lake, Callf ornia
Code 556 Code 4572 Technical Library B. A. Breslow J. Sherman
Copies
1 1
2
2
2

NavWeps Report 7411
Copies ' Director Naval Research Laboratory Washington 25, D. C.
Technical Information Section
Commander Naval Air Development Center Johnavllle, Pennsylvania
Aviation Armament Laboratory
Commander U, S. Naval Weapons Laboratory Dahlgren, Virginia
Technical Library 3. Payne L. Pruett P, Altman J. Gray Weapons Department Terminal Ballistics Department
Commander U, S. Navy Electrbnics Laboratory San Diego, California
Commandant U. S. Marine Corps Washington 25, D. C.
Commanding Officer U. S. Naval Weapons Station Yorktown, Virginia
R & D Division
Commanding Officer U. S, Naval Ordnapce Laboratory Corona, California
Commanding Officer U. S. Naval Propellant Plant Indian Head, Maryland
Technical Library EODTC
Commander Naval Radiological Defense Laboratory San Francisco, California
R. Schnlder
a
2
1
2
5
1 1
1
NavWepe Report 7411
Copies Commander Pacific Missile Range Point Mu&u, California
Superintendent Naval Post Graduate School Monterey, California
Commanding Officer Naval Armnunltion Depot Crane, Indiana
Commanding Officer U. S. Naval Ordnance Plant Macon, Georgia
Commanding Officer U. S. Naval Ammunition Depot McAlester, Oklahoma
R. E. Halpern
Commanding Officer U. S. Naval Ammunition Depot Walpele Branch Oahu, Hawaii
Special Projects Officer Quality Evaluation Laboratory
Commanding Officer U. S. Naval Ammunition Depot Navy Number Six Six (66) c/o Fleet Post Office San Francisco, California
Commanding Officer U. S. Naval Ammunition Depot Bangor, Maine
Quality Evaluation Laboratory
Commanding Officer U. S. Naval Amnmnltion Depot Concord, California
Quality Evaluation Laboratory
Commanding Officer U. S. Naval Underwater Ordnance Station Newport, Rhode Island
1
1
1
NavWeps Report 7411
Commanding Officer Naval Torpedo Station Keyport, Washington
Commanding Officer U. S. Naval Weapons Evaluation Paclllty Kirtland Air For& Base Albuquerque, New Mexico
Office of Chief of Ordnance Department of Army Washington 25, D.,C.
ORDGU ORDTB ORDTN
Office of Chief of Engineers Department of Army Washington 25, D. C.
ENGNB ENGEB
Commanding General Picatinny Arsenal Dover, New Jersey
ORDBB-TH8, Technical Information ORDBB-TJl, H.E. Section ORDBB-TK3, Prop. and_Expl. Unit ORDBB-TMl, Chem. Res. Section ORDBB-TPl, Proj. Fuze Section ORDBB-TP2, GM, Rocket and Bomb Fuze ORDBB-TP3, Init. and Spec Dev. ORDBB-TR2, Phys. Res, Section ORDBB-TSl, Pyrotech. Lab.
Commanding Officer Diamond Ordnance Fuze Laboratory Connecticut Avenue & Van Ness St., N. W. Washington 25, D. C,
Ordnance Development Laboratory M, Lipnick (Code 005)
Commanding Officer Office of Ordnance Research Box CM Duke Stat,ion Durham, North Carolina
Copies
1
1
1 1
1

.
.'
Commanding Officer Rock Island Arsenal Rock Island, Illinois
NavWeps Report 7411
Copies
1
Commanding Officer Chemical Corps Chemical & Radiological Laboratory Army Chemical Center Maryland
Commandlng Officer Engineer Research & Development Laboratory U, S. Army Ft. Belvolr, Virginia
Technical Intelligence Branch
Commanding Officer Fort Dletrlck Maryland
Commanding General U, S. Army Ordnance Ammunition Center Jollet, Illinois
Commanding General U. S. Army Proving Ground Aberdeen, Maryland
BRL
Commanding General Frankford Arsenal Philadelphia 37, Pennsylvania
s. Plcoll
Commanding Officer Holston Ordnance Works Kingsport, Tennessee
Commanding General Redstone Arsenal Huntsville, Alabama
Teahnical Library
Commander Army Rocket & Guided Missile Agency Redstone Arsenal, Alabama
ORDXR-RH
1
1
1
Y

NavWeps Report 7411
Commander Ordnance Corps Lake City Arsenal Independence, Missouri
Industrial Engineering, Division
Commanding General White Sands Proving Ground White Sands, New Mexico
Chief of Staff ~ U. S, Air Force Washington 25, D. C.
AFORD-AR
Wright Air Developpnt Division Wright-Patterson Air Force Base Ohio
WWAD
Headquarters Air Proving Ground Center U. S. Air Force, ARDC Eglin Air Force Base, Florida
Attn: PQTRI, Technical Library
Commander Air Research & Development Command Andrews Air Force Base Washington 25, D. F.
Commander Rome Air Development Center Griffis Air Force Base Rome, New York
Commander Holloman Air Development Center Alamagordo, New Mexico
Commanding Officer Air Force Missile Test Center Patrick Air Force pase Florida
Copies
1

NavWeps Report 7411
Commander Air Force Cambridge Research Center L. G, Hanscom Field Bedford, Massachusetts
Commander Hill Air Force Base Utah
OOAMA
Hanscom Air Force Base Massachusetts
AFCCDD CCSEI-1 Capt. Long
Armed Services Technical Information Agency Arlington Hall Station Arlington, Virginia
TIPDR
Office of Technical Services Department of Commerce Washington 25, D. C.
Atomic Energy Commission Washington 25, D. C.
DMA
Chief Defense Atomic Support Agency Washington 25, D. C.
Director U. S. Bureau of Mines Division of Explosive Technology 4800 Forbes Street Pittsburgh 13, Pennsylvania
Copies
1
1
10
100
1
1
Director USAF Project RAND (Via USAF Liaison Office) The Rand Corporation 1700 Main Street Santa Monica, California

NavWeps Report 7411
Lawrence Radiation Laboratory University of Cali:fornla - P. 0. Box 808 Livermore, California
Technical Information Division
Director Los Alamos Scientific Laboratory P. 0. BOX 1663 Los Alamos, New Mexico.
National Aeronautics and Space Administration Headquarters 1520 H Street, N. W. Washington 25, D. C.
National Aeronautics and Space Administration Goddard Space Flight Center Greenbelt, Maryland
Lewis Research Center, N.A.S.A. 21,000 Brookpark Road Cleveland 35, Ohiq
Library ~ .
Director Applied Physics Laboratory Johns Hopkins University 8621 Georgia Avenue Silver Spring, Maryland
Solid Propellants Agency
Sandla Corporation P. 0. Box 5400 Albuquerque, New Mexico
Sandia Corporation P. 0. Box g6g I Llvermore, California
Director Waterways Experiment Station Vicksburg, Tennessee
American Potash and Chemical Corporation National Northern Division P. 0. Box 175 West Hanover, Massachusetts
Mr. J. A. Smith, Security Officer
Copies
1
1
2
1
f
1
1

NavWeps Report 7411
l Copies Armour Research Foundation Technology Center Illinois Institute of Technology 10 West 35th Street Chicago 16, Illinois
Alleghany Ballistics Laboratory Cumberland, Maryland
Arthur D. Little, Inc. 30 Memorial Drive Cambridge 42, Massachusetts
Dr. G. R. Handrick Reports Library, V. Vabri
Aerojet-General Corporation Ordnance Division Downey, California
Dr. Louis Zernow
Bermlte Powder Company Saugus, California
Denver Research Institute University of Denver Denver 10, Colorado
E. I. duPont deNemours Eastern Laboratories Explosives Department Gibbstown, New Jersey
Dr. L. Coursen
The Franklin Institute 20th Street & Benjamin Franklin Parkway Philadelphia 3, Pennsylvania
Project TAl-2707 AA (Mr. Gunther Cohn)
Hercules Powder Company Experiment Station Wilmington, Delaware
5. Roth Dr. Lawrence
1
1
1 1
1
1
1
1
1
1
1

NavWeps Report 7411
Hercules Powder Company Port Ewen, New York
C. Wood G. Scherer
Librascope-Sunnyvale 670 Arques Avenue Sunnyvale, California
Lockheed Aircraft Corporation P. 0. Box 504 Sunnyvale, California
Stanford Research Institute Poulter Laboratories Menlo Park, California
University of Utah Salt Lake City, Utah
Dr. Melvin Cook, Explosive Research Group
Universal Match Corporation Marion, Illinois
Western Cartridge, Company Division of Olin Industries East Alton, Illinois
Bulova Research and Development Inc. 52-10 Woodside Avenue Woodside 77, New York
Copies
1 1
1
1
1
1
1
1
1
General Electric Company Missile and Ordnance Systems Department 2198 Chestnut Street Philadelphia, Pennsylvania
T, W. Kennedy
Elgin National Watch Company Mlcronlcs Division 21001 Nordhoff Chatsworth, California
Hamilton Watch Company Allled Products Division Lancaster, Pennsylvania

NavWeps Report 7411
The Martin Company 815 Elwell Street Orlando, Florida
McDonnell Aircraft Corporation P. 0. Box 516 St. Louis, Missouri
U, S. Flare Division Wtlantlc Research Corporation 19701 W, (Poodvale Road Saugus, California
Daystrom Electric Corporation 229-A Manchester Road Poughkeepsle, New York
Copies
1
1
1
1
I ,I
. ‘I
1 I
Nav
al
Ord
nano
e La
bora
tory
, W
ife
Oak
, M
d.
(Kw
!#EP
S re
port
7411
) VA
FUW
,AM
THO
DFa
D
EmD
ET&
N&!
!!IO
lWU
NSF
E R
PR
OBB
BILZ
NS
(U),
by J
.N.
Ayre
s an
d ot
hers
. 30
J
e 19
61.
143~
. Pr
ojeo
t IK
1~~3
Eo12
/212
l~
&08h
OW
.
VAFU
XXP
is
a m
etho
d fo
r de
term
inim
? th
e de
tona
tion-
trans
fer
mbs
bilit
ies
of-&
&
- pl
osirr
, tra
in
by
subs
titut
ion
of
expl
osiy%
(s)
of
varie
d se
nsiti
vitie
s or
en
ergi
es
for
the
aesig
n ex
plos
ive*
Thes
e su
betit
utea
- v~
f.%iP
4XdO
SiV#
S hh
480
~eST
!dlU
38
Or
O&
put
prob
abilit
y di
strib
utio
n f&
&ion
s ha
ve
been
ca
libra
ted
rela
tioe
to
the
desig
n ex
plo-
sh
e)
are
used
to
m
easu
re
the
expl
osiw
M
w in
here
nt
in
the
desig
n sy
stsm
. M
etho
ds
of
calib
ratin
g em
ploa
ivles
an
d ca
rryin
g ou
t VA
RICW
pe
rform
moe
te
sts
are
give
n al
ong
with
st
atist
ical
proo
edur
es
for
com
bini
ng
perfo
rman
ce
test
an
d ca
libra
tion
data
.
VAR
ICC
W
is
a m
etho
d fo
r de
tem
inin
g th
e de
tona
tion-
traue
fer
prob
abilit
ies
of
au e
x-
plor
ive
train
by
su
bstit
tiion
of
%
xplo
aive
(s)
of
varie
d s8
IISiti
Viti6
8 or
8l
Wgi
88
for
ths
desi
gn
expl
osi~
. Th
ese
subs
titut
ed-
mR
mM
P-0
osiv
8s
T (w
hose
re
spon
se
or
out-
out
nrob
abil
tv
dist
ribut
ion
ftmot
ions
ha
re
b8O
dCal
ibra
tk
rela
tive
to
the
desiB
n e&
lad
rive)
ar
e us
ed
to
mea
sure
th
e e&
o&%
d&
m
inhe
rent
in
th
e d%
siSu
svst
en.
Met
hods
of
aa
libra
tlng
expl
osiG
3 a&
0a
fiJpi
ng
out
VAR
ICO
MP
with
at
at p
" fO
=fW
W9
test
8 sX
% g
i7%
u al
Ong
st
foal
pr
ooed
ures
fo
r oo
mbi
ning
pe
rfom
natm
e te
st
and
calib
ratio
n da
ta.
I-
1
-----
I ---m
---s
1.
Expl
osiv
es
- '
2.
sens
itivi
ty
Expl
osiT
es
- D
eton
atio
n I
3.
S:?
I 4.
De
tona
tion
- 1
Prob
abilit
ies
2:
VARI
CW
Title
I
Nav
al
Qrd
nam
x La
bora
tory
, W
hit8
oa
k,
kH.
(ImaP
s re
port
7411
) VA
RXX
MP.
A
MYl
!HO
D FO
R D
- D
ETo-
1.
Exp1
08i~
8 -
’
2.
sens
ititit
y -1
08iP
e8
- D
eton
atio
n I
3.
Expl
osiv
e tra
ins
4.
Det
onat
ion
- I
Prob
abilf
tiss
I':
VAR
ICO
MP
Title
I
Nav
al
C&n
ame
Labo
rato
ry,
Whi
te
Oak
, M
. (T
&W?E
PS re
port
7411
) VA
RIC0
MP,
AMW
HODF
ORD
E!E~
DET&
M
TKN
-TR
bMSF
F.R
PR
OBB
ILIT
TES
(U),
byJ,
x.
Ayre
s an
d ot
hers
. 30
J
e 19
61.
143~
. Pr
ojec
t Rm
mEo
12/2
12
1~m
s/lo
ocw.
UN
WSm
D VA
RIC
rBP
is
a m
etho
d fo
r de
tem
inin
g th
e de
tona
tion-
trans
fer
prob
sbilit
ies
of
m
m-
plos
iv%
train
by
su
bstit
utio
n of
ex
plos
ive(s
) of
va
ried
sens
itivi
ties
or
ener
gies
fo
r th
e de
sign
expl
osive
. Th
ese
subs
titut
ed-
VAIU
CoA
bp--e
xplo
sive
s (w
boae
re
spon
se
or
out-
put
prob
abilit
y di
strib
utio
n fu
nctio
ns
have
be
en
calib
rate
d re
lativ
e to
th
e de
sign
expl
o-
sive
) ar
e ua
ed
to
mea
sure
th
e ex
plos
ive
driv
s irt
here
nt
in
the
desig
n sy
stem
. M
etho
ds
of
calib
ratin
g ex
plos
fws
aud
oarry
ing
out
VBRf
CW
with
st
at
le er
fom
anoe
te
sts
are
giPs
n al
ong
rtioa
l pr
ooed
ures
fo
r ao
mbi
ning
p%
rfom
am%
te
st
and
calib
ratio
n da
ta.
1.
Expl
osiv
es -
I se
nsiti
vity
2.
Eq
losl
vea
- D
eton
atio
n 3.
Ex
plos
ive
I tra
ins
4.
Det
onat
ion
- Pr
obab
ilitie
s I
I': ZE
"" II*
&n
-es,
I
J.N.
III
. Pr
ojec
t I
Nav
al
Ord
nanc
e La
bora
tory
, W
hite
O
ak,
Ml.
(NW
WEP
S re
port
7411
)
VARI
CCW
is
a
met
hod
for
dete
rmin
ing
the
deto
natio
n-tra
nsfe
r pr
obab
ilitie
s of
au
%x-
pl
osiv
%
train
by
su
bstit
utio
n of
e+
OSh(
S)
Of
Parid
Se
lkSi
tititi
8s
Or
8n%
rgi%
6 iO
r th
e de
sign
expl
osim
3.
!Fhe
se
subs
titut
ed-
TM-4
lO
SiV9
8 (Id
i r%
S~llS
%
Or
Old-
pu
t pr
obab
&y
dist
ribut
ion
fum
tiona
ha
m
b%%
n cal
ibra
ted
rSla
tiV%
to
th
e de
8ign
%xp
lol
she)
ar
e us
ed
to
mea
mre
the
%xp
losiv
%
Mm
in
here
nt
in
the
desig
n ey
eten
. M
etho
d8
of
cdiib
ratin
g e~
plO
8im
8 an
d oa
rrJrir
@
OI&
VAR
ICC
4E
uith
st
at p
" rfo-e
ts
ats
are
gim
n al
ong
8tio
d ~O
O%
dure
a fo
r oo
mbi
ning
pe
rfom
anoe
te
at
and
oslib
ratio
n ah
-
-e 1.
2.
3.
4.
2 ti.
III.
Expl
osiv
es
- I
sens
ititit
y Eq
losl
veg
- D
eton
atfo
n I
Erpl
OSi
ve
train
s D
eton
atio
n -
I Pr
obsh
ilitfe
s VA
RXCO
MP
Title
I