NAVI MUMBAI INTERNATIONAL AIRPORT (NMIA) · GW1 Open well at Kombadbhuje GW2 A well near pond at...
24
Quarterly Monitoring Report Ground Water and Marine Water Analysis For NAVI MUMBAI INTERNATIONAL AIRPORT (NMIA) Sponsor: City and Industrial Development Corporation of Maharashtra Ltd (CIDCO) Period: July – September 2018 PREPARED BY ADITYA ENVIRONMENTAL SERVICES PVT.LTD. MOEFCC Recognized Laboratory under EP Act 1986 Accredited under ISO 9001: 2008 & OHSAS 18001: 2007 by ICQS www.aespl.co.in
Transcript of NAVI MUMBAI INTERNATIONAL AIRPORT (NMIA) · GW1 Open well at Kombadbhuje GW2 A well near pond at...

Quarterly Monitoring Report
Ground Water and Marine Water Analysis
For
NAVI MUMBAI INTERNATIONAL AIRPORT (NMIA)
Sponsor:
City and Industrial Development Corporation of Maharashtra Ltd (CIDCO)
Period:
July – September 2018
PREPARED BY
ADITYA ENVIRONMENTAL SERVICES PVT.LTD. MOEFCC Recognized Laboratory under EP Act 1986
Accredited under ISO 9001: 2008 & OHSAS 18001: 2007 by ICQS www.aespl.co.in

Quarterly Monitoring Report Navi Mumbai International Airport (NMIA)
Index
Environmental Consultant
Aditya Environmental Services Pvt. Ltd.
INDEX 1. INTRODUCTION ................................................................................................................................. 1 2. SCOPE OF MONITORING WORK ........................................................................................................ 2
2.1 Scope of Monitoring Work as per CIDCO Tender: ......................................................................... 2
2.2 Locations of Monitoring: ................................................................................................................ 2
2.3 Period/Time of Sampling (July – September 2018): ...................................................................... 4
3. METHODOLOGY ADOPTED FOR ENVIRONMENTAL MONITORING ................................................... 6 3.1 GROUND WATER SAMPLING .......................................................................................................... 6
3.1.1 Reconnaissance Survey: ............................................................................................................... 6
3.1.2 Methodology of Sampling: .......................................................................................................... 6
3.2 MARINE WATER, SEDIMENTS & PLANKTON SAMPLING EQUIPMENTS ......................................... 6
3.2.1 Reconnaissance Survey: ............................................................................................................... 6
3.2.2 Methodology of Sampling: .......................................................................................................... 7
3.2.2.1 Niskin Bottle - Marine Water Sampler .................................................................................. 7
3.2.2.2 Plankton Net - Biological Samples ......................................................................................... 7
3.2.2.3 Grab Sampler - For Marine Sediments .................................................................................. 7
3.2.2.4 Selection of Stations, Preservation and Transportation of Samples: .................................. 8
3.3 Laboratory Credentials ................................................................................................................... 8
4. COMPILATION OF DATA & INFERENCE ............................................................................................ 10 4.1 GROUND WATER QUALITY ANALYSIS REPORT ............................................................................. 10
4.4.1 GW Analysis Data ....................................................................................................................... 10
4.1.2 GW Analysis Inference: .............................................................................................................. 11
4.2 MARINE WATER QUALITY ANALYSIS REPORT .............................................................................. 12
4.2.1 Analytical Data - Physicochemical Parameters during monsoon .............................................. 13
4.2.2 Inference - Physicochemical Parameters during monsoon: ...................................................... 14
4.3.1 Analytical Data - Biological Parameters during monsoon: ........................................................ 15
4.3.2 Inferences - Biological Parameters during monsoon: ............................................................... 16
4.3.2.1 Phytoplankton ....................................................................................................................... 16
4.3.2.2 Zooplankton ............................................................................................................................ 17
4.3.2.4 Microbiology ........................................................................................................................... 17
5. CHAPTER V: CONCLUSION & RECOMMENDATION ......................................................................... 18 5.1 Ground Water: .......................................................................................................................... 18
5.1.1 Observations from Data: ........................................................................................................... 18
5.1.2 NMIA Pre - Development Activities and impacts anticipated on Ground Water Quality: ........ 18
5.1.3 Further Study Suggested: .......................................................................................................... 18
5.2 Marine Water: ........................................................................................................................... 18
5.2.1 Observations from Data: ........................................................................................................... 18
5.2.2 NMIA Pre- Development Activities and impacts anticipated on Marine Water Quality: .......... 19
5.2.3 Further Study Suggested: .......................................................................................................... 19

Quarterly Monitoring Report Navi Mumbai International Airport (NMIA)
Index
Environmental Consultant
Aditya Environmental Services Pvt. Ltd.
List of Tables
Table 2-1: Scope of Environmental Monitoring Work as per CIDCO Tender .......................................................... 2 Table 2-2: Details of Ground Water Quality Monitoring Stations as per CIDCO Tender ........................................ 3 Table 2-3: Details of Marine Water Quality Monitoring Stations as per CIDCO Tender ......................................... 3 Table 2-4: Period/Time of Sampling for this Survey ............................................................................................... 5 Table 4-1: Ground water analysis at various stations during July 2018 ............................................................... 10 Table 4-2: Marine water physicochemical analysis at various stations during July 2018 ..................................... 13 Table 4-3: Marine water biological analysis of stations (W1 to W7) during July 2018 ........................................ 15 Table 4-4: Marine water biological analysis of stations (W8 to W13) during July 2018 ....................................... 15

Quarterly Monitoring Report Navi Mumbai International Airport (NMIA)
Index
Environmental Consultant
Aditya Environmental Services
Pvt. Ltd.
List of Figures
Figure 2.1: Map of Surface Marine, Ground Water & Sediment Monitoring Stations as per CIDCO Tender ......... 4 Figure 4.1 : Representation of phytoplankton population & Total genera for July 2018 ............................... 16 Figure 4.2: Phytoplankton found in samples for July 2018 .................................................................................. 16 Figure 4.3: Graphical representations of Zooplankton Biomass, Population and total group for July 2018 ........ 17 Figure 4.4: Zooplankton found in samples for July 2018 ...................................................................................... 17

Quarterly Monitoring Report Navi Mumbai International Airport (NMIA)
(July – September 2018)
Environmental Consultant Page 1
Aditya Environmental Services Pvt. Ltd.
1. INTRODUCTION
Mumbai Metropolitan Region (MMR) comprises of areas in and around Mumbai city and
includes parts of Mumbai, Thane and Raigad Districts. Mumbai is known as the
commercial capital of India and MMR is an industrial and technologically advanced
region, which has experienced rapid growth in income and employment. The increasing
trend in trading, business and financial services, demands highest order of infrastructure.
There is need to enhance the capacity of airport as the existing airport in Mumbai
experiencing tremendous pressure for meeting the air traffic demands of this vibrant
region. Realizing the need of second airport for Mumbai, the Government of Maharashtra
granted approval and appointed City & industrial Development Corporation of
Maharashtra Limited (CIDCO) as Nodal agency for implementation.
The site for the airport was selected near Panvel in Raigad district of Maharashtra state
with central coordinates 18°59'33.00"N and 73°4'18.00"E. The Director General of Civil
Aviation (DGCA) has approved the site. Environmental Impact Assessment (EIA) study
was conducted by Centre for Environmental Science and Engineering (CESE), Indian
Institute of Technology (IIT) Mumbai and updated report submitted in April 2011.
Environmental Clearance was granted by Ministry of Environment and Forests vide F. No.
10-53/2009- IA.III dt 22.11.2010 and validity extended vide letter dt 20.12.2017.
Pre-development works for the site has started and as compliance to the Environmental clearance, CIDCO appointed Aditya Environmental Services Pvt. Ltd. (AESPL) to conduct Compliance Environmental Monitoring for the New Mumbai International Airport (NMIA) vide Tender No. C. A. No. 01 / CIDCO/ T&C/ CGM (T&A) / STE (S& A) / 2017-18 (2nd call – 1st Extension) & its Work Order No. CIDCO / T&C / CGM (T & A)/ STE (S-I& A)/2018/1383 dated 07.06.2018.
The sampling locations fixed by CIDCO for compliance monitoring once in each season (Post, pre & during monsoon) for ground water and marine/Surface water quality as per Tender are as given in Chapter II for month from July 2018 – September 2018. The assignment comprises monitoring of following parameters in and around the surrounding project area:
- Ground/Surface water
- Marine water for biological and physicochemical parameters.

Quarterly Monitoring Report Navi Mumbai International Airport (NMIA)
(July – September 2018)
Environmental Consultant Page 2
Aditya Environmental Services Pvt. Ltd.
2. SCOPE OF MONITORING WORK
2.1 Scope of Monitoring Work as per CIDCO Tender: Scope of monitoring work as per CIDCO tender are as given below:
Table 2-1: Scope of Environmental Monitoring Work as per CIDCO Tender
Sr. No.
Parameters – as per Annexure B Location Frequency Samples/ Year
Samples/ 2 years
1. Ground Water Quality (35): Physical Parameters - pH, Temperature, Turbidity, EC, Salinity, TSS, TDS. Chemical Parameters: DO, BOD, COD, Magnesium, Hardness, Alkalinity, Chloride, Sulphate, Fluoride, Sodium, Potassium, Phenol, Total Phosphorous, Total Nitrogen, Sodium Absorption Ratio (SAR), Nitrite-N, Nitrate-N, Calcium. Heavy Metals: Fe, Zn, Mg, Mn, Cd, Cr, Hg. Bacteriological Parameters; Coliform Count. Total Heterotrophic Bacteria. SPC/100ML.
10 10 Stations per season (Post, Pre-& During Monsoon)
30 60
2. Marine/Surface Water Quality parameters (35): Physico Chemical parameters: PH, Temperature, Turbidity, EC, Salinity (ppt), TSS, TDS. Chemical Parameters: Nitrate-N, Nitrite N, Phosphate-P, Silicate, DO, BOD, COD, O&G, Magnesium, Hardness, Alkalinity, Chloride, Sulphate, Fluoride, Sodium, Potassium, Phenol, Total phosphorus, Total Nitrogen. Heavy Metals: Fe, Zn, Mg, Mn, Cd, Cr, Hg Bacteriological parameters: Coliform Count. Marine Biology: Phytoplankton & Zooplankton
13 13 stations per season (Post, Pre-& During Monsoon)
39 78
2.2 Locations of Monitoring:
Sampling Locations have been specified by CIDCO in its Tender. The monitoring was
carried out at the same locations as fixed by CIDCO. Details of monitoring stations for
Ground Water, Marine Water- physicochemical & biological and along with location maps
showing station locations are as given below:
Quarterly Monitoring Report Navi Mumbai International Airport (NMIA)
(July – September 2018)
Environmental Consultant Page 3
Aditya Environmental Services Pvt. Ltd.
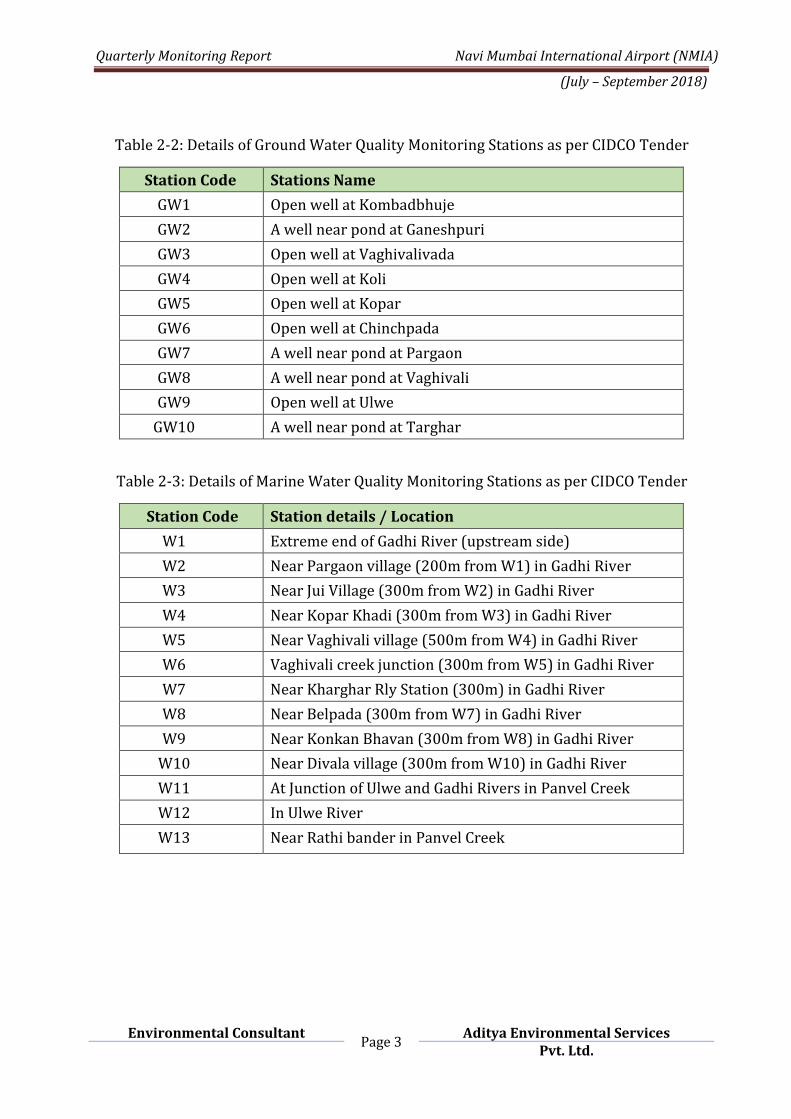
Table 2-2: Details of Ground Water Quality Monitoring Stations as per CIDCO Tender
Station Code Stations Name
GW1 Open well at Kombadbhuje
GW2 A well near pond at Ganeshpuri
GW3 Open well at Vaghivalivada
GW4 Open well at Koli
GW5 Open well at Kopar
GW6 Open well at Chinchpada
GW7 A well near pond at Pargaon
GW8 A well near pond at Vaghivali
GW9 Open well at Ulwe
GW10 A well near pond at Targhar
Table 2-3: Details of Marine Water Quality Monitoring Stations as per CIDCO Tender
Station Code Station details / Location
W1 Extreme end of Gadhi River (upstream side)
W2 Near Pargaon village (200m from W1) in Gadhi River
W3 Near Jui Village (300m from W2) in Gadhi River
W4 Near Kopar Khadi (300m from W3) in Gadhi River
W5 Near Vaghivali village (500m from W4) in Gadhi River
W6 Vaghivali creek junction (300m from W5) in Gadhi River
W7 Near Kharghar Rly Station (300m) in Gadhi River
W8 Near Belpada (300m from W7) in Gadhi River
W9 Near Konkan Bhavan (300m from W8) in Gadhi River
W10 Near Divala village (300m from W10) in Gadhi River
W11 At Junction of Ulwe and Gadhi Rivers in Panvel Creek
W12 In Ulwe River
W13 Near Rathi bander in Panvel Creek

Quarterly Monitoring Report Navi Mumbai International Airport (NMIA)
(July – September 2018)
Environmental Consultant Page 4
Aditya Environmental Services Pvt. Ltd.
Figure 2.1: Map of Surface Marine, Ground Water & Sediment Monitoring Stations as per CIDCO Tender
2.3 Period/Time of Sampling (July – September 2018):
The sampling survey was carried out as per following schedule during July 2018 –
September 2018. Ground Water and Marine Water samples collected for monsoon season
(July 2018)

Quarterly Monitoring Report Navi Mumbai International Airport (NMIA)
(July – September 2018)
Environmental Consultant Page 5
Aditya Environmental Services Pvt. Ltd.
Table 2-3: Period/Time of Sampling for this Survey
Month Parameter Sampling Stations Dates of
Sampling
Time Period
July
2018 Ground
Water
GW1, GW2, GW3,
GW4, GW5, GW6,
GW7, GW8, GW9,
GW10
19.07.18
Grab Sample
Marine
Water
W1, W2, W3, W4,
W5, W12
30.07.18
Grab Sample W6, W7, W8, W9,
W10, W11, W13
31.07.18

Quarterly Monitoring Report Navi Mumbai International Airport (NMIA)
(July – September 2018)
Environmental Consultant Page 6
Aditya Environmental Services Pvt. Ltd.
3. METHODOLOGY ADOPTED FOR ENVIRONMENTAL MONITORING
3.1 GROUND WATER SAMPLING
3.1.1 Reconnaissance Survey:
The villages in study area use ground water from open/bore well and use it for drinking and
other domestic purposes. Ground water gets contaminated due to bad sanitary habits such as
washing of utensils, cattle and bathing and location of septic tanks in/near the open wells.
3.1.2 Methodology of Sampling:
Ground water sample is collected by using containers and the sampling container is rinsed
before using it for storing water samples. Ground water samples are stored in two separate
containers for Physicochemical & Microbiological analysis and preservatives added as
recommended by Standard Methods APHA, stored in cold storage box and transferred to the
laboratory for the further analysis.
Ground Water Sampling in Progress
3.2 MARINE WATER, SEDIMENTS & PLANKTON SAMPLING EQUIPMENTS
3.2.1 Reconnaissance Survey:
The study area represents complex hydrodynamic system. The Ulwe river flows down through the mountains (to the south) in the centre of project site and joins the Panvel creek. The Gadhi river flows from the East to the West. The Ulwe river will be diverted/retrained as part of the project and the Gadhi river will be partly retrained towards the northern part of the site. The river Gadhi receives sewage from Panvel town and nearby areas. Both the rivers drain into the Panvel creek which drains into the Arabian sea to the west. The Panvel creek also received effluents from CETP at MIDC Taloja and sewage from NMMC STPs in Nerul.

Quarterly Monitoring Report Navi Mumbai International Airport (NMIA)
(July – September 2018)
Environmental Consultant Page 7
Aditya Environmental Services Pvt. Ltd.
3.2.2 Methodology of Sampling:
3.2.2.1 Niskin Bottle - Marine Water Sampler
This Water Sampler is used to collect samples at various water depths and can operate at any depth on a cable or line with a messenger.
3.2.2.2 Plankton Net - Biological Samples
This plankton net operates a cable or lined by hand or behind a boat, it can be towed vertically or horizontally. Nets comes in varieties of size (Mesh no 00 equal an aperture of 0.30 inches)
3.2.2.3 Grab Sampler - For Marine Sediments
Sediment grab operate at any depth on a cable or line by free fall (without a messenger). It is
extremely heavy and can take samples of hardest rocky ocean bottoms.

Quarterly Monitoring Report Navi Mumbai International Airport (NMIA)
(July – September 2018)
Environmental Consultant Page 8
Aditya Environmental Services Pvt. Ltd.
Grab Sampler
3.2.2.4 Selection of Stations, Preservation and Transportation of Samples:
Marine water samples were collected from sampling locations in Gadhi River, Ulwe River
and Panvel Creek at the locations indicated by CIDCO – in all, 13 samples were collected
from 13 sampling locations for physicochemical and Biological samples (Stations 1 to 10
are located in Gadhi River & Station 11 & 13 are Panvel Creek while station 12 in Ulwe
River. A good amount of mangrove vegetation was noted on either side of stream 4 to 6.
Sampling locations were approached by boats (wherever possible) and collection done
irrespective of tide. Sampling were done only for surface water. The samples were
preserved and taken to laboratory using vehicle on same day.
3.3 Laboratory Credentials
Sampling and analysis were done by laboratory of Aditya Environmental Services Pvt Ltd
located at Plot P-1, MIDC Commercial plots, Mohopada, Tal Panvel, Dist. Raigad.
Our Environmental Laboratory is recognized by Ministry of Environment & Forest
(MoEFCC), Govt. of India under Environment (Protection) Act, 1986.
Laboratory is also certified ISO 9001:2015 and OHSAS 18001:2007.
Laboratory is accredited under ISO/IEC 17025:2005 (TC-7085) for water, wastewater
and soil parameters
Environmental sampling conducted by our experienced, qualified environmental staff &
Analysis and reporting by approved Government Analyst.
Instruments used for sampling are from reputed manufacturer & are regularly
calibrated.

Quarterly Monitoring Report Navi Mumbai International Airport (NMIA)
(July – September 2018)
Environmental Consultant Page 9
Aditya Environmental Services Pvt. Ltd.
Chemicals used are Analytical Reagent grade and from reputed manufacturer.
Analytical Instrumentation used in the laboratory is regularly calibrated.
We have regular program of Preventive & Annual Maintenance for all critical
equipment.
Ground Water, Soil Analysis - using APHA, BIS, ASTM & CPCB standards Methods for
water Analysis.
Standard Methods Adopted in the laboratory are those prescribed by APHA, BIS, ASTM
& CPCB for water, waste & marine water analysis using methods as per NIO (National
Institute of Oceanography) Manual.
We have CRMs (Certified Reference Material) for heavy metals from reputed
manufacturers for heavy metals and Standard sea water which we use for analysis.
We are regularly participating in Proficiency testing with reputed Organizations like
Central Pollution Control Board (CPCB), Goa State Pollution Control Board and others
as also Intra laboratory QC testing to check performance of our chemists.
Overall approach & methodology is with Annexure IA Scope of the work & the Best
practices as per prevailing norms of Central Pollution Board /Ministry of
Environment & Forest etc. /Internationally adopted practices.

Quarterly Monitoring Report Navi Mumbai International Airport (NMIA)
(July – September 2018)
Environmental Consultant Page 10
Aditya Environmental Services Pvt. Ltd.
4. COMPILATION OF DATA & INFERENCE
4.1 GROUND WATER QUALITY ANALYSIS REPORT
4.4.1 GW Analysis Data
The physicochemical analysis of ground water study showed considerable variation and is compiled
and presented below:
Table 4-1: Ground water analysis at various stations during July 2018
Sr. No.
Sampling Locations GW
1 GW
2 GW
3 GW 4
GW 5
GW 6
GW 7
GW 8
GW 9
GW 10
Sampling month 19.07.2018
1 pH 7.23 7.40 7.27 7.21 7.30 7.16 7.22 7.36 7.70 7.12
2 Temperature 27.9 28.0 27.2 28.1 28.1 28.0 27.9 28.0 28.1 28.0
3 Turbidity BDL BDL BDL BDL BDL BDL BDL BDL BDL BDL
5 Electrical Conductivity 208.95 212.6 223.88 137.32 2.0 210.8 194.03 179.1 164.18 164.18
6 Salinity 1.1 0.9 1.67 0.8 214.3 2.2 2.0 1.8 1.9 2.2
7 TSS 14 12 28 12 22 14 16 10 10 14
8 Total Dissolved Solid 140 140 150 90 140 140 130 120 110 110
9 Dissolved Oxygen 6.5 6.4 6.3 6.0 6.5 6.4 6.5 6.4 6.0 6.2
10 BOD 10 12 14 08 06 10 10 08 12 08
11 COD 30 40 50 30 20 40 40 20 40 20
12 Hardness (as CaCO3) 64 70 120 86 100 110 112 78 88 78
13 Alkalinity 86 66 84 54 70 72 70 48 70 70
14 Chlorides (as Cl) 40 46 82 40 62 76 76 52 52 46
15 Sulphate (as SO4-2) 18 26 16 12 40 36 28 40 36 42
16 Fluoride (as F) BDL BDL BDL BDL BDL BDL BDL BDL BDL BDL
17 Sodium (as Na) 02 03 02 03 02 01 03 02 02 02
18 Potassium (as K) 04 08 06 08 04 06 10 08 06 06
19 Phenol BDL BDL BDL BDL BDL BDL BDL BDL BDL BDL
20 Total phosphorous BDL BDL BDL BDL BDL BDL BDL BDL BDL BDL
21 Total Nitrogen (TKN) BDL BDL BDL BDL BDL BDL BDL BDL BDL BDL
22 Sodium absorption ratio 0.1 0.1 0.1 0.1 0.1 0.1 0.1 0.1 0.1 0.1
23 Nitrite - N BDL BDL BDL BDL BDL BDL BDL BDL BDL BDL
24 Nitrate -N BDL BDL BDL BDL BDL BDL BDL BDL BDL BDL
25 Calcium (as Ca) 20.8 17.6 30.4 24 28.8 28 35.2 20.8 22 20.8
26 Iron (as Fe) 0.11 0.08 0.10 0.02 0.08 0.10 0.06 0.04 0.10 0.06
27 Zinc (as Zn) BDL BDL BDL BDL BDL BDL BDL BDL BDL BDL
28 Magnesium (as Mg) 2.88 5.28 10.6 6.24 6.72 9.6 5.76 6.24 7.92 6.24
29 Manganese (as Mn) BDL BDL BDL BDL BDL BDL BDL BDL BDL BDL
30 Cadmium (as Cd) BDL BDL BDL BDL BDL BDL BDL BDL BDL BDL
31 Chromium (as Cr) BDL BDL BDL BDL BDL BDL BDL BDL BDL BDL
32 Mercury (as Hg) BDL BDL BDL BDL BDL BDL BDL BDL BDL BDL
33 Coliform Present Present Present Present Present Present Present Present Present Present
34 Heterophilic Bacteria (SPC/100 ml)
11.7 x 10³ 9.6 x 10³ 10.4 x 10³ 12.3 x 10³ 11.5 x 10³
10.9 x 10³ 13.2 x 10³ 9.9 x 10³
12.9 x 10³
11.1 x 10³
GW1: Open Well at Kombadbhuje; GW2: Well near pond at Ganeshpuri; GW3: Open well at Vaghivalivada; GW4: Open Well at Koli; GW5: Open well at Kopar; GW6: Open well at Chinchpada; GW7: A well Near Pargaon; GW8: Well near Vaghivali; GW9: Open well at Ulwe; GW10: Well near pond at Targhar BDL: Below Detectable Limit

Quarterly Monitoring Report Navi Mumbai International Airport (NMIA)
(July – September 2018)
Environmental Consultant Page 11
Aditya Environmental Services Pvt. Ltd.
4.1.2 GW Analysis Inference:
The ground water quality showed considerable variation. Some ground water parameters were
within desirable limit, some between desirable and permissible limit and few exceeded the
permissible limit. The ground water not fully complied the quality requirements as per IS 10500
revised in 2012 for purpose of drinking water.
The quality of collected ground water was not suitable for drinking purpose due to the presence of
coliform & heterotrophic bacteria at all locations i.e. Koli, Kopar, Pargaon, Chinchpada,
Vaghivalivada, Ulwe, Ganeshpuri, Vaghivali, Targhar & Kombadbhuje. Proper treatment of ground
water required before consumption.

Quarterly Monitoring Report Navi Mumbai International Airport (NMIA)
(July – September 2018)
Environmental Consultant Page 12
Aditya Environmental Services Pvt. Ltd.
4.2 MARINE WATER QUALITY ANALYSIS REPORT
Surface Marine water samples were collected for different Physiochemical and
Biological parameters from 13 stations during 30th to 31st July 2018. Analysis part
is mention in subsequent sections below.
Collection of water sample Noting Down Water Temperature
Preserving of phytoplankton sample Fixing DO Sample
Collection of Zooplankton Samples

Quarterly Monitoring Report Navi Mumbai International Airport (NMIA)
(July – September 2018)
Environmental Consultant Page 13
Aditya Environmental Services Pvt. Ltd.
4.2.1 Analytical Data - Physicochemical Parameters during Monsoon
Table 4-2: Marine water physicochemical analysis of various stations of project area during July 2018
Sr. No. Parameter W1 W2 W3 W4 W5 W6 W7 W8 W9 W10 W11 W12 W13 Unit
S S S S S S S S S S S S S 1. pH 6.50 6.62 6.72 6.48 6.43 6.82 6.25 6.47 6.78 6.23 6.53 6.63 6.64 -- 2. Temperature 24.7 25.3 25.1 24.6 24.1 24.0 24.0 24.6 24.0 24.4 24.6 24.1 24.0 °C 3. Turbidity 2.0 2.6 2.6 2.2 2.5 1.8 2.0 2.4 1.3 1.8 1.6 2.0 2.1 NTU 4. Electrical Conductivity 1805 12582 9197 12149 13313 12701 12358 12373 11910 12626 12298 11701 12298 µS/Cm 5. Salinity 13.1 13.4 14.3 13.0 13.8 13.2 13.1 13.6 13.1 13.8 13.0 13.2 13.6 ppt 6. TSS 112 124 132 124 128 102 98 124 92 128 102 114 102 mg/l 7. TDS 9210 8430 9250 8140 8920 8510 8280 8290 7980 8460 8240 7840 8240 mg/l 8. Nitrite - N BDL BDL BDL BDL BDL BDL BDL BDL BDL BDL BDL BDL BDL mg/l 9. Nitrate -N BDL BDL BDL BDL BDL BDL BDL BDL BDL BDL BDL BDL BDL mg/l 10. Phosphate - P BDL BDL BDL BDL BDL BDL BDL BDL BDL BDL BDL BDL BDL mg/l 11. Silicate BDL BDL BDL BDL BDL BDL BDL BDL BDL BDL BDL BDL BDL mg/l
12. DO 5.2 5.0 5.8 5.5 5.3 5.8 5.6 5.5 5.8 5.5 5.6 5.6 5.2 mg/l
13. BOD 12 22 22 18 20 14 16 20 12 32 34 18 22 mg/l 14. COD 42 70 70 40 60 50 50 70 40 100 120 60 80 mg/l 15. Oil & Grease BDL BDL BDL BDL BDL BDL BDL BDL BDL BDL BDL BDL BDL mg/l 16. Hardness 340 346 266 372 356 248 398 340 166 404 460 410 320 mg/l 17. Sodium, Na 32 38 28 32 28 30 25 20 24 28 26 22 26 mg/l 18. Alkalinity 356 360 320 420 380 320 420 352 182 420 358 324 288 mg/l 19. Chloride 7454 7624 8137 7397 7852 7511 7454 7738 7454 7852 7397 7511 7738 mg/l 20. Sulphate as SO4 74.3 88.4 86.2 86.8 112.3 74.6 80.4 88 48.3 94.6 113 88.6 90 mg/l 21. Fluoride BDL BDL BDL BDL BDL BDL BDL BDL BDL BDL BDL BDL BDL mg/l 22. Potassium K 10 12 08 14 14 12 08 06 08 10 12 11 12 mg/l 23. Phenol BDL BDL BDL BDL BDL BDL BDL BDL BDL BDL BDL BDL BDL mg/l 24. Total phosphorous BDL BDL BDL BDL BDL BDL BDL BDL BDL BDL BDL BDL BDL mg/l 25. Total Nitrogen (TKN) BDL BDL BDL BDL BDL BDL BDL BDL BDL BDL BDL BDL BDL mg/l 26. Iron as Fe 0.10 0.14 0.08 0.11 0.18 0.10 0.09 0.10 0.10 0.08 0.08 0.15 0.10 mg/l 27. Zinc as Zn BDL BDL BDL BDL BDL BDL BDL BDL BDL BDL BDL BDL BDL mg/l 28. Magnesium as Mg 22.3 24.3 18.6 32.6 28.2 22.4 28.6 24 12.8 28.6 43.1 35.6 24.3 mg/l 29. Manganese Mn BDL BDL BDL BDL BDL BDL BDL BDL BDL BDL BDL BDL BDL mg/l 30. Cadmium as Cd BDL BDL BDL BDL BDL BDL BDL BDL BDL BDL BDL BDL BDL mg/l 31. Chromium as Cr BDL BDL BDL BDL BDL BDL BDL BDL BDL BDL BDL BDL BDL mg/l 32. Mercury as Hg BDL BDL BDL BDL BDL BDL BDL BDL BDL BDL BDL BDL BDL mg/l

Quarterly Monitoring Report Navi Mumbai International Airport (NMIA)
(July – September 2018)
Environmental Consultant Page 14
Aditya Environmental Services Pvt. Ltd.
4.2.2 Inference - Physicochemical Parameters during Monsoon:
The pH value ranged from 6.23 to 6.82 at surface basic nature of water. Salinity was low due to influx of fresh water and collection during monsoon. The total suspended solids were found due to accumulation of discharge from surrounding villages in the Panvel Creek and Ulwe river respectively. The Total dissolved solids were noted high which suggest the high concentration of dissolved salts and deteriorated quality of water. Total organic carbon was noted low which suggest there were no accumulation of organic matter in water body. Dissolve Oxygen level more than 5 mg/l is within normal limit suggest good amount of dissolved oxygen in the water body to support living organism. BOD value suggests the presence of biodegradable organic wastes present in water body which comes as domestic waste, discharge of sewage from surrounding areas and effluents from CETP at MIDC Taloja and sewage from NMMC STPs in Nerul. COD value indicates the amount of oxidable material present in water body. The Sulphate value were found in low concentration which represents anthropogenic contamination. The concentration of Manganese, Magnesium and Iron were low due natural origin.

Quarterly Monitoring Report Navi Mumbai International Airport (NMIA)
(July – September 2018)
Environmental Consultant Page 15
Aditya Environmental Services Pvt. Ltd.
4.3 MARINE WATER QUALITY ANALYSIS REPORT (BIOLOGICAL PARAMETERS)
4.3.1 Analytical Data - Biological Parameters during Monsoon:
Biological parameters viz. Phytoplankton, Zooplankton and Microbiology were analyzed and compiled data is presented below:
Table 4-3: Marine water biological analysis of various stations of project area during July 2018
Parameter W 1 W 2 W3 W4 W5 W6 W7
S S S S S S S
Phytoplankton
Population (nox103/L)
168.4 142.8 132.6 116.8 198.4 48.8 56.2
Total Genera 22 18 13 18 11 16 14
Major Genera
Scenedesmus Thalassiosira Leptocylindrus Navicula
Nitzschia, Scenedesmus, Thalassiosira, Leptocylindrus
Thalassiosira, Leptocylindrus, Navicula, Skeletonema
Thalassiosira Leptocylindrus, Chaetoceros, Skeletonema
Thalassiosira, Leptocylindrus, Navicula, Skeletonema
Nitzschia, Thalassiosira, Leptocylindrus, Skeletonema
Pleurosigma, Skeletonema, Nitzschia, Thalassiosira
Diversity Index 2.16 1.32 1.38 1.67 1.34 2.08 2.56
Zooplankton
Population (nox 103/100m3)
91.00 102.32 88.49 2.72 1.36 28.98 9.32
Total Group 4 4 3 3 5 8 6
Major Groups Copepods Copepods Copepods Copepods
Gastropods Gastropods,
foraminiferans Copepods
Gastropods Copepods
Gastropods
Biomass (ml/100m3)
22.00 7.78 5.42 3.12 5.56 118.14 57.61
Diversity Index 0.16 0.00 0.00 0.21 0.59 1.02 0.79
Microbiology
Coliform/100 ml *P *P *P *P *P *P *P
Table 4-4: Marine water biological analysis of stations (W8 to W13) during July 2018
Parameter W8 W9 W10 W11 W12 W13
S S S S S S
Phytoplankton
Population (nox103/L)
42.6 18.6 16.4 36.2 265.2 32.4
Total Genera 15 10 14 9 11 18
Major Genera
Skeletonema, Nitzschia, Cyclotella,
Thalassiosira
Skeletonema, Nitzschia, Guinardia,
Thalassiosira
Skeletonema, Cyclotella,
Rhizosolenia Nitzschia
Skeletonema, Nitzschia,
Leptocylindrus, Thalassiosira
Thalassiosira, Leptocylindrus,
Pleurosigma, Navicula
Thalassiosira, Chaetoceros, Skeletonema,
Nitzschia
Diversity Index 2.21 2.18 2.36 2.18 1.48 2.34
Zooplankton
Population (no x 103/100m3)
42.71 46.24 48.03 42.06 88.42 32.82
Total Group 6 5 6 5 6 7
Major Groups Copepods Gastropods
Copepods Gastropods
Copepods Gastropods
Copepods Gastropods
Polychaete, lamellibranchs
Copepods Gastropods
Biomass (ml/100m3)
146.06 122.02 182.59 162.45 44.12 126.32
Diversity Index 0.83 0.82 0.90 0.94 1.38 1.04
Microbiology
Coliform/100 ml *P *P *P *P *P *P

Quarterly Monitoring Report Navi Mumbai International Airport (NMIA)
(July – September 2018)
Environmental Consultant Page 16
Aditya Environmental Services Pvt. Ltd.
4.3.2 Inferences - Biological Parameters during Monsoon:
4.3.2.1 Phytoplankton In July 2018, Phytoplankton population density ranges from 16.4-256.2 x 10³/l at surface
water of all 13 stations. Highest phytoplankton population at surface water of station 12 may
be due to influx of domestic water from surrounding villages; total generic groups ranges from
9-18 nos. at surface water of 13 stations. Maximum generic diversity 18 no. is observed at
surface water of Station 4 during July 2018.
Thalassiosira, Skeletonema, Pleurosigma and Nitzschia, are most common ones, followed by
rest of observed genera like Leptocylindrus, Scenedesmus, Navicula.
The other fresh water phytoplankton genera found are Scenedesmus, Oscillatoria in Gadhi River (Station 2). Nitzschia, Thalassiosira and Navicula are common Genera noted in all stations. Graphical representations of phytoplankton population and total genera is represented in Figure 4.1. The graph below represents the population of phytoplankton is more at station 12; and less at
station 10, which represents there is discharge of sewage and domestic waste. The
phytoplankton trend with respect to total number of genera is almost same throughout all
stations. Some of the major genera seen were photographed and shown in figure 4.2.
Figure 4.1 : Representation of phytoplankton population & Total genera for July 2018
Figure 4.2: Phytoplankton found in samples for July 2018
Population (no x 103/ L) Total Genera (no)
Thalassiosira Pleurosigma Gyrosigma Oscillatoria

Quarterly Monitoring Report Navi Mumbai International Airport (NMIA)
(July – September 2018)
Environmental Consultant Page 17
Aditya Environmental Services Pvt. Ltd.
4.3.2.2 Zooplankton
In July 2018, the zooplankton biomass ranged from 3.12 to 182.59 ml/100 m3 with population
density of 1.36 to 102.32 no x 103/100m3 while having good faunal group ranging from 3-8
nos. The zooplankton was noted with good population and group diversity. Copepods,
Gastropods & polychaetes were common groups observed as, figures 4.3 represents
zooplankton standing stock graphically.
The graph below represents that average standing stock reported from all stations; Station 5
shows lowest population as compared to Station 2; and station 4 shows lowest biomass and
Station 10 shows highest biomass respectively.
Figure 4.3: Graphical representations of Zooplankton Biomass, Population and total group for July 2018
Figure 4.4: Zooplankton found in samples for July 2018
4.3.2.4 Microbiology
Coliform microbes were present at all stations in surface level. No specific trend was
observed.
Biomass (ml/100 m3)
Population (no x 103/100 m3)
Total Group (no)
Copepod Polychaete

Quarterly Monitoring Report Navi Mumbai International Airport (NMIA)
(July – September 2018)
Environmental Consultant Page 18
Aditya Environmental Services Pvt. Ltd.
5. CHAPTER V: CONCLUSION & RECOMMENDATION
Based on the study of activities planned during pre-development works and on the basis
of the environmental baseline monitoring results, certain issues have been identified
and steps proposed to mitigate the environmental impacts as suggested below:
5.1 Ground Water:
5.1.1 Observations from Data:
Ground Water quality is poor and fails to meet IS 10500:2012 norms at number of
locations. The area of the site is low lying and partially inundated during high tide.
Ground water table is high and mostly open dug wells are seen in rural areas.
5.1.2 NMIA Pre - Development Activities and impacts anticipated on Ground
Water Quality:
Construction activities at NMIA during pre-development works include:
- demolition of hill which will generate of material like murum and rock which will
be utilized within site and balance will be taken to fill up nearby areas
- Site level is currently low and will be increased to +6 to +7m above existing GL by
using excavated material.
- The area of the site is partially inundated during high tide. This area will be filled
up to make available land for airport development
The ground water quality will get affected by above activities.
5.1.3 Further Study Suggested:
As per clause (vii) under specific conditions of the Environmental clearance granted
for the NMIA project by MOEFCC, “systematic and periodic monitoring mechanism
need to be put in place by CIDCO to assess the impact on sub surface flow /impact
on aquifers as well as surface water bodies in different seasons. Necessary
additional environmental protection measures to be adopted to address the impact
of proposed development in coastal sub surface flow as well as impact on aquifers”.
The above study needs to be undertaken by a Functional Area Expert specializing in
Hydrology/Geo- hydrology urgently in view of the fact that pre-development activities
have started.
5.1.4 Mitigation Measures for Rehabilitated Settlements:
CIDCO needs to make adequate and clean piped water supply available for people to be
accommodated in Rehabilitated settlements.
5.2 Marine Water:
5.2.1 Observations from Data:
Marine Water quality is moderate, may be due to hindrances.

Quarterly Monitoring Report Navi Mumbai International Airport (NMIA)
(July – September 2018)
Environmental Consultant Page 19
Aditya Environmental Services Pvt. Ltd.
5.2.2 NMIA Pre- Development Activities and impacts anticipated on Marine
Water Quality:
Construction activities at NMIA during pre-development works include:
- demolition of hill which will generate of material like murum and rock which will
be utilized within site and balance will be taken to fill up nearby areas.
- Site level is currently low and will be increased to +6 to +7m above existing GL by
using excavated material.
- The area of the site is partially inundated during high tide. This area will be filled
up to make available land for airport development
The marine water quality may get affected by activities such as land filling, diversion of
courses of Ulwe and training of Gadhi rivers.
5.2.3 Further Study Suggested:
The re-coursing of Ulwe river and training of Gadhi river with provision of special
channel to the North of the site in the proposed Master plan needs detailed studies so
far as its impacts on marine water quality and drainage on the entire area is considered.
The Environmental clearance has several clauses pertaining to this as below:
(1) The proposed re-coursing of tidally influenced water body outlets from Ulwe river
has a large cross-sectional area at the middle with the river/creek on either end
remaining unchanged with its natural course. The whole system should function as it
was functioning earlier without airport project. Surface runoff should not be let into
the channel just because the area of cross section is large. The whole airport area will
be reclaimed, and the level raised to 7m whereas the existing level all around the
airport will continue to be low in its natural state. There will be flow all around due to
surface runoff. This additional quantity must be collected by appropriate drainage
system and let into Gadhi River and not into the recoursing channel. The recourse
channel may be able to take it but not the river or creek on either side of the channel.
This aspect shall be examined by CIDCO in details to avoid the flooding of the low-
lying areas besides inducting other hydrological and environmental studies.
(2) The entire system shall be studied as one composite system with appropriate
boundary conditions to reflect the worst conditions – minimum 100 years to be
specified and compliance ensured such as -flooding, surface runoff not only from the
airport but also from surrounding areas as well, normal flow, tidal flow due to tidal
surge having a long return period, possible obstructions to flow, tributaries joining
the main river etc. so as to take appropriate protection and remedial measures. Due
to construction of recourse Channels and also due to tail end of the Gadhi & Ulwe
Rivers into Panvel Creek, there is a need to prepare a Comprehensive Master Plan for
Surface drainage and Flood protection, keeping in view the proposed developments.
CIDCO shall submit the above Master Plan to the Ministry.
(3) On the northern part of the airport there is a secondary channel of the Gadhi River
which will be filled up for the airport runway construction. This will be replaced by a
Quarterly Monitoring Report Navi Mumbai International Airport (NMIA)
(July – September 2018)
Environmental Consultant Page 20
Aditya Environmental Services Pvt. Ltd.
shorter channel along the northern boundary of the airport. The channel shall be
designed appropriately through overall modeling study so that the channel provides
tidal water to the mangrove park and moderate tidal flows under worst
environmental conditions. Need for widening and deepening of Gadhi River may also
be studied simultaneously, if required. The revised widths and depths of recourse
channels shall be determined with modified drainage and worst rainfall/tide
conditions including appropriate factor of safety.
The above studies need to be undertaken on priority in view of the fact that pre-
development activities have started.
5.2.4 Mitigation Measures for protection of Marine Water Quality:
Mitigation measures taken up at NMIA during pre-development works are as follows:
- landfilling is done in areas inundated during high tide, taking care that there is no
disposal of debris in inter tidal area, nor any water way is obstructed
- for excavated areas and freshly filled up areas, proper garland drains leading to
settlement basins followed by filter bunds are provided so that rainwater does not
carryover the loose excavated material into marine areas.
- polyelectrolytes are used to help settle loose suspended material in the settlement
basins.