NAUTICA GAUGE MACKINTOSH PROBE - utpedia.utp.edu.myutpedia.utp.edu.my/15607/1/1.NAUTICA GAUGE...
61
NAUTICA GAUGE MACKINTOSH PROBE By Syahril Azim Bin Saiful Bahri 16937 Dissertation submitted in partially fulfilment of the requirements for the Degree of Study (Hons) (Civil Engineering) JANUARY 2015 Universiti Teknologi PETRONAS Bandar Seri Iskandar 31750 Tronoh Perak Darul Ridzuan
Transcript of NAUTICA GAUGE MACKINTOSH PROBE - utpedia.utp.edu.myutpedia.utp.edu.my/15607/1/1.NAUTICA GAUGE...
NAUTICA GAUGE MACKINTOSH PROBE
By
Syahril Azim Bin Saiful Bahri
16937
Dissertation submitted in partially fulfilment of
the requirements for the
Degree of Study (Hons)
(Civil Engineering)
JANUARY 2015
Universiti Teknologi PETRONAS
Bandar Seri Iskandar
31750 Tronoh
Perak Darul Ridzuan
i
CERTIFICATION OF APPROVAL
NAUTICA GAUGE MACKINTOSH PROBE
By
Syahril Azim Bin Saiful Bahri
16937
A project dissertation submitted to the
Civil Engineering Programme
Universiti Teknologi PETRONAS
In partial fulfilment of the requirement for the
BACHELOR OF ENGINEERING (Hons)
(CIVIL)
Approved by,
____________________
( )
UNIVERSITI TEKNOLOGI PETRONAS
TRONOH, PERAK
January 2015
ii
CERTIFICATION OF ORIGINALITY
This is to certify that I am responsible for the work submitted in this project, that the
original work is my own except as specified in the references and acknowledgements, and
that the original work contained herein have not been undertaken or done by unspecified
sources or persons.
_______________________________________
(SYAHRIL AZIM BIN SAIFUL BAHRI)
iii
ABSTARCT
A Mackintosh probe is a lightweight portable penetrometer that is designed to be a tool to
investigate the soil bearing capacity. The tool consist of high yield steel rods, each of
length approximately 120cm that are connected each other by 25mm outer diameter
couplings with a 27.9mm diameter of a 30o –apex angle; 12.7 mm diameter solid rods and
a 4.5 kg dead weight with standard drop height of 300mm. The applications of the
Mackintosh probe are by assembling the equipment, marked on each 0.3m on the rods, set
up the equipment on the ground, pulled up the hammer until maximum height, dropped
freely to driven the rod and cone into the soil, continued until the blow reach more than
400 blows per 0.3m penetration or the depth reached 15m. Under any circumstances of
the soil conditions, the rate of driven must be from 15 to 30 blows per minute and the
deviation from the vertical of the first extension rod shall not be greater than 2%. The
result from the Mackintosh probe test shall be recorded for every blows per 0.3m. Thus,
the value of the bearing capacity will be referred to the standard bearing capacity graph.
Mackintosh probe have lots of disadvantages that can lead to misleading test result that
are contributed mostly from human error. To overcome this problem, this study will
mainly focusing on developing a mechanism that will improve the present Mackintosh
probe. The mechanism is called the Nautical Gauge Mackintosh Probe (NGMP). From the
progress test result of this study, it shows the number of blows per 0.3m is exceed the
limitation of the standard bearing capacity graph. The recommendation for the problem is
to change the location of study to a more adequate location.
iv
ACKNOWLEDGEMENT
My deepest gratitude to Allah The Most Gracious and Merciful, for the guidance
and blessings, for granting me strength when all hope seems lost. The author would like
to thanks AP IR Dr Ibrahim Kamaruddin for being very proactive helping and supporting
throughout the Final Year Project 1 and 2 period. It has been a precious experience
researching under his supervision because he gave the best opportunity in handling and
experiencing real life problems.
A Special thanks to Muhammad Fairus bin Abdullah ( welding specialist for Arjafi
Resources Sdn. Bhd ) for coaching and helping the author in making the NGMP a reality
by contributing in manufacturing the NGMP without any hassle and miscommunications.
By this experience, it helps the author practicing to be a competent engineer during the
designing process of the NGMP. My most sincere appreciation is also dedicated to
Muhammad Hafiz bin Mustafa for his helps and opinions in the process of delivering the
NGMP to the site.
The author would like to give his deepest thanks to the workforce Universiti
Teknologi Petronas staffs for being very helpful along the Final Year Project 1 and 2
period. All ambiguity during the research period was explained thoroughly without
hesitation. Their openness in sharing experience in handling a real life research had made
my internship period worth a priceless knowledge.
v
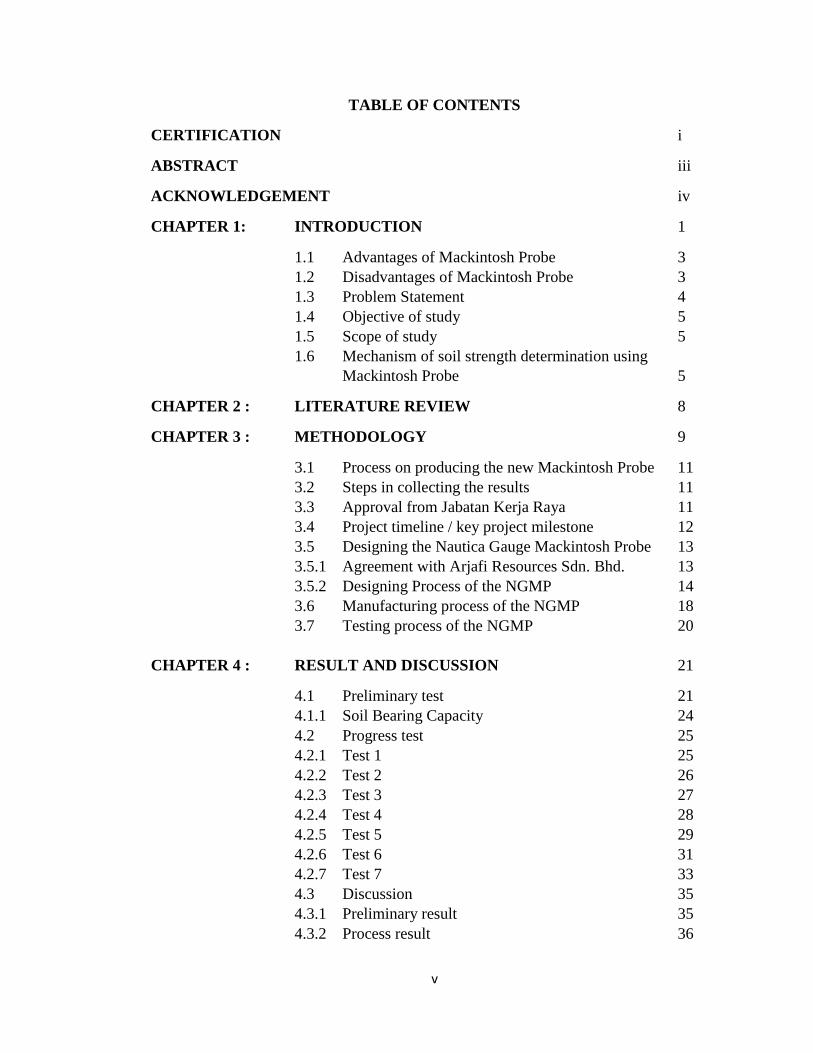
TABLE OF CONTENTS
CERTIFICATION i
ABSTRACT iii
ACKNOWLEDGEMENT iv
CHAPTER 1: INTRODUCTION 1
1.1 Advantages of Mackintosh Probe 3
1.2 Disadvantages of Mackintosh Probe 3
1.3 Problem Statement 4
1.4 Objective of study 5
1.5 Scope of study 5
1.6 Mechanism of soil strength determination using
Mackintosh Probe 5
CHAPTER 2 : LITERATURE REVIEW 8
CHAPTER 3 : METHODOLOGY 9
3.1 Process on producing the new Mackintosh Probe 11
3.2 Steps in collecting the results 11
3.3 Approval from Jabatan Kerja Raya 11
3.4 Project timeline / key project milestone 12
3.5 Designing the Nautica Gauge Mackintosh Probe 13
3.5.1 Agreement with Arjafi Resources Sdn. Bhd. 13
3.5.2 Designing Process of the NGMP 14
3.6 Manufacturing process of the NGMP 18
3.7 Testing process of the NGMP 20
CHAPTER 4 : RESULT AND DISCUSSION 21
4.1 Preliminary test 21
4.1.1 Soil Bearing Capacity 24
4.2 Progress test 25
4.2.1 Test 1 25
4.2.2 Test 2 26
4.2.3 Test 3 27
4.2.4 Test 4 28
4.2.5 Test 5 29
4.2.6 Test 6 31
4.2.7 Test 7 33
4.3 Discussion 35
4.3.1 Preliminary result 35
4.3.2 Process result 36
vi
4.3.3 Progress result (Present Mackintosh Probe) 37
4.3.4 Progress result (NGMP) 37
CHAPTER 5: CONCLUSION AND RECOMMENDATIONS 40
5.1 Conclusion 40
5.2 Recommendations 41
REFFERENCE 42
APPENDICES 43
vii
LIST OF FIGURES
Figure 1 Mackintosh Probe 2
Figure 2 Graph M versus Depth 6
Figure 3 Standard Bearing Capacity Graph 7
Figure 4 Steps of project implementation 9
Figure 5 Illustration of the first initial design of the NGMP 15
Figure 6 Illustration of the second initial design of the NGMP 16
Figure 7 Illustration of the final design of the NGMP 17
Figure 8 Welding process of the NGMP 19
Figure 9 Automatic countable gauge 19
Figure 10 Cumulative number of blows versus depth graph 22
Figure 11 Rough estimation of layer of soil 23
Figure 12 The standard bearing capacity graph 24
Figure 13 Cumulative number of blows versus depth graph for test 1 25
Figure 14 Cumulative number of blows versus depth graph for test 2 26
Figure 15 Cumulative number of blows versus depth graph for test 3 27
Figure 16 Cumulative number of blows versus depth graph for test 4 28
Figure 17 Cumulative number of blows versus depth graph for test 5 without 30
NGMP
Figure 18 Cumulative number of blows versus depth graph for test 5 with 30
NGMP
Figure 19 Cumulative number of blows versus depth graph for test 6 without 32
NGMP
Figure 20 Cumulative number of blows versus depth graph for test 6 with 32
NGMP
Figure 21 Cumulative number of blows versus depth graph for test 7 without 34
NGMP
Figure 22 Cumulative number of blows versus depth graph for test 7 with 34
NGMP
Figure 23 Cumulative number of blows versus depth graph from test 5 until 7 39
viii
LIST OF TABLES
Table 1 Example of data table 6
Table 2 Safe / allowable bearing capacity for various type of soil / rock 7
Table 3 Gantt chart of the project time line and key project milestone 12
Table 4 Result from the preliminary test 21
Table 5 Result from the progress test 1 25
Table 6 Result from the progress test 2 26
Table 7 Result from the progress test 3 27
Table 8 Result from the progress test 4 28
Table 9.0 Result from the progress test 5 without NGMP 29
Table 9.1 Result from the progress test 5 with NGMP 29
Table 10.0 Result from the progress test 6 without NGMP 31
Table 10.1 Result from the progress test 6 with NGMP 31
Table 11.0 Result from the progress test 7 without NGMP 33
Table 11.1 Result from the progress test 7 with NGMP 33
Table 12.0 Result for the present Mackintosh Probe test 38
Table 12.1 Result for the NGMP 38
1
CHAPTER 1
INTRODUCTION
1. INTRODUCTION
A thoroughly soil investigation is required before any construction building or
project begins. This is important due to the assurance of the safety of a structure.
Mackintosh Probe is a tool used for research purposes especially for soil investigation.
Mackintosh Probe test is carried out to determine the bearing capacity which is the
strength of the soil.
The result obtain from the test provides a rough estimation of the soil layer at
a point. It is a tool that is light and easy to operate by a group of people consisting of
a technician with one or two workers who do not required any skills in handling the
tool. Fakher et. al (2005), who quoted this statement from Sabtan and Shehata (1994)
that the Mackintosh Probe is a lightweight dynamic penetrometer and a considerably
faster and cheaper tool than boring, particularly when the depth of exploration is
moderate and the soils being investigated are soft or loose.
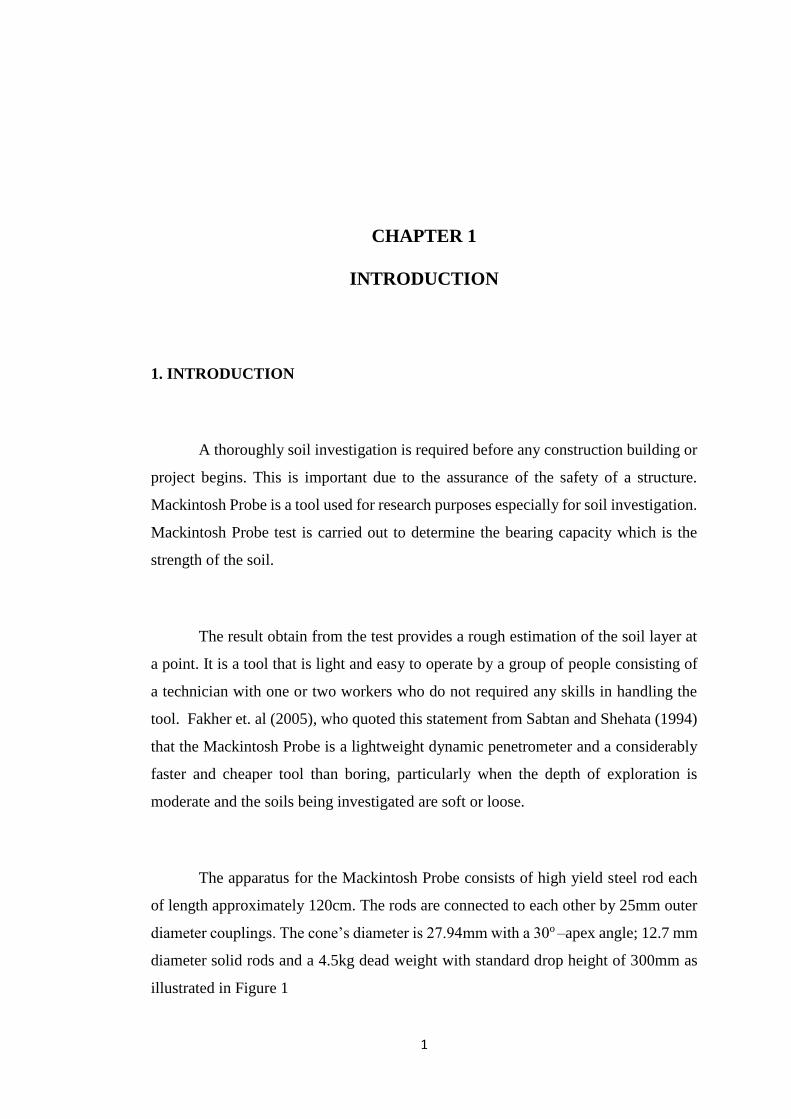
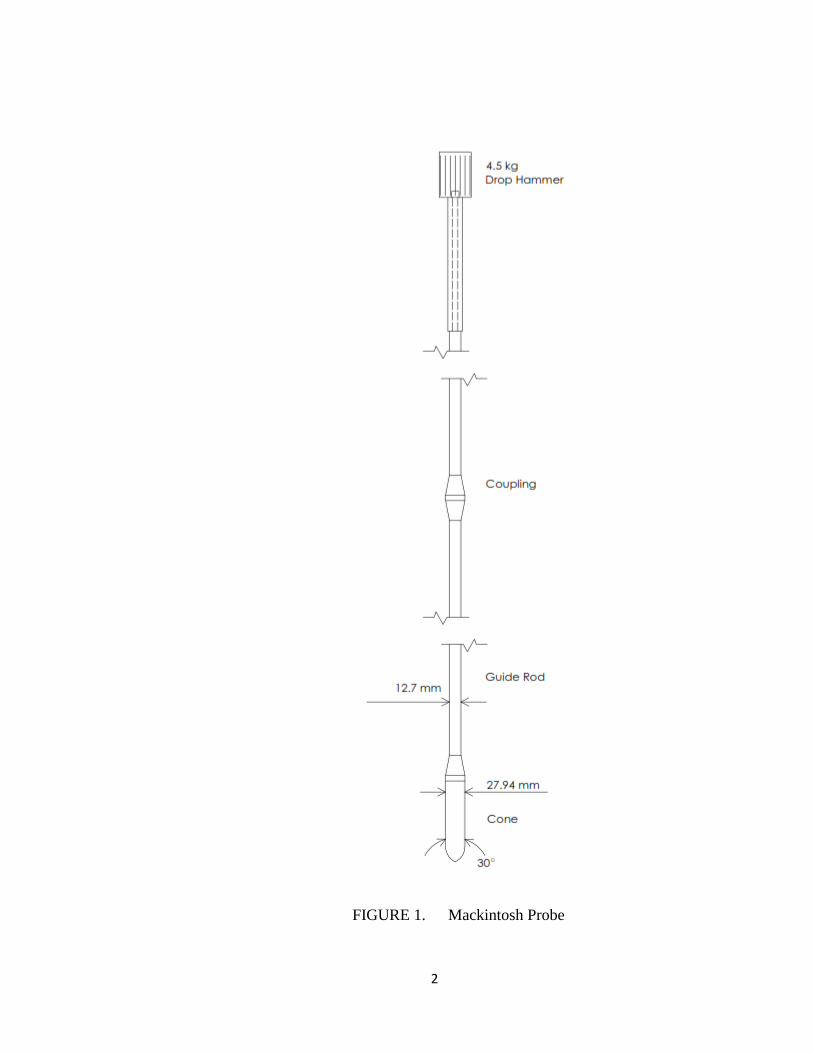
The apparatus for the Mackintosh Probe consists of high yield steel rod each
of length approximately 120cm. The rods are connected to each other by 25mm outer
diameter couplings. The cone’s diameter is 27.94mm with a 30o –apex angle; 12.7 mm
diameter solid rods and a 4.5kg dead weight with standard drop height of 300mm as
illustrated in Figure 1
2
FIGURE 1. Mackintosh Probe
3
1.1 Advantages of Mackintosh Probe
Fakher et al. (2005) briefly report the main advantages of the Mackintosh Probe
that are :
i. Speed of operation;
ii. Use in difficult terrain where access is poor;
iii. Minimal equipment and personnel are required;
iv. Equipment is very low cost;
v. Simplicity of operation and data recording/analysis;
vi. Use in the interpolation of soil strata and properties between trial pits and
boreholes;
vii. Reduces the number of boreholes required.
1.2 Disadvantages of Mackintosh Probe
Despite of the many advantages of the Mackintosh Probe, there are also many
disadvantages to this tool. The disadvantages are as follows:
i. Contribute to human error.
a. Wrong counting
b. Non-consistent drop height
c. Not accurately vertical when using of the tool
ii. This tool can only be used in shallow soil
iii. Unable to penetrate into medium strength.
iv. Depending on human strength limitation
v. Might injured the user.

4
1.3 Problem Statement
As reported by Fakher at al. (2005), in the introduction section, there are many
advantages of the Mackintosh Probe, but there are also some error and disadvantages of
Mackintosh Probe. According to Sew et. al (2000), human errors are also prone in this
method such as wrong counting, non-consistent drop height or exerting force to the drop
hammer giving misleading results. Therefore, many error might occur during this process
due to human error that cannot be prevented and this will affect the results of the
investigation.
The application of the Mackintosh Probe must be followed thoroughly as it might
affect the end result of the soil investigation. Sew at al. (2000) briefly wrote in their
research that the usage of the Mackintosh Probe, some of precautionary measures to
prevent errors in testing which are as follows :
i. Drop of hammer should be a free fall and consistent drop height.
ii. Components and apparatus properly washed and oiled.
Even though the Mackintosh Probe is said to be a light tool as cited by Fakher at
al.(2005), but the limitation of human strength will eventually become a factor of human
error because this tool tend to use a big portion of human energy in a long term usage.
5
1.4 Objectives of study
The main objectives of this study are as follows:
i. Designing and introducing the Nautical Gauge Mackintosh Probe (NGMP).
ii. Improving the usage of Mackintosh Probe in order to reduce errors.
iii. Comparing the results between the present Mackintosh Probe with the NGMP.
1.5 Scope of study
The scope of this study concentrate on the comparisons between results on the
present Mackintosh Probe with the NGMP. This study relies on data that is obtain in the
study area at Universiti Teknologi Petronas (UTP) region.
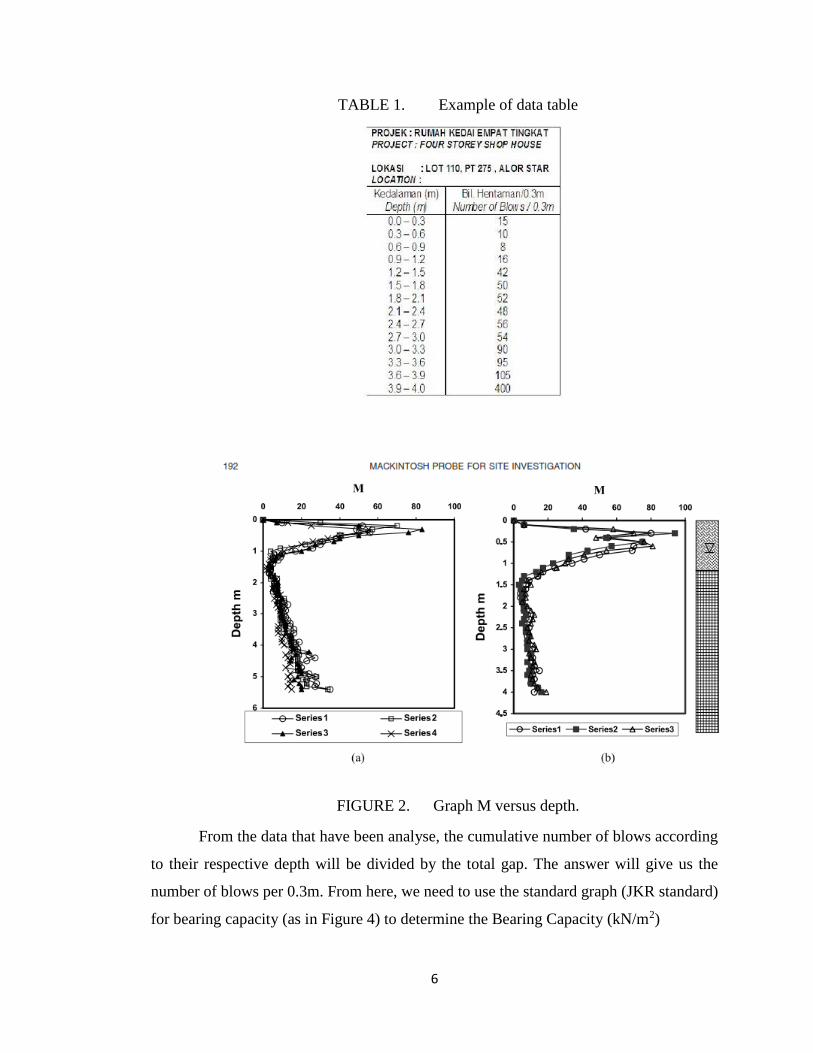
1.6 Mechanism of soil strength determination using Mackintosh Probe
To determine the soil strength using the Mackintosh Probe, the user must get the
data that is plot on a table according to the number of blows per 0.3m and depth. Figure
2 shows example of data table. From this data, the user have to form the graph of 100mm
penetration that is counted for (M) versus the depth, m. Figure 3 shows the graph that is
taken from Fakher et al. (2005). This graph is to obtain a rough estimation of the soil layer
at a point.
6
TABLE 1. Example of data table
FIGURE 2. Graph M versus depth.
From the data that have been analyse, the cumulative number of blows according
to their respective depth will be divided by the total gap. The answer will give us the
number of blows per 0.3m. From here, we need to use the standard graph (JKR standard)
for bearing capacity (as in Figure 4) to determine the Bearing Capacity (kN/m2)
7
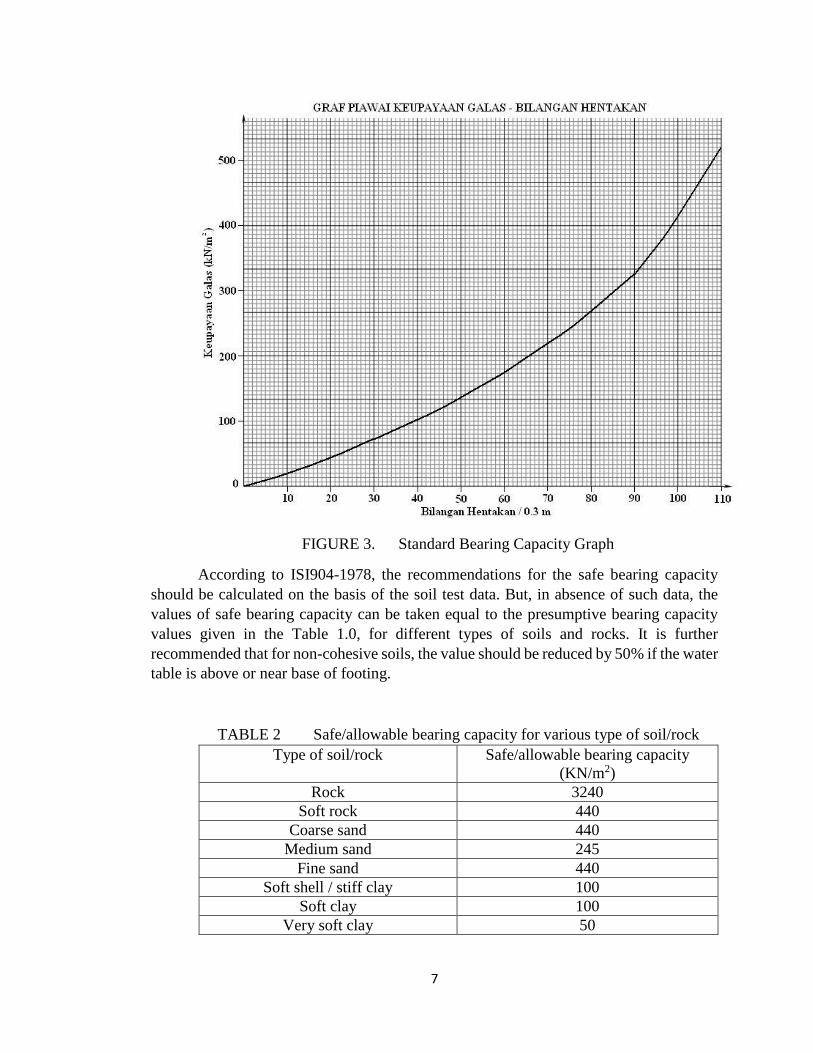
FIGURE 3. Standard Bearing Capacity Graph
According to ISI904-1978, the recommendations for the safe bearing capacity
should be calculated on the basis of the soil test data. But, in absence of such data, the
values of safe bearing capacity can be taken equal to the presumptive bearing capacity
values given in the Table 1.0, for different types of soils and rocks. It is further
recommended that for non-cohesive soils, the value should be reduced by 50% if the water
table is above or near base of footing.
TABLE 2 Safe/allowable bearing capacity for various type of soil/rock
Type of soil/rock Safe/allowable bearing capacity
(KN/m2)
Rock 3240
Soft rock 440
Coarse sand 440
Medium sand 245
Fine sand 440
Soft shell / stiff clay 100
Soft clay 100
Very soft clay 50
8
CHAPTER 2
LITERATURE REVIEW
2.0 LITERATURE REVIEW
Mackintosh Probe is usually used in preliminary soil investigation to acquire the
undrained shear strength (directly through correlations) and consistency of the subsoil
layering for very soft soils, Sew et. al (2000). Therefore, the application of this tool is
very important to the construction world as it affect the whole construction of structure.
There are many shape and model of Mackintosh Probe but this research will be
using the same model as Fakher et. al (2005) that consists of a 27.94 mm diameter cone
with a 30o –apex angle; 12.7 mm diameter solid rods and a 4.5kg dead weight with
standard drop height of 300mm as illustrated in Figure 1.
The usage of the Mackintosh Probe is very easy and the tools itself is light in
weight but it is also a boring tool to be used. As quote by Fakher et al.(2006), it is a tool
that is much faster and cheaper but boring, especially when the depth of exploration is
moderate and below ground is soft or loose investigation. In a human nature perspective,
the user tend to make error along the process of the investigation because of the tireless
feeling.
9
CHAPTER 3
METHODOLOGY
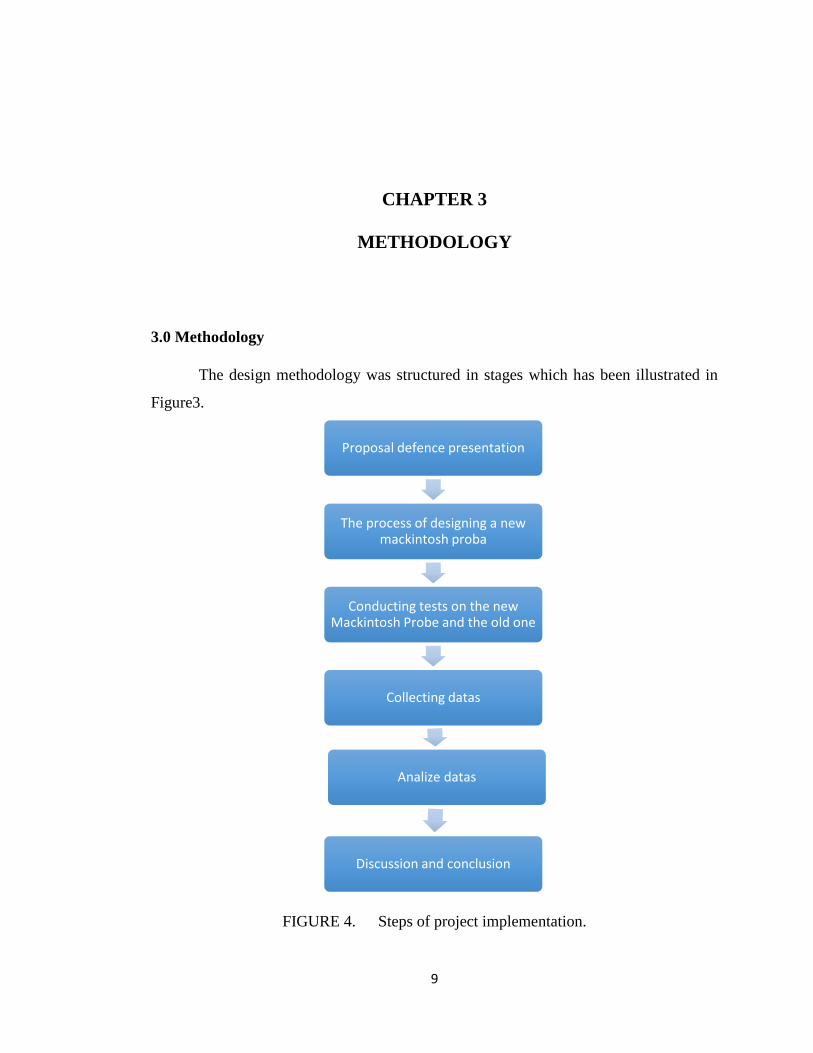
3.0 Methodology
The design methodology was structured in stages which has been illustrated in
Figure3.
FIGURE 4. Steps of project implementation.
Proposal defence presentation
The process of designing a new mackintosh proba
Conducting tests on the new Mackintosh Probe and the old one
Collecting datas
Analize datas
Discussion and conclusion

10
There are two results which will determine whether this project is successful or
the opposite. The results will based on the result’s differences between the old Mackintosh
Probe and the new Mackintosh Probe. If the results from the new Mackintosh Probe are
almost the same with the results from the old Mackintosh Probe, then the objective of this
studies is a success and vice versa. The results will be obtain from the procedure of the
Mackintosh Probe. The procedure of the old Mackintosh Probe are as follows:
i. Equipment for the test are assembled. The cone diameter is measured in SI
unit.
ii. The boring rods and hammer are joint using the rod coupling. Grease is sweep
up for an easy dissembles later.
iii. Distance of 0.3 m is measured and marked on the rod start from the tip of the
cone.
iv. The equipment is set up on the ground.
v. The hammer is pulled up until it reached the maximum. The hammer is
dropped freely to driven the cone into the soils.
vi. The sum of the number of blows for each 0.3m penetration is recorded in the
data sheet.
vii. The rod will continuously joint until :
a. The blow is more than 400 for 0.3m penetration.
b. The depth reached 15m
viii. Pull the rods using lifting tools after the penetration reached the requirement.
ix. The equipment are dissembled and cleaned before storing
11
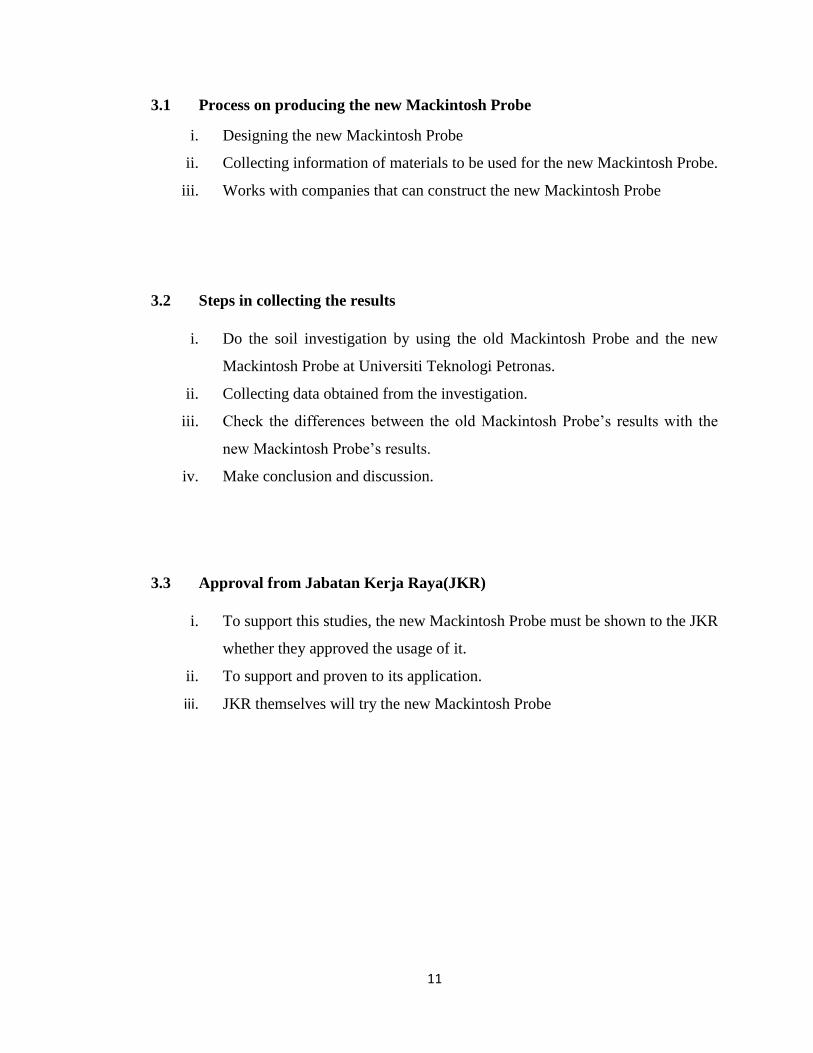
3.1 Process on producing the new Mackintosh Probe
i. Designing the new Mackintosh Probe
ii. Collecting information of materials to be used for the new Mackintosh Probe.
iii. Works with companies that can construct the new Mackintosh Probe
3.2 Steps in collecting the results
i. Do the soil investigation by using the old Mackintosh Probe and the new
Mackintosh Probe at Universiti Teknologi Petronas.
ii. Collecting data obtained from the investigation.
iii. Check the differences between the old Mackintosh Probe’s results with the
new Mackintosh Probe’s results.
iv. Make conclusion and discussion.
3.3 Approval from Jabatan Kerja Raya(JKR)
i. To support this studies, the new Mackintosh Probe must be shown to the JKR
whether they approved the usage of it.
ii. To support and proven to its application.
iii. JKR themselves will try the new Mackintosh Probe
12
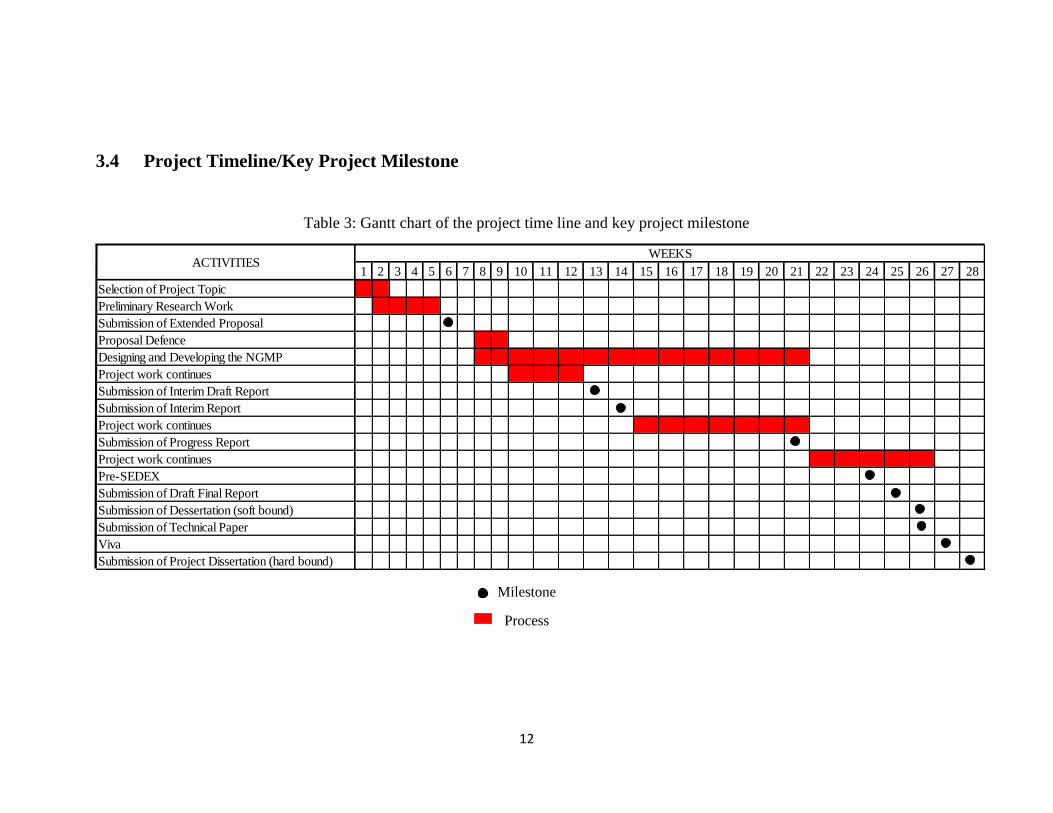
3.4 Project Timeline/Key Project Milestone
Table 3: Gantt chart of the project time line and key project milestone
Milestone
Process
1 2 3 4 5 6 7 8 9 10 11 12 13 14 15 16 17 18 19 20 21 22 23 24 25 26 27 28
Submission of Project Dissertation (hard bound)
Designing and Developing the NGMP
Project work continues
Pre-SEDEX
Submission of Draft Final Report
Submission of Dessertation (soft bound)
Submission of Technical Paper
Viva
Proposal Defence
Project work continues
Submission of Interim Draft Report
Submission of Interim Report
Project work continues
Submission of Progress Report
WEEKSACTIVITIES
Selection of Project Topic
Preliminary Research Work
Submission of Extended Proposal
13
3.5 Designing the Nautica Gauge Mackintosh Probe
3.5.1 Agreement with Arjafi Resources Sdn. Bhd
As a result from the discussion with Arjafi Resources Sdn. Bhd., an expert
welding company, they had agreed to jointly help the designing and building
process of the Nautica Gauge Mackintosh Probe.
RM Dagang Sdn. Bhd. had agreed to give their full services which
compromise of :-
i. Welding work expertise
ii. Consulting on the design
iii. Manpower and machineries
It is necessary to let the highly expertise companies, which is in the field of
welding, to produce the Nautica Gauge Mackintosh Probe. This is because the
welding process requires experience, qualified and expert workers in handling
such dangerous tools.
14
3.5.2 Designing Process of the NGMP
Further discussions and meetings had been arrange with Arjafi Resources
Sdn. Bhd to design the Nautical Gauge Mackintosh Probe. All of the designs had
been illustrate in Autodesk AutoCAD which gives the study a clearer view of any
negligence. Combining ideas and descriptions of the problems that have been
identified from the preliminary study had help RM Dagang to understand the
necessarily of their expertise skills.
Some rough ideas and sketches have been made to get an overview of the
Nautical Gauge Mackintosh Probe. All of the point of the problems had been
identify from further sketches before the final drawings were made. These
sketches was adapted using Autodesk AutoCAD to produce the blueprint of the
design.
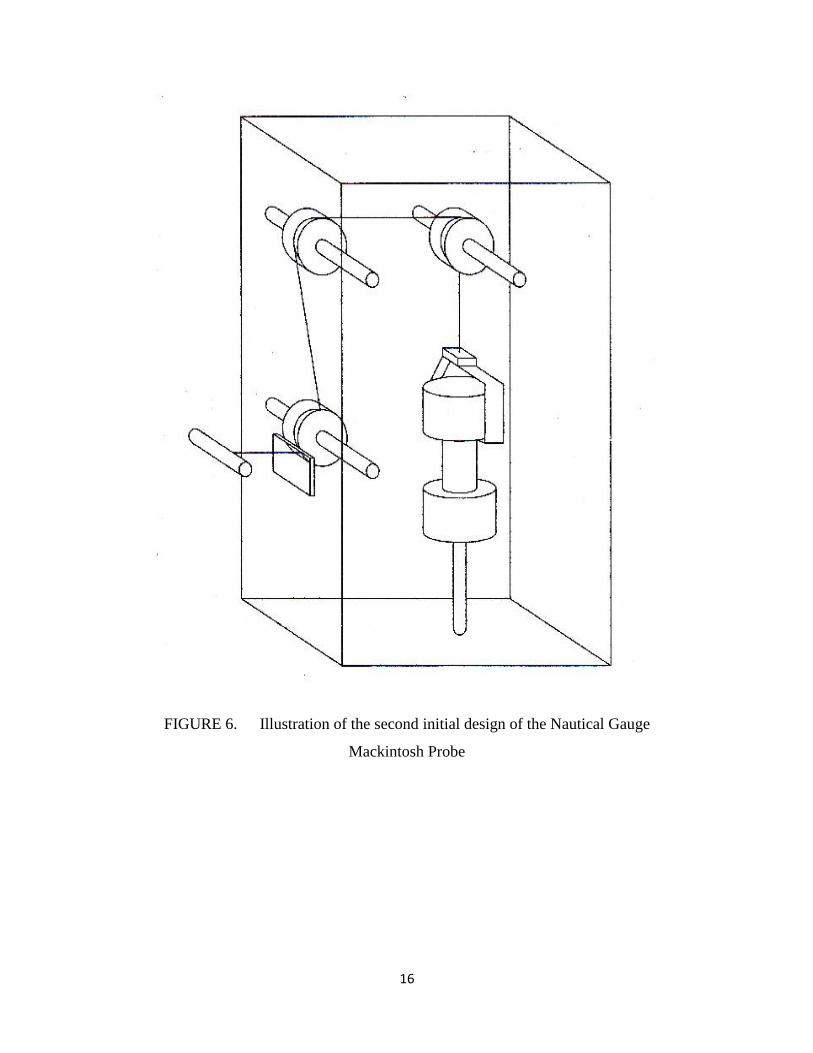
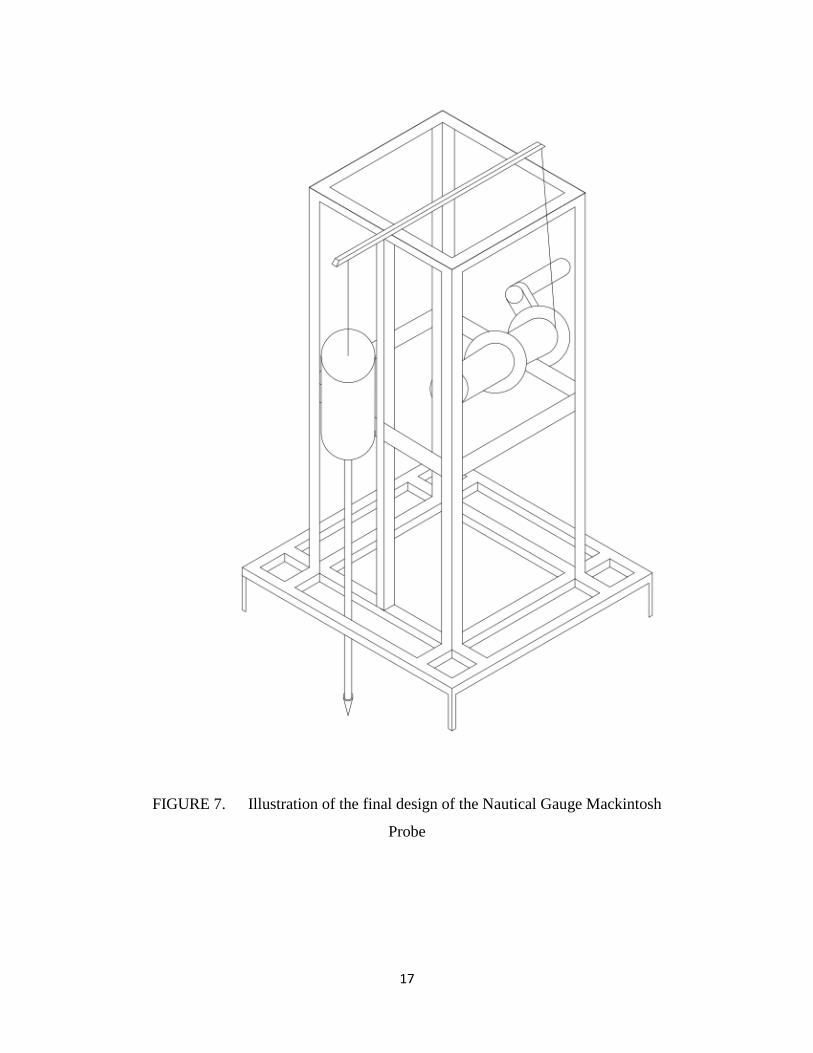
All of the layout needs to take account the capacity factor of the materials
that will be used for the production of the Nautical Gauge Mackintosh Probe. In
Figure 5 Figure 6 and Figure 7 illustrate some of the initial and final design of
the Nautical Gauge Mackintosh Probe.
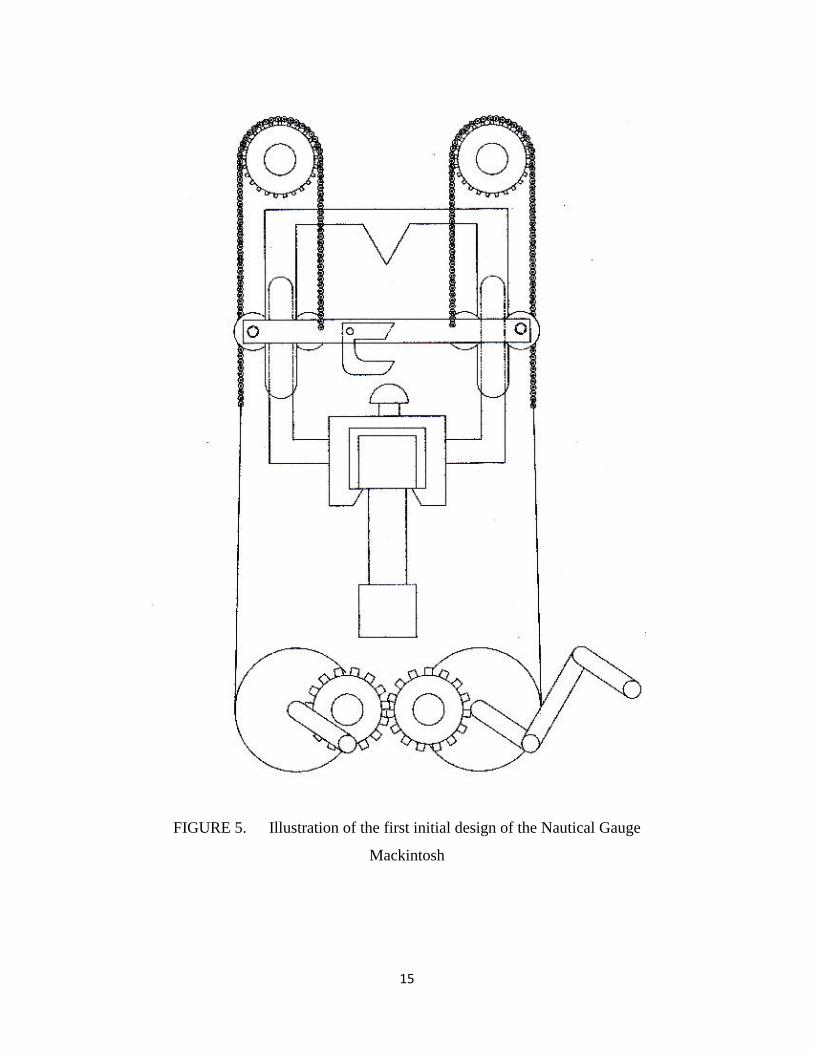
15
FIGURE 5. Illustration of the first initial design of the Nautical Gauge
Mackintosh
16
FIGURE 6. Illustration of the second initial design of the Nautical Gauge
Mackintosh Probe
17
FIGURE 7. Illustration of the final design of the Nautical Gauge Mackintosh
Probe
18
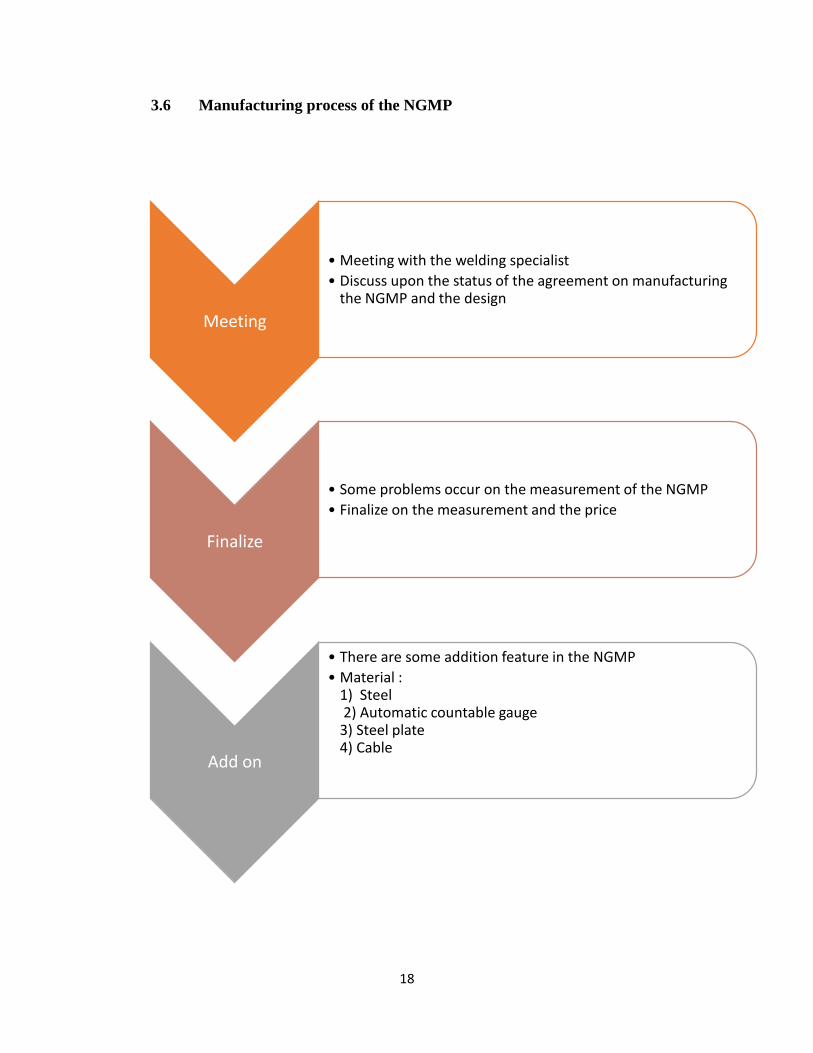
3.6 Manufacturing process of the NGMP
Meeting
• Meeting with the welding specialist
• Discuss upon the status of the agreement on manufacturing the NGMP and the design
Finalize
• Some problems occur on the measurement of the NGMP
• Finalize on the measurement and the price
Add on
• There are some addition feature in the NGMP
• Material :1) Steel2) Automatic countable gauge
3) Steel plate4) Cable
19
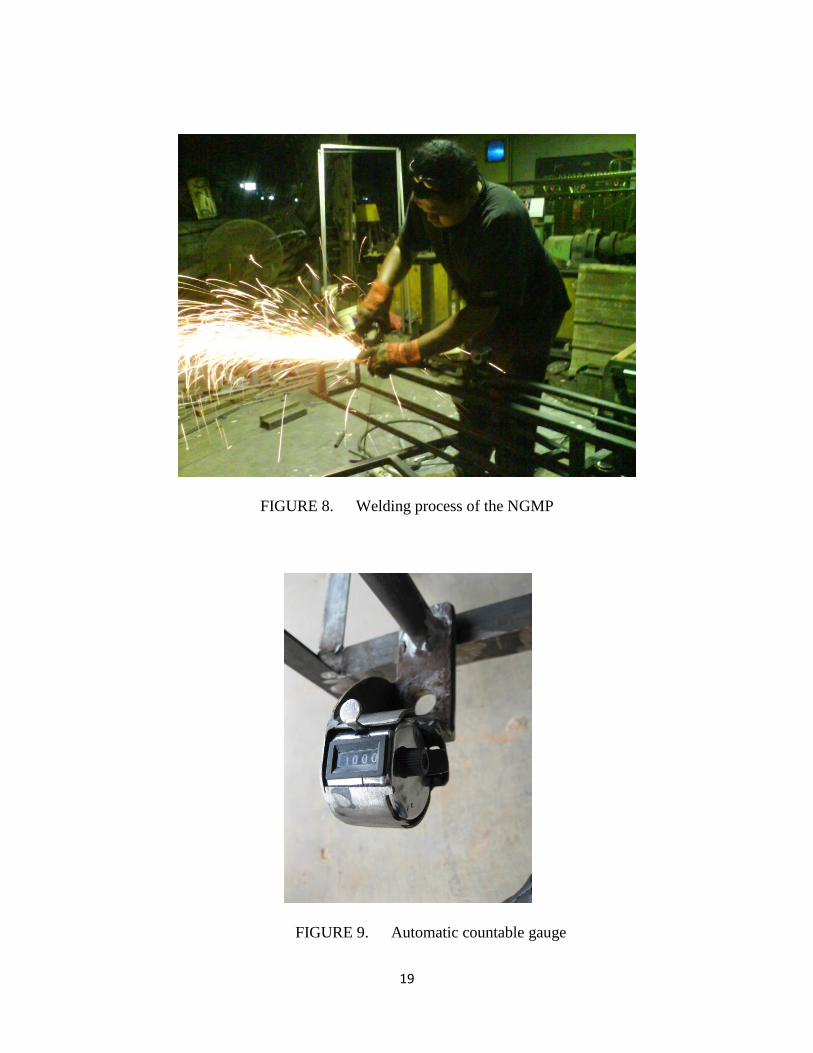
FIGURE 8. Welding process of the NGMP
FIGURE 9. Automatic countable gauge
20
3.7 Testing process of the NGMP
The process of manufacturing of the Nautica Gauge Mackintosh Probe
took 3 month. Thus, along the process of it, there are some verification and
adjustment that had been done. Once the NGMP had been transported to UTP,
the author had tested it.
In this research, the result to determine whether this research is a success
is determine thoroughly on the comparison between the result of the present
Mackintosh Probe and the result of the NGMP.
All of tests had been carried out inside of UTP ground and the result had
been collected and analysed which to ensure whether the objective had been
achieved or not.
21
CHAPTER 4
RESULT AND DISCUSSION
4. RESULT AND DISCUSSION
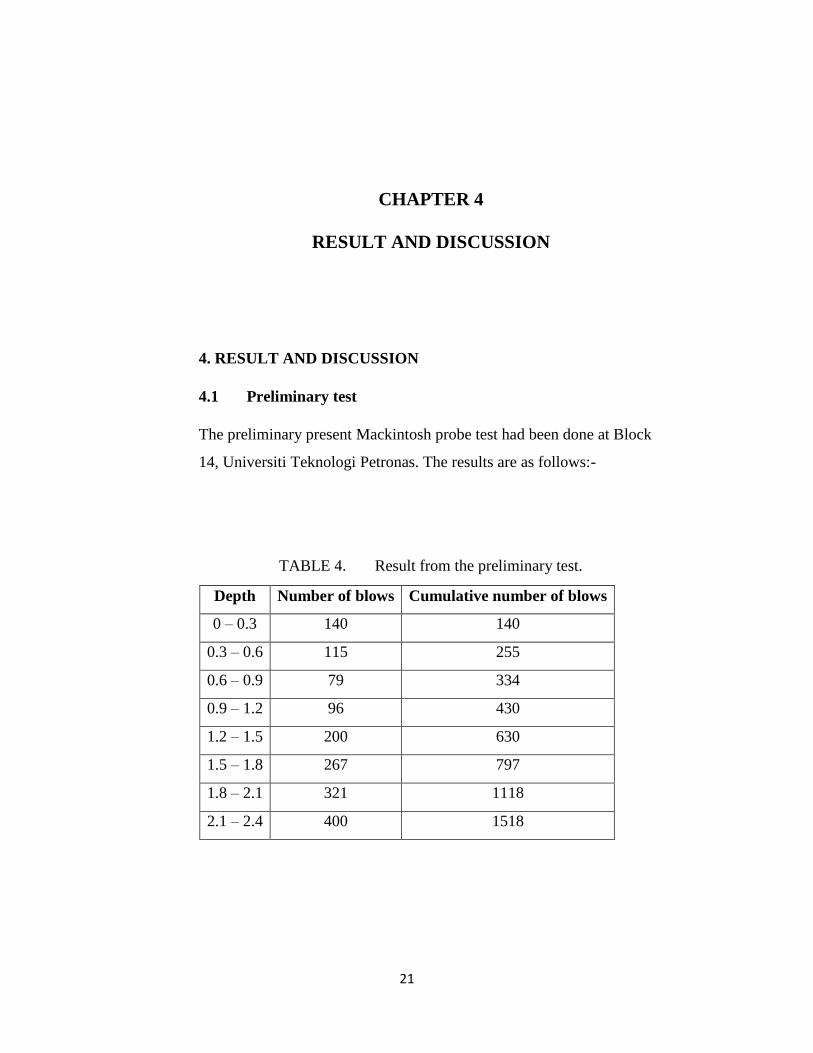
4.1 Preliminary test
The preliminary present Mackintosh probe test had been done at Block
14, Universiti Teknologi Petronas. The results are as follows:-
TABLE 4. Result from the preliminary test.
Depth Number of blows Cumulative number of blows
0 – 0.3 140 140
0.3 – 0.6 115 255
0.6 – 0.9 79 334
0.9 – 1.2 96 430
1.2 – 1.5 200 630
1.5 – 1.8 267 797
1.8 – 2.1 321 1118
2.1 – 2.4 400 1518
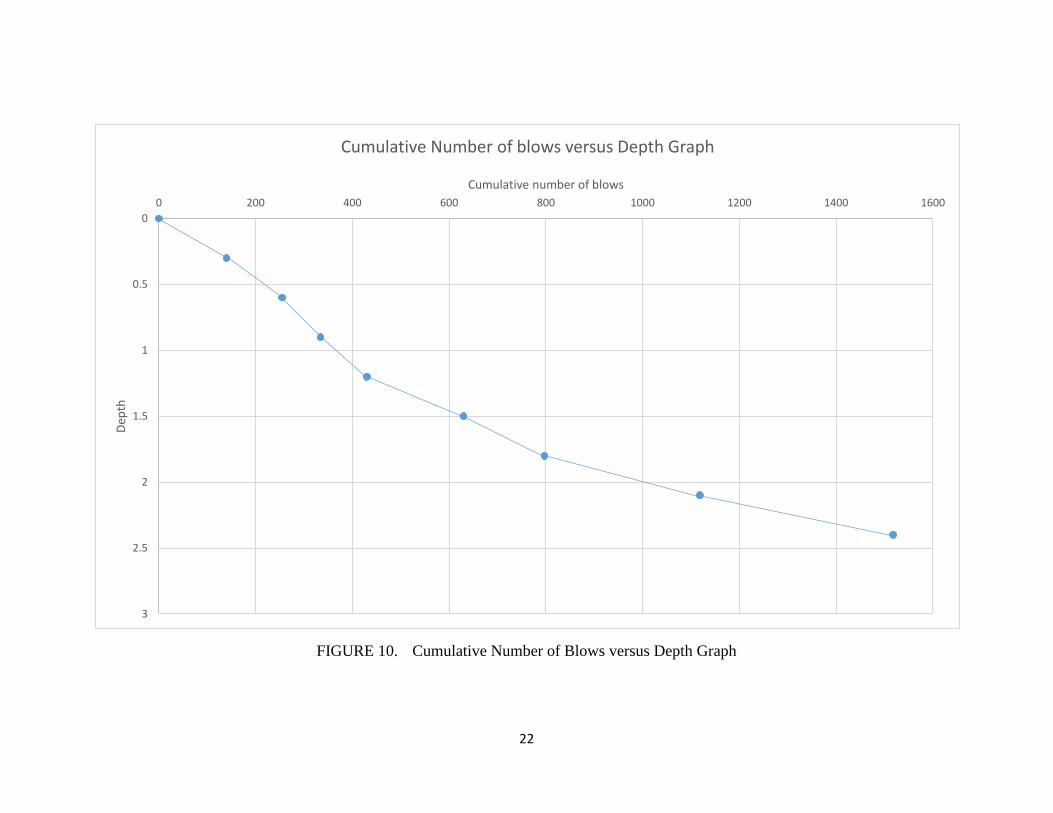
22
FIGURE 10. Cumulative Number of Blows versus Depth Graph
0
0.5
1
1.5
2
2.5
3
0 200 400 600 800 1000 1200 1400 1600
Dep
th
Cumulative number of blows
Cumulative Number of blows versus Depth Graph
23
0
0.5
1
1.5
2
2.5
3
0 200 400 600 800 1000 1200 1400 1600
Dep
th
Cumulative number of blows
Cumulative Number of blows versus Depth Graph
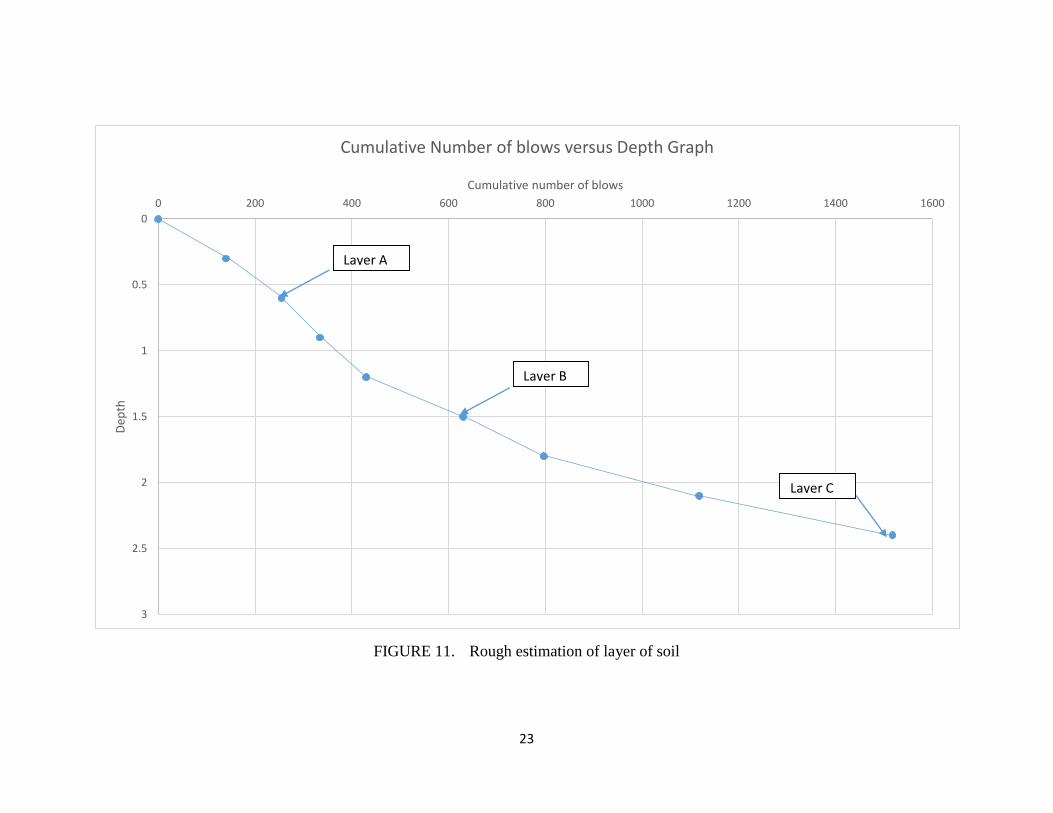
FIGURE 11. Rough estimation of layer of soil
Layer A
Layer B
Layer C
24
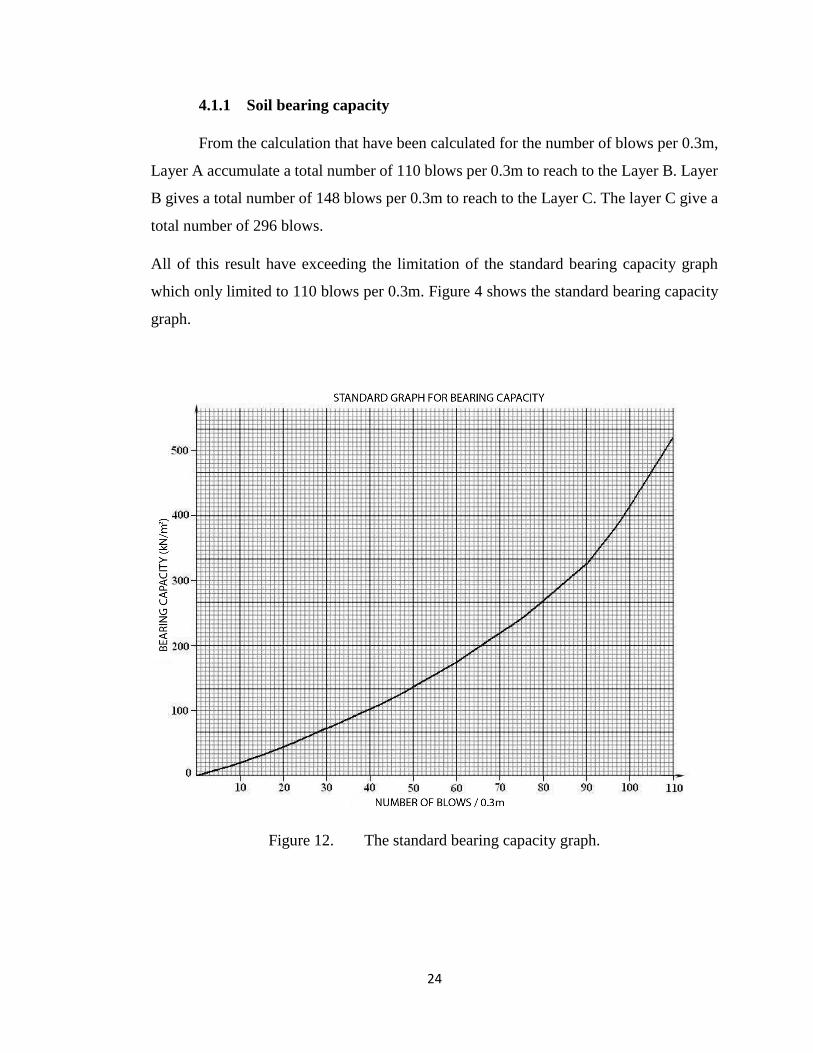
4.1.1 Soil bearing capacity
From the calculation that have been calculated for the number of blows per 0.3m,
Layer A accumulate a total number of 110 blows per 0.3m to reach to the Layer B. Layer
B gives a total number of 148 blows per 0.3m to reach to the Layer C. The layer C give a
total number of 296 blows.
All of this result have exceeding the limitation of the standard bearing capacity graph
which only limited to 110 blows per 0.3m. Figure 4 shows the standard bearing capacity
graph.
Figure 12. The standard bearing capacity graph.
25
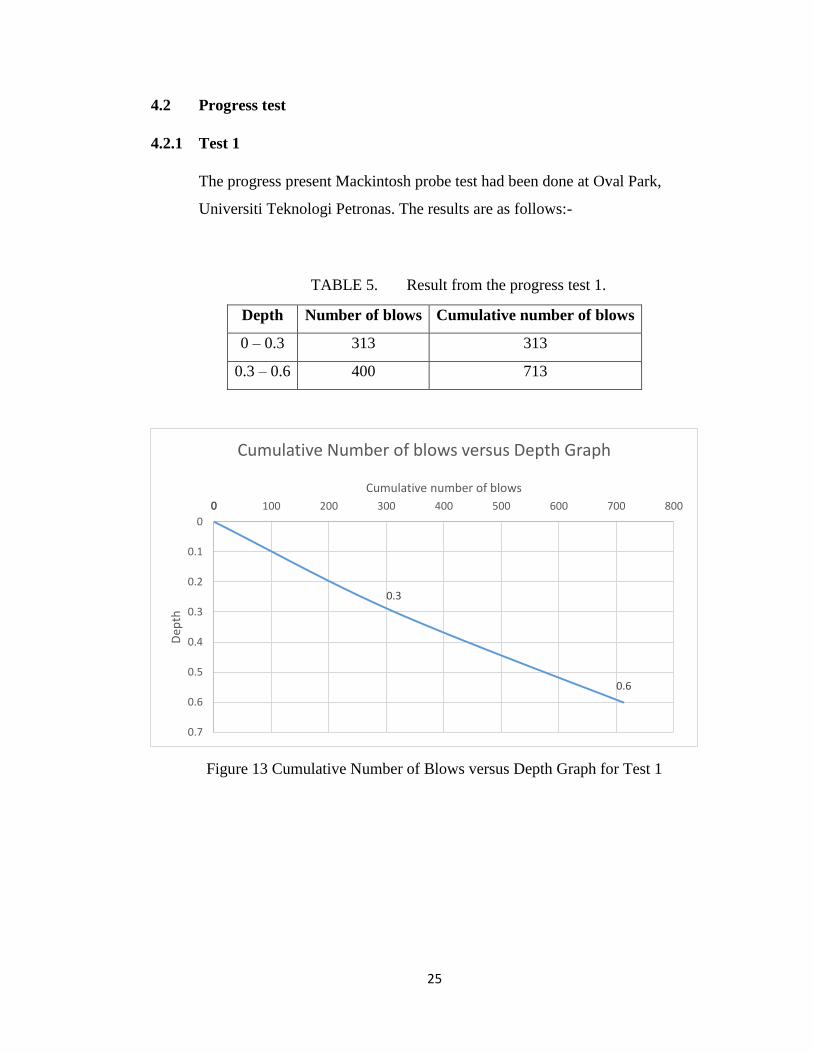
4.2 Progress test
4.2.1 Test 1
The progress present Mackintosh probe test had been done at Oval Park,
Universiti Teknologi Petronas. The results are as follows:-
TABLE 5. Result from the progress test 1.
Depth Number of blows Cumulative number of blows
0 – 0.3 313 313
0.3 – 0.6 400 713
Figure 13 Cumulative Number of Blows versus Depth Graph for Test 1
0
0.3
0.6
0
0.1
0.2
0.3
0.4
0.5
0.6
0.7
0 100 200 300 400 500 600 700 800
Dep
th
Cumulative number of blows
Cumulative Number of blows versus Depth Graph
26
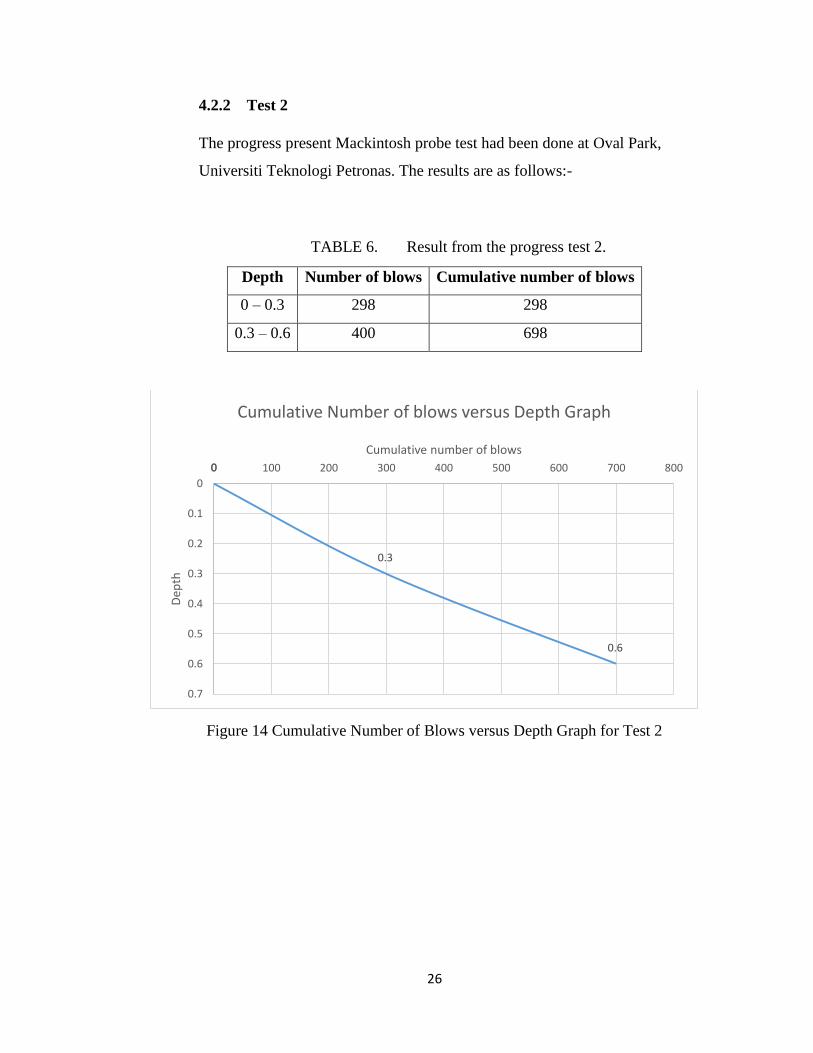
4.2.2 Test 2
The progress present Mackintosh probe test had been done at Oval Park,
Universiti Teknologi Petronas. The results are as follows:-
TABLE 6. Result from the progress test 2.
Depth Number of blows Cumulative number of blows
0 – 0.3 298 298
0.3 – 0.6 400 698
Figure 14 Cumulative Number of Blows versus Depth Graph for Test 2
0
0.3
0.6
0
0.1
0.2
0.3
0.4
0.5
0.6
0.7
0 100 200 300 400 500 600 700 800
Dep
th
Cumulative number of blows
Cumulative Number of blows versus Depth Graph
27
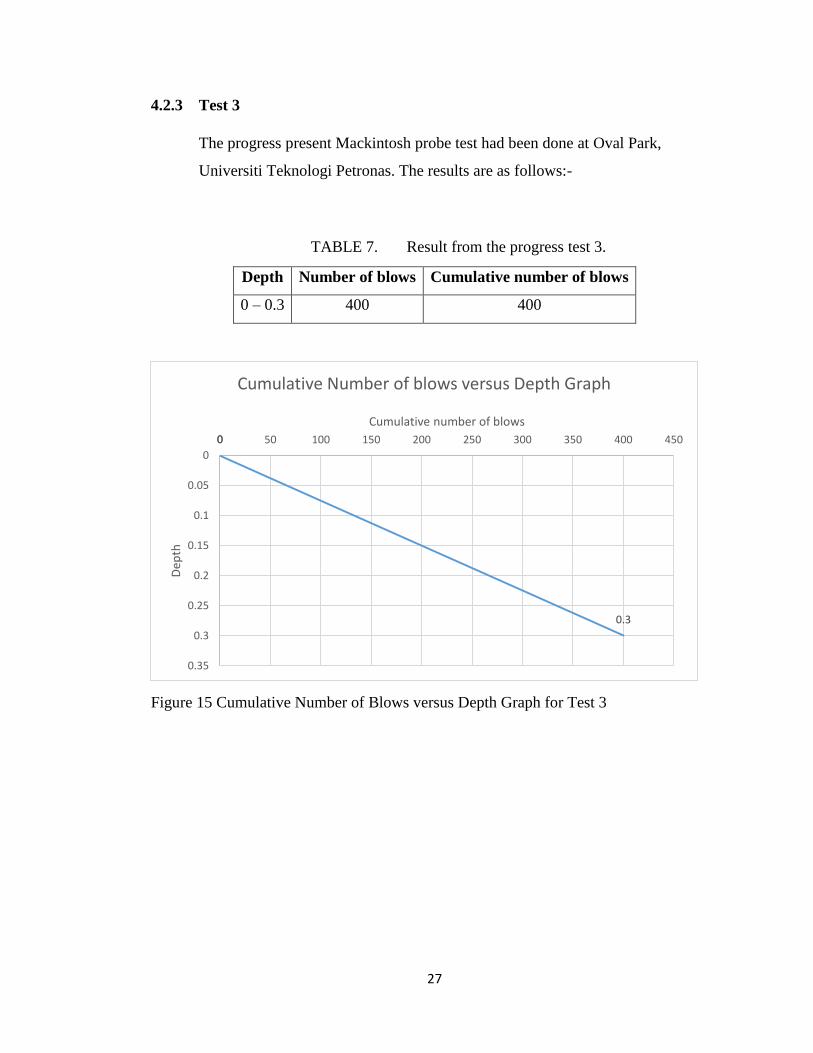
4.2.3 Test 3
The progress present Mackintosh probe test had been done at Oval Park,
Universiti Teknologi Petronas. The results are as follows:-
TABLE 7. Result from the progress test 3.
Depth Number of blows Cumulative number of blows
0 – 0.3 400 400
Figure 15 Cumulative Number of Blows versus Depth Graph for Test 3
0
0.3
0
0.05
0.1
0.15
0.2
0.25
0.3
0.35
0 50 100 150 200 250 300 350 400 450
Dep
th
Cumulative number of blows
Cumulative Number of blows versus Depth Graph
28
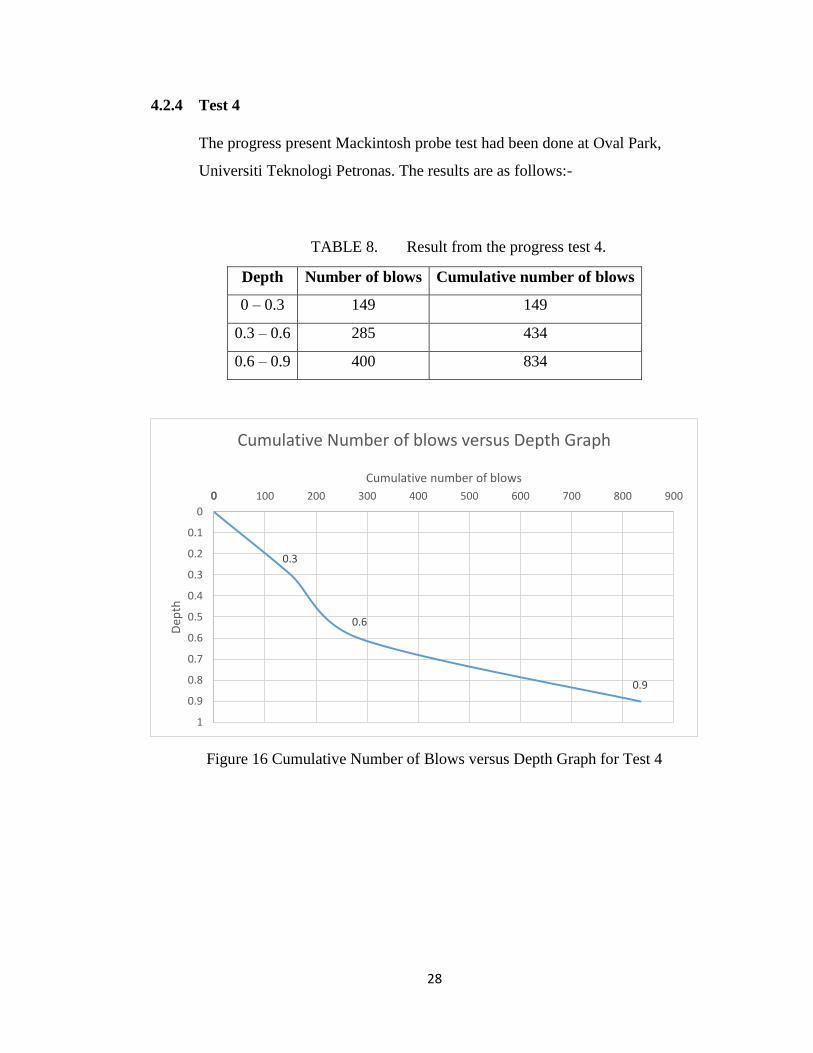
4.2.4 Test 4
The progress present Mackintosh probe test had been done at Oval Park,
Universiti Teknologi Petronas. The results are as follows:-
TABLE 8. Result from the progress test 4.
Depth Number of blows Cumulative number of blows
0 – 0.3 149 149
0.3 – 0.6 285 434
0.6 – 0.9 400 834
Figure 16 Cumulative Number of Blows versus Depth Graph for Test 4
0
0.3
0.6
0.9
0
0.1
0.2
0.3
0.4
0.5
0.6
0.7
0.8
0.9
1
0 100 200 300 400 500 600 700 800 900
Dep
th
Cumulative number of blows
Cumulative Number of blows versus Depth Graph
29
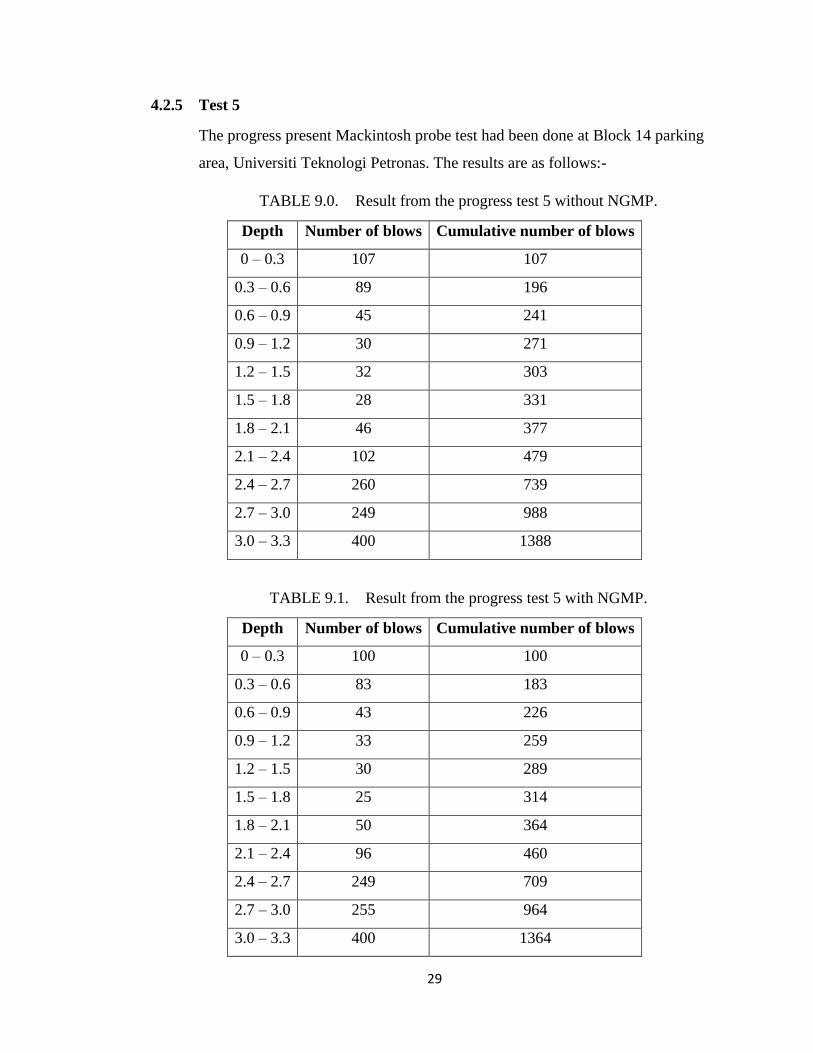
4.2.5 Test 5
The progress present Mackintosh probe test had been done at Block 14 parking
area, Universiti Teknologi Petronas. The results are as follows:-
TABLE 9.0. Result from the progress test 5 without NGMP.
Depth Number of blows Cumulative number of blows
0 – 0.3 107 107
0.3 – 0.6 89 196
0.6 – 0.9 45 241
0.9 – 1.2 30 271
1.2 – 1.5 32 303
1.5 – 1.8 28 331
1.8 – 2.1 46 377
2.1 – 2.4 102 479
2.4 – 2.7 260 739
2.7 – 3.0 249 988
3.0 – 3.3 400 1388
TABLE 9.1. Result from the progress test 5 with NGMP.
Depth Number of blows Cumulative number of blows
0 – 0.3 100 100
0.3 – 0.6 83 183
0.6 – 0.9 43 226
0.9 – 1.2 33 259
1.2 – 1.5 30 289
1.5 – 1.8 25 314
1.8 – 2.1 50 364
2.1 – 2.4 96 460
2.4 – 2.7 249 709
2.7 – 3.0 255 964
3.0 – 3.3 400 1364
30
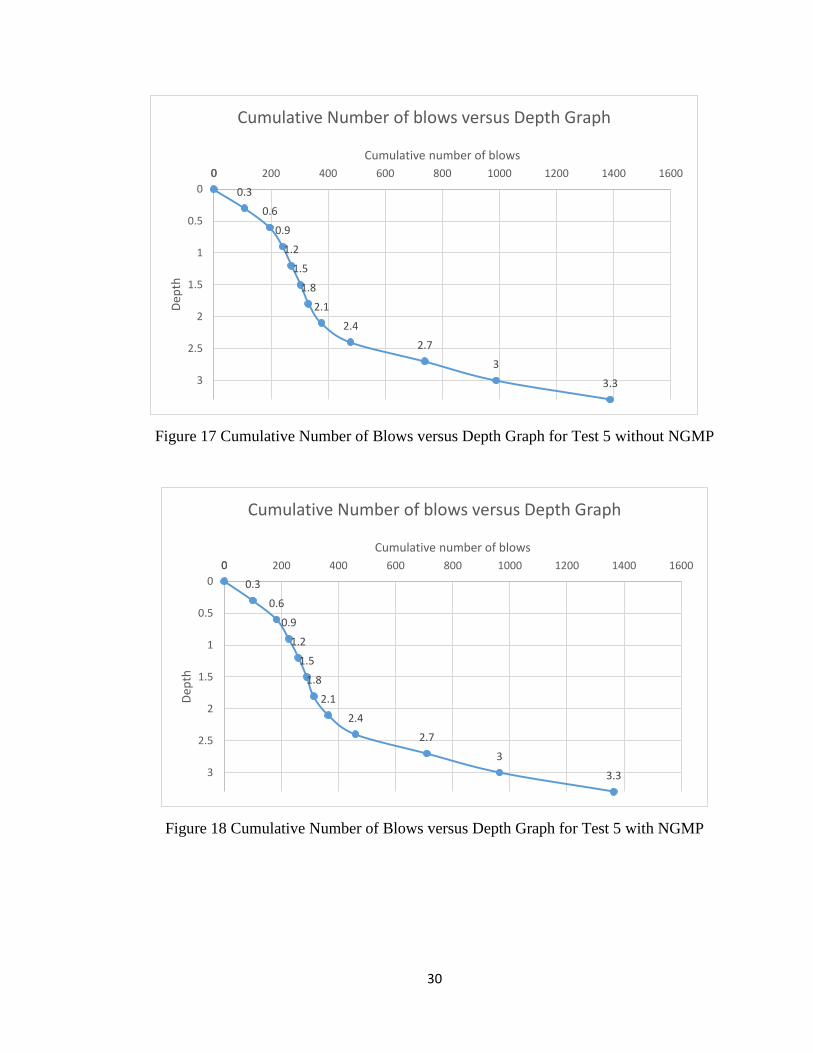
Figure 17 Cumulative Number of Blows versus Depth Graph for Test 5 without NGMP
Figure 18 Cumulative Number of Blows versus Depth Graph for Test 5 with NGMP
0
0.3
0.6
0.9
1.2
1.5
1.8
2.1
2.4
2.7
3
3.3
0
0.5
1
1.5
2
2.5
3
0 200 400 600 800 1000 1200 1400 1600D
epth
Cumulative number of blows
Cumulative Number of blows versus Depth Graph
0
0.3
0.6
0.9
1.2
1.5
1.8
2.1
2.4
2.7
3
3.3
0
0.5
1
1.5
2
2.5
3
0 200 400 600 800 1000 1200 1400 1600
Dep
th
Cumulative number of blows
Cumulative Number of blows versus Depth Graph
31
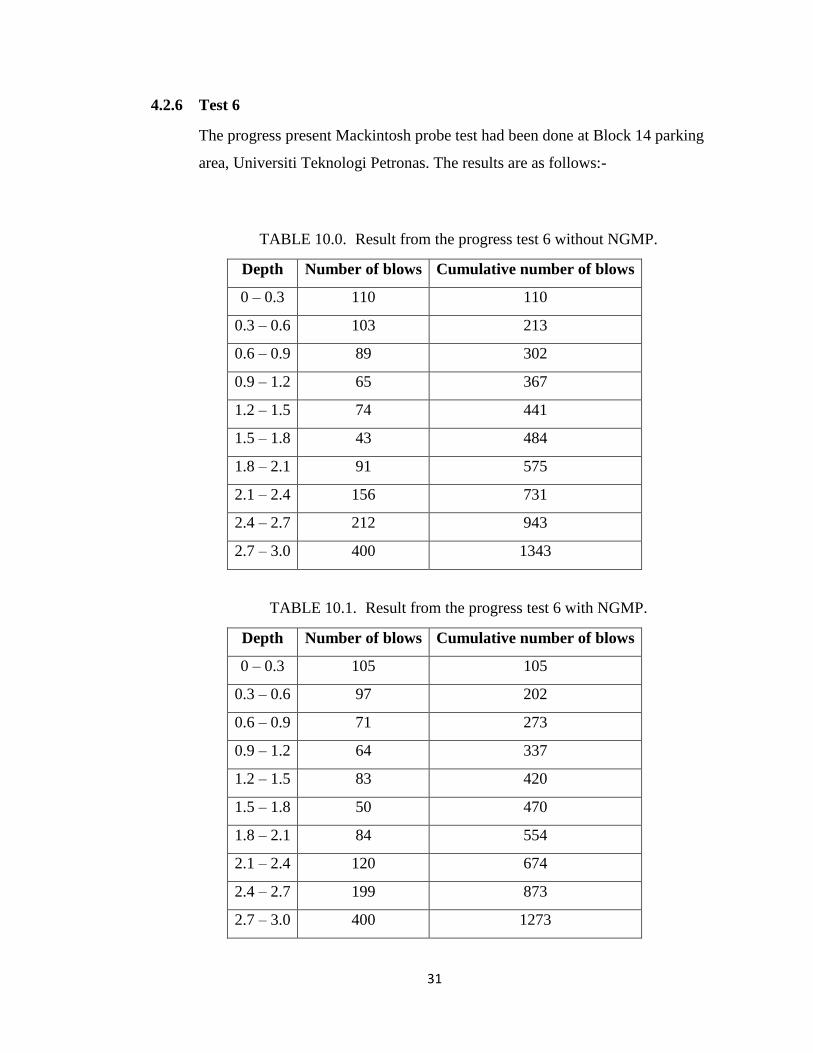
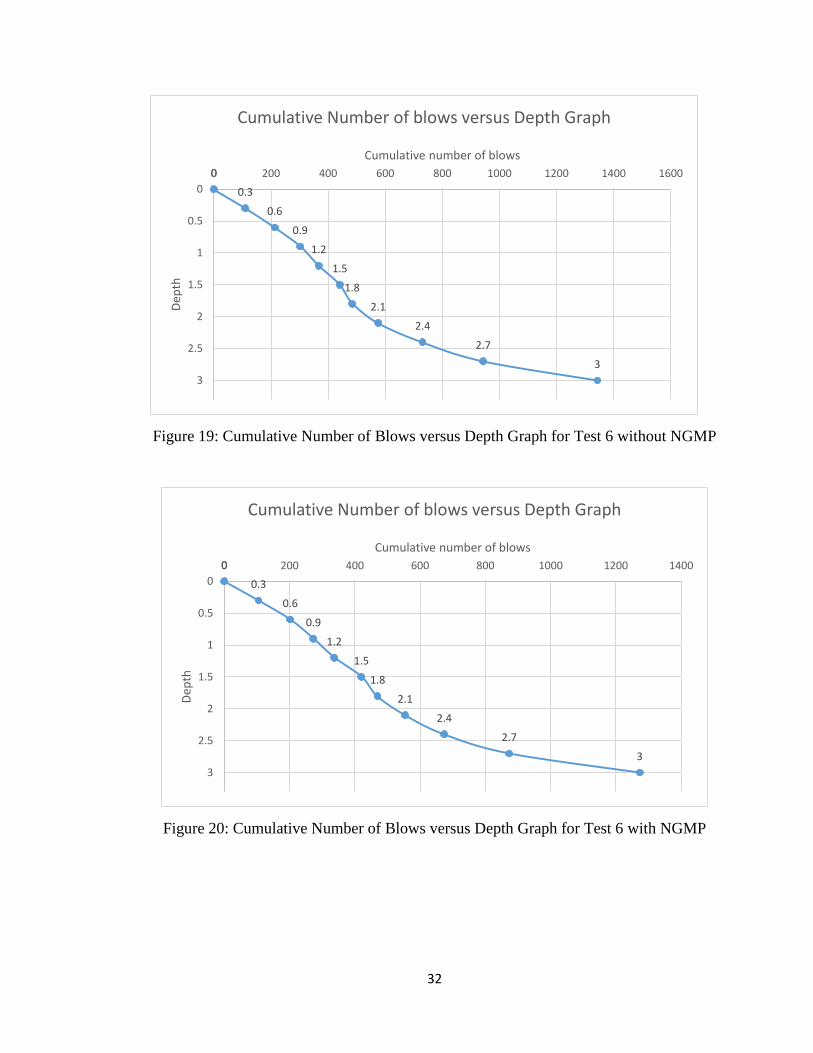
4.2.6 Test 6
The progress present Mackintosh probe test had been done at Block 14 parking
area, Universiti Teknologi Petronas. The results are as follows:-
TABLE 10.0. Result from the progress test 6 without NGMP.
Depth Number of blows Cumulative number of blows
0 – 0.3 110 110
0.3 – 0.6 103 213
0.6 – 0.9 89 302
0.9 – 1.2 65 367
1.2 – 1.5 74 441
1.5 – 1.8 43 484
1.8 – 2.1 91 575
2.1 – 2.4 156 731
2.4 – 2.7 212 943
2.7 – 3.0 400 1343
TABLE 10.1. Result from the progress test 6 with NGMP.
Depth Number of blows Cumulative number of blows
0 – 0.3 105 105
0.3 – 0.6 97 202
0.6 – 0.9 71 273
0.9 – 1.2 64 337
1.2 – 1.5 83 420
1.5 – 1.8 50 470
1.8 – 2.1 84 554
2.1 – 2.4 120 674
2.4 – 2.7 199 873
2.7 – 3.0 400 1273
32
Figure 19: Cumulative Number of Blows versus Depth Graph for Test 6 without NGMP
Figure 20: Cumulative Number of Blows versus Depth Graph for Test 6 with NGMP
0
0.3
0.6
0.9
1.2
1.5
1.8
2.1
2.4
2.7
3
0
0.5
1
1.5
2
2.5
3
0 200 400 600 800 1000 1200 1400 1600D
epth
Cumulative number of blows
Cumulative Number of blows versus Depth Graph
0
0.3
0.6
0.9
1.2
1.5
1.8
2.1
2.4
2.7
3
0
0.5
1
1.5
2
2.5
3
0 200 400 600 800 1000 1200 1400
Dep
th
Cumulative number of blows
Cumulative Number of blows versus Depth Graph
33
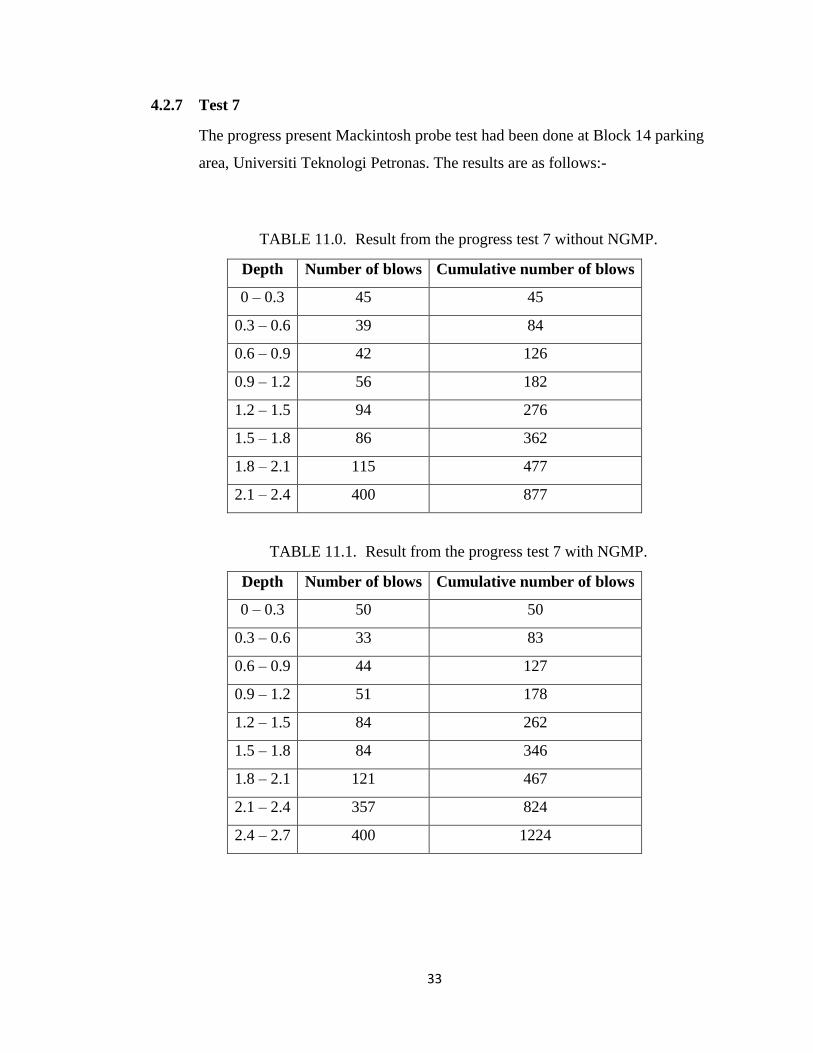
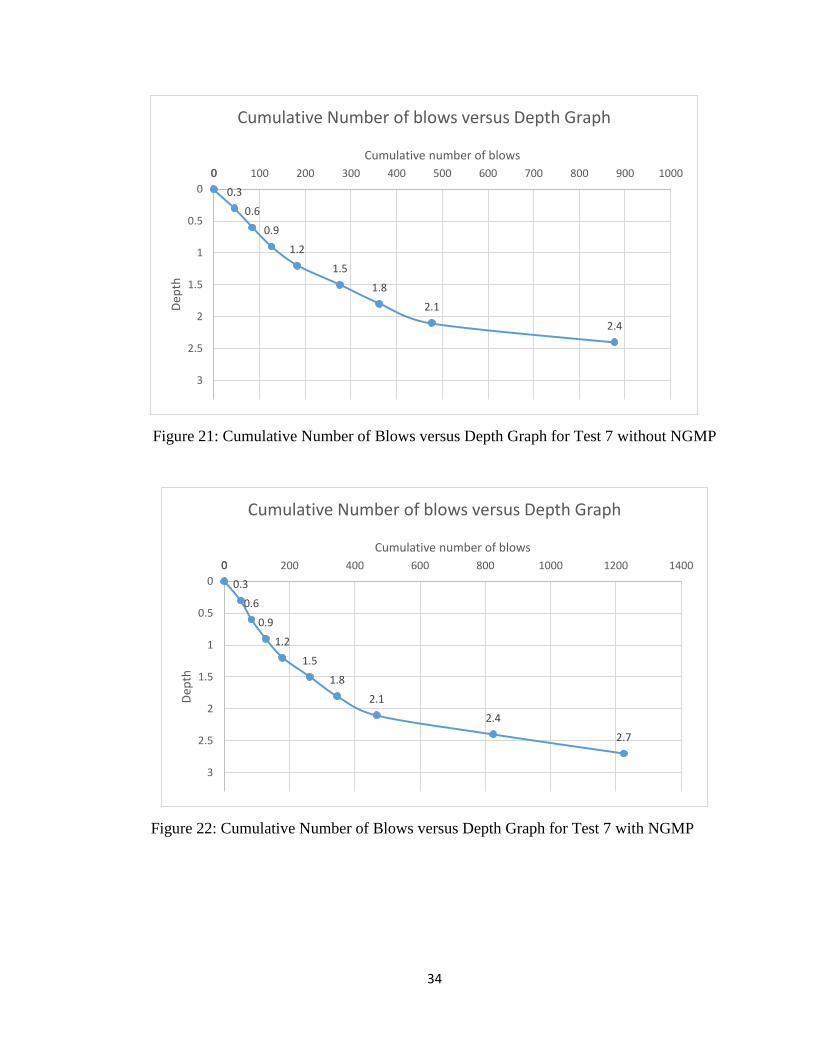
4.2.7 Test 7
The progress present Mackintosh probe test had been done at Block 14 parking
area, Universiti Teknologi Petronas. The results are as follows:-
TABLE 11.0. Result from the progress test 7 without NGMP.
Depth Number of blows Cumulative number of blows
0 – 0.3 45 45
0.3 – 0.6 39 84
0.6 – 0.9 42 126
0.9 – 1.2 56 182
1.2 – 1.5 94 276
1.5 – 1.8 86 362
1.8 – 2.1 115 477
2.1 – 2.4 400 877
TABLE 11.1. Result from the progress test 7 with NGMP.
Depth Number of blows Cumulative number of blows
0 – 0.3 50 50
0.3 – 0.6 33 83
0.6 – 0.9 44 127
0.9 – 1.2 51 178
1.2 – 1.5 84 262
1.5 – 1.8 84 346
1.8 – 2.1 121 467
2.1 – 2.4 357 824
2.4 – 2.7 400 1224
34
Figure 21: Cumulative Number of Blows versus Depth Graph for Test 7 without NGMP
Figure 22: Cumulative Number of Blows versus Depth Graph for Test 7 with NGMP
0
0.3
0.6
0.9
1.2
1.5
1.8
2.1
2.4
0
0.5
1
1.5
2
2.5
3
0 100 200 300 400 500 600 700 800 900 1000D
epth
Cumulative number of blows
Cumulative Number of blows versus Depth Graph
0
0.3
0.6
0.9
1.2
1.5
1.8
2.1
2.4
2.7
0
0.5
1
1.5
2
2.5
3
0 200 400 600 800 1000 1200 1400
Dep
th
Cumulative number of blows
Cumulative Number of blows versus Depth Graph
35
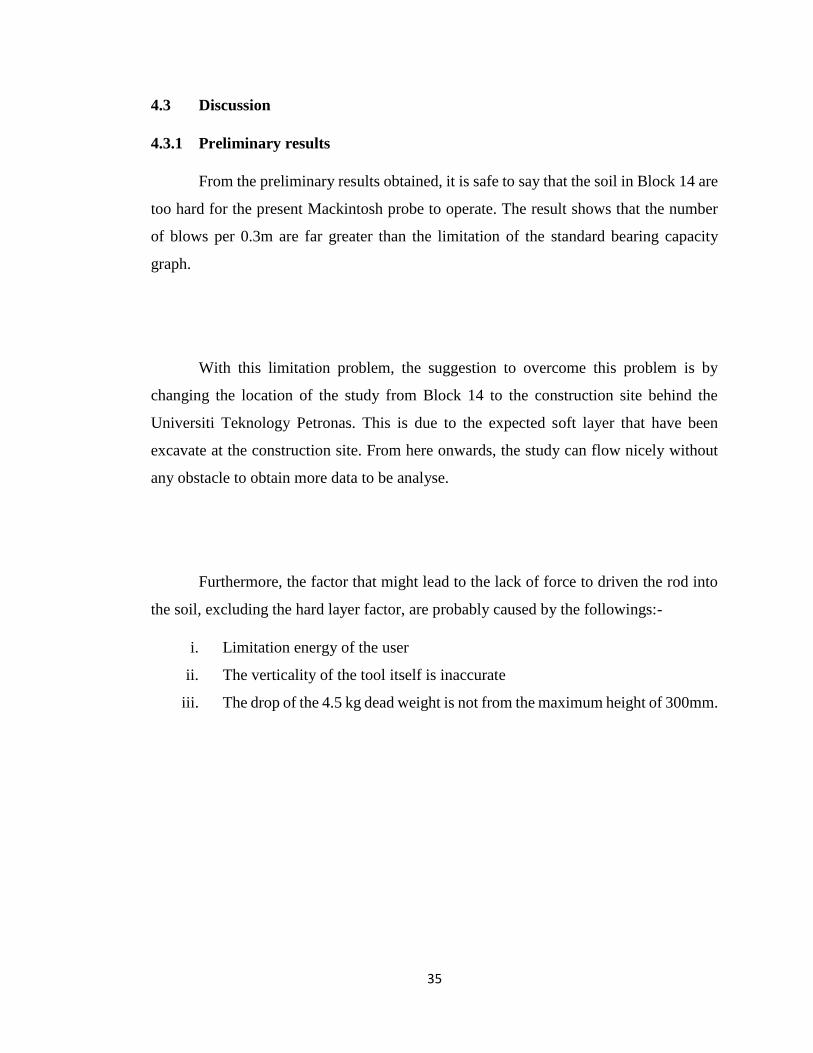
4.3 Discussion
4.3.1 Preliminary results
From the preliminary results obtained, it is safe to say that the soil in Block 14 are
too hard for the present Mackintosh probe to operate. The result shows that the number
of blows per 0.3m are far greater than the limitation of the standard bearing capacity
graph.
With this limitation problem, the suggestion to overcome this problem is by
changing the location of the study from Block 14 to the construction site behind the
Universiti Teknology Petronas. This is due to the expected soft layer that have been
excavate at the construction site. From here onwards, the study can flow nicely without
any obstacle to obtain more data to be analyse.
Furthermore, the factor that might lead to the lack of force to driven the rod into
the soil, excluding the hard layer factor, are probably caused by the followings:-
i. Limitation energy of the user
ii. The verticality of the tool itself is inaccurate
iii. The drop of the 4.5 kg dead weight is not from the maximum height of 300mm.
36
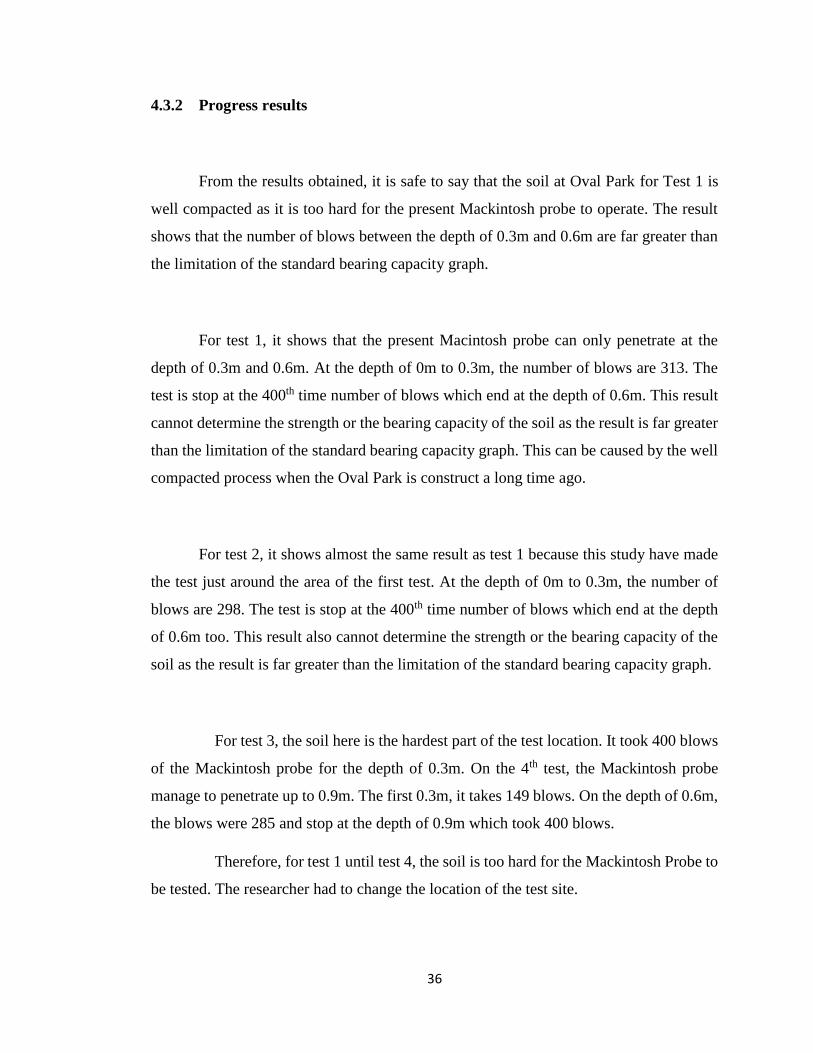
4.3.2 Progress results
From the results obtained, it is safe to say that the soil at Oval Park for Test 1 is
well compacted as it is too hard for the present Mackintosh probe to operate. The result
shows that the number of blows between the depth of 0.3m and 0.6m are far greater than
the limitation of the standard bearing capacity graph.
For test 1, it shows that the present Macintosh probe can only penetrate at the
depth of 0.3m and 0.6m. At the depth of 0m to 0.3m, the number of blows are 313. The
test is stop at the 400th time number of blows which end at the depth of 0.6m. This result
cannot determine the strength or the bearing capacity of the soil as the result is far greater
than the limitation of the standard bearing capacity graph. This can be caused by the well
compacted process when the Oval Park is construct a long time ago.
For test 2, it shows almost the same result as test 1 because this study have made
the test just around the area of the first test. At the depth of 0m to 0.3m, the number of
blows are 298. The test is stop at the 400th time number of blows which end at the depth
of 0.6m too. This result also cannot determine the strength or the bearing capacity of the
soil as the result is far greater than the limitation of the standard bearing capacity graph.
For test 3, the soil here is the hardest part of the test location. It took 400 blows
of the Mackintosh probe for the depth of 0.3m. On the 4th test, the Mackintosh probe
manage to penetrate up to 0.9m. The first 0.3m, it takes 149 blows. On the depth of 0.6m,
the blows were 285 and stop at the depth of 0.9m which took 400 blows.
Therefore, for test 1 until test 4, the soil is too hard for the Mackintosh Probe to
be tested. The researcher had to change the location of the test site.
37
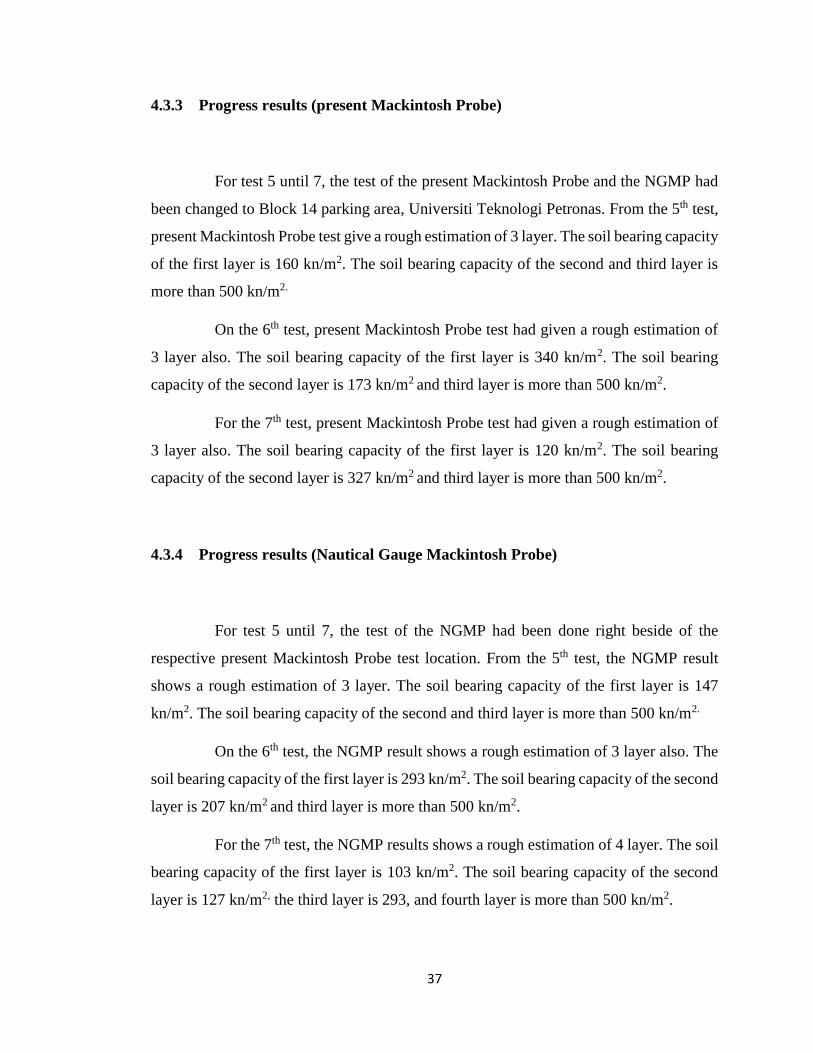
4.3.3 Progress results (present Mackintosh Probe)
For test 5 until 7, the test of the present Mackintosh Probe and the NGMP had
been changed to Block 14 parking area, Universiti Teknologi Petronas. From the 5th test,
present Mackintosh Probe test give a rough estimation of 3 layer. The soil bearing capacity
of the first layer is 160 kn/m2. The soil bearing capacity of the second and third layer is
more than 500 kn/m2.
On the 6th test, present Mackintosh Probe test had given a rough estimation of
3 layer also. The soil bearing capacity of the first layer is 340 kn/m2. The soil bearing
capacity of the second layer is 173 kn/m2 and third layer is more than 500 kn/m2.
For the 7th test, present Mackintosh Probe test had given a rough estimation of
3 layer also. The soil bearing capacity of the first layer is 120 kn/m2. The soil bearing
capacity of the second layer is 327 kn/m2 and third layer is more than 500 kn/m2.
4.3.4 Progress results (Nautical Gauge Mackintosh Probe)
For test 5 until 7, the test of the NGMP had been done right beside of the
respective present Mackintosh Probe test location. From the 5th test, the NGMP result
shows a rough estimation of 3 layer. The soil bearing capacity of the first layer is 147
kn/m2. The soil bearing capacity of the second and third layer is more than 500 kn/m2.
On the 6th test, the NGMP result shows a rough estimation of 3 layer also. The
soil bearing capacity of the first layer is 293 kn/m2. The soil bearing capacity of the second
layer is 207 kn/m2 and third layer is more than 500 kn/m2.
For the 7th test, the NGMP results shows a rough estimation of 4 layer. The soil
bearing capacity of the first layer is 103 kn/m2. The soil bearing capacity of the second
layer is 127 kn/m2, the third layer is 293, and fourth layer is more than 500 kn/m2.
38
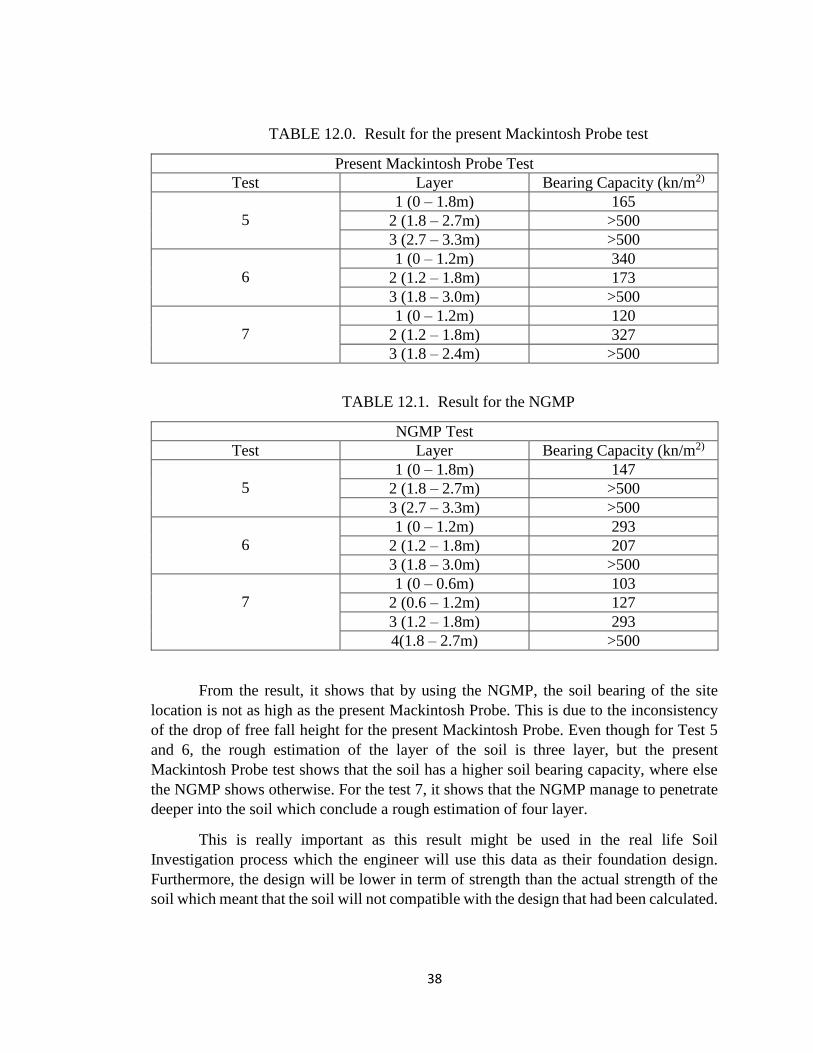
TABLE 12.0. Result for the present Mackintosh Probe test
TABLE 12.1. Result for the NGMP
NGMP Test
Test Layer Bearing Capacity (kn/m2)
5
1 (0 – 1.8m) 147
2 (1.8 – 2.7m) >500
3 (2.7 – 3.3m) >500
6
1 (0 – 1.2m) 293
2 (1.2 – 1.8m) 207
3 (1.8 – 3.0m) >500
7
1 (0 – 0.6m) 103
2 (0.6 – 1.2m) 127
3 (1.2 – 1.8m) 293
4(1.8 – 2.7m) >500
From the result, it shows that by using the NGMP, the soil bearing of the site
location is not as high as the present Mackintosh Probe. This is due to the inconsistency
of the drop of free fall height for the present Mackintosh Probe. Even though for Test 5
and 6, the rough estimation of the layer of the soil is three layer, but the present
Mackintosh Probe test shows that the soil has a higher soil bearing capacity, where else
the NGMP shows otherwise. For the test 7, it shows that the NGMP manage to penetrate
deeper into the soil which conclude a rough estimation of four layer.
This is really important as this result might be used in the real life Soil
Investigation process which the engineer will use this data as their foundation design.
Furthermore, the design will be lower in term of strength than the actual strength of the
soil which meant that the soil will not compatible with the design that had been calculated.
Present Mackintosh Probe Test
Test Layer Bearing Capacity (kn/m2)
5
1 (0 – 1.8m) 165
2 (1.8 – 2.7m) >500
3 (2.7 – 3.3m) >500
6
1 (0 – 1.2m) 340
2 (1.2 – 1.8m) 173
3 (1.8 – 3.0m) >500
7
1 (0 – 1.2m) 120
2 (1.2 – 1.8m) 327
3 (1.8 – 2.4m) >500
39
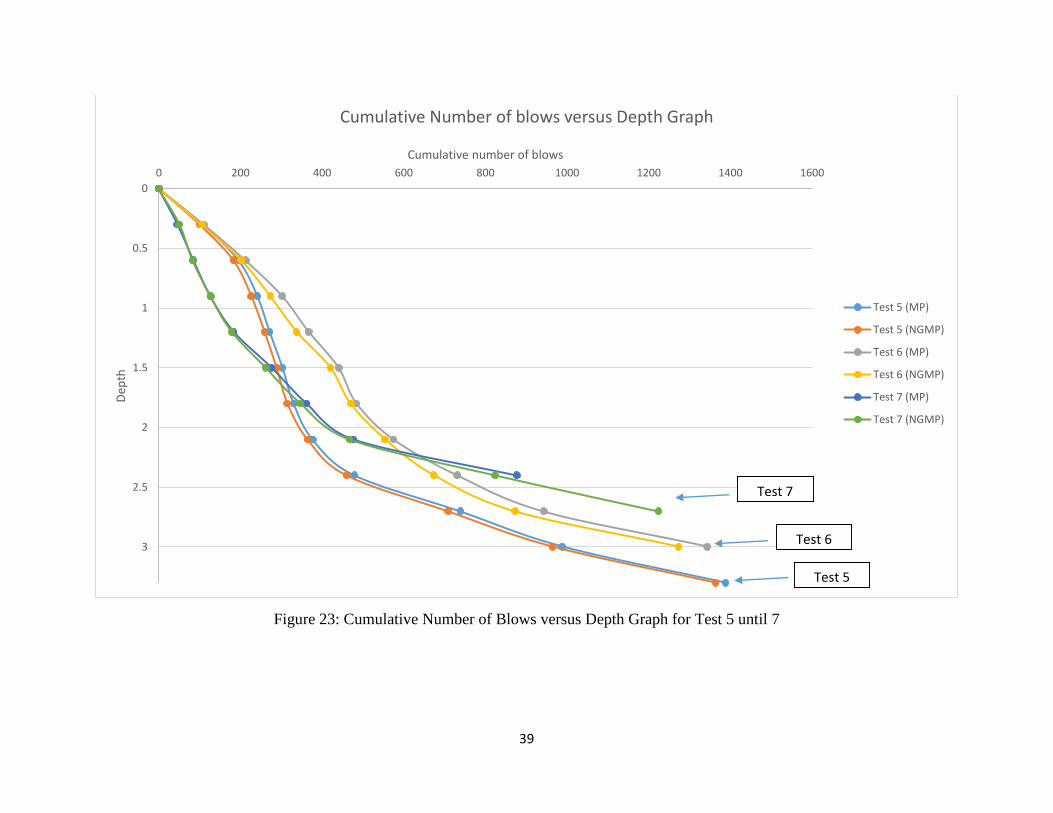
Figure 23: Cumulative Number of Blows versus Depth Graph for Test 5 until 7
0
0.5
1
1.5
2
2.5
3
0 200 400 600 800 1000 1200 1400 1600
Dep
th
Cumulative number of blows
Cumulative Number of blows versus Depth Graph
Test 5 (MP)
Test 5 (NGMP)
Test 6 (MP)
Test 6 (NGMP)
Test 7 (MP)
Test 7 (NGMP)
Test 7
Test 6
Test 5
40
CHAPTER 5
CONCLUSION AND RECOMMENDATION
5. CONCLUSION AND RECOMMENDATION
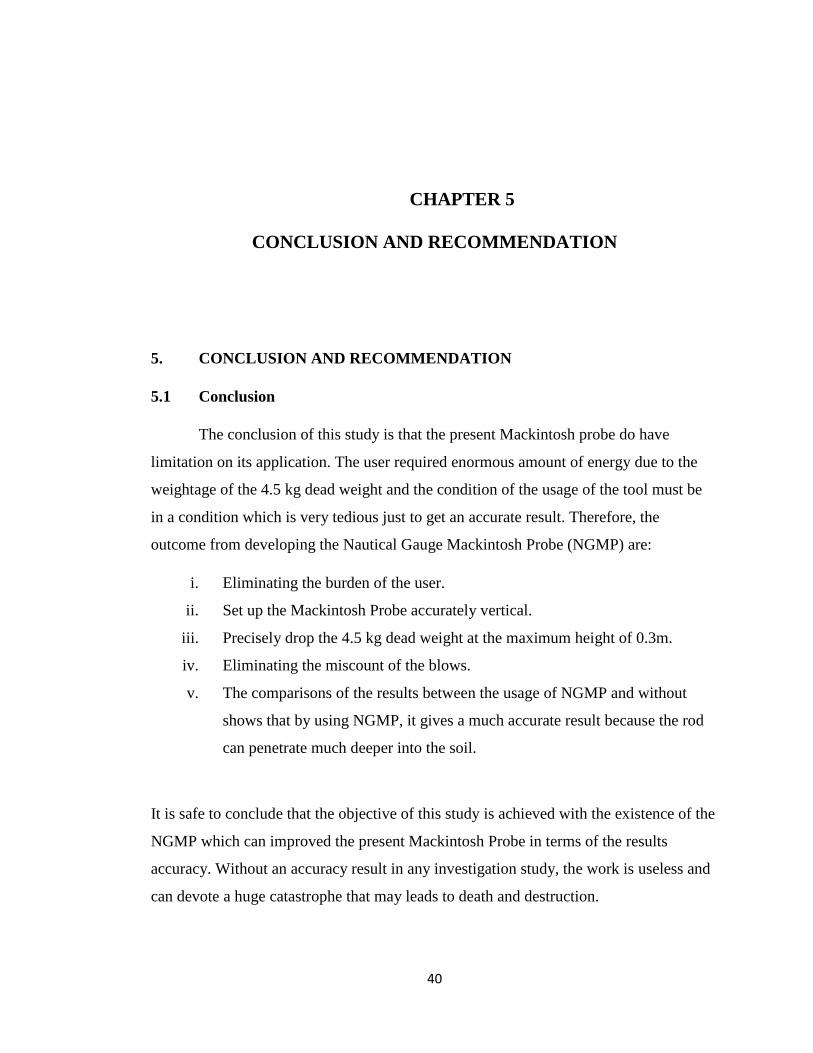
5.1 Conclusion
The conclusion of this study is that the present Mackintosh probe do have
limitation on its application. The user required enormous amount of energy due to the
weightage of the 4.5 kg dead weight and the condition of the usage of the tool must be
in a condition which is very tedious just to get an accurate result. Therefore, the
outcome from developing the Nautical Gauge Mackintosh Probe (NGMP) are:
i. Eliminating the burden of the user.
ii. Set up the Mackintosh Probe accurately vertical.
iii. Precisely drop the 4.5 kg dead weight at the maximum height of 0.3m.
iv. Eliminating the miscount of the blows.
v. The comparisons of the results between the usage of NGMP and without
shows that by using NGMP, it gives a much accurate result because the rod
can penetrate much deeper into the soil.
It is safe to conclude that the objective of this study is achieved with the existence of the
NGMP which can improved the present Mackintosh Probe in terms of the results
accuracy. Without an accuracy result in any investigation study, the work is useless and
can devote a huge catastrophe that may leads to death and destruction.
41
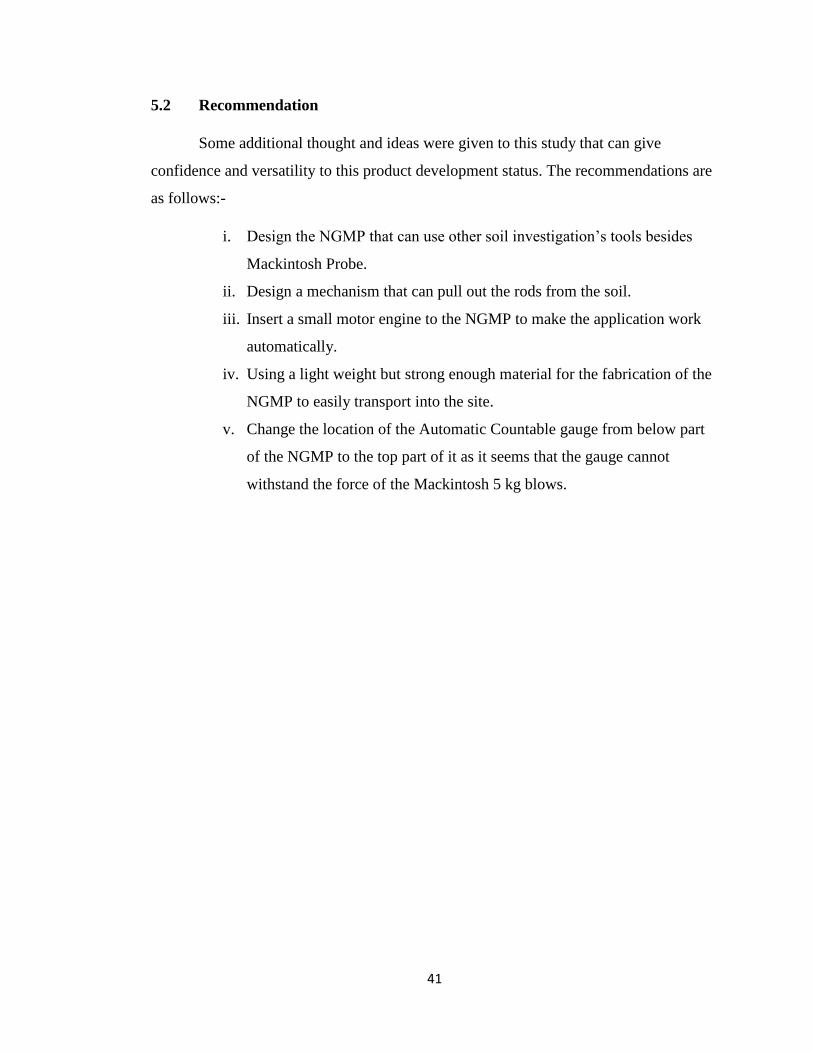
5.2 Recommendation
Some additional thought and ideas were given to this study that can give
confidence and versatility to this product development status. The recommendations are
as follows:-
i. Design the NGMP that can use other soil investigation’s tools besides
Mackintosh Probe.
ii. Design a mechanism that can pull out the rods from the soil.
iii. Insert a small motor engine to the NGMP to make the application work
automatically.
iv. Using a light weight but strong enough material for the fabrication of the
NGMP to easily transport into the site.
v. Change the location of the Automatic Countable gauge from below part
of the NGMP to the top part of it as it seems that the gauge cannot
withstand the force of the Mackintosh 5 kg blows.
42
REFERENCE
Fakher, A., Khodaparast, M., & Jones, C. J. F. P. (2005). The use of the Mackintosh Probe for Site Investigation in Soft Soils.
Sew, I. D. G. S., Gue, I. T. Y. C., & Bhd, P. S. (2000). Subsurface Investigation and
Interpretation of Test Results for Foundation Design in Soft Clay.
43
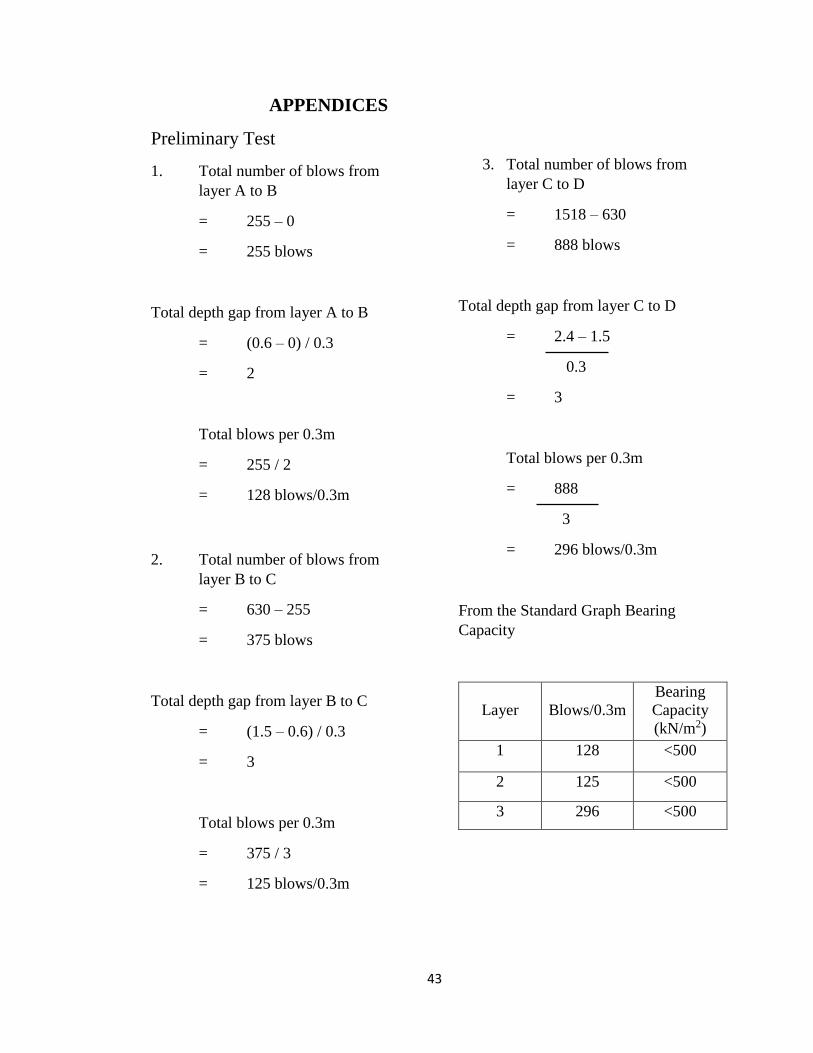
APPENDICES
Preliminary Test
1. Total number of blows from
layer A to B
= 255 – 0
= 255 blows
Total depth gap from layer A to B
= (0.6 – 0) / 0.3
= 2
Total blows per 0.3m
= 255 / 2
= 128 blows/0.3m
2. Total number of blows from
layer B to C
= 630 – 255
= 375 blows
Total depth gap from layer B to C
= (1.5 – 0.6) / 0.3
= 3
Total blows per 0.3m
= 375 / 3
= 125 blows/0.3m
3. Total number of blows from
layer C to D
= 1518 – 630
= 888 blows
Total depth gap from layer C to D
= 2.4 – 1.5
0.3
= 3
Total blows per 0.3m
= 888
3
= 296 blows/0.3m
From the Standard Graph Bearing
Capacity
Layer
Blows/0.3m
Bearing
Capacity
(kN/m2)
1 128 <500
2 125 <500
3 296 <500
44
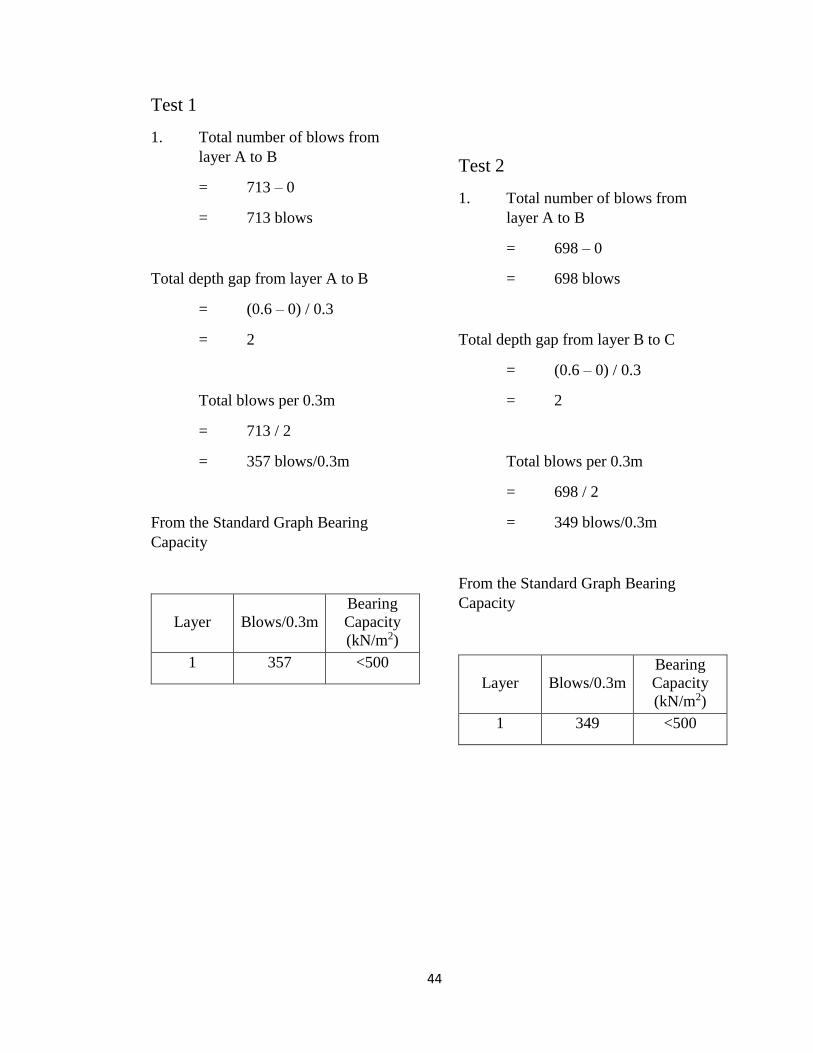
Test 1
1. Total number of blows from
layer A to B
= 713 – 0
= 713 blows
Total depth gap from layer A to B
= (0.6 – 0) / 0.3
= 2
Total blows per 0.3m
= 713 / 2
= 357 blows/0.3m
From the Standard Graph Bearing
Capacity
Layer
Blows/0.3m
Bearing
Capacity
(kN/m2)
1 357 <500
Test 2
1. Total number of blows from
layer A to B
= 698 – 0
= 698 blows
Total depth gap from layer B to C
= (0.6 – 0) / 0.3
= 2
Total blows per 0.3m
= 698 / 2
= 349 blows/0.3m
From the Standard Graph Bearing
Capacity
Layer
Blows/0.3m
Bearing
Capacity
(kN/m2)
1 349 <500
45
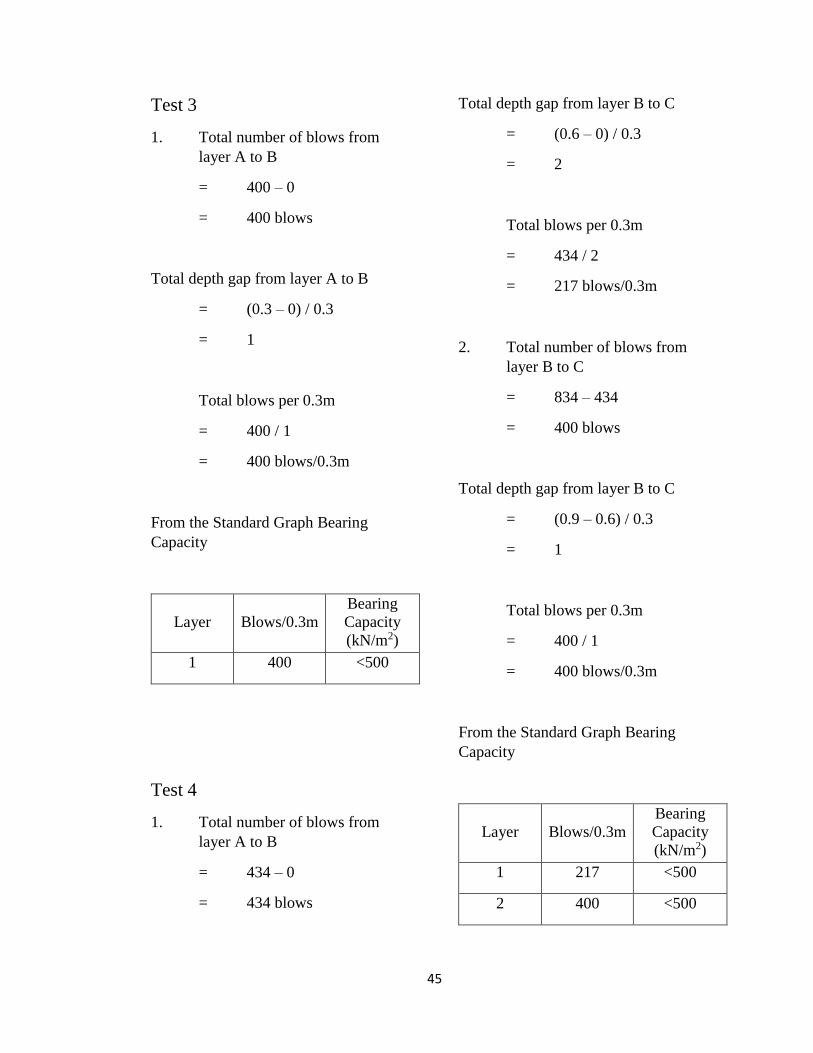
Test 3
1. Total number of blows from
layer A to B
= 400 – 0
= 400 blows
Total depth gap from layer A to B
= (0.3 – 0) / 0.3
= 1
Total blows per 0.3m
= 400 / 1
= 400 blows/0.3m
From the Standard Graph Bearing
Capacity
Layer
Blows/0.3m
Bearing
Capacity
(kN/m2)
1 400 <500
Test 4
1. Total number of blows from
layer A to B
= 434 – 0
= 434 blows
Total depth gap from layer B to C
= (0.6 – 0) / 0.3
= 2
Total blows per 0.3m
= 434 / 2
= 217 blows/0.3m
2. Total number of blows from
layer B to C
= 834 – 434
= 400 blows
Total depth gap from layer B to C
= (0.9 – 0.6) / 0.3
= 1
Total blows per 0.3m
= 400 / 1
= 400 blows/0.3m
From the Standard Graph Bearing
Capacity
Layer
Blows/0.3m
Bearing
Capacity
(kN/m2)
1 217 <500
2 400 <500

46
Test 5 (Present Mackintosh Probe)
1. Total number of blows from
layer A to B
= 331 – 0
= 331 blows
Total depth gap from layer A to B
= (1.8 – 0) / 0.3
= 6
Total blows per 0.3m
= 331 / 6
= 56 blows/0.3m
2. Total number of blows from
layer B to C
= 739 – 331
= 408 blows
Total depth gap from layer A to B
= (2.7 – 1.8) / 0.3
= 3
Total blows per 0.3m
= 408 / 3
= 136 blows/0.3m
3. Total number of blows from
layer C to D
= 1388 – 739
= 649 blows
Total depth gap from layer A to B
= (3.3 – 2.7) / 0.3
= 2
Total blows per 0.3m
= 649 / 2
= 325 blows/0.3m
From the Standard Graph Bearing
Capacity
Layer
Blows/0.3m
Bearing
Capacity
(kN/m2)
1 56 161
2 135 <500
3 325 <500
47
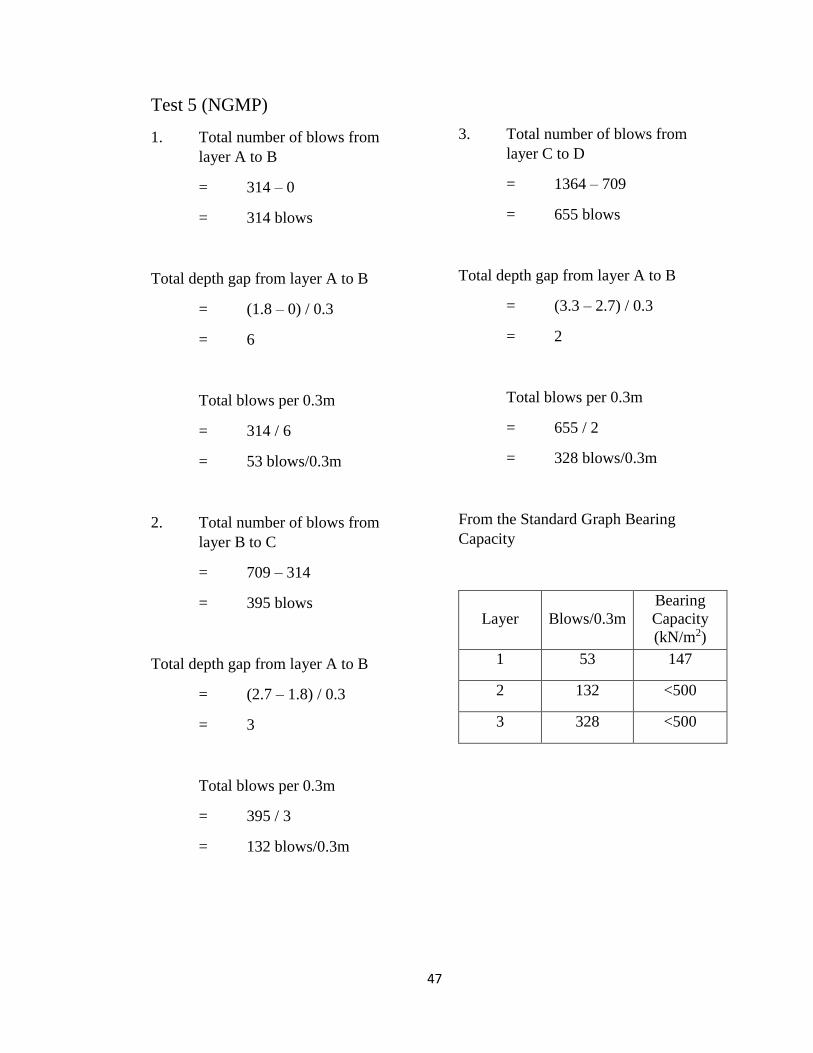
Test 5 (NGMP)
1. Total number of blows from
layer A to B
= 314 – 0
= 314 blows
Total depth gap from layer A to B
= (1.8 – 0) / 0.3
= 6
Total blows per 0.3m
= 314 / 6
= 53 blows/0.3m
2. Total number of blows from
layer B to C
= 709 – 314
= 395 blows
Total depth gap from layer A to B
= (2.7 – 1.8) / 0.3
= 3
Total blows per 0.3m
= 395 / 3
= 132 blows/0.3m
3. Total number of blows from
layer C to D
= 1364 – 709
= 655 blows
Total depth gap from layer A to B
= (3.3 – 2.7) / 0.3
= 2
Total blows per 0.3m
= 655 / 2
= 328 blows/0.3m
From the Standard Graph Bearing
Capacity
Layer
Blows/0.3m
Bearing
Capacity
(kN/m2)
1 53 147
2 132 <500
3 328 <500

48
Test 6 (Present Mackintosh Probe)
1. Total number of blows from
layer A to B
= 367 – 0
= 367 blows
Total depth gap from layer A to B
= (1.2 – 0) / 0.3
= 4
Total blows per 0.3m
= 367 / 4
= 92 blows/0.3m
2. Total number of blows from
layer B to C
= 484 – 367
= 117 blows
Total depth gap from layer A to B
= (1.8 – 1.2) / 0.3
= 2
Total blows per 0.3m
= 117 / 2
= 59 blows/0.3m
3. Total number of blows from
layer C to D
= 1343 – 484
= 859 blows
Total depth gap from layer A to B
= (3.0 – 1.8) / 0.3
= 4
Total blows per 0.3m
= 859 / 4
= 215 blows/0.3m
From the Standard Graph Bearing
Capacity
Layer
Blows/0.3m
Bearing
Capacity
(kN/m2)
1 92 340
2 59 173
3 215 <500

49
Test 6 (NGMP)
1. Total number of blows from
layer A to B
= 337 – 0
= 337 blows
Total depth gap from layer A to B
= (1.2 – 0) / 0.3
= 4
Total blows per 0.3m
= 337 / 4
= 85 blows/0.3m
2. Total number of blows from
layer B to C
= 470 – 337
= 133 blows
Total depth gap from layer A to B
= (1.8 – 1.2) / 0.3
= 2
Total blows per 0.3m
= 133 / 2
= 67 blows/0.3m
3. Total number of blows from
layer C to D
= 1273 – 470
= 803 blows
Total depth gap from layer A to B
= (3.0 – 1.8) / 0.3
= 4
Total blows per 0.3m
= 803 / 4
= 201 blows/0.3m
From the Standard Graph Bearing
Capacity
Layer
Blows/0.3m
Bearing
Capacity
(kN/m2)
1 85 293
2 67 207
3 201 <500

50
Test 7 (Present Mackintosh Probe)
1. Total number of blows from
layer A to B
= 182 – 0
= 182 blows
Total depth gap from layer A to B
= (1.2 – 0) / 0.3
= 4
Total blows per 0.3m
= 182 / 4
= 46 blows/0.3m
2. Total number of blows from
layer B to C
= 362 – 182
= 180 blows
Total depth gap from layer A to B
= (1.8 – 1.2) / 0.3
= 2
Total blows per 0.3m
= 180 / 2
= 90 blows/0.3m
3. Total number of blows from
layer C to D
= 877 – 362
= 515 blows
Total depth gap from layer A to B
= (2.4 – 1.8) / 0.3
= 2
Total blows per 0.3m
= 515 / 2
= 258 blows/0.3m
From the Standard Graph Bearing
Capacity
Layer
Blows/0.3m
Bearing
Capacity
(kN/m2)
1 46 120
2 90 327
3 258 <500
51
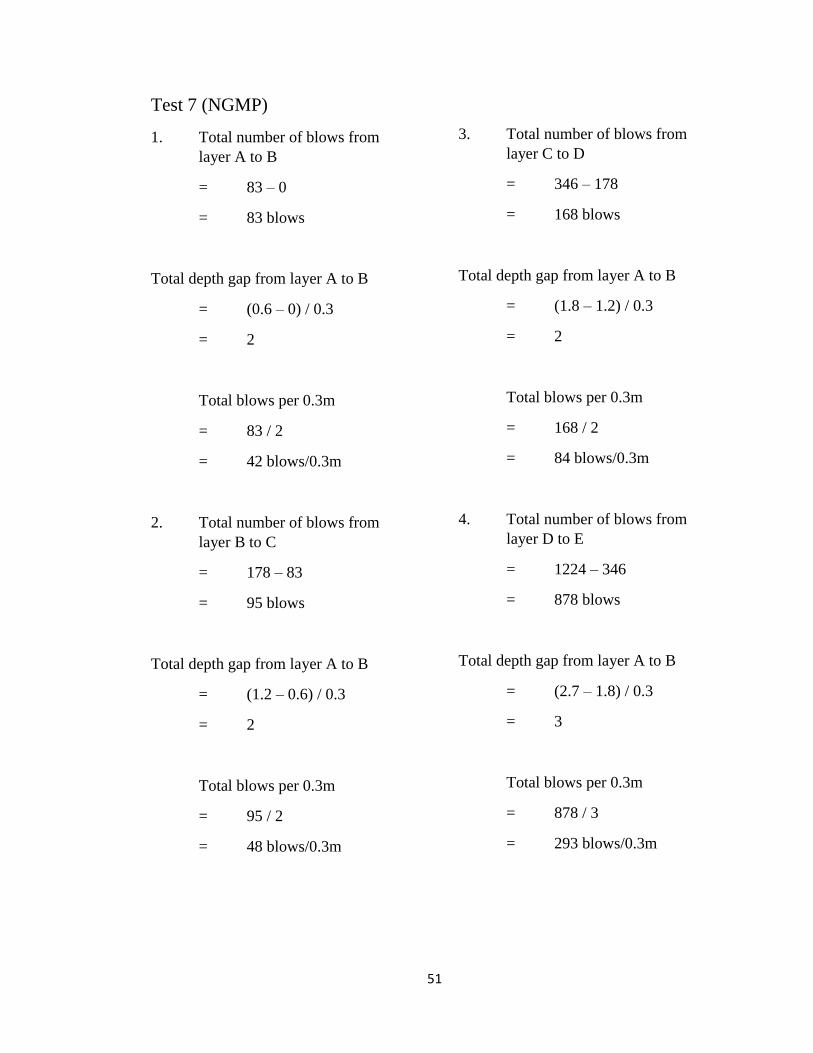
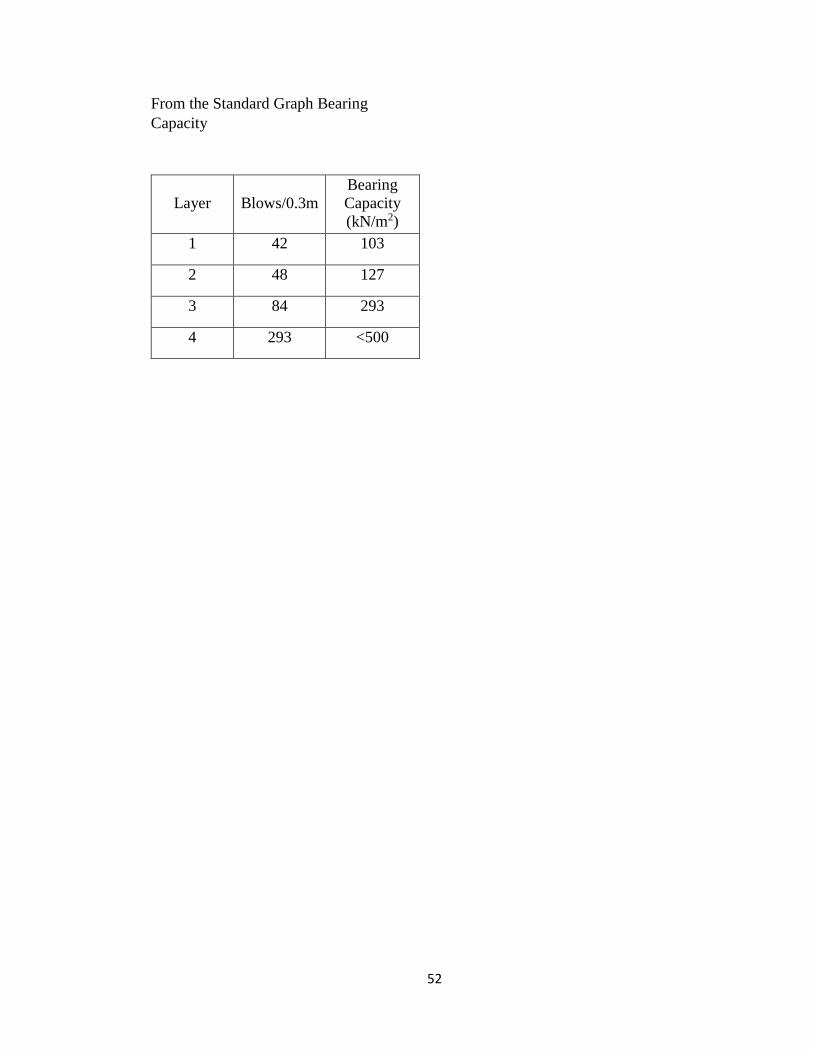
Test 7 (NGMP)
1. Total number of blows from
layer A to B
= 83 – 0
= 83 blows
Total depth gap from layer A to B
= (0.6 – 0) / 0.3
= 2
Total blows per 0.3m
= 83 / 2
= 42 blows/0.3m
2. Total number of blows from
layer B to C
= 178 – 83
= 95 blows
Total depth gap from layer A to B
= (1.2 – 0.6) / 0.3
= 2
Total blows per 0.3m
= 95 / 2
= 48 blows/0.3m
3. Total number of blows from
layer C to D
= 346 – 178
= 168 blows
Total depth gap from layer A to B
= (1.8 – 1.2) / 0.3
= 2
Total blows per 0.3m
= 168 / 2
= 84 blows/0.3m
4. Total number of blows from
layer D to E
= 1224 – 346
= 878 blows
Total depth gap from layer A to B
= (2.7 – 1.8) / 0.3
= 3
Total blows per 0.3m
= 878 / 3
= 293 blows/0.3m
52
From the Standard Graph Bearing
Capacity
Layer
Blows/0.3m
Bearing
Capacity
(kN/m2)
1 42 103
2 48 127
3 84 293
4 293 <500