Naturally occurring arsenic in the Miocene Hawthorn Group...
21
Naturally occurring arsenic in the Miocene Hawthorn Group, southwestern Florida: Potential implication for phosphate mining Olesya Lazareva, Thomas Pichler * Department of Geology, University of South Florida, Tampa, FL, USA Received 20 February 2006; accepted 11 December 2006 Editorial handling by R. Fuge Available online 20 February 2007 Abstract To understand the mineralogical association, concentration, and distribution of arsenic (As) in the Hawthorn Group, the chemical and mineralogical composition of 362 samples that were collected from 16 cores in southwestern Florida were examined in detail. In the study area, the Hawthorn Group consisted primarily of a basal carbonate unit (the Arcadia For- mation) and an upper siliciclastic unit (The Peace River Formation). The Peace River Formation contains appreciable amounts of phosphate and is currently being exploited for phosphate ore. Samples were taken from cores of each forma- tion at intervals of 7.5 m. In addition, to the interval samples, sections likely to have high As concentrations, such as zones with pyrite crystals, hydrous ferric oxides, green clays, and organic material, were collected and analyzed. Bulk As concen- trations were determined by hydride generation-atomic fluorescence spectrometry (HG-AFS) after digestion with aqua regia (3:1 HCl and HNO 3 ). The elements Fe, Al, Si, Mg, Ca, S, and P were measured on the same solutions by inductively coupled plasma optical emission spectrometry (ICP-OES). The identification of discrete minerals was aided by scanning electron microscopy (SEM) and chemical compositions within the sample matrix and in individual minerals were obtained by electron-probe microanalysis (EMPA). This detailed mineralogical and geochemical study demonstrated that: (1) As in the Hawthorn Group varied from for- mation to formation and was mostly concentrated in trace minerals, such as pyrite; (2) average As concentrations signif- icantly changed from 8.8 mg/kg (r = 8.6 mg/kg) in the Peace River Formation to 3.0 mg/kg (r = 3.7 mg/kg) in the Tampa Member of the Arcadia Formation. Arsenic concentrations for all Hawthorn samples varied from 0.1 to 69.0 mg/kg; (3) pyrite, with one exception, occurred as framboids and was unevenly distributed throughout the Hawthorn Group; (4) pyr- ite framboids were located inside a francolite (carbonate fluorapatite) matrix with As concentrations as high as 3730 mg/kg and as a trace mineral in the sediment matrix concentrations varying from <1 to 8260 mg/kg; (5) hydrous ferric oxides (HFO) contained As concentrations as high as 540 mg/kg; (6) francolite, organic material, and clays contained substan- tially less As than pyrite; (7) thus, the release of As from pyrite could pose a potential problem for the phosphate industry. Ó 2007 Elsevier Ltd. All rights reserved. 0883-2927/$ - see front matter Ó 2007 Elsevier Ltd. All rights reserved. doi:10.1016/j.apgeochem.2006.12.021 * Corresponding author. Tel.: +1 813 974 0321; fax: +1 813 974 2654. E-mail address: [email protected] (T. Pichler). Applied Geochemistry 22 (2007) 953–973 www.elsevier.com/locate/apgeochem Applied Geochemistry
Transcript of Naturally occurring arsenic in the Miocene Hawthorn Group...

Applied Geochemistry 22 (2007) 953–973
www.elsevier.com/locate/apgeochem
AppliedGeochemistry
Naturally occurring arsenic in the Miocene HawthornGroup, southwestern Florida: Potential implication
for phosphate mining
Olesya Lazareva, Thomas Pichler *
Department of Geology, University of South Florida, Tampa, FL, USA
Received 20 February 2006; accepted 11 December 2006Editorial handling by R. Fuge
Available online 20 February 2007
Abstract
To understand the mineralogical association, concentration, and distribution of arsenic (As) in the Hawthorn Group,the chemical and mineralogical composition of 362 samples that were collected from 16 cores in southwestern Florida wereexamined in detail. In the study area, the Hawthorn Group consisted primarily of a basal carbonate unit (the Arcadia For-mation) and an upper siliciclastic unit (The Peace River Formation). The Peace River Formation contains appreciableamounts of phosphate and is currently being exploited for phosphate ore. Samples were taken from cores of each forma-tion at intervals of 7.5 m. In addition, to the interval samples, sections likely to have high As concentrations, such as zoneswith pyrite crystals, hydrous ferric oxides, green clays, and organic material, were collected and analyzed. Bulk As concen-trations were determined by hydride generation-atomic fluorescence spectrometry (HG-AFS) after digestion with aquaregia (3:1 HCl and HNO3). The elements Fe, Al, Si, Mg, Ca, S, and P were measured on the same solutions by inductivelycoupled plasma optical emission spectrometry (ICP-OES). The identification of discrete minerals was aided by scanningelectron microscopy (SEM) and chemical compositions within the sample matrix and in individual minerals were obtainedby electron-probe microanalysis (EMPA).
This detailed mineralogical and geochemical study demonstrated that: (1) As in the Hawthorn Group varied from for-mation to formation and was mostly concentrated in trace minerals, such as pyrite; (2) average As concentrations signif-icantly changed from 8.8 mg/kg (r = 8.6 mg/kg) in the Peace River Formation to 3.0 mg/kg (r = 3.7 mg/kg) in the TampaMember of the Arcadia Formation. Arsenic concentrations for all Hawthorn samples varied from 0.1 to 69.0 mg/kg; (3)pyrite, with one exception, occurred as framboids and was unevenly distributed throughout the Hawthorn Group; (4) pyr-ite framboids were located inside a francolite (carbonate fluorapatite) matrix with As concentrations as high as 3730 mg/kgand as a trace mineral in the sediment matrix concentrations varying from <1 to 8260 mg/kg; (5) hydrous ferric oxides(HFO) contained As concentrations as high as 540 mg/kg; (6) francolite, organic material, and clays contained substan-tially less As than pyrite; (7) thus, the release of As from pyrite could pose a potential problem for the phosphate industry.� 2007 Elsevier Ltd. All rights reserved.
0883-2927/$ - see front matter � 2007 Elsevier Ltd. All rights reserved.doi:10.1016/j.apgeochem.2006.12.021
* Corresponding author. Tel.: +1 813 974 0321; fax: +1 813 974 2654.E-mail address: [email protected] (T. Pichler).

954 O. Lazareva, T. Pichler / Applied Geochemistry 22 (2007) 953–973
1. Introduction
Southwestern Florida hosts several large phos-phate mines that exploit the Oligocene- to Miocene-aged Hawthorn Group sediments (Blakey, 1973).Currently, Florida supplies about one-quarter ofthe world’s and three-quarters of the United Statesdomestic phosphate needs (Hodges et al., 2001).
Arsenic concentrations of up to 54.1 mg/kg wererecently reported for samples from the Oligocene-aged Suwannee Limestone in Florida (Price andPichler, 2006). The Suwannee Limestone directlyunderlies the Hawthorn Group, which triggered this
Fig. 1. Map of the research area including the Regional Observation Mthe 16 cores that were sampled. Note: the sample labels correspond to
study. Because P and As are chemically closelyrelated, they often co-occur in nature (Shields,2002). In addition, the highly open crystal structureof carbonate fluorapatite (francolite) shows a ten-dency to accumulate such elements as As, Mo, Se,Y, Zn and the Rare Earth Elements (REE) duringdiagenesis (Shields, 2002). This may pose problemsfor phosphate mining, such as (1) high As values inthe phosphate-bearing rock has a negative effect onore processing (benefication) and the quality of thefinal product; and (2) mine-induced changes inground water physico-chemical conditions maycause the release of As present in the subsurface,
onitor Well Program (ROMP) locations, numbers, and names ofdrill ‘well number’ – ‘sample depth’.

O. Lazareva, T. Pichler / Applied Geochemistry 22 (2007) 953–973 955
causing increased values in public and private supplywells relative to existing drinking water standards.The potential for this scenario was clearly demon-strated by release of high-As water from CoronetIndustries processing plant in Plant City, Hillsbor-ough County, where levels were in excess of100 lg/L (Hammett, 2002). The new MaximumContaminant Level (MCL) for As in drinking water,established by the U. S. Environmental ProtectionAgency (US EPA) in 2001 and which took effect onJanuary 23, 2006, is 10 lg/L (Walsh, 2001). More-over, there have been several occurrences of swinefatalities due to As contaminated phosphate feedsupplements (El Bahri and Romdane, 1991).
1.1. Geology and hydrogeology of the study area
The research area is located in the SouthwestFlorida Water Management District (SWFWMD)
Fig. 2. Lithostratigraphic and hydrogeologic units o
between Tampa and Port Charlotte (Fig. 1). Herethe hydrogeological framework can be subdividedinto 3 discrete units, the Floridan Aquifer System(FAS), the Intermediate Aquifer System (IAS) orIntermediate Confining Unit, and the SurficialAquifer System (SAS) (Fig. 2) (Miller, 1986).
The Miocene Hawthorn Group is the strati-graphic unit that contains the Intermediate aquifersystem. It is subdivided into a lower section compris-ing the undifferentiated Arcadia Formation, Tampaand Nocatee Members of the Arcadia Formation(Fig. 2) and the upper section of the Peace River For-mation (Scott, 1988, 1990). The Arcadia Formationunconformably overlies the Oligocene SuwanneeLimestone. Its maximum thickness within the studyarea is approximately 183 m (600 ft) in the Okeecho-bee Basin (Scott, 1988). Throughout the researcharea the undifferentiated Arcadia Formation is prin-cipally composed of variable amount of siliciclastics
f the study area (Modified from Miller, 1986).
956 O. Lazareva, T. Pichler / Applied Geochemistry 22 (2007) 953–973
such as quartz sands, greenish gray clays, chert andfrancolite within a carbonate matrix (Scott, 1990).The lithology of the Tampa Member of the ArcadiaFormation varies from yellow-gray marine wacke-stone to packestone containing variable amounts ofdolostone, clay, quartz sand and minor occurrencesof francolite (Wingard et al., 1993; Scott, 1988).The Nocatee Member forms the base of the ArcadiaFormation (Fig. 2) in the much of the southern por-tion of SWFWMD. Scott (1988) reported that theNocatee Member contains the highest amount ofsiliciclastic material found within the entire ArcadiaFormation.
The Peace River Formation, currently beingexploited for the phosphate ore, unconformablyoverlies the Arcadia Formation (Fig. 2) and, withinthe study area, reaches a maximum thickness of 46–61 m (150–200 ft) in the Okeechobee Basin (Scott,1990). In the study area, the Peace River Formationconsists of greenish gray sandy clays, and carbon-ates with variable amounts of francolite, sand andgravel (Green et al., 1995). The carbonates are com-prised of interbedded limestones, dolostones, and asiliciclastic component dominates the Peace RiverFormation (Scott, 1988).
2. Methods
A combination of petrographic and geochemicaltechniques was used to evaluate the abundance andmineralogical association of As in 362 samples from16 Hawthorn Group cores in proximity to currentand future phosphate mining. The cores were origi-nally collected as part of the Regional ObservationMonitor Well Program (ROMP) by SWFWMD,and stored at the Florida Geological Survey(FGS) in Tallahassee. Each core was sampled atan even spacing of approximately 7.5 m to ensurerepresentation of the entire Hawthorn interval. Inaddition, targeted samples were taken from sec-tions, which previous studies (Price and Pichler,2006) suggested were likely to have higher As con-centrations than the bulk carbonate/siliciclasticmatrix, such as areas containing visible pyrite,hydrous ferric oxides, green clays, and organicmaterial. Overall, 285 interval samples and 77 tar-geted samples were collected and analyzed. Thesample labels correspond to drill ‘well number’ –‘sample depth’ (for example, sample 12-48).
The samples were initially examined using a 10·hand lens and a stereo microscope. Based on a com-bination of hand specimen description and bulk As
concentration (following chemical analyses),approximately 60 samples were selected for furtherstudy. Polished thin sections were made for thosesamples and they were examined using a polarizingmicroscope with reflected and transmitted light.
To determine bulk chemical composition sampleswere powdered (homogenized) in an agate mortar.To avoid cross-contamination, the mortar and pes-tle were cleaned with pure silica sand and deionisedwater between samples. A dilute HNO3 solution wasused after powdering soft greenish clays. Approxi-mately 0.5 ± 0.001 g of powdered sample wasweighed into a digestion vessel and 10 mL of a 3:1mixture of HCl and HNO3 was added. The diges-tion vessel was immediately capped with a refluxcup to trap any arsine gas. The sample was heatedto a temperature of 95 �C for 30 min. After diges-tion, the solution was cooled, diluted to 50 mL(5:1) with DI water, centrifuged for 15 min toremove non-soluble particles, and filtered.
Calcium, Fe, Mg, Mn, S, P, Si and Al weredetermined on a Perkin Elmer Optima 2000 DVinductively coupled plasma – optical emission spec-trometer (ICP-OES). Bulk As concentrations weremeasured by hydride generation-atomic fluorescencespectrometry using a PSA 10.055 Millenium Excali-bur instrument (HG-AFS) at the Center for WaterAnalysis, University of South Florida. The accuracyand precision of the measurements and acid digestionwas verified by analysis of the JGS JLs-1 referencematerial and sample duplicates, which indicated aprecision of better than 5%. Reagent-acid blankswere tested and showed no detectable As. Back-ground signal drift was consistently less than 1%.
Based on the bulk concentrations, samples withhigh As levels were selected for a more focused min-eralogical analysis using a Hitachi S-3500N scan-ning electron microscope (SEM) at the College ofMarine Science, University of South Florida.
To better understand the chemical compositionof individual minerals and mineral phases contain-ing As, 16 polished thin sections from each forma-tion/member of the Hawthorn Group were chosenfor electron-probe microanalysis – wave dispersivespectrometry (EMPA or electron microprobe),using a JEOL 8200 instrument at the University ofNew Mexico. Operating conditions of the electronmicroprobe were 20 kV accelerating voltage, a spotsize of 5 lm, and a 20 nA current. The electronmicroprobe was used for spot analysis and to mapAs concentrations within the sample matrix and inindividual minerals.
O. Lazareva, T. Pichler / Applied Geochemistry 22 (2007) 953–973 957
3. Results
3.1. Mineralogy and petrography
3.1.1. Arcadia Formation
Most samples consisted of carbonate material(limestones and dolostones), with a variable silici-clastic component, and francolite. The siliciclasticswere primarily composed of gray and grayish greenclays, and quartz. The Tampa Member containedminor or no francolite. The sedimentary componentscontained minor mineral phases, such as pyrite, gyp-sum, chert, secondary calcite, feldspar, and hydrousferric oxides (HFOs). The HFOs were frequentlyobserved as stains or rings around pyrites. Framboi-dal pyrite was ubiquitous throughout the ArcadiaFormation. Organic matter was observed in severalsamples and revealed a heterogeneous distributionthroughout the undifferentiated Arcadia Formation.
The examination of thin sections confirmed thepresence of francolite, calcite, dolomite, feldspar,pyrite, quartz, clays, and HFO. Pyrite was presentas framboids generally less 10 lm in diameter inabout 90% of the thin sections, occurring in the sed-iment matrix and as inclusions in francolite nodules(Fig. 3). Framboids consisted of euhedral pyritemicro-crystals. These observations were confirmedby SEM (Fig. 4a).
3.1.2. Peace River Formation
The majority of samples from the Peace Riversediments were composed of siliciclastics such asquartz sand, gray to dark greenish gray clays, andsubstantial amounts of francolite. Minor mineralphases were pyrite, gypsum, sulfur, secondary cal-cite, feldspar, and HFO. Most pyrite was presentin the form of framboids; cubic pyrite (Fig. 4b) onlyoccurred in one sample (12-125(2)).
Thin section examination confirmed the presenceof pyrite, francolite, calcite, gypsum, dolomite, feld-spar, quartz, clays and HFO. About 90% of the thinsections from the Peace River Formation containedpyrite crystals in the sediment matrix and severalsamples revealed pyrite inclusions in francolitegrains and calcite crystals (Fig. 5).
3.2. Bulk rock chemical composition
Bulk As concentrations for all 362 HawthornGroup samples varied from 0.1 to as high as69.0 mg/kg with a mean (l) of 5.6 mg/kg(r = 7.1 mg/kg) (Table 1). Bulk-rock chemical anal-
yses by ICP-OES for Ca, Mg, Mn, Fe, S, Al, P andSi showed that the strongest linear correlation forthe Hawthorn Group sediments existed between Sand Fe with a R2 of 0.87 (Appendix 1), which couldbe due to the outlier effect (Swan and Sandilands,1995) caused by sample 12-125(2) (Fig. 6a). Thissample had anomalously high Fe, S and P comparedto other Hawthorn Group sediments. Eliminationof the outlier point changed the correlation coeffi-cient to R2 = 0.77 (Fig. 6b).
The total As concentrations of the 285 intervalsamples (samples that were taken at fixed intervals)ranged from 0.1 to 40.8 mg/kg with a mean of5.0 mg/kg (r = 5.8 mg/kg) (Table 1). Bulk-rockanalyses by ICP-OES revealed a significant degreeof linear correlation between Fe and S (R2 = 0.69)for all interval samples (Fig. 7, Appendix 1).
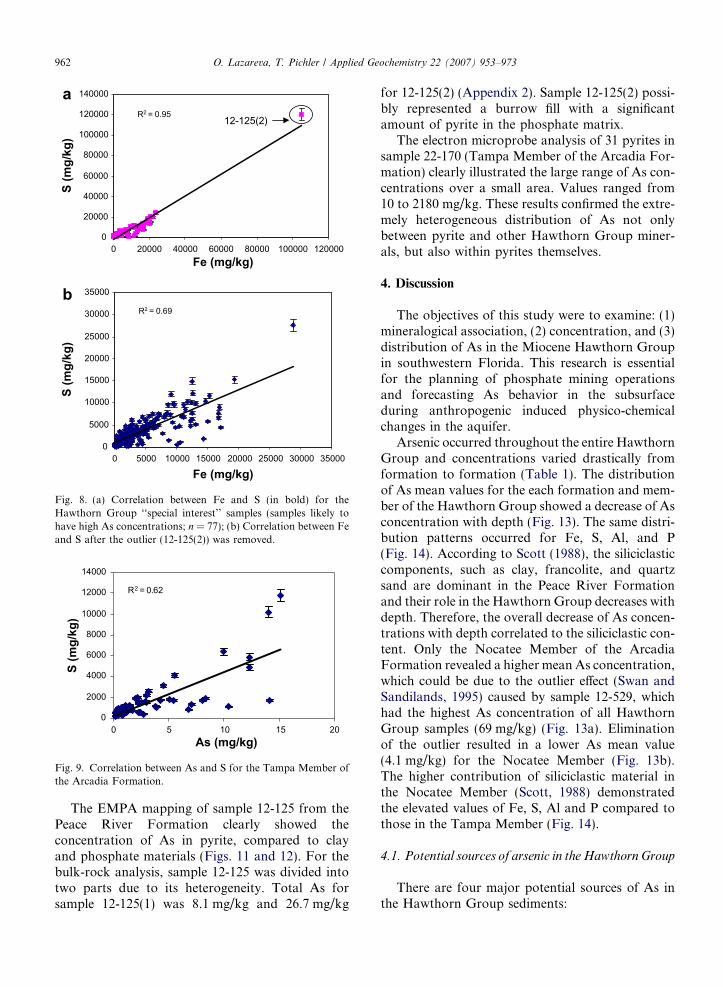
The bulk As concentrations of the 77 targetedsamples (samples likely to have high As concentra-tions) ranged from 0.4 to 69.0 mg/kg with a meanof 8.3 mg/kg (r = 10.5 mg/kg) (Table 1). Bulk-rockanalysis showed that a significant degree of linearcorrelation existed between Fe and S (R2 = 0.95)for the all ‘‘special interest’’ samples (Appendix 1),which could be due to the outlier effect (Swan andSandilands, 1995) caused by sample 12-125(2)(Fig. 8a). Elimination of the outlier point reducedthe correlation coefficient to R2 = 0.83 (Fig. 8b).
3.2.1. Arcadia Formation
The bulk As concentrations in samples from theundifferentiated Arcadia Formation varied from0.1 to 36.0 mg/kg with a mean of 5.7 mg/kg(r = 6.2 mg/kg) (Table 1). Approximately 88% and11% of the samples had <10 mg/kg and <1 mg/kgAs, respectively. Samples consisting mainly of lime-stone and dolostone showed low As concentrations,whereas higher concentrations were generally asso-ciated with pyrite, clay, HFO and francolite. A highdegree of linear correlation for the undifferentiatedArcadia Formation sediments existed for S withFe (R2 = 0.81), and Al with Fe (R2 = 0.74) (Appen-dix 1).
The bulk As concentrations in samples from theTampa Member of the Arcadia Formation rangedfrom 0.2 to 15.2 mg/kg (Table 1). The mean valuefor 75 samples was 3 mg/kg (r = 3.7 mg/kg).Approximately 92% and 39% of the samples con-tained <10 mg/kg and <1 mg/kg As, respectively.A high degree of linear correlation for the TampaMember samples existed for Al with Fe(R2 = 0.76), and Al with S (R2 = 0.78). The most
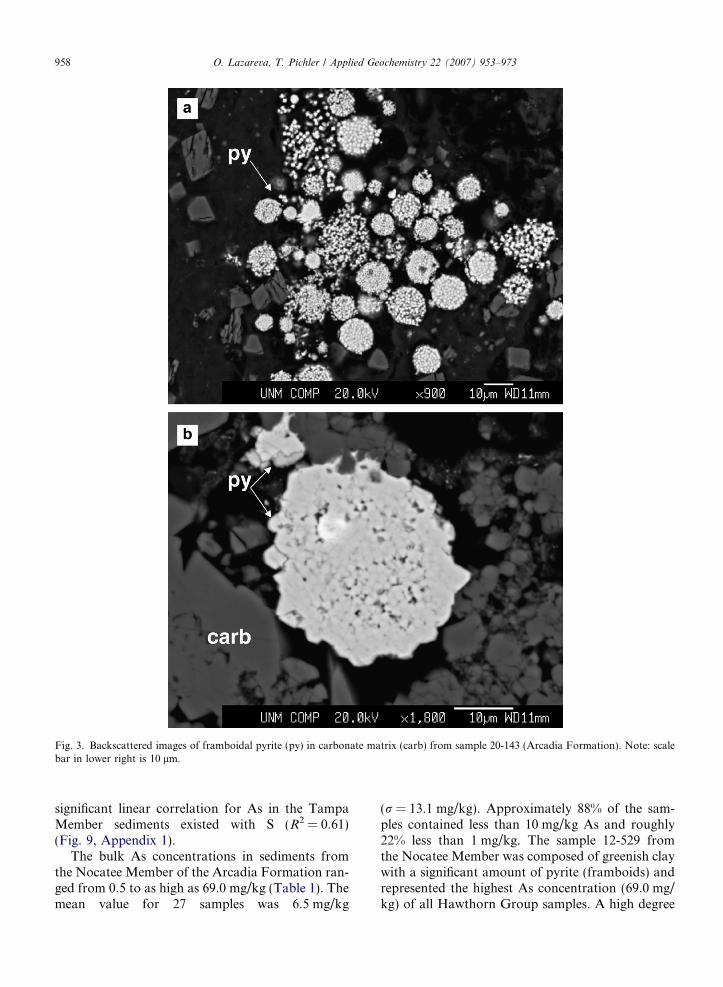
Fig. 3. Backscattered images of framboidal pyrite (py) in carbonate matrix (carb) from sample 20-143 (Arcadia Formation). Note: scalebar in lower right is 10 lm.
958 O. Lazareva, T. Pichler / Applied Geochemistry 22 (2007) 953–973
significant linear correlation for As in the TampaMember sediments existed with S (R2 = 0.61)(Fig. 9, Appendix 1).
The bulk As concentrations in sediments fromthe Nocatee Member of the Arcadia Formation ran-ged from 0.5 to as high as 69.0 mg/kg (Table 1). Themean value for 27 samples was 6.5 mg/kg
(r = 13.1 mg/kg). Approximately 88% of the sam-ples contained less than 10 mg/kg As and roughly22% less than 1 mg/kg. The sample 12-529 fromthe Nocatee Member was composed of greenish claywith a significant amount of pyrite (framboids) andrepresented the highest As concentration (69.0 mg/kg) of all Hawthorn Group samples. A high degree

Fig. 4. Scanning electron micrographs of pyrite: (a) Framboidal pyrite (py) and kaolinite (kaol) in sample 22-170 from the TampaMember (As concentration of the bulk sample is 14.0 mg/kg); note: scale bar in lower right is 10 lm. (b) Cubic pyrite (py) in sample 12-125(2) from the Peace River Formation (As concentration of the bulk sample is 26.7 mg/kg); note: scale bar in lower right is 50 lm.
O. Lazareva, T. Pichler / Applied Geochemistry 22 (2007) 953–973 959
of linear correlation for the Nocatee Member sedi-ments existed for Fe with S (R2 = 0.85), and Fe withAl (R2 = 0.81) (Appendix 1).
3.2.2. Peace River Formation
The total As concentrations in samples from thePeace River Formation ranged from 0.4 to 40.8 mg/kg (Table 1). Mean value for 54 samples was8.8 mg/kg (r = 8.6 mg/kg). Approximately 70% of
the samples had As concentrations less than10 mg/kg and about 7% less than 1 mg/kg (Appen-dix 2). Samples consisting mostly of pure carbonatesor sandstone with no visible trace minerals had lowconcentrations of As. Generally, high As concentra-tions occurred with pyrite, clay, HFO, andfrancolite.
The strongest linear correlation for the PeaceFormation sediments existed between Fe and S

Fig. 5. Backscattered image of pyrite (py) (in circles) in calcite (carb) matrix in sample 12-48 (Peace River Formation) taken with theEMPA using a JEOL 8200.
Table 1Maximum, minimum, mean and standard deviation of As concentrations in mg/kg for the Hawthorn Group and its Formations/Members
Maximum Minimum Mean Standard deviation (n)
Hawthorn Group (all samples) 69.0 0.1 5.6 7.1 362Hawthorn Group (interval samples) 40.8 0.1 5.0 5.8 285Hawthorn Group (‘‘special interest’’ samples) 69.0 0.4 8.3 10.5 77Undifferentiated Arcadia Formation 36.0 0.1 5.7 6.2 205Tampa Member 15.2 1.2 3.0 3.7 75Nocatee Member 69.0 0.5 6.5 13.1 27Peace River Formation 40.8 0.4 8.8 8.6 55
960 O. Lazareva, T. Pichler / Applied Geochemistry 22 (2007) 953–973
(R2 = 0.94) (Appendix 1), which could be due to theoutlier effect caused by sample 12-125(2). Removingthe outlier from the plot resulted in a significantlylower degree of linear correlation (R2 = 0.59). Thisis because analyzed samples contained not only pyr-ite, but also contained HFO and gypsum, sources ofFe and S.
3.3. Occurrence of arsenic in matrix and individual
minerals
After determination of bulk As concentrationssamples with high As were selected for a more
detailed geochemical and mineralogical investiga-tion. The electron-probe (EMPA) analysis of 16thin sections with variations in lithologic composi-tions revealed that substantial As concentrationswere present only in pyrite. About 126 pyrite fram-boids were analyzed for As and concentrationsranged from <1 to 8260 mg/kg with a mean of1272 mg/kg (r = 1379 mg/kg) (Table 2). Priorstudies of framboidal pyrite in the Suwannee Lime-stone, which underlies the Hawthorn Group, dem-onstrated a similar As enrichment in pyrite,ranging from 100 to 11200 mg/kg (Price andPichler, 2006).

R2 = 0.87
0
20000
40000
60000
80000
100000
120000
140000
0 20000 40000 60000 80000 100000 120000
S (m
g/kg
)
12-125(2)
Pyrite Line
R2 = 0.77
0
5000
10000
15000
20000
25000
30000
35000
0 5000 10000 15000 20000 25000 30000 35000
Fe (mg/kg)
Fe (mg/kg)
S (m
g/kg
) Pyrite Line
Fig. 6. (a) Correlation between Fe and S (in bold) for the Hawthorn Group all data (n = 362) analyzed by ICP-OES; (b) Correlationbetween Fe and S (in bold) after the outlier (12-125(2)) was removed. The ‘‘Pyrite line’’ represents pyrite dissolution as a source of Fe and S(Fe = 2S).
R2 = 0.69
0
5000
10000
15000
20000
25000
30000
35000
0 10000 20000 30000 40000Fe (mg/kg)
S (m
g/kg
)
Fig. 7. Correlation between Fe and S (in bold) for the HawthornGroup interval samples (n = 285).
O. Lazareva, T. Pichler / Applied Geochemistry 22 (2007) 953–973 961
The elemental maps of clays, pyrite, dolomite,quartz and francolite demonstrated that high con-centrations of As were generally associated withpyrite and sometimes with HFO. The elementalmap of a francolite nodule (sample 5-1-235, undif-ferentiated Arcadia Formation) revealed the pres-ence of very small pyrite crystals (<5 lm) insidethe nodule (Fig. 10). Arsenic values in these pyriteswere up to 3700 mg/kg while As values in the phos-phate matrix were <1 mg/kg. The elemental map-ping of sample 4-1-501 from the undifferentiatedArcadia Formation demonstrated As enrichmentin both pyrites and HFO, and showed a heteroge-neous distribution of As.
R2 = 0.95
0
20000
40000
60000
80000
100000
120000
140000
0 20000 40000 60000 80000 100000 120000
R2 = 0.69
0
5000
10000
15000
20000
25000
30000
35000
0 5000 10000 15000 20000 25000 30000 35000
Fe (mg/kg)
Fe (mg/kg)
S (m
g/kg
)S
(mg/
kg)
12-125(2)
Fig. 8. (a) Correlation between Fe and S (in bold) for theHawthorn Group ‘‘special interest’’ samples (samples likely tohave high As concentrations; n = 77); (b) Correlation between Feand S after the outlier (12-125(2)) was removed.
R2 = 0.62
0
2000
4000
6000
8000
10000
12000
14000
0 5 10 15 20As (mg/kg)
S (m
g/kg
)
Fig. 9. Correlation between As and S for the Tampa Member ofthe Arcadia Formation.
962 O. Lazareva, T. Pichler / Applied Geochemistry 22 (2007) 953–973
The EMPA mapping of sample 12-125 from thePeace River Formation clearly showed theconcentration of As in pyrite, compared to clayand phosphate materials (Figs. 11 and 12). For thebulk-rock analysis, sample 12-125 was divided intotwo parts due to its heterogeneity. Total As forsample 12-125(1) was 8.1 mg/kg and 26.7 mg/kg
for 12-125(2) (Appendix 2). Sample 12-125(2) possi-bly represented a burrow fill with a significantamount of pyrite in the phosphate matrix.
The electron microprobe analysis of 31 pyrites insample 22-170 (Tampa Member of the Arcadia For-mation) clearly illustrated the large range of As con-centrations over a small area. Values ranged from10 to 2180 mg/kg. These results confirmed the extre-mely heterogeneous distribution of As not onlybetween pyrite and other Hawthorn Group miner-als, but also within pyrites themselves.
4. Discussion
The objectives of this study were to examine: (1)mineralogical association, (2) concentration, and (3)distribution of As in the Miocene Hawthorn Groupin southwestern Florida. This research is essentialfor the planning of phosphate mining operationsand forecasting As behavior in the subsurfaceduring anthropogenic induced physico-chemicalchanges in the aquifer.
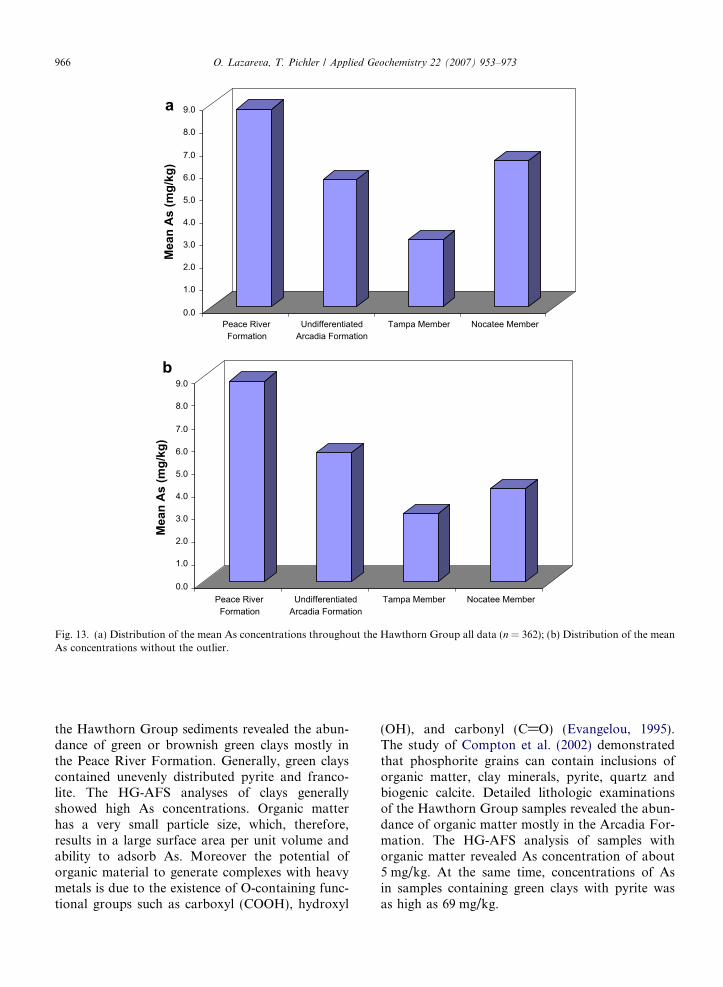
Arsenic occurred throughout the entire HawthornGroup and concentrations varied drastically fromformation to formation (Table 1). The distributionof As mean values for the each formation and mem-ber of the Hawthorn Group showed a decrease of Asconcentration with depth (Fig. 13). The same distri-bution patterns occurred for Fe, S, Al, and P(Fig. 14). According to Scott (1988), the siliciclasticcomponents, such as clay, francolite, and quartzsand are dominant in the Peace River Formationand their role in the Hawthorn Group decreases withdepth. Therefore, the overall decrease of As concen-trations with depth correlated to the siliciclastic con-tent. Only the Nocatee Member of the ArcadiaFormation revealed a higher mean As concentration,which could be due to the outlier effect (Swan andSandilands, 1995) caused by sample 12-529, whichhad the highest As concentration of all HawthornGroup samples (69 mg/kg) (Fig. 13a). Eliminationof the outlier resulted in a lower As mean value(4.1 mg/kg) for the Nocatee Member (Fig. 13b).The higher contribution of siliciclastic material inthe Nocatee Member (Scott, 1988) demonstratedthe elevated values of Fe, S, Al and P compared tothose in the Tampa Member (Fig. 14).
4.1. Potential sources of arsenic in the Hawthorn Group
There are four major potential sources of As inthe Hawthorn Group sediments:
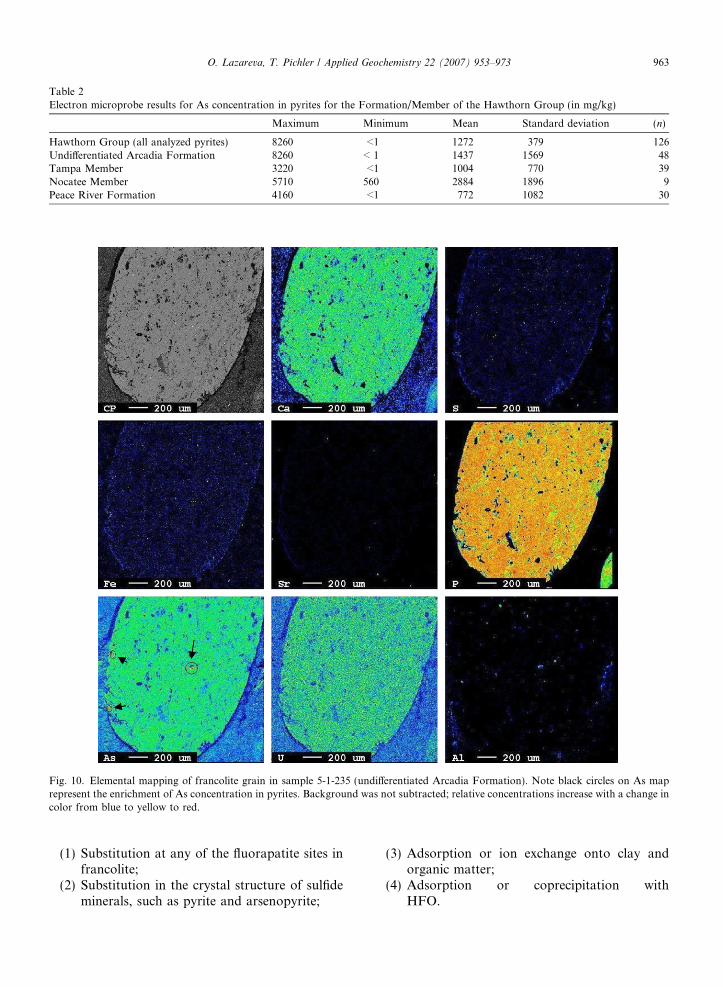
Table 2Electron microprobe results for As concentration in pyrites for the Formation/Member of the Hawthorn Group (in mg/kg)
Maximum Minimum Mean Standard deviation (n)
Hawthorn Group (all analyzed pyrites) 8260 <1 1272 379 126Undifferentiated Arcadia Formation 8260 < 1 1437 1569 48Tampa Member 3220 <1 1004 770 39Nocatee Member 5710 560 2884 1896 9Peace River Formation 4160 <1 772 1082 30
Fig. 10. Elemental mapping of francolite grain in sample 5-1-235 (undifferentiated Arcadia Formation). Note black circles on As maprepresent the enrichment of As concentration in pyrites. Background was not subtracted; relative concentrations increase with a change incolor from blue to yellow to red.
O. Lazareva, T. Pichler / Applied Geochemistry 22 (2007) 953–973 963
(1) Substitution at any of the fluorapatite sites infrancolite;
(2) Substitution in the crystal structure of sulfideminerals, such as pyrite and arsenopyrite;
(3) Adsorption or ion exchange onto clay andorganic matter;
(4) Adsorption or coprecipitation withHFO.
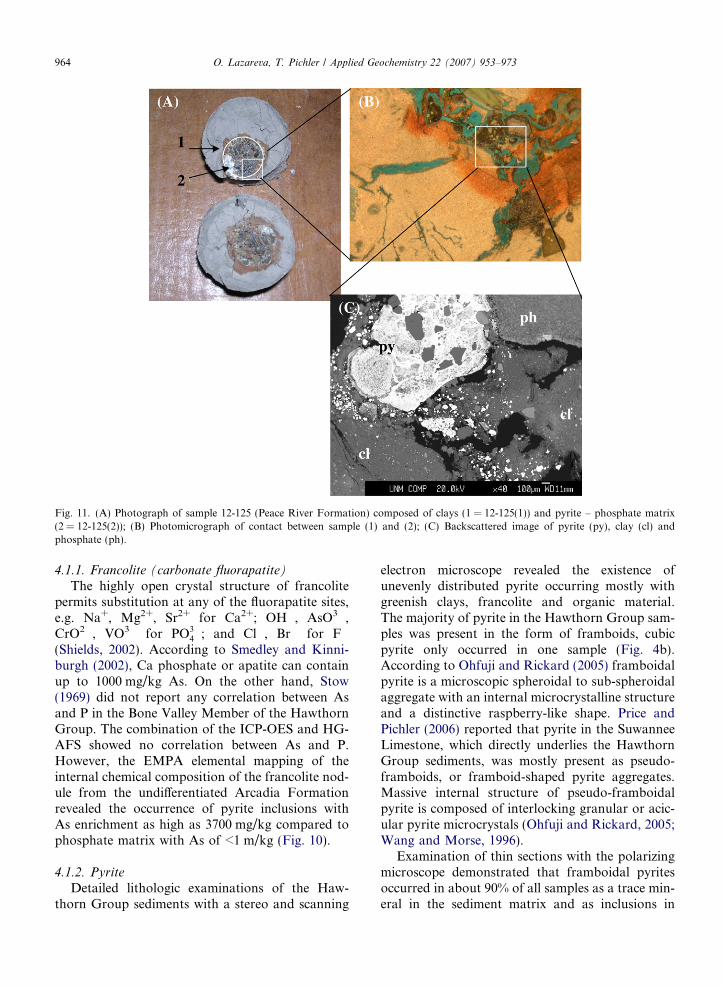
Fig. 11. (A) Photograph of sample 12-125 (Peace River Formation) composed of clays (1 = 12-125(1)) and pyrite – phosphate matrix(2 = 12-125(2)); (B) Photomicrograph of contact between sample (1) and (2); (C) Backscattered image of pyrite (py), clay (cl) andphosphate (ph).
964 O. Lazareva, T. Pichler / Applied Geochemistry 22 (2007) 953–973
4.1.1. Francolite (carbonate fluorapatite)
The highly open crystal structure of francolitepermits substitution at any of the fluorapatite sites,e.g. Na+, Mg2+, Sr2+ for Ca2+; OH�, AsO3�,CrO2�, VO3� for PO3�
4 ; and Cl�, Br� for F�
(Shields, 2002). According to Smedley and Kinni-burgh (2002), Ca phosphate or apatite can containup to 1000 mg/kg As. On the other hand, Stow(1969) did not report any correlation between Asand P in the Bone Valley Member of the HawthornGroup. The combination of the ICP-OES and HG-AFS showed no correlation between As and P.However, the EMPA elemental mapping of theinternal chemical composition of the francolite nod-ule from the undifferentiated Arcadia Formationrevealed the occurrence of pyrite inclusions withAs enrichment as high as 3700 mg/kg compared tophosphate matrix with As of <1 m/kg (Fig. 10).
4.1.2. Pyrite
Detailed lithologic examinations of the Haw-thorn Group sediments with a stereo and scanning
electron microscope revealed the existence ofunevenly distributed pyrite occurring mostly withgreenish clays, francolite and organic material.The majority of pyrite in the Hawthorn Group sam-ples was present in the form of framboids, cubicpyrite only occurred in one sample (Fig. 4b).According to Ohfuji and Rickard (2005) framboidalpyrite is a microscopic spheroidal to sub-spheroidalaggregate with an internal microcrystalline structureand a distinctive raspberry-like shape. Price andPichler (2006) reported that pyrite in the SuwanneeLimestone, which directly underlies the HawthornGroup sediments, was mostly present as pseudo-framboids, or framboid-shaped pyrite aggregates.Massive internal structure of pseudo-framboidalpyrite is composed of interlocking granular or acic-ular pyrite microcrystals (Ohfuji and Rickard, 2005;Wang and Morse, 1996).
Examination of thin sections with the polarizingmicroscope demonstrated that framboidal pyritesoccurred in about 90% of all samples as a trace min-eral in the sediment matrix and as inclusions in

Fig. 12. Elemental mapping of pyrite in sample 12-125 (Peace River Formation). Note increase of As concentration in pyrite compare tomatrix. Background was subtracted; relative concentrations increase with a change in color from blue to yellow to red.
O. Lazareva, T. Pichler / Applied Geochemistry 22 (2007) 953–973 965
francolite grains and calcite crystals. Prior studies ofsulfide minerals such as the abundance and occur-rence of pyrite in the Suwannee Limestone (Priceand Pichler, 2006) revealed significant enrichmentof As in pyrite with concentrations as high as11200 mg/kg. Thomas and Saunders (1998)reported As concentrations in pyrite framboids ofup to 1000 mg/kg as a substitute element for S inthe FeS2 structure. Huerta-Diaz and Morse (1990,1992) found As concentrations in marine sedimen-tary pyrites of up to 9300 mg/kg. Therefore, sedi-mentary pyrite can be a significant sink andpotential source of As.
The ICP-OES results revealed a strong linear cor-relation between S and Fe (R2 = 0.87) confirming
the presence of pyrite (Fig. 6). Lack of a significantcorrelation between As and S or Fe was probablydue to the contribution of As from other sources,such as clays, HFO, francolite, or organic matter.The electron microprobe analyses of 16 thin sectionswith variations in lithologic composition revealedthat substantial As concentrations were present inpyrite. Arsenic concentrations in 126 analyzed pyr-ites ranged from <1 to as high as 8260 mg/kg show-ing the heterogeneous distribution of As (Table 2).
4.1.3. Clay and organic matter
Clay minerals readily adsorb As because of theoxide-like character of the edges of their crystals(Goldberg, 2002). The lithologic examination of
0.0
1.0
2.0
3.0
4.0
5.0
6.0
7.0
8.0
9.0
0.0
1.0
2.0
3.0
4.0
5.0
6.0
7.0
8.0
9.0
Mea
n A
s (m
g/kg
)
Peace RiverFormation
UndifferentiatedArcadia Formation
Tampa Member Nocatee Member
Mea
n A
s (m
g/kg
)
Peace RiverFormation
UndifferentiatedArcadia Formation
Tampa Member Nocatee Member
Fig. 13. (a) Distribution of the mean As concentrations throughout the Hawthorn Group all data (n = 362); (b) Distribution of the meanAs concentrations without the outlier.
966 O. Lazareva, T. Pichler / Applied Geochemistry 22 (2007) 953–973
the Hawthorn Group sediments revealed the abun-dance of green or brownish green clays mostly inthe Peace River Formation. Generally, green clayscontained unevenly distributed pyrite and franco-lite. The HG-AFS analyses of clays generallyshowed high As concentrations. Organic matterhas a very small particle size, which, therefore,results in a large surface area per unit volume andability to adsorb As. Moreover the potential oforganic material to generate complexes with heavymetals is due to the existence of O-containing func-tional groups such as carboxyl (COOH), hydroxyl
(OH), and carbonyl (C@O) (Evangelou, 1995).The study of Compton et al. (2002) demonstratedthat phosphorite grains can contain inclusions oforganic matter, clay minerals, pyrite, quartz andbiogenic calcite. Detailed lithologic examinationsof the Hawthorn Group samples revealed the abun-dance of organic matter mostly in the Arcadia For-mation. The HG-AFS analysis of samples withorganic matter revealed As concentration of about5 mg/kg. At the same time, concentrations of Asin samples containing green clays with pyrite wasas high as 69 mg/kg.

0
2000
4000
6000
8000
10000
12000
14000
16000
Mea
n (m
g/kg
)
Peace RiverFormation
UndifferentiatedArcadia Formation
Tampa Member Nocatee Member
Mean S (ppm)
Mean Fe (ppm)
Mean Al (ppm)
Mean P (ppm)
Fig. 14. Distribution of the mean S, Fe, Al and P concentrations throughout the Hawthorn Group all data (n = 362).
O. Lazareva, T. Pichler / Applied Geochemistry 22 (2007) 953–973 967
4.1.4. Hydrous ferric oxides (HFO)
It has been shown that As incorporates into sed-iments by co-precipitation with HFO, or isadsorbed onto the extremely high surface area ofprecipitated HFO (Hongshao and Stanforth, 2001;Evangelou, 1995; Pichler et al., 1999). The closeconnection between HFO and As is well docu-mented (e.g., Pichler et al., 2001; Pichler and Veizer,1999). Stow (1969) reported that most of the As inthe Bone Valley Member of the Hawthorn Groupwas adsorbed onto HFO. Detailed lithologic exam-inations revealed the occurrence of HFO through-out the Hawthorn Group as stains or rings aroundpyrites. According to Compton et al. (1993) rework-ing of the Hawthorn Group sediment during peri-ods of marine regressions caused oxidation ofsome pyrite and formation of HFO. The electronmicroprobe analysis showed that HFO from theundifferentiated Arcadia Formation contained upto 540 mg/kg As.
4.2. Quantified role of pyrite
It appears that framboidal pyrite contained themajority of As in the Hawthorn Group. This canbe verified by a simple mass balance approach using
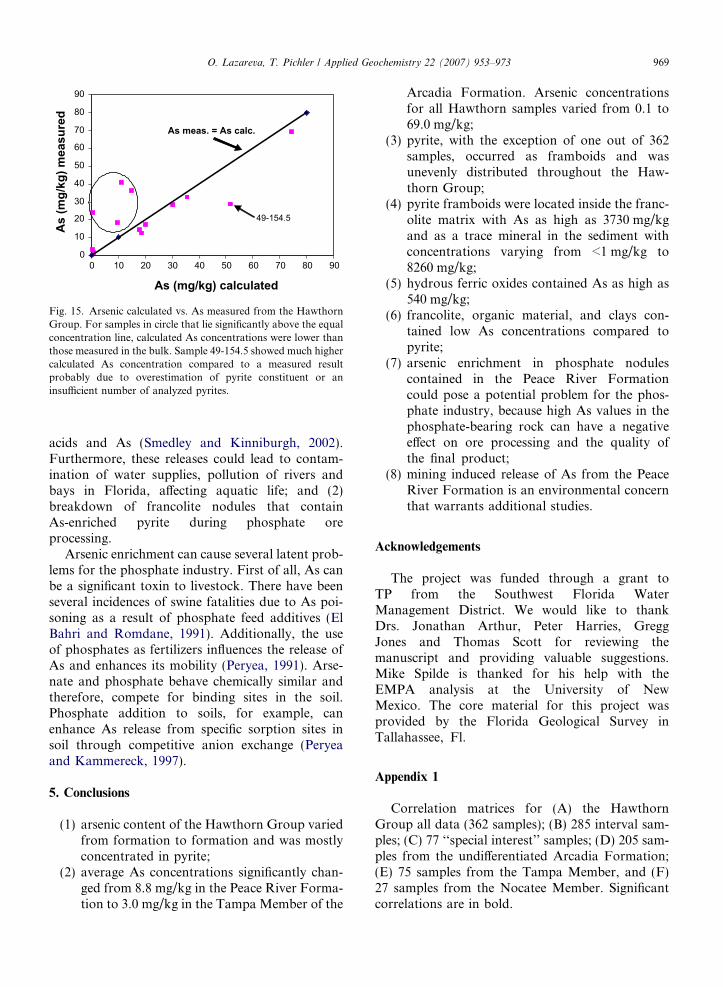
the bulk concentrations of Fe, S and As combinedwith As concentrations in individual pyrites. Dueto the strong linear correlation between S and Fe(R2 = 0.87), it is conceivable that Fe and S in Haw-thorn Group samples are controlled largely by thepresence of pyrite. The pyrite line (Fe = 2S) repre-sents Fe/S ratios that are exclusively controlled bypyrite (Fig. 6). Thus, using the values of S and Fe,the abundance of pyrite in each sample was calcu-lated. Then, the calculated amount of pyrite wasmultiplied by the mean As concentration in pyriteof each analyzed thin section and compared to theactual analyzed bulk As concentrations (Table 3).Calculated and measured As were compared inFig. 15. For those samples that lie significantlyabove the equal concentration line, calculated Asconcentrations were lower than those measured inthe bulk sample (Fig. 15). These results can beexplained by existence of other sources of As (clays,francolite, organic material, HFO) or underestima-tion of the possible amount of pyrite, or an insuffi-cient number of analyzed pyrite crystals. Sample 49-154.5 showed much higher calculated As concentra-tion compared to a measured result probably due tooverestimation of pyrite constituent or an insuffi-cient number of analyzed pyrites.

Tab
le3
Cal
cula
ted
As
con
cen
trat
ion
sin
pyr
ite
com
par
edto
mea
sure
db
ulk
As
con
cen
trat
ion
s
Sam
ple
Haw
tho
rnF
m/M
ma
S(m
g/k
g)F
e(m
g/k
g)F
eS2
(mg/
kg)
FeS
2(%
)M
ean
As
mea
sure
din
pyr
ite
(mg/
kg)
(n)
As
calc
ula
ted
inp
yrit
e(m
g/k
g)A
sm
easu
red
inb
ulk
(mg/
kg)
9-30
PR
4479
3905
8384
113
3715
1141
13-1
95P
R75
4565
7914
124
168
84
1018
12-4
8P
R58
3350
8610
919
115
40
320
-215
AF
7293
6358
1365
11
1096
1015
3620
-143
AF
7429
6477
1390
61
2570
1136
3249
-154
.5A
F10
569
9210
1977
32
2620
352
285-
1-23
5A
F73
5064
0813
758
114
688
2017
25-2
99A
F93
5681
5817
514
217
345
3028
4-1-
501
AF
2839
2475
5314
118
65
11
5-32
0A
F95
9583
6517
960
234
51
2422
-170
AF
1019
088
8319
073
292
931
1814
3-3-
275
AF
4892
4265
9157
120
365
1912
12-5
29N
M13
805
1203
625
841
328
849
7569
aH
awth
orn
Gro
up
Fo
rmat
ion
/Mem
ber
:P
R–
Pea
ceR
iver
Fo
rmat
ion
,A
F–
Arc
adia
Fo
rmat
ion
,N
M–
No
cate
eM
emb
er,
(n)
–n
um
ber
of
pyr
ites
inea
chth
inse
ctio
n.
968 O. Lazareva, T. Pichler / Applied Geochemistry 22 (2007) 953–973
4.3. Mobilization of arsenic during phosphate
mining
Apatite group minerals are stable under abroad range of geologic conditions for millionsof years (Wright, 1990; Nriagu, 1974). The traceelemental composition of the apatite fossil teethand bones, and analyses of the sedimentaryphosphorite deposits by Wright (1990) and others(Keto and Jacobsen, 1987; Shaw and Wasserburg,1985) has revealed that biogenic and sedimentaryapatite incorporates considerable amounts ofradionuclides and metals from seawater. Differentelements substitute for Ca, PO4 and OH in theapatite crystal structure (Skinner and Catherine,2002). Apatite locks these metals and radionuc-lides in a crystal structure for up to a billion yearswith no consequent leaching, exchange or desorp-tion, even due to diagenetic changes in waterchemistry, pH and temperatures. This is becausethe apatite mineral structure is very stable in abroad range of environmental conditions, suchas pH 2 to 12, temperature as high as 1000 �C,and the presence of aqueous and non-aqueoussolutions (Shields, 2002). Studies of the carbonatefluorapatite, francolite by McConnell (1973),Jahnke (1984) and Regnier et al. (1994) howeversuggest that the substitution of CO2�
3 in carbonatefluorapatite leads to the destabilization of itscrystal structure and, therefore, increase insolubility.
The Peace River Formation of the HawthornGroup contains substantial amounts of francoliteand is currently being exploited for phosphateore. According to the present study, the PeaceRiver Formation contained the highest concentra-tion of As (l = 8.8 mg/kg) in the HawthornGroup (Table 1). Detailed mineralogical analyseshave confirmed the presence of ubiquitousframboidal pyrites harboring considerableamounts of As. In addition, EMPA elementalmapping has revealed that pyrite crystals werelocated both inside the francolite matrix with Asas high as 3730 mg/kg (Fig. 10) and as a tracemineral in the sediment matrix with varyingconcentrations.
Because of the complicated distribution of pyr-ite in the Hawthorn Group, there are severalpotential scenarios that could lead to the mobili-zation of As during phosphate mining: (1) Oxida-tion of pyrite under aerobic conditions that couldcause the release of substantial amounts of SO4,
0
10
20
30
40
50
60
70
80
90
0 10 20 30 40 50 60 70 80 90
As (mg/kg) calculated
As
(mg/
kg) m
easu
red
As meas. = As calc.
49-154.5
Fig. 15. Arsenic calculated vs. As measured from the HawthornGroup. For samples in circle that lie significantly above the equalconcentration line, calculated As concentrations were lower thanthose measured in the bulk. Sample 49-154.5 showed much highercalculated As concentration compared to a measured resultprobably due to overestimation of pyrite constituent or aninsufficient number of analyzed pyrites.
O. Lazareva, T. Pichler / Applied Geochemistry 22 (2007) 953–973 969
acids and As (Smedley and Kinniburgh, 2002).Furthermore, these releases could lead to contam-ination of water supplies, pollution of rivers andbays in Florida, affecting aquatic life; and (2)breakdown of francolite nodules that containAs-enriched pyrite during phosphate oreprocessing.
Arsenic enrichment can cause several latent prob-lems for the phosphate industry. First of all, As canbe a significant toxin to livestock. There have beenseveral incidences of swine fatalities due to As poi-soning as a result of phosphate feed additives (ElBahri and Romdane, 1991). Additionally, the useof phosphates as fertilizers influences the release ofAs and enhances its mobility (Peryea, 1991). Arse-nate and phosphate behave chemically similar andtherefore, compete for binding sites in the soil.Phosphate addition to soils, for example, canenhance As release from specific sorption sites insoil through competitive anion exchange (Peryeaand Kammereck, 1997).
5. Conclusions
(1) arsenic content of the Hawthorn Group variedfrom formation to formation and was mostlyconcentrated in pyrite;
(2) average As concentrations significantly chan-ged from 8.8 mg/kg in the Peace River Forma-tion to 3.0 mg/kg in the Tampa Member of the
Arcadia Formation. Arsenic concentrationsfor all Hawthorn samples varied from 0.1 to69.0 mg/kg;
(3) pyrite, with the exception of one out of 362samples, occurred as framboids and wasunevenly distributed throughout the Haw-thorn Group;
(4) pyrite framboids were located inside the franc-olite matrix with As as high as 3730 mg/kgand as a trace mineral in the sediment withconcentrations varying from <1 mg/kg to8260 mg/kg;
(5) hydrous ferric oxides contained As as high as540 mg/kg;
(6) francolite, organic material, and clays con-tained low As concentrations compared topyrite;
(7) arsenic enrichment in phosphate nodulescontained in the Peace River Formationcould pose a potential problem for the phos-phate industry, because high As values in thephosphate-bearing rock can have a negativeeffect on ore processing and the quality ofthe final product;
(8) mining induced release of As from the PeaceRiver Formation is an environmental concernthat warrants additional studies.
Acknowledgements
The project was funded through a grant toTP from the Southwest Florida WaterManagement District. We would like to thankDrs. Jonathan Arthur, Peter Harries, GreggJones and Thomas Scott for reviewing themanuscript and providing valuable suggestions.Mike Spilde is thanked for his help with theEMPA analysis at the University of NewMexico. The core material for this project wasprovided by the Florida Geological Survey inTallahassee, Fl.
Appendix 1
Correlation matrices for (A) the HawthornGroup all data (362 samples); (B) 285 interval sam-ples; (C) 77 ‘‘special interest’’ samples; (D) 205 sam-ples from the undifferentiated Arcadia Formation;(E) 75 samples from the Tampa Member, and (F)27 samples from the Nocatee Member. Significantcorrelations are in bold.

Ca Fe Mg Mn Si S P Al As
(A)Ca 1 �0.43 �0.13 �0.24 �0.29 �0.27 �0.12 �0.64 �0.29Fe 1 �0.03 0.38 0.25 0.87 0.27 0.57 0.35Mg 1 0.23 0.09 �0.01 <0.01 0.04 0.04Mn 1 0.11 0.30 0.36 0.41 0.27Si 1 0.22 0.28 0.24 0.28S 1 0.29 0.35 0.40P 1 0.28 0.14Al 1 0.25As 1
(B)Ca 1 �0.55 �0.17 �0.24 �0.25 �0.4 �0.16 �0.59 �0.09Fe 1 0.04 0.47 0.31 0.69 0.30 0.63 0.32Mg 1 0.27 0.09 0.09 �0.02 0.07 0.01Mn 1 0.15 0.42 0.38 0.42 0.07Si 1 0.37 0.32 0.26 0.06S 1 0.37 0.35 0.26P 1 0.33 0.19Al 1 0.25As 1
(C)Ca 1 �0.11 <0.01 �0.07 �0.12 �0.05 <0.01 �0.48 �0.05Fe 1 0.03 0.2 0.04 0.95 0.08 0.15 0.17Mg 1 0.03 <0.01 0.003 <0.01 <0.01 <0.01Mn 1 <0.01 0.16 0.07 0.20 0.11Si 1 0.03 0.06 0.02 0.10S 1 0.11 0.06 0.13P 1 0.02 0.10Al 1 0.15As 1
(D)Ca 1 �0.46 �0.17 �0.19 �0.28 �0.32 �0.06 �0.51 �0.14Fe 1 �0.06 0.38 0.18 0.81 0.14 0.74 0.30Mg 1 0.19 �0.01 �0.08 �0.11 �0.03 <0.01Mn 1 0.03 0.37 0.33 0.35 0.12Si 1 0.18 0.23 0.23 0.02S 1 0.27 0.51 0.28P 1 0.21 0.10Al 1 0.35As 1
(E)Ca 1 �0.52 �0.27 �0.18 �0.28 �0.34 �0.29 �0.58 �0.17Fe 1 0.24 0.44 0.19 0.63 0.51 0.76 0.53Mg 1 0.54 0.23 0.24 0.03 0.22 0.11Mn 1 0.25 0.30 0.05 0.29 0.23Si 1 0.16 0.08 0.16 0.23
970 O. Lazareva, T. Pichler / Applied Geochemistry 22 (2007) 953–973

Appendix 1 (continued)
Ca Fe Mg Mn Si S P Al As
S 1 0.58 0.78 0.61P 1 0.48 0.16Al 1 0.55As 1
(F)Ca 1 �0.44 �0.12 �0.39 �0.28 �0.38 �0.01 �0.36 �0.08Fe 1 0.25 0.77 0.50 0.85 0.03 0.81 0.49Mg 1 0.31 �0.05 0.13 0.29 0.42 <0.01Mn 1 0.58 0.61 0.10 0.45 0.11Si 1 0.74 0.16 0.44 0.61S 1 0.12 0.51 0.51P 1 0.05 <0.01Al 1 0.28As 1
O. Lazareva, T. Pichler / Applied Geochemistry 22 (2007) 953–973 971
Appendix 2
Inductively coupled plasma – opticalemission spectrometry (ICP-OES) and hydride
Sample Ca Fe Mg Mn
39-47.5-52.5 <0.01 264 <0.01 2.539-72.5-77.5 42 920 2284 <0.01 44.839-100 28 872 12223 20962 84.639-125 116 704 4712 61947 148.839-130 52 157 15487 16759 99.639-150 82 302 14666 56559 259.939-155 80 199 8075 22954 140.539-173-178 58 628 3258 1892 55.922-20 168 057 14362 2187 85.222-29 22 989 9004 5216 28.222-45 155 462 11164 90636 184.930-Sep 45 277 17101 10695 30.425-45-47 59 901 1520 <0.01 14.925-65-70 220 330 15330 48352 97.325-90 268 317 7178 97030 106.4TR-9-2-40 39 167 12500 44510 98.520-38.5 206 198 5822 15018 47.120-48.5 16 834 16283 13377 37.620-65 250 873 2509 140861 50.617-50-56 353 922 6176 27941 209.817-70 148 529 13088 40882 455.4DV-1-6 <0.01 8 <0.01 <0.0DV-1-25-26 66 162 1889 <0.01 27.3
generation-atomic fluorescence spectrometry(HG-AFS) results for the Peace River Formationsamples sorted by well (concentrations inmg/kg)
Si S P Al As
133 55 326 761 0.4851 1713 17667 2019 8.1347 4814 8117 19635 6.1308 3800 9277 8131 4.3383 11 014 6760 19303 6.5652 10 390 7504 21844 6.1347 6876 15143 14436 5.3623 3065 20941 3512 5.9
2376 1825 55029 12217 11.2449 487 8036 11465 5.3416 6815 8929 14106 9.3242 4479 12602 23236 40.8
1347 1292 22199 4550 4.51645 11 597 48881 13462 37.21503 7327 41624 9307 13.12892 6275 7404 18873 4.03583 5632 60253 3033 12.2
894 13 379 4801 12826 9.8666 2466 1842 1857 1.9
1407 4142 29614 4382 9.7859 9901 34632 13824 9.4
1 56 103 161 1414 1.3954 200 50000 46212 1.1
(continued on next page)
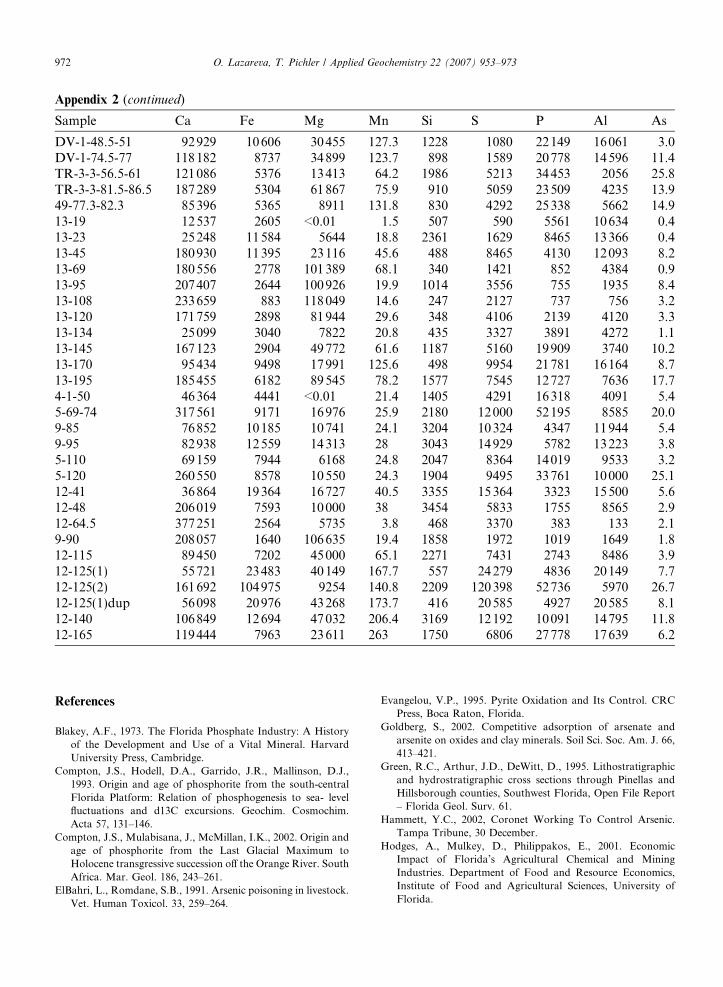
Appendix 2 (continued)
Sample Ca Fe Mg Mn Si S P Al As
DV-1-48.5-51 92929 10606 30 455 127.3 1228 1080 22149 16061 3.0DV-1-74.5-77 118182 8737 34 899 123.7 898 1589 20778 14596 11.4TR-3-3-56.5-61 121086 5376 13 413 64.2 1986 5213 34453 2056 25.8TR-3-3-81.5-86.5 187289 5304 61 867 75.9 910 5059 23509 4235 13.949-77.3-82.3 85396 5365 8911 131.8 830 4292 25338 5662 14.913-19 12537 2605 <0.01 1.5 507 590 5561 10634 0.413-23 25248 11584 5644 18.8 2361 1629 8465 13366 0.413-45 180930 11395 23 116 45.6 488 8465 4130 12093 8.213-69 180556 2778 101 389 68.1 340 1421 852 4384 0.913-95 207407 2644 100 926 19.9 1014 3556 755 1935 8.413-108 233659 883 118 049 14.6 247 2127 737 756 3.213-120 171759 2898 81 944 29.6 348 4106 2139 4120 3.313-134 25099 3040 7822 20.8 435 3327 3891 4272 1.113-145 167123 2904 49 772 61.6 1187 5160 19909 3740 10.213-170 95434 9498 17 991 125.6 498 9954 21781 16164 8.713-195 185455 6182 89 545 78.2 1577 7545 12727 7636 17.74-1-50 46364 4441 <0.01 21.4 1405 4291 16318 4091 5.45-69-74 317561 9171 16 976 25.9 2180 12 000 52195 8585 20.09-85 76852 10185 10 741 24.1 3204 10 324 4347 11944 5.49-95 82938 12559 14 313 28 3043 14 929 5782 13223 3.85-110 69159 7944 6168 24.8 2047 8364 14019 9533 3.25-120 260550 8578 10 550 24.3 1904 9495 33761 10000 25.112-41 36864 19364 16 727 40.5 3355 15 364 3323 15500 5.612-48 206019 7593 10 000 38 3454 5833 1755 8565 2.912-64.5 377251 2564 5735 3.8 468 3370 383 133 2.19-90 208057 1640 106 635 19.4 1858 1972 1019 1649 1.812-115 89450 7202 45 000 65.1 2271 7431 2743 8486 3.912-125(1) 55721 23483 40 149 167.7 557 24 279 4836 20149 7.712-125(2) 161692 104975 9254 140.8 2209 120 398 52736 5970 26.712-125(1)dup 56098 20976 43 268 173.7 416 20 585 4927 20585 8.112-140 106849 12694 47 032 206.4 3169 12 192 10091 14795 11.812-165 119444 7963 23 611 263 1750 6806 27778 17639 6.2
972 O. Lazareva, T. Pichler / Applied Geochemistry 22 (2007) 953–973
References
Blakey, A.F., 1973. The Florida Phosphate Industry: A History
of the Development and Use of a Vital Mineral. Harvard
University Press, Cambridge.
Compton, J.S., Hodell, D.A., Garrido, J.R., Mallinson, D.J.,
1993. Origin and age of phosphorite from the south-central
Florida Platform: Relation of phosphogenesis to sea- level
fluctuations and d13C excursions. Geochim. Cosmochim.
Acta 57, 131–146.
Compton, J.S., Mulabisana, J., McMillan, I.K., 2002. Origin and
age of phosphorite from the Last Glacial Maximum to
Holocene transgressive succession off the Orange River. South
Africa. Mar. Geol. 186, 243–261.
ElBahri, L., Romdane, S.B., 1991. Arsenic poisoning in livestock.
Vet. Human Toxicol. 33, 259–264.
Evangelou, V.P., 1995. Pyrite Oxidation and Its Control. CRC
Press, Boca Raton, Florida.
Goldberg, S., 2002. Competitive adsorption of arsenate and
arsenite on oxides and clay minerals. Soil Sci. Soc. Am. J. 66,
413–421.
Green, R.C., Arthur, J.D., DeWitt, D., 1995. Lithostratigraphic
and hydrostratigraphic cross sections through Pinellas and
Hillsborough counties, Southwest Florida, Open File Report
– Florida Geol. Surv. 61.
Hammett, Y.C., 2002, Coronet Working To Control Arsenic.
Tampa Tribune, 30 December.
Hodges, A., Mulkey, D., Philippakos, E., 2001. Economic
Impact of Florida’s Agricultural Chemical and Mining
Industries. Department of Food and Resource Economics,
Institute of Food and Agricultural Sciences, University of
Florida.

O. Lazareva, T. Pichler / Applied Geochemistry 22 (2007) 953–973 973
Hongshao, Z., Stanforth, R., 2001. Competitive adsorption of
phosphate and arsenate on goethite. Environ. Sci. Technol.
35, 4753–4757.
Huerta-Diaz, M.A., Morse, J.W., 1990. Geochemistry of trace
metals associated with sedimentary pyrite from anoxic marine
sediments. Eos. Trans. Am. Geophys. Union 71 (2), 98.
Huerta-Diaz, M.A., Morse, J.W., 1992. Pyritization of trace
metals in anoxic marine sediments. Geochim. Cosmochim.
Acta 56, 2681–2702.
Jahnke, R.A., 1984. The synthesis and solubility of carbonate
fluorapatite. Am. J. Sci. 284, 58–78.
Keto, L.S., Jacobsen, S.B., 1987. Nd and Sr isotopic variations of
early Paleozoic oceans. Earth Planet. Sci. Lett. 84, 27–41.
McConnell, D., 1973. Apatite, Its Crystal Chemistry, Mineral-
ogy, and Geologic and Biologic Occurrences. III. Springer-
Verlag, Berlin.
Miller, J.A., 1986. Hydrogeologic framework of the Floridan
aquifer system in Florida and in parts of Georgia, South
Carolina, and Alabama. U.S. Geol. Surv. Prof. Pap. P 1403-
B, B1-B91.
Nriagu, 1974. Lead orthophosphates, IV. Formation and stability
in the environment. Geochim. Cosmochim. Acta 38, 887–898.
Ohfuji, H., Rickard, D., 2005. Experimental syntheses of fram-
boids-a review. Earth Sci. Rev. 71, 147–170.
Peryea, F.J., 1991. Phosphate-induced release of arsenic from
soils contaminated with lead arsenate. Soil Sci. Soc. Am. J. 55,
1301–1306.
Peryea, F.J., Kammereck, R., 1997. Phosphate-enhanced move-
ment of arsenic out of lead arsenate-contaminated topsoil and
through uncontaminated subsoil. Water Air Soil Poll. 93
(1–4), 243–254.
Pichler, T., Veizer, J., 1999. Precipitation of Fe III oxyhydroxide
deposits from shallow-water hydrothermal fluids in Tutum
Bay, Ambitle Island, Papua New Guinea. Chem. Geol. 162,
15–31.
Pichler, T., Veizer, J., Hall, G.E.M., 1999. The natural input of
extremely high arsenic concentrations into a coral reef
ecosystem by hydrothermal fluids and its removal by Fe(III)
oxyhydroxides. Environ. Sci. Technol. 33, 1373–1378.
Pichler, T., Hendry, J., Hall, G.E.M., 2001. The mineralogy of
arsenic in uranium mine tailings at the rabbit lake in-pit
facility, Northern Saskatchewan, Canada. Environ. Geol. 40,
495–506.
Price, R.E., Pichler, T., 2006. Abundance and mineralogical
association of arsenic in the Suwannee Limestone (Florida):
implications for arsenic release during water-rock interaction.
Chem. Geol. 228, 44–56.
Regnier, P., Lasaga, A.C., Berner, R.A., Han, O.H., Zilm,
K.W., 1994. Mechanism of CO2�3 substitution in carbon-
ate flurapatite: Evidence from FTIR spectroscopy, 13C
NMR, and quantum mechanical calculations. Am. Min-
eral. 79, 809–818.
Scott, T.M., 1988. The lithostratigraphy of the Hawthorn Group
(Miocene) of Florida. Florida Geol. Surv. Bull., 59.
Scott, T.M., 1990. The lithostratigraphy of the Hawthorn Group
of peninsular Florida. Open File Report Florida Geol. Surv.,
36.
Shaw, H.F., Wasserburg, G.J., 1985. Sm–Nd in marine carbon-
ates and phosphates: implications for Nd isotopes in seawater
and crustal ages. Geochim. Cosmochim. Acta 49, 503–518.
Shields, G., 2002. Phosphorites: a mine of information. Econ.
Geol. Res. Unit Newslett, 6–7.
Skinner, H., Catherine, W., 2002. In praise of phosphates, or
why vertebrates chose apatite to mineralize their skeletal
elements. In: Ernst, W.G. (Ed.), Frontiers in Geochemis-
try; Organic, Solution, and Ore Deposit Geochemistry;
Konrad Krauskopf, vol. 2. International Book Series, pp.
41–49.
Smedley, P.L., Kinniburgh, D.C., 2002. A review of the source,
behavior and distribution of arsenic in natural waters. Appl.
Geochem. 17, 517–568.
Stow, S.H., 1969. The occurrence of arsenic and the color-causing
components in Florida land-pebble phosphate rock. Econ.
Geol. 64, 667–671.
Swan, A.R.H., Sandilands, M., 1995. Introduction to Geological
Data Analysis. Blackwell Science, Oxford.
Thomas, R.C., Saunders, J.A., 1998. Arsenic coprecipitation in
low temperature pyrites: implications for bioremediation via
sulfate reducing bacteria. Geol. Soc. Am. Abstr. Prog. 30 (7),
A58.
Walsh, E., 2001. Arsenic drinking water standard issued: after
seven-month scientific review, EPA backs Clinton-established
levels. In: The Washington Post, p. A31.
Wang, Q., Morse, J.W., 1996. Pyrite formation under conditions
approximating those in anoxic sediments: I. Pathway Mor-
phol. Mar. Chem. 52, 99–121.
Wingard, G.L., Weedman, S.D., McCartan, L., 1993. Age and
diagenesis of Miocene and Oligocene strata of the interme-
diate and upper Floridan Aquifer systems in Southwest
Florida. Geol. Soc. Am. Abstr. Prog. 25 (6), 208.
Wright, J., 1990. Conodont apatite: structure and geochemistry.
In: 28th Internat. Geol. Congr., Paleontological Society and
American Geophysical Union, Washington, D.C., pp. 445–
449.