Natural Soundscape Monitoring€¦ · Lone Star Geyser, Yellowstone National Park, December to...
64
Natural Soundscape Monitoring in Yellowstone National Park December 2003- March 2004 30 July 04 NPS Photo Grand Teton National Park Soundscape Program Report No. 200403 Shan Burson Division of Science and Resource Management Grand Teton National Park PO Drawer 170 Moose, Wyoming 83012
Transcript of Natural Soundscape Monitoring€¦ · Lone Star Geyser, Yellowstone National Park, December to...

Natural Soundscape Monitoring in Yellowstone National Park December 2003- March 2004
30 July 04
NPS Photo
Grand Teton National Park Soundscape Program Report No. 200403
Shan Burson Division of Science and Resource Management Grand Teton National Park PO Drawer 170 Moose, Wyoming 83012

Abstract: Sounds associated with oversnow vehicles (snowmobiles and snowcoaches) are an important management concern at Yellowstone National Park. Acoustical standards and thresholds are defined in park planning documents. The primary purpose of this study was to monitor the soundscape relative to the standards and thresholds outlined in the Yellowstone and Grand Teton National Parks’ Winter Use Plans (WUP). Acoustical data were collected at five sites in Yellowstone National Park during the winter use season December 2003- March 2004. The acoustic data indicate that the soundscape thresholds for oversnow vehicles were exceeded at Old Faithful, along the groomed motorized routes between Old Faithful and Madison Junction (Mary Mountain 1000) and Madison Junction and the West Yellowstone entrance (Madison Junction 2.3). Sound from oversnow vehicles regularly extended at least one mile adjacent to the main motorized routes resulting in backcountry zone WUP acoustic thresholds being exceeded at Mary Mountain Trail 1000 and Mary Mountain 4000 (2001 WUP thresholds). Acoustical thresholds were not exceeded along a groomed non- motorized trail at Lone Star Geyser (one mile from a main groomed motorized route). The sound level and the percent time oversnow vehicles were audible dramatically decreased from the 2002- 2003 to 2003- 2004 winter season. The reduced sound and audibility levels were largely explained by the fewer numbers of snowmobiles used, the change from 2 to 4- stroke engine technology and the 2003- 2004 group requirements.
2

Table of Contents:
ABSTRACT:.................................................................................................................................................... 2 INTRODUCTION: .......................................................................................................................................... 6 STUDY AREA: ................................................................................................................................................ 6 INSTRUMENTATION AND METHODS: ................................................................................................... 7 ANALYSES:..................................................................................................................................................... 8
Table 1. Management zones and soundscape thresholds in 2001 Yellowstone and Grand Teton National Parks and the John D. Rockefeller, Jr. Memorial Parkway Final Environmental Impact Statement Winter Use Plan. .............................................................................................................................. 9 Table 2. Management zones and soundscape thresholds in 2003 Yellowstone and Grand Teton National Parks and the John D. Rockefeller, Jr. Memorial Parkway Final Supplemental Environmental Impact Statement Winter Use Plan. ................................................................................... 10
ACOUSTIC MEASUREMENT LOCATIONS: ......................................................................................... 11 OLD FAITHFUL ............................................................................................................................................ 11 LONE STAR .................................................................................................................................................. 11
Figure 1. Locations of sound monitoring sites within Yellowstone National Park, December 2003-March 2004....................................................................................................................................................... 12
MARY MOUNTAIN TRAIL 1000.................................................................................................................... 13 MARY MOUNTAIN 4000 ............................................................................................................................. 13 MADISON JUNCTION 2.3.............................................................................................................................. 13
RESULTS AND DISCUSSION: ................................................................................................................ 14 Table 3. Dates used for audibility analyses at five locations in Yellowstone National Park, December 2003- March 2004 ............................................................................................................................................ 15 Table 4. Dates used for sound level analyses at five locations in Yellowstone National Park, December 2003- March 2004. ........................................................................................................................ 16
AUDIBILITY:................................................................................................................................................. 16 Old Faithful ........................................................................................................................................... 16
Figure 3. The average percent time audible by hour (8am- 4pm) of snowmobiles and snowcoaches and high and low range at Old Faithful, Yellowstone National Park from 8 a.m. to 4 p.m., 17 December 2003 to 14 March 2004. .................................................................................................................................... 19 Figure 4. The percent time audible by hour (12am- 11:59pm) of snowmobiles and snowcoaches at Old Faithful, Yellowstone National Park, 3 March 2004, the day with the highest average.......................... 20 Figure 5. The average percent time audible by hour (12am- 11:59pm) of snowmobiles and snowcoaches at Old Faithful, Yellowstone National Park, 14 February 2003 .................................................................. 21 Figure 6. The average percent time audible by hour (8am- 4pm) of snowmobiles and snowcoaches at Old Faithful, Yellowstone National Park during 3 January and over Presidents Day Weekend 2003.. 22 Figure 7. The average percent time audible by hour (8am- 4pm) of snowmobiles and snowcoaches at Old Faithful, Yellowstone National Park during 3 January and Presidents Day Weekend 2004 .......... 23
Mary Mountain Trail 1000.................................................................................................................. 24 Figure 8. The average percent time audible and number of snowmobiles and snowcoaches (8am-4pm) by date 1000 feet from the Madison Junction- Old Faithful Road near Mary Mountain Trail, January and February 2004............................................................................................................................. 25 Figure 10. The average percent time audible by hour (8am- 4pm) of snowmobiles and snowcoaches 1000 feet from the Madison Junction- Old Faithful Road near Mary Mountain Trail, Yellowstone National Park, 17 February 2004, the day with the highest average........................................................... 27
Lone Star Geyser .................................................................................................................................. 28 Figure 11. The average percent time audible (8am- 4pm) and number of snowmobiles and snowcoaches by date at Lone Star Geyser, Yellowstone National Park, December 2003- March 2004............................................................................................................................................................................. 29
3

Figure 12. The average percent time audible by hour (8am- 4pm) of snowmobiles and snowcoaches at Lone Star Geyser, Yellowstone National Park, December to February 2004.......................................... 30 Figure 13. The average percent time audible by hour (8am- 4pm) of snowmobiles and snowcoaches at Lone Star Geyser, Yellowstone National Park, 28 February 2004, the day with the highest average ... 31
Mary Mountain 4000 .......................................................................................................................... 32 Figure 14. The percent time audible by hour (8am- 4pm) of snowmobiles and snowcoaches (oversnow vehicles) and aircraft 4000 feet from the Madison Junction- Old Faithful Road near Mary Mountain Trail, over Presidents Day Weekend 2004 ................................................................................. 33
Madison Junction 2.3 ............................................................................................................................ 34 Figure 15. The average percent time audible and range by hour (8am- 4pm) of snowmobiles and snowcoaches at 2.3 miles west of Madison Junction along the West Entrance Road Yellowstone National Park during Presidents Day Weekend 2003 and 2004 ................................................................ 35
SOUND LEVELS: ........................................................................................................................................... 36 Table 5. Decibel levels of commonly known sound sources for comparative purposes........................ 38
Old Faithful ........................................................................................................................................... 38 Figure 16. Hourly sound levels averaged for 17- 31 December 2003, Old Faithful, Yellowstone National Park. ................................................................................................................................................................... 40 Figure 17. Hourly sound levels averaged for January 2004, Old Faithful, Yellowstone National Park 40 Figure 18. Hourly sound levels averaged for February 2004, Old Faithful, Yellowstone National Park............................................................................................................................................................................. 41 Figure 19. Hourly sound levels averaged for 1- 4 March 2004, Old Faithful, Yellowstone National Park............................................................................................................................................................................ 41 Figure 20. The hourly sound level metrics (8am- 4pm) of natural and non- natural sounds at Old Faithful, Yellowstone National Park from 8am to 4pm, January 2004 ..................................................... 42 Figure 21. Median hourly sound levels and Lmax for Presidents Day Weekend 2004, Old Faithful, Yellowstone National Park............................................................................................................................. 43 Figure 22. Median hourly sound levels and Lmax for Presidents Day Weekend 2003, Old Faithful, Yellowstone National Park............................................................................................................................. 43
Lone Star ............................................................................................................................................... 44 Figure 23. Hourly sound levels averaged for December 2003, Lone Star Geyser, Yellowstone National Park .................................................................................................................................................................... 45 Figure 24. Hourly sound levels averaged for January 2004, Lone Star Geyser, Yellowstone National Park .................................................................................................................................................................... 45 Figure 25. Hourly sound levels averaged for February 2004, Lone Star Geyser, Yellowstone National Park. ................................................................................................................................................................... 46 Figure 26. Hourly sound levels averaged for 1- 5 March 2004, Lone Star Geyser, Yellowstone National Park.................................................................................................................................................... 46
Mary Mountain Trail 1000.................................................................................................................. 47 Figure 27. Hourly sound levels averaged for January 2004, Mary Mountain Trail 1000, Yellowstone National Park.................................................................................................................................................... 48 Figure 28. Hourly sound levels averaged for February 2004, Mary Mountain Trail 1000, Yellowstone National Park.................................................................................................................................................... 48 Figure 29. Hourly sound levels averaged for 1- 5 March 2004, Mary Mountain Trail 1000, Yellowstone National Park.................................................................................................................................................... 49
Mary Mountain 4000 .......................................................................................................................... 49 Figure 30. Hourly sound levels averaged for 15 February 2004, Mary Mountain 4000, Yellowstone National Park.................................................................................................................................................... 50
Madison Junction 2.3 ............................................................................................................................ 50 Figure 31. Hourly sound levels averaged for 14- 15 February 2004, Madison Junction 2.3, Yellowstone National Park.................................................................................................................................................... 51 Figure 32. Hourly sound levels averaged for 4- 5 January 2003, Madison Junction 2.3, Yellowstone National Park.................................................................................................................................................... 51
EFFECT OF NUMBER OF SNOWMOBILES ON AUDIBILITY:............................................................................. 52 Figure 33. A comparison at Old Faithful of the average percent time audible (8am- 4pm) by the number of visitor snowmobile and snowcoaches entering Yellowstone National Park by date, winters 2003 and 2004................................................................................................................................................... 52
RECOMMENDATIONS: .......................................................................................................................... 53
4

ACKNOWLEDGEMENTS: ...................................................................................................................... 54 LITERATURE CITED: .............................................................................................................................. 54 APPENDIX A: .............................................................................................................................................. 55 APPENDIX B: .............................................................................................................................................. 57
5

Introduction: National Park Service (NPS) management policies state that natural soundscapes (the unimpaired sounds of nature) are to be preserved or restored as is practicable. Natural soundscapes are intrinsic elements of the environment and are necessary parts of its ecological functioning and therefore associated with park purposes. Natural soundscapes are a valued resource at national parks including Yellowstone. The existing winter soundscape at Yellowstone consists of both natural and non- natural sounds. Common natural sounds include bird calls, animal vocalizations, flowing water, wind, and thermal activity. Non- natural sounds include human voices, motorized sounds of snowmobiles, snowcoaches, snow- grooming vehicles, wheeled vehicles, aircraft, and the sounds associated with the functioning of buildings in destination and support areas. To address management concerns the 2001 and 2003 Winter Use Plans (WUP) Environmental Impact Statement of Yellowstone (YNP) and Grand Teton National Parks and the John D. Rockefeller, Jr., Memorial Parkway defined acoustical standards and thresholds for measuring the parks’ natural soundscape and the acoustical impact of the use of oversnow vehicles (snowmobiles and snowcoaches). Acoustical monitoring was mandated and this report summarizes data collected in Yellowstone during the 2003- 2004 winter use season. The primary purpose of this acoustical monitoring was to assess the impact of snowmobile and snowcoach sound on the park’s natural soundscape. However, additional data from other human and natural sources were collected and summarized. This report also includes a limited comparison of acoustical data collected during the winter of 2002- 2003. Study Area: Yellowstone National Park occupies the northwest corner of Wyoming and extends a short distance into Montana and Idaho on the north and west boundaries. The park is at high elevation and has extensive stands of lodgepole pine forests, grasslands, and open thermal areas. Large areas of the Yellowstone are in the early stages of lodgepole pine regrowth after the fire of the 1988. The two million acre park was reduced to two acoustic zone categories (open and forested) by a previous winter acoustical study (HMMH 2001) for the purpose of describing areas with similar natural acoustic properties. This simplistic categorization is generally maintained for habitat descriptions in this present study. The major highways within YNP that are open to vehicles during the summer are groomed and available for oversnow vehicles travel during the winter use season (December to March) with the exception of the road between Canyon and Tower and the plowed road from Mammoth to Cooke City along YNP’s northern boundary. During the winter use season between 17 December 2003 and 14 March 2004 24,658
6
snowmobiles (22,604) and snowcoaches (2,054) entered Yellowstone National Park (NPS unpublished data). The majority of these oversnow vehicles (22,760) entered through the West and the South entrances. Most of these winter visitors traveled to Old Faithful. Instrumentation and Methods: Automated acoustic monitors (Skip Ambrose, NPS Natural Sounds) collected traditional one- second decibel data as well as digital recordings using a systematic sampling scheme (10 seconds every four minutes), and 20 second recordings of sound events exceeding a user- defined threshold (decibels) and duration (seconds). Calibrated Type 1 Larson Davis (Provo, Utah) 824 sound level meters and PRM902 microphone preamplifiers and G.R.A.S. (North Olmsted, Ohio) 40AE microphones with windscreens were used to collect 33 one- third octave band frequency (12.5- 20,000 Hz) sound pressure levels each second for the sampling period. SoundMonitor TM (Far North Aquatics, Fairbanks, Alaska) software running on a WindowsTM- based PanasonicTM CF- 48 laptop computer controlled and stored the acoustical data. Each system collected high quality digital recordings (44.1 KHz, 16- bit) using a Sound Devices (Reedsburg, Wisconsin) USBPreTM precision microphone interface. B&K (Naerum, Demark) Model 4231 and Larson Davis LD200 calibrators were used for field calibration. During the initial deployment, the sound level meter noise floor (minimum sound level) was measured using a Larson Davis ADP005 dummy microphone and documented. Monitors were subsequently checked and data files retrieved at least biweekly. The acoustic monitors, contained within weatherproof containers, were either plugged into electricity outlets (Old Faithful) or powered by 12- volt battery and photovoltaic charging systems. Both systems could operate continuously for long time periods. Specific methodologies (protocols) for equipment type, microphone type, microphone placement and height, and other factors are presented in Appendix A. These protocols followed guidance of (Ambrose and Burson 2004) and were based on American National Standards Institute (ANSI) S12.9- 1992, Part 2 (ANSI 1992), Federal Aviation Administration’s “Draft Guidelines for the Measurement and Assessment of Low- level Ambient Noise” (Fleming et al. 1998), and Methodology for the Measurement and Analysis of Aircraft Sound Levels within National Parks (Dunholter et al. 1989). Appendix B contains a glossary of acoustical terms. A field data sheet was completed for each measurement location and for each visit. Basic site information, time arrive/time leave, latitude and longitude, habitat/vegetation types, equipment type and serial numbers, and software settings were completed for each site. During every visit, time offsets were noted (GPS time versus computer time), computer clocks were set to GPS time, data were
7

downloaded to a portable hard drive, and calibration levels were checked (differences from 94.0 dB were noted and recalibrated if >0.1 dBA). Analyses: Sound pressure level data (decibels) were reduced and common acoustic summary metrics were calculated using the analytical software, Soundstat 040318TM (Far North Aquatics, Fairbanks, Alaska) and Hourly Metrics (Ric Hupalo, NPS Natural Sounds). In previous acoustic studies arithmetic averages and medians have been used to aggregate summary metrics. Most of the results in this report use arithmetic averages, but medians are presented in some examples. The daily 360 10- second digital recordings were calibrated and replayed using Adobe’s AuditionTM software, Sound Devices USBPreTM acoustical interface and professional headphones. Prior to analysis 10 dBA was added to the recordings. This boost in sound level was determined to best simulate field conditions. Investigators then replayed the recordings and determined the source (snowmobile, animal, aircraft, wind, thermal activity, etc.) for each audible sound. The percent time audible for each sound source was calculated using the combined 10- second samples as approximations of all periods of the day. For example if a particular sound source was audible for half of the samples (60 of 120 samples) the percent time audible was calculated as 50%. Although a sampling scheme may miss an occasional sound, comparison testing with attended logging, other sampling schemes and constant recordings demonstrated that analyses using this scheme closely approximate actual levels. 4-stroke snowmobiles were sometimes difficult to distinguish from snowcoaches. When the two categories could not be distinguished they were combined in the analyses (Fig. 3 and 9 provide examples of the relative proportions of snowmobiles, snowcoaches and the combined category at two locations). This report relies on descriptive statistics, mostly averages, for the audibility data and a number of common acoustical metrics for the sound level data. It should be recognized that high and low data points are masked when average results are calculated. A disadvantage of using averages is that knowledge of these high values is often valuable for proper interpretation. I try to fill in those missing elements when their absence may lead to misinterpretation. Wind contamination (distortion) causes false sound level data when wind speeds exceed the capacity of the microphone windscreens. All hours with known wind contamination were deleted from the dataset prior to analysis. Data influenced by visits to the monitoring site were also deleted. Results from this sound monitoring project were compared to both the 2001 and 2003 WUP acoustic thresholds (Tables 1 and 2) because of the changing requirements due to court orders over the winter.
8

Table 1. Management zones and soundscape thresholds in 2001 Yellowstone and Grand Teton National Parks and the John D. Rockefeller, Jr. Memorial Parkway Final Environmental Impact Statement Winter Use Plan. Zone Management Zone Maximum Audibility1 of motorized
sound during the hours of 8am- 4pm
1 Destination or Support Area
Audibility: NTE 50% (anywhere within area boundary)
2 Plowed Road (within 100 feet either side of road)
Audibility: NTE 50% at 100 feet
3 Groomed Motorized Route Clean and Quiet (within 100 feet either side route)
Audibility: NTE 50% at 100 feet
4 Groomed Motorized Route (within 100 feet either side route)
Audibility: NTE 50% at 100 feet
5 Groomed Motorized Trail Clean and Quiet (within 100 feet either side of trail)
Audibility: NTE 25% at 100 feet
6 Groomed Motorized Trail (within 100 feet either side of trail)
Audibility: NTE 25% at 100 feet
7 Ungroomed Motorized Trail (within 100 feet either side of trail)
Audibility: NTE 25% at 100 feet
8 Groomed Non- motorized Trail Audibility: NTE 10% at 500 feet
9 Ungroomed Non- motorized Trail or Area
Audibility: NTE 10% at 500 feet
10 Backcountry non- motor trail or area Audibility: NTE 10% at 500 feet Audibility: NTE 0% at 1000 feet
1 Audibility- the ability of a person with normal hearing to hear a given sound
9

Table 2. Management zones and soundscape thresholds in 2003 Yellowstone and Grand Teton National Parks and the John D. Rockefeller, Jr. Memorial Parkway Final Supplemental Environmental Impact Statement Winter Use Plan. Zone Management Zone Maximum Audibility1, Max. dBA2,
and Hourly Leq 3 of oversnow vehicle sounds
during hours of 8am- 4pm 1 Destination or Support Area
(anywhere within area boundary) Audibility: NTE4 50%
dBA: NTE 70 dBA Leq: NTE 45dBA
2 Plowed Road (within 100 feet either side of road)
Audibility: NTE 50% dBA: NTE 70 dBA Leq: NTE 45 dBA
3 Groomed Motorized Route (within 100 feet either side route)
Audibility: NTE 50% dBA: NTE 70 dBA Leq: NTE 45 dBA
4 Groomed Motorized Trail (within 100 feet either side route)
Audibility: NTE 50% dBA: NTE 70 dBA Leq: NTE 45 dBA
5 Ungroomed Motorized Trail or Area (within 100 feet either side of trail)
Audibility: NTE 50% dBA: NTE 70 dBA Leq: NTE 45 dBA
6 Groomed Non- motorized Trail (within 100 feet either side of trail)
Audibility: NTE 25% dBA: NTE 70 dBA Leq: NTE 45 dBA
7 Ungroomed Nonmotorized Trail or Area (within 100 feet either side of trail)
Audibility: NTE 20% dBA: NTE Lnat5 - 6 dBA
Leq: NTE to Lnat 8 Backcountry Nonmotorized Area
(anywhere within area >1,000 feet from motorized area)
Audibility: NTE 20% dBA: NTE Lnat - 6 dBA
Leq: NTE to Lnat 9 Sensitive Area
(no winter use)
1 Audibility- the ability of a person with normal hearing to hear a given sound2 dBA- weighted sound level in decibels 3 Leq - The level of a constant sound over a specific time period that has the same
sound energy as the actual (unsteady) sound over the same period. 4 NTE- not to exceed 5 Lnat- The natural sound conditions found in a given area, including only sounds
of nature.
10

Acoustic Measurement Locations: The sound monitoring locations (Fig. 1) were chosen among high use areas to best represent different natural soundscape management zones and to permit comparisons to acoustic data collected the previous winter. The specific placement relative to sound sources of interest was mainly determined by logistical constraints. These constraints included open south facing sky for solar exposure for charging systems, proximity to electricity outlets, and placement of instrumentation in locations protected from large mammals. Habitat cover percentages listed below were measured in a 500 m radius of the sound monitor. Old Faithful Latitude: 44.45688 Longitude: 110.83178 Elevation: 7383 feet Habitat: 50% open (parking lot, road, buildings), 30% open (wetlands,
thermal area), 20% forested (sparse lodgepole pine) Management Area: Destination area The Old Faithful monitor was located within the fenced area of the weather station adjacent to the Ranger Station. It was powered by AC electricity. The microphones were located 40 feet from a walking/ski trail, 200 feet from the Ranger Station, 230 feet from the entrance road used by oversnow traffic and 300 feet from the large parking lot between the Ranger Station and the Visitors Center. Lone Star Latitude: 44.41930 Longitude: 110.80482 Elevation: 7725 feet Habitat: 75% forested (lodgepole pine), 25% open (thermal area) Management Area: Groomed non- motorized trail
11

.
[
[
[
[[
[
Figure 1. Locations of sound monitoring sites (red stars) within Yellowstone National Park, December 2003- March 2004. North to south: Madison Junction 2.3, Mary Mountain 4000, Mary Mountain Trail 1000, Old Faithful and Lone Star. The Lone Star monitor was located at the forest edge at the northeastern corner of the open thermal area surrounding the Lone Star Geyser. The site was approximately 2.2 miles along a trail from the groomed Old Faithful- West Thumb Road and one mile in a straight line with intervening dense forest and hills from the road. The microphones were located 200 feet from the periodically groomed ski trail, 525 feet from the geyser, and 25 feet from the edge of the open thermal area.
12

Mary Mountain Trail 1000 Latitude: 44.56947 Longitude: 110.81088 Elevation: 7240 feet Habitat: 60% open (grassland), 40% forested (lodgepole pine) Management Area: Backcountry area The Mary Mountain Trail 1000 monitor was located 1000 feet from the groomed Old Faithful- Madison Junction Road and 500 feet from the Mary Mountain Trail. The terrain was open with no intervening vegetation or hills between the monitor and the road. The microphones were at one end of an uprooted lodgepole pine in an open area with sparse distribution of lodgepole pines. Mary Mountain 4000 Latitude: 44.57433 Longitude: 110.80228 Elevation: 7236 feet Habitat: 60% open, 30% forested (lodgepole pine), 10% river Management Area: Backcountry area The Mary Mountain 4000 monitor was located 4000 feet from the groomed Old Faithful- Madison Junction Road, 1000 feet from the Mary Mountain Trail and 125 feet from the Nez Perce Creek. The terrain was mostly open between the monitor and the road. The microphones were in the trees in the creek’s riparian zone 10 feet from the edge of a large open area. Madison Junction 2.3 Latitude: 44.64253 Longitude: 110.89645 Elevation: 6804 feet Habitat: 80% forested (small lodgepole pines), 10% open (road), 10%
river Management Area: Groomed motorized route The Madison Junction 2.3 monitor was located 2.3 miles from Madison Junction, 100 feet from the West Entrance- Madison Junction Road within a large area of small (1.5- 2 meter) lodgepole pines, and 275 feet from the Firehole River.
13

Results and Discussion: Acoustical measurements were made at three primary sites, Old Faithful, Lone Star Geyser, and Mary Mountain Trail 1000 augmented by two additional sites over Presidents Day Weekend, Mary Mountain 4000 and Madison Junction 2.3 (see previous section for site details). Data collection began on 16 December 2003 and ended 9 April 2004, although only data collected during the winter use season (17 December 2003- 14 March 2004) are presented here. Selected data (Tables 3 and 4) were chosen for analysis based on visitor usage patterns, timing of previous measurements, distribution over days of week and winter, and availability of time for analysis. The WUP thresholds apply only to motorized oversnow vehicle sounds from 8am- 4pm so for the audibility analyses generally only those periods are presented in this report. However, audibility data was collected and analyzed for the entire 24 hour day. A wealth of biological data, as well as sound level data, is contained within this dataset. These additional data, substantially not yet analyzed, are available for future study. For comparative value the sound level data are presented for the 24 hour day although the WUP thresholds apply only to 8am-4pm. Perhaps the most intuitive, useful and easily understandable results come from the digital recordings and audibility analysis. These results will be presented first followed by the sound level data.
14

Table 3. Dates used for audibility analyses at five locations in Yellowstone National Park, December 2003- March 2004. Daily average numbers of snowmobiles during sampling days are listed at bottom of table. Average number of snowcoaches for all sampling days was 26/day.
Old Faithful 30 days (240 hours)
Lone Star Geyser 18 days
(144 hours)
Mary Mnt. Trail 1000
8 days(64 hours)
Madison Junction 2.3
2 days (16 hours)
Mary Mnt. 4000 1 day
(8 hours) 17- Dec- 04 18- Dec- 04 22- Jan- 04 14- Feb- 04 15- Feb- 0418- Dec- 04 19- Dec- 04 23- Jan- 04 15- Feb- 04 19- Dec- 04 20- Dec- 04 25- Jan- 04 20- Dec- 04 21- Dec- 04 26- Jan- 04 21- Dec- 04 10- Jan- 04 5- Feb- 04 22- Dec- 04 11- Jan- 04 15- Feb- 04 23- Dec- 04 12- Jan- 04 17- Feb- 04 25- Dec- 04 13- Jan- 04 27- Feb- 04 26- Dec- 04 17- Jan- 04 27- Dec- 04 18- Jan- 04 30- Dec- 04 24- Jan- 04 31- Dec- 04 6- Feb- 04 3- Jan- 04 7- Feb- 04 21- Jan- 04 8- Feb- 04 22- Jan- 04 10- Feb- 04 23- Jan- 04 16- Feb- 04 24- Jan- 04 28- Feb- 04 25- Jan- 04 29- Feb- 04 26- Jan- 04 6- Feb- 04 7- Feb- 04 8- Feb- 04 15- Feb- 04 16- Feb- 04 17- Feb- 04 28- Feb- 04 29- Feb- 04 1- Mar- 04 2- Mar- 04 3- Mar- 04 Average daily # of snowmobiles during sampling days 259/day 236/day 281/day 399/day 403/day
15

Table 4. Dates used for sound level analyses at five locations in Yellowstone National Park, December 2003- March 2004.
Old Faithful (~1600 hours) Mary Mnt. Trail 1000 (~800 hours)
17 December 2003- 10 February 2004 21- 30 January 2004 13 February- 4 March 2004 4- 5 February 2004 14 February- 5 March 2004
Lone Star Geyser (~1200 hours) 17- 27 December 2003 Madison Jct 2.3 (62 hours)9 January- 12 February 2004 13- 16 February 2004 15- 17 February 2004 27 February- 5 March 2004 Mary Mnt. 4000 (42 hours)
14- 16 February 2004
Audibility: We replayed each day’s 120 10- second (for a daily 8am- 4pm total of 20 minutes) digital recording sample and determined the source of each sound (snowmobile, animal, aircraft, wind, thermal activity, etc.) that was audible. We then calculated the percent time audible for each sound source, however, with few exceptions, only the snowmobile and snowcoach percent time audible is presented here. Often snowmobiles and snowcoaches were audible simultaneously but other times one masked the sound of the other. The winter season average number of snowcoaches entering YNP was 23/day (range 8- 45). The winter season average number of snowmobiles entering YNP was 254/day (range 111- 438). Audibility depends on the sound level of and distance from the sound source as well the presence of natural sounds, and non- sound source variables such as atmospheric conditions, wind speed and direction, topography, snow cover, and vegetative cover. These various factors influenced day to day audibility at each sound monitoring location. No two days were identical, but patterns were regularly observed and differences among monitoring locations are demonstrated. Old Faithful Old Faithful is a destination area and the WUP threshold percent time audible for oversnow vehicles was not to exceed 50% from 8am- 4pm. The winter use season average daily percent time audible for snowmobiles and snowcoaches (61%)
16

exceeded this audibility threshold for all days analyzed except for 18 December 2003 (49%), the day after the winter use season opened and 26 December (47%), the day after Christmas (Fig. 2). The daily percent time audible stayed relatively constant as the season progressed (Fig. 2). The highest daily average percent time audible was 3 March 2004 with oversnow vehicles audible for 73% of the time. Percent time audible can be calculated by hour to understand the pattern of oversnow vehicle use between 8am and 4pm (Fig. 3). Again, all hours other than the 10am hour exceeded the percent time audible threshold of 50%. Most days followed a typical pattern of snowcoaches making up the bulk of oversnow vehicle sounds for the 8am hour, especially early in the season, followed by increasing percentages of snowmobiles as the day progressed. The analyses for the WUP are restricted to 8am- 4pm but oversnow vehicle sounds beyond that time were common, especially later in the day (Fig. 4). For a comparison to the previous winter 2002- 2003, Figure 5 illustrates a day at Old Faithful during February 2003. For further annual comparisons, Figures 6 and 7 illustrate the difference in percent time audible of oversnow vehicles for one day in January and Presidents Day Weekend in both 2003 and 2004.
17

D a te
12/1
7/03
12/2
1/03
12/2
5/03
12/2
9/03
1/2/
04
1/6/
04
1/10
/04
1/14
/04
1/18
/04
1/22
/04
1/26
/04
1/30
/04
2/3/
04
2/7/
04
2/11
/04
2/15
/04
2/19
/04
2/23
/04
2/27
/04
3/2/
04
% T
ime
Aud
ible
0
10
2 0
3 0
4 0
5 0
6 0
7 0
8 0
9 0
10 0
# o
f Ove
rsno
w V
ehic
les
10 0
15 0
2 0 0
2 5 0
3 0 0
3 5 0
4 0 0
4 5 0
5 0 0
A v e r a g e = 6 1%
A v e r a g e O v e r s n o w # s W U P T h r e s h o ld = 5 0 %
O ld F a ith fu l
Figure 2. The percent time audible (blue squares) and number of snowmobiles and snowcoaches (black triangles) by date at Old Faithful, Yellowstone National Park from 8 a.m. to 4 p.m., 17 December 2003 to 3 March 2004.
18

Hour 07:
00:0
0
08:
00:0
0
09:
00:0
0
10:
00:0
0
11:0
0:00
12:
00:0
0
13:
00:0
0
14:
00:0
0
15:
00:0
0
16:
00:0
0
% T
ime
Aud
ible
0
10
20
30
40
50
60
70
80
90
100
Snowmobile Snowcoach Either Average AudibilityWUP Zone 1- 4 Threshold (50%)Oversnow Highest Percentage Oversnow Lowest Percentage
Old Faithful
Figure 3. The average percent time audible by hour (8am- 4pm) of snowmobiles (bottom bar category) and snowcoaches (middle bar category) and combined category (top), and high and low range at Old Faithful, Yellowstone National Park from 8 a.m. to 4 p.m., 17 December 2003 to 14 March 2004.
19

0%
10%
20%
30%
40%
50%
60%
70%
80%
90%
100%
0:00
:00
1:00:
00
2:00
:00
3:00
:00
4:00
:00
5:00
:00
6:00
:00
7:00
:00
8:00
:00
9:00
:00
10:0
0:00
11:0
0:00
12:0
0:00
13:0
0:00
14:0
0:00
15:0
0:00
16:0
0:00
17:0
0:00
18:0
0:00
19:0
0:00
20:0
0:00
21:0
0:00
22:0
0:00
23:0
0:00
Hour
% T
ime
Average 8 am- 4 pm = 73%
2001/2003 WUP Zone 1- 4 Threshold (50%)
Figure 4. The percent time audible by hour (12am- 11:59pm) of snowmobiles and snowcoaches at Old Faithful, Yellowstone National Park, 3 March 2004, the day with the highest average. The green histograms are outside the time period covered by the WUP thresholds (8am- 4pm) and are shown for comparative purposes.
20

0%
10%
20%
30%
40%
50%
60%
70%
80%
90%
100%
0:00
:00
1:00:
00
2:00
:00
3:00
:00
4:00
:00
5:00
:00
6:00
:00
7:00
:00
8:00
:00
9:00
:00
10:0
0:00
11:0
0:00
12:0
0:00
13:0
0:00
14:0
0:00
15:0
0:00
16:0
0:00
17:0
0:00
18:0
0:00
19:0
0:00
20:0
0:00
21:0
0:00
22:0
0:00
23:0
0:00
Hour
% T
ime
Average 8am- 4pm = 93%
2001/2003 WUP Zone 1- 4 Threshold (50%)
Figure 5. The average percent time audible by hour (12am- 11:59pm) of snowmobiles and snowcoaches at Old Faithful, Yellowstone National Park, 14 February 2003. The green histograms are outside the time period covered by the WUP thresholds (8am- 4pm) and are shown for comparative purposes.
21

0%
10%
20%
30%
40%
50%
60%
70%
80%
90%
100%
8:00
:00
9:00
:00
10:0
0:00
11:0
0:00
12:0
0:00
13:0
0:00
14:0
0:00
15:0
0:00
All
Hou
rs
Hour
% T
ime
3- Jan- 03
15- Feb- 03
16- Feb- 03
Average
Figure 6. The average percent time audible by hour (8am- 4pm) of snowmobiles and snowcoaches at Old Faithful, Yellowstone National Park during 3 January and over Presidents Day Weekend 2003. Compare to Fig. 7.
22

0%
10%
20%
30%
40%
50%
60%
70%
80%
90%
100%
8:00
:00
9:00
:00
10:0
0:00
11:0
0:00
12:0
0:00
13:0
0:00
14:0
0:00
15:0
0:00
All
Hou
rs
Hour
% T
ime
3- Jan- 04
14- Feb- 04
15- Feb- 04
Average
Figure 7. The average percent time audible by hour (8am- 4pm) of snowmobiles and snowcoaches at Old Faithful, Yellowstone National Park during 3 January and Presidents Day Weekend 2004. Compare to Fig. 6.
23

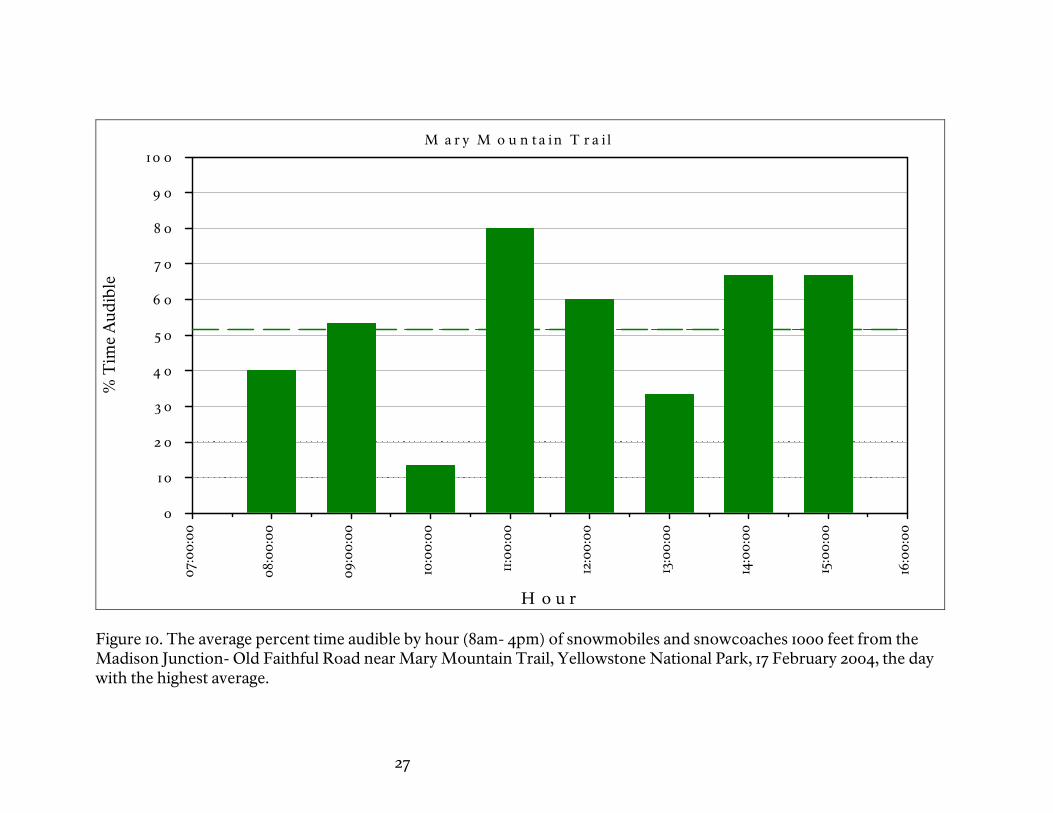
Mary Mountain Trail 1000 Mary Mountain Trail 1000 site is in a backcountry non- motorized zone, but these results clearly indicate that site is impacted by the groomed Old Faithful-Madison Junction Road 1000 feet away. All days analyzed exceeded the 0% (2001 WUP) and 20% (2003 WUP) percent time audible threshold for backcountry areas as well as the less stringent management zones of groomed and ungroomed motorized and non- motorized trails (Fig. 8 and Tables 1 and 2). The average percent time audible for all days analyzed was 32%. The average daily pattern of oversnow vehicle audibility follows a pattern consistent with visitors traveling by this site on their way to spending the midday at Old Faithful (Fig. 9). The individual daily pattern closely follows the presented average daily pattern. The day with the highest percent time audible (53%) (Fig. 10) illustrates a common factor that was documented at each site. Wind commonly masked motorized sound, especially at greater distances from travel corridors. Wind speeds also were occasionally high enough to cause distortion of the recorded signal thus obscuring all but the loudest sounds. 17 February 2004 was a windy day at Mary Mountain Trail 1000, with microphone distortion beginning in the 10am hour, continuing intermittently throughout the day. Thus wind masking contributes to the pattern of percent time audible shown (Fig. 10).
24

D a te
1/17
/04
1/21
/04
1/25
/04
1/29
/04
2/2/
04
2/6/
04
2/10
/04
2/14
/04
2/18
/04
2/22
/04
2/26
/04
3/1/
04
% T
ime
Aud
ible
0
10
2 0
3 0
4 0
5 0
6 0
7 0
8 0
9 0
10 0
# o
f Ove
rsno
w V
ehic
les
10 0
15 0
2 0 0
2 5 0
3 0 0
3 5 0
4 0 0
4 5 0
5 0 0
A v e r a g e %
W U P T h r e s h o ld s
A v e r a g e #
M a r y M o u n ta in T r a il
Figure 8. The average percent time audible (blue squares) and number of snowmobiles and snowcoaches (black triangles) (8am- 4pm) by date 1000 feet from the Madison Junction- Old Faithful Road near Mary Mountain Trail, January and February 2004.
25

H o u r 07:
00:0
0
08:
00:0
0
09:
00:0
0
10:
00:0
0
11:0
0:00
12:
00:0
0
13:
00:0
0
14:
00:0
0
15:
00:0
0
16:
00:0
0
% T
ime
Aud
ible
0
10
20
30
4 0
50
6 0
70
8 0
9 0
10 0Sn o w m o b ile C o ach E ith er O versn o w A v erag eW U P T h resh o ld sH igh P ercen tage L o w P ercen tag e
M ary M o u n tain T rail
Figure 9. The average (and range) percent time audible by hour (8am- 4pm) of snowmobiles (bottom bar category), snowcoaches (middle bar category) and combine category (top) 1000 feet from the Madison Junction- Old Faithful Road near Mary Mountain Trail, Yellowstone National Park, January and February 2004.
26
H o u r
07:
00:0
0
08:
00:0
0
09:
00:0
0
10:
00:0
0
11:0
0:00
12:
00:0
0
13:
00:0
0
14:
00:0
0
15:
00:0
0
16:
00:0
0
% T
ime
Aud
ible
0
1 0
2 0
3 0
4 0
5 0
6 0
7 0
8 0
9 0
1 0 0M a r y M o u n t a i n T r a i l
Figure 10. The average percent time audible by hour (8am- 4pm) of snowmobiles and snowcoaches 1000 feet from the Madison Junction- Old Faithful Road near Mary Mountain Trail, Yellowstone National Park, 17 February 2004, the day with the highest average.
27

Lone Star Geyser Although the Lone Star Geyser monitoring site was in a groomed non- motorized trail management zone, it was the most distant monitoring site (one mile) from a groomed road. Snowmobiles and snowcoaches were audible 11 of 18 days and an average of 3% during all analyzed days (Figs. 11 and 12). The louder 2- stroke snowmobiles used to groom the ski trail were also periodically audible. Oversnow vehicles were audible for 19% of the time on 28 February 2004, the highest of any day analyzed (Fig. 13). They were audible for 40% of the noon hour and 33% of the 3pm hour. The Lone Star Geyser itself was audible on regular 3 hour intervals. Skiers and other visitors to the geyser were increasingly audible as the season progressed. Several aircraft were audible per day, between 2- 10% of the time between 8am-4pm
28

D a te
12/1
7/03
12/2
1/03
12/2
5/03
12/2
9/03
1/2/
04
1/6/
04
1/10
/04
1/14
/04
1/18
/04
1/22
/04
1/26
/04
1/30
/04
2/3/
04
2/7/
04
2/11
/04
2/15
/04
2/19
/04
2/23
/04
2/27
/04
3/2/
04
% T
ime
Aud
ible
0
10
2 0
3 0
4 0
5 0
6 0
7 0
8 0
9 0
10 0
# o
f Ove
rsno
w V
ehic
les
10 0
15 0
2 0 0
2 5 0
3 0 0
3 5 0
4 0 0
4 5 0
5 0 0
A v e ra g e = 4 %
2 0 0 1 W U P T h re sh o ld
2 0 0 3 W U P T h re sh o ld
L o n e S ta r
Figure 11. The average percent time audible (blue squares) (8am- 4pm) and number (black triangles) of snowmobiles and snowcoaches by date at Lone Star Geyser, Yellowstone National Park, December 2003- March 2004.
29

H o u r
07:
00:0
0
08:
00:0
0
09:
00:0
0
10:
00:0
0
11:0
0:00
12:
00:0
0
13:
00:0
0
14:
00:0
0
15:
00:0
0
16:
00:0
0
% T
ime
Aud
ible
0
1 0
2 0
3 0
4 0
5 0
6 0
7 0
8 0
9 0
1 0 0
2 0 0 3 W U P T h r e s h o l d
2 0 0 1 W U P T h r e s h o l d
A v e r a g e = 4 %
L o n e S t a r
Figure 12. The average percent time audible by hour (8am- 4pm) of snowmobiles and snowcoaches at Lone Star Geyser, Yellowstone National Park, December to February 2004. Red dotted lines indicate 2001 and 2003 WUP thresholds.
30

H o u r
07:
00:0
0
08:
00:0
0
09:
00:0
0
10:
00:0
0
11:0
0:00
12:
00:0
0
13:
00:0
0
14:
00:0
0
15:
00:0
0
16:
00:0
0
% T
ime
Aud
ible
0
1 0
2 0
3 0
4 0
5 0
6 0
7 0
8 0
9 0
1 0 0
2 0 0 3 W U P T h r e s h o l d
2 0 0 1 W U P T h r e s h o l d
A v e r a g e = 1 9 %
L o n e S t a r
Figure 13. The average percent time audible by hour (8am- 4pm) of snowmobiles and snowcoaches at Lone Star Geyser, Yellowstone National Park, 28 February 2004, the day with the highest average. Red dotted lines indicate the WUP thresholds.
31

Mary Mountain 4000 The Mary Mountain 4000 monitoring site was in the WUP backcountry non-motor management area, but during the one day analyzed snowmobiles and snowcoaches were audible 13% of the time (Fig. 14). This level is below the 2003 WUP audibility threshold, but above the 2001 WUP threshold. At distances of several thousand feet from oversnow vehicle sources of sound, atmospheric, vegetative and topological conditions substantially influence the audibility. Wind can both mask motorized sounds and alternatively propagate sounds downwind. For comparative purposes, Figure 14 also includes the hourly percent time audible of aircraft at this site. High altitude commercial jets comprised 6 of the 7 audible aircraft events.
32

H o u r
07:
00:0
0
08:
00:0
0
09:
00:0
0
10:
00:0
0
11:0
0:00
12:
00:0
0
13:
00:0
0
14:
00:0
0
15:
00:0
0
% T
ime
Aud
ible
0
1 0
2 0
3 0
4 0
5 0
6 0
7 0
8 0
9 0
1 0 0O v e r s n o w V e h i c l e sA i r c r a f tW U P T h r e s h o l d sA v e r a g e A i r c r a f t = 5 %A v e r a g e O v e r s n o w = 1 3 %
M a r y M o u n t a i n 4 0 0 0
Figure 14. The percent time audible by hour (8am- 4pm) of snowmobiles and snowcoaches (oversnow vehicles) and aircraft (bar to the right of each hour) 4000 feet from the Madison Junction- Old Faithful Road near Mary Mountain Trail over Presidents Day Weekend 2004. Red dotted lines indicate the 2001 and 2003 WUP threshold levels for this management zone.
33

Madison Junction 2.3 Madison Junction 2.3 monitoring site was located 100 feet off the West Entrance road 2.3 miles west of Madison Junction in a groomed motorized route management zone. Acoustic data was collected over Presidents Day Weekend in both 2004 and 2003 (Fig. 15). Snowmobiles and snowcoaches were audible for 25% of the time during Saturday and Sunday of Presidents Day Weekend 2004. Only the 10am hour exceeded the 50% audibility threshold for this management zone during this weekend. There was a striking difference in oversnow vehicle percent time audible between 2003 and 2004 (Fig. 15). Oversnow vehicles were audible for 93% of the two day weekend in 2003. Nearly three times the number of snowmobiles entered the West Entrance during Saturday and Sunday of Presidents Day Weekend in 2003 (1679 snowmobiles) compared to 2004 (589 snowmobiles). It is likely that this disparity in snowmobile numbers explains most of the difference in percent time audible between the two years; however, there is nearly a fourfold difference in percent time audible. The remaining disparity between years can likely be explained by the required grouping of snowmobiles in 2004 unlike in 2003, and the overall lower sound level due to the predominate use of 4- stroke snowmobiles rather than 2- stroke snowmobiles of 2003.
34

H o u r
07:
00:0
0
08:
00:0
0
09:
00:0
0
10:
00:0
0
11:0
0:00
12:
00:0
0
13:
00:0
0
14:
00:0
0
15:
00:0
0
16:
00:0
0
% T
ime
Aud
ible
0
10
2 0
3 0
4 0
5 0
6 0
7 0
8 0
9 0
10 0
2 0 0 32 0 0 42 0 0 4 A v e r a g e 2 5 %2 0 0 3 A v e r a g e 9 3 %2 0 0 3 R a n g e2 0 0 4 R a n g e
M a d is o n J u n c tio n 2 .3
Figure 15. The average percent time audible and range by hour (8am- 4pm) of snowmobiles and snowcoaches at 2.3 miles west of Madison Junction along the West Entrance Road Yellowstone National Park during Presidents Day Weekend 2003 and 2004. The red dotted line indicates the WUP threshold for this management zone.
35

Sound levels: The 2001 WUP contains no standards or thresholds for sound levels, only audibility standards and thresholds (Table 1). However, the 2003 WUP has both audibility and sound level thresholds (Table 2). Table 5 has typical sound levels of some common sound sources to introduce decibel levels. The interpretation of sound level data is not as easily understood as audibility data. The WUP thresholds apply only to oversnow vehicles, but occasional natural (wind, bird vocalizations, etc.) and other motorized sounds (aircraft, snowgroomers, etc.) may be as loud as oversnow vehicle sounds during some periods and in some locations. Therefore the sound levels for oversnow vehicles should be separated from other sounds before evaluating them against sound level thresholds. Unfortunately there is yet no automated process for separating different sound sources and without which the interpretation of sound levels becomes more difficult. In the developed areas and along travel corridors the loudest sounds during 8am- 4pm were almost invariably oversnow vehicles, but as distances increase from these motorized areas natural sounds were sometimes louder than oversnow vehicle sounds. Common acoustical metrics used to describe environmental sound levels and those used in the 2003 WUP include the maximum sound level for a measurement period (Lmax) and the energy level equivalent or energy average (Leq). The L50 and L90 sound level exceedance metrics are useful to interpret the implications of the Lmax and Leq values. Leq is the level (in decibels) of a constant sound over a specific time period that has the same sound energy as the actual (unsteady) sound over the same period. Leq depends heavily on the loudest periods of a time- varying sound. Leq of an intruding source by itself, however, is inadequate for fully characterizing the intrusiveness of the source. Research has shown that judgments of the effects of intrusions in park environments depend not only upon the amplitude of the intrusion, but also upon the sound level of the “background,” in this case, the sound level of the non- intruding sources, usually the natural ambient sound levels. Leq must be used carefully in quantifying natural ambient sound levels because occasional loud sound levels (gusts of wind, birds, insects) may heavily influence (increase) its value, even though the sound levels are typically lower. L50 and L90 are the sound levels (L), in decibels, exceeded x percent of the time. The L50 value represents the sound level exceeded 50 percent of the measurement period. L50 is the same as the median; the middle value where half the sound levels are above and half below. The L90 value represents the sound level exceeded 90 percent of the time during the measurement period. L90 is a useful measure of the natural sounds because in park situations, away from developed areas, the lowest
36
10 percent of sound levels are less likely to be affected by non- natural sounds. Put another way, non- natural sounds in many park areas are likely to affect the measured sound levels for less than 90 percent of the time. The L50 or the median is also not affected by a few loud sounds as is the Leq and therefore provides another useful measure of the sound environment. Returning to the complications of evaluating these sound level results, the L90 is the NPS (and other organizations) standard for use as an analog to the natural ambient in locations other than those most heavily impacted from non- natural sounds. However, using this or any Lx metric can give misleading results in areas where natural sounds such as thermal activity (Lone Star Geyser), wind (Mary Mountain Trail 1000), or other natural sounds are common and louder than the quietest x% of the sounds. Also using L90 or other Lx metrics, as the natural ambient is inappropriate in locations with constant non- natural sounds (Old Faithful). While there is no easy solution to these problems, I will try to present information for each location to help interpret the results. Using several sound level metrics in concert diminish the disadvantages of any one metric. The quietest sound levels in YNP are sometimes below the level the acoustic equipment can measure so the lowest documented measurements may overestimate the quietest sound levels. This might occasionally slightly affect only the average L90 values. Sound levels depend on the distance from the sound source, the presence of natural sounds, as well as non- sound source variables such as atmospheric conditions, wind speed and direction, topography, snow cover, and vegetative cover. These various factors influenced day to day sound levels measured at each sound monitoring location. No two days were identical, but patterns were regularly observed and differences among monitoring locations are demonstrated.
37

Table 5. Decibel levels of commonly known sound sources for comparative purposes. Note that decibels are logarithmic so a difference of 10 decibels is perceived as a doubling or halving of loudness.
dBA Perception Outdoor Sounds Indoor Sounds
130 Painful
120 Intolerable Jet aircraft at 50 ft Oxygen torch
110 Uncomfortable Turbo- prop at 200 ft Rock Band
100 Jet flyover at 1000 ft Blood- curdling
scream
90 Very noisy Lawn mower Hair dryer
80 Diesel truck 50 mph at 50 ft Food blender
70 Noisy 2- stroke snowmobile 30 mph at 50 ft Vacuum cleaner
60 4- stroke snowmobile 30 mph at 50 ft Conversation
50 Moderate Croaking Raven flyover at 200 ft Office
40 Snake River at 100 ft Living room
30 Quiet Snake River at 300 ft Quiet bedroom
20 Winter wilderness Recording studio
10 Barely audible Below noise floor Old Faithful The average hourly sound levels by month from the soundscape monitoring at Old Faithful are presented in Figures 16- 19. The Old Faithful monitor was 230 feet from the exit road used by oversnow vehicles. The WUP thresholds however assume a distance of 100 feet from the sound source. In a free- field, sound levels decrease by approximately six dBA for every doubling of the distance from the source to the receiver. Therefore to compensate for the additional distance from the sound monitor, adding an additional six dBA to the levels presented in the
38

following figures would approximate the levels at 100 feet (using the reasonable assumption that the maximum sound levels originate from oversnow vehicles traveling 230 feet from the sound monitor). This assumption is reasonable for only Lmax because it is likely that lower sound levels commonly originate from areas other than the exit road such as the parking lot, the main road, etc. and therefore the distance is unknown and thus the correction factor is also unknown. By adding this six dBA adjustment to the values shown in Figs. 16- 19, the Lmax threshold was exceeded for at least one hour during 8am- 4pm during all winter use months. Keep in mind that these are averages which by definition obscure the highest (and lowest) values. Therefore, additional hours during some days also exceeded these thresholds. The Leq threshold was exceeded during midday hours in all months (Figs. 16- 19). For illustration, Figure 20 presents each of the hourly sound metrics for the month of January 2004. Note the hourly Lmax and Leq values exceeded the thresholds even measuring at 230 feet. Because the loudest sounds have the most influence on Leq values, oversnow vehicle sound largely determined the Leq value at Old Faithful on all but the windiest days. The lowest sound levels (about 25 dBA) were determined by the nearly constant utility sounds (exhaust and heating fans) from the Snow Lodge and Old Faithful Ranger Station. Figures 21 and 22 compare the sound levels over Presidents Day Weekend during 2004 and 2003. Recalling that a 10 dBA difference is perceived as a doubling of loudness there was a large difference between years. Oversnow vehicles were often used outside the period covered by the WUP thresholds, even in the middle of the night, and the nighttime snowgroomer sometimes had the loudest sound levels during the 24 hour day.
39

Average Hourly Sound LevelsOld Faithful
December 2003
0
10
20
30
40
50
60
70
80
0:00 1:0
0
2:00
3:00
4:00
5:00
6:00
7:00
8:00
9:00
10:0
0
11:0
0
12:0
0
13:0
0
14:0
0
15:0
0
16:0
0
17:0
0
18:0
0
19:0
0
20:0
0
21:0
0
22:0
0
23:0
0
Hour
dBA
Leq
L50
L90
Lmax
2003 WUP Lmax Threshold (70dBA)
2003 WUP Leq Threshold (45 dBA)
Figure 16. Average hourly sound levels for 17- 31 December 2003, Old Faithful, Yellowstone National Park. These sound levels include all natural and non-natural sounds. Lmax is the highest sound level measured during the measurement period. Dotted red lines indicate acoustic thresholds of 2003 Winter Use Plan. (n=358 hours).
Average Hourly Sound LevelsOld FaithfulJanuary 2004
0
10
20
30
40
50
60
70
80
0:00 1:00
2:00
3:00
4:00
5:00
6:00
7:00
8:00
9:00
10:0
0
11:0
0
12:0
0
13:0
0
14:0
0
15:0
0
16:0
0
17:0
0
18:0
0
19:0
0
20:0
0
21:0
0
22:0
0
23:0
0
Hour
dBA
Leq
L50
L90
Lmax
Figure 17. Average hourly sound levels for January 2004, Old Faithful, Yellowstone National Park. See Fig. 16 caption for additional details. (n=735).
40

Average Hourly Sound LevelsOld Faithful
February 2004
0
10
20
30
40
50
60
70
80
0:00 1:0
0
2:00
3:00
4:00
5:00
6:00
7:00
8:00
9:00
10:0
0
11:0
0
12:0
0
13:0
0
14:0
0
15:0
0
16:0
0
17:0
0
18:0
0
19:0
0
20:0
0
21:0
0
22:0
0
23:0
0
Hour
dBA
Leq
L50
L90
Lmax
Figure 18. Average hourly sound levels for February 2004, Old Faithful, Yellowstone National Park. See Fig. 16 caption for additional details. (n=435).
Average Hourly Sound LevelOld FaithfulMarch 2004
0
10
20
30
40
50
60
70
80
0:00 1:0
0
2:00
3:00
4:00
5:00
6:00
7:00
8:00
9:00
10:0
0
11:0
0
12:0
0
13:0
0
14:0
0
15:0
0
16:0
0
17:0
0
18:0
0
19:0
0
20:0
0
21:0
0
22:0
0
23:0
0
Hour
dBA
Leq
L50
L90
Lmax
Figure 19. Average hourly sound levels for 1- 4 March 2004, Old Faithful, Yellowstone National Park. See Fig. 16 caption for additional details. (n=82).
41

Hourly Sound Level MetricsOld FaithfulJan 1- 31 2004
0
10
20
30
40
50
60
70
801/
1/20
04
1/2/
2004
1/3/
2004
1/4/
2004
1/5/
2004
1/6/
2004
1/7/
2004
1/8/
2004
1/9/
2004
1/10
/200
4
1/11
/200
4
1/12
/200
4
1/13
/200
4
1/14
/200
4
1/15
/200
4
1/16
/200
4
1/17
/200
4
1/18
/200
4
1/19
/200
4
1/20
/200
4
1/21
/200
4
1/22
/200
4
1/23
/200
4
1/24
/200
4
1/25
/200
4
1/26
/200
4
1/27
/200
4
1/28
/200
4
1/29
/200
4
1/30
/200
4
1/31
/200
4
Date
dBA
L50
LMax
Leq
L90
2003 WUP Zone 1- 6 Lmax Threshold
2003 WUP Zone 1- 6 Leq Threshold (45dBA)
Figure 20. The hourly sound level metrics (8am- 4pm) of natural and non- natural sounds at Old Faithful, Yellowstone National Park from 8am to 4pm, January 2004. (n=243).
42

Median Hourly Sound LevelsOld Faithful
Presidents Day Weekend 2004
0
10
20
30
40
50
60
70
80
0:00 1:0
0
2:00
3:00
4:00
5:00
6:00
7:00
8:00
9:00
10:0
0
11:0
0
12:0
0
13:0
0
14:0
0
15:0
0
16:0
0
17:0
0
18:0
0
19:0
0
20:0
0
21:0
0
22:0
0
23:0
0
Hour
dBA
Leq_LogMean
L50_Median
L90_Median
Lmax
Figure 21. Median hourly sound levels and Lmax for Presidents Day Weekend 2004, Old Faithful, Yellowstone National Park. See Fig. 16 caption for additional details. (n=55).
Median Hourly Sound LevelsOld Faithful
Presidents Day Weekend 2003
0
10
20
30
40
50
60
70
80
0:00 1:0
0
2:00
3:00
4:00
5:00
6:00
7:00
8:00
9:00
10:0
0
11:0
0
12:0
0
13:0
0
14:0
0
15:0
0
16:0
0
17:0
0
18:0
0
19:0
0
20:0
0
21:0
0
22:0
0
23:0
0
Hour
dBA
Leq_LogMean
L50_Median
L90_Median
Lmax
Figure 22. Median hourly sound levels and Lmax for Presidents Day Weekend 2003, Old Faithful, Yellowstone National Park. See Fig. 16 caption for additional details. (n=71).
43

Lone Star Oversnow vehicles traveling along the main road approximately one mile away from the Lone Star Geyser sound monitor were audible at this site but their sound levels were generally near the natural ambient sound levels. The maximum sound levels at this site were from oversnow vehicles only during the periodic track grooming. The average hourly sound levels by month for the Lone Star Geyser sound monitor are presented in Figures 23- 26. Natural sounds largely determined the sound level at this site including those approaching the indicated threshold levels. The predominate sounds at this site were wind blowing through the trees, geyser activity every three hours, Raven, Gray Jay, and other bird and mammal vocalizations, and human voices during the midday, especially as the season progressed. Aircraft, distant oversnow vehicles and the periodic snowmobile track groomer also influenced the sound levels at this site.
44

Average Hourly Sound LevelsLone Star GeyserDecember 2003
0
10
20
30
40
50
60
70
80
0:00 1:0
0
2:00
3:00
4:00
5:00
6:00
7:00
8:00
9:00
10:0
0
11:0
0
12:0
0
13:0
0
14:0
0
15:0
0
16:0
0
17:0
0
18:0
0
19:0
0
20:0
0
21:0
0
22:0
0
23:0
0
Time
dBA
Leq
L50
L90
Lmax
2003 WUP Lmax Threshold (70 dBA)
2003 WUP Leq Threshold (45 dBA)
Figure 23. Average hourly sound levels for December 2003, Lone Star Geyser, Yellowstone National Park. See Fig. 16 caption for additional details. (n=232).
Average Hourly Sound LevelsLone Star Geyser
January 2004
0
10
20
30
40
50
60
70
80
0:00 1:0
0
2:00
3:00
4:00
5:00
6:00
7:00
8:00
9:00
10:0
0
11:0
0
12:0
0
13:0
0
14:0
0
15:0
0
16:0
0
17:0
0
18:0
0
19:0
0
20:0
0
21:0
0
22:0
0
23:0
0
Hour
dBA
Leq
L50
L90
Lmax
Figure 24. Average hourly sound levels for January 2004, Lone Star Geyser, Yellowstone National Park. See Fig. 16 caption for additional details. (n=537).
45

Average Hourly Sound LevelsLone Star Geyser
February 2004
0
10
20
30
40
50
60
70
80
0:00 1:0
0
2:00
3:00
4:00
5:00
6:00
7:00
8:00
9:00
10:0
0
11:0
0
12:0
0
13:0
0
14:0
0
15:0
0
16:0
0
17:0
0
18:0
0
19:0
0
20:0
0
21:0
0
22:0
0
23:0
0
Hour
dBA
Leq
L50
L90
Lmax
Figure 25. Average hourly sound levels for February 2004, Lone Star Geyser, Yellowstone National Park. See Fig. 16 caption for additional details. (n=382).
Average Hourly Sound LevelsLone Star Geyser
March 2004
0
10
20
30
40
50
60
70
80
0:00 1:0
0
2:00
3:00
4:00
5:00
6:00
7:00
8:00
9:00
10:0
0
11:0
0
12:0
0
13:0
0
14:0
0
15:0
0
16:0
0
17:0
0
18:0
0
19:0
0
20:0
0
21:0
0
22:0
0
23:0
0
Hour
dBA
Leq
L50
L90
Lmax
Figure 26. Average hourly sound levels for 1- 5 March 2004, Lone Star Geyser, Yellowstone National Park. See Fig. 16 caption for additional details. (n=107).
46

Mary Mountain Trail 1000 The sound levels during the day at Mary Mountain were highly influenced by oversnow vehicles, even at 1000 feet (Figs. 27- 29). Passing snowcoaches and snowmobiles were often documented at sound levels up to 62 dBA. Because the site was on the east side of a large open area, wind was also a common contributor to the documented sound level as can be seen by the March data (Fig. 29). 5 March 2004 was a very windy day and the increased sound levels from the wind influenced the sound level metrics for the whole five day period analyzed. The WUP oversnow vehicle sound level thresholds for backcountry management zones states the oversnow vehicle Leq is not to exceed the natural ambient sound level and the oversnow vehicle Lmax is not to exceed 6 dBA below the natural ambient sound level. Most of the 8am- 4pm combined natural and non- natural sounds Lmax values and the major contributor of Leq values are from oversnow vehicles. Therefore these backcountry sound level thresholds were regularly exceeded. The sound level thresholds of a groomed motorized route were also regularly exceeded if the Lmax sound levels at 100 feet are calculated by using the Lmax sound levels measured at 1000 feet.
47

Average Hourly Sound LevelsMary Mountain Trail 1000
January 2004
0
10
20
30
40
50
60
70
80
0:00 1:0
0
2:00
3:00
4:00
5:00
6:00
7:00
8:00
9:00
10:0
0
11:0
0
12:0
0
13:0
0
14:0
0
15:0
0
16:0
0
17:0
0
18:0
0
19:0
0
20:0
0
21:0
0
22:0
0
23:0
0
Hour
dBA
Leq
L50
L90
Lmax
Figure 27. Average hourly sound levels for January 2004, Mary Mountain Trail 1000, Yellowstone National Park. See Fig. 16 caption for additional details. See Table 2 for sound level thresholds of 2003 Winter Use Plan. (n=204).
Average Hourly Sound LevelsMary Mountain Trail 1000
February 2004
0
10
20
30
40
50
60
70
80
0:00 1:0
0
2:00
3:00
4:00
5:00
6:00
7:00
8:00
9:00
10:0
0
11:0
0
12:0
0
13:0
0
14:0
0
15:0
0
16:0
0
17:0
0
18:0
0
19:0
0
20:0
0
21:0
0
22:0
0
23:0
0
Hour
dBA
Leq
L50
L90
Lmax
Figure 28. Average hourly sound levels for February 2004, Mary Mountain Trail 1000, Yellowstone National Park. See Fig. 16 caption for additional details. See Table 2 for sound level thresholds of 2003 Winter Use Plan. (n=394).
48

Average Hourly Sound LevelsMary Mountain Trail 1000
March 2004
0
10
20
30
40
50
60
70
80
0:00 1:0
0
2:00
3:00
4:00
5:00
6:00
7:00
8:00
9:00
10:0
0
11:0
0
12:0
0
13:0
0
14:0
0
15:0
0
16:0
0
17:0
0
18:0
0
19:0
0
20:0
0
21:0
0
22:0
0
23:0
0
Hour
dBA
Leq
L50
L90
Lmax
Figure 29. Average hourly sound levels for 1- 5 March 2004, Mary Mountain Trail 1000, Yellowstone National Park. See Fig. 16 caption for additional details. See Table 2 for sound level thresholds of 2003 Winter Use Plan. (n=116). Mary Mountain 4000 The oversnow vehicle sound levels documented over Presidents Day Weekend at Mary Mountain 4000 were similar to those measured at Lone Star Geyser. The snowmobiles and snowcoaches were audible but were near natural ambient sound levels. The loudest sounds at Mary Mountain 4000 were aircraft and wind in the trees. The nearby Nez Perce Creek determined the lowest sound levels measured. Figure 30 presents the hourly sound levels for Mary Mountain 4000 on 15 February 2004.
49

Average Sound LevelsMary Mountain 4000
15 February 2004
0
10
20
30
40
50
60
70
800:
00 1:00
2:00
3:00
4:00
5:00
6:00
7:00
8:00
9:00
10:0
0
11:0
0
12:0
0
13:0
0
14:0
0
15:0
0
16:0
0
17:0
0
18:0
0
19:0
0
20:0
0
21:0
0
22:0
0
23:0
0
Hour
dBA
Overall Leq
L50
L90
LMax
Figure 30. Hourly sound levels for 15 February 2004, Mary Mountain 4000, Yellowstone National Park. See Fig. 16 caption for additional details. See Table 2 for acoustic thresholds of 2003 Winter Use Plan. (n=24) Madison Junction 2.3 Consistent with the results from Old Faithful, the sound levels at Madison Junction 2.3 exceeded both the 2003 WUP Lmax and Leq sound level thresholds during some of the hours of the day in 2004 (Fig. 31). This monitor was placed 100 feet from the road centerline so the sound levels can be directly compared to the WUP thresholds. For comparison, Figure 32 presents sound level data collected at the same location during two days in early January 2003.
50

Average Hourly Sound LevelsMadison Junction 2.314- 15 February 2004
0
10
20
30
40
50
60
70
80
0:00 1:0
0
2:00
3:00
4:00
5:00
6:00
7:00
8:00
9:00
10:0
0
12:0
0
13:0
0
14:0
0
15:0
0
16:0
0
17:0
0
18:0
0
19:0
0
20:0
0
21:0
0
22:0
0
23:0
0
Hour
dBA
Leq
L50
L90
Lmax
2003 WUP Leq Threshold (45 DBA)
2003 WUP Lmax Threshold (70 dBA)
Figure 31. Average hourly sound levels for 14- 15 February 2004, Madison Junction 2.3, Yellowstone National Park. See Fig. 16 caption for additional details. (n=47)
Average Hourly Sound LevelsMadision Junction 2.3
January 2003
0
10
20
30
40
50
60
70
80
0:00 1:0
0
2:00
3:00
4:00
5:00
6:00
7:00
8:00
9:00
10:0
0
11:0
0
12:0
0
13:0
0
14:0
0
15:0
0
16:0
0
17:0
0
18:0
0
19:0
0
20:0
0
21:0
0
22:0
0
23:0
0
Hour
dBA
Leq
L50
L90
Lmax
Figure 32. Average hourly sound levels for 4- 5 January 2003, Madison Junction 2.3, Yellowstone National Park. See Fig. 16 caption for additional details. (n=40)
51

Effect of number of snowmobiles on audibility: In an attempt to quantify the effect of the number of snowmobiles and snowcoaches entering Yellowstone National Park on their audibility I compared data from 2003 and 2004 at Old Faithful (Fig. 33). The relationship is not linear because of the many variables that affect audibility (weather conditions, oversnow vehicle timing and grouping, etc.) but the trend makes intuitive sense. Up to certain level, the greater the number of snowmobiles and snowcoaches using the park the greater the time they are audible. Grouping snowmobiles and requiring best available technology for sound emission reduces the direct relationship between vehicle numbers and audibility. During the winter 2003/2004 sampling included days that varied over almost a fourfold difference in the numbers of snowmobiles and snowcoaches entering Yellowstone, however the percent time audible varied by no more than 20% from the highest use day to the lowest (Fig. 33). During 2004 the lowest three days of oversnow vehicle entries (average=126 vehicles) had an average percent time audible of 60% of the day at Old Faithful. The three highest days during 2004 (average=450 vehicles) had an average percent time audible of 67%. These levels were far lower than the 84- 94% percent time audible during the sampled days with 569- 1155 snowmobiles in the winter 2002/2003 (Fig. 33).
% Time Audible vs. # Oversnow VehiclesOld Faithful2003- 2004
0
10
20
30
40
50
60
70
80
90
100
0 200 400 600 800 1000 1200
# of Oversnow Vehicles
% T
ime
Aud
ible
Winter 2002- 2003
Winter 2003- 2004
Figure 33. A comparison at Old Faithful of the average percent time audible (8am- 4pm) by the number of visitor snowmobile and snowcoaches entering Yellowstone National Park by date, winters 2003 and 2004. Line is for reference only.
52

Recommendations:
1- Continue to monitor both audibility and sound levels.
The combined sound level and audibility data gathered for this study provide useful acoustical information about YNP’s soundscapes and the level of impact from oversnow vehicles. Collecting audibility data and identifying sources of sounds is critically important to characterize natural soundscapes and the non-natural acoustical impacts. Evaluating oversnow impacts on the natural soundscape requires the capability of sound source identification. In addition to information on audibility, the sound level of intruding non- natural sounds is also an important aspect of soundscape research. Collecting continuous 1/3 octave band frequency sound levels allows all standard acoustical metrics to be calculated.
2- Audibility and sound level metrics standards and thresholds should continue to be used for impact definitions. These standards should include percent time audible and maximum sound level.
The ability to determine if the acoustic impacts of winter oversnow use are meeting the management objectives require that quantitative acoustical standards and thresholds are defined. Acoustical research and the understanding of natural soundscapes in parks are rapidly improving. The requirements for specific impact definitions and associated standards parallel these changes. It is imperative to use easily understood, and more importantly, measurable and meaningful standards and thresholds (such as audibility and maximum sound levels).
3- Increase the number and range of sampling locations and extend
sampling beyond the winter season. The representativeness of the dataset would improve by increased sample size by sampling in other areas and replication within management zones. A full range of locations should be sampled to provide a more comprehensive evaluation of YNP’s natural soundscape and the impacts from oversnow vehicles. Data collected during non- winter seasons would allow comparisons to other seasons and provide additional knowledge of YNP’s natural and non- natural soundscapes.
4- Sound levels and audibility from motorized oversnow vehicles should be reduced.
Sound levels and audibility from motorized oversnow vehicles can be mitigated by reducing speed limits, reducing unnecessary idling and rapid acceleration, and other driver behavior modifications.
53

Acknowledgements: Skip Ambrose (NPS Natural Sound Program) developed an initial study plan that led to this project. The Old Faithful Ranger staff, especially Bonnie Schwartz, and the Old Faithful Maintenance staff, especially Roy Jenkins, graciously provided logistical and other help on this project. Linda Franklin contributed valuable field assistance and Skip Ambrose and Chris Florian generously provided assistance and additional monitoring equipment over Presidents Day Weekend. Robin Long expertly analyzed much of the audibility data. Skip Ambrose provided ongoing consultation for many aspects of this project. Literature Cited: Ambrose, S. and S. Burson. 2004. Soundscape studies in national parks. George Wright Forum 21(1): 29- 38 American National Standards Institute (ANSI). 1992. Quantities and procedures for description and measurement of environmental sound. Part 2: Measurement of long- term, wide- area sound. Accredited Standards Committee S12, Noise. Acoustical Society of America, New York, NY. 12 pp. Dunholter, P. H., V. E. Mestre, R. A. Harris, and L. F. Cohn. 1989. Methodology for the measurement of and analysis of aircraft sound levels within national parks. Unpublished report to National Park Service, Contract No. CX 8000- 7-0028. Mestre Greve Associates, Newport Beach, CA. Fleming, G., C. J. Roof, and D. R. Read. 1998. Draft guidelines for the measurement and assessment of low- level ambient noise (DTS- 34- FA865- LR1). U. S. Department of Transportation, Federal Aviation Administration, John A. Volpe National Transportation Systems Center, Acoustics Facility, Cambridge, MA. 83 pp. Harris Miller Miller and Hanson, Inc. 2001. Technical report on noise: winter use plan final environmental impact statement for the Yellowstone and Grand Teton National Parks and John D. Rockefeller, Jr. Memorial Parkway. Report No. 295860.18. June 2001. Harris Miller Miller and Hanson, Inc. 2002. Draft supplemental technical report on noise: winter use plan final supplemental environmental impact statement for the Yellowstone and Grand Teton National Parks and John D. Rockefeller, Jr. Memorial Parkway. Report No. 295860.360. October 2002.
54

Appendix A: Instrument and Setup Protocol AC Output Weighting For digital recordings using the AC output of the SLM, the AC output weighting shall be set to Flat, with appropriate gain setting for SLM or recording device in use Attended Data Logging Observers will conduct attended data logging approximately 50 m (150 feet) from the sound level meter, microphone, and/or tape recorder to ensure that field personnel can move about and conduct whispered conversations without influencing the measured sound. Observations during attended logging will be recorded on a standardized NPS data sheet. Bird Spike Spikes made of wire or hard plastic which prevents birds from perching on microphones and windscreens shall be used. Cables and Wiring All cables and wiring shall be secured to prevent any sound which might be created in windy conditions (due to wiring hitting other objects). Calibrator A calibrator whose performance is essentially independent of off- reference atmospheric conditions (such as the B & K Model 4231) is to be used. Instrument Clocks All clocks associated with the sound measurement effort shall be coordinated with GPS (Global Positioning System) time. This includes sound level meters, data loggers (notebook computer, Personal Digital Assistant- PDA), and all digital watches used during data logging. For long- term measurements, all clocks will be synchronized with GPS time at the beginning of the measurement period, and time differences with GPS time will be noted at the end of the measurement period. Acoustic data collected during the measurement period will be adjusted to correspond with GPS time. Microphone type A type 1 random incidence microphone is recommended for acoustic measurements in wilderness settings. Microphones can be either polarized or pre- polarized.
55

Monitor Location The microphone/pre- amplifier/windscreen shall be placed in a location representative of the habitat/acoustic zone under study. The microphone diaphragm should be placed 1.1 m to 1.5 m above the ground surface and oriented vertically (microphone grid facing the sky). Solar Panels All solar panels should be placed in a location with as little shading as possible and at least .3 m (12 inches) above the ground. Sound Level Meter Sound level meters shall be Type I or better and should perform true numeric integration and averaging in accordance with ANSI S1.4- 1983. Time Weighting Sound level meters shall be set to fast exponential time weighting. Windscreen Windscreens which are effectively acoustically transparent (less than +/- 0.5 dB effect over the frequency span of interest) shall be used.
56

Appendix B: Glossary of Acoustic Terms Acoustics The science of sound. Ambient Sound, Existing All sounds in a given area (includes all natural and all non- natural (human-caused) sounds). Ambient Sound, Less Source of Interest All sounds in a given area excluding a specific sound of interest. For example, when assessing the potential impacts of air tour aircraft, the “ambient sound level less source of interest” would be all sources of sound except air tour aircraft. Ambient Sound, Natural The natural sound conditions found in a given area, including all sounds of nature. The natural ambient sound level of a park is comprised of the natural sound conditions which exist in the absence of mechanical, electrical, and other non- natural sounds. Some generally unobtrusive non- natural sounds (talking quietly, walking) may be part of the natural soundscape, but not those generated by mechanical, electrical, or motorized means. Natural ambient sounds are actually composed of many natural sounds, near and far, which often are heard as a composite, not individually. In an acoustic environment subjected to high levels of non- natural sounds, natural sounds may be masked. Natural ambient sound is considered synonymous with the term “natural quiet,” although “natural ambient sound is more appropriate because nature is not always quiet. Ambient Sound, Non- natural Ambient sounds attributable to non- natural sources (mechanical, electrical, and other non- natural sources). In a national park setting, these sounds may be associated with activities that are essential to the park's purpose, they may be a by- product of park management activities, or they may come from outside the park. Amplitude The instantaneous magnitude of an oscillating quantity such as sound pressure. The peak amplitude is the maximum value. Appropriate Sounds Sound conditions defined as appropriate for an area in a national parks, such as a specific management zone. Other appropriate sounds, not natural in origin, are those types of sounds which are generated by activities directly related to the
57

purposes of a park, including resource protection, maintenance, and visitor services. Natural sounds are not only appropriate, but are part of the park’s resource base to be protected and enjoyed by the visiting public. Appropriate Sound Level Appropriate sound levels in a given area of a park are determined based on mandates in the Organic Act, establishment legislation, or other laws pertinent to the specific purposes and values associated with the park. This determination takes the form of management zone objectives for soundscape, as well as measurable indicators and standards for sound. Attenuation The reduction of sound intensity by various means (e.g., air, humidity and porous materials). Area of Audibility The area within which a specific sound or sounds is audible. Audibility Audibility is the ability of animals with normal hearing, including humans, to hear a given sound. Audibility is affected by the hearing ability of the animal, other simultaneous interfering sounds or stimuli, and by the frequency content and amplitude of the sound. Audiogram A graph showing hearing acuity as a function of frequency and amplitude. Decibel A logarithmic measure of any measured physical quantity and commonly used in the measurement of sound. The decibel provides the possibility of representing a large span of signal levels in a simple manner as opposed to using the basic unit Pascal. The difference between the sound pressure for silence versus a loud sound is a factor of 1,000,000:1 or more, therefore it is less cumbersome to use a small range of equivalent values: 0 to 130 decibels. Doubling of Sound Pressure = 6 dB Doubling of Sound Power = 3 dB Doubling of Perceived Sound Level = 10 dB (approximately) Doppler Effect (or Shift) The apparent upward shift in frequency of a sound as a noise source approaches the receiver or the apparent downward shift when the noise source recedes.
58

Energy Equivalent Sound Level (Leq) The level of a constant sound over a specific time period that has the same sound energy as the actual (unsteady) sound over the same period. Leq depends heavily on the loudest periods of a time- varying sound. Leq of an intruding source by itself, however, is inadequate for fully characterizing the intrusiveness of the source. Research has shown that judgments of the effects of intrusions in park environments depend not only upon the amplitude of the intrusion, but also upon the sound level of the “background,” in this case, the sound level of the non- intruding sources, usually the natural ambient sound levels. Leq must be used carefully in quantifying natural ambient sound levels because occasional loud sound levels (gusts of wind, birds, insects) may heavily influence (increase) its value, even though the sound levels are typically lower. Events per Hour The number of times a non- natural sound source is heard, on average, in one hour (this may be specific to a particular non- natural sound or to all non- natural sounds). If this information is known, presentation and documentation provides another easily comprehended measure of how often the particular intruding sounds are heard. It provides an additional means for communicating the sense of the soundscape. Frequency The number of times per second that the sine wave of sound repeats itself. It can be expressed in cycles per second, or Hertz (Hz). Frequency equals Speed of Sound / Wavelength. Hearing Range (human) An average healthy young person can hear frequencies from approximately 20 Hz to 20000 Hz, and sound pressure levels from 0 dB to 130 dB or more (threshold of pain). The smallest perceptible change is 1 dB. Impact For environmental analysis, an impact is defined as a change at a receptor that is caused by a stimulus, or an action. In accordance with the CEQ regulations (40 CFR Parts 1500- 1508), direct and indirect impacts (environmental consequences) are to be described in an environmental document by assessing their type, magnitude, intensity and duration. The significance of an impact is to be determined specifically in view of criteria provided in 40 CFR 1508.27, based on the outcome of these assessments. An assessment will take account of the short or long term nature of the impact, the extent to which it is either beneficial or adverse, whether it is irreversible or irretrievable, and, finally, its geographic and societal extent. Lastly, a resource impact is put in the context of all other past, present or reasonably foreseeable actions which affect the same resource, and its
59

contribution to the total cumulative effect is to be disclosed. Under CEQ regulations, the term “impact” is synonymous with “effect” (40 CFR 1508.8). Infrasound Frequencies below 20 Hz. Humans perceive frequencies below about 20 Hz as pressure rather than sound. Intensity The sound energy flow through a unit area in a unit time. Loudness The subjective judgment of intensity of a sound by humans. Loudness depends upon the sound pressure and frequency of the stimulus. Loudness was defined by Fletcher and Munson (1933) as a physiological description of the magnitude of an auditory sensation. Masking The process by which the threshold of audibility for a sound is raised by the presence of another (masking) sound. A masking noise is one that renders inaudible or unintelligible another sound that is also present. Noise Traditionally, noise has been defined as unwanted, undesired, or unpleasant sound. This makes noise a subjective term. Sounds that may be unwanted and undesired by some may be wanted and desirable by others. Noise is sound, as defined in this document: a pressure variation, etc. In order to keep terms used in soundscape management as non- subjective as possible, sounds should be classified as either appropriate or inappropriate, rather than as “noise.” or “sound.” The appropriateness of any sound in a given area of a park will depend on a variety of factors, including the management objectives of that area. Octave The interval between two frequencies having a ration of 2 to 1. For acoustic measurements, the octaves start a 1000 Hz center frequency and go up or down from that point, at the 2:1 ratio. From 1000 Hz, the next filter’s center frequency is 2000 Hz, the next is 4000 Hz, etc., or 500 Hz, 250 Hz, etc. Octave filtering is usually referred to as the class of octave filters typically 1, 3 or 12, thus creating full octaves, one- third octaves, or one- twelve octaves. Octave Band The segment of the frequency spectrum centered on an octave center frequency bounded by the midpoint between the next lower and higher octave.
60

Percent Exceedence (Lx) These metrics are the sound levels (L), in decibels, exceeded x percent of the time. The L50 value represents the sound level exceed 50 percent of the measurement period. L50 is the same as the median. The L90 value represents the sound level exceeded 90 percent of the time during the measurement period. L50 and L90 are useful measures of the natural sounds because in park situations, away from developed areas, they are less likely to be affected by non- natural sounds. Put another way, non- natural sounds in many park areas are likely to affect the measured sound levels for less than 50% of the time, and almost certainly for less than 90% of the time. L50 is used when there is high probability that no non-natural sounds affect the measurements. L90 is used when human- produced sounds are present much of the time during measurements. Common sounds that could be present for more than 50% of the time include road traffic sounds and, in some areas, high altitude jet aircraft. Percent Time Above Natural Ambient The amount of time that sound levels from non- natural sound(s) are greater than sound levels of natural ambient sound levels in a given area. This measure is not specific to the hearing ability of a given animal, but a measure of when and how long non- natural sound levels exceed natural ambient sound levels. Percent Time Audible The amount of time that various sounds are audible to animals, including humans, with normal hearing (hearing ability varies among animals). A specific sound may be below the natural ambient sound level, but still be audible to some animals. This information is essential for measuring and monitoring non- natural sounds in national parks. These data can be collected by either a trained observer (attended logging) or by making high- quality digital recordings (for later playback). Percent Time Audible is useful because it is a measure that is understandable without any acoustics knowledge. It is a metric that correlates well with park visitor judgments of annoyance and with visitor reports of interference from certain sound sources with the sounds of nature. Spectrum (Frequency Spectrum) The amplitude of sound at various frequencies. It is given by a set of numbers that describe the amplitude at each frequency or band of frequencies. Sound A wave motion in air, water, or other media. It is the rapid oscillatory compressional changes in a medium that propagate to distant points. It is characterized by changes in density, pressure, motion, and temperature as well as other physical properties. Not all rapid changes in the medium are sound (wind distortion on a microphone diaphragm).
61

Sound Impacts Sound impacts are effects on a receptor caused by the physical attributes of sound emissions. In national parks, non- natural sounds cause physical changes in the soundscape that can be detected and measured. The fact that a sound can be measured does not equate immediately to whether the impact of that sound is adverse, inconsequential, or beneficial, or whether there are adverse secondary impacts on wildlife, cultural values, or visitors. Levels of impact and impact significance are policy determinations. Soundscape Soundscape refers to the total acoustic environment associated with a given area. In a national park setting, soundscapes can be composed of natural sounds, or it can be composed of both natural and non- natural sounds. Soundscape, Natural Natural soundscapes consist of sounds associated with nature: wind, water flow, rain, surf, wildlife, thermal activity, lava flows, or other sounds not generated by non- natural means. Sound Exposure Level (SEL) The total sound energy of an actual sound calculated for a specific time period. SEL is usually expressed using a time period of one second. Sound Level The weighted sound pressure level obtained by frequency weighting, generally A- or C- weighted. Sound Level Floor The lowest amplitude measurable by sound monitoring equipment. Most commercially available sound level meters and microphones can detect sound levels down to about 15 to 20 dBA; however, there are microphones capable of measuring sound levels below 0 dBA. Sound Power (W) The total sound energy radiated by a source per unit time. The unit of measurement is the Watt. Sound Power Level (LW) The acoustic power radiated from a given sound source as related to a reference power level (typically 10- 12 watts) and expressed as decibels. A sound power level of 1 watt = 120 dB (reference level = 10- 12 watts).
62

Sound Pressure Fluctuations in air pressure caused by the presence of sound waves. Sound pressure is the instantaneous difference between the actual pressure produced by a sound wave and the average barometric pressure at a given point in space. Not all pressure fluctuations detected by a microphone are sound (e.g., wind over the microphone). Sound pressure is measured in Pascals (Pa), Newtons per square meter, which is the metric equivalent of pounds per square inch. Sound Pressure Level (SPL) The logarithmic form of sound pressure. In air, 20 times the logarithm (to the base 10) of the ratio of the actual sound pressure to a reference sound pressure (which is 20 micropascals, and by convention has been selected to be equal to the assumed threshold of human hearing). It is also expressed by attachment of the word decibel to the number. Sound Speed The speed of sound in air is about 344 m/sec (1,130 ft/sec or 770 mph) at 70o F at sea level. It substantially varies depending on temperature and type of medium. Time Weighting The response speed of the detector in a sound level meter. For Slow response, the response speed is 1 second. Slow time weighting is frequently used in environmental sound measurements. Fast response time is 1/8 second (0.125). This is less frequently used, but will detect changes in sound levels more rapidly. Both Fast and Slow time weightings have been used in previous NPS acoustic studies, and, when compared over long measurement periods (over several days), there is very little difference in results (differences are often less than the accuracy of the meter). Fast and slow time weightings were developed, in part, to slow needle movement (called a “decay” factor) in analog meters so investigators could read and record sound levels. New digital sound level meters, while changing numbers rapidly on the screen, store sound level data in memory for later analysis, thus, the ability to read numbers on the screen is less important. Hence, the most accurate “weighting” is none. Ultrasound Sounds of a frequency higher than 20,000 Hz. Wave A particular type of disturbance that travels through a medium by virtue of the elastic properties of that medium. Wavelength Wavelength is the distance a wave travels in the time it takes to complete one cycle. A wavelength can be measured between successive peaks or between any
63

two corresponding points on the cycle. Wavelength (ft) = Speed of Sound (ft) / Frequency (Hz). Windscreen A porous device used to cover the microphone of a sound level measurement system. Windscreens are designed to minimize the effects of wind disturbance on the sound levels being measured while minimizing the attenuation of the signal.
These definitions were derived from several sources, including: Acoustic Alliance. 2001. Glossary of Terms, Acoustic Alliance Products and Services Catalog. Provo, UT. American National Standards Institute. 1976. Standard Acoustical Terminology, S1.1. American National Standards Institute, New York, NY. 1976. Bruel & Kjaer. 2002. Environmental Noise. Bruel & Kjaer Sound and Vibration Measurement. Naerum, Denmark. Everest, F. A. 2001. Master Handbook of Acoustics. McGraw- Hill, New York, NY. Hirschorn, M. 2002. Noise Control Reference Handbook. Sound & Vibration, Bay Village, OH. Kelso, D. and A. Perez. 1983. Noise Control Terms Made Somewhat Easier. Minnesota Pollution Control Agency, St. Paul, MN. U. S. Environmental Protection Agency. 1976. About Sound. Environmental Protection Agency, Washington, D. C.
64