
Www.geohelp.ab.ca Resource Development Model Dave Russum Geo-Help Inc.

10th ESRI India User Conference 2009 Geography in Action
Natural Resource Management And Geo-Information Science
P S ROY National Remote Sensing Centre
ISRO, Department of Space, Hyderabad [email protected]
About the Author:
Dr. Roy has made pioneering contributions in Satellite Remote Sensing and Geo-information science for surveying, mapping and monitoring of natural resource, and geo-spatial analysis & modeling, GIS products and solutions. He has contributed immensely to spatial & dynamic assessment of vegetation of India, spatial definition of Indian forest vegetation types and finally spatial characterization of Biome of India leading to landscape ecology analysis, biodiversity assessment, carbon stock, net sown area of cropping systems and defining disturbance regimes in natural vegetation landscape. His research wok in conservation ecology has resulted in National programme on ‘Biodiversity Characterization at Landscape Level’. Key conservation parameters viz., fragmentation, disturbance regimes and biological richness mapping uses habitats (vegetation type), ground sample data, social interaction within landscape and knowledge base, are his innovative contributions. He developed landscape ecology based model (Bio-CAP) for biodiversity characterization and established National LULC monitoring system. He has made major contributions in international research initiatives and developed methodology on Biophysical Spectral Response Model for forest canopy stratification initiated by ITTO in south East Asia and South Asia. Vegetation type map of south central Asia using SPOT vegetation data using phenology as determent. His area of scientific research includes landscape ecology, biodiversity conservation, disaster management, spatial analysis and modeling, surveying, satellite remote sensing mapping, monitoring and management of natural resource. 1.0 INTRODUCTION
Overexploitation of available natural resources for meeting the increasing demand for food, fuel and
fibre of ever-growing population has led to degradation of land by way of soil erosion by water and
wind, salinization and/or alkalinization, waterlogging, shifting cultivation, etc. For optimal utilization
of available natural resources and for taking up any preventive or curative measures for degraded
lands, timely and reliable information on their nature, extent and spatial distribution, and temporal
behaviour is a pre-requisite. Realizing the application potentials of space technology, in general, and
remote sensing technology in particular, the Indian space programme was formulated in the 1960s.
To provide the access of remote sensing technology to all user departments in the country, the
National Natural Resources Management System (NNRMS) was conceptualized in 1983 as an
integrated system. The Planning Committee of the National Natural Resources Management System
(PC-NNRMS) set up at the behest of Planning Commission of Government of India comprising of

10th ESRI India User Conference 2009 Geography in Action
members from concerned user ministries provides policy guidelines and direction to remote sensing
applications programme in the country through its various Standing Committees.
By 2020 India would need 300 million tones of food grain to feed its projected population of 1.3
billion. It calls for improving the productivity of existing arable lands and for bringing more lands
lying otherwise unproductive due to various land degradation processes, under agriculture.
Superposed over land degradation processes that is affecting the productivity of land is the climate
change due to global warming that is adding to new dimension to productivity of land by way of
enhanced levels of CO2 and rising earth surface temperatures. While increasing levels of CO2 (also
called carbon fertilization) have beneficial effect on crop yield, rising temperatures have shown to
have deleterious effect. However, the net effect of climate change on crop yield depends, to a large
extent, on balance between these two processes.
2.0 NATURAL RESOURCES CENSUS
For creating and maintaining a systematic archive of all the digital spatial database of thematic and
base maps generated using remote sensing data, and promote / encourage its usage, the
Department of Space, Government of India has initiated a programme tilted “National Natural
Resources Repository (NRR).” The NRR programme consists of three elements, namely (i) Data
generation, (ii) Database organization, and (iii) Spatial data services. Data generation is being
addressed through Natural Resources Census (NRC) project, database organization through Natural
Resources Data Base (NRDB), and spatial data services is being addressed through NNRMS portal
which houses the GIS repository of natural resources for entire country in a secured environment.
Data generation is being addressed through Natural Resources Census (NRC) project synchronizing
with the national socio-economic survey.
The NRC envisages periodic inventory of land use/land cover at 1: 250,000 scale using Resourcesat-
1 AWiFS images on annual basis with season-wise crop area estimate in addition to inventory of
seven natural resources themes, namely land use /land cover, soils, land degradation,
geomorphology, snow and glaciers, wetlands and vegetation at 1:50,000 scale using Resourcesat-1
Linear Imaging Self-scanning Sensor (LISS-III) data. The project envisages updation of dynamic
natural resources, namely land use/land cover, land degradation, wetlands, vegetation and snow
and glaciers every five years whereas updation of soils and geomorphology will be taken up every
20 years. The project is being executed in association with partner institutes having adequate
infrastructure and expertise
(Annexure 1). In addition, other national-level missions like Rajiv Gandhi National Drinking Water
Mission, wastelands monitoring and biodiversity characterization at landscape level will also get into
NRC database.

10th ESRI India User Conference 2009 Geography in Action
2.1 Land Use and Land Cover (LULC)
2.1.1 Rapid Assessment of Annual LULC
National-level Land Use and Land Cover (LULC) mapping at 1:250,000 scale using multitemporal
Resourcesat-1 AWiFS data has been taken up by the Department of Space to provide interim kharif
cropped area statistics at the end of cropping season annually, and integrated LULC map at the end
of each year beginning from 2004-05. Three cycles of assessments for the periods 2004-05, 2005-
06, 2006-07 have been completed and 4th cycle for the period 2007-08 is in progress. Multi-
temporal AWiFS data acquired during August- May of each crop calendar year (kharif, rabi, and zaid
seasons) have been analyzed using hierarchical decision tree (See 5) and maximum likelihood
algorithm, and interactive classification techniques. Process-based Quality Assurance Scheme (QAS)
was implemented for maintaining classification accuracies. Additionally, surface water bodies and
snow/glaciers layer for entire country have also been generated for three seasons and for all the
three cycles using same database and automated feature extraction approach portraying seasonal
variations therein. The integrated LULC map of 2007-08 and interannual changes therein are shown
in Figure-1 and 2.
Based on the study, the Net Sown Area (NSA) in the first, second and third cycles have been
estimated as 140.17, 141.87, 141.06 million ha, respectively. The NSA has been observed to vary
significantly with variations in rainfall in command areas and irrigation intensive regions, hilly/high
rainfall regions, arid and semi arid regions. Out of 33 meteorological subdivisions, 14 sub-divisions
have shown an increase in NSA with increasing rainfall from cycle-1 to cycle 2. Moderate drought
conditions and seasonal rainfall deficiency of 26 per cent to 50 per cent were reported during 2006-
07 (cycle-3) in North Eastern states, Western UP that has resulted in shrinkage in NSA in these
states with reference to 2005. Consistent double cropped and consistent fallow lands were
delineated based on 3 cycle’s data. Besides, significant reduction in the area under forests due to
shifting cultivation was also observed in NE states.
The LULC database, seasonal snow and water bodies have been organized in geospatial domain in
conjunction with ancillary information on roads, settlements and socio-economic to serve as Web-
enabled LULC information system (BHOOSAMPADA) that would facilitate value- added data query,
utilization and dissemination (http://applications.nrsc.gov.in:15001). The information system has
been organized to serve 1:1 million scale products for wider use as a primary information product,
and 1:250,000 scale products viz., maps, statistics and digital databases to facilitate advanced
analysis and integration. The database, thus generated, will be extremely useful, when integrated
with ancillary information, in effective management of natural resources.

10th ESRI India User Conference 2009 Geography in Action
Figure 1: Land use and land cover map of India (2007-08)

10th ESRI India User Conference 2009 Geography in Action
Figure 2: Inter-annual changes in cropping areas, near Dhule, Maharashtra
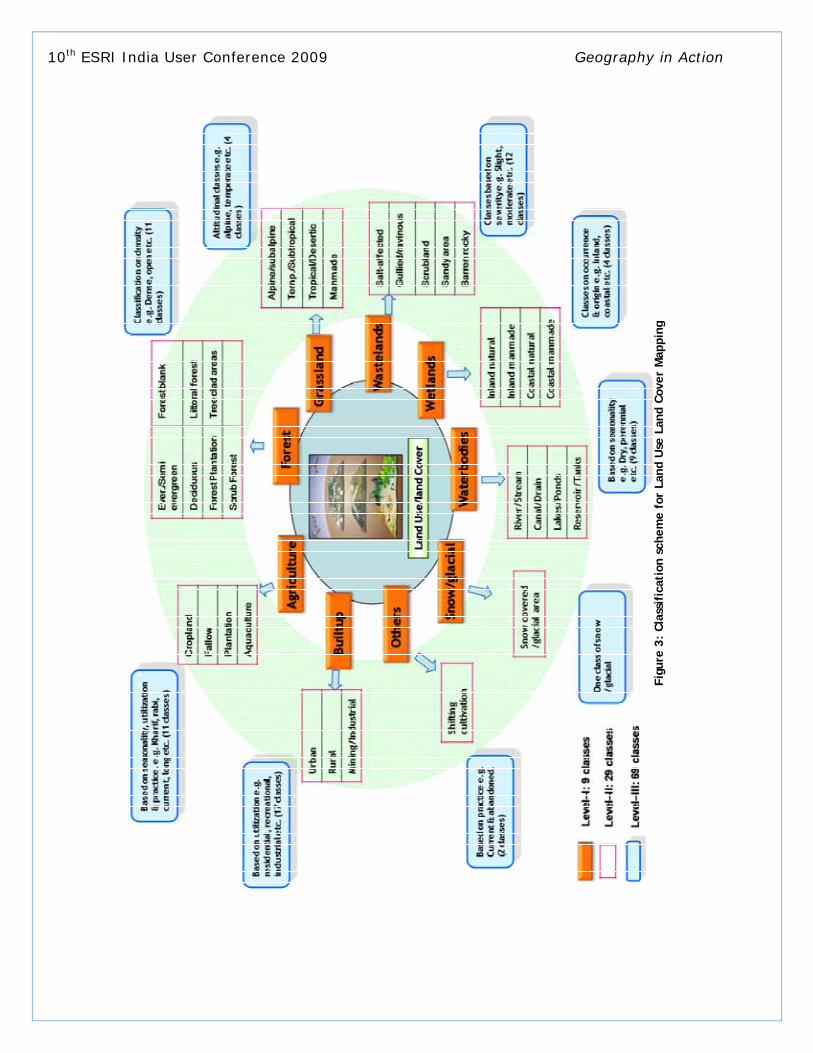
2.1.2 LULC (1:50k)
In addition to 1:250,000 scale LULC mapping, nationwide mapping of land use/ land cover has also
been taken up at 1:50,000 scale using three cropping season viz. kharif, rabi and ziad /summer
Resourcesat-1 Linear Imaging Self-scanning Sensor (LISS-III) data for the period 2005-06 through
heads-up visual interpretation approach in association with 19 partner institutions including various
ISRO/DOS centres. At this mapping scale, LULC categories upto level-III have been mapped (Fig.-
3). In order to ensure the accuracy of LULC maps a two-level (internal and external) systematic
quality auditing has been carried out. In addition, a map template, which will be used for printing
LULC maps for entire country, has also been developed. Atlas at State and district-level will be
brought out for users’ reference. Seamless geodatabase, which is useful in utilising the information
on LULC along with other themes, is also envisaged for entire country. A sample LULC map for part
of Bokaro district, Jharkhand State is appended as Fig.-4.

10th ESRI India User Conference 2009 Geography in Action
2.2 Geomorphology
The information on geomorphology is required for geo-environment, geo-engineering, geo- hazards,
mineral and ground water exploration and also interdisciplinary themes like soil, land use / land
cover and forest cover. Towards realizing the objectives of the project, a pilot study covering diverse
geomorphic regions of the country was taken up in collaboration with Geological Survey of India.
Five test sites, namely Tiruchirapally (Tamil Nadu), Hoshangabad (Madhya Pradesh), Mahanadi Delta
(Orissa), Jalor (Rajasthan) and Kulu (Himachal Pradesh) were identified. The pilot study aimed at
developing national-level legend in association with Geological Survey of India, and preparing a
manual for nationwide geomorphological mapping at 1:50,000 scale. A hierarchical system of
landform classification that is a modification of the pure genetic-based classification system has
been adopted. Based on pilot study, manual and mapping legend are being finalized that will be
used for nationwide geomorphological mapping in collaboration with partner institutions.
2.2 Geomorphology
The information on geomorphology is required for geo-environment, geo-engineering, geo- hazards, mineral and
ground water exploration and also interdisciplinary themes like soil, land use / land cover and forest cover.
Towards realizing the objectives of the project, a pilot study covering diverse geomorphic regions of the country
was taken up in collaboration with Geological Survey of India. Five test sites, namely Tiruchirapally (Tamil
Nadu), Hoshangabad (Madhya Pradesh), Mahanadi Delta (Orissa), Jalor (Rajasthan) and Kulu (Himachal Pradesh)
were identified. The pilot study aimed at developing national-level legend in association with Geological Survey
of India, and preparing a manual for nationwide geomorphological mapping at 1:50,000 scale. A hierarchical
system of landform classification that is a modification of the pure genetic-based classification system has been
adopted. Based on pilot study, manual and mapping legend are being finalized that will be used for nationwide
geomorphological mapping in collaboration with partner institutions.
2.3 Land Degradation
In pursuit of increasing agriculture production additional land, which is lying unproductive, is to be brought
under cultivation after reclamation. Realizing the potential of degraded lands in enhancing agriculture
production, nation-wide land degradation mapping at 1:50,000 scale was taken up using Resourcesat-1 LISS-III
data of kharif, rabi and zaid (summer) through heads-up visual interpretation approach in association with 32
partner institutions including State Remote Sensing Centres, ICAR, ISRO centers, etc. A manual has been
prepared by a team of scientists drawn from ISRO/DOS centres and partner institutions. The legend consists of
the processes of degradation; their severity, major landform where these processes are operating and the
existing land use. There are eight land degradation processes, 18 types, five severity classes, and four broad
land forms and land use categories. The project was initiated in May 2007. Seamless digital database on land
degradation for entire country is also envisaged after conclusion of mapping exercise. sample map of degraded
lands in parts of Guntur district, Andhra Pradesh is shown as Fig.-5.
10th ESRI India User Conference 2009 Geography in Action
Figu
re 3
: Cl
assi
fica
tion
sch
eme
for
Land
Use
Lan
d Co
ver
Map
ping

10th ESRI India User Conference 2009 Geography in Action
Figure 4: Land Use/Land Cover map of Bokaro district (part), Jharkhand
2.4 Soil Resources
Soil resources maps at medium scale data serve as base for planning at district/watershed level planning.
Realizing the utility of medium scale soil maps, soil resources mapping at 1:50,000 scales has been carried out
under various projects taken up by the Department of Space, namely Integrated Mission for Sustainable
Development (IMSD), Integrated Resource System for Desertic Areas (IRISDA), and national Natural Resources
Information System (NRIS). Around 65 % of the country's total geographical area has already been covered for
soil mapping under these programmes. Fresh mapping for rest of the 85 M ha. is being carried out by Soil and
Land Use Survey Institute.
Soil resources mapping at 1: 50,000 scale for rest of the area has been initiated under NR census project using
Resourcesat-1 LISS-III data for the period 2005-2006. Soil and Land Use Survey of India (SLUSI), erstwhile All India
Soil and Land Use Survey (AIS& LUS), Department of Agriculture and Co-operation, Ministry of Agriculture is the
focal point for soil resources mapping. The overall goal of the project is to develop a uniform digital soil
database for entire country on 1:50,000 scales that serve the planning requirement for various users. SLUSI has
already initiated soil mapping exercise following NNRMS standards.

10th ESRI India User Conference 2009 Geography in Action

10th ESRI India User Conference 2009 Geography in Action
2.5 Vegetation
The vegetation type mapping carried out so far by various centers of the Department of Space addresses only
those classes that are amenable to be detected and delineated using remote sensing data. Though such remote
sensing -based spatial database on vegetation types are quite useful for several ecological and forestry
applications, they do not cover address the full spectrum of the forest type classification advocated by
Champion and Seth (1968). In fact, quite a bit of field information is required for addressing all the forest
classes enumerated in the Champion and Seth’s (1968) classification scheme. Realizing the potential of remote
sensing in deriving information on forest types and the complementary role played by conventional approach,
the National Natural Resource Management System (NNRMS) Standing Committee on Bio-Resources and
Environment (SC-B) has requested the Forest Survey of India to take up nationwide forest type mapping 1:50000
scale with the following objectives:
• Preparation of detailed report on forest type mapping - based on Champion and Seth (1968)
classification.
• Generation of forest type maps of the entire country at 1:50,000 scale and on a larger scale for some of
the important areas, and
• Publication of atlas depicting the forest type maps of different regions, states/UTs of India.
The project aims at mapping all the 227 forest types of India described by Champion and Seth (1968) on 1:50,000
scale. The expected outcome from the project is the spatial database on forest types of the country that would
be of immense help in policy planning and field level management. In this exercise, in addition to remotely
sensed data, temperature, rainfall, altitude, aspect, soil and other collateral and legacy information are being
integrated and analyzed in the GIS domain.
The study is carried out in two-step process. Initially, 2 21 ’x 2 2
1 ’ grid- wise forest type maps are prepared using
reference forest cover type, crown density maps and field level species data available with Forest Survey of
India. Subsequently, the two season IRS LISS-III data, 2 21 ’x 2 2
1 ’ reference forest type maps, additional field
data, topography, climate and soil information are used to prepare the final forest type map. The preparation of
forest type reference maps and field data collection is completed for entire country. The forest types mapping is
in advanced stages of completion.
2.6 Wetlands Wetlands are among the most productive ecosystems besides being a rich repository of biodiversity, and are
known to play a significant role in carbon sequestration and maintaining the ecological balance of both biotic
and abiotic life in the coastal and inland environments. In view of the global concern about wetlands and the
potential of remote sensing in deriving information wetlands the Space Applications Centre (SAC) Space
Research Organization Space Research Organization, Department of Space, Indian has carried out a nation-wide
systematic inventory of wetlands at 1:50,000 scale using IRS-1A/1B LISS-II data for the period 1992-93 at the

10th ESRI India User Conference 2009 Geography in Action
behest of the Ministry of Environment and Forests (MoEF), Govt. of India. The information on wetlands, thus
generated, has been organized as a digital database and a wetland information system (WINSYS) has been
developed. Now, the updation of wetlands for entire country at 1: 50,000 scale has been taken up using latest
Resourcesat-1 LISS-III data for the period 2005-06/2007. The project also envisages creation of a digital database
of wetlands as per NNRMS Standards, and to develop a query shell for information retrieval.
2.7 Snow and Glaciers
The nationwide snow and glaciers inventory using Resourcesat-1 AWiFS/LISS-III data has been taken up by Space
Applications Centre (SAC), Ahmedabad, Department of Space along with the partner institutes at the instance of
the Ministry of Environment and Forests, Government of India in the year 2004. The project aims at inventorying
glaciers for entire Himalayas on 1:50,000 scale, snow cover monitoring on 1:250,000 scale every 10 days and
glacier retreat and mass balance studies for selected glaciers.
3.0 OTHER NATIONAL-LEVEL PROJECTS
3.1 Biodiversity Characterization at Landscape Level
Biologically diverse ecosystems, apart from providing the basic ecosystem services like ecosystem stabilization,
gene pool and carbon sinks, are a vital resource for technological development in agriculture, pharmaceuticals
and other technological innovations. Realizing the importance of spatial information on biodiversity, and the
potential of remote sensing and Geographic Information System in deriving such information the Department of
Biotechnology and Department of Space, Government of India have jointly taken up a national-level project on
biodiversity characterization at landscape level in phased manner with the following objectives:
• To prepare baseline data on vegetation and land cover type;
• To study the influence of human activities on landscape as disturbance regimes and habitat
characterization and identification of biologically rich areas, and
• Generation of web-based data repository and information system.
The spatial data on vegetation type derived from remote sensing has been used to generate various landscape
matrices like fragmentation, juxtaposition, and interspersion. These products in conjunction with other spatial
data like settlement, road and fire locations have been used to compute the disturbance regimes. The
disturbance regimes along with the field-based phyto-sociological data and the ecosystem characteristics have
been used to compute the biological richness of area that helps in identifying the areas for prioritization and
conservation. In the first two phases, 86% of the forested areas of the country spread over in North Eastern
Regions, Western Himalayas, Western Ghats, Andaman and Nicobar Islands, Central India, Eastern Ghats and East
Coast and West Bengal have been covered. The work on rest of the forested and natural ecosystems of the
country is in progress. Entire spatial and non-spatial data has been organized in a common platform for sharing
and dissemination of biological resources in a conceptual spatial framework, and the Indian Bio-resources
Information Network (IBIN), a web-portal (http://www.ibin.co.in) has been launched for data organization,
services and dissemination.

10th ESRI India User Conference 2009 Geography in Action
3.2 Nationwide Wastelands Monitoring Initially, wastelands mapping at 1:1million scale for entire country was carried out by NRSC, Department of
Space in 1985. Thirteen categories of wastelands were delineated and an estimated 53million ha accounting for
15% of the geographic area of our country was found to be under wastelands. Subsequently, wastelands
mapping at 1:50,000 scales was taken up by NRSC at the instance of Ministry of Rural Development, Government
of India using Landsat-TM, IRS-1A/-1B LISS-II and IRS-1C/-1D LISS-III data. The project was concluded in the
year 2000, and an estimated 63.85 million ha land have been mapped under thirteen wastelands categories. It
was followed by an updation of wastelands maps at the same scale using IRS-1C/-1D LISS-III data of 2003 with a
view to categorize them for reclamation. The exercise was concluded in 2005 and twenty-eight categories of
wastelands indicating easiness of reclamation were delineated. An estimated 55.27 million ha was delineated as
wastelands. A consolidated state wise “Wasteland Atlas of India – 2005” showing spatial distribution of
wasteland and district wise area statistics was brought out during November 2005. Besides, entire dataset was
organized in a GIS environment and a Wastelands Information System (WALIS) has been developed.
In continuation of above-mentioned project, at the instance of the Ministry of Rural Development a nationwide
project on “Wastelands Monitoring” has been taken up by DOS in association with partner institution using
Resourcesat-1 LISS-III data for kharif, rabi and zaid season data for the period 2005-2006 to study the dynamics
of wastelands.
2.3 Rajiv Gandhi National Drinking Water Mission
The ground water prospects mapping at national level on 1:50,000 scale has been taken up by NRSC in
association with partner institutions under Rajiv Gandhi National Drinking Water Mission (RGNDWM) using remote
sensing and GIS technology in a phased manner. The methodology consists of delineation of hydrogeomorphic
units based on parameters influencing the hydrogeological properties, and evaluation of ground water
condition in each hydrogeomorphic unit. Initially, lithological, geomorphological, structural and hydrological
units were delineated, and were integrated in a GIS environ to derive hydrogeomorphological units.
Subsequently each hydrogeomorphological unit was evaluated for ground water prospects. Additionally,
tentative sites for taking up artificial recharge structures were also identified.
The data, thus generated at different stages has been is converted into a digital database as per NNRMS
standards. Six States, namely - Rajasthan, Madhya Pradesh, Chhattisgarh, Andhra Pradesh, Karnataka and Kerala
were taken up in the first phase that commenced in January 1999 and concluded in the year 2002. Subsequently
in Phase – II, Jharkhand, Himachal Pradesh, Orissa and Gujarat States were taken up in October 2002, and the
ground water prospects maps for these states also have been prepared and submitted to the user department.
The rest of the States have been taken in the ongoing phase-III.

10th ESRI India User Conference 2009 Geography in Action
The maps, thus generated, enable the user departments in narrowing down the target zones around the problem
habitations for detailed ground hydrogeological and geophysical investigations leading ultimately to selection
of the sites for drilling. With respect to sites for recharge structures, though each unit has been evaluated for its
suitability for taking up different types of recharge structures, the precise location needs to be evaluated based
on the requirement, nature of underlying aquifer, site conditions, availability of water for recharge, etc. An
overall 90 % success rate has been reported in all the ten states on selection of sites for drilling. The project has
been executed with following partner institutes:
List of Partner Institutes
• Andhra Pradesh Remote Sensing Applications Centre, Hyderabad • Bhaskaracharya Institute for Space Applications and Geo-informatics, Gandhinagar • Birla Institute of Technology, Jaipur • Central Arid Zone Research Institute, Jodhpur • Centre for Development of Advanced Computing, Pune • Central Soil Salinity Research Institute, Krnal • Department of Science and Technology, Sikkim • Directorate of Ecology, Environment & Remote Sensing, Srinagar, Jammu and Kashmir • Forest Survey of India • Geoinformatics & Remote Sensing Cell, West Bengal State Council of Science & Technology, Kolkata • Geological Survey of India • Himachal Pradesh State Remote Sensing Applications Centre • Indian Institute of Remote Sensing, Dehradun • Institute of Remote Sensing, Anna University, Chennai • ISRO Headquarters, Bangalore • Jharkhand Space Applications Centre, Ranchi • Karnataka State Remote Sensing Applications Centre, Bangalore • Kerala State Remote Sensing & Environment Centre, Thiruvananthapuram • Madhya Pradesh Council of Science and Technology, Bhopal • Maharashtra Remote Sensing Applications Centre, Nagpur • National Remote Sensing Centre, Hyderabad • North Eastern Space Applications Centre, Shillong • Orissa Remote Sensing Applications Centre, Bhubaneswar • Punjab Remote Sensing Applications Centre, Ludhiana • Regional Remote Sensing Service Centre, Dehradun • Regional Remote Sensing Service Centre, Jodhpur • Regional Remote Sensing Service Centre, Kharagpur • Regional Remote Sensing Service Centre, Nagpur • Remote Sensing Applications Centre,Uttar Pradesh, Lucknow • Soil and Land Use Survey of India, Ministry of Agriculture, New Delhi • Soil Survey Organization, Department of Agriculture, Government of Kerala • Space Applications Centre, Ahmedabad • State Remote Sensing Centre • Tamil Nadu Agricultural University, Coimbatore • University of Agricultural Sciences, Dharwar


