Natural Language Processing forPersonal Values and Human ... · Natural Language Processing for...
145
Natural Language Processing for Personal Values and Human Activities by Steven R. Wilson A dissertation submitted in partial fulfillment of the requirements for the degree of Doctor of Philosophy (Computer Science and Engineering) in the University of Michigan 2019 Doctoral Committee: Professor Rada Mihalcea, Chair Assistant Professor David Jurgens Assistant Professor Walter Lasecki Professor James W. Pennebaker
Transcript of Natural Language Processing forPersonal Values and Human ... · Natural Language Processing for...

Natural Language Processing forPersonal Values and Human Activities
by
Steven R. Wilson
A dissertation submitted in partial fulfillmentof the requirements for the degree of
Doctor of Philosophy(Computer Science and Engineering)
in the University of Michigan2019
Doctoral Committee:
Professor Rada Mihalcea, ChairAssistant Professor David JurgensAssistant Professor Walter LaseckiProfessor James W. Pennebaker

In memory of Nora Wilson, Roger McFall,and William Lloyd I
ii

ACKNOWLEDGMENTS
I could not have completed this work without the support and encourage-ment of my family and friends– most of all, my wife, Jenna. Thanks tomy professors at Taylor University, Drs. Brandle and White, who intro-duced me to the world of research and encouraged me to pursue a PhD,and “zillions” of thanks to my advisor Rada Mihalcea and the mem-bers of the LIT Lab with whom I had the chance to collaborate, shareideas, and learn: Veronica, Mohamed, Shibu, Charlie, Costas, Mahmoud,Aparna, Laura, MeiXing, Paul, Oana, Jonathan, Santiago, Allie, Laura,Ash, Ho-Gene, Xianzhi, Renhan, Zheng, Yiting, Harry, Amy, Ana, andmany others who spent time in the lab or around the CSE department atMichigan. I am also very grateful for my collaborators at the Universityof Texas, James Pennebaker and Ryan Boyd, who helped shape the workthat eventually grew into this dissertation, and to the other members ofmy dissertation committee, David Jurgens and Walter Lasecki, for theirhelpful feedback and questions. Finally, thank-you to the anonymousworkers who, through their contributions to various crowdsourcing plat-forms, helped teach computers to understand language a bit more closelyto the way humans do.
This work in this dissertation was supported in part by the Michigan In-stitute for Data Science, the National Science Foundation (#1344257),the John Templeton Foundation (#48503), and the Army Research Insti-tute (#W5J9CQ12C0043). Any opinions, findings, and conclusions orrecommendations expressed in this material are those of the authors anddo not necessarily reflect the views of these organizations.
iii
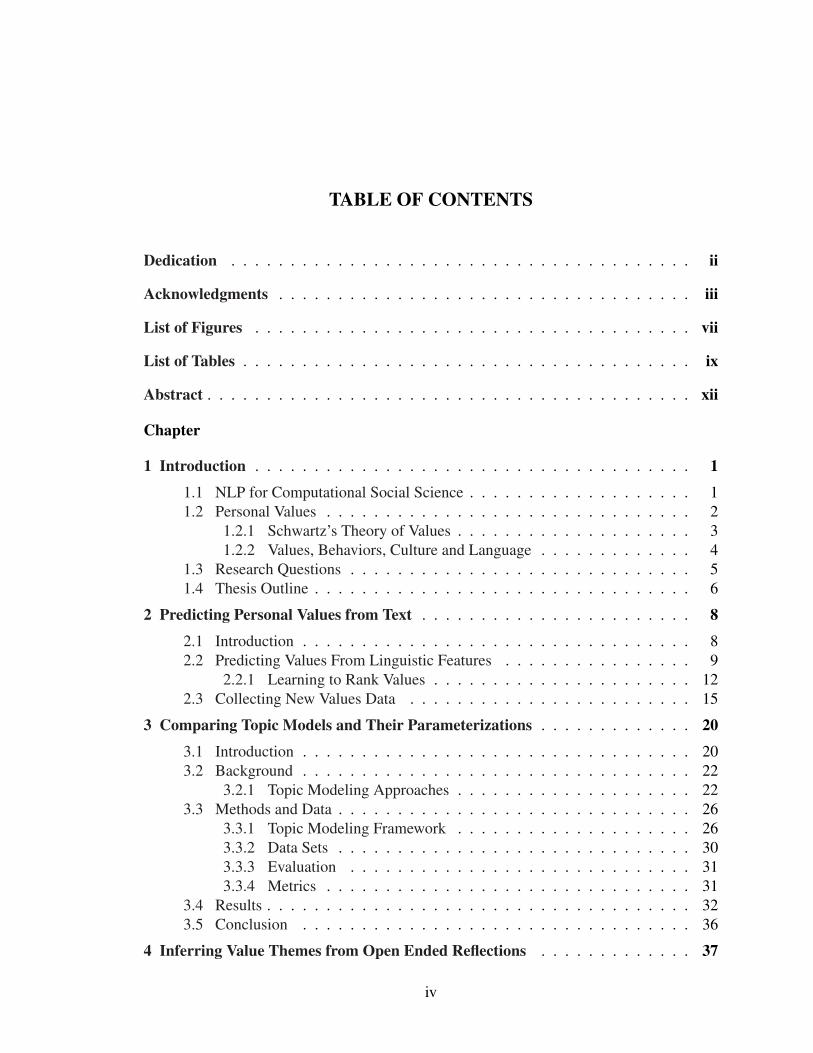
TABLE OF CONTENTS
Dedication . . . . . . . . . . . . . . . . . . . . . . . . . . . . . . . . . . . . . . . ii
Acknowledgments . . . . . . . . . . . . . . . . . . . . . . . . . . . . . . . . . . . iii
List of Figures . . . . . . . . . . . . . . . . . . . . . . . . . . . . . . . . . . . . . vii
List of Tables . . . . . . . . . . . . . . . . . . . . . . . . . . . . . . . . . . . . . . ix
Abstract . . . . . . . . . . . . . . . . . . . . . . . . . . . . . . . . . . . . . . . . . xii
Chapter
1 Introduction . . . . . . . . . . . . . . . . . . . . . . . . . . . . . . . . . . . . . 1
1.1 NLP for Computational Social Science . . . . . . . . . . . . . . . . . . . 11.2 Personal Values . . . . . . . . . . . . . . . . . . . . . . . . . . . . . . . 2
1.2.1 Schwartz’s Theory of Values . . . . . . . . . . . . . . . . . . . . 31.2.2 Values, Behaviors, Culture and Language . . . . . . . . . . . . . 4
1.3 Research Questions . . . . . . . . . . . . . . . . . . . . . . . . . . . . . 51.4 Thesis Outline . . . . . . . . . . . . . . . . . . . . . . . . . . . . . . . . 6
2 Predicting Personal Values from Text . . . . . . . . . . . . . . . . . . . . . . . 8
2.1 Introduction . . . . . . . . . . . . . . . . . . . . . . . . . . . . . . . . . 82.2 Predicting Values From Linguistic Features . . . . . . . . . . . . . . . . 9
2.2.1 Learning to Rank Values . . . . . . . . . . . . . . . . . . . . . . 122.3 Collecting New Values Data . . . . . . . . . . . . . . . . . . . . . . . . 15
3 Comparing Topic Models and Their Parameterizations . . . . . . . . . . . . . 20
3.1 Introduction . . . . . . . . . . . . . . . . . . . . . . . . . . . . . . . . . 203.2 Background . . . . . . . . . . . . . . . . . . . . . . . . . . . . . . . . . 22
3.2.1 Topic Modeling Approaches . . . . . . . . . . . . . . . . . . . . 223.3 Methods and Data . . . . . . . . . . . . . . . . . . . . . . . . . . . . . . 26
3.3.1 Topic Modeling Framework . . . . . . . . . . . . . . . . . . . . 263.3.2 Data Sets . . . . . . . . . . . . . . . . . . . . . . . . . . . . . . 303.3.3 Evaluation . . . . . . . . . . . . . . . . . . . . . . . . . . . . . 313.3.4 Metrics . . . . . . . . . . . . . . . . . . . . . . . . . . . . . . . 31
3.4 Results . . . . . . . . . . . . . . . . . . . . . . . . . . . . . . . . . . . . 323.5 Conclusion . . . . . . . . . . . . . . . . . . . . . . . . . . . . . . . . . 36
4 Inferring Value Themes from Open Ended Reflections . . . . . . . . . . . . . 37
iv
4.1 Introduction . . . . . . . . . . . . . . . . . . . . . . . . . . . . . . . . . 374.1.1 Values and Value Research . . . . . . . . . . . . . . . . . . . . . 37
4.2 Project 1: Values and Behavior in an Online Survey Sample . . . . . . . . 394.2.1 Analysis . . . . . . . . . . . . . . . . . . . . . . . . . . . . . . 39
4.3 Project 2: Values in Social Media . . . . . . . . . . . . . . . . . . . . . . 464.3.1 Analysis . . . . . . . . . . . . . . . . . . . . . . . . . . . . . . 47
4.4 Conclusions . . . . . . . . . . . . . . . . . . . . . . . . . . . . . . . . . 504.4.1 Beyond Values . . . . . . . . . . . . . . . . . . . . . . . . . . . 50
5 Disentangling Topic Models: A Cross-cultural Analysis of Personal Values . . 52
5.1 Introduction . . . . . . . . . . . . . . . . . . . . . . . . . . . . . . . . . 525.2 Methodology . . . . . . . . . . . . . . . . . . . . . . . . . . . . . . . . 53
5.2.1 Topic Modeling with the Meaning Extraction Method . . . . . . 535.2.2 Topic Regression Analysis . . . . . . . . . . . . . . . . . . . . . 545.2.3 Relationships Between Sets of Themes . . . . . . . . . . . . . . 55
5.3 Application to Personal Values . . . . . . . . . . . . . . . . . . . . . . . 565.4 Data Collection . . . . . . . . . . . . . . . . . . . . . . . . . . . . . . . 57
5.4.1 Open-Ended Survey Data . . . . . . . . . . . . . . . . . . . . . 575.4.2 Blog Data . . . . . . . . . . . . . . . . . . . . . . . . . . . . . . 58
5.5 Results . . . . . . . . . . . . . . . . . . . . . . . . . . . . . . . . . . . . 585.5.1 Targeted Topic Extraction . . . . . . . . . . . . . . . . . . . . . 585.5.2 Topic Regression Analysis . . . . . . . . . . . . . . . . . . . . . 605.5.3 Value-behavior Relationships . . . . . . . . . . . . . . . . . . . 605.5.4 Applying Themes to Social Media Data . . . . . . . . . . . . . . 62
5.6 Conclusions . . . . . . . . . . . . . . . . . . . . . . . . . . . . . . . . . 64
6 Building and Evaluating a Hierarchical Values Lexicon . . . . . . . . . . . . . 66
6.1 Introduction . . . . . . . . . . . . . . . . . . . . . . . . . . . . . . . . . 666.2 Methodology . . . . . . . . . . . . . . . . . . . . . . . . . . . . . . . . 67
6.2.1 Hierarchy Initialization . . . . . . . . . . . . . . . . . . . . . . . 686.2.2 Crowd Powered Concept Sorting . . . . . . . . . . . . . . . . . . 686.2.3 Lexicon Expansion . . . . . . . . . . . . . . . . . . . . . . . . . 726.2.4 Using a Hierarchical Lexicon . . . . . . . . . . . . . . . . . . . 74
6.3 Evaluating Lexicons . . . . . . . . . . . . . . . . . . . . . . . . . . . . . 746.3.1 Frequency Testing . . . . . . . . . . . . . . . . . . . . . . . . . 746.3.2 Word Intrusion Choose Two . . . . . . . . . . . . . . . . . . . . 756.3.3 Category-Text Matching . . . . . . . . . . . . . . . . . . . . . . 76
6.4 Case Study: A Lexicon for Values . . . . . . . . . . . . . . . . . . . . . 766.4.1 Collecting Seed Data . . . . . . . . . . . . . . . . . . . . . . . . 776.4.2 Organizing the Value Words . . . . . . . . . . . . . . . . . . . . 786.4.3 Evaluation . . . . . . . . . . . . . . . . . . . . . . . . . . . . . 79
6.5 Conclusions . . . . . . . . . . . . . . . . . . . . . . . . . . . . . . . . . 81
7 Refining Computational Representations of Human Behaviors . . . . . . . . . 82
7.1 Introduction . . . . . . . . . . . . . . . . . . . . . . . . . . . . . . . . . 82
v

7.2 Related Work . . . . . . . . . . . . . . . . . . . . . . . . . . . . . . . . 847.3 Data Collection and Annotation . . . . . . . . . . . . . . . . . . . . . . . 86
7.3.1 Forming Pairs of Activities . . . . . . . . . . . . . . . . . . . . . 877.3.2 Annotating Activity Pairs . . . . . . . . . . . . . . . . . . . . . 887.3.3 Relationships Between Dimensions . . . . . . . . . . . . . . . . 89
7.4 Methods . . . . . . . . . . . . . . . . . . . . . . . . . . . . . . . . . . . 897.4.1 Composed Word-level Embeddings . . . . . . . . . . . . . . . . 917.4.2 Graph-Based Embeddings . . . . . . . . . . . . . . . . . . . . . 927.4.3 Phrase-level Embeddings . . . . . . . . . . . . . . . . . . . . . . 93
7.5 Results . . . . . . . . . . . . . . . . . . . . . . . . . . . . . . . . . . . . 937.5.1 Transfer Learning . . . . . . . . . . . . . . . . . . . . . . . . . 95
7.6 Conclusions . . . . . . . . . . . . . . . . . . . . . . . . . . . . . . . . . 98
8 Clustering and Predicting Human Activities . . . . . . . . . . . . . . . . . . . 99
8.1 Introduction . . . . . . . . . . . . . . . . . . . . . . . . . . . . . . . . . 998.2 Data . . . . . . . . . . . . . . . . . . . . . . . . . . . . . . . . . . . . . 100
8.2.1 Event2Mind Activities . . . . . . . . . . . . . . . . . . . . . . . 1018.2.2 Short Survey Activities . . . . . . . . . . . . . . . . . . . . . . . 1018.2.3 Query Results . . . . . . . . . . . . . . . . . . . . . . . . . . . . 1028.2.4 Creating Human Activity Clusters . . . . . . . . . . . . . . . . . 103
8.3 Methodology . . . . . . . . . . . . . . . . . . . . . . . . . . . . . . . . 1068.3.1 Model Architecture . . . . . . . . . . . . . . . . . . . . . . . . . 1078.3.2 Incorporating Personal Values . . . . . . . . . . . . . . . . . . . 109
8.4 Prediction Experiments . . . . . . . . . . . . . . . . . . . . . . . . . . . 1118.4.1 Results . . . . . . . . . . . . . . . . . . . . . . . . . . . . . . . 112
8.5 Conclusions . . . . . . . . . . . . . . . . . . . . . . . . . . . . . . . . . 114
9 Conclusions . . . . . . . . . . . . . . . . . . . . . . . . . . . . . . . . . . . . . 116
9.1 Revisiting the Research Questions . . . . . . . . . . . . . . . . . . . . . 1169.2 Final Remarks . . . . . . . . . . . . . . . . . . . . . . . . . . . . . . . . 119
Bibliography . . . . . . . . . . . . . . . . . . . . . . . . . . . . . . . . . . . . . . 121
vi

LIST OF FIGURES
1.1 Schwartz’s theorized structure of values (Image from [38]). . . . . . . . . . . . 3
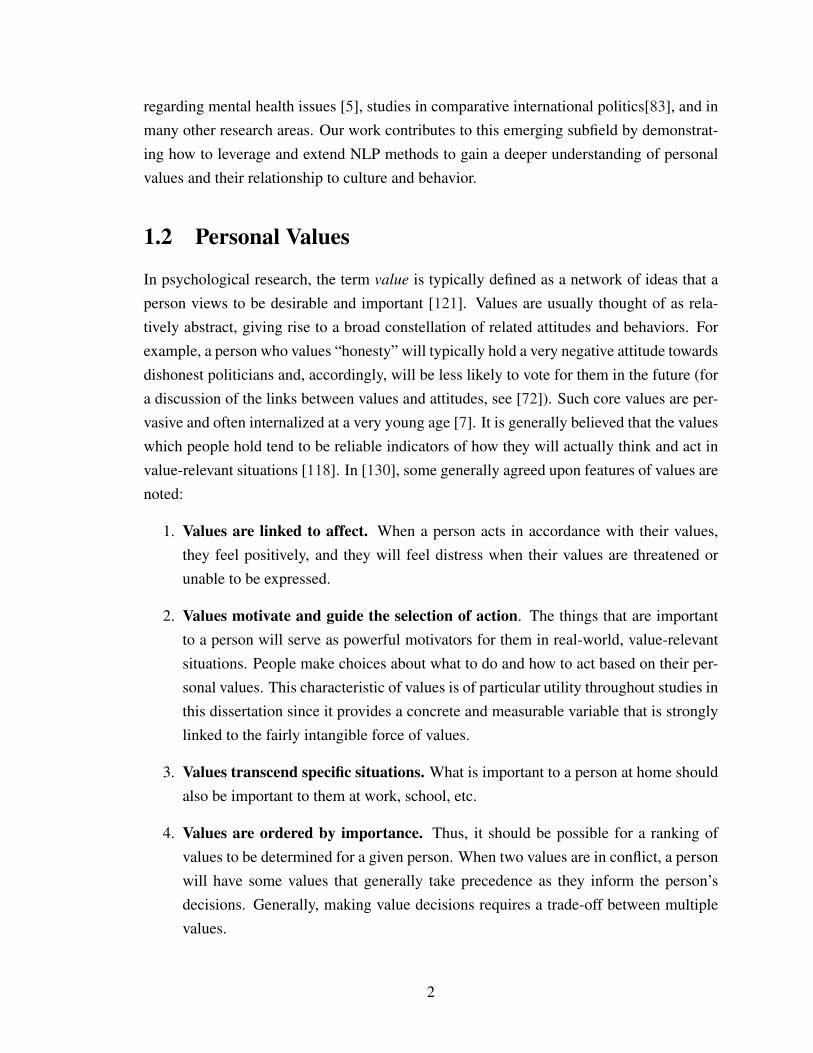
2.1 Accuracy of the 3 top performing classifiers on the five bin classification taskfor the value “Tradition”. Results averaged over a ten-fold cross validation.Difference from theoretical baseline of 0.20 is significant at α = .01 for alldata points using a paired one-tailed t-test. . . . . . . . . . . . . . . . . . . . . 11
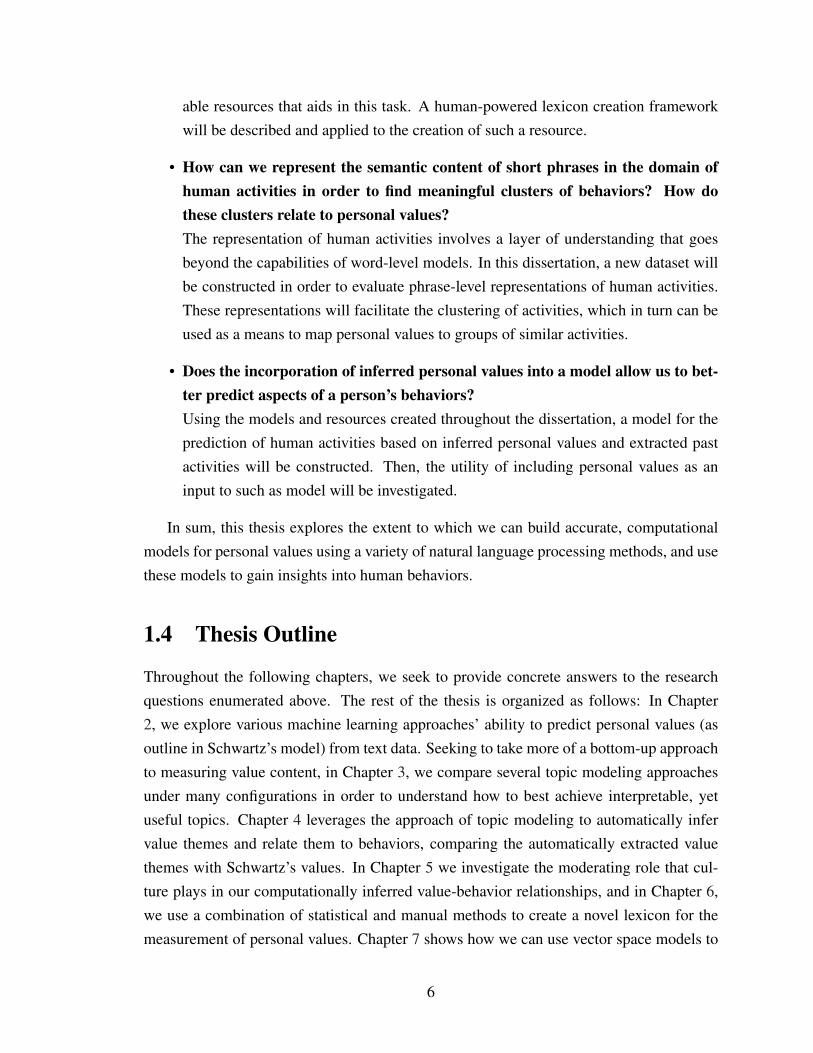
2.2 Ranking loss of the 3 top performing ranking and regression methods on theranking task for the value “Tradition”. Results averaged over a ten-fold crossvalidation. Difference from theoreticaly baseline of .50 is significant at α =.01 for all data points using a paired one-tailed t-test. . . . . . . . . . . . . . . 13
2.3 Accuracy of the 3 top performing methods on the five bin classification taskfor the value “Tradition”. Results averaged over a ten-fold cross validation.Difference from theoretical baseline of .20 is significant at α = .01 for all datapoints other than Linear Regression for K = 750 and K = 1000 (these twopoints are not statistically significant) using a paired one-tailed t-test. . . . . . 17
3.1 Graphical model representation of LDA. Image originally presented in [14]. . . 233.2 Effect of lemmatization on average test perplexity. . . . . . . . . . . . . . . . 343.3 Average cluster purity for each dataset while varying the topic-class ration. . . 35
5.1 Coefficients for the Country, Gender, and Age variables in regression model.For Country, Gender, and Age, negative values indicate a US, male, or youngerbias toward the theme, respectively, and positive values indicate an Indian,female, or older bias toward the theme, respectively. * indicates p < .001. . . . 61
6.1 Example semantic tree structure. . . . . . . . . . . . . . . . . . . . . . . . . . 706.2 Example sorting interface . . . . . . . . . . . . . . . . . . . . . . . . . . . . 726.3 Several possible tree configurations achieved by completing the same HIT in
different ways. . . . . . . . . . . . . . . . . . . . . . . . . . . . . . . . . . . 736.4 Two equally common configurations submitted for the same set of nodes. . . . 78
8.1 t-SNE projection of human activity clusters for kact = 128. Visualizationshows the general landscape of activity space and regions that are groupedtogether– higher values of kact lead to clusters too small to easily inspect inthis format. . . . . . . . . . . . . . . . . . . . . . . . . . . . . . . . . . . . . 104
8.2 Predictive model architecture. . . . . . . . . . . . . . . . . . . . . . . . . . . 1088.3 Average comparison rank score for the 50 class task. . . . . . . . . . . . . . . 113
vii

8.4 Average comparison rank score for the 806 class task. . . . . . . . . . . . . . 114
viii

LIST OF TABLES
2.1 Classification accuracy on a 5-bin classification task for top performing mod-els. Results averaged over ten-fold cross validation. “All” contains LIWC,MRC, and top-500-unigram features. Improvement over the theoretical base-line of 0.20: * indicates p < 0.05, and ** indicates p < 0.01 using a one-tailedpaired t-test. . . . . . . . . . . . . . . . . . . . . . . . . . . . . . . . . . . . . 12
2.2 Results on the 5-bin classification task and 5-bin ranking task for top perform-ing models. Results averaged over ten-fold cross validation. M5P uses top-750-unigrams and SVM uses top-500-unigrams. Neither model was found tohave a statistically significant advantage over the other using McNemar’s testwith α = .05. . . . . . . . . . . . . . . . . . . . . . . . . . . . . . . . . . . . 15
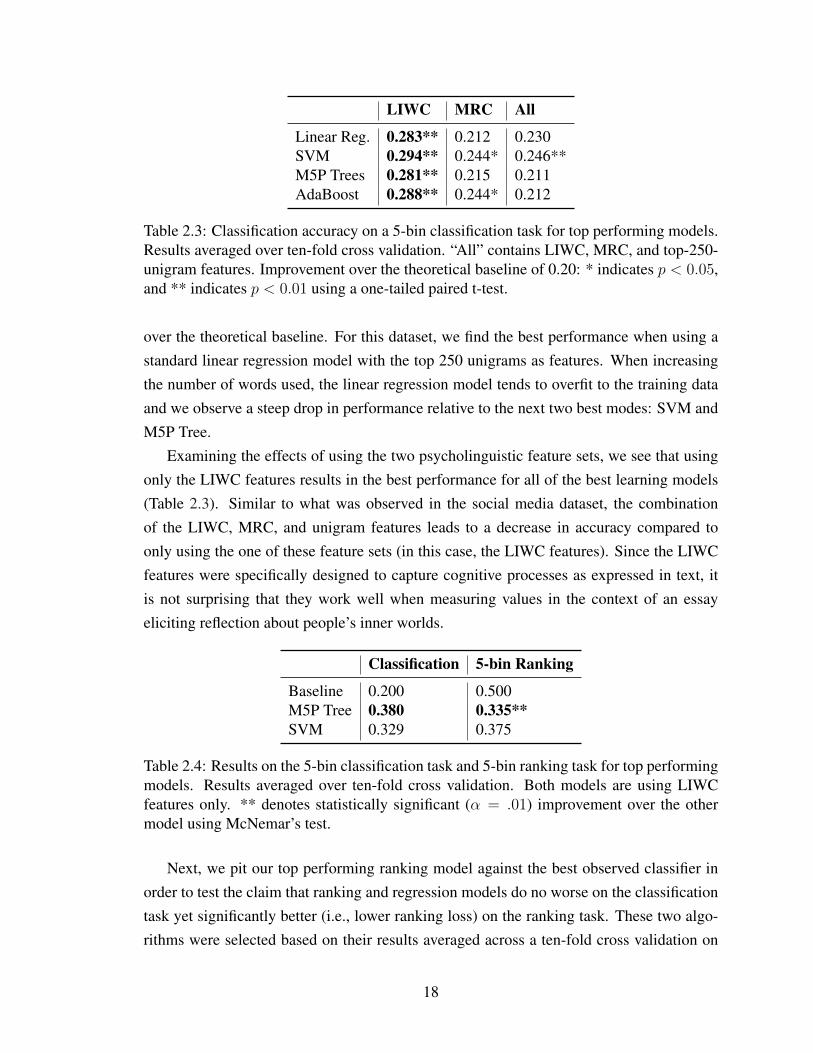
2.3 Classification accuracy on a 5-bin classification task for top performing mod-els. Results averaged over ten-fold cross validation. “All” contains LIWC,MRC, and top-250-unigram features. Improvement over the theoretical base-line of 0.20: * indicates p < 0.05, and ** indicates p < 0.01 using a one-tailedpaired t-test. . . . . . . . . . . . . . . . . . . . . . . . . . . . . . . . . . . . . 18
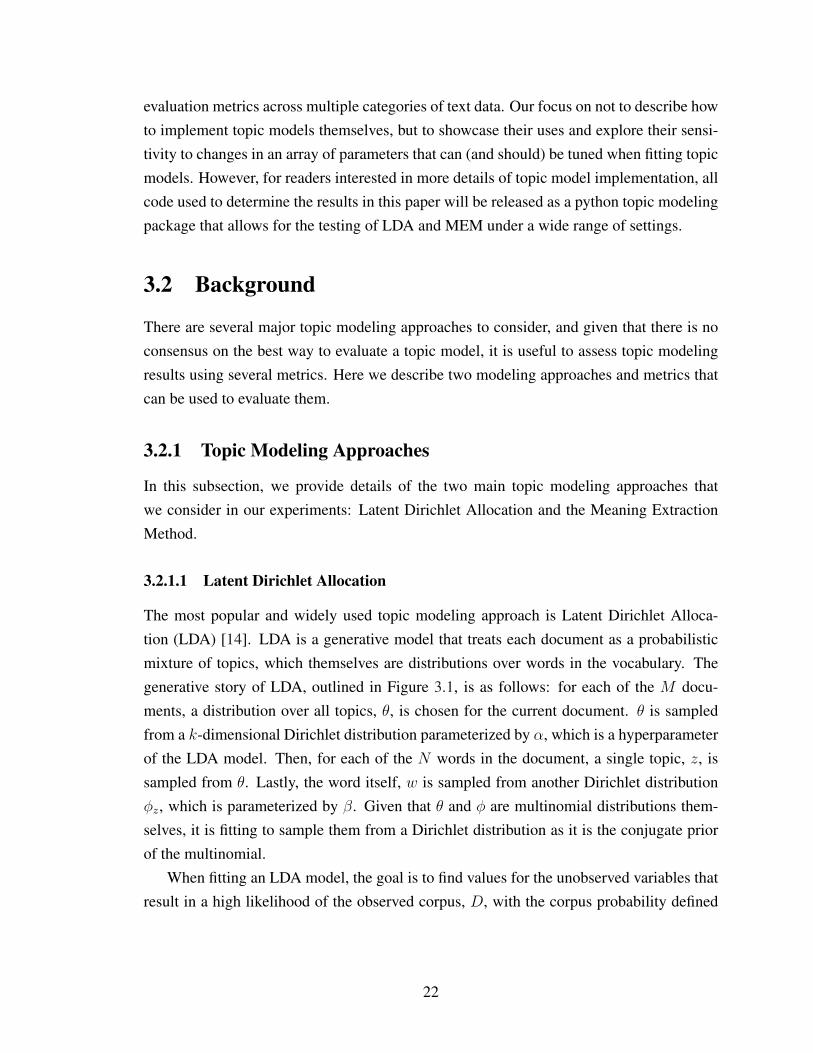
2.4 Results on the 5-bin classification task and 5-bin ranking task for top perform-ing models. Results averaged over ten-fold cross validation. Both modelsare using LIWC features only. ** denotes statistically significant (α = .01)improvement over the other model using McNemar’s test. . . . . . . . . . . . 18
3.1 Corpus preprocessing parameters, shorthand symbols, and values used in ex-periments. . . . . . . . . . . . . . . . . . . . . . . . . . . . . . . . . . . . . . 27
3.2 Topic modeling parameters, shorthand symbols, and values used in experiments. 303.3 Overview of datasets used in experiments. . . . . . . . . . . . . . . . . . . . . 313.4 Averaged evaluation scores for each vocabulary selection method for each
dataset. . . . . . . . . . . . . . . . . . . . . . . . . . . . . . . . . . . . . . . 333.5 Top scores achieved on each dataset by any single model of each type. . . . . . 343.6 Average topic coherence when using either count or bin input data for each
model. . . . . . . . . . . . . . . . . . . . . . . . . . . . . . . . . . . . . . . 35
4.1 Themes extracted by the MEM for the values essay writing task, Project 1. . . 404.2 Themes extracted by the MEM for the behaviors essay writing task, Project 1. . 414.3 Relationships between SVS values and MEM-derived value themes, Project 1.
Positive relationship: • = R2 ≥ .01, = R2 ≥ .04. Negative relationship: ◦= R2 ≥ .01, # = R2 ≥ .04. . . . . . . . . . . . . . . . . . . . . . . . . . . . . 42
4.4 SVS Scores for “Participant Z”. . . . . . . . . . . . . . . . . . . . . . . . . . 43
ix
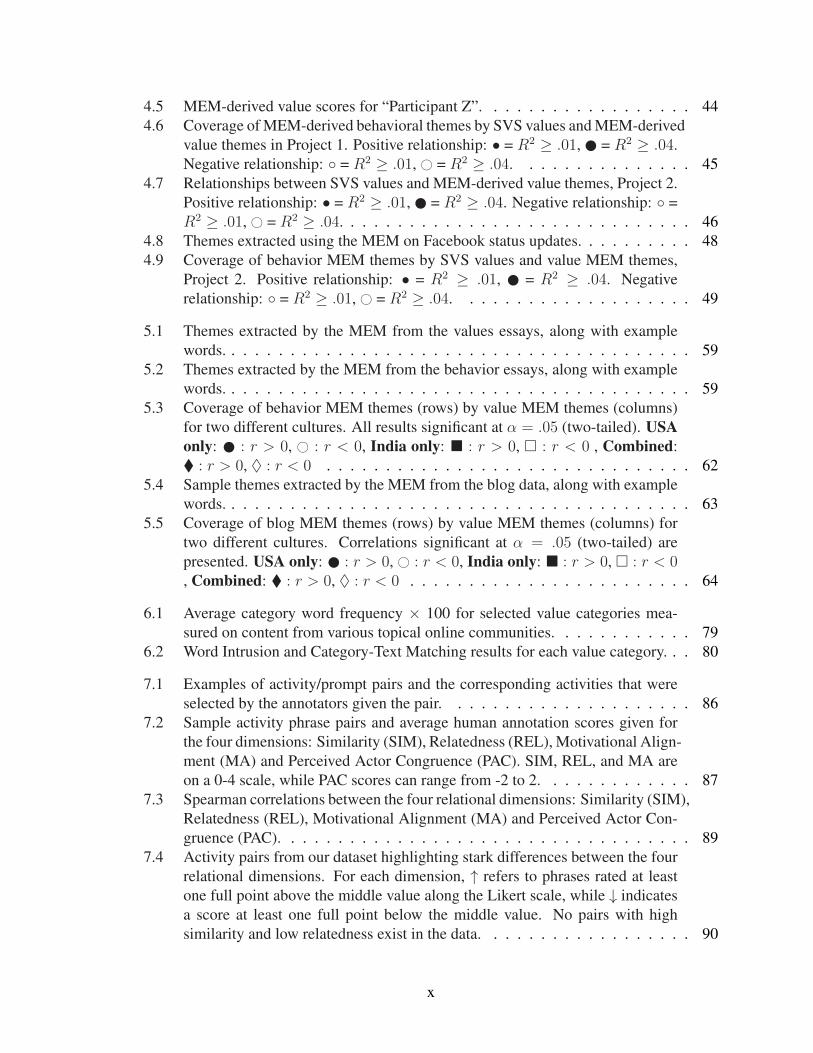
4.5 MEM-derived value scores for “Participant Z”. . . . . . . . . . . . . . . . . . 444.6 Coverage of MEM-derived behavioral themes by SVS values and MEM-derived
value themes in Project 1. Positive relationship: • = R2 ≥ .01, = R2 ≥ .04.Negative relationship: ◦ = R2 ≥ .01, # = R2 ≥ .04. . . . . . . . . . . . . . . 45
4.7 Relationships between SVS values and MEM-derived value themes, Project 2.Positive relationship: • = R2 ≥ .01, = R2 ≥ .04. Negative relationship: ◦ =R2 ≥ .01, # = R2 ≥ .04. . . . . . . . . . . . . . . . . . . . . . . . . . . . . . 46
4.8 Themes extracted using the MEM on Facebook status updates. . . . . . . . . . 484.9 Coverage of behavior MEM themes by SVS values and value MEM themes,
Project 2. Positive relationship: • = R2 ≥ .01, = R2 ≥ .04. Negativerelationship: ◦ = R2 ≥ .01, # = R2 ≥ .04. . . . . . . . . . . . . . . . . . . . 49
5.1 Themes extracted by the MEM from the values essays, along with examplewords. . . . . . . . . . . . . . . . . . . . . . . . . . . . . . . . . . . . . . . . 59
5.2 Themes extracted by the MEM from the behavior essays, along with examplewords. . . . . . . . . . . . . . . . . . . . . . . . . . . . . . . . . . . . . . . . 59
5.3 Coverage of behavior MEM themes (rows) by value MEM themes (columns)for two different cultures. All results significant at α = .05 (two-tailed). USAonly: : r > 0, # : r < 0, India only: � : r > 0, � : r < 0 , Combined:� : r > 0, ♦ : r < 0 . . . . . . . . . . . . . . . . . . . . . . . . . . . . . . . 62
5.4 Sample themes extracted by the MEM from the blog data, along with examplewords. . . . . . . . . . . . . . . . . . . . . . . . . . . . . . . . . . . . . . . . 63
5.5 Coverage of blog MEM themes (rows) by value MEM themes (columns) fortwo different cultures. Correlations significant at α = .05 (two-tailed) arepresented. USA only: : r > 0, # : r < 0, India only: � : r > 0, � : r < 0, Combined: � : r > 0, ♦ : r < 0 . . . . . . . . . . . . . . . . . . . . . . . . 64
6.1 Average category word frequency × 100 for selected value categories mea-sured on content from various topical online communities. . . . . . . . . . . . 79
6.2 Word Intrusion and Category-Text Matching results for each value category. . . 80
7.1 Examples of activity/prompt pairs and the corresponding activities that wereselected by the annotators given the pair. . . . . . . . . . . . . . . . . . . . . 86
7.2 Sample activity phrase pairs and average human annotation scores given forthe four dimensions: Similarity (SIM), Relatedness (REL), Motivational Align-ment (MA) and Perceived Actor Congruence (PAC). SIM, REL, and MA areon a 0-4 scale, while PAC scores can range from -2 to 2. . . . . . . . . . . . . 87
7.3 Spearman correlations between the four relational dimensions: Similarity (SIM),Relatedness (REL), Motivational Alignment (MA) and Perceived Actor Con-gruence (PAC). . . . . . . . . . . . . . . . . . . . . . . . . . . . . . . . . . . 89
7.4 Activity pairs from our dataset highlighting stark differences between the fourrelational dimensions. For each dimension, ↑ refers to phrases rated at leastone full point above the middle value along the Likert scale, while ↓ indicatesa score at least one full point below the middle value. No pairs with highsimilarity and low relatedness exist in the data. . . . . . . . . . . . . . . . . . 90
x

7.5 Spearman correlation between phrase similarity methods and human annota-tions across four annotated relations: Similarity (SIM), Relatedness (REL),Motivational Alignment (MA) and Perceived Actor Congruence (PAC). Topperforming methods for each dimension are in bold font. * indicates correla-tion coefficient is not statistically significantly lower than the best method forthat relational dimension (α = .05). . . . . . . . . . . . . . . . . . . . . . . . 94
7.6 The performance of transfer settings for three models, reported as Spearman’sρ. The lock icon indicates freezing the word embedding matrix weights (wem),and the unlock icon indicates updating them. Note that wem of InferSent mustbe frozen due to its implementation constraints. For each dataset, the besttransfer result per-model is listed in bold font, and the best overall result isunderlined. . . . . . . . . . . . . . . . . . . . . . . . . . . . . . . . . . . . . 97
8.1 Effect of targeted query approach on activity frequency in tweets. “Valid ac-tivities” are defined as first-person verb phrases that clearly indicate that theauthor of the text has actually performed the concrete activity being described.For each set of tweets, a random subset of 100 was chosen and manually an-notated for validity. . . . . . . . . . . . . . . . . . . . . . . . . . . . . . . . . 100
8.2 Number of human activity queries from multiple sources. . . . . . . . . . . . . 1028.3 Summary of query results. . . . . . . . . . . . . . . . . . . . . . . . . . . . . 1028.4 Summary of additional data. . . . . . . . . . . . . . . . . . . . . . . . . . . . 1028.5 Summary valid user filtering. . . . . . . . . . . . . . . . . . . . . . . . . . . . 1038.6 Examples of clustered activities. . . . . . . . . . . . . . . . . . . . . . . . . . 1058.7 Three sample clusters and their distances from the first cluster in Table 8.6,
showing the closest cluster, a somewhat distant cluster, and a very distant cluster.1068.8 Profiles scoring the highest for various values categories when being measured
with the values lexicon. . . . . . . . . . . . . . . . . . . . . . . . . . . . . . . 1098.9 Profiles scoring the highest for various values categories when being measured
with the values lexicon. . . . . . . . . . . . . . . . . . . . . . . . . . . . . . . 1108.10 Per-class Accuracy @ keval for the 50-class prediction task. . . . . . . . . . . 1128.11 Per-class Accuracy @ keval for the 806-class prediction task. . . . . . . . . . . 113
xi

ABSTRACT
Personal values are theorized to influence thought and decision making patterns,
which often manifest themselves in the things that people say and do. We explore
the degree to which we can employ computational models to infer people’s values
from the text that they write and the everyday activities that they perform. In addi-
tion to investigating how personal values are expressed in language, we use natu-
ral language processing methods to automatically discover relationships between
a person’s values, behaviors, and cultural background. To this end, we show that
the automatic analysis of less constrained, open-ended essay questions leads to a
model of personal values that is more strongly connected to behaviors than tradi-
tional forced-choice value surveys, and that cultural background has a significant
influence these connections. To help measure personal values in textual data, we
use a novel crowd-powered sorting algorithm to construct a hierarchical lexicon
of words and phrases related to human values. Additionally, we develop seman-
tic representations of human activities that capture a variety of useful dimensions
such the motivation for which they are typically done. We leverage these repre-
sentations to build deep neural models that are able to make predictions about a
person’s activities based on their observed linguistic patterns and inferred values.
xii

CHAPTER 1
Introduction
1.1 NLP for Computational Social Science
The advent of the internet has fundamentally revolutionized the way that the modern worldoperates. People use the web not only to gather information, conduct business, and seekentertainment, but also to express themselves and socialize with one another. Blogging andsocial media services provide platforms for online communication to a global audience,and the rate of growth of human generated content is only increasing. A great deal of thispublicly shared information is personal in nature and can provide insights into what peopleare thinking, feeling, and doing in their everyday lives. This has made the internet a trove ofdata waiting to be explored by social scientists interested in studying personality, politicalideology, mental disorders, gender, race, values, and more.
The sheer volume of data coming from online sources often makes it difficult for anyperson (or team of people) to manually read, study, and analyze in its entirety. To overcomethis obstacle, many researches turn to computational methods that allow for orders of mag-nitude increases in the amount of information that can be processed in a given period oftime. However, further complications arise from the unstructured nature of the data whichoften exists as raw natural language text rather than a structured database that is easily di-gestible for a computer. State-of-the-art Natural Language Processing (NLP) techniquesneed to be expertly leveraged in order to unlock the full richness of this huge source ofhuman generated content.
Fortunately, a growing body of Computational Social Science research has sought toaddress these very challenges, often relying on NLP tools in order to achieve novel results.This requires an interdisciplinary effort involving theories and methods from diverse fieldssuch as psychology, sociology, linguistics, political science, statistics, data science, andcomputer science. Work at the intersection of these disciplines has led to advances in the or-ganization of disaster recovery efforts [98], the analysis of counselor-patient conversations
1
regarding mental health issues [5], studies in comparative international politics[83], and inmany other research areas. Our work contributes to this emerging subfield by demonstrat-ing how to leverage and extend NLP methods to gain a deeper understanding of personalvalues and their relationship to culture and behavior.
1.2 Personal Values
In psychological research, the term value is typically defined as a network of ideas that aperson views to be desirable and important [121]. Values are usually thought of as rela-tively abstract, giving rise to a broad constellation of related attitudes and behaviors. Forexample, a person who values “honesty” will typically hold a very negative attitude towardsdishonest politicians and, accordingly, will be less likely to vote for them in the future (fora discussion of the links between values and attitudes, see [72]). Such core values are per-vasive and often internalized at a very young age [7]. It is generally believed that the valueswhich people hold tend to be reliable indicators of how they will actually think and act invalue-relevant situations [118]. In [130], some generally agreed upon features of values arenoted:
1. Values are linked to affect. When a person acts in accordance with their values,they feel positively, and they will feel distress when their values are threatened orunable to be expressed.
2. Values motivate and guide the selection of action. The things that are importantto a person will serve as powerful motivators for them in real-world, value-relevantsituations. People make choices about what to do and how to act based on their per-sonal values. This characteristic of values is of particular utility throughout studies inthis dissertation since it provides a concrete and measurable variable that is stronglylinked to the fairly intangible force of values.
3. Values transcend specific situations. What is important to a person at home shouldalso be important to them at work, school, etc.
4. Values are ordered by importance. Thus, it should be possible for a ranking ofvalues to be determined for a given person. When two values are in conflict, a personwill have some values that generally take precedence as they inform the person’sdecisions. Generally, making value decisions requires a trade-off between multiplevalues.
2

1.2.1 Schwartz’s Theory of Values
Within the value research community, various frameworks have been proposed which iden-tify the set of core human values and their relationships with one another [119]. Perhapsthe most widely used of these frameworks was developed by Schwartz and others [126].In the original formulation of this theory, ten primary value categories are organized into acircumplex structure as depicted in Figure 1.1. Later refinements broke each value categoryinto more fine-grained items, but the same overall structure remained intact [131].
Figure 1.1: Schwartz’s theorized structure of values (Image from [38]).
Schwartz’s ten value model has seen great success in psychological research as well asother fields. The basic circumplex model has been applied to the understanding of culture[127, 128], religion [132], cognitive development [24], and politically-motivated behaviors[28], to name but a few domains. Generally speaking, the vast majority of this researchhas been built upon the Schwartz Value Survey (SVS), an internally consistent self-reportquestionnaire commonly used to assess the theorized ten core human values [125].
3

1.2.2 Values, Behaviors, Culture and Language
Psychologists, historians, and other social scientists have long argued that people’s basicvalues predict their behaviors [8, 119]. This is crucial in our efforts to measure and analyzepersonal values from a computational perspective for several reasons: first, behaviors pro-vide a means of grounding for the relatively abstract notion of values, providing a concreteand potentially observable variable that can be linked to values. That is to say, if we areable to construct a representation of personal values that is able to give us reliable insightsinto the kind of things that a person does, this values representation is meaningful not onlytheoretically, but also as a predictor of human behaviors. Further, we can use human behav-ior as a means of evaluating our models of values. As we do not necessarily have a “groundtruth” indication of a person’s values (though we explore various proxies to this “groundtruth” throughout this thesis), we can use our ability to predict measurable behaviors as atest of the utility of our models of values.
It is also important to note that human values are thought to generalize across broadswaths of time and culture [125], yet a person’s cultural background has a strong connectionto their own values [61]. Methodologies that we propose for the measurement of personalvalues should be applicable to data collected in different times and from different cultures.We should not draw universal conclusions about personal values when considering datafrom only a single cultural group, and we will indeed show that our conclusions differdramatically when applying the same methods to texts collected from authors in differentcountries.
Additionally, values have been shown to be deeply embedded in the language that peo-ple use on a day-to-day basis [31, 76]. It is only natural that the guiding forces in a person’slife will come up in everyday speech and writing. For example, if family is of paramountimportance to a person, we can expect that they will be likely to talk about family, usingwords and phrases such as “my mother”, “relationships”, or “my children”. Observingthese types of language patterns can serve as clues into the types of things that a person isthinking about, and in turn, what is important to them.
Because of these strong connections between language, values, behaviors, and culture,linguistic data should provide a valuable lens into people’s inner worlds through whichvalues, and their relationships to behavior and culture, can be studied. Additionally, weshould be able to leverage the recent advances in Natural Language Processing and Com-putational Social Science to study values in new ways and at a larger scale than has everbeen accomplished before. These observations serve as motivation for the approach takenand work completed throughout this thesis.
4

1.3 Research Questions
This thesis uses a computational approach to provide new ways to measure and understandlong-standing psychological phenomena such as personal values, human behaviors, andcultural differences. Specifically, the thesis attempts to answer the following main researchquestions:
• Can we build statistical models to predict a person’s values from their text?This dissertation begins by investigating the connection between a person’s use oflanguage and their personal values. Several models will be developed in order toautomatically infer a person’s values from open-ended writing samples.
• Does a top-down or bottom-up approach to measuring values better relate toreal-world human behaviors?While a top-down, forced response methodology of value measurement is the norm,this dissertation will consider an alternative approach: inferring values in a bottom-up, data-driven manner. The two paradigms will be evaluated by comparing theirability to predict the things people actually do in their everyday lives.
• Which topic modeling approach has qualities best suited for capturing the no-tion of personal values from open ended survey text?Common unsupervised methods for determining the major themes are highly con-figurable, yet there is no consensus on which parameter settings will give the bestresults on data involving personal values and everyday behaviors. A large numberof possible settings will be tested in order to determine which text-preprocessingand modeling decisions allow for the best explanation of data in the domain underconsideration.
• What moderating role does culture play in the relationship between personalvalues and behaviors as measured through text?Values, being a construct heavily influence by a person’s culture, may be expressed indifferent behaviors for different groups of people. This dissertation will describe thedevelopment of models that can account for and quantify cross-cultural differencesin value-behavior relationships as expressed via language.
• How can we semi-automatically create a useful lexicon for the measurement ofpersonal values?Further work in the measurement of values from text will benefit from a freely avail-
5
able resources that aids in this task. A human-powered lexicon creation frameworkwill be described and applied to the creation of such a resource.
• How can we represent the semantic content of short phrases in the domain ofhuman activities in order to find meaningful clusters of behaviors? How dothese clusters relate to personal values?The representation of human activities involves a layer of understanding that goesbeyond the capabilities of word-level models. In this dissertation, a new dataset willbe constructed in order to evaluate phrase-level representations of human activities.These representations will facilitate the clustering of activities, which in turn can beused as a means to map personal values to groups of similar activities.
• Does the incorporation of inferred personal values into a model allow us to bet-ter predict aspects of a person’s behaviors?Using the models and resources created throughout the dissertation, a model for theprediction of human activities based on inferred personal values and extracted pastactivities will be constructed. Then, the utility of including personal values as aninput to such as model will be investigated.
In sum, this thesis explores the extent to which we can build accurate, computationalmodels for personal values using a variety of natural language processing methods, and usethese models to gain insights into human behaviors.
1.4 Thesis Outline
Throughout the following chapters, we seek to provide concrete answers to the researchquestions enumerated above. The rest of the thesis is organized as follows: In Chapter2, we explore various machine learning approaches’ ability to predict personal values (asoutline in Schwartz’s model) from text data. Seeking to take more of a bottom-up approachto measuring value content, in Chapter 3, we compare several topic modeling approachesunder many configurations in order to understand how to best achieve interpretable, yetuseful topics. Chapter 4 leverages the approach of topic modeling to automatically infervalue themes and relate them to behaviors, comparing the automatically extracted valuethemes with Schwartz’s values. In Chapter 5 we investigate the moderating role that cul-ture plays in our computationally inferred value-behavior relationships, and in Chapter 6,we use a combination of statistical and manual methods to create a novel lexicon for themeasurement of personal values. Chapter 7 shows how we can use vector space models to
6

provide better representations of behaviors, and Chapter 8 shows how we are able to useour behavior modeling approaches to cluster behaviors into meaningful groups and makepredictions about these groups using, among other things, information inferred about peo-ple’s values using our hierarchical lexicon. Finally, overall conclusions are presented inChapter 9.
7

CHAPTER 2
Predicting Personal Values from Text
2.1 Introduction
In this chapter we present a series of approaches to computationally understanding the psy-chological construct of values, which have long been argued by psychologists, historians,and other social scientists to predict people’s behaviors [8, 119]. In psychological research,the term value is typically defined as a network of ideas that a person views to be desirableand important [121]. Prior work has shown that human values are captured in everydaylanguage [31, 76]. As an example, consider the following textual expression of personalvalues: “I believe in being honest. I try my best not to lie and to be forthright in my inten-
tions and statements. I also try to help those who have helped me, especially when I was
in desperate need of help. . . ”.1 While this person is clearly discussing values, text on theweb will rarely be this focused and computational approaches will require robust modelsof personal values in order to be applied at scale.
The ability to extract value content from text will allow psychologists and sociologiststo more easily study the value systems of cultures around the world. Additionally, changesin value priorities over time could be assessed based on the text that these cultural groupsgenerate and post to the web in the form of blogs, forum posts, tweets, or other socialmedia. Since we seek to model values through language features, it should also be possibleto make inferences about the types of words and word categories that are related to valuesand how these relationships vary from one culture to the next.
Within the value research community, various frameworks have been proposed whichidentify the set of core human values and their relationships with one another [119]. Per-haps the most widely used of these frameworks was developed by Schwartz and others[126], as was introduced in Chapter 1. Schwartz’s ten value model has seen great success
1This writing sample comes from a new survey of values that is discussed in more detail later in thischapter.
8

in psychological research as well as other fields. The basic circumplex model has been ap-plied to the understanding of culture [127, 128], religion [132], cognitive development [24],and politically-motivated behaviors [28], to name but a few domains. Generally speaking,the vast majority of this research has been built upon the Schwartz Value Survey (SVS), aninternally consistent self-report questionnaire commonly used to assess the theorized tencore human values [125].
In this chapter, we begin by taking for granted that the SVS provides the ground truth fora person’s set of values. We formulate a supervised learning problem in which we attemptto predict a person’s values within the framework proposed by Schwartz using commonpsycholinguistic features as well as individual words. Next, we collect a new dataset thatseeks to provide a more focused picture of the relationships between values, words, andeveryday behaviors. Based on analysis of these results, we challenge the assumption thatquantitative self-report questionnaires such as the SVS should be used as the gold standardfor complex mental constructs. We take a bottom-up approach to values through the use oftopic modeling to automatically discover value concepts from a person’s text, and we showthat these models can be applied on large scale social media data.
2.2 Predicting Values From Linguistic Features
As a first step toward a computational representation of values through text, we formulatea five class supervised classification task. Our overarching goal in this section is to explorethe extent to which we can make predictions about people’s values as defined by the SVS.The SVS results in a numeric value for each of the ten values, and we try to make predic-tions regarding these values solely based on the words that the survey respondent uses. Asimple approach to this is as follows: for each of the ten value dimensions captured by theSVS, we first rank all subjects according to their score. Formally, let X represent the set ofall subjects, and vi(x) : x ∈ X represent the score of x for the ith value type to be modeled.Each participant is labeled as belonging to one of five bins Bi : i ∈ {1, 2, . . . , 5}, each con-taining the same number of items, such that ∀xi ∈ Bi,∀xj ∈ Bj, (i < j)→ vi(xi) > vi(xj)
and no information is retained about ordering within each bin. We can use these labels astarget values for the training of a given machine learning classifier. The classification meth-ods considered are: C4.5 decision tree learning, Nearest neighbour (k = 1), Naive Bayes,Ripper, Adaboost (10 rounds of boosting) and Support vector machines with linear kernels.Additionally, regression methods can be trained directly on the numeric scores received byeach person when taking the SVS. The regression methods tested are: linear regression,M5 regression tree, M5 model tree returning a linear model, REPTree decision tree, and a
9

model based on Support vector machines with linear kernels. The implementations of eachof these algorithms used are those that are a part of the Weka machine learning toolkit [147]and the default parameters are used. These models were previously selected for use in [85]for their interpretability in addition to prediction accuracy in an experimental setting.
We begin with an examination of a pre-existing dataset from the social media domain.2
As part of the myPersonality project [68], Facebook users were given the opportunity tocomplete various psychological assessments including the SVS. Users also allowed theirstatus updates to be collected. For the purposes of this study, all status updates for a givenuser are combined into a single document which is used as the text sample for that user.All users who produced at least 50 total words combined between all of their status updatesare used for this dataset, leading to a sample size of N = 1260. This minimum word countwas enforced in order to reduce the sparsity of the linguistic feature vectors.
We represent each text sample using a bag-of-words language model by creating wordcount vectors. We used a list of common stopwords contained in the python Natural Lan-guage Toolkit3 to filter out extremely common words such as articles and prepositions. Tokeep these count vectors from becoming extremely large, only the features correspond-ing to the top K unigrams are retained, where K is a parameter that we tune using crossvalidation. In addition to individual words, psycholinguistic features from the LinguisticInquiry Word Count (LIWC) dictionaries [107] and the Medical Research Council (MRC)psycholinguistic database [33] are extracted from each text sample. LIWC is a widelyused word counting software package that includes manually crafted dictionaries of wordsknown to be related to human cognitive processes. The LIWC features come in two vari-eties: dictionary based features and text statistics. For each of the dictionary based features,a set of words and word stems is given for each cognitive property. The number of appear-ances of these words and word stems gives a score for each dictionary item. The textstatistics are generic and include information such as the number of words per sentence,punctuation markers, and total word count. The MRC database includes entries for over150,000 words and includes a number of relevant features such as age of acquisition, con-creteness, familiarity, imagery, number of syllables, and frequency counts from multiplecorpora. Here, we will experiment with various combinations of these feature sets. Duringthe model selection phase of our experiments, we only rely on a randomly sampled 90%portion of the data. On this 90% sample, we perform ten-fold cross validation in order tomost accurately approximate the performance of the various models under consideration.
2These experiments were also performed on a corpus of student stream-of-consciousness style essays.Results are similar to those reported here.
3nltk.org
10
200 400 600 800 1,0000.22
0.24
0.26
0.28
Number of Unigrams (K)
Cla
ssifi
catio
nA
ccur
acy
SVMNaive Bayes
AdaBoost
Figure 2.1: Accuracy of the 3 top performing classifiers on the five bin classification taskfor the value “Tradition”. Results averaged over a ten-fold cross validation. Differencefrom theoretical baseline of 0.20 is significant at α = .01 for all data points using a pairedone-tailed t-test.
The current study will focus on a single value from the ten that are represented in theSVS: “Tradition”. This value type was found to be predicted at a significant level by thegreatest number of machine learning models. The following analysis has been performedfor all ten values, with results ranging from extremely poor (no significant difference fromthe theoretical baseline of random guessing) to the results that we show in greater detail.While it is not the case that the same decisions were made to handle each value type, wehope to outline an instantiation of the general approach used while presenting a manageableslice of the myriad results compiled.
In order to select a value for the K parameter, which controls for the number of un-igram features to use, we evaluate the performance of our machine learning models atK = {250, 500, 750, 1000}. As depicted in Figure 2.1, the optimal setting for K is notdefinitively clear since no single K value gives the best results for all classifiers. Theclassifiers displayed in this figure are selected based on their performance averaged over aten-fold cross validation which was found to be higher than all other models. For resultsusing this social media dataset, we set K = 500. We arrive at this value by taking themaximum of the classification accuracies at each value for K, finding 500 to produce thehighest value.
Next we examine the performance of the psycholinguistic feature sets individually. Forthe social media set, we fit all classification and regression models using the concatena-tion of the LIWC, MRC, and top-K-unigram features using our experimentally determined
11

LIWC MRC All
SVM 0.253** 0.196 0.246**Naive Bayes 0.253** 0.219 0.242**AdaBoost 0.210 0.230** 0.212Linear Regression 0.237* 0.250** 0.230
Table 2.1: Classification accuracy on a 5-bin classification task for top performing models.Results averaged over ten-fold cross validation. “All” contains LIWC, MRC, and top-500-unigram features. Improvement over the theoretical baseline of 0.20: * indicates p < 0.05,and ** indicates p < 0.01 using a one-tailed paired t-test.
best value of K for each dataset. We compare these results to those achieved using eachof these feature sets individually, finding that the LIWC features alone using the SVM orNaive Bayes classifier gives the best performance (Table 2.1). Linear Regression on theMRC features also yields competitive performance. The models in the table are those withthe most significant improvement over the random baseline. It appears that the combinationof all of the features considered thus far leads to a decrease in performance. Recall that thehighest accuracy achieved for “Tradition” is using the SVM with the top-500-unigrams (ac-curacy of 0.274 in Figure 2.1). While the LIWC and MRC features have merit as validatedpsycholinguistic measures, for these social media data we find that simple word counts leadto better models.
2.2.1 Learning to Rank Values
Following the approach of [85], we also consider a ranking approach to the modeling ofpsychological constructs. When modeling the results of a values survey, ranking resultsmay be more practical since the numeric scales have arbitrary values (as opposed to re-flecting real-world measures) [46]. So, we test the usefulness of treating the value scalesas ordinal rather than ratio. For any of the ten values defined by Schwartz, we can train amodel to order the list of subjects based on their scores for that value type. Improvement ismeasured using pairwise ranking loss, and:
Ti = {(x0, x1) ∈ (X ×X) : vi(x0) > vi(x1)} (2.1)
defines the set of training examples for trait i using the previously stated definitions of viand X . Ranking loss is then defined by the number of incorrectly ordered examples, and
12
200 400 600 800 1,000
0.44
0.46
0.48
Number of Unigrams (K)
Ran
king
Los
s
Linear Reg.RankBoostM5P Tree
Figure 2.2: Ranking loss of the 3 top performing ranking and regression methods on theranking task for the value “Tradition”. Results averaged over a ten-fold cross validation.Difference from theoreticaly baseline of .50 is significant at α = .01 for all data pointsusing a paired one-tailed t-test.
the objective becomes finding a function Hi for each trait that minimizes:
Loss1 =1
|Ti|∑
(x0,x1)∈Ti
I(Hi(x0) ≤ Hi(x1)) (2.2)
Where I(·) is an indicator function that returns 1 if its argument is true and 0 otherwise.In addition to the regression methods that were used to measure classification accuracy,
we also implement the RankBoost algorithm as described in [46]. The results measuringranking loss achieved by the top performing models (selected using ten-fold cross valida-tion) as a function of the number of unigrams used in the feature set are shown in Figure2.2 for the social media dataset. The optimal value for K is 750 for each of the best 3ranking or regression models, and the M5P Trees yield the minimum ranking loss out of allconfigurations that we tested.
An interesting claim made in [85] is that methods which treat human personality as acontinuous construct (i.e., regression and ranking models) are better suited for ranking tasksand equally successful for classification tasks than classification models. We make thishypothesis strictly binary and test whether or not regression and ranking models achievesignificantly lower ranking loss than classification methods with no significant drop in clas-sification accuracy (significance measured using a one-tailed paired t-test). Here, we seekto test this claim in the case of personal values, but in order to do so we must first under-stand how the comparison between ranking, regression, and classification models will be
13
made.It is straightforward to map the results of regression and ranking algorithms to a ranking
due to the fact that each item from the test set will receive a prediction in the form of a scalarvalue. The instances can simply be sorted by the value given, breaking any ties randomly.In order to measure how well classification algorithms are able to capture the ranked orderof the items, X is first divided into 5 bins Bi : i ∈ {1, 2, . . . , 5} each containing an equalnumber of items, such that ∀xi ∈ Bi, ∀xj ∈ Bj, (i < j) → vi(xi) > vi(xj) and noinformation is retained about ordering within each bin. Now a classifier can be trained topredict which bin each subject belongs to, thereby inducing a coarse raking. To measurethe ranking loss in this case, ranking loss can be calculated using equation 2.2 with thefollowing as the Hi function:
Hi(x) =1
predC(x)(2.3)
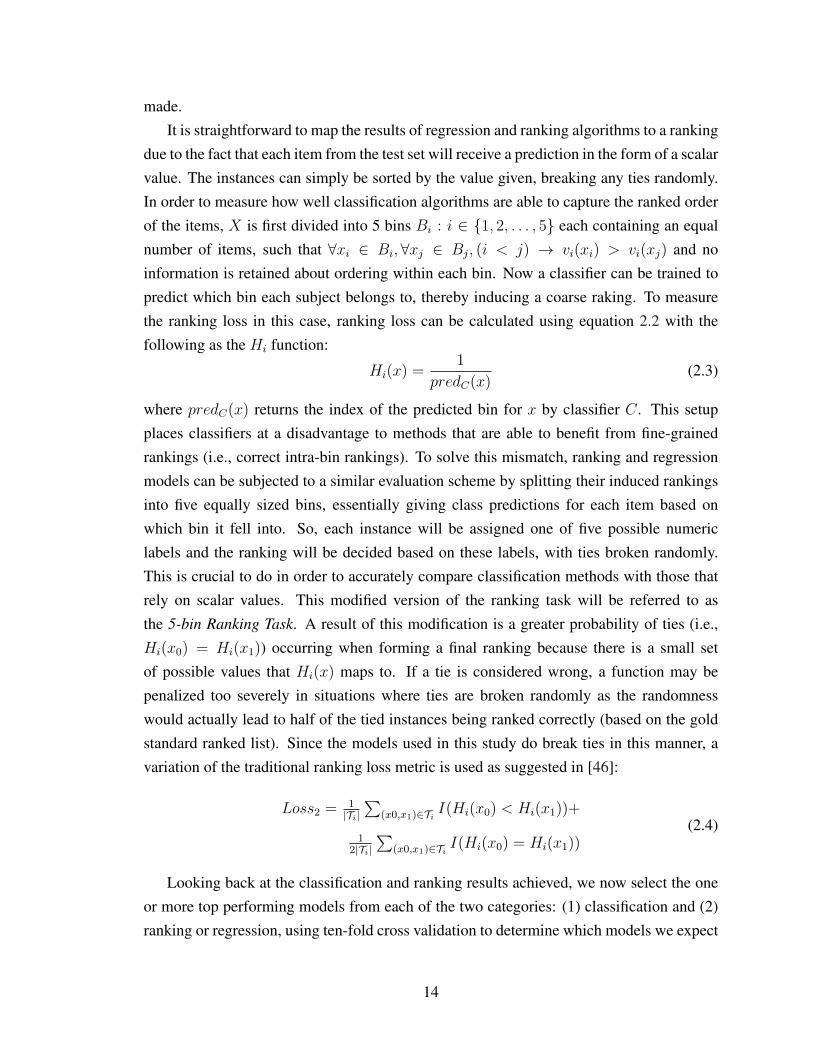
where predC(x) returns the index of the predicted bin for x by classifier C. This setupplaces classifiers at a disadvantage to methods that are able to benefit from fine-grainedrankings (i.e., correct intra-bin rankings). To solve this mismatch, ranking and regressionmodels can be subjected to a similar evaluation scheme by splitting their induced rankingsinto five equally sized bins, essentially giving class predictions for each item based onwhich bin it fell into. So, each instance will be assigned one of five possible numericlabels and the ranking will be decided based on these labels, with ties broken randomly.This is crucial to do in order to accurately compare classification methods with those thatrely on scalar values. This modified version of the ranking task will be referred to asthe 5-bin Ranking Task. A result of this modification is a greater probability of ties (i.e.,Hi(x0) = Hi(x1)) occurring when forming a final ranking because there is a small setof possible values that Hi(x) maps to. If a tie is considered wrong, a function may bepenalized too severely in situations where ties are broken randomly as the randomnesswould actually lead to half of the tied instances being ranked correctly (based on the goldstandard ranked list). Since the models used in this study do break ties in this manner, avariation of the traditional ranking loss metric is used as suggested in [46]:
Loss2 =1|Ti|∑
(x0,x1)∈Ti I(Hi(x0) < Hi(x1))+
12|Ti|
∑(x0,x1)∈Ti I(Hi(x0) = Hi(x1))
(2.4)
Looking back at the classification and ranking results achieved, we now select the oneor more top performing models from each of the two categories: (1) classification and (2)ranking or regression, using ten-fold cross validation to determine which models we expect
14
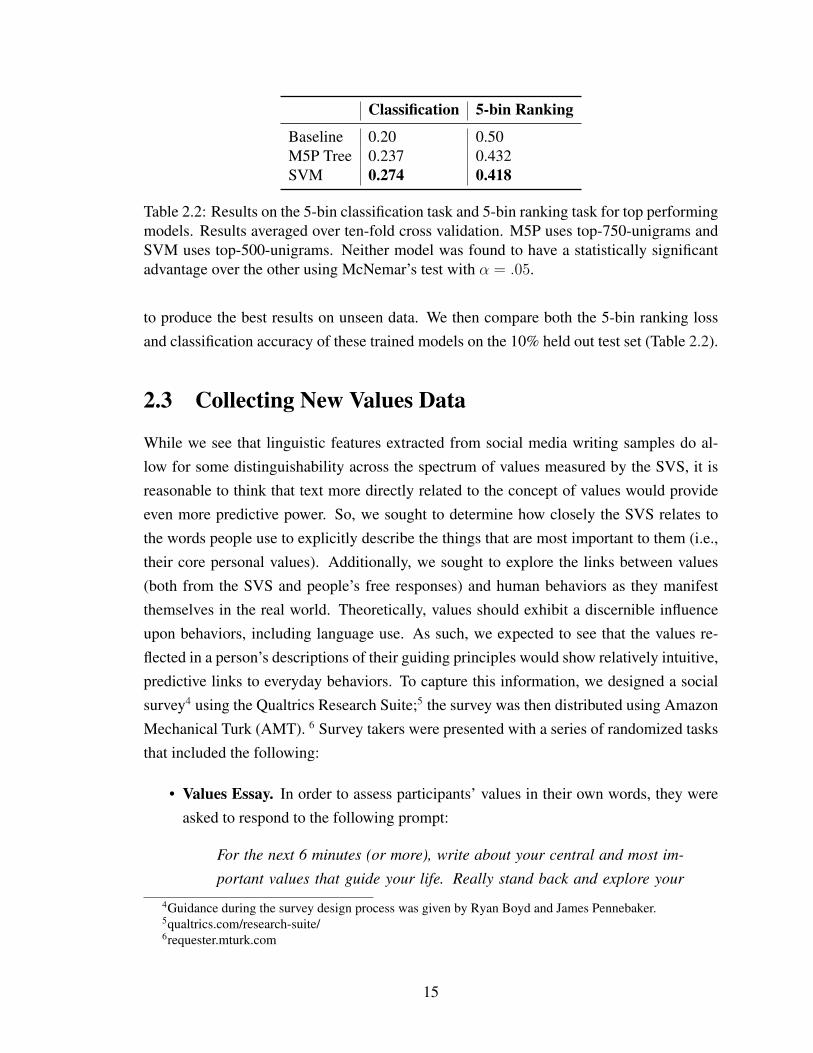
Classification 5-bin Ranking
Baseline 0.20 0.50M5P Tree 0.237 0.432SVM 0.274 0.418
Table 2.2: Results on the 5-bin classification task and 5-bin ranking task for top performingmodels. Results averaged over ten-fold cross validation. M5P uses top-750-unigrams andSVM uses top-500-unigrams. Neither model was found to have a statistically significantadvantage over the other using McNemar’s test with α = .05.
to produce the best results on unseen data. We then compare both the 5-bin ranking lossand classification accuracy of these trained models on the 10% held out test set (Table 2.2).
2.3 Collecting New Values Data
While we see that linguistic features extracted from social media writing samples do al-low for some distinguishability across the spectrum of values measured by the SVS, it isreasonable to think that text more directly related to the concept of values would provideeven more predictive power. So, we sought to determine how closely the SVS relates tothe words people use to explicitly describe the things that are most important to them (i.e.,their core personal values). Additionally, we sought to explore the links between values(both from the SVS and people’s free responses) and human behaviors as they manifestthemselves in the real world. Theoretically, values should exhibit a discernible influenceupon behaviors, including language use. As such, we expected to see that the values re-flected in a person’s descriptions of their guiding principles would show relatively intuitive,predictive links to everyday behaviors. To capture this information, we designed a socialsurvey4 using the Qualtrics Research Suite;5 the survey was then distributed using AmazonMechanical Turk (AMT). 6 Survey takers were presented with a series of randomized tasksthat included the following:
• Values Essay. In order to assess participants’ values in their own words, they wereasked to respond to the following prompt:
For the next 6 minutes (or more), write about your central and most im-
portant values that guide your life. Really stand back and explore your
4Guidance during the survey design process was given by Ryan Boyd and James Pennebaker.5qualtrics.com/research-suite/6requester.mturk.com
15

deepest thoughts and feelings about your basic values. You might think
about the types of guiding principles that you use to make difficult deci-
sions, interact with other people, and determine the things that are impor-
tant in your life and the lives of those around you. Try to describe each
of these values and their relationship to who you are. Once you begin
writing, try to write continuously until time runs out.”
• Behavior Essay. Similarly, a prompt was given with the aim of collecting naturallanguage related to everyday behaviors. This prompt was not intended to acquirea list of all behaviors in which all participants engaged. Rather, our goal was to ac-quire a natural language behavioral inventory that reflected common, psychologicallymeaningful behaviors. The writing prompt read as follows:
For the next 6 minutes (or more), write about everything that you have
done in the past 7 days. For example, your activities might be simple,
day-to-day types of behaviors (such as eating dinner with your family,
making your bed, writing an e-mail, and going to work). Your activities
in the past week might also include things that you do regularly, but not
necessarily every day (such as going to church, playing a sport, writing a
paper, having a romantic evening) or even rare activities (such as skydiv-
ing, taking a trip to a new place). Try to recall each activity that you have
engaged in, starting a week ago and moving to the present moment. Be
specific. Once you begin writing, try to write continuously until time runs
out.”
• Schwartz Value Survey Respondents were asked to assign integers in the range[-1,7] to the 57 different value items of the SVS based on how important they per-ceived them to be as guiding principles in their own lives. With this scale, highernumbers indicate greater personal importance – responses were made using a Likert-type scale. Scores for the ten values were then calculated by taking the mean of theindividual items that characterize each particular value type, with corrections beingperformed to address respondents’ differences in use of the response scale. This stepinvolves computing the average score for each individual across all 57 survey items,then centering each item’s score around that average value [129].
Tasks were presented in a randomized fashion between participants in order to mini-mize the potential for order effects, placing boundaries on any effects that may have beenpresent. Participants were allowed to take as much time as needed to complete each section
16

200 400 600 800 1,000
0.22
0.24
0.26
0.28
0.3
Number of Unigrams (K)
Cla
ssifi
catio
nA
ccur
acy
Linear Reg.SVM
M5P Tree
Figure 2.3: Accuracy of the 3 top performing methods on the five bin classification task forthe value “Tradition”. Results averaged over a ten-fold cross validation. Difference fromtheoretical baseline of .20 is significant at α = .01 for all data points other than LinearRegression for K = 750 and K = 1000 (these two points are not statistically significant)using a paired one-tailed t-test.
of the study and were encouraged to be as comprehensive as possible in their responses tothe writing prompts. In order to filter out spam and careless responses, multiple “catch”items were randomly interspersed throughout the survey. These items asked users to selecta particular answer that could be easily verified (e.g., “For this question, please select thethird option”) – participants who failed to respond to catch items were excluded from allanalyses. Additionally, each of the essay writing samples was manually checked for co-herence and plagiarism. Between the months of May and July, 2014, surveys successfullycompleted by 767 respondents (64.5% female, 77.1% Caucasian, 70.0% aged 26-54) wereretained using the aforementioned criteria.
To relate this new dataset to our previous work, we again train a handful of machinelearning models using the same approach described before. The text sample used for eachparticipant includes the essays from both the values and behavior writing tasks.7 Sincethese tasks were specifically designed to capture information about a person’s core values,we expect to achieve better predictive performance on these data in comparison to thesocial media data explored previously. We begin by analyzing the effects of varying thenumber of unigrams used in a purely bag-of-words language model (Figure 2.3). Themodels reported here were those that yielded the greatest statically significant improvement
7The same set of analyses were performed using each writing sample individually. While similar trendswere discovered, results had weaker significance and lesser scores.
17
LIWC MRC All
Linear Reg. 0.283** 0.212 0.230SVM 0.294** 0.244* 0.246**M5P Trees 0.281** 0.215 0.211AdaBoost 0.288** 0.244* 0.212
Table 2.3: Classification accuracy on a 5-bin classification task for top performing models.Results averaged over ten-fold cross validation. “All” contains LIWC, MRC, and top-250-unigram features. Improvement over the theoretical baseline of 0.20: * indicates p < 0.05,and ** indicates p < 0.01 using a one-tailed paired t-test.
over the theoretical baseline. For this dataset, we find the best performance when using astandard linear regression model with the top 250 unigrams as features. When increasingthe number of words used, the linear regression model tends to overfit to the training dataand we observe a steep drop in performance relative to the next two best modes: SVM andM5P Tree.
Examining the effects of using the two psycholinguistic feature sets, we see that usingonly the LIWC features results in the best performance for all of the best learning models(Table 2.3). Similar to what was observed in the social media dataset, the combinationof the LIWC, MRC, and unigram features leads to a decrease in accuracy compared toonly using the one of these feature sets (in this case, the LIWC features). Since the LIWCfeatures were specifically designed to capture cognitive processes as expressed in text, itis not surprising that they work well when measuring values in the context of an essayeliciting reflection about people’s inner worlds.
Classification 5-bin Ranking
Baseline 0.200 0.500M5P Tree 0.380 0.335**SVM 0.329 0.375
Table 2.4: Results on the 5-bin classification task and 5-bin ranking task for top performingmodels. Results averaged over ten-fold cross validation. Both models are using LIWCfeatures only. ** denotes statistically significant (α = .01) improvement over the othermodel using McNemar’s test.
Next, we pit our top performing ranking model against the best observed classifier inorder to test the claim that ranking and regression models do no worse on the classificationtask yet significantly better (i.e., lower ranking loss) on the ranking task. These two algo-rithms were selected based on their results averaged across a ten-fold cross validation on
18

the training data. They are then trained on the entire set of training data and evaluated onthe testing data, giving the results presented in Table 2.4. In this case, we indeed find thatthe regression approach yields significantly lower ranking loss without any significant lossin classification accuracy.
We have shown that it is possible to predict people’s values from linguistic featuresextracted from their writing samples. However, a significant improvement over the theoret-ical baseline is not enough to claim that we have achieved a computational understandingof values. Even in the case where people are explicitly asked to describe their personalvalues, we are unable to capture a strong signal from their language features. It appearsthat the kinds of values people naturally talk about show only a minor relationship withthose measured by the SVS.
19

CHAPTER 3
Comparing Topic Models and TheirParameterizations
3.1 Introduction
Topic modeling describes the process of fitting statistical models to a text corpus that ex-plain the distribution of words across a number of major themes, or topics.1 Generallyspeaking, a document can be composed of one or more topics, and each topic is a mix-ture of one or more words. The goal of topic modeling is to automatically learn a set oflatent topics that accurately explain the true distribution of observed words in documents,providing a meaningful and potentially interpretable set of themes present in a corpus. Re-searchers are typically interested in either the topical compositions of a set of documents,the groups of words that are associated with various topics, or both.
Topic models can be important tools for both exploration and modeling. When facedwith enormous text corpora, topic modeling can be a first step in understanding the maintypes of things that are being written about while being more sophisticated than analyz-ing word frequencies. Topic models not only present information about the words beingused, but also how these words co-occur together in possibly meaningful ways. Further,topic models can be used to assign topic probabilities to documents, showing topical diver-sity and providing an opportunity to search a corpus for documents that are most relatedto a given topic in a totally unsupervised way– that is, the researcher does not need todefine any of the topics beforehand. The fact that topic modeling is almost completelydata-driven means that the results have a smaller chance to be biased by preconceived ideasabout the topical makeup of a corpus. Another advantage of topic models is that they allowresearchers to work at a topic-level granularity, which can be much more manageable thanword-level granularity, but still lends itself to meaningful interpretations (given a meaning-
1we use the terms “topic” and “theme” interchangeably throughout this paper.
20

ful set of topics). This can also lead to lower-dimensionality in predictive models: ratherthan having to use thousands of words as features, a smaller set of topics can be used as auseful and less cumbersome representation for text documents.
Because of these advantages, topic models have been applied to a wide range of naturallanguage processing problems2 including authorship attribution [122], identification of biasin media coverage [40], Twitter hashtag recommendation [50], and spam detection [79].Recently, topic models have been used as a source of content diversity or control for textgeneration systems that seek to produce text that is about a coherent theme [95, 136].
While many types of topic models have been proposed, perhaps the most well-knownand widely used approach is Latent Dirichlet Allocation (LDA) [14], in which a generativemodel is proposed to explain the document generation process. In LDA, each word isassumed to be chosen from a document-specific mixture of topics, which in turn are drawnfrom a distribution over topical distributions with a Dirichlet prior. Inference methods,such as Gibbs sampling, can be used to discover these distributions for a given corpus, andthe learned distributions can be used to explain previously unseen documents. Some otherapproaches that have been used for topic modeling include Correlated Topic Models [13],Hierarchical Dirichlet Processes [134], and the Meaning Extraction Method (MEM) [30].Among these, the MEM has been shown to be particularly useful for revealing dimensionsof authors’ thoughts while composing a document. However, a direct comparison betweenLDA and the MEM has not been performed before. We set out to experimentally determinewhich combinations of parameters allow for the maximization of both quantitative andqualitative evaluation metrics for two topic modeling paradigms: LDA and MEM.
Comparing two topic modeling approaches is not a straightforward task, however. Be-ing unsupervised methods, there is often no ground truth available for topic distributions,and researchers have yet to come to an agreement about the single best way to evaluate thegoodness of a topic model. Traditionally, the log-likelihood of some held-out set of data isused as a quantitative measure of the explanatory power of a topic model [29]. However,further research has shown that models with the highest log-likelihood do not necessarilylead to the highest degree of interpretability by humans. In fact, in several cases, there wasshown to be a negative relationship between log-likelihood and interpretability.
Here we will explore both quantitative and qualitative types of measurement in an at-tempt to pinpoint the parameters that have the greatest effect on each. The result of thisstudy will be a thorough analysis of the effects of topic modeling parameters on several
2While the focus on this work is the use of topic modeling with textual data, it should be noted that topicmodels have also have been applied in a range of fields for tasks like clustering and classifying biologicaldata [80], as well as analyzing structures in musical pieces [58].
21
evaluation metrics across multiple categories of text data. Our focus on not to describe howto implement topic models themselves, but to showcase their uses and explore their sensi-tivity to changes in an array of parameters that can (and should) be tuned when fitting topicmodels. However, for readers interested in more details of topic model implementation, allcode used to determine the results in this paper will be released as a python topic modelingpackage that allows for the testing of LDA and MEM under a wide range of settings.
3.2 Background
There are several major topic modeling approaches to consider, and given that there is noconsensus on the best way to evaluate a topic model, it is useful to assess topic modelingresults using several metrics. Here we describe two modeling approaches and metrics thatcan be used to evaluate them.
3.2.1 Topic Modeling Approaches
In this subsection, we provide details of the two main topic modeling approaches thatwe consider in our experiments: Latent Dirichlet Allocation and the Meaning ExtractionMethod.
3.2.1.1 Latent Dirichlet Allocation
The most popular and widely used topic modeling approach is Latent Dirichlet Alloca-tion (LDA) [14]. LDA is a generative model that treats each document as a probabilisticmixture of topics, which themselves are distributions over words in the vocabulary. Thegenerative story of LDA, outlined in Figure 3.1, is as follows: for each of the M docu-ments, a distribution over all topics, θ, is chosen for the current document. θ is sampledfrom a k-dimensional Dirichlet distribution parameterized by α, which is a hyperparameterof the LDA model. Then, for each of the N words in the document, a single topic, z, issampled from θ. Lastly, the word itself, w is sampled from another Dirichlet distributionφz, which is parameterized by β. Given that θ and φ are multinomial distributions them-selves, it is fitting to sample them from a Dirichlet distribution as it is the conjugate priorof the multinomial.
When fitting an LDA model, the goal is to find values for the unobserved variables thatresult in a high likelihood of the observed corpus, D, with the corpus probability defined
22
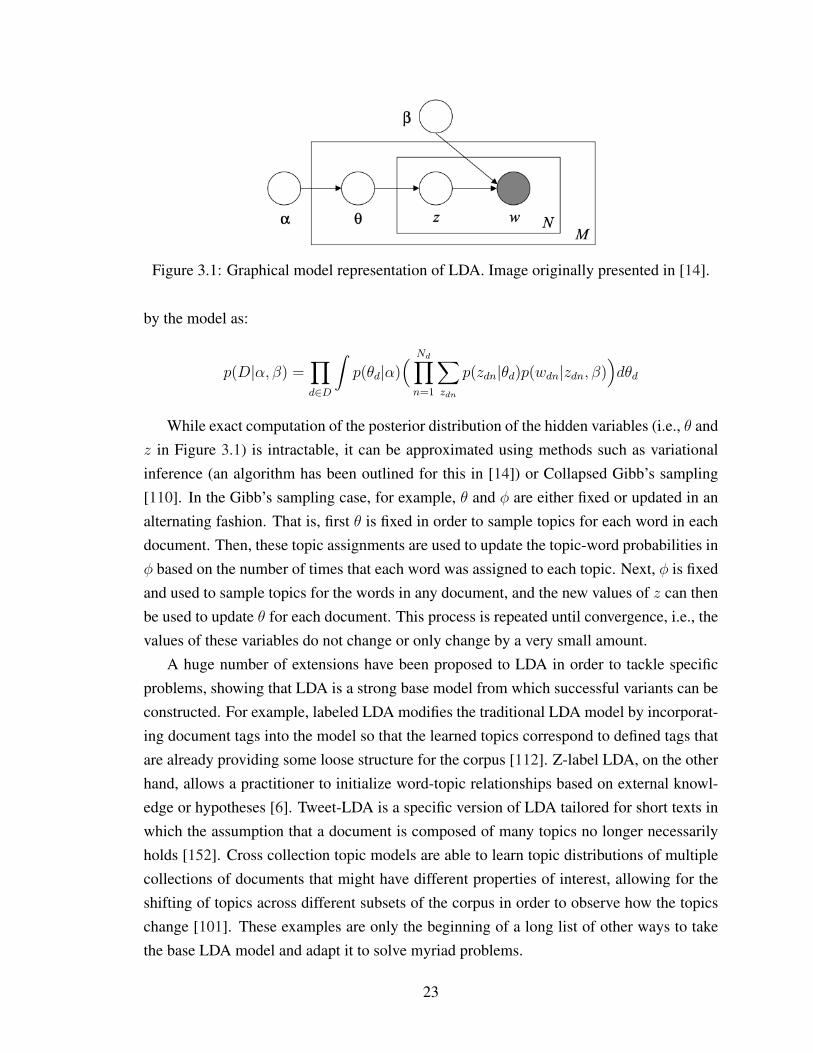
Figure 3.1: Graphical model representation of LDA. Image originally presented in [14].
by the model as:
p(D|α, β) =∏d∈D
∫p(θd|α)
( Nd∏n=1
∑zdn
p(zdn|θd)p(wdn|zdn, β))dθd
While exact computation of the posterior distribution of the hidden variables (i.e., θ andz in Figure 3.1) is intractable, it can be approximated using methods such as variationalinference (an algorithm has been outlined for this in [14]) or Collapsed Gibb’s sampling[110]. In the Gibb’s sampling case, for example, θ and φ are either fixed or updated in analternating fashion. That is, first θ is fixed in order to sample topics for each word in eachdocument. Then, these topic assignments are used to update the topic-word probabilities inφ based on the number of times that each word was assigned to each topic. Next, φ is fixedand used to sample topics for the words in any document, and the new values of z can thenbe used to update θ for each document. This process is repeated until convergence, i.e., thevalues of these variables do not change or only change by a very small amount.
A huge number of extensions have been proposed to LDA in order to tackle specificproblems, showing that LDA is a strong base model from which successful variants can beconstructed. For example, labeled LDA modifies the traditional LDA model by incorporat-ing document tags into the model so that the learned topics correspond to defined tags thatare already providing some loose structure for the corpus [112]. Z-label LDA, on the otherhand, allows a practitioner to initialize word-topic relationships based on external knowl-edge or hypotheses [6]. Tweet-LDA is a specific version of LDA tailored for short texts inwhich the assumption that a document is composed of many topics no longer necessarilyholds [152]. Cross collection topic models are able to learn topic distributions of multiplecollections of documents that might have different properties of interest, allowing for theshifting of topics across different subsets of the corpus in order to observe how the topicschange [101]. These examples are only the beginning of a long list of other ways to takethe base LDA model and adapt it to solve myriad problems.
23
Despite it’s ubiquity, LDA does have some drawbacks. Aside from general criticisms oftopic modeling approaches, there are cases in which LDA itself may not be ideal. The as-sumptions that every topic contains every word with some probability and every documentcontains every topic with some probability can make LDA models difficult to interpret,and the continuous nature of the results can lead to ad-hoc decision making regarding thenumber of top words to associate with a particular topic. Often, social science researchersare interested in a more discrete set of terms, and clear separation between the groups isvery important.
3.2.1.2 The Meaning Extraction Method
The Meaning Extraction Method (MEM) [30] is an alternative topic modeling approachthat has been proposed in the context of psychology research. Essentially, the MEM treatsthe presence of a word in a document as a binary indicator variable, and then a PCA-basedfactor analysis is performed in order to find the primary factors that explain the presence ofthe words.
The MEM takes a corpus as input, represented as a |V | ×M word-document matrix,D. Then, a Principal Components Analysis [103] is run on D and the top k componentsare retained and scaled to produce factor loadings. These loadings are then adjusted usingthe varimax rotation,[62] which seeks to maximize the following :
V ARIMAX =∑
(l2j,q − l−2j,q )2
Where lj,q is the value of the loading for the jth word on the qth factor. Essentially, to geta high value from the equation, words should be loaded more heavily on a small numberof factors, and each factor should contain a small number of words. The rotated loadingsare used as the word-topic scores (i.e, φ), and the softmax function can be applied to eachcolumn in cases where it is required that topics appear as distributions over words. Whilethe MEM doesn’t generate the document-topic probability matrix θ inherently, we cansimulate it using the training data that the model has been fit to. For each document, wecompute a score for each topic based on φ as follows:
θ = (DφT )
and then normalizing so that the rows sum to equal 1. The Meaning Extraction Method haspreviously been used for numerous projects in the social sciences and digital humanaties.For example, the MEM was used to analyze social media data in order to study potential
24
Russian interference in the 2016 United States elections [22], to summarize feedback givento students in communication courses [75], and to study patterns of content exchange inemails between psychotherapists and their patients [148].
3.2.1.3 Relationship between LDA and the MEM
While LDA and the MEM differ algorithmically, there is also a set of assumptions that istied to each approach about they ways in which data are preprocessed, represented, andfed into the models. These additional steps have almost become indistinguishable from themodels themselves, but that does not necessarily need to be the case. While some of thetypical processing associated with each method may have been heuristically or empiricallydetermined to be useful and exists for good reason, we seek to decouple these additionalsteps from the models themselves in order to make a fair comparison. That is, to trulyevaluate the differences between the MEM and LDA, we should control all other factors byperforming the same preprocessing steps for each model. Throughout section 3.3 of thispaper, we note the parameter choices that are often used as defaults for each model.
Focusing on the topic modeling methods themselves, we can actually see that they arestrongly connected. In fact, LDA can be viewed as a case of multinomal probabilisticPCA [25]. Probabilistic PCA is a reformulation of the traditional PCA method using alatent variable model. In probabilistic PCA, an observed variable x, is defined in termsof a transformation of a Gaussian latent variable z (representing the principal componentspace) and additive noise:
x = Wz+ µ+ ε
which has parameters that can be estimated using maximum likelihood estimation or ex-pectation maximization. In the typical Probabilistic PCA case, ε comes from a Gaussiandistribution. In the multinomial case, we apply the same formulation as above, but tocount data, z is a multinomial variable and our noise comes from a Dirichlet distribution.The formulation used in LDA is a special case of this multinomial, probabilistic variationof PCA. Therefore, by using a PCA-based approach like the MEM, we are removing theprobabilistic nature of our solution, which makes computationally efficient solutions lessfeasible, especially with large, high-dimensional data sets. Further, the classical MEM for-mulation uses binary variables to represent the input data, but by changing this to countdata, we are already moving one step closer to LDA– the major difference at that pointbeing the probabilistic formulation. However, in the case of the MEM we are also usinga post-decomposition rotation to try to enforce separation between the sets of words thatappear in each topic. Seeing how these two methods are only a few steps removed from
25
one another, we would like to empirically explore the effects of each of these small, yetimportant, differences.
3.3 Methods and Data
For our experiments, we compare both LDA and the MEM with a wide range of configu-rations and datasets, including news, fiction, scientific articles, and social media text.
3.3.1 Topic Modeling Framework
We use a generalized framework in which both LDA and MEM can be run (in addition tothe potential addition of other methods) in variety of settings. Each topic model can beapplied to a number of different corpora, which can be preprocessed in a variety of ways.There are also several parameter choices to be made during the modeling process itself,and finally, a handful of evaluation metrics that can be computed for each model. For thepurposes of evaluation, each corpus will have a set of documents that belong to knowncategories, or classes. This way, we can measure the extent to which the topic models areable to recover the underlying class labels without any supervision.
Formally, each corpus is an unordered set of M documents, D, where each document,dm ∈ D, is a sequence of Nm words from the vocabulary V , i.e., dm = {w0, . . . , wNm}.Each document has exactly one class label c(d) from the set of labels C. Each topic modelshould be fit to a specific corpus, D, given a set of parameters, λ, that is, TM = π(D,λ)
for a topic modeling method π. The number of topics, k should be specified beforehand(i.e., k ∈ λ). Each topic model must contain two matrices: a document-topic matrix, θ,and a topic-word matrix, φ. θ should be an M × k matrix that gives a likelihood score toeach topic for each document, and φ must be a k × |V | matrix that gives a likelihood scoreto each word for each topic. We would like to find topic models that maximize one or moreout of several evaluation metrics, depending on the goals of the researcher.
3.3.1.1 Preprocessing
Before topic modeling even begins, the corpus text is preprocessed as follows: in all cases,the documents in the corpus are tokenized, punctuation is stripped, common conversionsfrom British to American English are applied, common misspellings are corrected, and
26
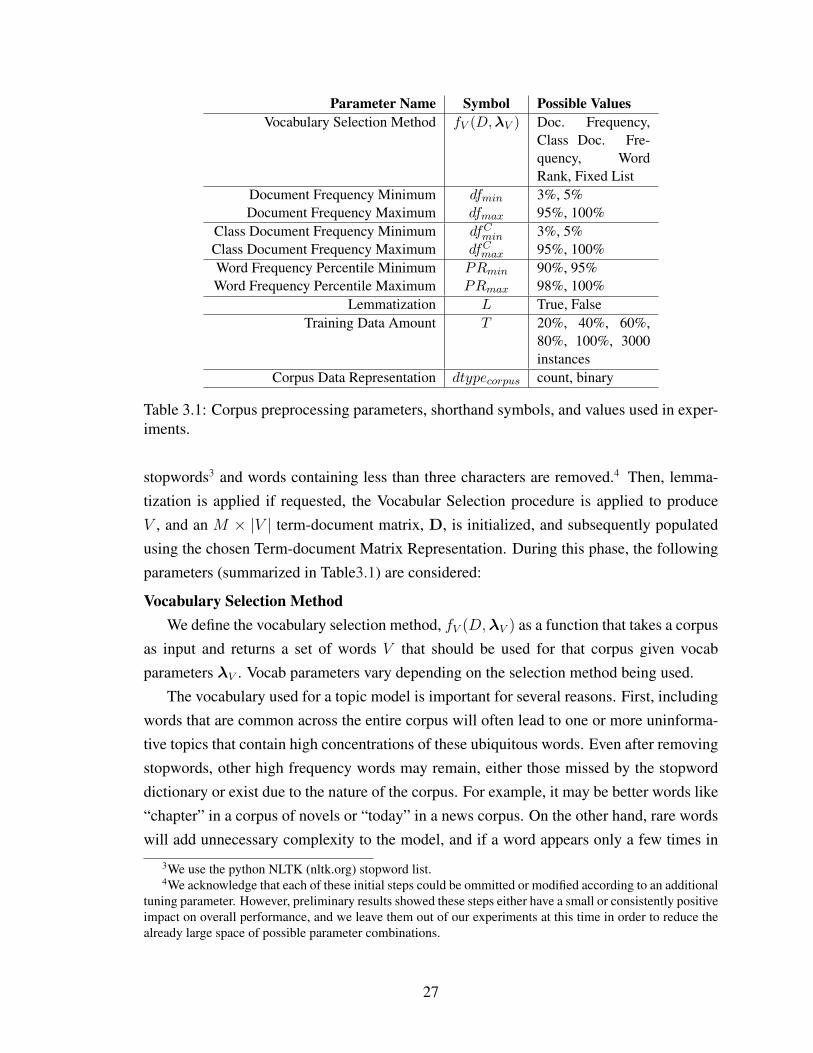
Parameter Name Symbol Possible ValuesVocabulary Selection Method fV (D,λV ) Doc. Frequency,
Class Doc. Fre-quency, WordRank, Fixed List
Document Frequency Minimum dfmin 3%, 5%Document Frequency Maximum dfmax 95%, 100%
Class Document Frequency Minimum dfCmin 3%, 5%
Class Document Frequency Maximum dfCmax 95%, 100%
Word Frequency Percentile Minimum PRmin 90%, 95%Word Frequency Percentile Maximum PRmax 98%, 100%
Lemmatization L True, FalseTraining Data Amount T 20%, 40%, 60%,
80%, 100%, 3000instances
Corpus Data Representation dtypecorpus count, binary
Table 3.1: Corpus preprocessing parameters, shorthand symbols, and values used in exper-iments.
stopwords3 and words containing less than three characters are removed.4 Then, lemma-tization is applied if requested, the Vocabular Selection procedure is applied to produceV , and an M × |V | term-document matrix, D, is initialized, and subsequently populatedusing the chosen Term-document Matrix Representation. During this phase, the followingparameters (summarized in Table3.1) are considered:
Vocabulary Selection MethodWe define the vocabulary selection method, fV (D,λV ) as a function that takes a corpus
as input and returns a set of words V that should be used for that corpus given vocabparameters λV . Vocab parameters vary depending on the selection method being used.
The vocabulary used for a topic model is important for several reasons. First, includingwords that are common across the entire corpus will often lead to one or more uninforma-tive topics that contain high concentrations of these ubiquitous words. Even after removingstopwords, other high frequency words may remain, either those missed by the stopworddictionary or exist due to the nature of the corpus. For example, it may be better words like“chapter” in a corpus of novels or “today” in a news corpus. On the other hand, rare wordswill add unnecessary complexity to the model, and if a word appears only a few times in
3We use the python NLTK (nltk.org) stopword list.4We acknowledge that each of these initial steps could be ommitted or modified according to an additional
tuning parameter. However, preliminary results showed these steps either have a small or consistently positiveimpact on overall performance, and we leave them out of our experiments at this time in order to reduce thealready large space of possible parameter combinations.
27
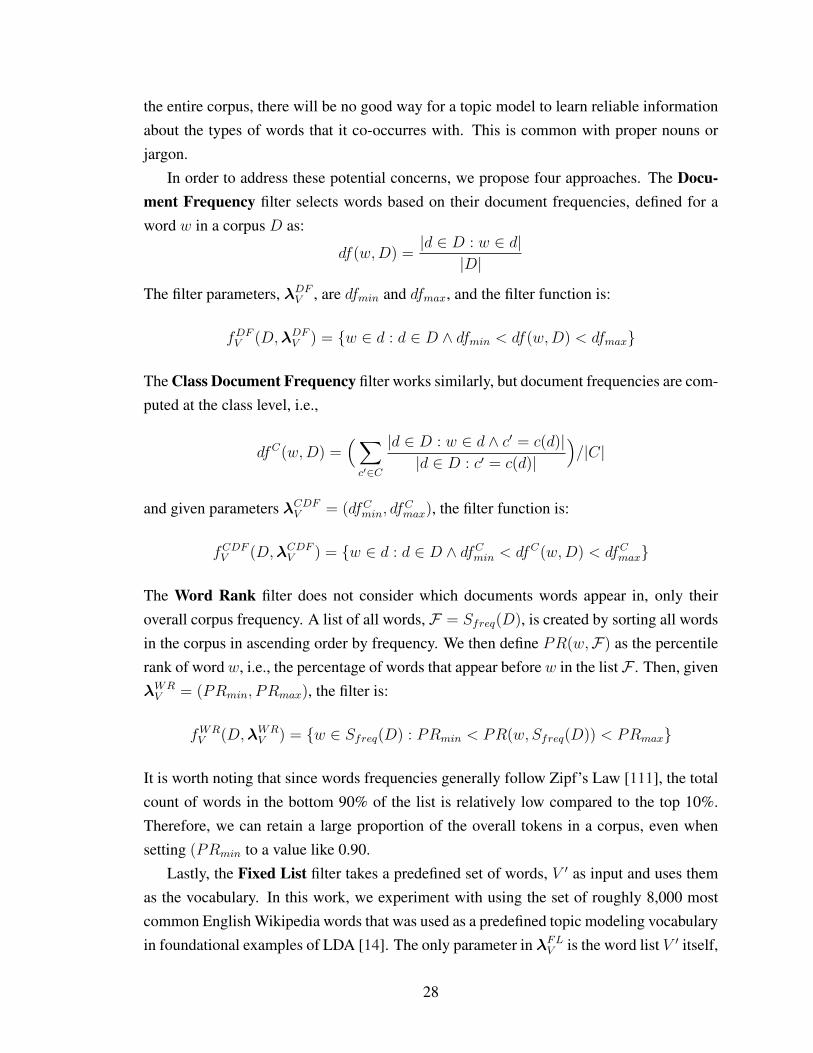
the entire corpus, there will be no good way for a topic model to learn reliable informationabout the types of words that it co-occurres with. This is common with proper nouns orjargon.
In order to address these potential concerns, we propose four approaches. The Docu-ment Frequency filter selects words based on their document frequencies, defined for aword w in a corpus D as:
df(w,D) =|d ∈ D : w ∈ d|
|D|
The filter parameters, λDFV , are dfmin and dfmax, and the filter function is:
fDFV (D,λDF
V ) = {w ∈ d : d ∈ D ∧ dfmin < df(w,D) < dfmax}
The Class Document Frequency filter works similarly, but document frequencies are com-puted at the class level, i.e.,
dfC(w,D) =(∑
c′∈C
|d ∈ D : w ∈ d ∧ c′ = c(d)||d ∈ D : c′ = c(d)|
)/|C|
and given parameters λCDFV = (dfC
min, dfCmax), the filter function is:
fCDFV (D,λCDF
V ) = {w ∈ d : d ∈ D ∧ dfCmin < dfC(w,D) < dfC
max}
The Word Rank filter does not consider which documents words appear in, only theiroverall corpus frequency. A list of all words, F = Sfreq(D), is created by sorting all wordsin the corpus in ascending order by frequency. We then define PR(w,F) as the percentilerank of word w, i.e., the percentage of words that appear before w in the listF . Then, givenλWR
V = (PRmin, PRmax), the filter is:
fWRV (D,λWR
V ) = {w ∈ Sfreq(D) : PRmin < PR(w, Sfreq(D)) < PRmax}
It is worth noting that since words frequencies generally follow Zipf’s Law [111], the totalcount of words in the bottom 90% of the list is relatively low compared to the top 10%.Therefore, we can retain a large proportion of the overall tokens in a corpus, even whensetting (PRmin to a value like 0.90.
Lastly, the Fixed List filter takes a predefined set of words, V ′ as input and uses themas the vocabulary. In this work, we experiment with using the set of roughly 8,000 mostcommon English Wikipedia words that was used as a predefined topic modeling vocabularyin foundational examples of LDA [14]. The only parameter in λFL
V is the word list V ′ itself,
28

and the filter is simply:
fFLV (D,λFL
V ) = {w ∈ d : d ∈ D ∧ w ∈ V ′}
LemmatizationThe choice of whether or not to perform some sort of lemmatization, stemming, or
other hashing of words can have an impact on the overall size of the vocabulary. When per-forming lemmatization, the topic model will ignore morphological information that mightconvey information about tense or number. When the goal is to focus on content, this maybe an added benefit to the reduced complexity of a fitting a model to the smaller vocabu-lary remaining after the lemmatization process. On the other hand, some potentially usefulinformation could be removed, and so we experiment with both performing and abstainingfrom lemmatization5. It has previously been shown that choices about stemming can havea significant impact topic modeling results, including interpretability and stability of topics[124]. As the choice of stemming method has been explore in-depth in prior work, we onlyconsider the option of whether or not to perform any type of lemmaziation/stemming at all,and not the differences in outcomes when using any particular approach.
Training Data AmountIn order to determine the effect of having access to more training documents, we also
vary the amount of data to be used to fit the model. The rest of the data is treated as testdata, which is used during evaluation. We experiment with using a relative proportion ofthe full dataset as training data, and we also consider treated a fixed number of instancesas training data so that we can make more direct comparisons between datasets that aredifferent sizes.
Corpus Data RepresentationEach topic modeling method requires a matrix representing the relationship between
documents in the corpus and the words in those documents. We explore two ways torepresent the data: either as count variables (the number of times a word appears in thedocument), as are used in LDA, or binary indicator variables (1 if the word appears inthe document any number of times, and 0 otherwise), as are used in the MEM. By usingthe same data type for both methods, we can make a more fair comparison between them,and by evaluating the methods when fed different data representations than those that arenormally provided, we can determine how beneficial it might be use each representation ingeneral.
5We use the WordNet based lemmatizer available in the Python NLTK package (nltk.org)
29

Parameter Name Symbol Possible ValuesNumber of Topics k 0.5|C|,|C|,1.5|C|, 2|C|,
5|C|Method M MEM, LDA
Rotation rot varimax, none
Table 3.2: Topic modeling parameters, shorthand symbols, and values used in experiments.
3.3.1.2 Models
After the preprocessing has been completed, we are ready to begin learning topics from theterm-document matrix that represents the preprocessed corpus. Based on that input, we fitthe topic models as described in Section 3.2 using our own custom implementation. At thispoint, we consider the following topic modeling parameters, which are outlined in Table3.2.
Number of TopicsSelection of k, the number of topics, is one of the most important parameters when fit-
ting topic models. As there is no consensus on the optimal number of topics, it is generallyrecommended that practitioners test several values of k in order to determine which numberof topics leads to the model best suited for their needs. In our experiments, we considervalues of k proportional to the number of classes in the dataset being used in order to inves-tigate the relationship between the space of underlying classes and the set of topics learnedby the chosen modeling method.
Topic Modeling MethodWe consider both LDA and the MEM as topic modeling methods. We use our own
implementation of batched LDA [57] with a batch size of 100, and set both α and β to 0.1.For the MEM, we use a factor loading membership threshold of 0.2.
RotationFor the MEM only, we test the effect of omitting the varimax rotation. This will help
us determine the degree to which this rotation, which is typically done by default, actuallyhelps produce to meaningful and accurate themes.
3.3.2 Data Sets
We use three diverse data sets in order to cover a variety of writing styles and content (Table3.3).
Online ForumsThe 20 newsgroups dataset is composed of online discussion forums related to various
30
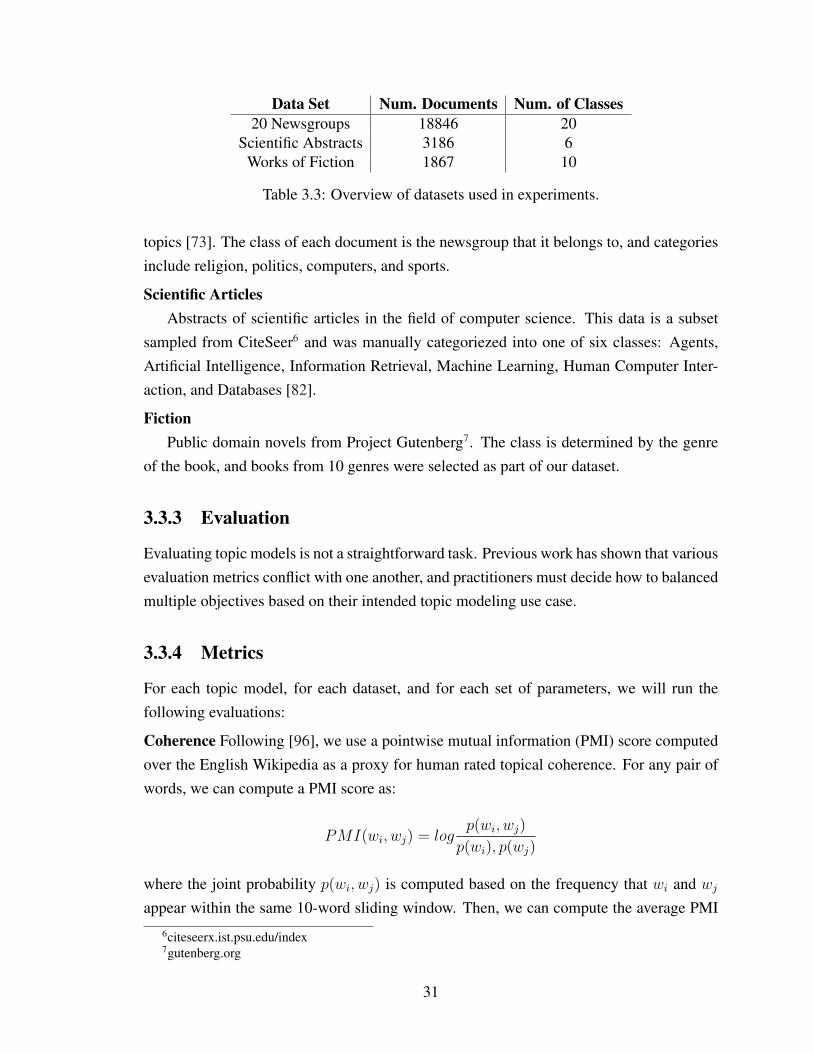
Data Set Num. Documents Num. of Classes20 Newsgroups 18846 20
Scientific Abstracts 3186 6Works of Fiction 1867 10
Table 3.3: Overview of datasets used in experiments.
topics [73]. The class of each document is the newsgroup that it belongs to, and categoriesinclude religion, politics, computers, and sports.
Scientific ArticlesAbstracts of scientific articles in the field of computer science. This data is a subset
sampled from CiteSeer6 and was manually categoriezed into one of six classes: Agents,Artificial Intelligence, Information Retrieval, Machine Learning, Human Computer Inter-action, and Databases [82].
FictionPublic domain novels from Project Gutenberg7. The class is determined by the genre
of the book, and books from 10 genres were selected as part of our dataset.
3.3.3 Evaluation
Evaluating topic models is not a straightforward task. Previous work has shown that variousevaluation metrics conflict with one another, and practitioners must decide how to balancedmultiple objectives based on their intended topic modeling use case.
3.3.4 Metrics
For each topic model, for each dataset, and for each set of parameters, we will run thefollowing evaluations:
Coherence Following [96], we use a pointwise mutual information (PMI) score computedover the English Wikipedia as a proxy for human rated topical coherence. For any pair ofwords, we can compute a PMI score as:
PMI(wi, wj) = logp(wi, wj)
p(wi), p(wj)
where the joint probability p(wi, wj) is computed based on the frequency that wi and wj
appear within the same 10-word sliding window. Then, we can compute the average PMI6citeseerx.ist.psu.edu/index7gutenberg.org
31

score between all pairs of words within the ten words with highest probabilities for a giventopic: ∑
PMI(wi, wj), ij ∈ 1 . . . 10, i < j(102
)and finally, we can compute the average coherence score across all topics for a given model.This gives us information about how related the top words are for a given topic.
Perplexity Average log-likelihood of documents in the corpus. Since the topic models thatwe are considering do not take word order into account, the probability of a document canbe computed as P (D) =
∏w∈D P (w), where the word probabilities come from the topic
model itself. However, for documents in the test corpus, we must first perform inference inorder to obtain their topic probabilities which we achieve using expectation maximization.[97] This metrics measure how well the model is able to describe previously unseen data.
Document Classification Here we measure the predictive power of topics as machinelearning features in a classifier trained to predict the class of unseen documents. We traina simple logistic regression classifier to predict the class labels of the dataset using thetrain/test splits chosen as parameters in the preprocessing step. The input features are thetopic probabilities for each document, and we report the classification accuracy on the testdata. This allows us to evaluate the effectiveness of a particular topic model at selectinguseful features for a downstream task.
Cluster Purity We first form clusters from all documents in the test corpus by group-ing them by the topics with the highest likelihood (after performing inference to estimatedocument-topic probabilities, as before), thus producing a set of k clusters, A. For a givencluster, purity is computed as: ∑
a∈Amaxc∈C |a ∩ c||Test|
Where each a represents all points in a given cluster, c represents all points that belong toa class, and Test is the set of test data points that have been clustered. This metric willattempt to measure the topic model’s abilty to recover the structure of the documents asdesignated by the class labels.
3.4 Results
While there are multitudinous analyses that could be performed across all of the combina-tions of results that we calculated, here, we use the collected results of our many runs to
32

Vocab Selection Coher. Perpl. Doc. Class. Purity
20ne
ws Document Frequency 2.57 1.20 0.29 0.35
Class Doc Frequency 1.36 1.19 0.23 0.53Word Rank 1.47 1.24 0.32 0.42Fixed List 1.91 1.28 0.25 0.56
Scie
nce Document Frequency 2.86 0.88 0.58 0.50
Class Doc Frequency 1.80 0.72 0.41 0.45Word Rank 2.35 0.76 0.45 0.44Fixed List 2.34 0.72 0.36 0.45
Fict
ion
Document Frequency 0.86 1.16 0.53 0.42Class Doc Frequency 0.53 0.89 0.45 0.39
Word Rank 0.51 1.38 0.53 0.52Fixed List 0.89 1.02 0.50 0.43
Table 3.4: Averaged evaluation scores for each vocabulary selection method for eachdataset.
answer five questions:
How does vocabulary selection method relate to the four evaluation metrics?The vocabulary selection method depends on both the dataset and the metric that is
being optimized (Table 3.4). The Document Frequency filter leads to the most coherentset of topics in several cases, but also typically leads to high perplexity. This may be dueto its ability to filter out less common words that are needed in order to achieve the best fitto new data, but by removing these words, the resulting topics appear more coherent. TheClass Doc Frequency leads to the lowest average perplexity scores, meaning that it is agood choice when trying to build models that have the best statistic fit to unseen documents.The Word Rank filter gives good document classification performance in several cases,indicating that this method does a reasonable job selecting a set of features that are relatedto the original document classes. The Fixed List filter results in the best coherence scorefor the fiction dataset, which may be due to its ability to easily standardize large or lesstypical vocabularies, whereas the other filters will be influenced much more strongly by thewords in the corpus.
How does lemmatization affect the model perplexity for each dataset?In Figure 3.2, we can see that applying lemmatization only has a major impact when
considering the 20 Newsgroups dataset. This may be due in part to the fact that lemmati-zation restricts the expressiveness of the model by reducing the vocabulary size, making itmore difficult to achieve a good fit to new data. It may also be collapsing groups of wordsin a way that is unhelpful– for example, if the concept of a “run” (as a means of scoringa point) in a topic about the sport of baseball is a useful feature, but all other instances of
33

20news Science Fiction
0.8
1
1.2
1.4
Test
Perp
lexi
ty
True False
Figure 3.2: Effect of lemmatization on average test perplexity.
Model Coher. Perpl. Doc. Class. Purity
20N LDA 4.83 0.00 0.39 0.89
MEM 5.15 1.36 0.63 0.93
Sci LDA 5.42 0.00 0.75 0.83
MEM 5.37 1.28 0.76 0.83
Fic LDA 5.28 0.00 0.43 0.66
MEM 4.90 0.63 0.70 0.90
Table 3.5: Top scores achieved on each dataset by any single model of each type.
“running”, “ran”, etc., are all mapped to “run”, it may be more difficult for the model toaccurately distinguish documents that belong to the baseball topic. For the Science andFiction datasets, the effect of lemmatization on the text perplexity is insignificant. Theseresults suggest that it may not always be best to perform lemmatization or stemming overthe entire corpus before topic modeling.
How does the best performing LDA model compare to the best performing MEMmodel for each metric, for each dataset?
Only considering the best model for each dimension, we can see that each model has itsown advantages (Table 3.5). LDA achieves a far superior (lower) perplexity score in everycase due to its ability to assign probabilities to every word in the vocabulary for every topic,while the MEM, using a threshold to remove words with lower membership to a giventopic, does not have the ability to explain all of the noise present in unseen documents.However, the MEM always provides the best classification and performance and clusterpurity, suggesting that MEM features can be used to define groupings that better reflect the
34
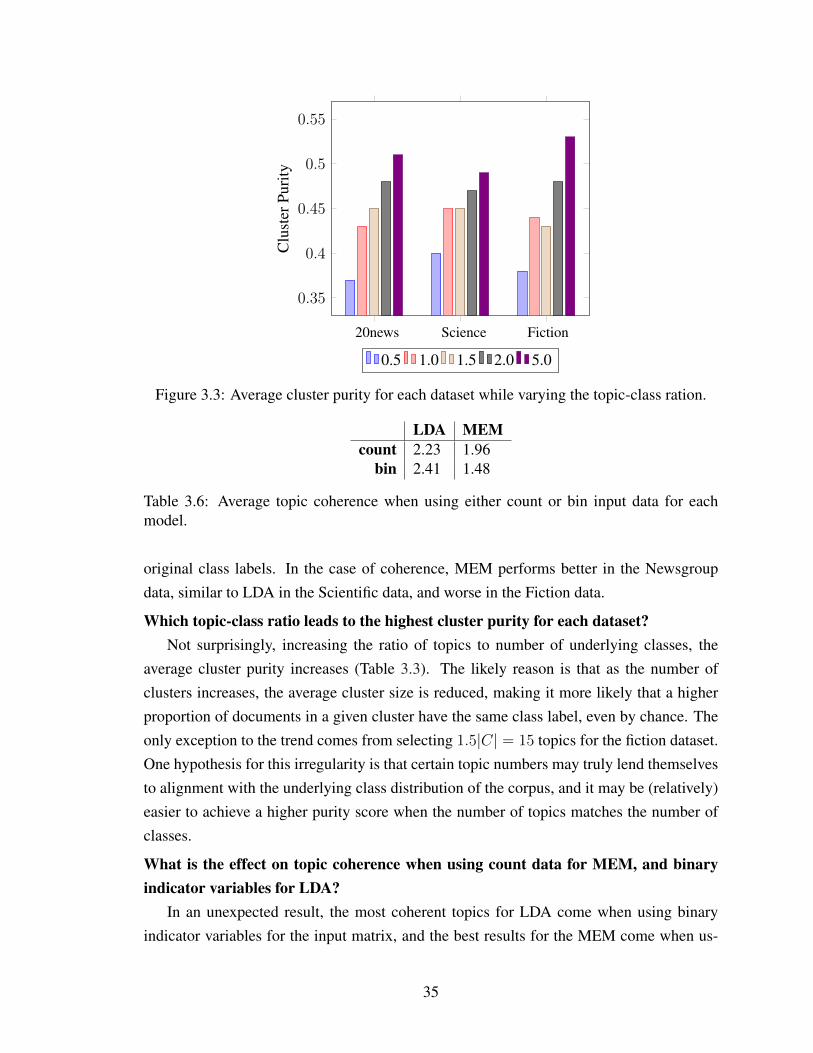
20news Science Fiction
0.35
0.4
0.45
0.5
0.55
Clu
ster
Puri
ty
0.5 1.0 1.5 2.0 5.0
Figure 3.3: Average cluster purity for each dataset while varying the topic-class ration.
LDA MEMcount 2.23 1.96
bin 2.41 1.48
Table 3.6: Average topic coherence when using either count or bin input data for eachmodel.
original class labels. In the case of coherence, MEM performs better in the Newsgroupdata, similar to LDA in the Scientific data, and worse in the Fiction data.
Which topic-class ratio leads to the highest cluster purity for each dataset?Not surprisingly, increasing the ratio of topics to number of underlying classes, the
average cluster purity increases (Table 3.3). The likely reason is that as the number ofclusters increases, the average cluster size is reduced, making it more likely that a higherproportion of documents in a given cluster have the same class label, even by chance. Theonly exception to the trend comes from selecting 1.5|C| = 15 topics for the fiction dataset.One hypothesis for this irregularity is that certain topic numbers may truly lend themselvesto alignment with the underlying class distribution of the corpus, and it may be (relatively)easier to achieve a higher purity score when the number of topics matches the number ofclasses.
What is the effect on topic coherence when using count data for MEM, and binaryindicator variables for LDA?
In an unexpected result, the most coherent topics for LDA come when using binaryindicator variables for the input matrix, and the best results for the MEM come when us-
35
ing a count matrix as input (Table 3.6). However, LDA typically uses count input while theMEM uses binary input. Based on this, it may be worth considering the type of input repre-sentation as a parameter to tune when fitting topic models with the end goal of maximizingtopical coherence.
3.5 Conclusion
We have taken a close look at topic modeling and the many parameters that are involved.Overall, the choice of preprocessing methodology does have an impact on the final results–sometimes even more than the choice of the model itself. We have explored a huge numberof parameter combinations, and found that there is no single configuration that unilaterallyoutperforms the others. However, the fact that the MEM is able to achieve strong resultsacross a number of datasets and metrics makes it a strong contender to use when performingtopic modeling on our values-related data, and we will explore its use in the next chapter.
36
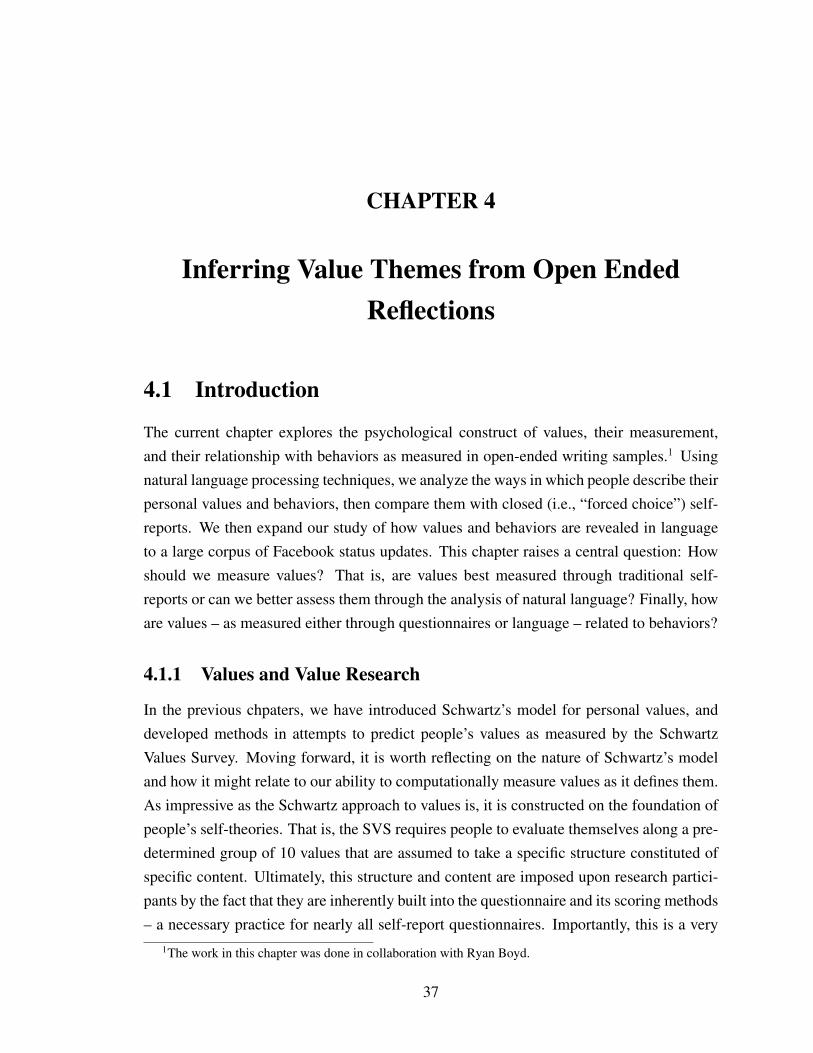
CHAPTER 4
Inferring Value Themes from Open EndedReflections
4.1 Introduction
The current chapter explores the psychological construct of values, their measurement,and their relationship with behaviors as measured in open-ended writing samples.1 Usingnatural language processing techniques, we analyze the ways in which people describe theirpersonal values and behaviors, then compare them with closed (i.e., “forced choice”) self-reports. We then expand our study of how values and behaviors are revealed in languageto a large corpus of Facebook status updates. This chapter raises a central question: Howshould we measure values? That is, are values best measured through traditional self-reports or can we better assess them through the analysis of natural language? Finally, howare values – as measured either through questionnaires or language – related to behaviors?
4.1.1 Values and Value Research
In the previous chpaters, we have introduced Schwartz’s model for personal values, anddeveloped methods in attempts to predict people’s values as measured by the SchwartzValues Survey. Moving forward, it is worth reflecting on the nature of Schwartz’s modeland how it might relate to our ability to computationally measure values as it defines them.As impressive as the Schwartz approach to values is, it is constructed on the foundation ofpeople’s self-theories. That is, the SVS requires people to evaluate themselves along a pre-determined group of 10 values that are assumed to take a specific structure constituted ofspecific content. Ultimately, this structure and content are imposed upon research partici-pants by the fact that they are inherently built into the questionnaire and its scoring methods– a necessary practice for nearly all self-report questionnaires. Importantly, this is a very
1The work in this chapter was done in collaboration with Ryan Boyd.
37

different approach than simply asking people for their own thoughts on the question of“What are your personal values that guide your decisions and behaviors?” Indeed, if askedthis question, many people might answer “to work hard”, “be faithful to my religion”, or“be a good mother”. Such professed values are not inherently contradictory to the SVS.Rather, the SVS lacks the ability to concretely reflect those specific values that people holdin their own personal value constellations.
An even more complex problem arises when studying the relationship between val-ues and behaviors. Unfortunately, most studies attempting to examine value–behaviorlinks have simply compared self-reported SVS values with other self-report attributes suchas personality, likes, and dislikes. This creates a problem wherein researchers are oftenultimately exploring the relationships between different facets of people’s explicit self-concepts rather than studying more organic and real-world instantiations of values andbehaviors. In fact, Schwartz has pushed for researchers to explore behaviors in more detail.This undertaking seems promising and has been the focus of recent research that seeks tobuild a set of self-report behaviors that correspond to the values measured by the SVS [26].Unfortunately, many of the self-reported behaviors thus far have been general abstractionsrather than concrete behaviors. For example, the behavioral measure for the value of “stim-ulation” was “change plans spontaneously”, and for the value of “humility”, “play downmy achievements or talent.”
A related issue with which all social scientists struggle is the question of how to measurebehaviors efficiently and effectively. Self-reports of behaviors via forced choice question-naires ultimately suffer from the same problem as other self-report measures: the question-naires only contain questions that researchers think to ask. By adopting such an approach,researchers run the risk of imposing a potentially skewed, and sometimes inaccurate, struc-ture on behavioral patterns. These are intractable features inherent to virtually all closed-format self-report questionnaires. In most cases, we would like to know what behaviorsour respondents are actually doing and thinking about without relying upon questionnaireprompts. Currently, researchers are beginning to acquire greater amounts of objective be-havioral measures such as buying behaviors, movement information, and even reading pat-tern data as the “big data” revolution continues to grow [67]. In the interim, however,researchers now have access to an endless stream of open-ended reports of mental life inthe form of social media. A principal benefit of these reports is that they are ecologicallyvalid and driven entirely by what people say they are doing and thinking in their own words.
The rest of this chapter examines values and behaviors that emerge from open-endedtext. The first of two projects within this chapter relies on an online survey. This surveyinvolved multiple randomized tasks that included 1) asking people to describe in detail the
38

basic values that guide their lives, 2) asking people to describe the behaviors in which theyengaged within the past week, and 3) participant completion of the self-reported SVS.2 Us-ing a topic modeling technique called the meaning extraction method [30, 70], values andbehaviors were inductively extracted from the texts. Value- and behavior-relevant thematicfactors were then compared with each other and with the SVS data.
The second project adapts the results of the first project and applies them to status up-dates from over 130,000 Facebook users; these data are part of the myPersonality project[69]. Although a relatively small number of the cases (N = 1, 260) included the SVS,the primary analyses revealed intuitive links between the MEM-derived values and MEM-derived behaviors. The work presented here, then, constitutes a proof-of-concept studydemonstrating the utility of relying on natural language markers of abstract psychologicalphenomena, including values, to better predict and understand their connections to behav-iors and thought in a broader sense.
4.2 Project 1: Values and Behavior in an Online SurveySample
To begin, we sought to determine how well the SVS captures prevalent values as describedby people when discussing the things that are most important to them (i.e., their core per-sonal values) in their own words. Additionally, we sought to explore the links between val-ues (both from the SVS and people’s free responses) and human behaviors as they manifestthemselves in the real world. Theoretically, values should exhibit a discernible influenceupon behaviors, including language use. As such, we expected to see that the values re-flected in a person’s descriptions of their guiding principles would show relatively intuitive,predictive links to everyday behaviors. To capture this information, we designed a socialsurvey, which has been described in detail in Chapter 2 of this dissertation.
4.2.1 Analysis
In order to model the natural language data from participants into statistically actionablemetrics, we employed the meaning extraction method (MEM). The MEM is an approachto topic modeling for natural language data that possesses demonstrated utility in under-standing psychological phenomena, including both cognition [30] and behaviors [113]. In
2For this study, we also collected data in the form of closed questionnaires about recent behaviors fromall participants. These items corresponded very strongly with the free-response behavioral reports providedby participants. Results are available from the authors.
39

Table 4.1: Themes extracted by the MEM for the values essay writing task, Project 1.
Theme Example WordsFaith (Positive) God, Christian, Faith, Bible, Church
Empathy People, Treat, Respect, Kind, CompassionFamily Growth Family, Good, Child, Parent, Raise
Work Work, Best, Hard, Job, GoalDecision Making Make, Feel, Decision, Situation, Difficult
Honesty Honest, Trust, Lie, Truth, LoyaltyFaith (Negative) Belief, Bad, Wrong, Religion, Problem
Social Life, Love, Friend, Relationship, EnjoyGrowth Life, Learn, Live, Grow, Easy
Indulgence Money, Enjoy, Spend, Free, ChangeCaring/ Knowledge Know, Care, Give, Allow, Truth
Openness Happy, Mind, Open, Positive, SeeKnowledge Gain Better, Learn, Understand, Experience, Realize
Principles Guide, Principle, Situation, Central, FollowFreedom Strive, Action, Nature, Personal, FreeCertainty Right, Sure, Strong, Stand, Thought
essence, the MEM allows researchers to discover words that repeatedly co-occur acrossa corpus. When considering modest to large numbers of observations together, the co-occurrence of words can converge to identify emergent and psychologically meaningfulthemes. These themes are then treated as independent dimensions of thought along whichall texts can be quantified. Like most topic modeling methods, the MEM omits closed-class (function) words and low-frequency open-class (content) words to ensure reliabilityand validity. For the current research, we used software designed specifically to automatetopic modeling and lemmatization procedures [20]. With the MEM approach, we identi-fied 16 themes from the language generated during the values essay task (Table 4.1) and 27themes from the behavior essay task (Table 4.2).3
The MEM-derived value themes capture the various semantic topics that people gener-ate and, more broadly, tend to focus on when asked to reflect upon and discuss their values.Such themes lack the constraints of a forced choice questionnaire and, like other assess-ment methods, allow for nuance and variability between individuals. After performing thestandard MEM procedures for theme extraction, we sought to determine how these topicscorrespond to the 10 values as defined in the SVS. To quantify each MEM-derived themefor individual respondents, we used word counting software [19] to measure the rate of
3Like other topic modeling methods, researchers have some degree of leeway in determining the numberof themes extracted. For the MEM, theme interpretability is typically a key determining factor in decidinghow many themes to retain. While other potential solutions were available, the adoption of an alternatenumber of themes does not impact the conclusions that we draw from the current research.
40
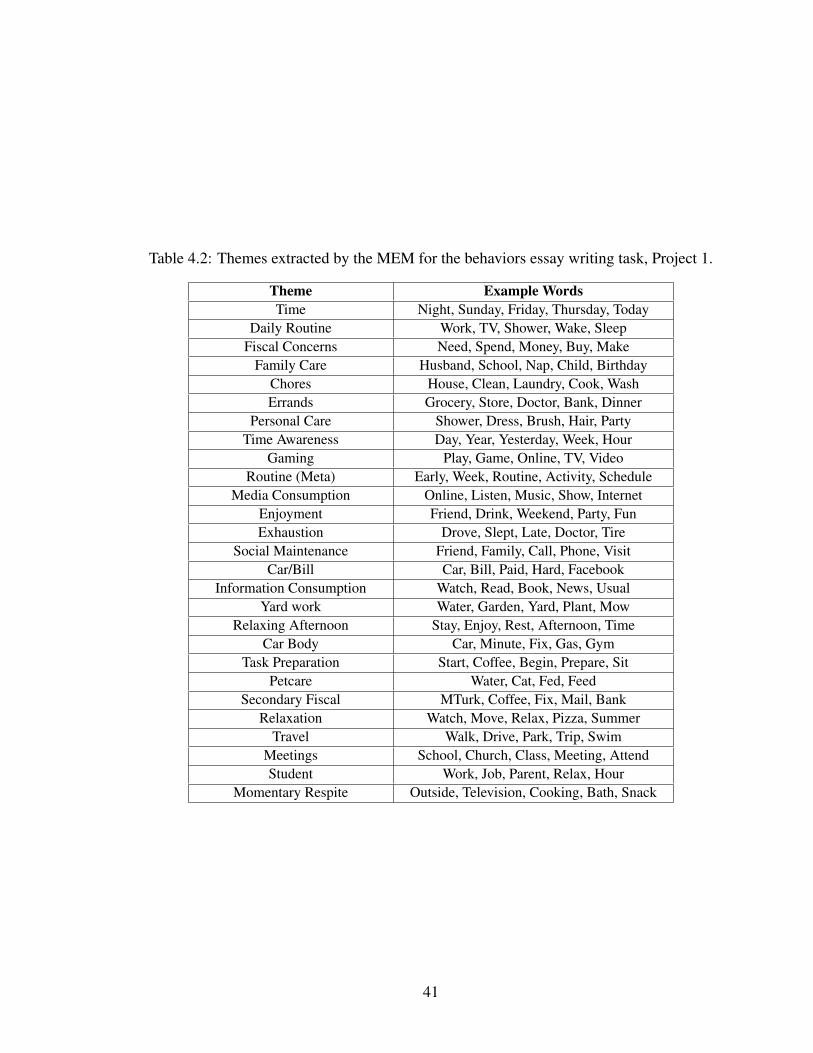
Table 4.2: Themes extracted by the MEM for the behaviors essay writing task, Project 1.
Theme Example WordsTime Night, Sunday, Friday, Thursday, Today
Daily Routine Work, TV, Shower, Wake, SleepFiscal Concerns Need, Spend, Money, Buy, Make
Family Care Husband, School, Nap, Child, BirthdayChores House, Clean, Laundry, Cook, WashErrands Grocery, Store, Doctor, Bank, Dinner
Personal Care Shower, Dress, Brush, Hair, PartyTime Awareness Day, Year, Yesterday, Week, Hour
Gaming Play, Game, Online, TV, VideoRoutine (Meta) Early, Week, Routine, Activity, Schedule
Media Consumption Online, Listen, Music, Show, InternetEnjoyment Friend, Drink, Weekend, Party, FunExhaustion Drove, Slept, Late, Doctor, Tire
Social Maintenance Friend, Family, Call, Phone, VisitCar/Bill Car, Bill, Paid, Hard, Facebook
Information Consumption Watch, Read, Book, News, UsualYard work Water, Garden, Yard, Plant, Mow
Relaxing Afternoon Stay, Enjoy, Rest, Afternoon, TimeCar Body Car, Minute, Fix, Gas, Gym
Task Preparation Start, Coffee, Begin, Prepare, SitPetcare Water, Cat, Fed, Feed
Secondary Fiscal MTurk, Coffee, Fix, Mail, BankRelaxation Watch, Move, Relax, Pizza, Summer
Travel Walk, Drive, Park, Trip, SwimMeetings School, Church, Class, Meeting, AttendStudent Work, Job, Parent, Relax, Hour
Momentary Respite Outside, Television, Cooking, Bath, Snack
41
words from each theme as they appeared in each essay response. For example, an individ-ual who used 4 “empathy” words out of 100 total words would attain a score of 4% forthis theme. Following these calculations, we then correlated scores for the MEM-derivedvalues with the values quantified by the SVS. This comparison is summarized in Table 4.3.
Con
form
ity
Trad
ition
Secu
rity
Pow
er
Ach
ieve
men
t
Hed
onis
m
Stim
ulat
ion
Self
-Dir
ectio
n
Uni
vers
alis
m
Ben
evol
ence
Religion ◦ ◦ ◦ ◦ •Empathy ◦ • •FamilyGrowth • • • ◦ # ◦WorkDecisionMakingHonesty •NegativeReligionSocial • ◦ ◦GrowthIndulgence •CaringKnowledgeOpennessKnowledgeGain ◦ ◦ ◦ • • •PrinciplesFreedom ◦ ◦ • •Certainty
Table 4.3: Relationships between SVS values and MEM-derived value themes, Project 1.Positive relationship: • = R2 ≥ .01, = R2 ≥ .04. Negative relationship: ◦ = R2 ≥ .01,# = R2 ≥ .04.
The established relationships among the SVS values seem to exhibit themselves here.For each of the SVS value dimensions, the correlations tend to exhibit an expected sinu-soidal trend against the MEM-derived themes. Additionally, we see relatively intuitivecorrelations between MEM-derived values and the SVS in a way that might be expected.Peoples’ use of words from the “religion” theme align well with the SVS Tradition valueand fall in opposition to the SVS value of Self-Direction. We see small positive correlationsbetween theme-score pairs such as Honesty/Benevolence, KnowledgeGain/Universalism,and Indulgence/Stimulation. However, we note that the correlations between the MEM-derived values and the SVS value scores are considerably weaker than would be expectedwere they reflecting identical constructs. Given their hypothetical measurement of the samebroad construct (i.e., “values”), convergence would be expected to a rather high degree, re-flected by moderately strong effect sizes; this was not the case. In other words, the ideas
42
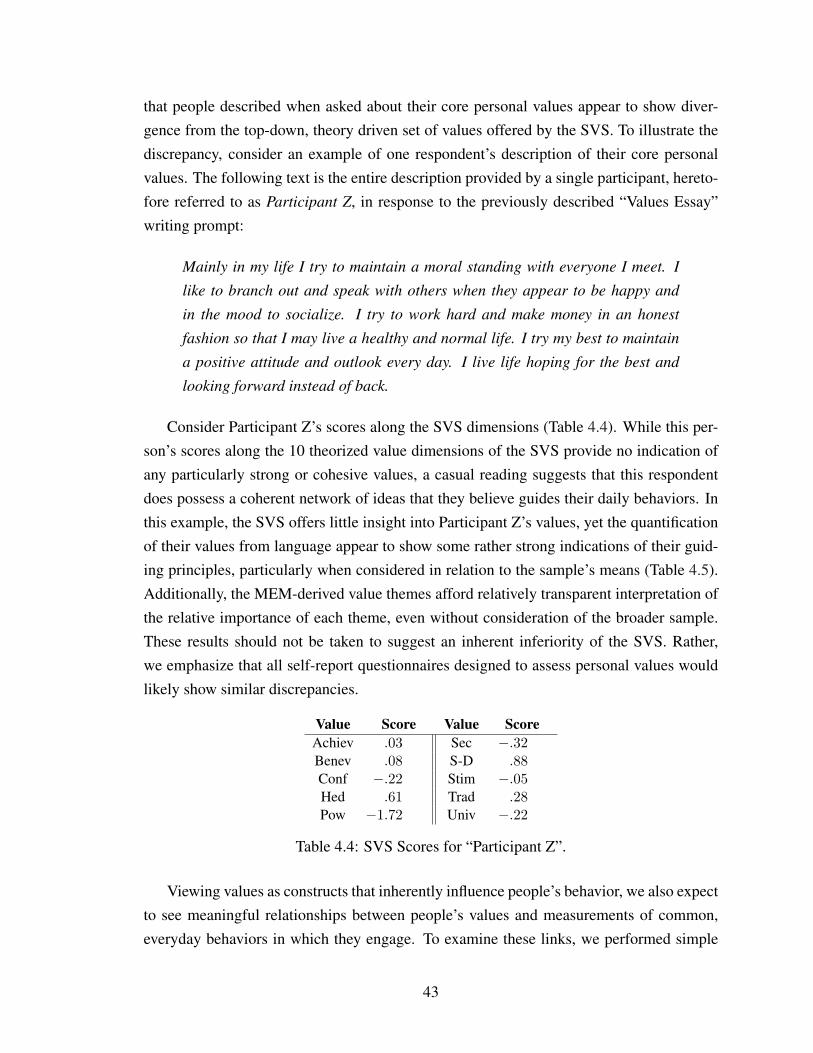
that people described when asked about their core personal values appear to show diver-gence from the top-down, theory driven set of values offered by the SVS. To illustrate thediscrepancy, consider an example of one respondent’s description of their core personalvalues. The following text is the entire description provided by a single participant, hereto-fore referred to as Participant Z, in response to the previously described “Values Essay”writing prompt:
Mainly in my life I try to maintain a moral standing with everyone I meet. I
like to branch out and speak with others when they appear to be happy and
in the mood to socialize. I try to work hard and make money in an honest
fashion so that I may live a healthy and normal life. I try my best to maintain
a positive attitude and outlook every day. I live life hoping for the best and
looking forward instead of back.
Consider Participant Z’s scores along the SVS dimensions (Table 4.4). While this per-son’s scores along the 10 theorized value dimensions of the SVS provide no indication ofany particularly strong or cohesive values, a casual reading suggests that this respondentdoes possess a coherent network of ideas that they believe guides their daily behaviors. Inthis example, the SVS offers little insight into Participant Z’s values, yet the quantificationof their values from language appear to show some rather strong indications of their guid-ing principles, particularly when considered in relation to the sample’s means (Table 4.5).Additionally, the MEM-derived value themes afford relatively transparent interpretation ofthe relative importance of each theme, even without consideration of the broader sample.These results should not be taken to suggest an inherent inferiority of the SVS. Rather,we emphasize that all self-report questionnaires designed to assess personal values wouldlikely show similar discrepancies.
Value Score Value ScoreAchiev .03 Sec −.32Benev .08 S-D .88Conf −.22 Stim −.05Hed .61 Trad .28Pow −1.72 Univ −.22
Table 4.4: SVS Scores for “Participant Z”.
Viewing values as constructs that inherently influence people’s behavior, we also expectto see meaningful relationships between people’s values and measurements of common,everyday behaviors in which they engage. To examine these links, we performed simple
43
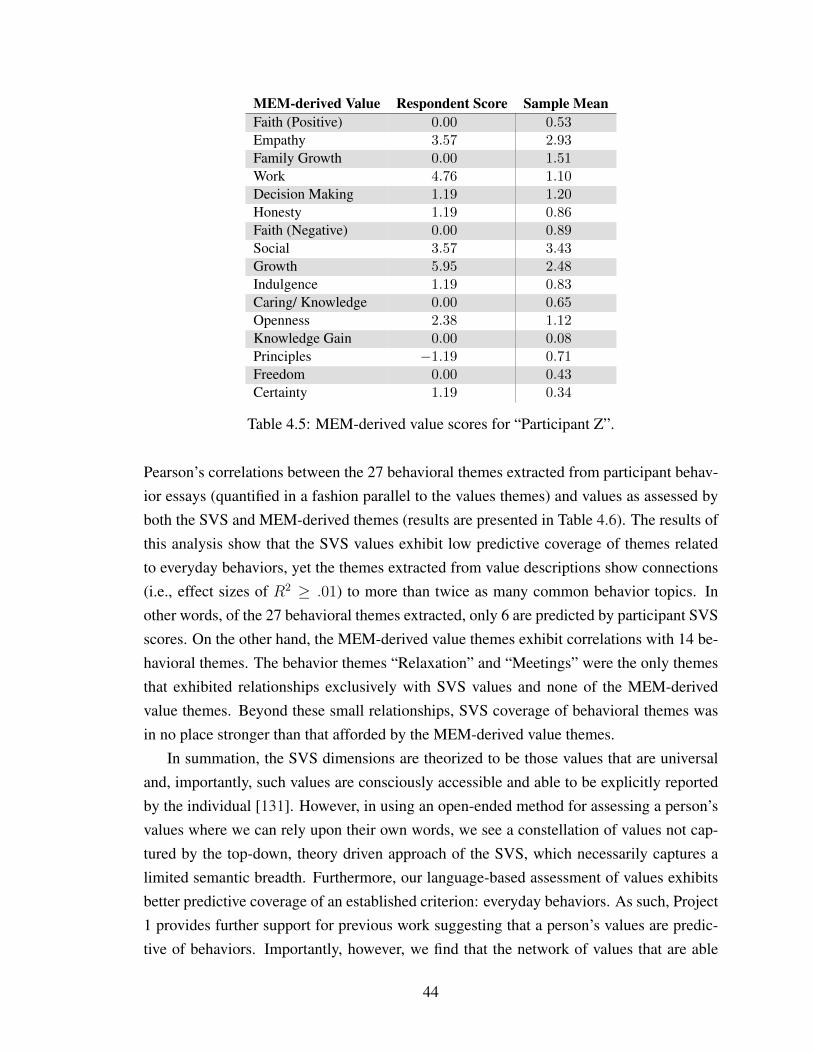
MEM-derived Value Respondent Score Sample MeanFaith (Positive) 0.00 0.53Empathy 3.57 2.93Family Growth 0.00 1.51Work 4.76 1.10Decision Making 1.19 1.20Honesty 1.19 0.86Faith (Negative) 0.00 0.89Social 3.57 3.43Growth 5.95 2.48Indulgence 1.19 0.83Caring/ Knowledge 0.00 0.65Openness 2.38 1.12Knowledge Gain 0.00 0.08Principles −1.19 0.71Freedom 0.00 0.43Certainty 1.19 0.34
Table 4.5: MEM-derived value scores for “Participant Z”.
Pearson’s correlations between the 27 behavioral themes extracted from participant behav-ior essays (quantified in a fashion parallel to the values themes) and values as assessed byboth the SVS and MEM-derived themes (results are presented in Table 4.6). The results ofthis analysis show that the SVS values exhibit low predictive coverage of themes relatedto everyday behaviors, yet the themes extracted from value descriptions show connections(i.e., effect sizes of R2 ≥ .01) to more than twice as many common behavior topics. Inother words, of the 27 behavioral themes extracted, only 6 are predicted by participant SVSscores. On the other hand, the MEM-derived value themes exhibit correlations with 14 be-havioral themes. The behavior themes “Relaxation” and “Meetings” were the only themesthat exhibited relationships exclusively with SVS values and none of the MEM-derivedvalue themes. Beyond these small relationships, SVS coverage of behavioral themes wasin no place stronger than that afforded by the MEM-derived value themes.
In summation, the SVS dimensions are theorized to be those values that are universaland, importantly, such values are consciously accessible and able to be explicitly reportedby the individual [131]. However, in using an open-ended method for assessing a person’svalues where we can rely upon their own words, we see a constellation of values not cap-tured by the top-down, theory driven approach of the SVS, which necessarily captures alimited semantic breadth. Furthermore, our language-based assessment of values exhibitsbetter predictive coverage of an established criterion: everyday behaviors. As such, Project1 provides further support for previous work suggesting that a person’s values are predic-tive of behaviors. Importantly, however, we find that the network of values that are able
44
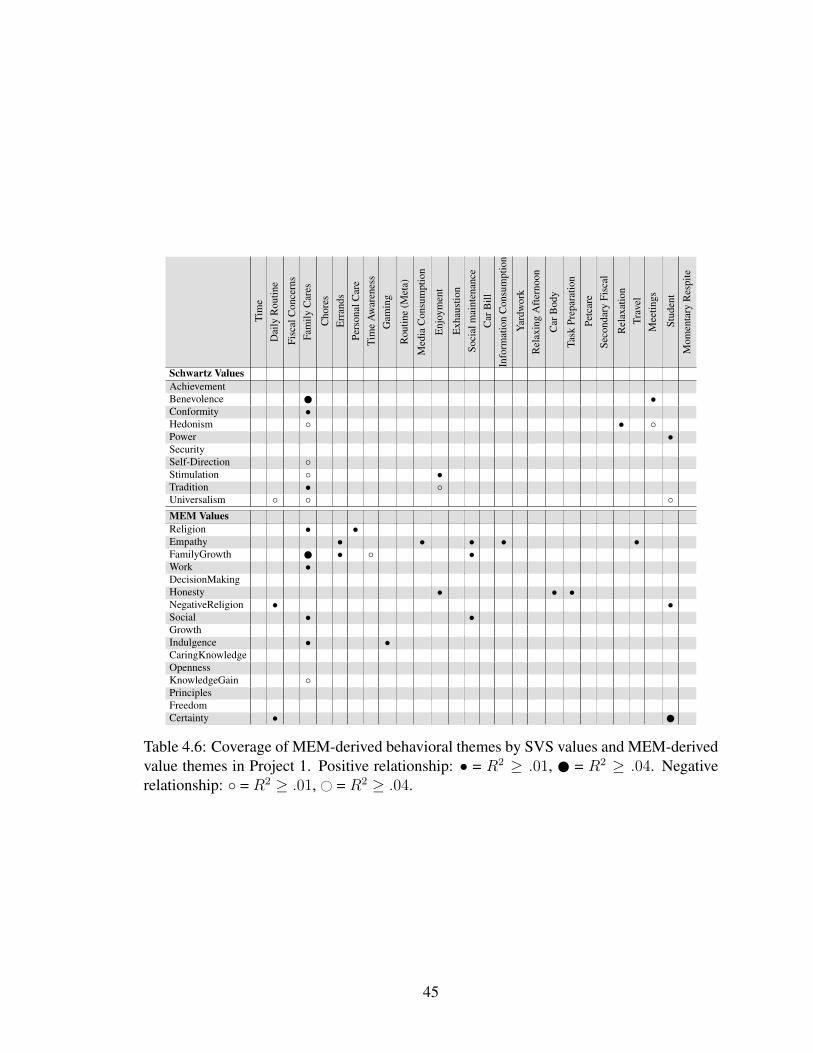
Tim
eD
aily
Rou
tine
Fisc
alC
once
rns
Fam
ilyC
ares
Cho
res
Err
ands
Pers
onal
Car
eTi
me
Aw
aren
ess
Gam
ing
Rou
tine
(Met
a)
Med
iaC
onsu
mpt
ion
Enj
oym
ent
Exh
aust
ion
Soci
alm
aint
enan
ceC
arB
illIn
form
atio
nC
onsu
mpt
ion
Yar
dwor
kR
elax
ing
Aft
erno
on
Car
Bod
y
Task
Prep
arat
ion
Petc
are
Seco
ndar
yFi
scal
Rel
axat
ion
Trav
elM
eetin
gs
Stud
ent
Mom
enta
ryR
espi
te
Schwartz ValuesAchievementBenevolence •Conformity •Hedonism ◦ • ◦Power •SecuritySelf-Direction ◦Stimulation ◦ •Tradition • ◦Universalism ◦ ◦ ◦MEM ValuesReligion • •Empathy • • • • •FamilyGrowth • ◦ •Work •DecisionMakingHonesty • • •NegativeReligion • •Social • •GrowthIndulgence • •CaringKnowledgeOpennessKnowledgeGain ◦PrinciplesFreedomCertainty •
Table 4.6: Coverage of MEM-derived behavioral themes by SVS values and MEM-derivedvalue themes in Project 1. Positive relationship: • = R2 ≥ .01, = R2 ≥ .04. Negativerelationship: ◦ = R2 ≥ .01, # = R2 ≥ .04.
45
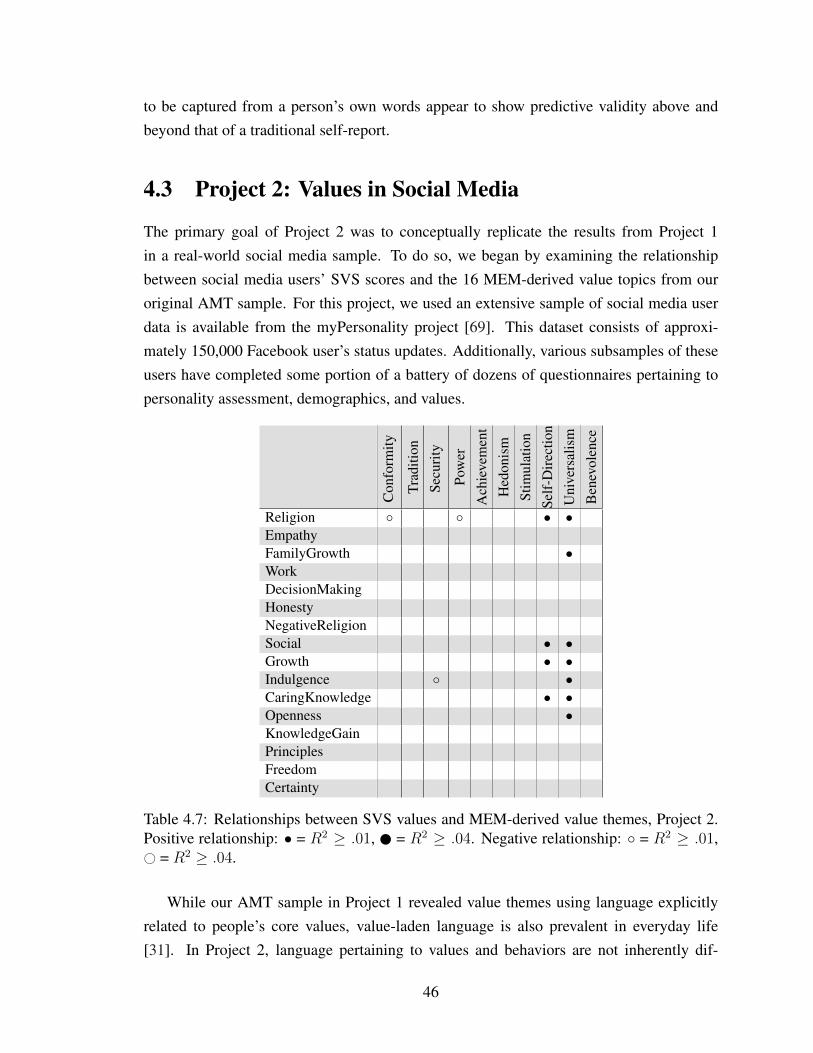
to be captured from a person’s own words appear to show predictive validity above andbeyond that of a traditional self-report.
4.3 Project 2: Values in Social Media
The primary goal of Project 2 was to conceptually replicate the results from Project 1in a real-world social media sample. To do so, we began by examining the relationshipbetween social media users’ SVS scores and the 16 MEM-derived value topics from ouroriginal AMT sample. For this project, we used an extensive sample of social media userdata is available from the myPersonality project [69]. This dataset consists of approxi-mately 150,000 Facebook user’s status updates. Additionally, various subsamples of theseusers have completed some portion of a battery of dozens of questionnaires pertaining topersonality assessment, demographics, and values.
Con
form
ity
Trad
ition
Secu
rity
Pow
er
Ach
ieve
men
t
Hed
onis
m
Stim
ulat
ion
Self
-Dir
ectio
n
Uni
vers
alis
m
Ben
evol
ence
Religion ◦ ◦ • •EmpathyFamilyGrowth •WorkDecisionMakingHonestyNegativeReligionSocial • •Growth • •Indulgence ◦ •CaringKnowledge • •Openness •KnowledgeGainPrinciplesFreedomCertainty
Table 4.7: Relationships between SVS values and MEM-derived value themes, Project 2.Positive relationship: • = R2 ≥ .01, = R2 ≥ .04. Negative relationship: ◦ = R2 ≥ .01,# = R2 ≥ .04.
While our AMT sample in Project 1 revealed value themes using language explicitlyrelated to people’s core values, value-laden language is also prevalent in everyday life[31]. In Project 2, language pertaining to values and behaviors are not inherently dif-
46

ferentiated, as all language was acquired exclusively from user status updates. As such,we used the MEM-derived value lexicon created within Project 1 as our “ground truth”for value-relevant words in Project 2. MEM-derived values for Facebook users were mea-sured using word counting software [19] to scan user status updates for the predeterminedvalue-relevant words; this procedure was parallel to the language-based value quantifica-tion method described for Project 1.
To ensure reliability, all participants were required to have a minimum of 200 wordsused across all status updates (participants meeting criteria: N = 130, 828). Those usersincluded in the myPersonality dataset who had completed demographic surveys reportedan average age of 25.3 years (SD = 11.1), and 56% identified themselves as female.Additionally, a subsample of the myPersonality dataset included Facebook users who hadalso completed the SVS online (N = 1, 260).4
4.3.1 Analysis
As a first step, SVS scores for Facebook users were correlated with the MEM-derived valuethemes as they were present in the users’ status updates (Table 4.7). Again, we see onlypartial coverage of value-relevant language in terms of value dimensions captured by theSVS. However, in this sample, we see a decrease in the predictive coverage of the SVS withregard to value-laden words in participant status updates. The weakened correspondencebetween these two measures is to be expected – unlike Project 1, participants are not likelyto be explicitly enumerating their core values. However, these results also suggest thatthose constructs measured by the SVS may not permeate into everyday life to the extentthat researchers have typically assumed, whereas value-laden language does.
As with Project 1, we also sought to examine the links between Facebook users’ corevalues and other aspects of mental life, primarily behavior. As was described for the firstproject, we first used the MEM to extract topical themes from the entire myPersonalitycorpus that met our minimum word count inclusion criteria. This procedure resulted in30 broad themes found within Facebook user status updates (Table 4.8).5 A few of thebehavioral themes derived from the Facebook users’ language have analogs to those themesfound in the AMT behavior essay responses (e.g., “Day to Day” and “Daily Routine”,“Children” and “Family Care”) but, in general, many of the themes derived from Facebookstatus updates pertain to qualitatively novel topics. Unlike the behavioral themes from the
4Average SVS scores were generally analogous to those from Project 1’s AMT sample.5Additional themes could be extracted, however, themes not intuitively reflecting cognition or behavior
were excluded. Extraneous themes largely reflected culture (e.g., specific word spelling such as “neighbour”and “arse” from the U.K.) or verbal fries (e.g., “gurl”, “cuz”). Retention of these themes did not alter theresults or conclusions.
47
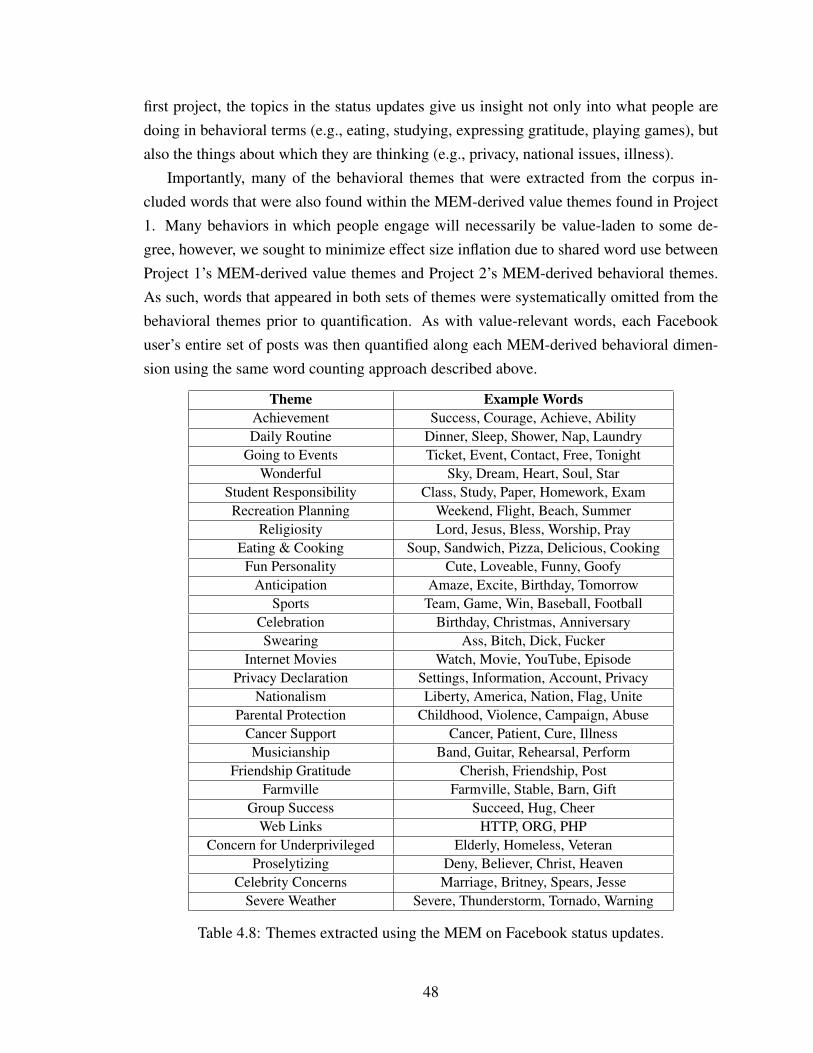
first project, the topics in the status updates give us insight not only into what people aredoing in behavioral terms (e.g., eating, studying, expressing gratitude, playing games), butalso the things about which they are thinking (e.g., privacy, national issues, illness).
Importantly, many of the behavioral themes that were extracted from the corpus in-cluded words that were also found within the MEM-derived value themes found in Project1. Many behaviors in which people engage will necessarily be value-laden to some de-gree, however, we sought to minimize effect size inflation due to shared word use betweenProject 1’s MEM-derived value themes and Project 2’s MEM-derived behavioral themes.As such, words that appeared in both sets of themes were systematically omitted from thebehavioral themes prior to quantification. As with value-relevant words, each Facebookuser’s entire set of posts was then quantified along each MEM-derived behavioral dimen-sion using the same word counting approach described above.
Theme Example WordsAchievement Success, Courage, Achieve, AbilityDaily Routine Dinner, Sleep, Shower, Nap, Laundry
Going to Events Ticket, Event, Contact, Free, TonightWonderful Sky, Dream, Heart, Soul, Star
Student Responsibility Class, Study, Paper, Homework, ExamRecreation Planning Weekend, Flight, Beach, Summer
Religiosity Lord, Jesus, Bless, Worship, PrayEating & Cooking Soup, Sandwich, Pizza, Delicious, Cooking
Fun Personality Cute, Loveable, Funny, GoofyAnticipation Amaze, Excite, Birthday, Tomorrow
Sports Team, Game, Win, Baseball, FootballCelebration Birthday, Christmas, AnniversarySwearing Ass, Bitch, Dick, Fucker
Internet Movies Watch, Movie, YouTube, EpisodePrivacy Declaration Settings, Information, Account, Privacy
Nationalism Liberty, America, Nation, Flag, UniteParental Protection Childhood, Violence, Campaign, Abuse
Cancer Support Cancer, Patient, Cure, IllnessMusicianship Band, Guitar, Rehearsal, Perform
Friendship Gratitude Cherish, Friendship, PostFarmville Farmville, Stable, Barn, Gift
Group Success Succeed, Hug, CheerWeb Links HTTP, ORG, PHP
Concern for Underprivileged Elderly, Homeless, VeteranProselytizing Deny, Believer, Christ, Heaven
Celebrity Concerns Marriage, Britney, Spears, JesseSevere Weather Severe, Thunderstorm, Tornado, Warning
Table 4.8: Themes extracted using the MEM on Facebook status updates.
48

Ach
ieve
men
t
Dai
lyR
outin
e
Goi
ngto
Eve
nts
Won
derf
ul
Stud
entR
esp.
Rec
reat
ion
Plan
ning
Rel
igio
sity
Eat
ing/
Coo
king
Fun
Pers
onal
ity
Ant
icip
atio
n
Spor
ts
Cel
ebra
tions
Swea
ring
Inte
rnet
/Mov
ies
Priv
acy
Con
cern
s
Nat
iona
lism
Pare
ntal
Prot
ectio
nC
ance
rSup
port
Mus
icia
nshi
p
Frie
ndsh
ip
Farm
ville
Gro
upSu
cces
s
Web
Lin
ksU
nder
priv
ilege
d
Pros
elyt
izin
g
Cel
ebri
tyC
once
rns
Seve
reW
eath
er
Schwartz ValuesAchievement ◦ • ◦BenevolenceConformity • • • •Hedonism ◦ ◦ • ◦PowerSecurity ◦ •Self-DirectionStimulation ◦ ◦Tradition • •Universalism
MEM ValuesReligion • Empathy • • • • • •FamilyGrowth • • • • • •Work • DecisionMaking • • •Honesty ◦ ◦ ◦ ◦NegativeReligion • •Social ◦ • • • • •Growth ◦ • ◦Indulgence • • • • • • • • • •CaringKnowledge ◦ ◦ ◦ • ◦ • • •Openness • • • • • •KnowledgeGain • • ◦ ◦ ◦Principles # # # ◦ # #Freedom • • • •Certainty •
Table 4.9: Coverage of behavior MEM themes by SVS values and value MEM themes,Project 2. Positive relationship: • = R2 ≥ .01, = R2 ≥ .04. Negative relationship: ◦ =R2 ≥ .01, # = R2 ≥ .04.
Finally, we performed an analysis parallel to that described for Project 1 in order to ex-plore the degree to which the language-derived value themes and SVS value scores corre-sponded to the self-described behaviors and ideas present in Facebook users’ status updates.We emphasize two primary aspects of the results, presented in Table 4.9. First, we againsee a conceptual replication of Project 1 in terms of value-behavior relationships. Scoresfrom the SVS appear to show little correspondence with the actual behaviors and ideas thatour sample of Facebook users share with others, whereas language-derived values showconsiderable and consistent relationships with behavioral topics. Second, whereas the SVSappears to correspond to rather narrow bands of behavioral themes, the language-derivedvalues show extensive coverage of behaviors in predictive terms. In other words, the resultsfrom Project 2 not only conceptually replicate the results from Project 1, but demonstratethe applicability of the language-derived value themes to a completely new set of themespertaining to the common thoughts and behaviors of social media users in the real world.
49

4.4 Conclusions
We have collected and analyzed one new, crowd-sourced dataset and one archival socialmedia user dataset in order to better understand the relationships between people’s val-ues and their behaviors using a natural language processing approach. We found that thewidely-adopted set of values that are measured by the SVS provide substantially less pre-dictive coverage of real-world behaviors than a set of values extracted from people’s owndescriptions. Simply asking people what is important to them turns out to be a more infor-mative method for answering the question of what values are, and the simple word countingapproach appears to be a viable method for value quantification. Using this approach, weexamined a large-scale social media data set to explore whether the language of valueswould continue to exhibit relationships with the ideas and behaviors that people share intheir Facebook status updates. Results offer consistently strong support for language-basedvalue–behavior links.
It is our hope that the work is this chapter has opened more doors to future work invalues research. A new set of values has been identified, along with a method that allowsfor the simple, intuitive lexical representation of values. These methods can be used tostudy the values of various groups of people across various platforms, languages, time, andspace. We note that this approach requires that a large enough body of text be collectedfor successful research. However, this is easily achieved by using more social media data,blog data, and other forms of prevalent data available in the current big data atmosphere.This approach may also facilitate further exploration of the relationships that exist betweenvalues and behavior by encouraging more fine-grained computational models.
4.4.1 Beyond Values
We have shown here a single case in which natural language data provided a more clearpicture of people’s cognitive and behavioral processes than data collected from a traditionaland widely used self-report survey. Additionally, we have demonstrated that the informa-tion extracted from natural language exhibited more links (both in terms of quantity anddiversity) with behaviors and thoughts than a standardized self-report measure. However,we advocate that the general approach that we have used for the current studies can alsobe applied much more generally. Indeed, many of the social and psychological phenom-ena studied using social media are conceptually abstract and difficult to distill into validmetrics. While the standard approach to studying such phenomena is to rely on gatheringself-report data in the form of forced-choice questionnaires, this process often requires thecollection of data beyond what is already available via social media and may often serve
50
as insufficient “ground truth” when attempting to capture psychology as it exists in the realworld.
As described in the current work, we emphasize that already-existing, organically gen-erated social media data can exhibit greater predictive strength for human behaviors anda more dynamic structure than that imposed by closed, forced-choice questionnaires. Ad-ditionally, data at the “big data” level are often only available in the form of natural lan-guage. In such cases, we have demonstrated that psychological “ground truth” can stillbe attained, allowing researchers to explore human psychology under conditions wherediverse forms of data are unavailable. Finally, the methods described here allow for theinference of many different psychological phenomena from the same data, including thecore three components of human psychology (i.e., affect, cognition, and behavior). It isour aim to demonstrate with the work presented here that language is an incredibly flexibleform of data that can be used to many great purposes.
51

CHAPTER 5
Disentangling Topic Models: A Cross-culturalAnalysis of Personal Values
5.1 Introduction
In this chapter, we use topic modeling to explore sociolinguistic differences between vari-ous groups of authors by identifying groups of words that are indicative of a target process,building upon the results from Chapter 4. We introduce a number of strategies that ex-emplify how topic modeling can be employed to make meaningful comparisons betweengroups of people. Moreover, we show how regression analysis may be leveraged to dis-entangle various factors influencing the usage of a particular topic. This facilitates theinvestigation of how particular traits are related to psychological processes.
We provide an example application in which we investigate how this methodology canbe used to understand personal values, their relationships to behaviors, and the differencesin their expression by writers from two cultures. To carry out these analyses, we exam-ine essays from a multicultural social survey and posts written by bloggers in differentcountries. Our results show that culture plays an important role in the exploration of value-behavior relationships
Our contributions include: 1) a new sociolinguistic geared methodology that combinestopic modeling with linear regression to explore differences between groups, while specifi-cally accounting for the potential influence of different attributes of people in the group; 2)a cross-cultural study of values and behaviors that uses this methodology to identify differ-ences in personal values between United States (US) and India, as well as culture-specificvalue-behavior links; and 3) a social survey data set containing free response text as wellas a corpus of blog posts written by authors from two countries.
52

5.2 Methodology
5.2.1 Topic Modeling with the Meaning Extraction Method
While several topic modeling methods are available, we use the MEM as it has been shownto be particularly useful for revealing dimensions of authors’ thoughts while composing adocument [71, 81]. The MEM was first used as a content analysis approach for understand-ing dimensions along which people think about themselves as inferred from self descriptivewriting samples. Given a corpus in which the authors are known to be writing in a way thatis reflective of a certain psychological construct (e.g., self concept), the MEM can be usedto target that construct and automatically extract groups of words that are related to it. Notethat the MEM is a general framework for identifying topics in a corpus, and is one of manyapproaches that could be taken toward this goal. While our methodology allows for flexi-bility in decision making during the process, we opt for the original MEM setting proposedin [30] and leave the investigation of the effectiveness alternative configurations for futurework.
The standard MEM begins with a particular series of preprocessing steps, which weperform using the Meaning Extraction Helper [21]. This tool tokenizes and lemmatizes thewords in each document, then filters out function words as well as rare words (those used inless than 5% of documents). Each of the documents is then converted into a binary vectorindicating the presence of a given word with a value of 1 and the absence of a word with a0. This approach is taken in order to focus on whether or not documents contain particularwords without taking into account word frequency.
Based on the notion that word co-occurrences can lead to psychologically meaningfulword groupings, we then perform principal components analysis on the correlation matrixof these document vectors, and apply the varimax rotation [63],1 which, in terms of thelanguage analysis domain, is formulated as the orthogonal rotation that satisfies:
maxT∑t
( V∑w
fwt4 − (
∑Vw fwt
2)
|V |
)
where T represents the set of topics (|T | = k, the number of topics specified as a parameterto the model), V is the vocabulary of all the words in the data set, and ftw is the factorloading of word (variable) w for topic (factor) t. The goal of this rotation is to increasestructural simplicity and interpretability while maintaining factorial invariance.
For many topic modeling approaches, the raw membership relation mRAW for a word
1We use the implementation of the varimax rotation from the stats package of CRAN (cran.r-project.org).
53

w in a topic, or “theme”, t, may be defined directly as: mRAW (t, w) = fwt where fwt isthe factor loading of w for t (or posterior probability of w belonging to t, depending on theparadigm being used). However, the MEM traditionally takes a thresholding approach towords’ membership to a topic: any word with a factor loading of at least .20 for a particularcomponent is retained as part of the theme, (words with loadings of less than -.20 reflectconcepts at the opposite end of a bipolar construct). Functionally, then, we define thethreshold membership relation mTHRESH for a word w to a new theme t:
mTHRESH(t, w) =
1 if fwt > τ,
−1 if fwt < −τ,
0 otherwise.
We follow [30] and choose a threshold of τ = .2.
5.2.2 Topic Regression Analysis
To measure the degree to which a particular topic is used more (or less) by one group thananother, we fit and subsequently analyze a series of regression models. For each documentd and theme t, we assign a usage score by the function:
s(t, d) =
∑dwm(t, w)
|d|,
assuming that a document is an iterable sequence of words andm is the chosen membershiprelation. When using mTHRESH , this score is essentially a normalized count of words ina document that belong to a particular theme minus the total number of words that werefound to be in opposition to that theme (those words for which m(t, w) = −1).
We then regress the normalized score:
sNORM(t, i,D) =|D| · s(t, di)∑
d∈D s(t, d)
against variables encoding attributes of interest pertaining to each document di, such asthe author’s membership to a certain group, in order to determine the influence of theseattributes on sNORM(t, i,D). Here, D represents all documents in the corpus and di is theith document in D.
After fitting the regression models, we can interpret the coefficient attached to eachattribute as the expected change in the usage of a particular theme as a result of a unitincrease in the attribute, holding all other modeled attributes constant. For example, if
54

we have a variable measuring the gender of the document’s author, encoded as 0 for maleand 1 for female, we can explore the degree to which gender has an expected relationshipwith the usage of a theme while controlling for other possible confounding factors that areincluded in the regression model. With this formulation, a binary variable with a predictedcoefficient of, e.g., .15 would indicate an expected 15% increase in the usage of a themebetween the group encoded as 1 (female, in our example) over the group encoded as 0(male). Furthermore, we check for interactions between the attributes through a two-levelfactorial design regression analysis.
5.2.3 Relationships Between Sets of Themes
It may also be desirable to quantify the relationships between two different sets of themes.If the same set of authors have written texts that are known to relate to multiple categoriesof interest, perhaps psychological constructs (e.g., an essay about personality and anotherabout mental health), the MEM can be run for each category of writing in order to generateseveral sets of themes.
At this point, this is equivalent to treating each writing type as a distinct meaning extrac-tion task where the texts from a corpus C1 generates T1 and another corpus C2 generatesT2, where C1 and C2 are collections of documents belonging to distinct categories (e.g.,stances on a political issue and views of morality). We are then able to take a look at therelationships within or between the constructs as expressed in texts of C1 and C2. We usethe previously defined s function to assign a score to each writing sample d ∈ Ci for eachtopic t ∈ Ti so that all documents are represented as vectors of topic scores, with each ele-ment corresponding to one of the k topics. Transposing the matrix made up of these vectorsgives vectors for each topic with a length equal to the number of documents in the corpus.We then use these topic vectors to compute the Pearson correlation coefficient between anypair of themes. In order to ensure that correlations are not inflated by the presence of thesame word in both themes, we first remove words that appear in any theme in T1 from allthemes in T2 (or vice versa). When using an m function that gives a continuous nonzeroscore to (nearly) every word for every topic, it would be advisable to use a threshold in thiscase, rather than absence/presence. That is, remove any words from any theme ti ∈ T1 with|m(ti, w)| > φ from every topic tj ∈ T2 for which it is also the case that |m(tj, w)| > φ,for some small value φ.
These quantified topical relationships are then used as a way to look at differencesbetween two groups of people in a new way (e.g., differences between Republicans andDemocrats). To illustrate, assume that we have two groups of writers, G1 and G2, and
55

writers from each group have created two documents each, one belonging to C1 and theother to C2, on which we have applied the MEM to generate sets of themes T1 and T2 andcomputed s(t, d) scores. Then, for the group G1, we can use the aforementioned approachto compute the relationship between every theme in T1 and every theme in T2 and comparethese relationships to those found for another group of people, G2. Also, we are able tocompute the relationships between themes that are found when combining texts from bothwriter groups into a single corpus (written by G1 ∪G2) and examine how these differ fromthe relationships found when only considering one of the groups.
Since many correlations will be computed during this process, and each is consideredan individual statistical test, correction for multiple hypothesis testing is in order. This isaddressed using a series of 10K Monte Carlo simulations of the generation of the resultingcorrelation matrix in order to compute statistical significance, following the multivariatepermutation tests proposed by Yoder et al. (2004). Each iteration of this approach involvesrandomly shuffling the topic usage scores for every topic, then recomputing the correlationsto determine how often a given correlation coefficient would be found if the usage scoresof themes by a user were randomly chosen. Observed coefficient values larger than thecoefficient at the 1− α/2 percentile or smaller than the coefficient at the α/2 percentile ofall simulated coefficients are labeled as significant.
5.3 Application to Personal Values
As an application of this methodology, we take a look at the psychological construct ofvalues and how they are expressed differently by people from India and people from the US.We show how the MEM can be used to target the concept of values to create useful themesthat summarize the main topics people discuss when reflecting on their personal values intwo different cultural groups. While doing this, we seek to avoid overlooking culture, whichis a considerable determiner of an individual’s psychology [54]. Importantly, researchstudies that focus exclusively on very specific people groups may reach false conclusionsabout the nature of observed effects [55, 105].
Since values are theorized to relate to a person’s real-world behaviors, we also use theMEM to learn about people’s recent activities and which values these activities link to moststrongly within different cultural groups. Furthermore, we show how the themes that wediscover can be used to study cultural value and behavior differences in a new social mediadata set.
56

5.4 Data Collection
5.4.1 Open-Ended Survey Data
We set out to collect data that captures the types of things people from the different culturalgroups generally talk about when asked about their values and behaviors. To do this, wecollect a corpus of writings from US and Indian participants containing responses to open-ended essay questions. The choice to use participants from both the US and India wasgrounded in three practical concerns. First, both countries have a high degree of participa-tion in online crowdsourcing services. Second, English is a commonly-spoken language inboth countries, making direct comparisons of unigram use relatively straight-forward forthe current purposes. Lastly, considerable research has shown that these two cultures arepsychologically unique in many ways [89], making them an apt test case for the currentapproach.
We administer the same survey that was introduced and described in Chapter 2 to a newset of respondents. Given that the original set of survey-takers were American (as specifiedthrough the Amazon Mechanical Turk interface), we now sought to collect parallel datafrom a population of Indians. In order to guarantee an adequate amount of text for eachuser, we only retain surveys in which respondents write at least 40 words in each of thewriting tasks. Additionally, each essay is manually checked for coherence, plagiarism,and relevance to the prompt. Within the survey itself, multiple “check” questions wererandomly placed as a means of filtering out participants who were not paying close attentionto the instructions; no surveys are used in the current analyses from participants who failedthese check questions. After this filtering process, we choose the maximum number ofsurveys that would still allow for an equal balance of data from each country. Since therewere more valid surveys from the US than from India, a random subsample is drawn fromthe larger set of surveys to create a sample that is equivalent in size to the smaller set.These procedures result in 551 completed surveys from each country, or 1102 surveys intotal, each with both a value and behavior writing component. In the set of surveys fromIndia, 35% of respondents reported being female and 53% reported that they were between26 and 34 years old. 96% reported having completed at least some college education. Forthe respondents from the US, 63% reported being female and 38% were between the agesof 35 and 54 (more than any other age range). 88% reported having had some collegeeducation.
57

5.4.2 Blog Data
To further explore the potential of this approach, we would like to apply our sets of themesto a naturalistic data source that is unencumbered by researcher intervention. While surveydata is easily accessible and fast to collect, it may not necessarily reflect psychologicalprocesses as they occur in the real world. Thus, for another source of data, we turn to ahighly-trafficked social media website, Google Blogger.2
We create a new corpus consisting of posts scraped from Google Blogger. First, profilesof users specifying that their country is India or the US are recorded until we have amassed2,000 profiles each. Then, for each public blog associated with each profile (a user mayauthor more than one blog), we collect up to 1,000 posts. Since a disproportionate numberof these posts were written in more recent months, we balance the data across time byrandomly selecting 1,000 posts for each country for each month between January 2010 andSeptember 2015. This way, there should not be a bias toward a particular year or monthwhen the bloggers may have been more active in one of the countries. Each post is strippedof all HTML tags, and the titles of the posts are included as part of the document.
5.5 Results
5.5.1 Targeted Topic Extraction
First, we apply the MEM to the set of values essays, CV ALUES , from all respondents ofthe social survey. The set of extracted value-relevant themes, TV ALUES , is displayed inTable 5.1. The number of themes, k, is chosen for topical interpretability (e.g., in thiscase, k = 15). As with other topic modeling methods, slight variations in theme retentionare possible while still reaching the same general conclusions. The theme names weremanually assigned and are only for reference purposes; each theme is itself a collection ofwords with scores of either +1 or -1. For each theme, sample words that had a positivescore are given. Note that each word may appear in more than one theme. The themes arelisted in descending order by proportion of explained variance in the text data.
Table 5.2 shows the behavior themes (TBEHAV ). Most of these themes are rich inbehavioral content. However, a few themes capture words used in more of a structuralrole when composing a text descriptive of one’s past events (for example, Days and Dailyroutine). The theme labeled MTurk is a byproduct of the data collection method used, asit is expected that many of those surveyed would mention spending some time on the site
2http://www.blogger.com
58

Theme Example WordsRespect others people, respect, care, human, treat
Religion god, heart, belief, religion, rightFamily family, parent, child, husband, mother
Hard Work hard, work, better, honest, bestTime & Money money, work, time, day, yearProblem solving consider, decision, situation, problem
Relationships family, friend, relationship, loveOptimism enjoy, happy, positive, future, growHonesty honest, truth, lie, trust, true
Rule following moral, rule, principle, followSocietal society, person, feel, thought, quality
Personal Growth personal, grow, best, decision, mindAchievement heart, achieve, complete, goal
Principles important, guide, principle, centralExperiences look, see, experience, choose, feel
Table 5.1: Themes extracted by the MEM from the values essays, along with examplewords.
Theme Example WordsDays monday, tuesday, friday, sunday, today
Everyday activ. shower, coffee, lunch, eat, sleepChores clean, laundry, dish, cook, house
Morning wake, tea, morning, office, breakfastConsumption tv, news, eat, read, computer
Time week, hour, month, day, minuteChild care daughter, son, ready, school, church
MTurk computer, mturk, survey, moneyGrooming tooth, dress, hair, brush, shower
Video games play, game, video, online, talkHome leisure television, snack, show, music, listenCommuting move, house, drive, work, stay
Family sister, brother, birthday, phone, visitRoad trip drive, meet, plan, car, trip
Daily routine daily, regular, routine, activity, timeCompletion end, complete, finish, leave, weekend
Friends friend, visit, movie, together, funHobbies garden, read, exercise, write, cookingSchool attend, class, work, project, friend
Going out shop, restaurant, food, family, memberTaking a break break, fast, chat, work, routine
Table 5.2: Themes extracted by the MEM from the behavior essays, along with examplewords.
59
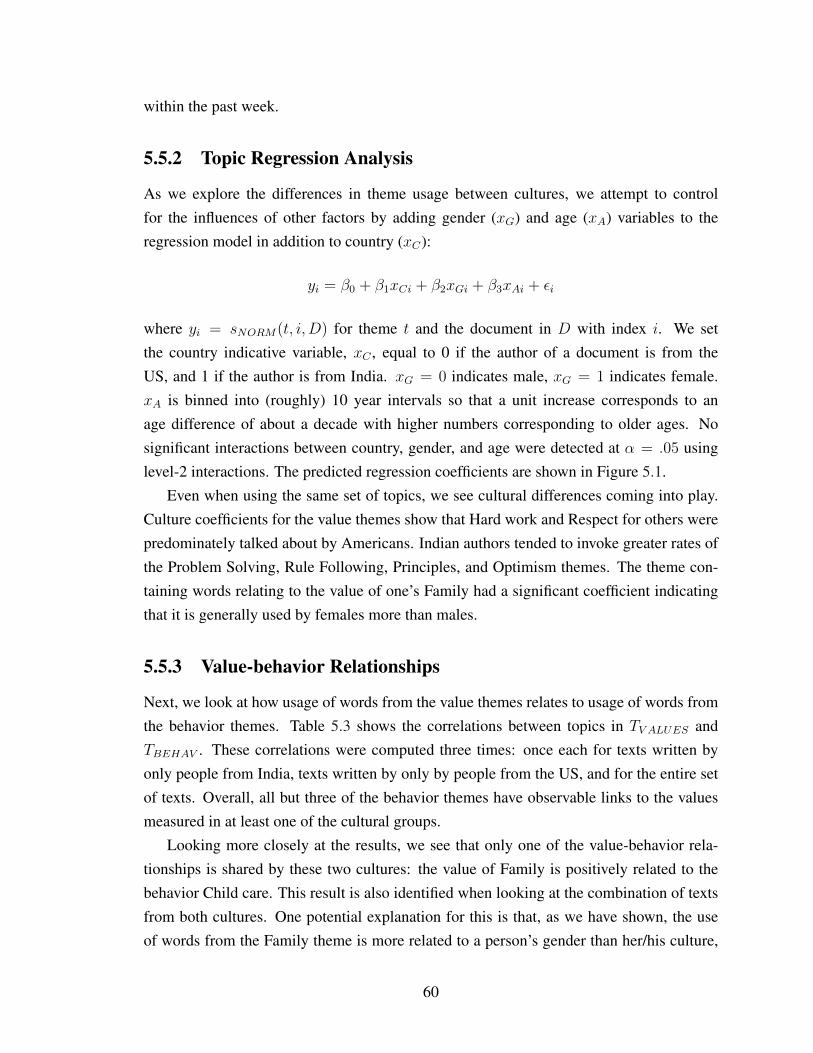
within the past week.
5.5.2 Topic Regression Analysis
As we explore the differences in theme usage between cultures, we attempt to controlfor the influences of other factors by adding gender (xG) and age (xA) variables to theregression model in addition to country (xC):
yi = β0 + β1xCi + β2xGi + β3xAi + εi
where yi = sNORM(t, i,D) for theme t and the document in D with index i. We setthe country indicative variable, xC , equal to 0 if the author of a document is from theUS, and 1 if the author is from India. xG = 0 indicates male, xG = 1 indicates female.xA is binned into (roughly) 10 year intervals so that a unit increase corresponds to anage difference of about a decade with higher numbers corresponding to older ages. Nosignificant interactions between country, gender, and age were detected at α = .05 usinglevel-2 interactions. The predicted regression coefficients are shown in Figure 5.1.
Even when using the same set of topics, we see cultural differences coming into play.Culture coefficients for the value themes show that Hard work and Respect for others werepredominately talked about by Americans. Indian authors tended to invoke greater rates ofthe Problem Solving, Rule Following, Principles, and Optimism themes. The theme con-taining words relating to the value of one’s Family had a significant coefficient indicatingthat it is generally used by females more than males.
5.5.3 Value-behavior Relationships
Next, we look at how usage of words from the value themes relates to usage of words fromthe behavior themes. Table 5.3 shows the correlations between topics in TV ALUES andTBEHAV . These correlations were computed three times: once each for texts written byonly people from India, texts written by only by people from the US, and for the entire setof texts. Overall, all but three of the behavior themes have observable links to the valuesmeasured in at least one of the cultural groups.
Looking more closely at the results, we see that only one of the value-behavior rela-tionships is shared by these two cultures: the value of Family is positively related to thebehavior Child care. This result is also identified when looking at the combination of textsfrom both cultures. One potential explanation for this is that, as we have shown, the useof words from the Family theme is more related to a person’s gender than her/his culture,
60

−0.5 −0.25 0 0.25 0.5 0.75
Respect others
Religion
Family
Hard work
Time & money
Problem solving
Relationships
Optimism
Honesty
Rule following
Societal
Personal growth
Achievement
Principles
Experiences
*
*
*
*
*
*
*
*
*
Regression coefficient
CountryGender
Age
Figure 5.1: Coefficients for the Country, Gender, and Age variables in regression model.For Country, Gender, and Age, negative values indicate a US, male, or younger bias towardthe theme, respectively, and positive values indicate an Indian, female, or older bias towardthe theme, respectively. * indicates p < .001.
so removing texts from one culture will not affect the presence of this relationship. On theother hand, when considering only the text from American survey respondents, we noticethat the value of Hard work is related to Chores. However, if we ignored these writing sam-ples and only analyzed the texts from Indian authors, we saw that this same theme of Hardwork is related to Consumption and Home leisure. The combined set of texts captures allthree relationships. This may hint at the solution of simply combining the texts in the firstplace, but further investigation showed that some of the relationships only emerged whenexamining texts from a single country. For example, we would not learn that American au-thors who wrote about Achievement in their values essay were more likely to have talked
61
Res
pect
othe
rs
Rel
igio
n
Fam
ily
Har
dw
ork
Tim
e&
mon
ey
Prob
lem
solv
ing
Rel
atio
nshi
ps
Opt
imis
m
Hon
esty
Rul
efo
llow
ing
Soci
etal
Pers
onal
grow
th
Ach
ieve
men
t
Prin
cipl
es
Exp
erie
nces
DaysEveryday activities Chores � ♦ ♦Morning ♦ � � � �Consumption �� Time #Child Care �� �MTurk � ♦Grooming Video games �Home leisure ��Commuting ♦ �♦ ♦Family ♦Road trip Daily routine ♦ ♦ � � �CompletionFriends Hobbies School ♦ � � �Going out �Taking a break
Table 5.3: Coverage of behavior MEM themes (rows) by value MEM themes (columns) fortwo different cultures. All results significant at α = .05 (two-tailed). USA only: : r > 0,# : r < 0, India only: � : r > 0, � : r < 0 , Combined: � : r > 0, ♦ : r < 0
about Personal Grooming when listing their recent activities, or that Indian authors whoused words from the value theme of Honesty probably wrote more words from the GoingOut theme.
5.5.4 Applying Themes to Social Media Data
For the blog data, CBLOGS , we perform topic modeling procedures that are parallel to thosedescribed earlier, with one exception: due to an extreme diversity in the content of blogposts, the threshold at which rare words were removed was set to 1% in order to capturea greater breadth of information. We found that a large number of themes (nearly 60) wasrequired in order to maximize interpretability and keep unrelated topics from mixing. Here,we only present the themes that were later found to be most related to personal values.
62

Since value-relevant themes, TV ALUES , were established using the MEM on the valuesurvey essays, value-specific language can be captured in the blog data without the need fora separate MEM procedure to be conducted. Themes in Table 5.4, then, reflect a broader,more naturalistic set of concepts being discussed by bloggers in the real world (TBLOGS)that can then be linked with their value-relevant language as measured by computing s(d, t)for d ∈ CBLOGS and t ∈ SV ALUES . As was done in the value-behavior comparison usingonly the survey data, all words that appeared in any value theme were removed from allof the blog themes so that relationships were not confounded by predictor/criterion themepairs containing overlapping sets of words. We present the themes found when looking atblog posts from each culture individually as well as the full combined corpus in Table 5.5.
In this dataset, we saw a similar trend as in Table 5.3: the particular cultural composi-tion of the corpus changes the observed relationships. However, the association betweenthe Religion 1 blog theme and the Religion, Honesty, and Experiences value themes waspresent in both US and India when considered in isolation, as well as in the combinedcorpus. The Tech industry theme was negatively correlated with a large number of valuethemes, which alludes to the idea that the words in this theme are actually an indicatorof less value-related language in general. Many of the relationships found in one of the
Theme Example WordsReligion 1 jesus, glory, saint, angel, pray
Outdoorsman farm, hunt, wild, duty, branchGovernment government, department, organizationReligion 2 singh, religion, praise, habit, wise
Profiles french, russian, male, female, australiaPersonal life cry, job, sleep, emotion, smile
Financial sector, money, trade, profit, consumerSchool school, university, grade, teacher
Stock market trade, market, close, investor, fundTech industry software, google, microsoft, ceo
Sports league, play, win, team, scoreCooking recipe, delicious, prepare, mix, kitchen
US Politics washington, obama, debt, law, americaJob openings requirement, candidate, opening, talent
Crime murder, police, crime, incidentFilm industry direct, film, movie, actor, musicalIndia & China india, china, representative, minister
Space exploration mars, mission, space, flight, scientistEnvironment weather, earth, bird, storm, ocean
Indian city living delhi, financial, tax, capital, chennaiBeauty gold, pattern, hair, mirror, flower
Happy fashion clothes, funny, awesome, grand
Table 5.4: Sample themes extracted by the MEM from the blog data, along with examplewords.
63
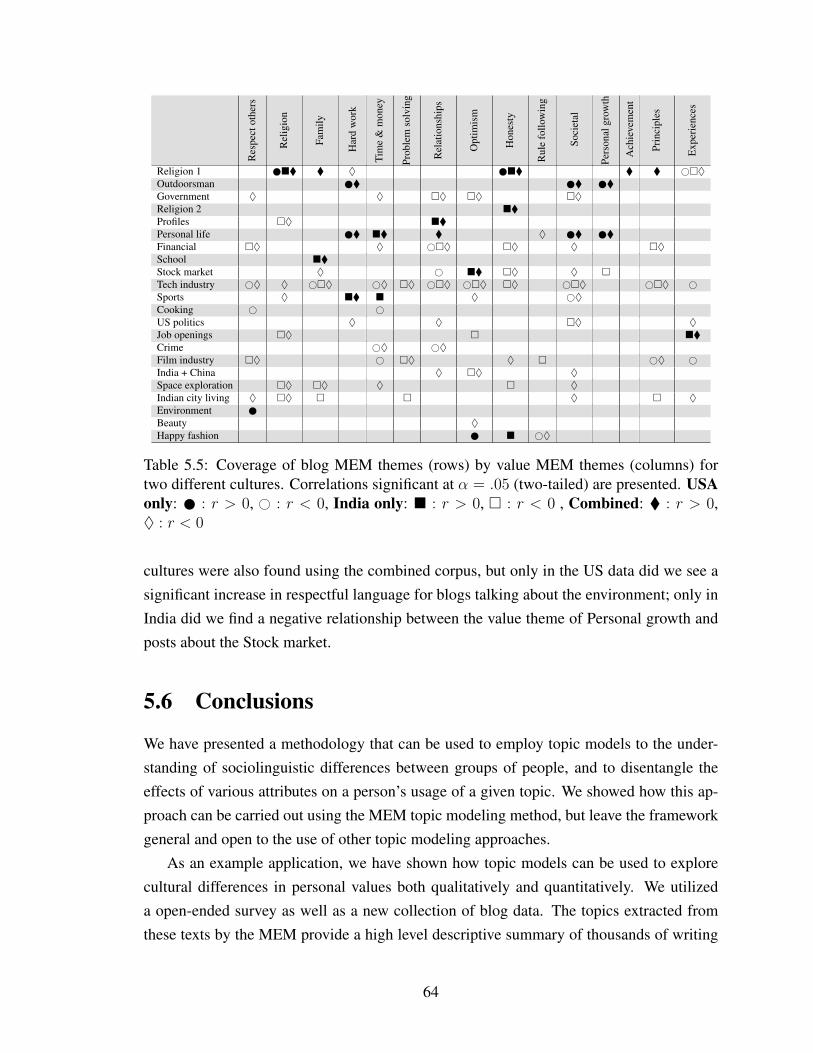
Res
pect
othe
rs
Rel
igio
n
Fam
ily
Har
dw
ork
Tim
e&
mon
ey
Prob
lem
solv
ing
Rel
atio
nshi
ps
Opt
imis
m
Hon
esty
Rul
efo
llow
ing
Soci
etal
Pers
onal
grow
th
Ach
ieve
men
t
Prin
cipl
es
Exp
erie
nces
Religion 1 �� � ♦ �� � � #�♦Outdoorsman � � �Government ♦ ♦ �♦ �♦ �♦Religion 2 ��Profiles �♦ ��Personal life � �� � ♦ � �Financial �♦ ♦ #�♦ �♦ ♦ �♦School ��Stock market ♦ # �� �♦ ♦ �Tech industry #♦ ♦ #�♦ #♦ �♦ #�♦ #�♦ �♦ #�♦ #�♦ #Sports ♦ �� � ♦ #♦Cooking # #US politics ♦ ♦ �♦ ♦Job openings �♦ � ��Crime #♦ #♦Film industry �♦ # �♦ ♦ � #♦ #India + China ♦ �♦ ♦Space exploration �♦ �♦ ♦ � ♦Indian city living ♦ �♦ � � ♦ � ♦Environment Beauty ♦Happy fashion � #♦
Table 5.5: Coverage of blog MEM themes (rows) by value MEM themes (columns) fortwo different cultures. Correlations significant at α = .05 (two-tailed) are presented. USAonly: : r > 0, # : r < 0, India only: � : r > 0, � : r < 0 , Combined: � : r > 0,♦ : r < 0
cultures were also found using the combined corpus, but only in the US data did we see asignificant increase in respectful language for blogs talking about the environment; only inIndia did we find a negative relationship between the value theme of Personal growth andposts about the Stock market.
5.6 Conclusions
We have presented a methodology that can be used to employ topic models to the under-standing of sociolinguistic differences between groups of people, and to disentangle theeffects of various attributes on a person’s usage of a given topic. We showed how this ap-proach can be carried out using the MEM topic modeling method, but leave the frameworkgeneral and open to the use of other topic modeling approaches.
As an example application, we have shown how topic models can be used to explorecultural differences in personal values both qualitatively and quantitatively. We utilizeda open-ended survey as well as a new collection of blog data. The topics extracted fromthese texts by the MEM provide a high level descriptive summary of thousands of writing
64
samples, and examining regression models gives insight into how some topics are useddifferently in US and India. We found that the underlying culture of the group of writers ofthe text has a significant effect on the conclusions that are drawn, particularly when lookingat value-behavior links. In the future, we hope to explore how well culture-specific themesare able to summarize texts from the cultures from which they are derived in comparisonwith themes that were generated using texts from many cultures. While we focused ondifferences between Indian and American people, the proposed approach could also beused to understand differences in topic usage between members of any groups, such asliberals vs. conservatives, computer scientists vs. psychologists, or at-risk individuals vs.the general population.
65

CHAPTER 6
Building and Evaluating a Hierarchical ValuesLexicon
6.1 Introduction
As evidenced in the previous chapters, content analysis of large text corpora is often a usefulfirst step in understanding, at a high level, what people are talking or writing about. Further,it can provide a means of quantifying a person or group’s focus on emotional, political,or social themes which may be of interest to researchers in the social and informationsciences. While unsupervised approaches such as topic modeling [15] can be useful indiscovering potentially meaningful themes within corpus, researchers often turn to lexicalresources that allow for the measurement of specific, pre-defined items such as those foundin the Linguistic Inquiry and Word Count [106], the General Inquirer [133], or WordnetDomains [84]. These domain- or concept-specific tools allow for greater control over thespecific type of content being measured, and the manually crafted category names providemeaningful labels for the themes being measured. Additionally, these resources are easy touse and scale to huge amounts of text, and the resulting counts are easy to interpret due totheir direct mapping to named categories.
The manual construction of these lexical resources often requires expert linguistic ordomain knowledge, and so a number of semi-supervised and crowdsourced approaches tolexicon generation have been proposed [135, 146, 60, 114, 91]. These approaches havebeen effective in the creation of lexical resources to measure sentiment, affect, and emo-tion where the categories to be measured are generally defined at the start of the process.Systems like Empath [43] allow users to quickly build new categories by providing sets ofseed words that represent the desired concepts. However, it may also be useful to allowpractitioners to define the set of categories to be measured later in the process for a numberof reasons: the categories may not always be initially known, or researchers may decide
66

to measure a concept at either a more general or specific granularity without creating anentirely new framework.
Rather than representing words belonging to a lexicon as a set of lists, we propose usinga hierarchical tree structure in which any node can be represented by a combination of thenodes that are its descendents. This allows for explicit modeling of hierarchical relation-ships between concepts, and facilitates a configurable level of specificity when measuringconcepts in the lexicon. For example, one researcher may want to measure positive emo-tions broadly, while another may want scores for more specific dimensions such as excite-ment, admiration, and contentment. A well-built hierarchical lexical resource can cater toeither, and once formed, can be reused for different purposes depending on the researchquestions being asked. While preexisting databases like WordNet [88] do contain somehuman defined structure, they do not provide the theme-specific structure that might berequired for certain tasks. WordNet also indexes word senses rather than words, requiringword sense disambiguation before using the resource to measure words in a text document,and it also organizes words more strictly based on their semantic meaning and a specificset of semantic relationships that may not fully capture the desired structure.
In this chapter, we introduce a crowd-powered approach for the creation of such ahierarchical lexicon for any theme given only a set of seed words that cover a variety ofconcepts within the theme. A theme could be anything from emotion to political discourse,and as an example of this approach, we create a resource that can be used to measure theexpression of personal values in text.1 Lastly, we demonstrate an evaluation framework thatcan be used to verify both the internal and external validity a lexical resource constructedusing our method.
6.2 Methodology
First, we collect a set of seed terms that can be used to initialize the lexicon creation process.These seeds should provide good coverage of the core concepts that will end up in thefinal lexical resource, but various ways of expressing these concepts do not all need tobe included. We embed the seed words into a vector space and cluster them hierarchically,and reorganize the initial structure using a human-powered tree sorting algorithm. Next, weautomatically expand the set of concepts to increase their coverage. The resulting expandedhierarchy can be used to measure content within texts at a configurable level of specificity.
1This new values lexicon, along with code that can be used to build an initial hierarchy, manage the human-powered sorting, and expand the sorted hierarchy can be found at: http://nlp.eecs.umich.edu/downloads.html
67

6.2.1 Hierarchy Initialization
Before beginning the crowd-powered sorting of the concepts, we create an initial hierarchythat represents a noisy sorting the seed terms. This will greatly reduce the workload ofthe crowd, lowering the lexicon construction time and cost, by only tasking workers withcorrecting this noise rather than sorting the concepts from scratch. To create this initialhierarchical structure, we first embed each of the words or phrases from the seed set intoa vector space using the Paragram model [139], which has been shown to perform com-petitively on a number of word- and phrase-level semantic similarity tasks. We representphrases by averaging the vector representations of the individual words in each phrase. Af-ter obtaining the embeddings, we compute the distance between every pair of words andphrases using cosine distance, providing us with a distance matrix. Given these distances,we use the scikit-learn library [104] to perform hierarchical agglomerate clustering on theword and phrase vectors in order to generate an initial hierarchy in the form of a tree, wherethe leaves of the tree are the seed words and phrases. However, this organization still hasroom for improvement: the embedding model only loosely approximate the meanings ofthe seed terms and the clustering algorithm is just one step toward achieving the desiredorganization of the concepts. Further, the tree is binary at this stage, which may not be aflexible enough representation to capture the relationships between the seed terms.
6.2.2 Crowd Powered Concept Sorting
Next, we turn to a human powered algorithm (Algorithm 1) to improve the initial sorting.Given an algorithmically pre-sorted, unordered tree T , we want to find a sorted tree T ′
such that each branch follows an organization that would be selected by a majority ofhuman annotators. We define a direct subtree of a tree, T , as a subtree, S, of T such thatthe root of S is a direct child of the root of T . We employ a recursive traversal of the treeduring which each direct subtree, S , of the current tree is sorted before sorting the currenttree itself. While sorting the current tree, it is possible that new subtrees are created, whichare not guaranteed to be sorted themselves. Therefore, we must also traverse the set ofsubtrees, U , that did not originally exist in the unsorted tree T , and sort them (or verify thatthey are already sorted).
In order to actually sort a particular tree or subtree, we first identify the current set ofgroups, G, which are derived from the set of direct subtrees of the current tree’s root. Eachgroup consists of one or more group-items, which are in turn represented as one or moreterms. For a given group, the group-items are comprised of the set of terms belonging tothe leaf nodes of each direct subtree of the group’s root node. For example, in Figure 6.1,
68

Algorithm 1: Crowd-powered Tree Sorting.Data: T : Tree to be sorted, n: number of annotators, m: maximum HIT extensionsResult: T ′: Sorted TreeFunction traverseAndSortTree(T , n, m)
if numChildren (T ) > 0 thenforeach S ∈ DirectSubtrees (T ) do
S ← traverseAndSortTree(S, n, m));
T ′ ← sortSubtree (T , n, m);foreach U ∈ (DirectSubtrees (T ′) \ DirectSubtrees (T )) doU ← traverseAndSortTree (U , n, m);
elseT ′ ← T ;
return T ′;Function sortSubtree (T , n, m)
G← makeGroups (DirectSubtrees (T ));H ← createHIT (G);n′ ← n;s← 0;while !s do
R← checkHITResults (H);if |R| ≥ n′ then
if majorityAgree (R) or n′ ≥ (m+ 1)× n thens← 1;T ′ ← mostCommon (R);
elseH ← extendHIT (H , n);n′ ← n′ + n;
return T ′;T ′ ← traverseAndSortTree(T , n, m);
the groups in G would be represented by subtrees with roots (1) and (2). The first group
would consist of the group-items in node (1)’s direct subtrees, so the two items would be“parents” and “mother, mom, father”. Regardless of the depth of a direct subtree, all wordsare combined into a single, flat list to abstract away the details of the subtree, making thesorting task less complicated for the annotators. Similarly, the second group would containtwo items: “brother” and “sister”.
To sort the groups in G, a Human Intelligence Task (HIT) is created in the AMT mar-ketplace where it can be completed by crowd workers. In the sorting interface, (Figure6.2) each group is represented as a column of stacked group-items, followed by an emptyspace where new group-items can be placed. Crowd workers are asked to drag and drop the
69

(1)
parents (3)
(4)
mom mother
father
(2)
brother sister
Figure 6.1: Example semantic tree structure.
group-items (displayed as blue boxes) into to the configuration that they believe best repre-sents a logical sorting of the group-items as semantic concepts. Within the cell representingeach group-item, a list of up to ten randomly sampled terms that belong to the group-item
are displayed so that the workers are able to glean the general concept that the group-item
represents. Users are able to create new, empty groups with the click of a button, if desired.Because only one possible tree can be attained when sorting two leaf nodes (i.e., a singlebranch for each node), subtrees consisting of two (or fewer) leaf nodes are considered tobe sorted a priori and do not require any human intervention.
After sorting, the users are asked to provide a label for each group, which can then beused as a label for the root node of the corresponding subtree. The label for a group couldbe identical to one of the terms belonging to the group if the workers feel that this term isparticularly representative of the group. If a group only contains a single group-item whichonly contains a single term, that term will remain the label for the group instead of adoptingthe crowd assigned label.
It is likely that multiple, reasonable configurations are possible. Our goal is to find theorganization that is preferred by a majority of annotators. At first, we create a fixed number(n) of identical tasks that are required to be completed by different crowd workers. If morethan n/2 workers sort the group − items in the same way, this configuration is acceptedas the majority view. However, if there is no majority view, we extend the HIT by creatingn additional tasks that must be completed by a new set of workers, and then checking fora majority view once again. This will be repeated a maximum of m times. After m HITextensions, when all n+n×m tasks have been completed, the most common configurationis accepted as the consensus view, regardless of whether or not a majority of the workersproduced this result (this is done to avoid extending ambiguous HITs indefinitely). Then,from the set of results that match the consensus configuration, the most common label foreach group is used to name the node that is the root of that group. All ties are broken
70
randomly, and empty groups are ignored.2 When checking for consensus, the group labels,the order of the groups themselves, and the order of the group-items with the columns arenot considered; only the unique sets of group-items that were assigned to each group. Inorder to encourage workers to select a reasonable arrangement of the concepts, we alsoadvertise and provide a bonus reward for all workers who submit the configuration thateventually is chosen as the consensus.
We then translate the consensus group configuration, G′, into the tree by rearrangingthe direct subtrees of the tree currently being sorted to reflect the set of groups selectedby the crowd. Recall that each group-item corresponds to an entire subtree in T . A treerepresenting each group is formed by making a link between the group tree’s root and theroot of each group-item tree. So, the branching factor will equal the number of group-items
that were placed into the group. Similarly, the current tree’s root will be connected to theroot of each group’s tree, with a branching factor of |G′|, the number of groups in theconsensus configuration. Non-leaf nodes with a branching factor of one will be replacedwith their children.
As an example, consider the HIT displayed in Figure 6.2. Figure 6.3 shows the treesthat would result from various user actions during the sorting task. It is possible that theconcepts are already sorted in a desirable configuration. Workers are not forced to makechanges and are allowed to simply “verify” that the current organization is suitable (theyare still asked to provide labels for the groups). The tree that would result from takingno sorting action on the example HIT is displayed in Figure 6.3a. On the other hand, aworker might decide that the concepts of “harmony” and “unity” do not belong together,and that “service” and “harmony” actually belong in the same grouping, separate from”unity”. In this case, the worker can drag the box containing “harmony” into the empty cellbelow “service” so that these items are now members of the same group, resulting in treedisplayed in Figure 6.3b. Yet another option would be to place all three items in the samegroup, which gives tree shown in Figure 6.3c. Note that this is equivalent to placing eachgroup-item into a separate group of size one, since nodes with a branching factor of onewill be replaced with their children. In the first two cases, the dummy label (1) in Figure6.3 would be replaced with the most common text-based label assigned to the subtree bycrowd workers.
2Note that this may cause instability in the organization of the hierarchy when running the sorting algo-rithm multiple times, even with the same set of humans providing the same labels. If stability across runs isparamount to the application, a deterministic approach can be used to make these decisions, such as keepingthe configuration that is most similar to the starting configuration, or the strict tree structure of the hierarchycould be relaxed to allow for two possible sortings to coexist (the implications of this change would requirefurther investigation and validation).
71

Figure 6.2: Example sorting interface
6.2.3 Lexicon Expansion
Next we seek to improve the coverage of this hierarchy by expanding the set of seeds thatrepresent a given subtree to include other semantically related words. We achieve this goalusing an iterative expansion process that leverages the structure of the sorted tree. First, weobtain a vector representation for node of the tree by averaging together the embeddings ofall terms contained in leaf nodes that are descendents of that node. Then, a set of candidateterms is generated by searching a set of vectors learned from a very large backgroundcorpus. A good background corpus should include examples of the seed terms in contextsthat exemplify the word senses and domain in which the lexicon is intended to be applied.For example, to successfully expand a lexicon of biological terms, a background corpusof scientific literature would be more appropriate than a news corpus. For a given nodevector, the top k most similar word vectors to the node vector are selected as the expansioncandidates (the node’s expansion list).
If all candidates were accepted with a large enough k, it is very likely that siblings,
72
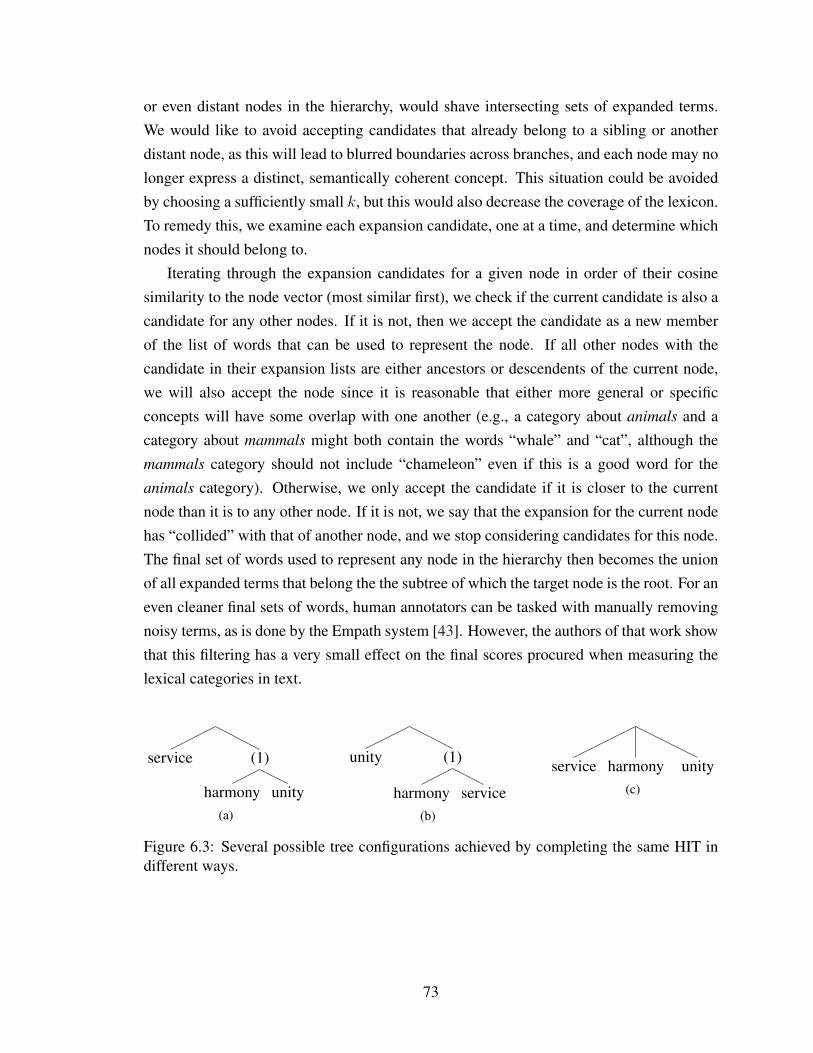
or even distant nodes in the hierarchy, would shave intersecting sets of expanded terms.We would like to avoid accepting candidates that already belong to a sibling or anotherdistant node, as this will lead to blurred boundaries across branches, and each node may nolonger express a distinct, semantically coherent concept. This situation could be avoidedby choosing a sufficiently small k, but this would also decrease the coverage of the lexicon.To remedy this, we examine each expansion candidate, one at a time, and determine whichnodes it should belong to.
Iterating through the expansion candidates for a given node in order of their cosinesimilarity to the node vector (most similar first), we check if the current candidate is also acandidate for any other nodes. If it is not, then we accept the candidate as a new memberof the list of words that can be used to represent the node. If all other nodes with thecandidate in their expansion lists are either ancestors or descendents of the current node,we will also accept the node since it is reasonable that either more general or specificconcepts will have some overlap with one another (e.g., a category about animals and acategory about mammals might both contain the words “whale” and “cat”, although themammals category should not include “chameleon” even if this is a good word for theanimals category). Otherwise, we only accept the candidate if it is closer to the currentnode than it is to any other node. If it is not, we say that the expansion for the current nodehas “collided” with that of another node, and we stop considering candidates for this node.The final set of words used to represent any node in the hierarchy then becomes the unionof all expanded terms that belong the the subtree of which the target node is the root. For aneven cleaner final sets of words, human annotators can be tasked with manually removingnoisy terms, as is done by the Empath system [43]. However, the authors of that work showthat this filtering has a very small effect on the final scores procured when measuring thelexical categories in text.
service (1)
harmony unity(a)
unity (1)
harmony service(b)
service harmony unity(c)
Figure 6.3: Several possible tree configurations achieved by completing the same HIT indifferent ways.
73

6.2.4 Using a Hierarchical Lexicon
A category can be selected by choosing a target node that represents the category, and ascore can be assigned to any piece of text for any category by computing the frequencyof words and phrases in the text that belong to the category. As before, words the belongto a category are found by taking the union of all terms in leaf nodes that are descendentsof the category’s root node. To increase coverage even further (at the loss of syntacticform), words in both the lexicon and the target text can be lemmatized before frequenciesare calculated. Due to the hierarchical structure of the lexicon, scores for more general ormore specific versions of any category can be quickly obtained by selecting a higher orlower node in the hierarchy.
6.3 Evaluating Lexicons
We explore a series of evaluation methods to test the effectiveness of any newly createdhierarchical lexicon.3 Each of these evaluations can be generally applied to any dictionary-like lexical resource. With these methods, we seek to answer the following three evaluationquestions:
1. Does the lexicon produce reasonable scores for documents that are known before-
hand to be related to the theme of the lexicon?
2. Are the categories in the lexicon comprised of semantically coherent sets of words?
3. Do the categories in the lexicon actually measure meaningful concepts?
A good hierarchical lexicon should lead to an answer of “yes” to each question. In thefollowing sections, we describe approaches that can be used to quantitatively answer them.
6.3.1 Frequency Testing
As a simple yet informative first step, we measure the frequency of a set of pre-selectedcategories on documents that are known to be related to concepts in the lexicon. This willprovide a preliminary understanding of the coverage and relative scores produced by thenew resource, and it will help us to answer the first evaluation question. For example,a lexicon created to measure political language should certainly produce non-zero scoresfor many categories when applied to a corpus of political texts. Further, documents from
3Yiting Shen contributed to the discussion of methodology and development of software used to carry outthe topic modeling evaluations described here.
74

left-wing media sources should achieve higher scores for categories intended to measureconcepts such as liberalism than categories about conservative politics.
6.3.2 Word Intrusion Choose Two
Next, we employ a coherence method borrowed from the topic modeling literature: WordIntrusion Choose Two (WICT) [92], which is a modified version of the Word Intrusiontask [29]. The premise of this approach is that for a set of semantically related words, itshould be easy for humans to detect randomly inserted words that do not belong to theset. Coherence is determined by presenting some words from the same category to humanjudges along with an intruder word that does not belong to that category. The intrudershould be a word that is semantically distant from the category being evaluated, but itshould be a member of one of the other categories (otherwise, the intruder might be easyto detect simply because it is not related to the theme or the lexicon at all, or it may bea very uncommon word). If most, or all, of the human judges can correctly identify theintruder, then the set of true category words is said to be “coherent”. This coherence isquantified for category c within model m using the Model Precision measure:
MPmc = pturk(wm
c,i)
where wmc is the set of words chosen to represent category c by model m, pturk(wm
c,k) is theobserved probability of a crowd worker selecting the kth word in wm
c as an intruder word,and i is the index of the intruder word.
WICT adds a slight modification to this: for each category, judges are asked to identifytwo intruders even though only one actually exists. For a coherent category, two condi-tions must be met: First, all (or most) of the human judges should choose the true intruderas one of their guesses; second, the judges’ other guesses should follow a uniform randomdistribution across all of the true category words. If any of the true category words is se-lected much more often than the others, then this word does not appear to semanticallyfit quite as well as the others. To quantify the coherence of a category, Model PrecisionChoose Two for category c within model m is computed as:
MPCTmc = H(pturk(wm
c,1), . . . , pturk(wmc,n))
where H(·) is the Shannon Entropy [37], and n is the total number of words displayed tothe judges. Higher values indicate more even distributions, and therefore more coherentcategories.
75
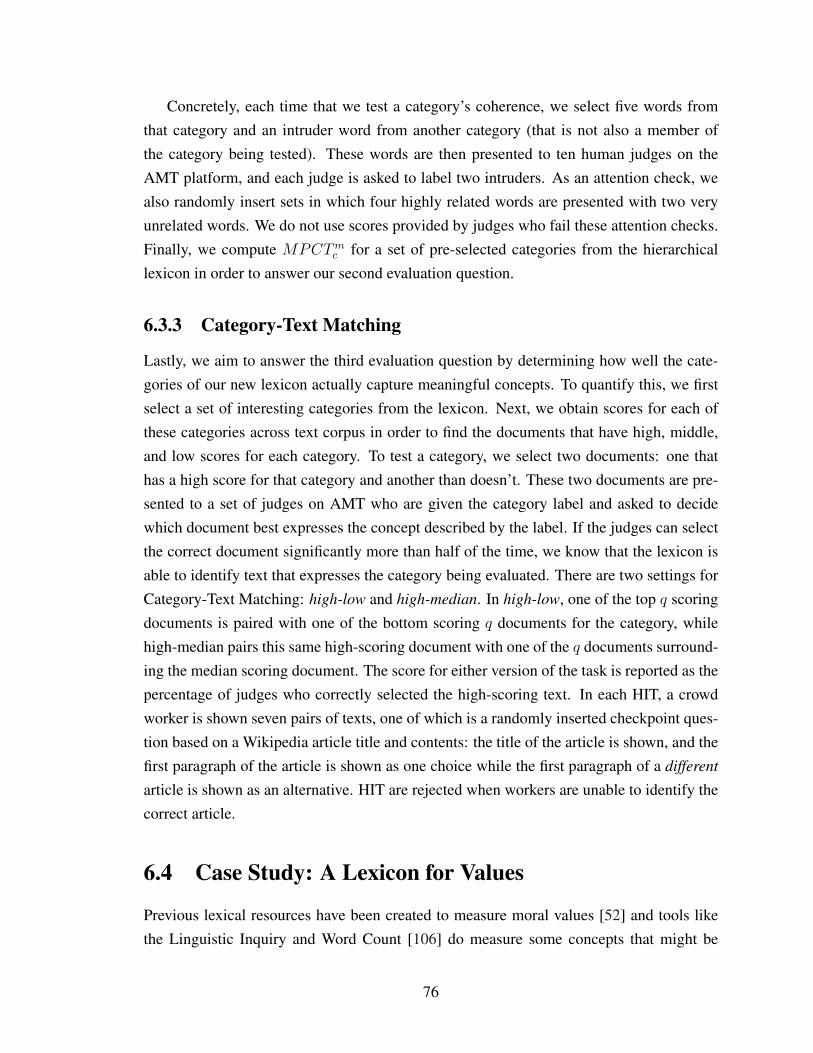
Concretely, each time that we test a category’s coherence, we select five words fromthat category and an intruder word from another category (that is not also a member ofthe category being tested). These words are then presented to ten human judges on theAMT platform, and each judge is asked to label two intruders. As an attention check, wealso randomly insert sets in which four highly related words are presented with two veryunrelated words. We do not use scores provided by judges who fail these attention checks.Finally, we compute MPCTm
c for a set of pre-selected categories from the hierarchicallexicon in order to answer our second evaluation question.
6.3.3 Category-Text Matching
Lastly, we aim to answer the third evaluation question by determining how well the cate-gories of our new lexicon actually capture meaningful concepts. To quantify this, we firstselect a set of interesting categories from the lexicon. Next, we obtain scores for each ofthese categories across text corpus in order to find the documents that have high, middle,and low scores for each category. To test a category, we select two documents: one thathas a high score for that category and another than doesn’t. These two documents are pre-sented to a set of judges on AMT who are given the category label and asked to decidewhich document best expresses the concept described by the label. If the judges can selectthe correct document significantly more than half of the time, we know that the lexicon isable to identify text that expresses the category being evaluated. There are two settings forCategory-Text Matching: high-low and high-median. In high-low, one of the top q scoringdocuments is paired with one of the bottom scoring q documents for the category, whilehigh-median pairs this same high-scoring document with one of the q documents surround-ing the median scoring document. The score for either version of the task is reported as thepercentage of judges who correctly selected the high-scoring text. In each HIT, a crowdworker is shown seven pairs of texts, one of which is a randomly inserted checkpoint ques-tion based on a Wikipedia article title and contents: the title of the article is shown, and thefirst paragraph of the article is shown as one choice while the first paragraph of a different
article is shown as an alternative. HIT are rejected when workers are unable to identify thecorrect article.
6.4 Case Study: A Lexicon for Values
Previous lexical resources have been created to measure moral values [52] and tools likethe Linguistic Inquiry and Word Count [106] do measure some concepts that might be
76
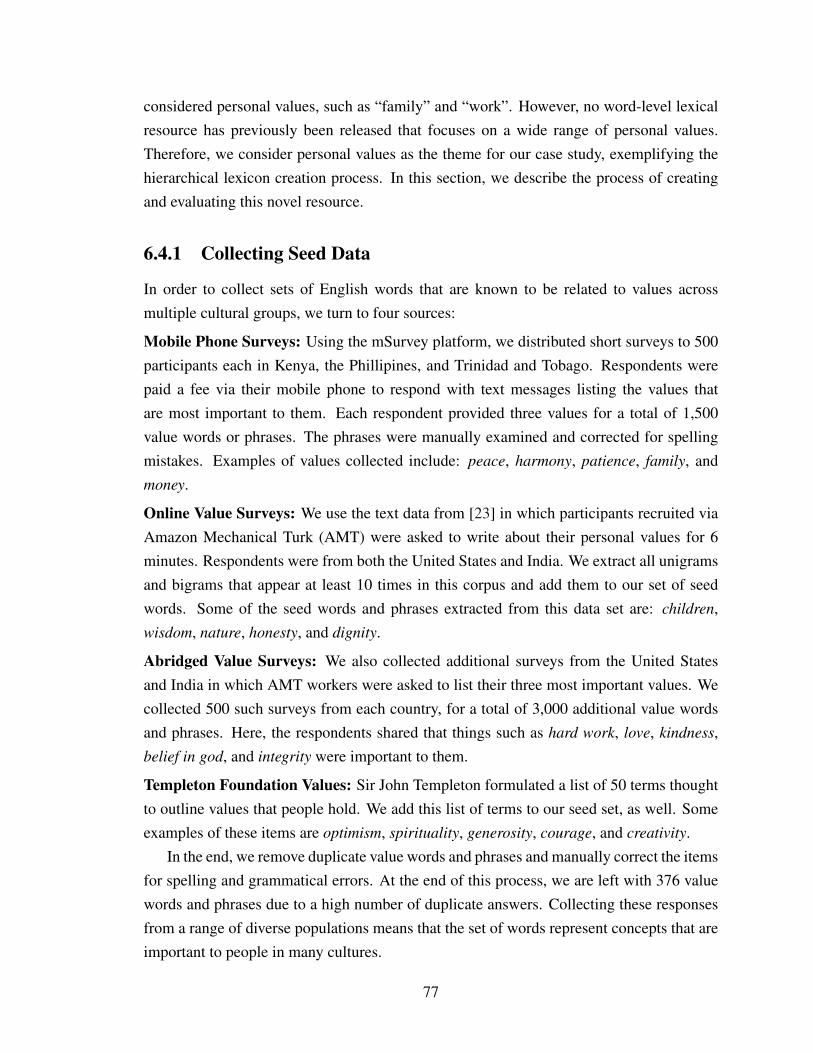
considered personal values, such as “family” and “work”. However, no word-level lexicalresource has previously been released that focuses on a wide range of personal values.Therefore, we consider personal values as the theme for our case study, exemplifying thehierarchical lexicon creation process. In this section, we describe the process of creatingand evaluating this novel resource.
6.4.1 Collecting Seed Data
In order to collect sets of English words that are known to be related to values acrossmultiple cultural groups, we turn to four sources:
Mobile Phone Surveys: Using the mSurvey platform, we distributed short surveys to 500participants each in Kenya, the Phillipines, and Trinidad and Tobago. Respondents werepaid a fee via their mobile phone to respond with text messages listing the values thatare most important to them. Each respondent provided three values for a total of 1,500value words or phrases. The phrases were manually examined and corrected for spellingmistakes. Examples of values collected include: peace, harmony, patience, family, andmoney.
Online Value Surveys: We use the text data from [23] in which participants recruited viaAmazon Mechanical Turk (AMT) were asked to write about their personal values for 6minutes. Respondents were from both the United States and India. We extract all unigramsand bigrams that appear at least 10 times in this corpus and add them to our set of seedwords. Some of the seed words and phrases extracted from this data set are: children,wisdom, nature, honesty, and dignity.
Abridged Value Surveys: We also collected additional surveys from the United Statesand India in which AMT workers were asked to list their three most important values. Wecollected 500 such surveys from each country, for a total of 3,000 additional value wordsand phrases. Here, the respondents shared that things such as hard work, love, kindness,belief in god, and integrity were important to them.
Templeton Foundation Values: Sir John Templeton formulated a list of 50 terms thoughtto outline values that people hold. We add this list of terms to our seed set, as well. Someexamples of these items are optimism, spirituality, generosity, courage, and creativity.
In the end, we remove duplicate value words and phrases and manually correct the itemsfor spelling and grammatical errors. At the end of this process, we are left with 376 valuewords and phrases due to a high number of duplicate answers. Collecting these responsesfrom a range of diverse populations means that the set of words represent concepts that areimportant to people in many cultures.
77
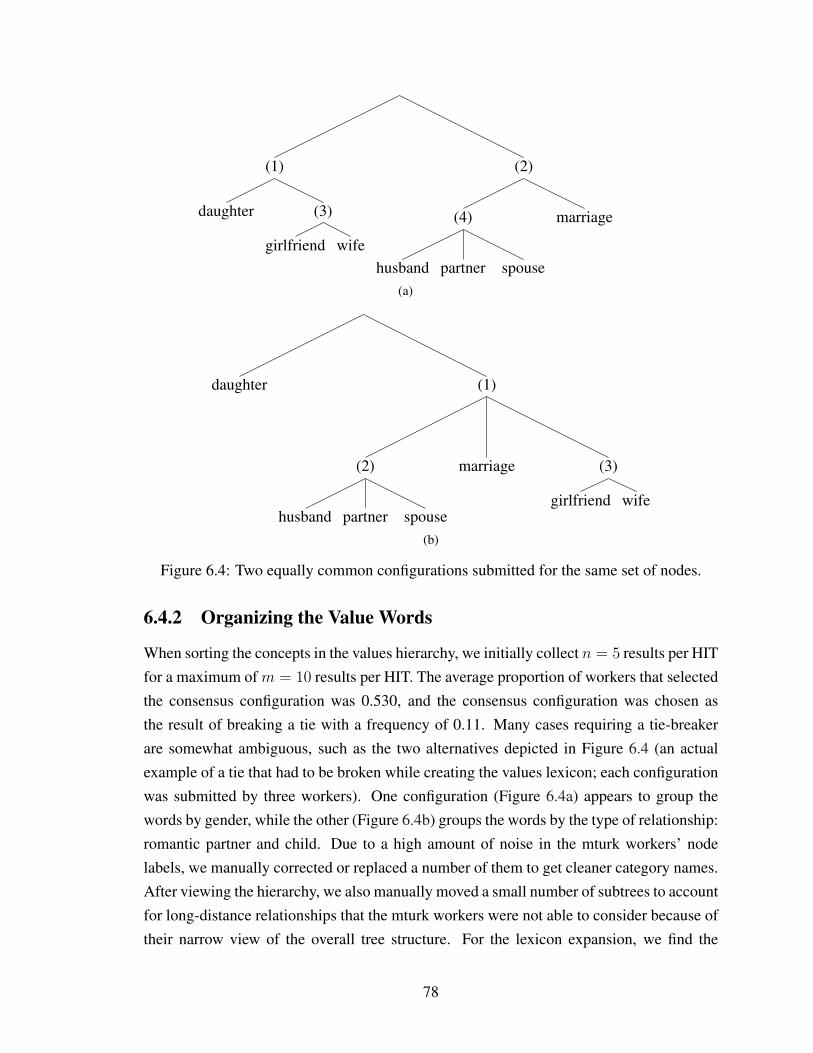
(1)
daughter (3)
girlfriend wife
(2)
(4)
husband partner spouse
marriage
(a)
daughter (1)
(2)
husband partner spouse
marriage (3)
girlfriend wife
(b)
Figure 6.4: Two equally common configurations submitted for the same set of nodes.
6.4.2 Organizing the Value Words
When sorting the concepts in the values hierarchy, we initially collect n = 5 results per HITfor a maximum of m = 10 results per HIT. The average proportion of workers that selectedthe consensus configuration was 0.530, and the consensus configuration was chosen asthe result of breaking a tie with a frequency of 0.11. Many cases requiring a tie-breakerare somewhat ambiguous, such as the two alternatives depicted in Figure 6.4 (an actualexample of a tie that had to be broken while creating the values lexicon; each configurationwas submitted by three workers). One configuration (Figure 6.4a) appears to group thewords by gender, while the other (Figure 6.4b) groups the words by the type of relationship:romantic partner and child. Due to a high amount of noise in the mturk workers’ nodelabels, we manually corrected or replaced a number of them to get cleaner category names.After viewing the hierarchy, we also manually moved a small number of subtrees to accountfor long-distance relationships that the mturk workers were not able to consider because oftheir narrow view of the overall tree structure. For the lexicon expansion, we find the
78

counter-fitted paragram vector space [93] provided the cleanest and most coherent sets ofexpansion candidates. We set the number of expansion candidates at k = 100.
Cog
nitio
n
Em
otio
n
Fam
ily
Lea
rnin
g
Opt
imis
m
Rel
atio
nshi
ps
Rel
igio
n
Res
pect
Soci
ety
Wea
lth
/r/christian 1.96 0.68 0.92 0.56 0.19 1.82 6.26 1.51 3.74 0.48/r/college 1.34 0.57 0.39 3.73 0.10 0.95 0.26 1.79 3.08 1.26/r/finance 1.29 0.29 0.09 1.26 0.17 0.58 0.04 1.01 2.07 3.20/r/family 1.54 0.60 5.58 0.60 0.10 7.20 0.10 2.04 3.55 0.89/r/love 2.63 1.21 0.39 0.33 0.23 1.79 0.85 1.75 4.72 0.39/r/mentalhealth 2.43 1.20 0.57 0.40 0.18 1.12 0.05 1.62 3.77 0.73/r/mom 1.36 0.50 4.38 0.51 0.10 5.08 0.08 1.73 3.93 0.91/r/money 1.58 0.16 0.42 0.61 0.06 0.91 0.00 1.13 2.94 5.29/r/parenting 1.23 0.38 3.92 0.68 0.12 5.08 0.10 1.78 2.76 0.81/r/positivity 2.35 1.05 0.36 0.46 2.74 1.13 0.48 1.40 4.71 0.64/r/work 1.25 0.38 0.21 0.44 0.10 0.73 0.03 1.75 2.98 1.22
Table 6.1: Average category word frequency × 100 for selected value categories measuredon content from various topical online communities.
6.4.3 Evaluation
For the Frequency Testing evaluation, we collect a corpus of recent posts from a set ofReddit4 online communities (subreddits) focused on topics that are expected to be relatedto personal values (e.g., /r/family, /r/christian) and apply the lexicon to these texts in orderto verify that categories related to the community are expressed to a higher degree thanother categories (Table 6.1). Many of the results are expected, such as high scores for theReligion category (includes words like pray, jesus, divinity) in the /r/christian category andhigh scores for the Wealth category (includes revenue, wage, and cash) in the /r/moneyposts. Interestingly, the Relationships category, which is a supercategory of the Familycategory, actually has the highest score for the posts in /r/family. This is likely because theRelationships category contains words from the Family category in addition to others likecompanion, buddy, and coworker.
For the Word Intrusion Choose Two task, we evaluate each category five times, eachtime querying ten unique judges on AMT. The scores in Table 6.2 show the regular ModelPrecision (MP; frequency with which judges correctly identified the intruder) and the
4reddit.com
79
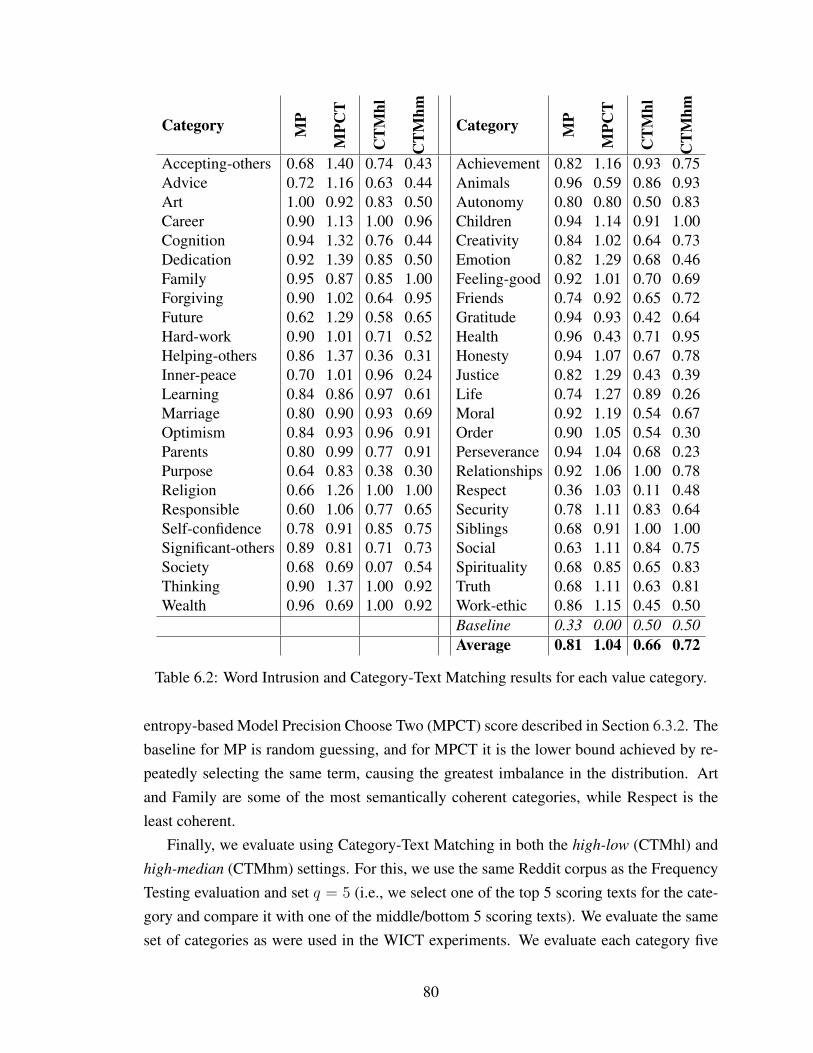
Category MP
MPC
T
CT
Mhl
CT
Mhm
Category MP
MPC
T
CT
Mhl
CT
Mhm
Accepting-others 0.68 1.40 0.74 0.43 Achievement 0.82 1.16 0.93 0.75Advice 0.72 1.16 0.63 0.44 Animals 0.96 0.59 0.86 0.93Art 1.00 0.92 0.83 0.50 Autonomy 0.80 0.80 0.50 0.83Career 0.90 1.13 1.00 0.96 Children 0.94 1.14 0.91 1.00Cognition 0.94 1.32 0.76 0.44 Creativity 0.84 1.02 0.64 0.73Dedication 0.92 1.39 0.85 0.50 Emotion 0.82 1.29 0.68 0.46Family 0.95 0.87 0.85 1.00 Feeling-good 0.92 1.01 0.70 0.69Forgiving 0.90 1.02 0.64 0.95 Friends 0.74 0.92 0.65 0.72Future 0.62 1.29 0.58 0.65 Gratitude 0.94 0.93 0.42 0.64Hard-work 0.90 1.01 0.71 0.52 Health 0.96 0.43 0.71 0.95Helping-others 0.86 1.37 0.36 0.31 Honesty 0.94 1.07 0.67 0.78Inner-peace 0.70 1.01 0.96 0.24 Justice 0.82 1.29 0.43 0.39Learning 0.84 0.86 0.97 0.61 Life 0.74 1.27 0.89 0.26Marriage 0.80 0.90 0.93 0.69 Moral 0.92 1.19 0.54 0.67Optimism 0.84 0.93 0.96 0.91 Order 0.90 1.05 0.54 0.30Parents 0.80 0.99 0.77 0.91 Perseverance 0.94 1.04 0.68 0.23Purpose 0.64 0.83 0.38 0.30 Relationships 0.92 1.06 1.00 0.78Religion 0.66 1.26 1.00 1.00 Respect 0.36 1.03 0.11 0.48Responsible 0.60 1.06 0.77 0.65 Security 0.78 1.11 0.83 0.64Self-confidence 0.78 0.91 0.85 0.75 Siblings 0.68 0.91 1.00 1.00Significant-others 0.89 0.81 0.71 0.73 Social 0.63 1.11 0.84 0.75Society 0.68 0.69 0.07 0.54 Spirituality 0.68 0.85 0.65 0.83Thinking 0.90 1.37 1.00 0.92 Truth 0.68 1.11 0.63 0.81Wealth 0.96 0.69 1.00 0.92 Work-ethic 0.86 1.15 0.45 0.50
Baseline 0.33 0.00 0.50 0.50Average 0.81 1.04 0.66 0.72
Table 6.2: Word Intrusion and Category-Text Matching results for each value category.
entropy-based Model Precision Choose Two (MPCT) score described in Section 6.3.2. Thebaseline for MP is random guessing, and for MPCT it is the lower bound achieved by re-peatedly selecting the same term, causing the greatest imbalance in the distribution. Artand Family are some of the most semantically coherent categories, while Respect is theleast coherent.
Finally, we evaluate using Category-Text Matching in both the high-low (CTMhl) andhigh-median (CTMhm) settings. For this, we use the same Reddit corpus as the FrequencyTesting evaluation and set q = 5 (i.e., we select one of the top 5 scoring texts for the cate-gory and compare it with one of the middle/bottom 5 scoring texts). We evaluate the sameset of categories as were used in the WICT experiments. We evaluate each category five
80
times, using ten judges each time. The scores reported in Table 6.2 are the per-categoryaveraged scores across all judges and trials. For both settings, the baseline is randomguessing. The high-scoring Religion and Siblings texts were easiest for human judges todifferentiate from other texts, while high scoring Work-ethic and Order texts were essen-tially indistinguishable from random texts, indicating that these categories are unreliableand may need to be removed from the final set of categories to be used.
6.5 Conclusions
We have proposed a methodology for the creation of hierarchical lexicons with any theme,including a crowd-powered sorting algorithm and tree-based lexicon expansion. Researchersonly need to provide a set of seed terms that are related to the theme of the lexicon and pro-vide some high-level oversight during the lexicon creation process. To show the utility ofthis approach, we create a lexical resource for the measurement of personal values in textdata and release this resource to the community. The values lexicon achieves promisingresults across a series of evaluation methods designed to test both intrinsic and extrinsicvalidity.
81

CHAPTER 7
Refining Computational Representations ofHuman Behaviors
7.1 Introduction
Our everyday behaviors say a lot about who we are. The things we do are related to ourpersonality [3], interests [51], what we are going to do next [99], and central to this disser-tation, our behaviors are connected to our values [120]. While we cannot always directlyobserve what people are doing on a day-to-day basis, we have access to a large numberof unstructured text sources that describe real-world human activity, such as news outletsand social media sites. Fiction and nonfiction writings often revolve around the things thatpeople do, and even encyclopedic texts can be rich in descriptions of human activities.Although many common sources of text contain human activities, reasoning about theseactivities and their relationships to one another is not a trivial task. Descriptions of humanactions are fraught with ambiguity, subjectivity, and there are multitudinous lexically dis-tinct ways to express highly similar events. If we want to gain useful insights from thesedata, it should be beneficial to develop effective systems that can successfully represent,compare, and ultimately understand human activity phrases.
In this chapter, we consider the task of automatically determining the strength of a re-lationship between two human activities,1 which can be helpful in reasoning about textsrich with activity-based content, and for building models that are able to incorporate infor-mation about human activities in a more sophisticated way than, say, using a topic model,which only captures activities in a very broad, generic sense, and only at the word-level.In reality, the relationship between a pair of activities might be similarity in a strict sense,such as watching a film and seeing a movie, or a more general relatedness, such as the
1Throughout this chapter, we use the word “activity” to refer to what a person does or has done. Unlikethe typical use of this term in the computer vision community, in this chapter we use it in a broad sense, toalso encompass non-visual activities such as “make vacation plans” or “have a dream”.
82

relationship between turn on an oven and bake a pie. Another way to categorize a pairof activities is by the degree to which they are typically done with a similar motivation,like eating dinner with family and visiting relatives. Or, in order to uncover which otherbehaviors a person is likely to exhibit, it might be useful to determine how likely a personmight be to do an activity given some information about previous real-world actions thatthey have taken.
Success on our proposed task will be a valuable step forward for multiple lines of re-search, especially within the computational social sciences where human behavior and itsrelation to other variables (e.g., personal values, personality traits, or political orientation)is a key focus. Since the language human activities is so varied, it is not enough to storeexact representations of activity phrases that are unlikely to appear many times. It would beuseful to instead have methods that can automatically find related phrases and group thembased on one (or more) of several dimensions of interest. Moreover, the ability to auto-matically group related activities will also benefit research in video-based and multimodalhuman activity recognition where there is need for inference about activities based on theirrelationships to one another.
Reasoning about the relationships between activity phrases brings with it many of thedifficulties often associated with phrase-level semantic similarity tasks. It is not enough toknow that the two phrases share a root verb, as the semantic weight of verbs can vary, suchas the word “go” in the phrases go to a bar and go to a church. While these phrases havehigh lexical overlap and are similar in that they both describe a traveling type of activity,they are usually done for different motivations and are associated with different sets of otheractivities. In this case, we could only consider the main nouns (i.e., “bar” and “church”),but that approach would cause difficulties when dealing with other phrases such as sell
a car and drive a car, which both involve an automobile but describe dissimilar actions.Therefore, successful systems should be able to properly focus on the most semanticallyrelevant tokens with a phrase. A final challenge when dealing with human activity phraserelations is evaluation. There should be a good way to determine the effectiveness of a sys-tem’s ability to measure relations between these types of phrases, yet other commonly usedsemantic similarity testbeds (e.g., those presented in various Semeval tasks [2, 1, 86]) arenot specifically focused on the domain of human activities. Currently, it is unclear whetheror not the top-performing systems on general phrase similarity tasks will necessarily leadto the best results when looking specifically at human activity phrases.
To address these challenges, we introduce a new task in automatically identifying thestrength of human activity phrase relations. We construct a dataset consisting of pairsof activities reportedly performed by actual people. The pairs that we have collected aim
83

specifically to showcase diverse phenomena such as pairs containing the same verb, a rangeof degrees of similarity and relatedness, pairs unlikely to be done by the same type ofperson, and so forth. These pairs are each annotated by multiple human judges across thefollowing four dimensions:
• Similarity: The degree to which the two activity phrases describe the same thing.Here we are seeking semantic similarity in a strict sense. Example of high similarityphrases: to watch a film and to see a movie.
• Relatedness: The degree to which the activities are related to one another. Thisrelationship describes a general semantic association between two phrases. Exampleof strongly related phrases: to give a gift and to receive a present.
• Motivational Alignment: The degree to which the activities are (typically) donewith similar motivations. Example of phrases with potentially similar motivations:to eat dinner with family members and to visit relatives.
• Perceived Actor Congruence: The degree to which the activities are often done bythe same type of person. Put another way, does knowing that a person often performsan activity increase human judges’ expectation that this person will also often do asecond activity? Example of activities that might be expected to be done by the sameperson: to pack a suitcase and to travel to another state.
These relational dimensions were selected to cover a variety of types of relationshipsthat may hold between two activity phrases. This way, automated methods that captureslightly different notions of similarity between phrases will potentially be able to performwell when evaluated on different scales. While the dimensions are correlated with oneanother, we show that they do in fact measure different things. We provide a set of bench-marks to show how well previously successful phrase-level similarity systems perform onthis new task. Furthermore, we introduce several modifications and novel methods thatlead to increased performance on the task.
7.2 Related Work
Semantic similarity tasks have been recently dominated by various methods that seek toembed segments of text as vectors into some high-dimensional space so that comparisonscan be made between them using cosine similarity or other vector based metrics. Whileword embeddings have existed in various forms in the past [32, 11], many approaches used
84
today draw inspiration directly from shallow neural network based models such as thosedescribed in [87].2 In the common skip-gram variant of these neural embedding models,a neural network is trained to predict a word given its context within some fixed windowsize. [77] and [9] extended the idea of context to incorporate dependency structures into thetraining process, leading to vectors that were able to better capture certain types of long-distance syntactic relationships. One of the major strengths of neural word embeddingmethods is that they are able to learn useful representations from extremely large corporathat can then be leveraged as a source of semantic knowledge on other tasks of interest,such as predicting word analogies [109] or the semantic similarity and relatedness of wordpairs [59].
Researchers have taken the powerful semi-supervised ability of these word embeddingmethods to aid in tasks at the phrase-level, as well. The most straightforward way to accom-plish a phrase-level representation is to use some binary vector-level operation to composepre-trained vector representations of individual words that belong to a phrase [90]. Othermethods have sought to directly find embeddings for larger sequences of words, such as[74] and [66].
Semantic textual similarity tasks are often evaluated by computing the correlation be-tween human judgements of similarity and machine output. The wordsim353 [45] andsimlex999 [56] resources provide a set of human annotated pairs of words, labeled forsimilarity and/or general association. Simverb-3500 [49] was introduced to provide re-searchers with a testbed for verb relations, a specific yet important class of words that wasless common in earlier word-level similarity data sets. SemEval has released a series ofsemantic text similarity tasks at varying levels of granularity, ranging from words to entiredocuments, such as the SICK (Sentences Involving Compositional Knowledge) dataset [86]which is specifically crafted to evaluate the ability of systems to effectively compose indi-vidual word semantics in order to achieve the overall meaning of a sentence. While manyof these evaluation sets contain human activities to some degree, they also have containother types of words or phrases due to the way in which they were created. For example,SICK contains actions done by animals such as follow a fish. Similarly, Simverb-3500 con-tains verbs that don’t necessarily describe human activities, like chirp and glow, and doesnot contain phrase-level activities.
Several recent works have raised concerns over the standard evaluation approaches usedin semantic textual similarity tasks. One potential issue is the use of inadequate metrics de-
2It is worth noting that [78] show that these embeddings are actually implicitly factorizing a shiftedversion of a more traditional PMI word-context matrix, which is similar to the word co-occurrence matrixfactorization approach used in [109]).
85
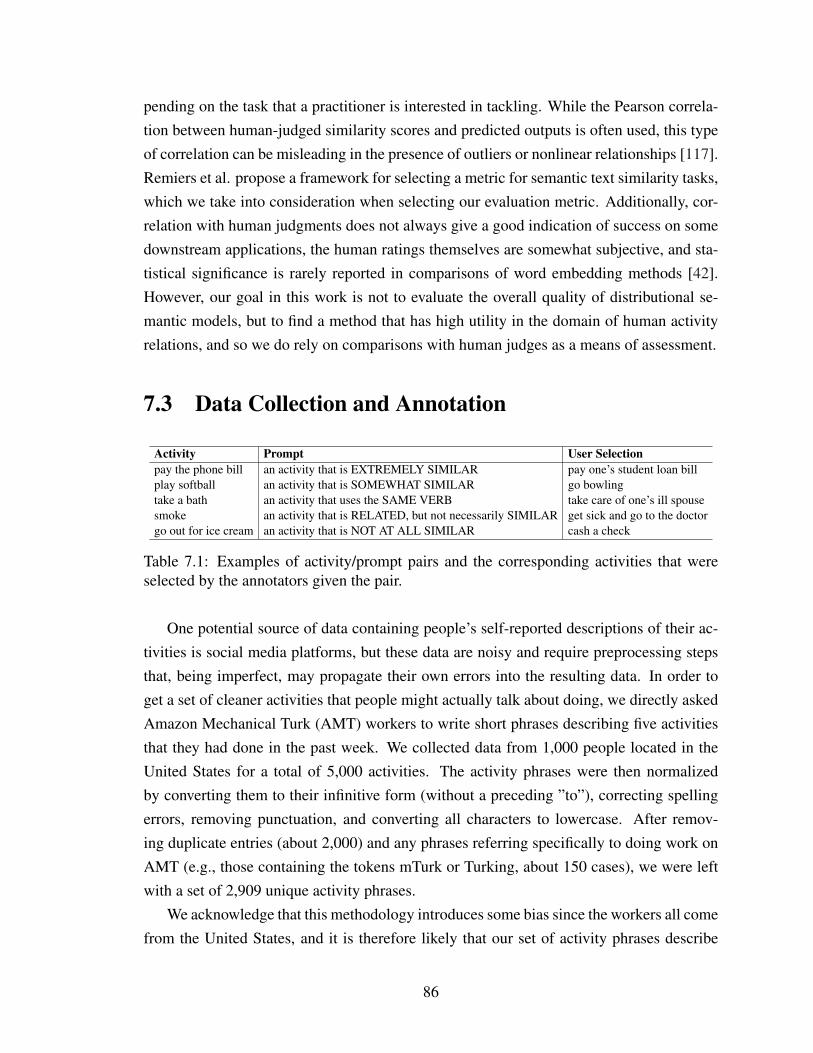
pending on the task that a practitioner is interested in tackling. While the Pearson correla-tion between human-judged similarity scores and predicted outputs is often used, this typeof correlation can be misleading in the presence of outliers or nonlinear relationships [117].Remiers et al. propose a framework for selecting a metric for semantic text similarity tasks,which we take into consideration when selecting our evaluation metric. Additionally, cor-relation with human judgments does not always give a good indication of success on somedownstream applications, the human ratings themselves are somewhat subjective, and sta-tistical significance is rarely reported in comparisons of word embedding methods [42].However, our goal in this work is not to evaluate the overall quality of distributional se-mantic models, but to find a method that has high utility in the domain of human activityrelations, and so we do rely on comparisons with human judges as a means of assessment.
7.3 Data Collection and Annotation
Activity Prompt User Selectionpay the phone bill an activity that is EXTREMELY SIMILAR pay one’s student loan billplay softball an activity that is SOMEWHAT SIMILAR go bowlingtake a bath an activity that uses the SAME VERB take care of one’s ill spousesmoke an activity that is RELATED, but not necessarily SIMILAR get sick and go to the doctorgo out for ice cream an activity that is NOT AT ALL SIMILAR cash a check
Table 7.1: Examples of activity/prompt pairs and the corresponding activities that wereselected by the annotators given the pair.
One potential source of data containing people’s self-reported descriptions of their ac-tivities is social media platforms, but these data are noisy and require preprocessing stepsthat, being imperfect, may propagate their own errors into the resulting data. In order toget a set of cleaner activities that people might actually talk about doing, we directly askedAmazon Mechanical Turk (AMT) workers to write short phrases describing five activitiesthat they had done in the past week. We collected data from 1,000 people located in theUnited States for a total of 5,000 activities. The activity phrases were then normalizedby converting them to their infinitive form (without a preceding ”to”), correcting spellingerrors, removing punctuation, and converting all characters to lowercase. After remov-ing duplicate entries (about 2,000) and any phrases referring specifically to doing work onAMT (e.g., those containing the tokens mTurk or Turking, about 150 cases), we were leftwith a set of 2,909 unique activity phrases.
We acknowledge that this methodology introduces some bias since the workers all comefrom the United States, and it is therefore likely that our set of activity phrases describe
86
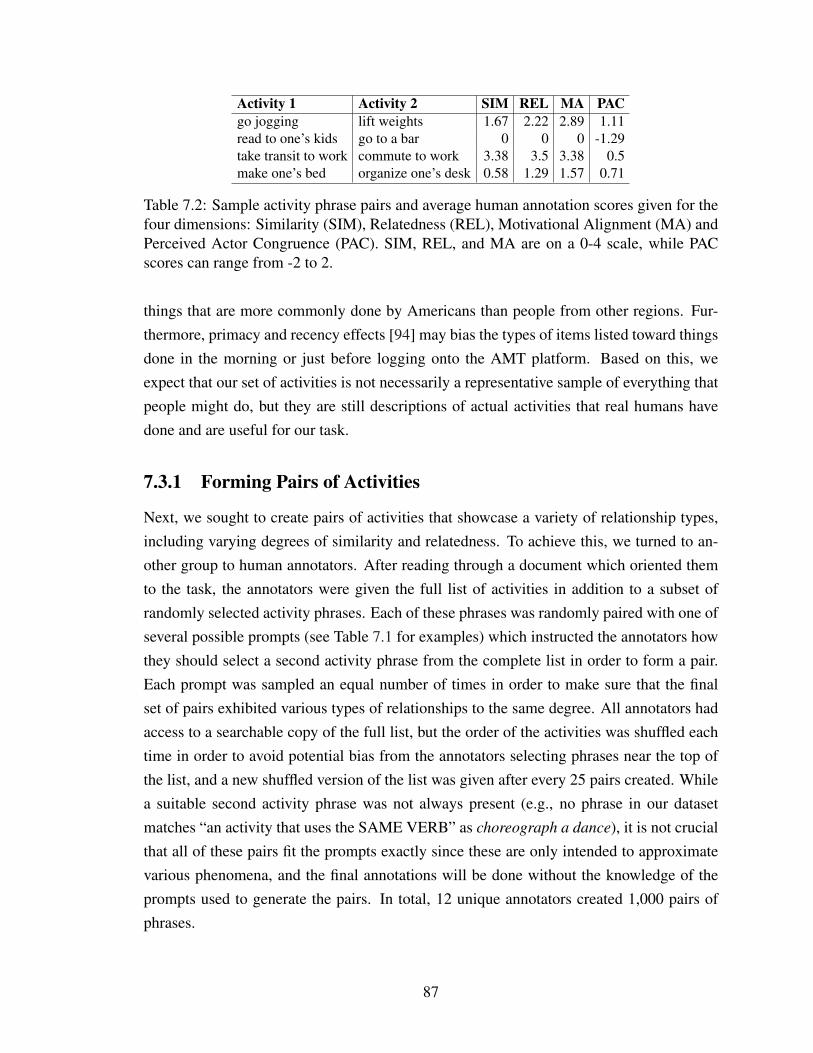
Activity 1 Activity 2 SIM REL MA PACgo jogging lift weights 1.67 2.22 2.89 1.11read to one’s kids go to a bar 0 0 0 -1.29take transit to work commute to work 3.38 3.5 3.38 0.5make one’s bed organize one’s desk 0.58 1.29 1.57 0.71
Table 7.2: Sample activity phrase pairs and average human annotation scores given for thefour dimensions: Similarity (SIM), Relatedness (REL), Motivational Alignment (MA) andPerceived Actor Congruence (PAC). SIM, REL, and MA are on a 0-4 scale, while PACscores can range from -2 to 2.
things that are more commonly done by Americans than people from other regions. Fur-thermore, primacy and recency effects [94] may bias the types of items listed toward thingsdone in the morning or just before logging onto the AMT platform. Based on this, weexpect that our set of activities is not necessarily a representative sample of everything thatpeople might do, but they are still descriptions of actual activities that real humans havedone and are useful for our task.
7.3.1 Forming Pairs of Activities
Next, we sought to create pairs of activities that showcase a variety of relationship types,including varying degrees of similarity and relatedness. To achieve this, we turned to an-other group to human annotators. After reading through a document which oriented themto the task, the annotators were given the full list of activities in addition to a subset ofrandomly selected activity phrases. Each of these phrases was randomly paired with one ofseveral possible prompts (see Table 7.1 for examples) which instructed the annotators howthey should select a second activity phrase from the complete list in order to form a pair.Each prompt was sampled an equal number of times in order to make sure that the finalset of pairs exhibited various types of relationships to the same degree. All annotators hadaccess to a searchable copy of the full list, but the order of the activities was shuffled eachtime in order to avoid potential bias from the annotators selecting phrases near the top ofthe list, and a new shuffled version of the list was given after every 25 pairs created. Whilea suitable second activity phrase was not always present (e.g., no phrase in our datasetmatches “an activity that uses the SAME VERB” as choreograph a dance), it is not crucialthat all of these pairs fit the prompts exactly since these are only intended to approximatevarious phenomena, and the final annotations will be done without the knowledge of theprompts used to generate the pairs. In total, 12 unique annotators created 1,000 pairs ofphrases.
87
7.3.2 Annotating Activity Pairs
All of the activity phrase pairs were uploaded to AMT in order to be labeled. For eachpair, ten workers were asked to rate the similarity, relatedness, motivational alignment, andperceived actor congruence on a 5-point Likert-type scales (a total of 40,000 annotated datapoints). The workers were given a set of instructions that included descriptions of the fourtypes of relationships with examples, including cases in which a pair might be related butnot similar, motivationally aligned but not similar, etc. By asking the same set of people tolabel all four relational dimensions for a given pair, we hoped to make them cognizant ofthe differences between the scales.
The first three relationships were prompted for using the form: “To what degree arethe two activities similar/related/of the same motivation?” and were coded as 0 (e.g., forresponses of “not at all similar”) and the integers 1-4 with 4 representing the strongestrelationship. Perceived actor congruence was solicited for using the form: “Person A oftendoes activity 1, while person B rarely does activity 1. Who would you expect to do activity
2 more often?” with choices ranging from “Most likely Person B” to “Most likely PersonA.” Perceived actor congruence ranges from -2 to 2 and has the lowest score when PersonB is chosen and the highest when Person A is chosen. A score of 0 on this scale means thatjudges were unable to determine whether Person A or Person B would be more likely toperform the action being asked about (i.e., activity 2). Each individual Human IntelligenceTask (HIT) posted to AMT required an annotator to label 25 pairs so that we could reliablycompute agreement, and a worker could complete as many HITs as they desired.
To remove potential spammers (annotators seeking quick payment who do not followthe task instructions), we first eliminated all annotations by any AMT workers who leftitems blank or selected the same score for every item for any of the four relationships in anyof their completed HITs. Then, inter-annotator agreement was computed by calculating theSpearman correlation coefficient ρ between each annotator’s scores and the average scoresof all other AMT workers who completed the HIT, excluding those already thrown out dur-ing spammer removal. We then removed any annotations from workers whose agreementscores were more than three standard deviations below the mean agreement score for theHIT under the assumption that these workers were not paying attention to the pairs whenselecting scores.
The final scores for each pair were assigned by taking the average AMT worker scorefor each relationship type. Some sample activities and their ratings are shown in Table 7.2.Averaged across all four relationship types, there is a good level of inter-annotator agree-ment at ρ = .720 (recomputed after spammer removal). The highest levels of agreementwere found for similarity and relatedness (ρ = .768 for both), which is to be expected as
88

SIM REL MA PACSIM 1.000 .962 .928 .735REL 1.000 .932 .776MA 1.000 .738PAC 1.000
Table 7.3: Spearman correlations between the four relational dimensions: Similarity(SIM), Relatedness (REL), Motivational Alignment (MA) and Perceived Actor Congru-ence (PAC).
these are somewhat less subjective than motivational alignment (ρ = .745) and perceivedactor congruence (ρ = .620). These agreement scores can be treated as an upper boundfor performance on this task; achieving a score higher than these would mean that an auto-mated system is as good at ranking activity phrases as the average human annotator.
7.3.3 Relationships Between Dimensions
While the four relationship types being measured are correlated with one another (Table7.3), there were certainly cases in which humans gave different scores for each relationshiptype to the same pair which shed light on the nuanced differences between the dimensions.(Table 7.4). Therefore, it is not necessarily the case that the best method for capturing onedimension is also the most correlated with human judgements across all four dimensions.However, it appears that similarity, relatedness, and motivational alignment are more highlycorrelated with one another than perceived actor congruence.
7.4 Methods
To determine how well automated systems are able to model humans’ judgements of sim-ilarity, relatedness, motivational alignment, and perceived actor congruence, we evaluate agroup of semantic textual similarity systems that are either commonly used or have shownstate-of-the-art results. Each method takes two texts of arbitrary length as input and pro-duces a continuous valued score as output. All of the methods are trained on outside datasources and many have been proposed as generalized embeddings that can be successfulacross many tasks. The methods we assess fall into three different categories: ComposedWord-level Embeddings, Graph-based Embeddings, and Phrase-level Embeddings.
Activity Phrase Pre-processing. For the first two classes of methods, we experiment withseveral variations in the set of words being passed to the model as input in order removethe influence of potentially less semantically important words. We do not apply these pre-
89

SIM REL Activity 1 Activity 2↑ ↑ call one’s mom call dad↑ ↓ - -↓ ↑ rake leaves mow the lawn↓ ↓ go for a run shop at a thrift store
SIM MA Activity 1 Activity 2↑ ↑ check facebook check twitter↑ ↓ drive to missouri go on a road trip↓ ↑ write a romantic letter kiss one’s spouse↓ ↓ cut firewood trim one’s beard
SIM PAC Activity 1 Activity 2↑ ↑ make a cherry pie bake a birthday cake↑ ↓ have dinner with friends eat by oneself↓ ↑ go to the gym take a shower↓ ↓ read a novel go to a party
REL MA Activity 1 Activity 2↑ ↑ gamble go to the casino↑ ↓ go swimming clean the pool↓ ↑ clean out old email vacuum the house↓ ↓ study abstract algebra go to the state fair
REL PAC Activity 1 Activity 2↑ ↑ eat cereal eat a lot of food↑ ↓ homeschool one’s child drive one’s child to school↓ ↑ cut the grass talk to neighbors↓ ↓ eat at a restaurant cook beans from scratch
MA PAC Activity 1 Activity 2↑ ↑ go to the dentist brush one’s teeth↑ ↓ take the train to work drive to work↓ ↑ walk one’s dog walk to the store↓ ↓ read watch football all day
Table 7.4: Activity pairs from our dataset highlighting stark differences between the fourrelational dimensions. For each dimension, ↑ refers to phrases rated at least one full pointabove the middle value along the Likert scale, while ↓ indicates a score at least one fullpoint below the middle value. No pairs with high similarity and low relatedness exist in thedata.
processing approaches to the phrase-level embedding methods since those methods aredesigned specifically to operate on entire phrases (as opposed to the bag-of-words viewthat the other methods take). The five variations of each phrase we consider are:Full: The original phrase in its entirety.Simplified: Starting with the Full phrase, we remove several less semantically relevant
90

edges from a dependency parse3 of the phrase, including the removal of determiners, coor-dinating conjunctions, adjectival modifiers, adverbs, and particles. This step is somewhatsimilar to performing stopword removal. For example, this filtering step would result in thebag of words containing “clean”, “living” and “room” for full phrase: clean up the living
room.Simplified - Light Verbs: Starting with the Simplified set of words, we remove the rootverb of the activity if it is not the only word in the Simplified phrase and if it belongs to thefollowing list of semantically light verbs [64]: “go”, “make”, “do”, “have”, “get”, “give”,“take”, “let”, “come”, and “put”. This means that we would convert the phrase go get a
tattoo to just get a tattoo, but read a novel would retain its verb and become read novel
(i.e., it will remain equivalent to the Simplified variation).Simplified - All Verbs: To compare against the effect of removing light verbs, this ap-proach takes the Simplified phrase and removes the root verb unless the Simplified phraseonly contains that one word. Performing this filtering step would convert the phrase cook
a sausage to simply sausage.Core: This method seeks to reduce the phrase to a single core concept. In many cases, thismeans simply using the root verb from the dependency parse. So, we might represent thephrase “clean up the living room” using only the word embedding for “clean”. However,we acknowledge that semantically light verbs such as “go”, “have”, and “do” would notadequately represent an entire activity, and so in the case of light verbs we instead selecteither the direct object or a nominal modifier that is connected to the root verb. If the nounselected as the core concept has another noun attached by a compound relationship, we alsoinclude that noun. This means, for example, that we would represent the phrase “go to anamusement park” as just “amusement park” when we are considering just the core concept.
7.4.1 Composed Word-level Embeddings
The methods in this section are based on word-level embeddings trained on some outsidedata. Since they operate at a word level, we apply a composition function to the words in agiven phrase in order to achieve an embedding for the phrase. We tested both the arithmeticmean and element-wise multiplication for composition functions, but the former gave betterperformance and thus we do not report results found when using the element-wise product.Given an aggregate embedding for a phrase, we generate a score for each pair of activityphrases by computing the cosine similarity between the embeddings for the two phrases.We consider the following word-level methods:
3We use the dependency parser from Stanford CoreNLP (http://stanfordnlp.github.io/CoreNLP/).
91

Wiki-BOW: Skip Gram with Negative Sampling Word Embeddings trained on Wikipediadata using a context window of size 2 (Wiki-BOW2) and size 5 (Wiki-BOW5). Thesevectors are the same ones used in [77].Wiki-DEP: Skip Gram with Negative Sampling Word Embeddings trained on Wikipediadata with dependency-based contexts (Wiki-DEP) from [77].GoogleNews: Skip Gram with Negative Sampling Word Embeddings trained on the GoogleNews corpus from [87].Paragram: Embeddings trained on the Paraphrase Database [47] by fitting the embed-dings so that the difference between the cosine similarity of actual paraphrases and thatof negative examples is maximized[139]. We use the Paragram-Phrase XXL embeddingscombined with the Paragram-SL999 embeddings, the latter of which has been tuned onSimLex999 [56]. We also use a variation of Paragram Embeddings that employs counterfitting (Paragram-CF). This method further tunes the Paragram embeddings to capture amore strict sense of similarity rather than general association between words. This is ac-complished via optimization with the goal of increasing the vectorspace differences be-tween known antonyms and altering synonym embeddings to make them more similar toone another [93].Nondistributional vectors: Highly sparse vectors that encode a huge number of binaryvariables that capture interesting features about the words such as part of speech, sentiment,and supersenses [41].
7.4.2 Graph-Based Embeddings
We also experiment with approaches that seek to incorporate higher order relationshipsbetween activity phrases by building semantic graphs that can be exploited to discoverrelations that hold between the phrases. Each graph G is of the form G = (V,E) where Vis a set of human activity phrases and E is some measure of semantic similarity, which iscomputed differently depending on the graph type. We run Node2vec [53] using the defaultsettings to generate an embedding for each node in the graph and then measure the cosinesimilarity between nodes (phrases) to get the final system output. The types of graphs thatwe use are:Similarity Graph: We first generate a fully connected graph of all activities in our datasetusing a high performing semantic similarity method (Paragram in this case) as a way togenerate edge weights. Next, we prune all edges with a weight less than some thresh-old. The results reported here use a threshold of .5 (on a 0-1 continuous scale). We alsotried threshold values of .3, .4, and .6., but found them to produce inferior results for all
92
dimensions.People Graph: For each activity, we know at least four other activities that were done bythe same person because each person submitted five activities. We add an unweighted edgeto the graph for each pair of activities that were done by the same person. On its own, thisgraph does not have enough information to be competitive, so we only report results for thecombined graph.Combined Graph: Here, we combine information from both the Similarity Graph andthe People Graph. Since the People Graph is unweighted, we follow the approach used in[137] and compute the average weight of all edges in the Similarity Graph and assign thisweight to all edges in the People Graph. We then add the edge weights of the two graphs,treating nonexistant edges as edges with weight 0.
7.4.3 Phrase-level Embeddings
The methods in this section are designed to create an embedding directly from phrases ofarbitrary length. Since these approaches are tailored toward phrases in their entirety, wedo not evaluate them on the pre-processed variations of the phrases in our dataset. Thephrase-level approaches we consider are:Skip-thoughts vectors: This encoder-decoder model induces sentence level vectors bylearning to predict surrounding sentences of each sentence in a large corpus of books [66].The encoder is a recurrent neural network (RNN) which creates a vector from the words inthe input sentence, and the RNN decoder generates the neighboring sentences. The modelalso learns a linear mapping from word-level embeddings into the encoder space to handlerare words that may not appear in the training corpus.Charagram embeddings: Embeddings that represent character sequences (i.e., words orphrases) based on an elementwise nonlinear transformation of embeddings of the charactern-grams that comprise the sequence [140]. Here we use the pre-trained charagram-phrasemodel.
7.5 Results
Because human annotations should fall on an ordinal scale rather than a ratio scale, it wouldnot be fair to directly compare the average values human judges gave to the systems’ output.Rather, the systems should be evaluated based on their ability to rank the set of phrases inthe same order as the ranking given by the average human annotations scores for eachdimension. Therefore, we calculate the Spearman Rank correlation between scores given
93

Method SIM REL MA PAC
Full
phra
se
Wiki-BOW-2 .434 .395 .383 .230Wiki-BOW-5 .480 .446 .431 .268Wiki-DEP .388 ,346 ,339 .191GoogleNews .550 .528 .514 .343Paragram .578 .554 .530 .363Paragram-CF .487 .455 .434 .276Sim Graph .508 .489 .460 .330+ People Graph .520 .502 .467 .340Skip-thoughts .435 .408 .411 .276Charagram .566 .550 .520 .381*
Sim
plifi
edWiki-BOW-2 .532 .501 .475 .316Wiki-BOW-5 .563 .537 .507 .342Wiki-DEP .499 .463 .443 .284GoogleNews .606* .582* .552* .383*Paragram .616* .594* .560* .397*Paragram-CF .617* .592* .556* .394*Sim Graph .533 .520 .478 .340+ People Graph .543 .533 .492 .350
-Lig
htV
erbs
Wiki-BOW-2 .523 .500 .481 .315Wiki-BOW-5 .565 .545 .522 .350Wiki-DEP .484 .457 .443 .280GoogleNews .618* .599* .577* .394*Paragram .639* .623* .595* .418*Paragram-CF .637* .618* .587* .416*Sim Graph .577 .572 .534 .360+ People Graph .584 .576 .535 .375
-All
Ver
bs
Wiki-BOW-2 .434 .436 .419 .334Wiki-BOW-5 .482 .492 .469 .381*Wiki-DEP .395 .392 .379 .290GoogleNews .529 .542 .515 .425*Paragram .547 .566 .541 .445*Paragram-CF .522 .538 .510 .435*Sim Graph .417 .452 .417 .363+ People Graph .433 .468 .432 .379
Cor
eO
nly
Wiki-BOW-2 .360 .321 .316 .153Wiki-BOW-5 .402 .364 .363 .184Wiki-DEP .319 .276 .274 .108GoogleNews .436 .394 .393 .209Paragram .444 .401 .402 .223Paragram-CF .438 .397 .397 .225Sim Graph .330 .281 .291 .146+ People Graph .334 .283 .293 .134Human Agree. .768 .768 .745 .620
Table 7.5: Spearman correlation between phrase similarity methods and human annotationsacross four annotated relations: Similarity (SIM), Relatedness (REL), Motivational Align-ment (MA) and Perceived Actor Congruence (PAC). Top performing methods for each di-mension are in bold font. * indicates correlation coefficient is not statistically significantlylower than the best method for that relational dimension (α = .05).
94
by the automated systems and the human judges our final score for each system. In aprevious study of evaluation metrics for intrinsic semantic textual similarity tasks, thismetric was recommended for tasks in which the ranking of all items is important [117].Results for all methods using all phrase variations are shown in Table (Table 7.5).
For our dataset, Paragram in the Simplified - Light Verbs setting gives the best resultsfor similarity, relatedness, and motivational alignment. It is somewhat expected that thesame method has the best performance for these three dimensions as they are strongly cor-related with one another. Paragram in the Simplified - All Verbs setting gives the best resulton perceived actor congruence. We can see that removing light verbs is a helpful step formost methods when trying to predict similarity, relatedness, and motivational alignmentindicating that light verbs mostly add noise to the overall meaning of the phrases. Inter-estingly, the best results for perceived actor congruence come when ignoring all root verbsin longer phrases. This was a filtering step that led to decreased performance when rank-ing across the other three dimensions. This suggests that for determining perceived actorcongruence, the context of the action found within a phrase is more important than the ac-tion itself. Based on statistical significance testing (Z-test using Fisher r-z transformation,single-tailed), however, we cannot be confident that all of these results will hold for largersets of human activity phrase pairs, as several other methods had scores that were not foundto be significantly lower than the best methods.
7.5.1 Transfer Learning
In addition to the previously described methods, we also explore the use of transfer learningmethods to fine-tune large, pretrained models from other semantic similarity tasks so thatthey can be applied to the human activity similarity tasks4. In order achieve this, a trainingset of human activity data is required. Therefore, we collect 1373 additional annotatedpairs of human activity phrases in the same format as before, randomly choosing 1000 fortraining and 373 for development. We then treat the original 1000 pairs as a held-out testset so that our results are directly comparable with those reported above.
We experiment on the following pre-trained sentence encoders, which have recentlyachieved state-of-the-art results on various downstream tasks, including semantic similar-ity.
Infersent [34]: a bi-directional LSTM with max pooling trained on the Stanford Natu-ral Language Inference (SNLI) dataset [18] and Multi-Genre Natural Language Inferencecorpus [143].
4Work in this subsection is the result of a collaboration with Harry Zhang.
95

Gated Recurrent Averaging Network (GRAN) [142]: a paraphrastic compositionalmodel that combines LSTM and averaging word embeddings, trained on sentence pairsobtained by aligning Simple English to standard English Wikipedia (Simple-Wiki dataset)[36].
BiLTSM-Avg [141, 142]: a bi-directional LSTM model that averages all hidden vectorsto generate the sentence embedding which has a large dimension of 4096, trained on theback-translated Czeng1.6 corpus [16] (PARANMT-50M).
Following Pan and Yang [100], we denote the source dataset that a sentence encoderhas trained on as S (usually large), and the semantic similarity target dataset as T (usu-ally small). We denote the word embedding matrix weights as wem, the sentence encoderweights as enc, and the output classifier weights as cla. For each of the models listed above,we consider a number of transfer approaches:
Unsupervised evaluation: The model is only trained on S and then evaluated on T .During evaluation, some distance metric is calculated between the embeddings of two sen-tences as the predicted score. In this setting, wem and enc are frozen, meaning that they donot receive gradients and are not updated, and cla does not exist. Technically, no transferlearning is applied.
Feature transfer: The model is first trained on S, learning wem and enc in the process.When transferring to T , a classifier with randomly initialized weights is trained to makepredictions using the sentence embeddings produced by the encoder as input features. Thisis equivalent to using a new model whose wem and enc are initialized as learned in S andwhose cla is initialized randomly. In this setting, wem and enc are frozen and only cla isupdated while training on T .
Network transfer: This setting is also commonly called fine-tuning [116]. Like featuretransfer, the model is trained on both S and T and evaluated on T , and a classifier is addedon top to produce the predicted score. However, while training on T , in addition to learningthe cla parameters, either enc or both wem and enc are updated, while the other parametersare frozen.
Direct network transfer: We propose this transfer learning setting, which is special-ized for semantic similarity tasks, in which the cosine similarity of sentence embeddingpairs is directly used in the loss function during transfer learning. More details about thismethod can be found in [151].
In each experiment, we use Adam [65] as optimizer and tune the batch size over{32, 64}, the learning rate over {0.1, 0.01, 0.001, 0.0001} and the number of epochs over{10, 30, 50}. For each dataset in the rest of this paper, we tune these hyperparameters onthe development set. When the transfer setting is feature transfer, network transfer or direct
96

Datasets SIM REL MA PACBiLSTM-Avg [UE] .649 .639 .603 .469BiLSTM-Avg [FT] .534 .514 .474 .412BiLSTM-Avg [NT] µ .576 .575 .529 .456BiLSTM-Avg [NT] b .571 .571 .526 .453BiLSTM-Avg [DNT] µ .699 .688 .660 .470BiLSTM-Avg [DNT] b .691 .680 .646 .462GRAN [UE] .644 .642 .596 .444GRAN [FT] .561 .576 .526 .392GRAN [NT] µ .575 .567 .523 .375GRAN [NT] b .578 .560 .510 .385GRAN [DNT] µ .668 .663 .624 .407GRAN [DNT] b .668 .666 .623 .413InferSent [UE] .701 .686 .652 .525InferSent [FT] .655 .644 .608 .432InferSent [NT] µ .699 .692 .672 .537InferSent [DNT] µ .702 .722 .691 .572
Table 7.6: The performance of transfer settings for three models, reported as Spearman’sρ. The lock icon indicates freezing the word embedding matrix weights (wem), and theunlock icon indicates updating them. Note that wem of InferSent must be frozen due to itsimplementation constraints. For each dataset, the best transfer result per-model is listed inbold font, and the best overall result is underlined.
network transfer, we experiment with both MSE loss and KL Divergence loss and bothfreezing and updating wem weights. However, the architecture of InferSent uses a fixedwem, meaning that it has to be frozen. We use early stopping as regularization. All hyper-parameters not mentioned maintain their values from the original code. Results shown inthis section use the mean squared error loss.
We find that leveraging the power of pretrained deep-learning models provides a hugeadvantage over the off-the-shelf approaches, even with rule based filtering. The Direct Net-work Transfer approach, when applied to the InferSent sentence encoder model, gives thebest overall performance on the human activities task, beginning to approach human per-formance on the task. However, it should be worth noting that the transfer learning methodshad access to additional training data that were not utilized by the methods reported in theprevious section, giving the transfer learning approaches a distinct advantage.
97
7.6 Conclusions
In this chapter, we addressed the task of measuring semantic relations between humanactivity phrases. We introduced a new dataset consisting of human activity pairs that havebeen annotated based on their similarity, relatedness, motivational alignment, and perceivedactor congruence. Using this dataset, we evaluated a number of semantic textual similar-ity methods to automatically determine scores for each of the four dimensions, and foundthat similarity between averaged paragram embeddings of the simplified phrases with lightverbs removed was highly correlated with human judgments of similarity, relatedness, andmotivational alignment and could achieve these results in an off-the-shelf manner. Sim-ilarly, a method that yielded strong results for the perceived actor congruence dimensionalso used the paragram embeddings, but for this dimension it was more used to averageacross the simplified phrases with all verbs removed. Transfer learning approaches led toeven more gain on this task, with the Direct Network Transfer approach giving the highestoverall correlation with human judgments.
Despite the work that has been done, we believe there is still room for improvement onthis task, and we hope that the release of our data will encourage greater participation onthis task. Future work should explore methods to handle more subtle semantic differencesbetween activities that we noticed are often missed by the automated methods includingthe effects of function words and polysemy.
98
CHAPTER 8
Clustering and Predicting Human Activities
8.1 Introduction
As discussed in the previous chapter, what a person does says a lot about who they are.Information about the types of activities that a person engages in can provide insights abouttheir interests [51], personality [4], physical health [17], the activities that they are likelyto do in the future [99], and other psychological phenomena like personal values [120]. Togive some specific examples, it has been shown that university students who are exhibittraits of interpersonal affect and self-esteem are more likely to attend parties [102], andthose that value stimulation are likely to watch movies that can be categorized as thrillers[10].
Several studies have applied computational approaches to the understanding and mod-eling of human behavior at scale [149] and in real time [138]. However, this previous workhas mainly relied on specific devices or platforms which require structured definitions ofbehaviors to be measured. While this leads to an accurate understanding of the types ofactivities being done by the involved users, these methods capture a relatively narrow setof behaviors compared to the huge range of things that people do on a day-to-day basis.On the other hand, publicly available social media data provide us with information aboutan extremely rich and diverse set of human activities, but the data are rarely structured andmostly exist in the form of natural language. Recently, though, natural language processingresearch has provided several examples of methodologies for extracting and representinghuman activities from text data [44, 144].
In this chapter, we extract human activities1 from social media text data in order togain a deeper understanding of the kinds of activities that people discuss online with oneanother. Given that the space of possible phrases describing human activities is nearly
1As before, throughout this chapter, we use the word “activity” to refer to what a person does or has done.Unlike the typical use of this term in the computer vision community, in this paper we use it in a broad sense,to also encompass non-visual activities such as “make vacation plans” or “have a dream”.
99
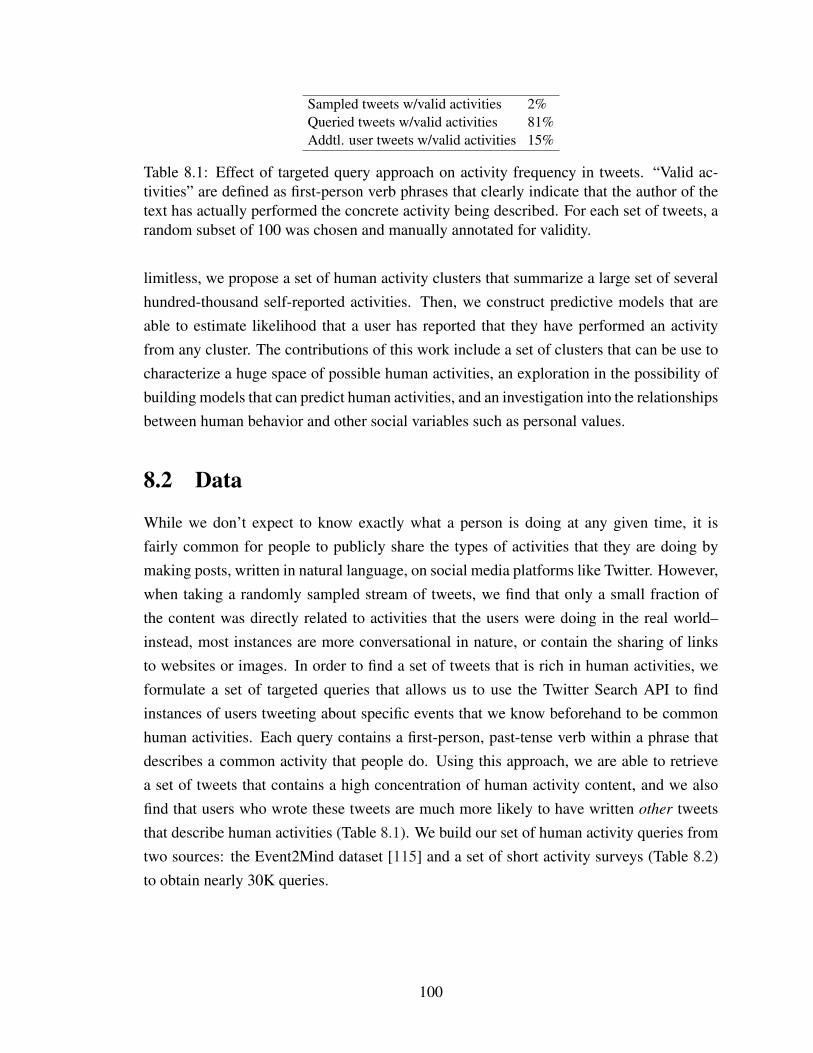
Sampled tweets w/valid activities 2%Queried tweets w/valid activities 81%Addtl. user tweets w/valid activities 15%
Table 8.1: Effect of targeted query approach on activity frequency in tweets. “Valid ac-tivities” are defined as first-person verb phrases that clearly indicate that the author of thetext has actually performed the concrete activity being described. For each set of tweets, arandom subset of 100 was chosen and manually annotated for validity.
limitless, we propose a set of human activity clusters that summarize a large set of severalhundred-thousand self-reported activities. Then, we construct predictive models that areable to estimate likelihood that a user has reported that they have performed an activityfrom any cluster. The contributions of this work include a set of clusters that can be use tocharacterize a huge space of possible human activities, an exploration in the possibility ofbuilding models that can predict human activities, and an investigation into the relationshipsbetween human behavior and other social variables such as personal values.
8.2 Data
While we don’t expect to know exactly what a person is doing at any given time, it isfairly common for people to publicly share the types of activities that they are doing bymaking posts, written in natural language, on social media platforms like Twitter. However,when taking a randomly sampled stream of tweets, we find that only a small fraction ofthe content was directly related to activities that the users were doing in the real world–instead, most instances are more conversational in nature, or contain the sharing of linksto websites or images. In order to find a set of tweets that is rich in human activities, weformulate a set of targeted queries that allows us to use the Twitter Search API to findinstances of users tweeting about specific events that we know beforehand to be commonhuman activities. Each query contains a first-person, past-tense verb within a phrase thatdescribes a common activity that people do. Using this approach, we are able to retrievea set of tweets that contains a high concentration of human activity content, and we alsofind that users who wrote these tweets are much more likely to have written other tweetsthat describe human activities (Table 8.1). We build our set of human activity queries fromtwo sources: the Event2Mind dataset [115] and a set of short activity surveys (Table 8.2)to obtain nearly 30K queries.
100
8.2.1 Event2Mind Activities
The Event2Mind dataset contains a large number of event phrases which are annotatedfor intent and reaction. The events themselves come from four sources of phrasal events(stories, common n-grams found in web data, blogs, and English idioms), and many ofthem fall under our classification of human activities, making Event2Mind a great resourcein our search for concrete examples of human activities. We consider events for which aperson is the subject (e.g, “PersonX listens to PersonX’s music”) to be human activities,and remove the rest (e.g., “It is Christmas morning”). We then use several simple rules toconvert the Event2Mind instances into first-person past-tense activities. Since all eventswere already filtered so that they begin with “PersonX”, we replace the first occurrence of“PersonX” in each event with “I” and all subsequent occurrences with “me”. All occur-rences of “PersonX’s” become “my”, and the main verb in each phrase is conjugated toits past-tense form using the Pattern python module2. For example, the event “PersonXteaches PersonX’s son” becomes the query “I taught my son”. Since Event2Mind also con-tains wildcard placeholders that can match any span of text within the same phrase (e.g.,“PersonX buys at the store”)3, but the Twitter API doesn’t provide a mechanism forwildcard search, we split the event on the string and generate a query that requires allsubstrings to appear in the tweet. We then check for the correct order for the substringsafter candidate tweets have been retrieved.
8.2.2 Short Survey Activities
In order to get an even richer set of human activities, we also ask a set of 1,000 peopleacross the United States to list any five activities that they had done in the past week.We collect our responses using Amazon Mechanical Turk4 and pay $0.10 per response,and manually verify that all responses are reasonable. We remove any duplicate stringsand automatically convert them into first-person and past-tense (if they were not in thatform already). For this set of queries, there are no wildcards and we only search for exactmatches. Example queries obtained using this approach include “I went to the gym” and “Iwatched a documentary”.
2www.clips.uantwerpen.be/pattern3We also treat instance of “PersonY” as a wildcard since this could be any name or even a user (@)
mention on Twitter.4www.mturk.com
101

count uniqueEvent2Mind activities 24,537 24,537Survey activities 5,000 4,957Total 29,537 29,494
Table 8.2: Number of human activity queries from multiple sources.
Total queries 29,494Queried tweets 422,607Avg. tweets/query 14.33Valid queried tweets 335,357Avg. valid tweets/query 11.37
Table 8.3: Summary of query results.
8.2.3 Query Results
Using our combined set of unique human activity queries, we use the Twitter Search API5
to collect the most recent 100 matches per query (the maximum allowed by the API perrequest), as available, and we refer to these tweets as our set of queried tweets. We thenfilter the queried tweets as follows: first, we verify that for any tweets requiring the match ofmultiple substrings (due to wildcards in the original activity phrase), the substrings appearin the correct order and do not span multiple sentences. Next, we remove activity phrasesthat are preceded with indications that the author of the tweet did not actually perform theactivitiy, such as “I wish” or “should I . . . ?”. We refer to the set of tweets left after thisfiltering as valid queried tweets (see Table 8.3 for more details).
In order to gather other potentially useful information about the users who wrote atleast one valid queried tweet, we collect both their self-written profile and their previouslywritten tweets (up to 3,200 past tweets per user, as allowed by the Twitter API), and werefer to these as our set of additional tweets. We ensure that there is no overlap betweenthe sets of queried tweets and additional tweets, so in the unlikely case that a user hasposted the same tweet multiple times, it cannot be included in both sets. Further, we use
5developer.twitter.com/en/docs/tweets/search/api-reference/get-search-tweets.html
Num. unique users 358,091Additional tweets collected 560,526,633Avg. additional tweets / user 1,565Additional activities extracted 21,316,364Avg. additional activities / user 59.52
Table 8.4: Summary of additional data.
102

Initial num. unique users 358,091Users with non-empty profiles 96.9%Users with ≥ 1 addtl. tweets 94.9%Users with ≥ 25 addtl. tweets 93.1%Users with ≥ 1 addtl. activities 93.5%Users with ≥ 5 addtl. activities 87.1%Num. unique valid users 214,708
Table 8.5: Summary valid user filtering.
a simple pattern-matching approach to extract additional activities from these tweets. Wesearch for strings that match I <VBD> .* <EOS> where <VBD> is any past-tense verb,.* matches any string (non-greedy), and <EOS> matches the end of a sentence. We thenperform the same filtering as before for indications that the person did not actually do theactivity, and we refer to these filtered matches as our set of additional activities (see Table8.4 for more information). Note that since these additional activities can contain any rangeof verbs, they are naturally noisier than our set of valid query tweets, and we therefore donot treat them as a reliable “ground truth” source of self-reported human activities, but asa potentially useful signal of activity-related information that can be associated with usersin our dataset. For our final dataset, we also filter our set of users. From the set of userswho posted at least one valid queried tweet, we remove those who had empty user profiles,those with less than 25 additional tweets, those with less than 5 additional activities (Table8.5).
8.2.4 Creating Human Activity Clusters
Given that the set of possible human activity phrases is extremely large and it is unlikelythat the same phrase will appear multiple times, we make this space more manageable byfirst performing a clustering over the set of activity phrase instances that we extract fromall valid queried tweets. We define an activity phrase instance as the set of words matchingan activity query, plus all following words through the end of the sentence in which thematch appears.
In order cluster our activity phrase instances, we need to define a notion of distancebetween any pair of instances. For this, we turn to our prior work (Chapter 7) buildingmodels to determine semantic similarity between human activity phrases in which we uti-lized transfer learning in order to fine-tune the Infersent [35] sentence similarity model tospecifically capture relationships between human activity phrases. We use our best per-forming BiLSTM-max sentence encoder trained to capture the relatedness dimension ofhuman activity phrases to obtain vector representations of each of our activity phrases.
103
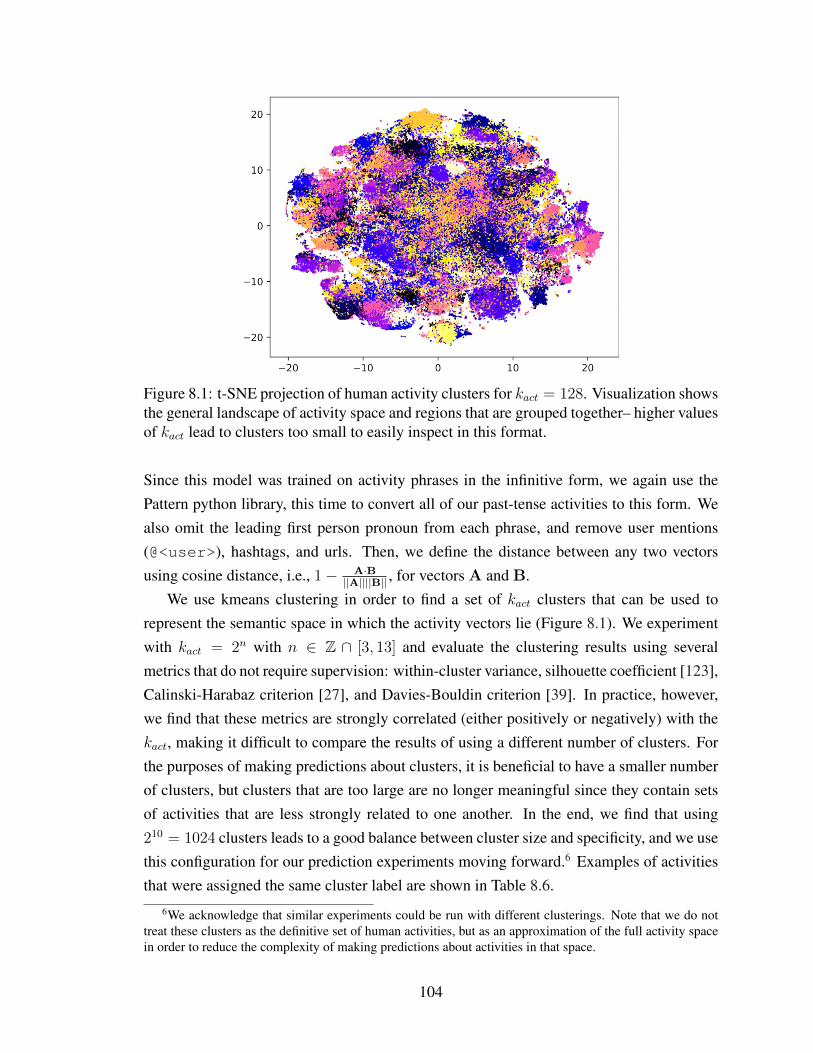
Figure 8.1: t-SNE projection of human activity clusters for kact = 128. Visualization showsthe general landscape of activity space and regions that are grouped together– higher valuesof kact lead to clusters too small to easily inspect in this format.
Since this model was trained on activity phrases in the infinitive form, we again use thePattern python library, this time to convert all of our past-tense activities to this form. Wealso omit the leading first person pronoun from each phrase, and remove user mentions(@<user>), hashtags, and urls. Then, we define the distance between any two vectorsusing cosine distance, i.e., 1− A·B
||A||||B|| , for vectors A and B.We use kmeans clustering in order to find a set of kact clusters that can be used to
represent the semantic space in which the activity vectors lie (Figure 8.1). We experimentwith kact = 2n with n ∈ Z ∩ [3, 13] and evaluate the clustering results using severalmetrics that do not require supervision: within-cluster variance, silhouette coefficient [123],Calinski-Harabaz criterion [27], and Davies-Bouldin criterion [39]. In practice, however,we find that these metrics are strongly correlated (either positively or negatively) with thekact, making it difficult to compare the results of using a different number of clusters. Forthe purposes of making predictions about clusters, it is beneficial to have a smaller numberof clusters, but clusters that are too large are no longer meaningful since they contain setsof activities that are less strongly related to one another. In the end, we find that using210 = 1024 clusters leads to a good balance between cluster size and specificity, and we usethis configuration for our prediction experiments moving forward.6 Examples of activitiesthat were assigned the same cluster label are shown in Table 8.6.
6We acknowledge that similar experiments could be run with different clusterings. Note that we do nottreat these clusters as the definitive set of human activities, but as an approximation of the full activity spacein order to reduce the complexity of making predictions about activities in that space.
104

make cauliflower stir-fry for dinnermake a salad with spicy breakfast turkey sausage
make garlic and olive oil vermicelli for lunchstart cooking bacon in the oven (on foil in a sheet)
burn the turkeymake perfect swordfish steaks tonight
miss one’s friends lmaobecome really good friends with her
tell people to flirt with oneself on one’s finstawant people to confess their lovemake jokes about it with friends
become friends hahaget a new pet spider today
spend the evening with the best kittycuddle 4 dogsget a pet sitter
feel so happy being able to pet kitties todayspend some time with cats
watch football italiawatch a football game in the pub
watch basketball todayfind someone one loves enough to watch football
watch sportswatch fireworks today in the theatre
ace the exampass one’s exam thank god
get a perfect score on one’s exambreak a sweat reading
get a c on one’s french exampass another exam omg
Table 8.6: Examples of clustered activities.
105
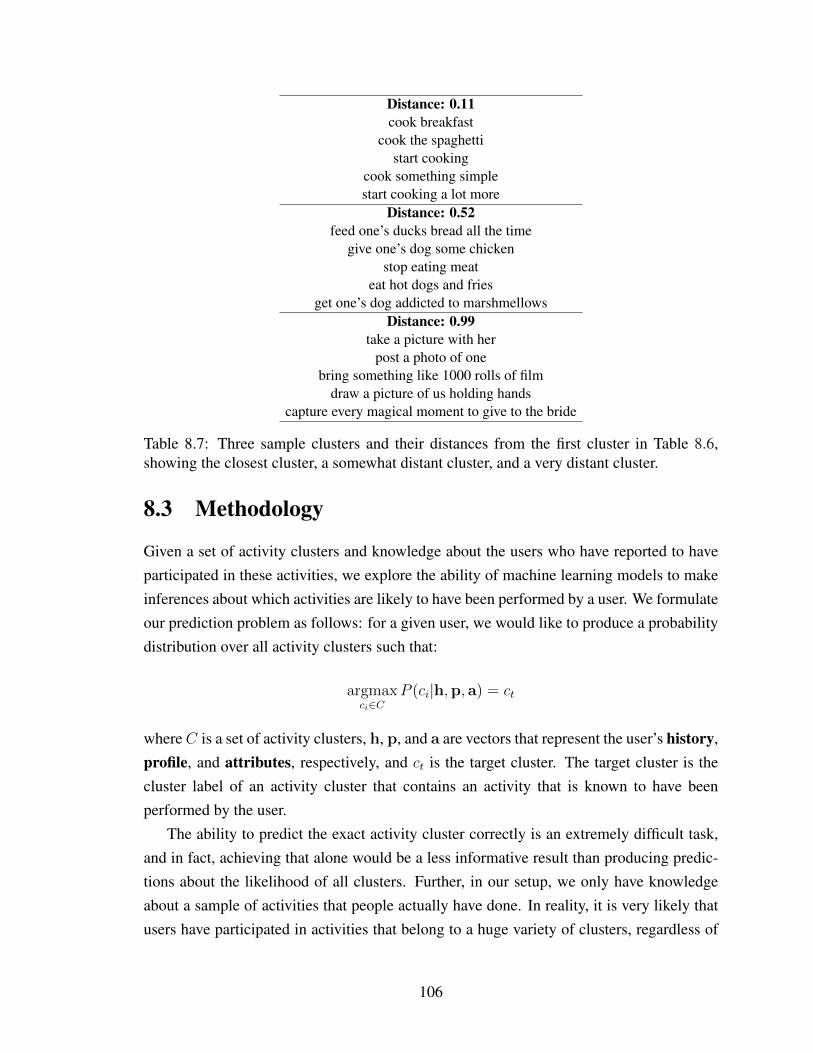
Distance: 0.11cook breakfast
cook the spaghettistart cooking
cook something simplestart cooking a lot more
Distance: 0.52feed one’s ducks bread all the time
give one’s dog some chickenstop eating meat
eat hot dogs and friesget one’s dog addicted to marshmellows
Distance: 0.99take a picture with her
post a photo of onebring something like 1000 rolls of film
draw a picture of us holding handscapture every magical moment to give to the bride
Table 8.7: Three sample clusters and their distances from the first cluster in Table 8.6,showing the closest cluster, a somewhat distant cluster, and a very distant cluster.
8.3 Methodology
Given a set of activity clusters and knowledge about the users who have reported to haveparticipated in these activities, we explore the ability of machine learning models to makeinferences about which activities are likely to have been performed by a user. We formulateour prediction problem as follows: for a given user, we would like to produce a probabilitydistribution over all activity clusters such that:
argmaxci∈C
P (ci|h,p, a) = ct
whereC is a set of activity clusters, h, p, and a are vectors that represent the user’s history,profile, and attributes, respectively, and ct is the target cluster. The target cluster is thecluster label of an activity cluster that contains an activity that is known to have beenperformed by the user.
The ability to predict the exact activity cluster correctly is an extremely difficult task,and in fact, achieving that alone would be a less informative result than producing predic-tions about the likelihood of all clusters. Further, in our setup, we only have knowledgeabout a sample of activities that people actually have done. In reality, it is very likely thatusers have participated in activities that belong to a huge variety of clusters, regardless of
106
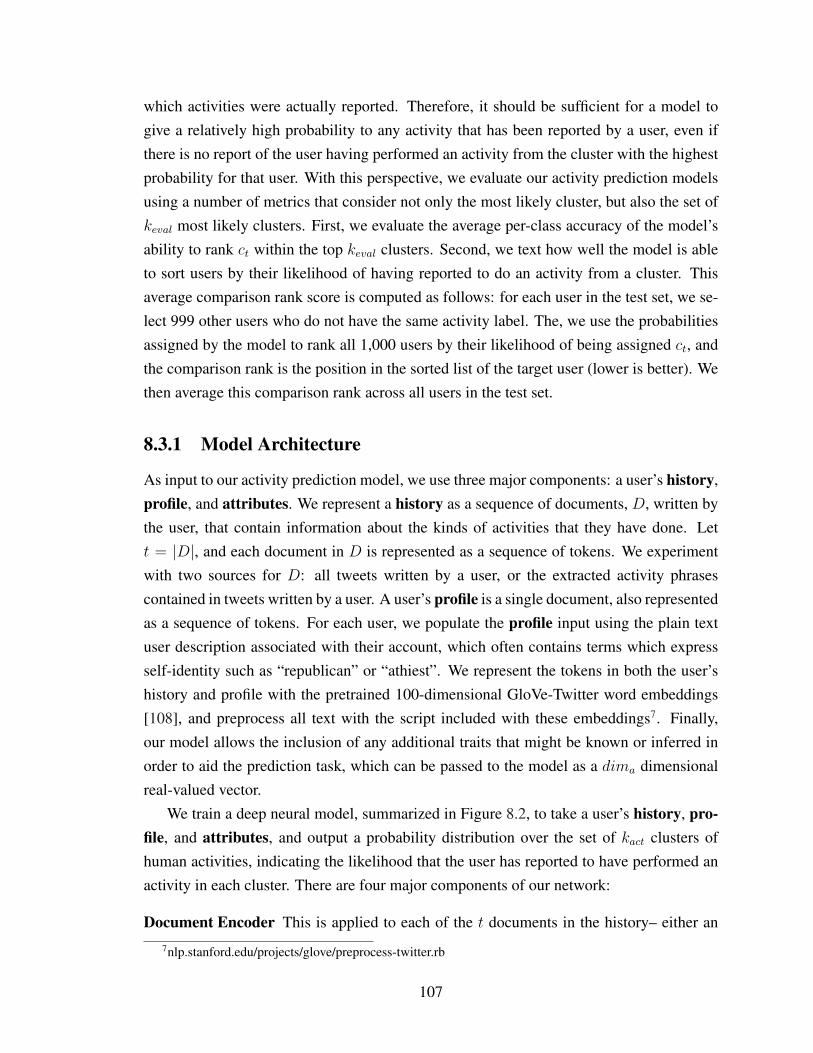
which activities were actually reported. Therefore, it should be sufficient for a model togive a relatively high probability to any activity that has been reported by a user, even ifthere is no report of the user having performed an activity from the cluster with the highestprobability for that user. With this perspective, we evaluate our activity prediction modelsusing a number of metrics that consider not only the most likely cluster, but also the set ofkeval most likely clusters. First, we evaluate the average per-class accuracy of the model’sability to rank ct within the top keval clusters. Second, we text how well the model is ableto sort users by their likelihood of having reported to do an activity from a cluster. Thisaverage comparison rank score is computed as follows: for each user in the test set, we se-lect 999 other users who do not have the same activity label. The, we use the probabilitiesassigned by the model to rank all 1,000 users by their likelihood of being assigned ct, andthe comparison rank is the position in the sorted list of the target user (lower is better). Wethen average this comparison rank across all users in the test set.
8.3.1 Model Architecture
As input to our activity prediction model, we use three major components: a user’s history,profile, and attributes. We represent a history as a sequence of documents, D, written bythe user, that contain information about the kinds of activities that they have done. Lett = |D|, and each document in D is represented as a sequence of tokens. We experimentwith two sources for D: all tweets written by a user, or the extracted activity phrasescontained in tweets written by a user. A user’s profile is a single document, also representedas a sequence of tokens. For each user, we populate the profile input using the plain textuser description associated with their account, which often contains terms which expressself-identity such as “republican” or “athiest”. We represent the tokens in both the user’shistory and profile with the pretrained 100-dimensional GloVe-Twitter word embeddings[108], and preprocess all text with the script included with these embeddings7. Finally,our model allows the inclusion of any additional traits that might be known or inferred inorder to aid the prediction task, which can be passed to the model as a dima dimensionalreal-valued vector.
We train a deep neural model, summarized in Figure 8.2, to take a user’s history, pro-file, and attributes, and output a probability distribution over the set of kact clusters ofhuman activities, indicating the likelihood that the user has reported to have performed anactivity in each cluster. There are four major components of our network:
Document Encoder This is applied to each of the t documents in the history– either an
7nlp.stanford.edu/projects/glove/preprocess-twitter.rb
107

Figure 8.2: Predictive model architecture.
activity phrase or a full tweet. For document i in D, it takes a sequence of tokenembeddings as input and produces a dimd dimensional vector, di as output.
History Encoder This layer takes the sequence {d0, . . . ,dt} as input and produces a sin-gle dimH dimensional vector, h, as output, intended to represent high-level featuresextracted from the entire history of the user.
Profile Encoder Takes each token in the user’s profile as input and produces a single dimp
dimensional vector, p as output.
Classifier As input, this module takes the concatenation a⊕ h⊕ p, where a is the prede-fined attribute vector associated with the user. Then, a prediction is made for each ofthe kact clusters, first applying softmax in order to obtain a probability distribution.We refer to the dimension of the output as dimo.
For any of the three encoder layers, several layer types can be used, including recurrent,convolutional, or self-attention based layers. The classifier layer is the only layer that doesnot take a sequence as input and we implement it using a simple feed-forward multi-layernetwork containing `c layers with hc hidden units each. The network is trained with cross-entropy loss, which has been shown to perform competitively when optimizing for top-kclassification tasks [12].
108

Category Top Scoring ProfileFamily a mother to my sonNature Environment & nat resource
economist tweeting about cli-mate change/risk, energy, envi-ronmental protection, green fi-nance, commodities, data sci-ence, politics
Work-Ethic Football is like life - it requiresperseverance, self-denial, hardwork, sacrifice, dedication andrespect for authority
Religion /Galatians 2:20/ I love our LordJesus Christ.
Truth Empathy, laughter, loyalty andhonesty are the essence of life. . .
Table 8.8: Profiles scoring the highest for various values categories when being measuredwith the values lexicon.
8.3.2 Incorporating Personal Values
While the attributes vector a can be used to encode any information of interest about auser, we choose to experiment with the use of personal values because of their theoreticalconnection to human behavior [10]. In order to get a representation of a user’s values, weturn to the hierarchical personal values lexicon from [145]. In this lexicon, there are 50value dimensions, represented as sets of words and phrases that characterize that value.Since users’ profiles often contain value-related content, we use the Distributed DictionaryRepresentations (DDR) method [48] to compute a score, sv for each value dimension, v,using cosine similarity as follows:
sv =R(profile) ·R(lexiconv)
||R(profile)||||R(lexiconv)||
Where R(·) is a representation of a set of vectors, which, for the DDR method, is definedas the mean vector of the set; profile is a set of word embeddings, one for each token inthe user’s profile; and lexiconv is another set of word embeddings, one for each token inthe lexicon for value dimension v. Finally, we set a = (s0, . . . , sdimL
) where dimL = 50,the number of value dimensions in the lexicon. Examples of profiles with high scores forsample value dimensions are shown in Table 8.8.
Further, we explore the types of activity clusters that contain activities reported by userswith high scores for various value dimensions. For a given value, we compute a score for
109

Category Activities in High Scoring ClusterFamily give one’s daughter a number of plants
ask one’s son to throw something in thetrashtake one’s family to the parkwork in the garden with mom
Nature visit another castlevisit francego on a fishing trip in north frontenaccountyspend time in the city visiting a mu-seum
Work-Ethic send emails directly to professor —add another footnote to the dissertationfile a complaint with the fccwrite one’s first novel by hand
Religion follow the rulesstudy really hardput one’s opinion forwarddo a good deed
Truth call customer supportreceive a letter from possibly the sameorgdescribe the house in detailstudy abroad in belgium
Table 8.9: Profiles scoring the highest for various values categories when being measuredwith the values lexicon.
110

each cluster, sCv , by taking the average sv of all users who tweeted about doing activitiesin the cluster. Then, for each value, v, we can rank all clusters by their sCv score, andexamples of those with the highest scores are presented in Table 8.9. We can observethat users whose profiles had high scores for Family were likely to report doing activitiesincluding their family members, those with high scores for Nature tweeted about travel,and those with high Work-Ethic scores reported performing writing related tasks.
8.4 Prediction Experiments
We split our data at the user-level, and from our set of valid users we use 200,000 instancesfor training data, 10,000 as test data, and the rest as development data.
For the document encoder and profile encoder we use a Bi-LSTM with max pooling,with dimd = 128 and dimp = 128. For the history encoder, we empirically found thatsingle mean pooling layer over the set of all document embeddings outperformed othermore complicated architectures, and so that is what we use in our experiments. Finally,the classifier is a 3-layer feed-forward network with and dimc = 512 for the hidden layers,followed by a softmax over the dimo-dimensional output. We use Adam [65] as our opti-mizer, set the maximum number of epochs to 100, and shuffle the order of the training dataat each epoch. During each training step, we represent each user’s history as a new randomsample of max sample docs = 1008 documents if there are more than max sample docsdocuments available for the user, and we use a batch size of 32 users. Since there is a classimbalance in our data, we use sample weighting in order to prevent the model from con-verging to a solution that simply predicts the most common classes present in the trainingdata. Each sample is weighted according to its class, c, using the following formula:
wc =N
count(c) ∗ dimo
where count(c) is the number of training instances belonging to class c. We evaluate ourmodel on the development data after each epoch and save the model with the highest per-class accuracy. Finally, we compute the results on the test data using this model, and reportthese results.
We test several configurations of our model. tweet+vals is the complete model as de-scribed in section 8.3.1 using the set of additional tweets written by a user as their history,tweet is the this model without considering the values vectors as input, act+vals is the fullmodel, but using the set of additional activities extract from a user’s tweets as their his-
8We empirically found that increasing this value beyond 100 had little effect on the development accuracy.
111

tweet actkeval rand +vals tweet +vals acts
1 2.00 2.86 2.62 2.74 2.742 4.00 5.77 4.82 5.53 4.883 6.00 7.79 6.78 7.50 7.135 10.00 12.31 10.76 11.88 10.96
10 20.00 23.8 21.12 22.83 22.6125 50.00 54.75 52.94 51.44 55.30
Table 8.10: Per-class Accuracy @ keval for the 50-class prediction task.
tory, and act is this model without considering the values vectors. We also include twosimple baselines in our results for comparison: rand is the theoretical score achieved if themodel were to select target clusters at random, and freq is the result achieved by rankingthe clusters based on their frequency in the training data.
We consider two variations on our dataset: the first is a simplified, 50-class classifica-tion problem. We choose the 50 most common clusters out of our full set of kact = 1024
and only make predictions about users who have reportedly performed an activity in one ofthese clusters. The second variation uses the entire dataset, but rather than making predic-tions about all kact classes, we only make fine-grained predictions about those classes forwhich count(c) ≥ minCount. We do this under the assumption that training an adequateclassifier for a given class requires at least minCount of examples. All classes for whichcount(c) < minCount are assigned an “other” label. In this way, we still make a predic-tion for every instance in the dataset, but we avoid allowing the model to try to fit to a hugelandscape of outputs when the training data for some of these outputs is insufficient. Bysetting minCount to 100, we are left with 805 out of 1024 classes, and an 806th “other”class for our 806-class setup.
8.4.1 Results
While our models are able to make predictions indicating that some learning has takenplace, it is clear that this prediction task is extremely difficult. In the 50-class setup, thetweet+vals setting worked the best in the case of most smaller values of keval (Table 8.10).However, when considering the entire rankings produced by each model, the acts settingoutperforms tweet+vals, achieving both a higher per-class accuracy @ keval and a loweraverage comparison rank (Figure 8.3). This suggests a trade off between higher per-classaccuracy at the top of the model’s ranking and a better average ranking of all test instances.Interestingly, focusing on only the portion of text from the tweets describing activities givesbetter results than considering the rest of the tweets, and using the information inferred
112
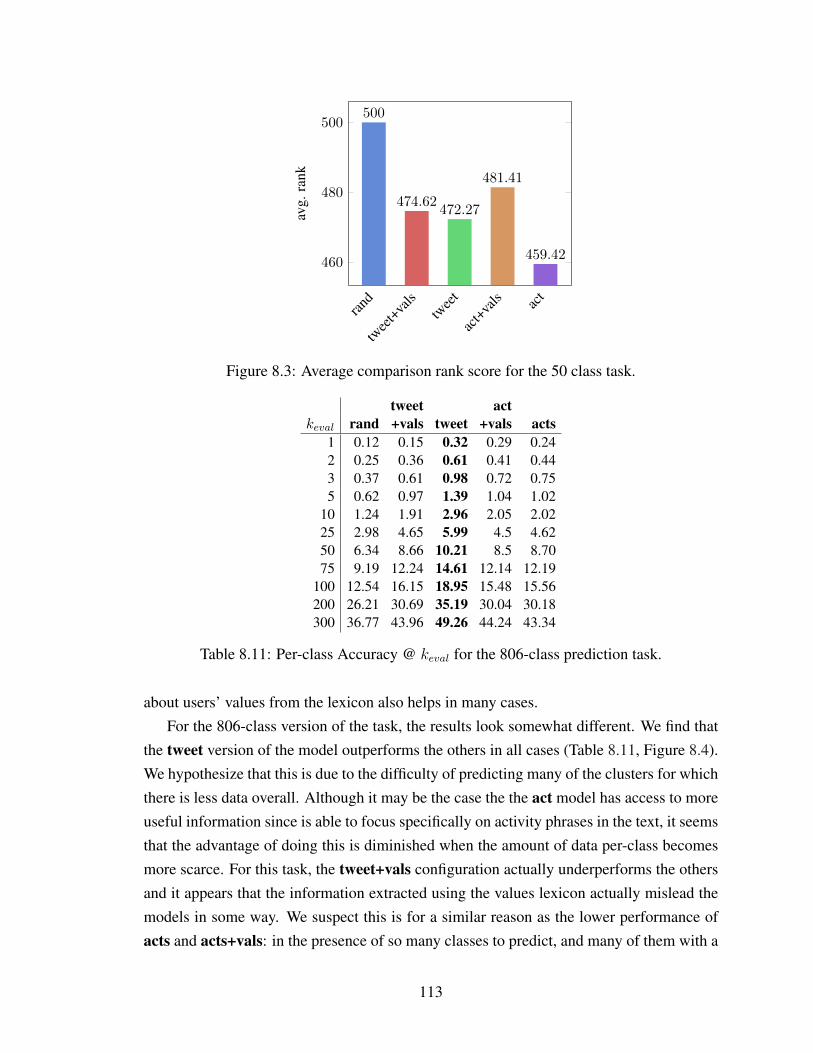
rand
twee
t+vals
twee
t
act+va
ls act
460
480
500500
474.62472.27
481.41
459.42
avg.
rank
Figure 8.3: Average comparison rank score for the 50 class task.
tweet actkeval rand +vals tweet +vals acts
1 0.12 0.15 0.32 0.29 0.242 0.25 0.36 0.61 0.41 0.443 0.37 0.61 0.98 0.72 0.755 0.62 0.97 1.39 1.04 1.02
10 1.24 1.91 2.96 2.05 2.0225 2.98 4.65 5.99 4.5 4.6250 6.34 8.66 10.21 8.5 8.7075 9.19 12.24 14.61 12.14 12.19
100 12.54 16.15 18.95 15.48 15.56200 26.21 30.69 35.19 30.04 30.18300 36.77 43.96 49.26 44.24 43.34
Table 8.11: Per-class Accuracy @ keval for the 806-class prediction task.
about users’ values from the lexicon also helps in many cases.For the 806-class version of the task, the results look somewhat different. We find that
the tweet version of the model outperforms the others in all cases (Table 8.11, Figure 8.4).We hypothesize that this is due to the difficulty of predicting many of the clusters for whichthere is less data overall. Although it may be the case the the act model has access to moreuseful information since is able to focus specifically on activity phrases in the text, it seemsthat the advantage of doing this is diminished when the amount of data per-class becomesmore scarce. For this task, the tweet+vals configuration actually underperforms the othersand it appears that the information extracted using the values lexicon actually mislead themodels in some way. We suspect this is for a similar reason as the lower performance ofacts and acts+vals: in the presence of so many classes to predict, and many of them with a
113

rand
twee
t+vals
twee
t
act+va
ls act
420
440
460
480
500500
441.03
426.08
459.81 459.92
avg.
rank
Figure 8.4: Average comparison rank score for the 806 class task.
somewhat smaller amount of training instances, it is more difficult correctly learn parameterweights for some features like the attributes vector in relation to the less frequent classes.However, since each user has many tweets, it may be easier to learn a strong DocumentEncoder even in situations with less data available per class, especially when looking at allof the tweets instead of just phrases focused on human activities.
8.5 Conclusions
We have collected a large Twitter dataset for the purpose of studying users every activitiesand their relationships to other variables such as personal values. Using sentence embed-ding models, we projected activity instances into a vector space and perform clustering inorder to learn about the high-level groups of behaviors that are commonly mentioned on-line. We trained predictive models to make inferences about the likelihood that a user hadreported to have done activities across the range of clusters that we discovered, and foundthat these models were able to achieve results significantly higher than random guessingbaselines for the metrics that we consider.
While the overall prediction accuracy is generally low, the models that we have traineddo show signs that they are able to generalize findings from one set of users to another tosome extent. This is evidence that the task is very difficult and could benefit from furtherinvestigation. Possible improvements may come from a number of approaches. For one,it may be worthwhile to work toward defining an even better set of activity clusters byexperimenting with a wider range of clustering methods, or tailoring a clustering algorithmspecifically to this task. Further, the clusters could be manually cleaned by a set of trained
114

annotators in order to reduce the amount of noise present in the dataset. Other predictionproblems could be formulated with this data, perhaps by obtaining the target labels in someother way such as a human-guided annotation of activity categories. This could meanbypassing the automatic clustering altogether, or finding a way to use a human-in-the-loopto select the labels more intelligently. Finally, different machine learning models could beapplied to the same task in order to potentially achieve even better results.
115

CHAPTER 9
Conclusions
9.1 Revisiting the Research Questions
The preceding chapters have presented the details of the methodologies employed and anal-yses performed in order to answer the foundational research questions of this dissertation.We have moved from the prediction of the Schwartz values to topic modeling based ap-proaches to gaining insights about person values from open-ended text using the MeaningExtraction method (which we thoroughly compared to Latent Dirichlet Allocation, the mostwidely used topic modeling approach). Further, we showed how to extend topic modelingapproaches to consider additional variables of interest such as culture, gender and age. Togain even more insights about people’s values, we described the construction of a lexicalresource built specifically to measure personal values. To better measure human behaviorsfrom a computational linguistic perspective, we built and fine-tuned models that were ableto place human activity phrases into a high-dimensional vector space in which distance hasa direct relationship with how humans think about behaviors. Using that space, we demon-strated a way in which deep-learning models can be used to incorporate both informationabout a person’s values and their past activities in order to make predictions about the typesof things that they are most likely to do. After all this, we will now revisit the questionsposed in Chapter 1 and discuss our overarching results.
• Can we build statistical models to predict a person’s values from their text?In chapter 2, we have shown that although it is possible to construct models to pre-dict a person’s values as measured using the Schwartz Values Survey, the predictivepower is not extremely strong, especially when applied to text that is not explicitlyabout values. The task of predicting value components from Schwartz’s model re-mains difficult, but could be explored even more in future work. Out of all of thevalues in the circumplex model the value of Tradition had the strongest connectionto features extracted from text, which suggests that those strongly aligned to this
116

value exhibit, at times, slightly different language patterns than those opposed to it.During this investigation into prediction, we also found that LIWC lexicon featuresto be particularly helpful in building models of personal values from text, showingthat these psycholinguistic markers provide a useful way to understand psychologicalprocesses in textual data.
• Does a top-down or bottom-up approach to measuring values better relate toreal-world human behaviors?Values inferred from open-ended essays using a bottom-up approach are connectedto a much wider range of human behaviors than values as captured using a tradi-tional self-report survey are, as shown in chapter 4. While the values measured usingthe Schwartz Values Survey are correlated with several self-reported behaviors, thevalue themes extracted using the Meaning Extraction Method provided both a richerunderstanding of individuals’ views on their own values and a model of values thatwas related to a more diverse set of behaviors. For example, we learned that be-havior categories such as Eating/Cooking, Friendship, and Recreation Planning wereconnected with a number of our extracted value themes, but had no significant rela-tionship with any of the values from Schwartz’s model. These types of findings arecrucial when building practical models of person values since behaviors are the ob-servable, more directly measurable manifestations of personal values. In addition toproviding these insights, the bottom-up approach to measuring values in open-endedsurvey text provides a blueprint for future work in the computational social sciencesseeking to measure the relationship between language and other social variables.
• Which topic modeling approach has qualities best suited for capturing the no-tion of personal values from open ended survey text?In chapter 3, we explored thousands of combinations of topic modeling parametersin order to measure their average effects across a series of datasets. From this inves-tigation, we found that the Meaning Extraction Method performs very competitivelywith more well-known topic modeling approaches, such as LDA, and that it can beparticularly useful when seeking to find features that can be used to classify text ac-cording to some predefined classes. We also observed that data preprocessing steps,which are sometimes viewed as peripheral to the main modeling task, can have ameaningful influence on the final results. Evaluating topic models and selecting thecorrect configuration remains difficult, however, it the best approach is to empiricallysearch for the parameters that will work best for each situation, and depending on thegoals motivating the use of topic modeling.
117

• What moderating role does culture play in the relationship between personalvalues and behaviors as measured through text?As evidenced in chapter 5, culture indeed plays an influential role in the measurementof values through words as well as value-behavior connections. Compared to otherdemographic variables like gender and age, culture is a dominant explanatory factorin the differences between the degree to which people mention various values. Whilegender does tell us more than the other variables about how much a person will talkabout Family as an important value (with females mentioning it significantly morethan males) and age is connected with the value theme of Personal Growth (withyounger people talking about this as a value much more often), culture is the variablethat is strongly related to differences in values for a majority of the themes that wediscovered, including Rule Following and Hard Work. Crucially, it was abundantlyclear that conclusions drawn from a set of data produced by people of a single culturalbackground do not generalize to other populations, making culture a very importantvariable to incorporate into any sociolinguistic models.
• How can we semi-automatically create a useful lexicon for the measurement ofpersonal values?In chapter 6, we outlined a procedure for the generation of a hierarchical lexiconand used that new approach to create a lexical resource that can be used to measurepersonal value content in text. Since we wanted to strike a balance between the scal-ability of automatic methods and the accuracy of human annotations, we developeda method that leverages both, only relying on human input when necessary to makesmall, manageable, yet important, decisions. The sorting process begins by (auto-matically) creating an initial hierarchical structure of the terms and phrases that aresearch has defined as being of interest. Then, a bottom-up sorting procedure be-gins, ensuring that each sub-tree in the entire hierarchy is sorted in a way that hasbeen selected the greatest number of times by humans as being a reasonable way tosort the concepts. In order to determine whether or not this lexical resource truly cap-tures value content, we designed a series of evaluation metrics and show that manyof our new value categories were able to retrieve texts that human judges deemedrelevant to the value category.
• How can we represent the semantic content of short phrases in the domain ofhuman activities in order to find meaningful clusters of behaviors? How dothese clusters relate to personal values?In chapter 7 of this dissertation, the construction of a new dataset was described.
118

This dataset allows for the evaluation of methods that can automatically determinesemantic relationships between human activity phrases, and the performance of myr-iad approaches was compared. We found that fine-tuning models that were previ-ously trained on similar tasks with huge amounts of data available led to models thatlargely agreed with human judgments as to the degree of several relationships be-tween pairs of activities. Given that we had a way to measure the semantic distancebetween pairs of activities, we went on to perform a clustering over a large numberof activity phrases found in naturally occurring social media text (Chapter 8). Usingour previously constructed values lexicon (Chapter 6), we were able to find somereasonable relationships between personal values and these behavior clusters, suchas the participation in a variety of activities together with family members by thosewho scored high for the value of Family.
• Does the incorporation of inferred personal values into a model allow us to bet-ter predict aspects of a person’s behaviors?We experimented with machine learning models that could make predictions aboutthe likelihood that a person had reported participating in a range of activities in chap-ter 8. We found that including features related to a person’s values helped in some,but not all, cases. When only considering the classes of behaviors that were mostcommon, and when measuring the accuracy of the model based on how often it se-lected the correct activity within the top few of its ranked predictions, informationfrom values was indeed helpful. However, when looking at a much larger range ofactivities, focusing on a larger amount of less specialized text led to better predic-tive performance by our best models. This suggests that it may be worth exploringthe effects of values in predictive models of behaviors, but there is not yet enoughevidence to say that these features will be valuable in a wider range of scenarios.
9.2 Final Remarks
Throughout this dissertation, we have taken an assortment of approaches to the problemof measuring and understanding personal values and their relationships with behaviors,culture, and at the center of it all, language. We have shown that language is an extremelyrich source of information, not only about people’s patterns of thought and expression,but also real-world behaviors as reported across social media platforms. More specifically,we have shown that there are quantifiable connections1 between linguistic variables and
1It is important to note that the relationships that we have explored in this work are not causal in nature–therefore, we cannot definitively claim that values “cause” people to perform certain activities, only that
119

personal values, and computational methods are the key to performing observations of thisnature at scale.
We hope that the work compiled here helps to spur on future research in the area of per-son values so that we can continue to gain a deeper understanding of what is truly importantto people– across cultures, in their daily lives, and in the way that they communicate withone another online. Not only that, but the research in this dissertation may serve as collec-tion of approaches that could potentially be applied to other psychological or sociologicalphenomena, from analyzing the values people hold, to learning about cultural differences inlanguage use, to the wide range of fascinating questions that computational social sciencewill help to answer in the near future and beyond.
there is a relationship between the likelihood that a person does some activity and the set of things that theyconsider to be their values. Exploration into the causality of these relationships remains as a future line ofresearch.
120

BIBLIOGRAPHY
[1] AGIRRE, E., CER, D., DIAB, M., GONZALEZ-AGIRRE, A., AND GUO, W. sem2013 shared task: Semantic textual similarity, including a pilot on typed-similarity.In SEM 2013: The Second Joint Conference on Lexical and Computational Seman-tics. Association for Computational Linguistics (2013), Citeseer.
[2] AGIRRE, E., DIAB, M., CER, D., AND GONZALEZ-AGIRRE, A. Semeval-2012task 6: A pilot on semantic textual similarity. In Proceedings of the First JointConference on Lexical and Computational Semantics-Volume 1: Proceedings of themain conference and the shared task, and Volume 2: Proceedings of the Sixth Inter-national Workshop on Semantic Evaluation (2012), Association for ComputationalLinguistics, pp. 385–393.
[3] AJZEN, I. Attitudes, traits, and actions: Dispositional prediction of behavior inpersonality and social psychology. Advances in experimental social psychology 20(1987), 1–63.
[4] AJZEN, I. Attitudes, traits, and actions: Dispositional prediction of behavior inpersonality and social psychology. In Advances in experimental social psychology,vol. 20. Elsevier, 1987, pp. 1–63.
[5] ALTHOFF, T., CLARK, K., AND LESKOVEC, J. Large-scale analysis of counsel-ing conversations: An application of natural language processing to mental health.Transactions of the Association for Computational Linguistics 4 (2016), 463.
[6] ANDRZEJEWSKI, D., AND ZHU, X. Latent dirichlet allocation with topic-in-setknowledge. In Proceedings of the NAACL HLT 2009 Workshop on Semi-SupervisedLearning for Natural Language Processing (2009), Association for ComputationalLinguistics, pp. 43–48.
[7] ARONSON, E. The Social Animal, 9th ed. Worth Publishers, New York, New York,USA, 2004.
[8] BALL-ROKEACH, S., ROKEACH, M., AND GRUBE, J. W. The Great AmericanValues Test: Influencing Behavior and Belief Through Television. Free Press, NewYork, New York, USA, 1984.
[9] BANSAL, M., GIMPEL, K., AND LIVESCU, K. Tailoring continuous word repre-sentations for dependency parsing. Association for Computational Linguistics.
121

[10] BARDI, A., AND SCHWARTZ, S. H. Values and behavior: Strength and structure ofrelations. Personality and social psychology bulletin 29, 10 (2003), 1207–1220.
[11] BENGIO, Y., DUCHARME, R., VINCENT, P., AND JAUVIN, C. A neural probabilis-tic language model. Journal of machine learning research 3, Feb (2003), 1137–1155.
[12] BERRADA, L., ZISSERMAN, A., AND KUMAR, M. P. Smooth loss functions fordeep top-k classification. arXiv preprint arXiv:1802.07595 (2018).
[13] BLEI, D., AND LAFFERTY, J. Correlated topic models. Advances in neural infor-mation processing systems 18 (2006), 147.
[14] BLEI, D. M., NG, A. Y., AND JORDAN, M. I. Latent Dirichlet Allocation. Journalof Machine Learning Research 3, 4-5 (2003), 993–1022.
[15] BLEI, D. M., NG, A. Y., AND JORDAN, M. I. Latent dirichlet allocation. Journalof machine Learning research 3, Jan (2003), 993–1022.
[16] BOJAR, O., DUSEK, O., KOCMI, T., LIBOVICKY, J., NOVAK, M., POPEL, M.,SUDARIKOV, R., AND VARIS, D. CzEng 1.6: Enlarged Czech-English ParallelCorpus with Processing Tools Dockered. In Text, Speech, and Dialogue: 19th Inter-national Conference, TSD 2016 (Cham / Heidelberg / New York / Dordrecht / Lon-don, 2016), P. Sojka, A. Horak, I. Kopecek, and K. Pala, Eds., no. 9924 in LectureNotes in Computer Science, Masaryk University, Springer International Publishing,pp. 231–238.
[17] BOUCHARD, C., BLAIR, S. N., AND HASKELL, W. L. Physical activity andhealth. Human Kinetics, 2018.
[18] BOWMAN, S. R., ANGELI, G., POTTS, C., AND MANNING, C. D. A largeannotated corpus for learning natural language inference. In Proceedings of the2015 Conference on Empirical Methods in Natural Language Processing (EMNLP)(2015), Association for Computational Linguistics.
[19] BOYD, R. L. RIOT Scan: Recursive Inspection of Text Scanner, 2014.
[20] BOYD, R. L. Ye Olde Token Converter, 2014.
[21] BOYD, R. L. MEH: Meaning Extraction Helper (Version 1.4.05) [Software] Avail-able from http://meh.ryanb.cc, 2015.
[22] BOYD, R. L., SPANGHER, A., FOURNEY, A., NUSHI, B., RANADE, G., PEN-NEBAKER, J., AND HORVITZ, E. Characterizing the internet research agencys so-cial media operations during the 2016 us presidential election using linguistic anal-yses.
[23] BOYD, R. L., WILSON, S. R., PENNEBAKER, J. W., KOSINSKI, M., STILLWELL,D. J., AND MIHALCEA, R. Values in words: Using language to evaluate and under-stand personal values. In ICWSM (2015), pp. 31–40.
122

[24] BUBECK, M., AND BILSKY, W. Value structure at an early age. Swiss Journal ofPsychology 63 (2004), 31–41.
[25] BUNTINE, W. Variational extensions to em and multinomial pca. In EuropeanConference on Machine Learning (2002), Springer, pp. 23–34.
[26] BUTENKO, T., AND SCHWARTZ, S. Relations of the new circle of 19 values tobehaviors. Tech. rep., National Research University Higher School of Economics,2013.
[27] CALINSKI, T., AND HARABASZ, J. A dendrite method for cluster analysis. Com-munications in Statistics-theory and Methods 3, 1 (1974), 1–27.
[28] CAPRARA, G. V., SCHWARTZ, S., CAPANNA, C., VECCHIONE, M., AND BAR-BARANELLI, C. Personality and politics: Values, traits, and political choice. Politi-cal Psychology 27 (2006), 1–28.
[29] CHANG, J., GERRISH, S., WANG, C., BOYD-GRABER, J. L., AND BLEI, D. M.Reading tea leaves: How humans interpret topic models. In Advances in neuralinformation processing systems (2009), pp. 288–296.
[30] CHUNG, C. K., AND PENNEBAKER, J. W. Revealing dimensions of thinking inopen-ended self-descriptions: An automated meaning extraction method for naturallanguage. Journal of Research in Personality 42 (2008), 96–132.
[31] CHUNG, C. K., RENTFROW, P. J., AND PENNEBAKER, J. W. Finding values inwords: Using natural language to detect regional variations in personal concerns. InGeographical psychology: Exploring the interaction of environment and behavior.American Psychological Association, 2014, pp. 195–216.
[32] CHURCH, K. W., AND HANKS, P. Word association norms, mutual information,and lexicography. Computational linguistics 16, 1 (1990), 22–29.
[33] COLTHEART, M. The mrc psycholinguistic database. The Quarterly Journal ofExperimental Psychology 33, 4 (1981), 497–505.
[34] CONNEAU, A., KIELA, D., SCHWENK, H., BARRAULT, L., AND BORDES, A.Supervised Learning of Universal Sentence Representations from Natural LanguageInference Data. ArXiv e-prints (May 2017).
[35] CONNEAU, A., KIELA, D., SCHWENK, H., BARRAULT, L., AND BORDES, A.Supervised learning of universal sentence representations from natural language in-ference data. arXiv preprint arXiv:1705.02364 (2017).
[36] COSTER, W., AND KAUCHAK, D. Simple english wikipedia: a new text simpli-fication task. In Proceedings of the 49th Annual Meeting of the Association forComputational Linguistics: Human Language Technologies: short papers-Volume 2(2011), Association for Computational Linguistics, pp. 665–669.
123

[37] COVER, T. M., AND THOMAS, J. A. Elements of information theory. John Wiley& Sons, 2012.
[38] DAVIDOV, E., MEULEMAN, B., BILLIET, J., AND SCHMIDT, P. Values and supportfor immigration: A cross-country comparison. European Sociological Review 24, 5(2008), 583–599.
[39] DAVIES, D. L., AND BOULDIN, D. W. A cluster separation measure. IEEE trans-actions on pattern analysis and machine intelligence, 2 (1979), 224–227.
[40] DOUMIT, S., AND MINAI, A. Online news media bias analysis using an lda-nlpapproach. In International Conference on Complex Systems (2011).
[41] FARUQUI, M., AND DYER, C. Non-distributional word vector representations.CoRR abs/1506.05230 (2015).
[42] FARUQUI, M., TSVETKOV, Y., RASTOGI, P., AND DYER, C. Problems withevaluation of word embeddings using word similarity tasks. arXiv preprintarXiv:1605.02276 (2016).
[43] FAST, E., CHEN, B., AND BERNSTEIN, M. S. Empath: Understanding topic signalsin large-scale text. In Proceedings of the 2016 CHI Conference on Human Factorsin Computing Systems (2016), ACM, pp. 4647–4657.
[44] FAST, E., MCGRATH, W., RAJPURKAR, P., AND BERNSTEIN, M. S. Augur:Mining human behaviors from fiction to power interactive systems. In Proceedingsof the 2016 CHI Conference on Human Factors in Computing Systems (2016), ACM,pp. 237–247.
[45] FINKELSTEIN, L., GABRILOVICH, E., MATIAS, Y., RIVLIN, E., SOLAN, Z.,WOLFMAN, G., AND RUPPIN, E. Placing search in context: The concept revis-ited. In Proceedings of the 10th international conference on World Wide Web (2001),ACM, pp. 406–414.
[46] FREUND, Y., IYER, R., SCHAPIRE, R. E., AND SINGER, Y. An efficient boostingalgorithm for combining preferences. The Journal of machine learning research 4(2003), 933–969.
[47] GANITKEVITCH, J., VAN DURME, B., AND CALLISON-BURCH, C. Ppdb: Theparaphrase database. In HLT-NAACL (2013), pp. 758–764.
[48] GARTEN, J., HOOVER, J., JOHNSON, K. M., BOGHRATI, R., ISKIWITCH, C.,AND DEHGHANI, M. Dictionaries and distributions: Combining expert knowl-edge and large scale textual data content analysis. Behavior research methods 50, 1(2018), 344–361.
[49] GERZ, D., VULIC, I., HILL, F., REICHART, R., AND KORHONEN, A. SimVerb-3500: A Large-Scale Evaluation Set of Verb Similarity. In EMNLP (2016).
124

[50] GODIN, F., SLAVKOVIKJ, V., DE NEVE, W., SCHRAUWEN, B., AND VAN DE
WALLE, R. Using topic models for twitter hashtag recommendation. In Proceedingsof the 22nd International Conference on World Wide Web (2013), ACM, pp. 593–596.
[51] GOECKS, J., AND SHAVLIK, J. Learning users’ interests by unobtrusively observ-ing their normal behavior. In Proceedings of the 5th international conference onIntelligent user interfaces (2000), ACM, pp. 129–132.
[52] GRAHAM, J., HAIDT, J., AND NOSEK, B. A. Liberals and conservatives rely ondifferent sets of moral foundations. Journal of personality and social psychology 96,5 (2009), 1029.
[53] GROVER, A., AND LESKOVEC, J. node2vec: Scalable feature learning for net-works. In Proceedings of the 22nd ACM SIGKDD International Conference onKnowledge Discovery and Data Mining (2016), ACM, pp. 855–864.
[54] HEINE, S. J., AND RUBY, M. B. Cultural psychology. Wiley InterdisciplinaryReviews: Cognitive Science 1, 2 (2010), 254–266.
[55] HENRICH, J., HEINE, S. J., AND NORENZAYAN, A. The weirdest people in theworld? Behavioral and brain sciences 33, 2-3 (2010), 61–83.
[56] HILL, F., REICHART, R., AND KORHONEN, A. Simlex-999: Evaluating semanticmodels with (genuine) similarity estimation. Computational Linguistics (2016).
[57] HOFFMAN, M., BACH, F. R., AND BLEI, D. M. Online learning for latent dirichletallocation. In advances in neural information processing systems (2010), pp. 856–864.
[58] HU, D. J., AND SAUL, L. K. A probabilistic topic model for music analysis. InProc. of NIPS (2009), vol. 9, Citeseer.
[59] HUANG, E. H., SOCHER, R., MANNING, C. D., AND NG, A. Y. Improving wordrepresentations via global context and multiple word prototypes. In Proceedings ofthe 50th Annual Meeting of the Association for Computational Linguistics: LongPapers-Volume 1 (2012), Association for Computational Linguistics, pp. 873–882.
[60] IGO, S. P., AND RILOFF, E. Corpus-based semantic lexicon induction with web-based corroboration. In Proceedings of the Workshop on Unsupervised and Mini-mally Supervised Learning of Lexical Semantics (2009), Association for Computa-tional Linguistics, pp. 18–26.
[61] INGLEHART, R., AND WELZEL, C. Modernization, cultural change, and democ-racy: The human development sequence. Cambridge University Press, 2005.
[62] KAISER, H. F. The varimax criterion for analytic rotation in factor analysis. Psy-chometrika 23, 3 (1958), 187–200.
125
[63] KAISER, H. F. The varimax criterion for analytic rotation in factor analysis. Psy-chometrika 23, 3 (1958), 187–200.
[64] KEARNS, K. Light verbs in english, 1988.
[65] KINGMA, D. P., AND BA, J. Adam: A method for stochastic optimization. arXivpreprint arXiv:1412.6980 (2014).
[66] KIROS, R., ZHU, Y., SALAKHUTDINOV, R. R., ZEMEL, R., URTASUN, R., TOR-RALBA, A., AND FIDLER, S. Skip-thought vectors. In Advances in neural informa-tion processing systems (2015), pp. 3294–3302.
[67] KOLB, J., AND KOLB, J. The Big Data Revolution. CreateSpace IndependentPublishing Platform, 2013.
[68] KOSINSKI, M., STILLWELL, D., AND GRAEPEL, T. Private traits and attributesare predictable from digital records of human behavior. Proceedings of the NationalAcademy of Sciences 110, 15 (2013), 5802–5805.
[69] KOSINSKI, M., STILLWELL, D., AND GRAEPEL, T. Private traits and attributesare predictable from digital records of human behavior. Proceedings of the NationalAcademy of Sciences 110, 15 (2013), 5802–5805.
[70] KRAMER, A. D., AND CHUNG, C. K. Dimensions of self-expression in facebookstatus updates. ICWSM (2011).
[71] KRAMER, A. D., AND CHUNG, C. K. Dimensions of self-expression in facebookstatus updates. In Fifth International AAAI Conference on Weblogs and Social Media(2011).
[72] KRISTIANSEN, C. M., AND ZANNA, M. P. Justifying attitudes by appealing tovalues: A functional perspective. British Journal of Social Psychology 27, 3 (1988),247–256.
[73] LANG, K. Newsweeder: Learning to filter netnews. In Proceedings of the TwelfthInternational Conference on Machine Learning (1995), pp. 331–339.
[74] LE, Q. V., AND MIKOLOV, T. Distributed representations of sentences and docu-ments. In ICML (2014), vol. 14, pp. 1188–1196.
[75] LEFEBVRE, L., LEFEBVRE, L., BLACKBURN, K., AND BOYD, R. Student es-timates of public speaking competency: The meaning extraction helper and videoself-evaluation. Communication Education 64, 3 (2015), 261–279.
[76] LEPLEY, R. The Language of Value. Columbia University Press, New York, 1957.
[77] LEVY, O., AND GOLDBERG, Y. Dependency-based word embeddings. In ACL (2)(2014), Citeseer, pp. 302–308.
126

[78] LEVY, O., AND GOLDBERG, Y. Neural word embedding as implicit matrix factor-ization. In Advances in neural information processing systems (2014), pp. 2177–2185.
[79] LI, J., CARDIE, C., AND LI, S. Topicspam: a topic-model based approach forspam detection. In Proceedings of the 51st Annual Meeting of the Association forComputational Linguistics (Volume 2: Short Papers) (2013), vol. 2, pp. 217–221.
[80] LIU, L., TANG, L., DONG, W., YAO, S., AND ZHOU, W. An overview of topicmodeling and its current applications in bioinformatics. SpringerPlus 5, 1 (2016),1608.
[81] LOWE, R. D., HEIM, D., CHUNG, C. K., DUFFY, J. C., DAVIES, J. B., AND
PENNEBAKER, J. W. In verbis, vinum? relating themes in an open-ended writingtask to alcohol behaviors. Appetite 68 (2013), 8–13.
[82] LU, Q., AND GETOOR, L. Link-based classification. In Proceedings of the 20thInternational Conference on Machine Learning (ICML-03) (2003), pp. 496–503.
[83] LUCAS, C., NIELSEN, R. A., ROBERTS, M. E., STEWART, B. M., STORER, A.,AND TINGLEY, D. Computer-assisted text analysis for comparative politics. Politi-cal Analysis 23, 2 (2015), 254–277.
[84] MAGNINI, B., AND CAVAGLIA, G. Integrating subject field codes into wordnet. InLREC (2000), pp. 1413–1418.
[85] MAIRESSE, F., WALKER, M. A., MEHL, M. R., AND MOORE, R. K. Usinglinguistic cues for the automatic recognition of personality in conversation and text.Journal of artificial intelligence research (2007), 457–500.
[86] MARELLI, M., MENINI, S., BARONI, M., BENTIVOGLI, L., BERNARDI, R., AND
ZAMPARELLI, R. A sick cure for the evaluation of compositional distributionalsemantic models. In LREC (2014), pp. 216–223.
[87] MIKOLOV, T., SUTSKEVER, I., CHEN, K., CORRADO, G. S., AND DEAN, J. Dis-tributed representations of words and phrases and their compositionality. In Ad-vances in neural information processing systems (2013), pp. 3111–3119.
[88] MILLER, G. A. Wordnet: a lexical database for english. Communications of theACM 38, 11 (1995), 39–41.
[89] MISRA, G., AND GERGEN, K. J. On the place of culture in psychological science.International Journal of Psychology 28, 2 (1993), 225.
[90] MITCHELL, J., AND LAPATA, M. Composition in distributional models of seman-tics. Cognitive science 34, 8 (2010), 1388–1429.
[91] MOHAMMAD, S. M., AND TURNEY, P. D. Crowdsourcing a word–emotion asso-ciation lexicon. Computational Intelligence 29, 3 (2013), 436–465.
127
[92] MORSTATTER, F., AND LIU, H. A novel measure for coherence in statistical topicmodels. In Proceedings of the 54th Annual Meeting of the Association for Compu-tational Linguistics (Volume 2: Short Papers) (2016), vol. 2, pp. 543–548.
[93] MRKSIC, N., SEAGHDHA, D. O., THOMSON, B., GASIC, M., ROJAS-BARAHONA, L., SU, P.-H., VANDYKE, D., WEN, T.-H., AND YOUNG,S. Counter-fitting word vectors to linguistic constraints. arXiv preprintarXiv:1603.00892 (2016).
[94] MURDOCK JR, B. B. The serial position effect of free recall. Journal of experimen-tal psychology 64, 5 (1962), 482.
[95] NALLAPATI, R., MELNYK, I., KUMAR, A., AND ZHOU, B. Sengen: Sentencegenerating neural variational topic model. arXiv preprint arXiv:1708.00308 (2017).
[96] NEWMAN, D., LAU, J. H., GRIESER, K., AND BALDWIN, T. Automatic evaluationof topic coherence. In Human Language Technologies: The 2010 Annual Conferenceof the North American Chapter of the Association for Computational Linguistics(2010), Association for Computational Linguistics, pp. 100–108.
[97] NGUYEN, D. Q., SIRTS, K., AND JOHNSON, M. Improving topic coherencewith latent feature word representations in map estimation for topic modeling. InProceedings of the Australasian Language Technology Association Workshop 2015(2015), pp. 116–121.
[98] OLTEANU, A., CASTILLO, C., DIAZ, F., AND VIEWEG, S. Crisislex: A lexicon forcollecting and filtering microblogged communications in crises. In ICWSM (2014).
[99] OUELLETTE, J. A., AND WOOD, W. Habit and intention in everyday life: Themultiple processes by which past behavior predicts future behavior. Psychologicalbulletin 124, 1 (1998), 54.
[100] PAN, S. J., AND YANG, Q. A survey on transfer learning. IEEE Transactions onknowledge and data engineering 22, 10 (2010), 1345–1359.
[101] PAUL, M., AND GIRJU, R. Cross-cultural analysis of blogs and forums with mixed-collection topic models. In Proceedings of the 2009 Conference on Empirical Meth-ods in Natural Language Processing: Volume 3-Volume 3 (2009), Association forComputational Linguistics, pp. 1408–1417.
[102] PAUNONEN, S. V., AND ASHTON, M. C. Big five factors and facets and the pre-diction of behavior. Journal of personality and social psychology 81, 3 (2001), 524.
[103] PEARSON, K. On lines and planes of closest fit to systems of points in space. TheLondon, Edinburgh, and Dublin Philosophical Magazine and Journal of Science 2,11 (1901), 559–572.
128
[104] PEDREGOSA, F., VAROQUAUX, G., GRAMFORT, A., MICHEL, V., THIRION, B.,GRISEL, O., BLONDEL, M., PRETTENHOFER, P., WEISS, R., DUBOURG, V.,VANDERPLAS, J., PASSOS, A., COURNAPEAU, D., BRUCHER, M., PERROT, M.,AND DUCHESNAY, E. Scikit-learn: Machine learning in Python. Journal of MachineLearning Research 12 (2011), 2825–2830.
[105] PENG, K., NISBETT, R. E., AND WONG, N. Y. Validity problems comparingvalues across cultures and possible solutions. Psychological methods 2, 4 (1997),329.
[106] PENNEBAKER, J. W., BOYD, R. L., JORDAN, K., AND BLACKBURN, K. Thedevelopment and psychometric properties of liwc2015. Tech. rep., 2015.
[107] PENNEBAKER, J. W., FRANCIS, M. E., AND BOOTH, R. J. Linguistic inquiry andword count: Liwc 2001. Mahway: Lawrence Erlbaum Associates 71 (2001), 2001.
[108] PENNINGTON, J., SOCHER, R., AND MANNING, C. Glove: Global vectors forword representation. In Proceedings of the 2014 conference on empirical methodsin natural language processing (EMNLP) (2014), pp. 1532–1543.
[109] PENNINGTON, J., SOCHER, R., AND MANNING, C. D. Glove: Global vectors forword representation. In EMNLP (2014), vol. 14, pp. 1532–1543.
[110] PORTEOUS, I., NEWMAN, D., IHLER, A., ASUNCION, A., SMYTH, P., AND
WELLING, M. Fast collapsed gibbs sampling for latent dirichlet allocation. InProceedings of the 14th ACM SIGKDD international conference on Knowledge dis-covery and data mining (2008), ACM, pp. 569–577.
[111] POWERS, D. M. Applications and explanations of zipf’s law. In Proceedings of thejoint conferences on new methods in language processing and computational naturallanguage learning (1998), Association for Computational Linguistics, pp. 151–160.
[112] RAMAGE, D., HALL, D., NALLAPATI, R., AND MANNING, C. D. Labeled lda: Asupervised topic model for credit attribution in multi-labeled corpora. In Proceed-ings of the 2009 Conference on Empirical Methods in Natural Language Processing:Volume 1-Volume 1 (2009), Association for Computational Linguistics, pp. 248–256.
[113] RAMIREZ-ESPARZA, N., CHUNG, C. K., KACEWICZ, E., AND PENNEBAKER,J. W. The psychology of word use in depression forums in english and in spanish:Texting two text analytic approaches. In International Conference on Weblogs andSocial Media (2008).
[114] RAO, D., AND RAVICHANDRAN, D. Semi-supervised polarity lexicon induction.In Proceedings of the 12th Conference of the European Chapter of the Associationfor Computational Linguistics (2009), Association for Computational Linguistics,pp. 675–682.
129
[115] RASHKIN, H., SAP, M., ALLAWAY, E., SMITH, N. A., AND CHOI, Y.Event2mind: Commonsense inference on events, intents, and reactions. In ACL(2018).
[116] RAZAVIAN, A. S., AZIZPOUR, H., SULLIVAN, J., AND CARLSSON, S. CNNfeatures off-the-shelf: an astounding baseline for recognition. In Computer Visionand Pattern Recognition Workshops (CVPRW), 2014 IEEE Conference on (2014),IEEE, pp. 512–519.
[117] REIMERS, N., BEYER, P., AND GUREVYCH, I. Task-oriented intrinsic evaluationof semantic textual similarity.
[118] ROHAN, M. J. A Rose by Any Name? The Values Construct. Personality andSocial Psychology Review 4, 3 (2000), 255–277.
[119] ROKEACH, M. Beliefs, Attitudes, and Values., vol. 34. Jossey-Bass, San Francisco,1968.
[120] ROKEACH, M. The nature of human values. Free press, 1973.
[121] ROKEACH, M. The Nature of Human Values, vol. 70. New York Free Press, 1973.
[122] ROSEN-ZVI, M., GRIFFITHS, T., STEYVERS, M., AND SMYTH, P. The author-topic model for authors and documents. In Proceedings of the 20th conference onUncertainty in artificial intelligence (2004), AUAI Press, pp. 487–494.
[123] ROUSSEEUW, P. J. Silhouettes: a graphical aid to the interpretation and validationof cluster analysis. Journal of computational and applied mathematics 20 (1987),53–65.
[124] SCHOFIELD, A., AND MIMNO, D. Comparing apples to apple: The effects of stem-mers on topic models. Transactions of the Association for Computational Linguistics4 (2016), 287–300.
[125] SCHWARTZ, S. H. Universals in the Content and Structure of Values: TheoreticalAdvances and Empirical Tests in 20 Countries. Advances in Experimental SocialPsychology 25 (1992), 1–65.
[126] SCHWARTZ, S. H. Are there universal aspects in the structure and contents of humanvalues? Journal of social issues 50, 4 (1994), 19–45.
[127] SCHWARTZ, S. H. Beyond individualism/collectivism: New cultural dimensions ofvalues. Sage Publications, Inc, 1994.
[128] SCHWARTZ, S. H. Mapping and interpreting cultural differences around theworld. In Comparing Cultures, Dimensions of Culture in a Comparative Perspec-tive, H. Vinken, J. Soeters, and P. Ester, Eds. Brill, Leiden, the Netherlands, 2004,pp. 43–73.
130

[129] SCHWARTZ, S. H. Draft users manual: Proper use of the schwartz value survey,version 14, 2009.
[130] SCHWARTZ, S. H. An overview of the schwartz theory of basic values. Onlinereadings in Psychology and Culture 2, 1 (2012), 11.
[131] SCHWARTZ, S. H., CIECIUCH, J., VECCHIONE, M., DAVIDOV, E., FIS-CHER, R., BEIERLEIN, C., RAMOS, A., VERKASALO, M., LONNQVIST, J.-E.,DEMIRUTKU, K., DIRILEN-GUMUS, O., AND KONTY, M. Refining the theory ofbasic individual values. Journal of Personality and Social Psychology 103, 4 (2012),663–688.
[132] SCHWARTZ, S. H., AND HUISMANS, S. Value Priorities and Religiosity in FourWestern Religions. Social Psychology Quarterly 58 (1995), 88.
[133] STONE, P. J., BALES, R. F., NAMENWIRTH, J. Z., AND OGILVIE, D. M. Thegeneral inquirer: A computer system for content analysis and retrieval based on thesentence as a unit of information. Systems Research and Behavioral Science 7, 4(1962), 484–498.
[134] TEH, Y. W., JORDAN, M. I., BEAL, M. J., AND BLEI, D. M. Hierarchical dirichletprocesses. Journal of the american statistical association (2012).
[135] THELEN, M., AND RILOFF, E. A bootstrapping method for learning semantic lexi-cons using extraction pattern contexts. In Proceedings of the ACL-02 conference onEmpirical methods in natural language processing-Volume 10 (2002), Associationfor Computational Linguistics, pp. 214–221.
[136] TIAN, F., GAO, B., HE, D., AND LIU, T.-Y. Sentence level recurrent topic model:letting topics speak for themselves. arXiv preprint arXiv:1604.02038 (2016).
[137] TRIPODI, R., AND PELILLO, M. A game-theoretic approach to word sense disam-biguation. Computational Linguistics (2016).
[138] WANG, R., HARARI, G., HAO, P., ZHOU, X., AND CAMPBELL, A. T. Smartgpa:how smartphones can assess and predict academic performance of college students.In Proceedings of the 2015 ACM international joint conference on pervasive andubiquitous computing (2015), ACM, pp. 295–306.
[139] WIETING, J., BANSAL, M., GIMPEL, K., AND LIVESCU, K. Towards universalparaphrastic sentence embeddings. arXiv preprint arXiv:1511.08198 (2015).
[140] WIETING, J., BANSAL, M., GIMPEL, K., AND LIVESCU, K. Charagram: Embed-ding words and sentences via character n-grams. arXiv preprint arXiv:1607.02789(2016).
[141] WIETING, J., AND GIMPEL, K. Pushing the limits of paraphrastic sentence em-beddings with millions of machine translations. In arXiv preprint arXiv:1711.05732(2017).
131

[142] WIETING, J., AND GIMPEL, K. Revisiting Recurrent Networks for ParaphrasticSentence Embeddings. ArXiv e-prints (Apr. 2017).
[143] WILLIAMS, A., NANGIA, N., AND BOWMAN, S. R. A broad-coveragechallenge corpus for sentence understanding through inference. arXiv preprintarXiv:1704.05426 (2017).
[144] WILSON, S., AND MIHALCEA, R. Measuring semantic relations between humanactivities. In Proceedings of the Eighth International Joint Conference on NaturalLanguage Processing (Volume 1: Long Papers) (2017), vol. 1, pp. 664–673.
[145] WILSON, S. R., SHEN, Y., AND MIHALCEA, R. Building and validating hierarchi-cal lexicons with a case study on personal values. In International Conference onSocial Informatics (2018), Springer, pp. 455–470.
[146] WILSON, T., WIEBE, J., AND HOFFMANN, P. Recognizing contextual polarity inphrase-level sentiment analysis. In Proceedings of the conference on human lan-guage technology and empirical methods in natural language processing (2005),Association for Computational Linguistics, pp. 347–354.
[147] WITTEN, I. H., AND FRANK, E. Introduction to weka. Data mining: practicalmachine learning tools and techniques 2 (2005), 365–368.
[148] WOLF, M., CHUNG, C. K., AND KORDY, H. Inpatient treatment to online aftercare:e-mailing themes as a function of therapeutic outcomes. Psychotherapy Research 20,1 (2010), 71–85.
[149] YIN, H., CUI, B., CHEN, L., HU, Z., AND HUANG, Z. A temporal context-aware model for user behavior modeling in social media systems. In Proceedings ofthe 2014 ACM SIGMOD international conference on Management of data (2014),ACM, pp. 1543–1554.
[150] YODER, P. J., BLACKFORD, J. U., WALLER, N. G., AND KIM, G. Enhancingpower while controlling family-wise error: an illustration of the issues using elec-trocortical studies. Journal of Clinical and Experimental Neuropsychology 26, 3(2004), 320–331.
[151] ZHANG, L., WILSON, S. R., AND MIHALCEA, R. Sequential network transfer:Adapting sentence embeddings to human activities and beyond. arXiv preprintarXiv:1804.07835 (2018).
[152] ZHAO, W. X., JIANG, J., WENG, J., HE, J., LIM, E.-P., YAN, H., AND LI, X.Comparing twitter and traditional media using topic models. In European conferenceon information retrieval (2011), Springer, pp. 338–349.
[153] ZHAO, W. X., JIANG, J., WENG, J., HE, J., LIM, E.-P., YAN, H., AND LI, X.Comparing twitter and traditional media using topic models. In Advances in Infor-mation Retrieval. Springer, 2011, pp. 338–349.
132