Natural Gas Vehicle Market Whitepaper USA 2013-2014
44
For more information, visit www.ngvevent.com Natural Gas Vehicle Market Whitepaper USA 2013-2014 Whitepaper highlights include: NGV USA Market Overview: Comprehensive analysis of the North American NGV Market Government Policies: How they will impact the NGV market over the next 5 years Converting to Natural Gas: Key considerations to address when converting your fleet to NGV’s Infrastructure Development: How to successfully plan and build NGV infrastructure
-
Upload
marcellus-drilling-news -
Category
News & Politics
-
view
1.894 -
download
0
Transcript of Natural Gas Vehicle Market Whitepaper USA 2013-2014

For more information, visit www.ngvevent.com
Natural Gas Vehicle Market Whitepaper USA2013-2014
Whitepaper highlights include:
NGV USA Market Overview: Comprehensive analysis of the North American NGV Market
Government Policies: How they will impact the NGV market over the next 5 years
Converting to Natural Gas: Key considerations to address when converting your fleet to NGV’s
Infrastructure Development: How to successfully plan and build NGV infrastructure

WELCO
ME
For more information visit www.ngvevent.com NGV INDUSTRY OVERVIEW | 2
Welcome
Dear Colleague
Thank you for your interest in this FC Gas Intelligence Whitepaper on the Natural Gas Vehicle market in North America, 2013-14, I hope you find it valuable.
Natural Gas Vehicle’s (NGV) are at a seminal moment in the United States currently, with a range of stakeholders driving the development of the market. To get a thorough overview the report interviewed over 20 industry experts, drawing their combined expertise into this document to better inform your strategies over the next few years.
This Whitepaper is only the beginning of the debate on Natural Gas Vehicle’s, it has been created in conjunction with the 3rd Natural Gas Vehicle USA Conference & Exhibition (June 11-13, Houston) more info can be found here www.ngvevent.com
I hope you find the report useful and I look forward to speaking to you soon,
With very best wishesJoshua BullSector Head | FC Gas Intelligence

AB
OU
T FC BU
SINESS IN
TELLIGEN
CE
For more information visit www.ngvevent.com NGV INDUSTRY OVERVIEW | 3
About FC Gas Intelligence
A business intelligence and networking company we help leading corporations define their future strategy and direction, develop growth opportunities and solve the problems facing their sectors. The engines of our business are growth and change. We focus on two types of industry:
■ Those arising from technology developments which are moving into full global commercialisation. ■ Those needing to change in order to respond to disruptive technologies or global events.
Our aim is to provide companies with insights into strategic options for the future in order that they can capitalise on opportunity.
Disclaimer FC Business Intelligence Ltd and its partners prepared the information and opinions in this report. FC Business Intelligence has no obligation to tell you when opinions or information in this report change. FC Business Intelligence Ltd makes every effort to use reliable, comprehensive information, but it makes no representation that the information is accurate or complete. In no event shall FC Business Intelligence Ltd and its partners be liable for any damages, losses, expenses, loss of data, loss of opportunity or profit caused by the use of the material or contents of this report.
No part of this document may be distributed, resold, copied or adapted without FC Business Intelligence Ltd ‘s prior written permission.
© FC Business Intelligence Ltd © 2013
Author

CON
TENTS
For more information visit www.ngvevent.com NGV INDUSTRY OVERVIEW | 4
Contents
Welcome . . . . . . . . . . . . . . . . . . . . . . . . . . . . . . . . . . . . . . . . . . . . . . . . . . . . . . . . . . 2
About FC Gas Intelligence . . . . . . . . . . . . . . . . . . . . . . . . . . . . . . . . . . . . . . . . . . . . . . . 3
List of Tables . . . . . . . . . . . . . . . . . . . . . . . . . . . . . . . . . . . . . . . . . . . . . . . . . . . . . . . . 6
Executive Summary . . . . . . . . . . . . . . . . . . . . . . . . . . . . . . . . . . . . . . . . . . . . . . . . . . 7-8
Chapter 1: NGV Industry Overview . . . . . . . . . . . . . . . . . . . . . . . . . . . . . . . . . . . . . . . . . . 9
1.0 Market Size and Growth Forecasts . . . . . . . . . . . . . . . . . . . . . . . . . . . . . . . . . . . . . . . . . . . . . . . . . . . . . . . . . . .9
1.1 Growth drivers . . . . . . . . . . . . . . . . . . . . . . . . . . . . . . . . . . . . . . . . . . . . . . . . . . . . . . . . . . . . . . . . . . . . . . . . . . . . 10
1.2 NGVs on the Road . . . . . . . . . . . . . . . . . . . . . . . . . . . . . . . . . . . . . . . . . . . . . . . . . . . . . . . . . . . . . . . . . . . . . . . . 13
1.3 Locations of Existing CNG and LNG Stations . . . . . . . . . . . . . . . . . . . . . . . . . . . . . . . . . . . . . . . . . . . . . . . 13
1.4 Proposed expansion of CNG and LNG fueling networks . . . . . . . . . . . . . . . . . . . . . . . . . . . . . . . . . . . . . . . . . . . . . . . . . . . . . . . . . . . . . . . . . 16
1.5 Expansion of Small and Midsize LNG Liquefaction Plants . . . . . . . . . . . . . . . . . . . . . . . . . . . . . . . . . . 20
1.6 Conclusion . . . . . . . . . . . . . . . . . . . . . . . . . . . . . . . . . . . . . . . . . . . . . . . . . . . . . . . . . . . . . . . . . . . . . . . . . . . . . . . 21
Chapter 2: Government policies: How they will shape the NGV market over the next 5 years . . . . .22
2.0 Introduction . . . . . . . . . . . . . . . . . . . . . . . . . . . . . . . . . . . . . . . . . . . . . . . . . . . . . . . . . . . . . . . . . . . . . . . . . . . . . . 22
2.1 Policy in context . . . . . . . . . . . . . . . . . . . . . . . . . . . . . . . . . . . . . . . . . . . . . . . . . . . . . . . . . . . . . . . . . . . . . . . . . . 22
2.2 Subsidies and tax incentives . . . . . . . . . . . . . . . . . . . . . . . . . . . . . . . . . . . . . . . . . . . . . . . . . . . . . . . . . . . . . . 22
2.3 Procurement policy . . . . . . . . . . . . . . . . . . . . . . . . . . . . . . . . . . . . . . . . . . . . . . . . . . . . . . . . . . . . . . . . . . . . . . . 23
2.4 CAFÉ standards . . . . . . . . . . . . . . . . . . . . . . . . . . . . . . . . . . . . . . . . . . . . . . . . . . . . . . . . . . . . . . . . . . . . . . . . . . . 24
2.5 Environmental regulation: potential risk? . . . . . . . . . . . . . . . . . . . . . . . . . . . . . . . . . . . . . . . . . . . . . . . . . . 25
2.6 Export policy: potential risk? . . . . . . . . . . . . . . . . . . . . . . . . . . . . . . . . . . . . . . . . . . . . . . . . . . . . . . . . . . . . . . 25
2.8 Conclusion . . . . . . . . . . . . . . . . . . . . . . . . . . . . . . . . . . . . . . . . . . . . . . . . . . . . . . . . . . . . . . . . . . . . . . . . . . . . . . . 27
Chapter 3: Converting to Natural Gas, Vehicle issues . . . . . . . . . . . . . . . . . . . . . . . . . . . . . .28
3.0 Introduction . . . . . . . . . . . . . . . . . . . . . . . . . . . . . . . . . . . . . . . . . . . . . . . . . . . . . . . . . . . . . . . . . . . . . . . . . . . . . 28
3.1 Passenger automobiles . . . . . . . . . . . . . . . . . . . . . . . . . . . . . . . . . . . . . . . . . . . . . . . . . . . . . . . . . . . . . . . . . . . 28
3.2 Light and medium duty trucking vehicle options . . . . . . . . . . . . . . . . . . . . . . . . . . . . . . . . . . . . . . . . . . 29
3.3 State subsidies for light-duty NGVS . . . . . . . . . . . . . . . . . . . . . . . . . . . . . . . . . . . . . . . . . . . . . . . . . . . . . . . . 31
3.4 Heavy duty trucking . . . . . . . . . . . . . . . . . . . . . . . . . . . . . . . . . . . . . . . . . . . . . . . . . . . . . . . . . . . . . . . . . . . . . . 33
3.5 Factors to consider in HD fleet conversions . . . . . . . . . . . . . . . . . . . . . . . . . . . . . . . . . . . . . . . . . . . . . . . 34
3.6 State subsidies for heavy-duty fleet conversion . . . . . . . . . . . . . . . . . . . . . . . . . . . . . . . . . . . . . . . . . . . . 36
3.7 Conclusion . . . . . . . . . . . . . . . . . . . . . . . . . . . . . . . . . . . . . . . . . . . . . . . . . . . . . . . . . . . . . . . . . . . . . . . . . . . . . . . 37
Chapter 4: Building Dedicated Fuelling Infrastructure, CNG and LNG . . . . . . . . . . . . . . . . . . . .38
4.1 Introduction . . . . . . . . . . . . . . . . . . . . . . . . . . . . . . . . . . . . . . . . . . . . . . . . . . . . . . . . . . . . . . . . . . . . . . . . . . . . . . 38
4.2 Basic cost considerations, CNG compared to LNG . . . . . . . . . . . . . . . . . . . . . . . . . . . . . . . . . . . . . . . . . 38
4.3 Design, planning, and siting of CNG fuelling stations . . . . . . . . . . . . . . . . . . . . . . . . . . . . . . . . . . . . . . 39
4.4 Design, planning, and siting of LNG fuelling stations . . . . . . . . . . . . . . . . . . . . . . . . . . . . . . . . . . . . . . 42
4.5 Conclusion . . . . . . . . . . . . . . . . . . . . . . . . . . . . . . . . . . . . . . . . . . . . . . . . . . . . . . . . . . . . . . . . . . . . . . . . . . . . . . . 44

FIGU
RES
For more information visit www.ngvevent.com NGV INDUSTRY OVERVIEW | 5
Figures
Figure 1 Natural gas consumption by sector, 1990-2040 (trillion cubic feet) . . . . . . . . . . . . . . . . . . . . . . 9
Figure 2 U .S . Natural Gas Vehicle Fuel Consumption MMcf . . . . . . . . . . . . . . . . . . . . . . . . . . . . . . . . . . . . . 10
Figure 3 Average diesel, gasoline, and CNG prices, 2000-2012 . . . . . . . . . . . . . . . . . . . . . . . . . . . . . . . . . 10
Figure 4 Price differential CNG to diesel, by state . . . . . . . . . . . . . . . . . . . . . . . . . . . . . . . . . . . . . . . . . . . . . . 12
Figure 5 PCT . Growth in public access CNG stations 7/11-8/13 . . . . . . . . . . . . . . . . . . . . . . . . . . . . . . . . . . 13
Figure 6 Regional Transportation Corridors . . . . . . . . . . . . . . . . . . . . . . . . . . . . . . . . . . . . . . . . . . . . . . . . . . . 14
Figure 7 Locations of CNG stations . . . . . . . . . . . . . . . . . . . . . . . . . . . . . . . . . . . . . . . . . . . . . . . . . . . . . . . . . . . 15
Figure 8 Locations of LNG Stations . . . . . . . . . . . . . . . . . . . . . . . . . . . . . . . . . . . . . . . . . . . . . . . . . . . . . . . . . . . 15
Figure 9 United States truck traffic volumes . . . . . . . . . . . . . . . . . . . . . . . . . . . . . . . . . . . . . . . . . . . . . . . . . . . 16
Figure 10 Projected expansion of Trillium CNG station network, 2013-2016 . . . . . . . . . . . . . . . . . . . . . . 17
Figure 11 Projected expansion of Love’s CNG network . . . . . . . . . . . . . . . . . . . . . . . . . . . . . . . . . . . . . . . . . . 17
Figure 12 Projected rollout of Clean Energy’s America’s Natural Gas Highway of LNG and LCNG stations . . . . . . . . . . . . . . . . . . . . . . . . . . . . . . . . . . . . . . . . . . . . . . . . . . . . . . . . . . . . . . . . . . . . . . . . . . . . 18
Figure 13 Projected network of LNG stations proposed by Shell and TravelCenters of America partnership . . . . . . . . . . . . . . . . . . . . . . . . . . . . . . . . . . . . . . . . . . . . . . . . . . . . . . . . . . . . . . . . . . . . . . . . . 19
Figure 14 Blu LNG operational and pending LNG fuelling network (as of end 2013) . . . . . . . . . . . . . . 19
Figure 15 Small and Mid Scale LNG Liquefaction plants* . . . . . . . . . . . . . . . . . . . . . . . . . . . . . . . . . . . . . . . . 20
Figure 16 Calculation of light-duty truck payback, based on various fuel price and truck premium assumptions . . . . . . . . . . . . . . . . . . . . . . . . . . . . . . . . . . . . . . . . . . . . . . . . . . . . . . . . . . . . . . . . . . . . . . . . 31
Figure 17 Map of states offering various incentives for light-duty CNG vehicles . . . . . . . . . . . . . . . . . . 32
Figure 18 Natural gas engine comparison-- power (hp) . . . . . . . . . . . . . . . . . . . . . . . . . . . . . . . . . . . . . . . . . 33
Figure 19 Natural gas engine comparison – torque (ft-lb) . . . . . . . . . . . . . . . . . . . . . . . . . . . . . . . . . . . . . . . 33
Figure 20 Sample calculation of expected payback for HD fleet conversion . . . . . . . . . . . . . . . . . . . . . . 34
Figure 21 Sample CNG range calculation . . . . . . . . . . . . . . . . . . . . . . . . . . . . . . . . . . . . . . . . . . . . . . . . . . . . . . . 35
Figure 22 Calculation of Heavy-duty truck payback, based on various fuel price and truck premium assumptions . . . . . . . . . . . . . . . . . . . . . . . . . . . . . . . . . . . . . . . . . . . . . . . . . . . . . . . . . . . . . . . . . . . . . . . . 36
Figure 23 Heavy-duty incentives, Canada and US (as of August 2013) . . . . . . . . . . . . . . . . . . . . . . . . . . . 37
Figure 24 GE CNG in a Box . . . . . . . . . . . . . . . . . . . . . . . . . . . . . . . . . . . . . . . . . . . . . . . . . . . . . . . . . . . . . . . . . . . . 41
Figure 25 GE LNG in a Box™ . . . . . . . . . . . . . . . . . . . . . . . . . . . . . . . . . . . . . . . . . . . . . . . . . . . . . . . . . . . . . . . . . . . 43
Figure 26 Micro LNG . . . . . . . . . . . . . . . . . . . . . . . . . . . . . . . . . . . . . . . . . . . . . . . . . . . . . . . . . . . . . . . . . . . . . . . . . . 43

TAB
LES
For more information visit www.ngvevent.com NGV INDUSTRY OVERVIEW | 6
List of Tables
Table 1 CNG average prices per region . . . . . . . . . . . . . . . . . . . . . . . . . . . . . . . . . . . . . . . . . . . . . . . . . . . . . . . .11
Table 2 Reduction of pollutants from CNG use, as compared with reformulated gasoline . . . . . . . . .12
Table 3 Small and Mid Scale LNG Liquefaction plants in the United States* . . . . . . . . . . . . . . . . . . . . . .20
Table 4 LNG Export facilities approved . . . . . . . . . . . . . . . . . . . . . . . . . . . . . . . . . . . . . . . . . . . . . . . . . . . . . . . .26
Table 5 Home fuelling specifications . . . . . . . . . . . . . . . . . . . . . . . . . . . . . . . . . . . . . . . . . . . . . . . . . . . . . . . . . .29
Table 6 Ford CNG model options (as of model year 2014) . . . . . . . . . . . . . . . . . . . . . . . . . . . . . . . . . . . . . . .30
Table 7 Chrysler CNG model options (as of model year 2014) . . . . . . . . . . . . . . . . . . . . . . . . . . . . . . . . . . .30
Table 8 GMC and Chevrolet CNG model options (as of model year 2014) . . . . . . . . . . . . . . . . . . . . . . . .30
Table 9 Summary of state incentives for light-duty CNG vehicles . . . . . . . . . . . . . . . . . . . . . . . . . . . . . . . .31
Table 10 Heavy-Duty engine options . . . . . . . . . . . . . . . . . . . . . . . . . . . . . . . . . . . . . . . . . . . . . . . . . . . . . . . . . . .33
Table 11 Weight diesel truck compared to CNG truck and LNG truck (full tanks in lbs) . . . . . . . . . . . . .35
Table 12 CNG to LNG compared . . . . . . . . . . . . . . . . . . . . . . . . . . . . . . . . . . . . . . . . . . . . . . . . . . . . . . . . . . . . . . . .39

EXECU
TIVE SU
MM
ARY
For more information visit www.ngvevent.com NGV INDUSTRY OVERVIEW | 7
FC Gas Intelligence’s Natural Gas Vehicles Market Report USA 2013-2014 provides an up-to-the-minute summary of current conditions in this fast-growing market segment. The report’s four chapters summarizes the latest business intelligence vital to understanding issues currently confronting stakeholders in this market, and provides direct guidance for fleet managers looking for first-hand advice on key issues to consider when deciding whether to switch to cheaper, cleaner-burning natural gas.
Chapter 1: NGV USA Market Overview: Comprehensive Analysis of the North American NGV Market
Natural gas has significant potential to transform the transportation sector, particularly for fleets and commercial trucking, due to its cheaper, less volatile price, compared diesel or gasoline. The fuel is largely sourced in North America, in contrast to petroleum-based fuels, which are largely sourced from politically unstable and potentially hostile regions of the world, especially the Middle East. The fuel is also cleaner burning than traditional transportation fuels, and can help provide a bridge to a greener, lower-carbon future.
The chapter lays out in detail how the number of CNG and LNG public access fuelling stations is expanding rapidly, with several companies rolling out new NG infrastructure. Detailed information is provided about ambitious expansion plans, launched by companies such as Trillium and Love Travel Stops, in the era of CNG infrastructure, and Clean Energy, Shell, and ENN- Blu LNG on the LNG side. In partnership with Pilot Flying J Truck S, Clean Energy is also exploring LCNG options. The
net effect of these expansion plans is that some fleets—particularly heavy-duty trucks servicing major interstate transportation corridors may soon be able to convert to natural gas without having to develop independent fuelling infrastructure.
Chapter 2: Government Policies: How they will impact the NGV market over the next 5 years
Federal and state government policies have been crucial to fostering the development of NG as a transportation fuel. Stakeholders currently operating in this market, as well as companies considering undertaking fleet conversions, need to understand how government policies will continue to shape the future development of the NGV sector in both positive and potentially negative ways over the next five years. The chapter provides an overview of current federal and state policies to promote NGVs, and provides information on what government and private resources are available for getting the latest information about these rapidly evolving policies. Detailed discussion follows of two significant policy areas— environmental regulation, both state and federal, and export policy— that could thwart or at minimum slow development of NGVs. Understanding potential policy risks is important for companies undertaking or continuing significant investments in NGVs or infrastructural development.
Executive Summary

EXECU
TIVE SU
MM
ARY
For more information visit www.ngvevent.com NGV INDUSTRY OVERVIEW | 8
Chapter 3: Converting to Natural Gas: Key Considerations to address when converting your fleet to NGVs
The higher relative costs of NGVs compared to traditionally-fuelled vehicles has thus far presented a major obstacle to wider use of NG as a transportation fuel. This chapter summarises the current state of the NGV market. OEMs have started to offer a wider range of NG options, from automobiles, to vans—both passenger and cargo—and light and medium-duty truck options. These vehicles cost more than conventionally fuelled models, but some of these costs can be offset by state incentives available for converting to NG. All major heavy-duty truck manufacturers now offer NG options, either in CNG or LNG formats, prodded by customers responding to the potential significant fuel costs savings. The chapter walks through specific examples of how to evaluate the value proposition for fleet conversions, looking at both light-duty, and heavy-duty, examples.
Chapter 4: Infrastructure Development: How to successfully plan and build NGV infrastructure
Infrastructural considerations continue to loom large in decisions to convert all or part of a fleet’s vehicles to NGV. The future U.S. NG infrastructure will combine a network of CNG, LNG, and LCNG stations. This chapter analyses issues fleet managers need to consider in deciding whether to opt for CNG of LNG, based on where their fleets will operate, and what their range needs are. Although more CNG and LNG infrastructure is continually coming on-line, most fleets must still construct or secure access to independent fuelling infrastructure, as existing public access infrastructure alone cannot support fleet range needs. This chapter discusses the issues companies must consider when deciding whether, where, and how to construct CNG or LNG fuelling stations. Infrastructural specialists are expanding their product offerings, focusing on modular, and lower-cost options that reduce the necessary up-front investments and also lower on-going operational and maintenance costs, for companies constructing both CNG and LNG fuelling infrastructure.
Executive Summary

IND
USTRY O
VERV
IEW
For more information visit www.ngvevent.com NGV INDUSTRY OVERVIEW | 9
Chapter 1: NGV Industry Overview
1.0 Market Size and Growth ForecastsPetroleum-based fuels currently dominate the U.S. transportation market, and this lack of fuel diversity makes this market particularly vulnerable to price shocks. The United States currently consumes 35 billion gallons of diesel fuel per year. Analysts disagree about how much of this current energy demand could be displaced by cheaper alternative fuels such as natural gas (NG), particularly in the industrial, power generation, and transportation sectors.
Citigroup forecasts NG demand in transportation alone to reach 2.2 billion cubic feet per day (Bcf/d) by 2020, while a Reuters poll of analysts is less bullish, expecting NG demand in this sector to reach only 1.2 Bcf/d over the same period. The United States Energy Information Administration (EIA) predicts a gradual rise in NG usage in the transportation sector over the next decade, as shown in Figure 1, as a more comprehensive NG sourcing and fuelling infrastructure is developed, comprising both compressed natural gas (CNG) and liquefied natural gas (LNG).
Figure 1 Natural gas consumption by sector, 1990-2040 (trillion cubic feet)
The use of NG as a transportation fuel has increased steadily over the last decade, reaching 32,000 Million cubic feet (MMcf ) in 2012. Most of this consumption is currently concentrated in the heavy-duty trucking sector. The American Clean Skies Foundation suggests that NG provides a promising opportunity to diversify fuel sources for both the heavy and medium duty trucking sector, which, taken together, account for 22% of the U.S. transportation sector’s fuel
use. This diversification would come with another benefit, for the cost of fueling with NG is substantially cheaper than buying petroleum-based fuels, even when necessary costs are included, both buying relatively more expensive NGVs, and developing fueling infrastructure, Fleet operators have a potential opportunity to capitalize on a major cost-saving opportunity, since fuel accounts for their second-highest cost.

IND
USTRY O
VERV
IEW
For more information visit www.ngvevent.com NGV INDUSTRY OVERVIEW | 10
Figure 2 U .S . Natural Gas Vehicle Fuel Consumption MMcf
1.1 Growth drivers
Fuel priceThe principal factor driving growth in interest in NGVs is the lower overall price of NG compared to the cost of either gasoline or refined diesel fuels. Over the last decade, NG prices have dropped dramatically as new North American sources of supply have opened up, with the United States moving from a potential NG importer to a potential significant NG exporter over this time period.
Oil prices, by contrast, have been especially volatile over the same time period. Since 2000, refined diesel prices as measured by Diesel Gallon Equivalents (DGEs) have always exceeded NG prices, sometimes by as much as $2, but usually by at least $1.50, per DGE. Similarly, gasoline prices have always exceeded NG prices, when measured by Gasoline Gallon Equivalents (GGEs), by as much as $1.50 per unit.
Figure 3 Average diesel, gasoline, and CNG prices, 2000-2012
Source: Clean Cities Alternative Fuel Price Report, July 2013

IND
USTRY O
VERV
IEW
For more information visit www.ngvevent.com NGV INDUSTRY OVERVIEW | 11
Politically stable source of supplyIn addition to the comparative price advantage, NG supplies are more stable and certain, and virtually all demand can be supplied either domestically, or by turning to Canada or Mexico; the three countries are linked in a fully integrated NG transportation and distribution system. About 85% of the NG consumed in the United States is sourced domestically, from one of the 32 U.S. states that currently produce NG. Overall, 97% of the NG used in the U.S. comes either from the United States, Canada, or Mexico.
By contrast, oil is sourced from politically unstable or potentially hostile places, including Latin America, Russia, and especially the Middle East. Political instability in the Middle East often translates into price volatility and also raises periodic concerns about supply interruptions. Increased use of NG would translate into lessened dependence on energy imports from these politically unstable parts of the world.
Price stabilityIn addition to their more attractive absolute price levels, NG prices also have another advantage for corporate planning purposes in that they have in recent years traded in a much narrower band than either diesel or gasoline prices, with the prices varying since 2000 about $1 from lowest to highest price. Since late 2004, this price spread has been even tighter, varying by no more than $0.75.
It has not always been the case that NG prices have traded in such a narrow band, and in fact, until technology increased the domestically produced supply, NG prices had been among the most volatile commodities traded on the New York Mercantile Exchange (NYMEX). Future forecasts of NG supply suggest that future volatility will follow the recent pattern of tighter trading spreads.
Regional price variationsAs Table 1 indicates, CNG currently has a lower average price than diesel for all regions of the country, with the largest difference ($1.83 per DGE) being in the Rocky Mountain region. CNG costs on average about $1.52 less than diesel on a DGE basis.
Table 1 CNG average prices per region
Region CNG Price ($/DGE) Diesel Price ($)
New England $2.86 $4.07
Central Atlantic $2.48 $3.81
Lower Atlantic $2.24 $3.82
Midwest $2.08 $3.86
Gulf Coast $2.26 $3.82
Rocky Mountain $2.03 $3.86
West Coast $2.71 $4.08
National Average $2.39 $3.91
Source: Clean Cities Alternative Fuel Price Report, July 2013

IND
USTRY O
VERV
IEW
For more information visit www.ngvevent.com NGV INDUSTRY OVERVIEW | 12
Figure 4 illustrates price differentials by state for CNG relative to diesel. In this map, negative numbers represent prices for CNG lower than prices for diesel. States not highlighted with a colour did not have any CNG data points in the latest Clean Cities Alternative
Fuel Price Report, published in July 2013. For all states for which pricing data are available, CNG prices were cheaper than diesel, with the most favourable relative CNG prices found in states located in the Midwest, Rocky Mountain, and West Coast regions.
Figure 4 Price differential CNG to diesel, by state
CNG Price Difference Relative to Diesel
($1.99) - ($1.50)($1.49) - ($0.95)($2.30) - ($2.00)($1.99) - ($1.50)($0.94) - ($0.55)
Source: Clean Cities Alternative Fuel Price Report, July 2013
Environmental benefitsThere are considerable environmental benefits to wider adoption of NG as a transportation fuel, whether in CNG or LNG form. The United States Environmental Protection Agency (EPA) recognizes that natural gas vehicles (NGVs) produce lower levels of harmful emissions, including greenhouse gases, carbon dioxide, nitrogen oxide, particulate matter, and toxic and carcinogenic pollutants. The exact degree of emissions benefits depends on the type and model of the vehicle used, as well as the choice of the conventionally fueled vehicle benchmark. The Alternative Fuels Data Center (AFDC) of the United States Department of Energy (DoE) provides tools for performing detailed emissions comparisons. Many fleet operators are as attracted to NG’s potential to enable them to meet their emissions targets as they
are to the potential for fuel cost savings compared to using diesel or gasoline.
Table 2 Reduction of pollutants from CNG use, as compared with reformulated gasoline
Volatile Organic Compounds 10%
Carbon Monoxide 20-40%
Nitrogen Oxides 0%
Particulate Matter 80%
Source: A Full Fuel-Cycle Analysis of Energy and Emissions Impacts of Transportation Fuels Produced From Natural Gas, Wang, M.Q. and Huang, H.S., 1999

IND
USTRY O
VERV
IEW
For more information visit www.ngvevent.com NGV INDUSTRY OVERVIEW | 13
1.2 NGVs on the Road
The DoE as of September 2013 estimated that about 112,000 NGVs operate in the United States. Market observers say that these DoE figures lag the actual state of play, and that the number of NGVs currently on the road is probably approaching 150,000. Transit buses currently form the largest category of NGVs, and are powered by either CNG or LNG. Waste collection vehicles comprise the second largest category of NGVs, with roughly half of all such vehicles fueled by NG. Airports are the third largest NGV users, with about 35 using NGVs, either by operating their own fleets or promoting the use of private fleets that burn NG.
Wider use of NG in both short-haul fleets and long distance trucking is being facilitated by the development of CNG, LNG, and LCNG fueling networks. Technological innovation is producing more affordable light-duty, medium-duty, and heavy-duty NG truck options, as well as NG-fueled passenger vehicles, largely for fleet use, although the premium for all such vehicles remains high. These premiums are expected to drop as demand for these vehicles increases, but even on current estimates, a viable model for heavy-duty trucks driving 125,000 miles a year suggests that payback on CNG fleet conversion can occur in fewer than 2 years (as described more fully in section 3.__ below).
1.3 Locations of Existing CNG and LNG Stations
CNG stationsAs of September 4, 2013, 602 public access CNG stations operate across the United States, and 633 private access stations. These stations are substantially concentrated regionally. California and Utah have been at the forefront of adopting NG as a transportation fuel, and now each of these two states is covered with a network of stations, with 157 stations operating in California, serving a population of about 38 million, and 42 in Utah, serving a population of approximately 2.9 million. (The state of Utah owns natural gas production facilities and has promoted NG use in transportation; in contrast to other states, Utah has eschewed direct subsidies to this end, and has instead concentrated on building NG infrastructure.)
Other states with significant concentrations of CNG stations include the key NG producing states of Louisiana, Oklahoma, and Texas, as well as urban states such as New York. Pennsylvania and Ohio have shown the highest growth rate in building CNG stations in the last two years, and now have 21 and 13 public access stations operating, respectively.
Figure 5 PCT . Growth in public access CNG stations 7/11-8/13
Source: NGV Today, August 19, 2013, p. 9
IND
USTRY O
VERV
IEW
For more information visit www.ngvevent.com NGV INDUSTRY OVERVIEW | 14
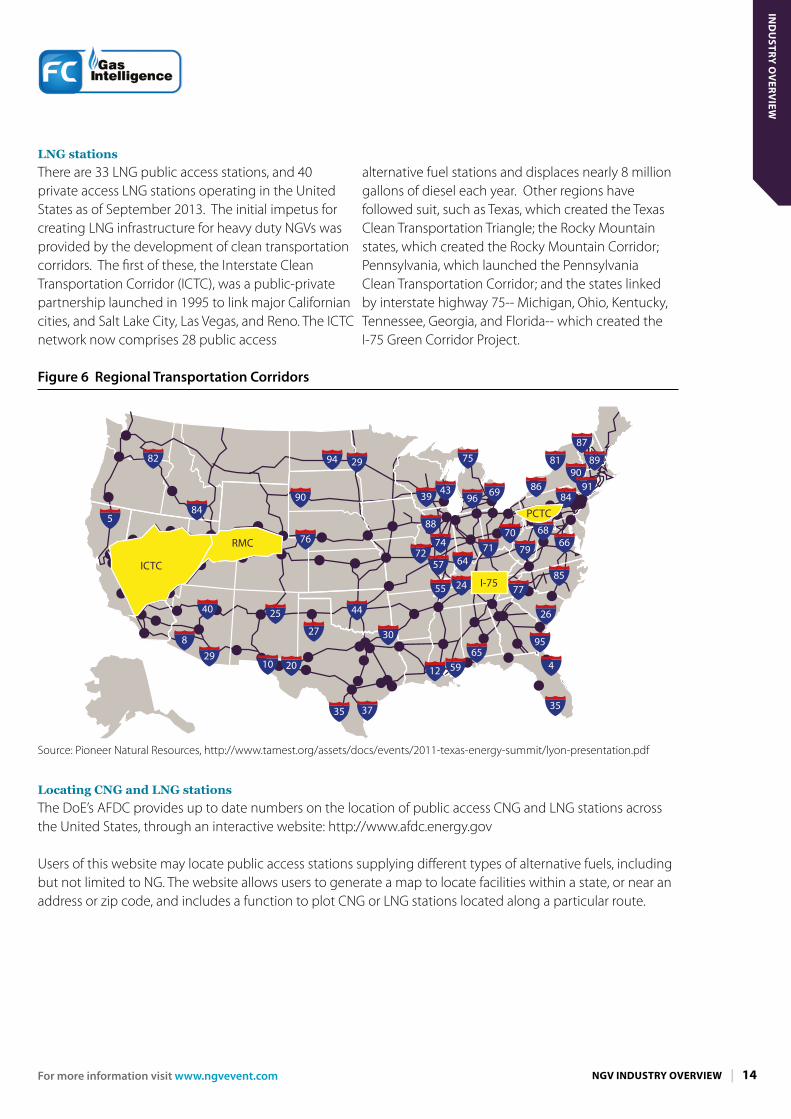
LNG stationsThere are 33 LNG public access stations, and 40 private access LNG stations operating in the United States as of September 2013. The initial impetus for creating LNG infrastructure for heavy duty NGVs was provided by the development of clean transportation corridors. The first of these, the Interstate Clean Transportation Corridor (ICTC), was a public-private partnership launched in 1995 to link major Californian cities, and Salt Lake City, Las Vegas, and Reno. The ICTC network now comprises 28 public access
alternative fuel stations and displaces nearly 8 million gallons of diesel each year. Other regions have followed suit, such as Texas, which created the Texas Clean Transportation Triangle; the Rocky Mountain states, which created the Rocky Mountain Corridor; Pennsylvania, which launched the Pennsylvania Clean Transportation Corridor; and the states linked by interstate highway 75-- Michigan, Ohio, Kentucky, Tennessee, Georgia, and Florida-- which created the I-75 Green Corridor Project.
Figure 6 Regional Transportation Corridors
82
845
90
76
2540
829
10 20
27
44
30
35 37
12 5965
4
95
26
55 24
57 64
35
39 43 699686
84
7170
79
7785
6866
88
7472
94 75 81
87
8990
29
ICTC
RMC
PCTC
I-75
91
Source: Pioneer Natural Resources, http://www.tamest.org/assets/docs/events/2011-texas-energy-summit/lyon-presentation.pdf
Locating CNG and LNG stationsThe DoE’s AFDC provides up to date numbers on the location of public access CNG and LNG stations across the United States, through an interactive website: http://www.afdc.energy.gov
Users of this website may locate public access stations supplying different types of alternative fuels, including but not limited to NG. The website allows users to generate a map to locate facilities within a state, or near an address or zip code, and includes a function to plot CNG or LNG stations located along a particular route.

IND
USTRY O
VERV
IEW
For more information visit www.ngvevent.com NGV INDUSTRY OVERVIEW | 15
Figure 7 Locations of CNG stations
Source: http://www.afdc.energy.gov/locator/stations/results?utf8=✓&location=&filtered=true&fuel=CNG&owner=all&payment=all&ev_level1=true&ev_level2=true&ev_dc_fast=true&radius_miles=5
Some companies have stepped in to make publicly available via the internet not only station location and tracking tools, but other relevant information. CNGprices.com, for example, supplies up-to-the-minute information on CNG prices at a particular station, as well as crowd sourced information about station reliability, opening hours, and payment information.
http://www.cngprices.com/index.php CNGnow.com incorporates a GPS application. http://www.cngnow.com
LNG suppliers, such as Blu LNG, have incorporated station finder features in their websites, which also include pricing information, opening hours, and payment options. http://blulng.com
Figure 8 Locations of LNG Stations
Source: http://www.afdc.energy.gov/locator/stations/results?utf8=✓&location=&filtered=true&fuel=LNG&owner=all&payment=all&ev_level1=true&ev_level2=true&ev_dc_fast=true&radius_miles=5

IND
USTRY O
VERV
IEW
For more information visit www.ngvevent.com NGV INDUSTRY OVERVIEW | 16
1.4 Proposed expansion of CNG and LNG fueling networks
In the past two years, several companies have announced ambitious efforts to construct public
access NG infrastructure. These plans generally closely track major U.S. trucking routes and patterns. In general, to date CNG fuelling station networks have been designed largely to serve local and regional fleets. The thrust of LNG station development has been to connect these regional hubs.
Figure 9 United States truck traffic volumes
CNG stationsIn the CNG area, for example, Trillium announced an expansion project in June 2013 to construct and open 101 new CNG stations in 29 states within three years. This project includes plans to build new stations in states that already have extensive CNG infrastructure-- including California, New York, Ohio,
and Pennsylvania, Texas—and will also locate many new stations in states that currently have few public access CNG stations, including Florida and Georgia, but are nonetheless high-volume parts of current U.S. trucking networks.

IND
USTRY O
VERV
IEW
For more information visit www.ngvevent.com NGV INDUSTRY OVERVIEW | 17
Figure 10 Projected expansion of Trillium CNG station network, 2013-2016
06/13
Existing Trillium Stations
Stations Opening 2013-2016 Projected
Stations Opening2013-2016 Projected
Existing Trillium Stations
Source: Trillium CNG, http://www.trilliumcng.com/fuel/pdf/expansion_map.pdf
Love’s Travel Stops and Country StoresLove’s Travel Stops & Country Stores, a family-owned, Oklahoma City-based company, currently operates more than 300 travel stops across 39 states that include fueling facilities and restaurants. The company has provided NG fueling capabilities at some of its locations for light and medium—duty vehicles since 2010. In 2012, Love’s constructed
its first heavy-duty CNG station in its home city of Oklahoma City, specifically for Class 8 vehicles, and the company is adding fast-fill CNG fueling capability to service Class 8 trucks at eight of its travel stops on highways along the Texas Triangle of Dallas, Houston and San Antonio, each intended to be operational by the fourth quarter of 2013.
Figure 11 Projected expansion of Love’s CNG network
85
WASHINGTON
OREGON
IDAHO
MONTANA
WYOMING
NEVADA
UTAH
ARIZONA
COLORADO
NEW MEXICO
NEWYORK VT
NH
MA
CT RI
NJ
MD DE
TEXAS
OKLAHOMA
CALIFORNIA
NEBRASKA
SOUTH DAKOTA
NORTH DAKOTAMINNESOTA
WISCONSIN
IOWA
MISSOURIKANSAS
ARKANSAS
LOUISIANA
MISSISSIPPI
ALABAMAGEORGIA
FLORIDA
NORTHCAROLINA
SOUTHCAROLINA
MAINE
VIRGINIA
WESTVIRGINIA
TENNESSEE
KENTUCKY
MICHIGAN
OHIO
INDIANA
ILLINOIS
PENNSYLVANIA
COTTONDALECOTTONDALE
HEYBURNHEYBURN
IDAHO FALLSIDAHO FALLS
INAINA
De MOTTEDe MOTTE
MATTHEWSMATTHEWS
McCOMBMcCOMB
TUPELOTUPELO
BILOXIBILOXI
DUNNDUNN
MILANMILAN
SANTA ROSASANTA ROSA
WELLSWELLS
CHOUTEAUCHOUTEAU
HAMBURGHAMBURG
FAIR PLAYFAIR PLAY
CHRISTIANACHRISTIANA
EDINBURGEDINBURG
THREE RIVERSTHREE RIVERS
LAMBSBURGLAMBSBURG
OAKDALEOAKDALE
TOOMSUBATOOMSUBA
LEELEE
AMARILLOAMARILLO
TIFTONTIFTON
SWEETWATERSWEETWATER
LOXLEYLOXLEY
EVERGREENEVERGREEN
McCALLAMcCALLA
STEELESTEELE
CLANTONCLANTON
FALKVILLEFALKVILLE
JASPERJASPER
MORRILTONMORRILTON
OZARKOZARK
PALESTINEPALESTINEWEST MEMPHISWEST MEMPHIS
LITTLE ROCKLITTLE ROCK
KINGMANKINGMAN
QUARTZSITEQUARTZSITE
GILA BENDGILA BEND
CHANDLERCHANDLER
YUMAYUMA
LAKE HAVASULAKE HAVASU
BENSONBENSON
COACHELLACOACHELLA
RIPONRIPON
LOST HILLSLOST HILLS
TULARETULARE
TEHACHAPITEHACHAPI
CORNINGCORNING
SANTA NELLASANTA NELLA
LAMARLAMAR
BENNETTBENNETT
HUDSONHUDSON
PUEBLOPUEBLO
FT. PIERCEFT. PIERCEAUBURNDALEAUBURNDALE
OCALAOCALA
JASPERJASPER
EMERSONEMERSON
JACKSONJACKSON
THOMSONTHOMSON
HOGANSVILLEHOGANSVILLE
RICHMOND HILLRICHMOND HILL
BRUNSWICKBRUNSWICK
DUBLINDUBLINDUBLINDUBLINDUBLINDUBLINDUBLINDUBLIN
NEWTONNEWTON DAVENPORTDAVENPORT
SIOUX CITYSIOUX CITY
CLIVECLIVE
POSTFALLSPOSTFALLS
GREENVILLEGREENVILLE
WILLIAMSVILLEWILLIAMSVILLE
UTICAUTICA
ROSCOEROSCOE
DWIGHTDWIGHT
KANKAKEEKANKAKEE
MARIONMARION
RICHMONDRICHMONDPITTSBOROPITTSBORO
ST. PAULST. PAUL
MEMPHISMEMPHIS
BELLEVILLEBELLEVILLE
GARYGARY
HAUBSTADTHAUBSTADT
WHITESTOWNWHITESTOWN
OTTAWAOTTAWA
ELLISELLIS
RICHMONDRICHMOND
CORBINCORBIN
HORSE CAVEHORSE CAVECALVERT CITYCALVERT CITY
SHEPHERDSVILLESHEPHERDSVILLE
WADDYWADDY
GRAYSONGRAYSON
PORT ALLENPORT ALLENLAKE CHARLESLAKE CHARLESVINTONVINTON
GREENWOODGREENWOOD MINDENMINDEN TALLULAHTALLULAH
ALBERT LEAALBERT LEAALBERT LEAALBERT LEA
MARSHALLMARSHALL
ST. JOSEPHST. JOSEPH
JOPLINJOPLIN
ROLLAROLLAROLLAROLLA
CANTONCANTON
BATESVILLEBATESVILLE
FLOWOODFLOWOOD
FARGOFARGO
WILLISTONWILLISTON
NORTH PLATTENORTH PLATTE
AURORAAURORA
BORDENTOWNBORDENTOWN
ALBUQUERQUEALBUQUERQUE
CLAYTONCLAYTON
LAS CRUCESLAS CRUCES
LORDSBURGLORDSBURG
GALLUPGALLUP
CLOVISCLOVIS
FERNLEYFERNLEY
LAS VEGASLAS VEGAS
BINGHAMTONBINGHAMTON
JEFFERSONVILLEJEFFERSONVILLE
HUBBARDHUBBARD
N. BALTIMOREN. BALTIMORE
ZANESVILLEZANESVILLE
BURBANKBURBANK
CLINTONCLINTONELK CITYELK CITY
NORMANNORMAN
LAWTONLAWTON
BOISE CITYBOISE CITY
ERICKERICK
EUFAULAEUFAULA
PAULS VALLEYPAULS VALLEY
TONKAWATONKAWA
WEBBERS FALLSWEBBERS FALLS
HOOKERHOOKER
ATOKAATOKA
HINTONHINTON
OKEMAHOKEMAH
COLBERTCOLBERT
ROSEBURGROSEBURG
ONTARIOONTARIO
TROUTDALETROUTDALE
JONESTOWNJONESTOWN
CARLISLECARLISLE
BLACKSBURGBLACKSBURGFT. MILLFT. MILL
NEWBERRYNEWBERRY
SIOUX FALLSSIOUX FALLS
COLUMBIACOLUMBIA
JACKSONJACKSON
MEMPHISMEMPHIS
DANDRIDGEDANDRIDGE
CHARLESTONCHARLESTON
LENOIR CITYLENOIR CITYBAXTERBAXTERNASHVILLENASHVILLE
CLAUDECLAUDE
DENTONDENTON
EL PASOEL PASO
HILLSBOROHILLSBORO
MIDLOTHIANMIDLOTHIAN
WALLERWALLER
MEMPHISMEMPHIS
VAN HORNVAN HORN
WICHITA FALLSWICHITA FALLS
RANGERRANGERWEATHERFORDWEATHERFORD
LULINGLULING
VANVAN
LUFKINLUFKIN
CLEVELANDCLEVELAND
EDNAEDNA
FAIRFIELDFAIRFIELD
HUTCHINSHUTCHINS
KINGSVILLEKINGSVILLE
LAREDOLAREDO
RHOMERHOME
HEARNEHEARNE
ODESSAODESSA
BAYTOWNBAYTOWN
MT. VERNONMT. VERNON
ANTHONYANTHONY
COMFORTCOMFORT
NATALIANATALIA
DEER PARKDEER PARKWEIMARWEIMAR
CEDAR CITYCEDAR CITY
SALT LAKE CITYSALT LAKE CITY
TOMSBROOKTOMSBROOK
SKIPPERSSKIPPERSSOUTH HILLSOUTH HILL
NAPAVINENAPAVINE ELLENSBURGELLENSBURG
TACOMATACOMA
WAMSUTTERWAMSUTTER
OAK CREEKOAK CREEK
N. LITTLE ROCKN. LITTLE ROCK
JOSEPH CITYJOSEPH CITY
BARSTOWBARSTOW
WHITELANDWHITELAND
TUCUMCARITUCUMCARI
PERRYSBURGPERRYSBURG
ARDMOREARDMORE
ORANGEBURGORANGEBURG
DICKSONDICKSON
LEARYLEARY
CHEYENNECHEYENNE
MAX MEADOWMAX MEADOW
PRESCOTTPRESCOTT
ANNAANNA
MARIONMARION
WACOWACO
ORMOND BEACHORMOND BEACH
BOONVILLEBOONVILLE
RIPLEYRIPLEY
SPARTASPARTA
CONNEAUTCONNEAUT
RUTHERGLENRUTHERGLEN
STRAFFORDSTRAFFORDSTRAFFORDSTRAFFORD
BUCKEYEBUCKEYE
MIFFLINVILLEMIFFLINVILLE
DILLONDILLON
LEROYLEROY
ELOYELOY
KATYKATYSAN ANTONIOSAN ANTONIO
FT. WORTHFT. WORTH ROCKWALLROCKWALL
DALLASDALLAS
SEGUIN
WILLISWILLIS
HOUSTONHOUSTON
OKLAHOMA CITYOKLAHOMA CITY
CNG AVAILABLE NOW
CNG COMING SOON
FEASIBLE CNG STATIONS
CNG UNLIKELY
FA
Source: Love’s Travel Stops and Country Stores, August 3, 2013 presentation

IND
USTRY O
VERV
IEW
For more information visit www.ngvevent.com NGV INDUSTRY OVERVIEW | 18
America’s Natural Gas HighwayClean Energy Fuels, the largest provider of NG fuel for transportation in North America, in July 2011 was the first private company to jump aggressively into supplying NG infrastructure when it announced plans to construct America’s Natural Gas Highway, a network of 150 public access LNG-fuelling stations, across 33 states. So far, about 70 stations have been completed, although rollout is proceeding slower than originally anticipated, partly due to Clean Energy’s desire to secure anchor tenants before construction of new facilities. Using two liquefaction plants, one planned and one operational, Clean Energy will supply both
stages of the supply chain, production and marketing.
Clean Energy has also entered into a partnership with Pilot Flying J Truck Travel Centers, which will allow Clean Energy to add NG fuelling options to the services already offered at Pilot Flying J’s extensive network of existing truck stops throughout the United States. Clean Energy also intends to add CNG-fuelling capacity at selected locations on the network, as and where it determines there will be sufficient demand to support such facilities.
Figure 12 Projected rollout of Clean Energy’s America’s Natural Gas Highway of LNG and LCNG stations
Source: Clean Energy Fuels
Shell and TravelCenters of America partnershipShell and TravelCenters of America announced in April 2013 that they would partner to provide a nationwide network of LNG fueling stations for heavy-duty road transportation customers. The companies intend to construct at least two LNG fueling lanes and a storage facility at 100 existing TravelCenters of America or Petro Stopping Centers full service travel centers located along the U.S. interstate highway system. Shell anticipates that the first of these stations will be operational within a year and intends to make it a priority to develop LNG fueling infrastructure along the main trucking corridors. Shell is also investing in both LNG liquefaction and refuelling infrastructure, and plans to build two
liquefaction plants. These will supply the basis for two new LNG refuelling networks, in the Gulf Coast Corridor (Texas and Louisiana) and the Great Lakes Corridor. These Shell-fueled networks have the potential to link up with planned or existing clean transportation corridors, including the Texas Triangle and the I-75 Clean Transportation Corridor. Market observers suggest that Shell’s entry into the NG market is serving as a wake-up call signaling the growing importance of NG as a transportation fuel, as Shell is a major multinational player with the scale and resources to transform this domestic U.S. LNG market substantially.

IND
USTRY O
VERV
IEW
For more information visit www.ngvevent.com NGV INDUSTRY OVERVIEW | 19
Figure 13 Projected network of LNG stations proposed by Shell and TravelCenters of America partnership
Source: Shell
ENN initiativesChinese-owned ENN is also investing heavily in U.S. LNG fuelling infrastructure, with plans to build up to 500 LNG stations. ENN has partnered with a small
Utah company, CH4 Energy, to create a joint venture trading as Blu LNG. ENN has ambitions of building LNG plants in the future.
Figure 14 Blu LNG operational and pending LNG fuelling network (as of end 2013)
Source: Blu LNG, http://blulng.com/station-finder/

IND
USTRY O
VERV
IEW
For more information visit www.ngvevent.com NGV INDUSTRY OVERVIEW | 20
1.5 Expansion of Small and Midsize LNG Liquefaction Plants
Crucial to the rollout of a wider use of LNG as a transportation fuel is increasing geographic access
to its supply, which is partly being achieved by developing small and midscale LNG liquefaction infrastructure. Gas producers, suppliers, utilities, and public companies are planning and building new facilities.
Figure 15 Small and Mid Scale LNG Liquefaction plants*
*Planned and operational small and mid scale liquefaction facilities in the United States, where the location has been made public or disclosed directly to FC Business Intelligence.
Table 3 Small and Mid Scale LNG Liquefaction plants in the United States*
P = Planned E = Expansion O = Operational S = Site Selection C = Construction R = Reg . approvals*Details disclosed/available
Small-Mid Scale LNG Liquefaction Faciliies in the US*
Map Key Name Location LNG production Stage
1 Noble Energy Weld County, Colorado 100,000 gal/day P
2 APNG Topock LNG Plant Arizona 86,000 gal/day E
3 Clean Energy California Plant Boron, California 160,000 gal/day O
4 The Pickens Plant Willis, Texas 100,000 gal/day O
5 Shell, Geismar Geismar, Louisiana 250,000 P
6 Shell, Sarnia Sarnia, Ontario 250,000 P
7 Stabilis Energy Eagle Ford Shale 100,000/250,000 R
8 Stabilis Energy West Texas 100,000/250,000 S
9 Stabilis Energy The Bakken 100,000/250,000 S
10 Stabilis Energy Western Oklahoma 100,000/250,000 S
11 Stabilis Energy Haynesville, East Texas 100,000/250,000 S
12 Grande Prairie Elmworth, Canada 190,000 litres/day C
13 Colony Energy Partners Reno 180,000 gal/day (initial) P
14 Spectrum LNG Prudhoe Bay, Alaska 100,000 gal/day P
15 Spectrum LNG Ehrenberg, Arizona 60,000 gal/day O
16 Exxon LaBarge Shute Creek, WY 60,000 gal/day O
17 Prometheus Bowerman LFG to LNG California 5,000 gal/day O

IND
USTRY O
VERV
IEW
For more information visit www.ngvevent.com NGV INDUSTRY OVERVIEW | 21
1.6 Conclusion
Natural gas has significant potential to displace diesel and gasoline usage in the transportation sector. NG prices are both cheaper than either diesel or gasoline, and are also less volatile. NG is largely sourced in North America, especially the U.S., in contrast to oil and diesel, which are largely foreign-sourced, from politically unstable and potentially hostile regions of the world, especially the Middle East.
The number of CNG and LNG public access fuelling stations is expanding rapidly. Several companies have committed themselves to rolling out new NG infrastructure. On the CNG side, Trillium and Love Travel Stops have announced extensive plans, while on the LNG side, Shell, and ENN in a joint venture with Blu LNG, are major players. Clean Energy has also announced an extensive LNG plan, America’s Natural Gas Highway, and in partnership with Pilot Flying J truck stops is also exploring LCNG options.

IND
USTRY O
VERV
IEW
For more information visit www.ngvevent.com NGV INDUSTRY OVERVIEW | 22
Chapter 2: Government policies: How they will shape the NGV market over the next 5 years
2.0 Introduction
Government policies, at both federal and state levels, have played a significant role in fostering the development of NG as a transportation fuel. The following chapter describes how such policies will continue to shape the future development of the NGV sector, focusing on the next five years. The chapter begins by discussing various state and federal policies to promote NGVs, including subsidies, tax incentives, procurement policies, and emissions standards. The chapter concludes by discussing two potential policy risk factors that could thwart or at minimum slow development of NGVs—environmental regulation, and export policy.
2.1 Policy in context
The DoE in 1993 launched the Clean Cities initiative, the flagship federal program designed to reduce petroleum consumption for transportation uses by promoting the use of alternative fuel vehicles. This program created a national network of more than 100 Clean Cities coalitions, which link fuel suppliers, private companies, original equipment manufacturers (OEMs), federal and state agencies, national laboratories, and local governments, among others, in designing and implementing alternative transportation policies for their local communities. Clean Cities seeks to reduce the use of fossil fuels by measures such as using alternative and renewable fuels, making improvements in fuel economy, and promoting emerging transportation technologies.
2.2 Subsidies and tax incentives
The significant and sustained lower relative cost of NG compared to petroleum-based fuels provides a strong incentive for fleets and individuals to shift to NGVs. Yet those who seek to make such a switch face two significant obstacles: the higher upfront cost of NGVs, whether automobiles, vans, or light, medium,
or heavy-duty trucks, compared to diesel or gasoline-powered vehicles; and the lack of a comprehensive fuelling infrastructure for either CNG or LNG vehicles.
Both the federal government and many state governments provide a plethora of subsidies, tax incentives, and loan programs to address these two obstacles (some of these incentive programmes are discussed more fully below—see sections 3.__ and 3.__, and 4.__ and 4.__). These public policies promote the use of NGVs (and other alternative fuel vehicles) by defraying their higher upfront costs and also support build-out of more NG fuelling stations. Other policies provide incentives to use alternative fuel vehicles—such as the ability to use high occupancy vehicle (HOV) lanes regardless of the number of passengers in a vehicle.
Most of the NG-specific policies the United States has in place promote the use of NG. But one federal excise tax policy currently disadvantages LNG, and this measure has attracted many reform calls among various NGV stakeholders. The federal excise tax on both LNG and diesel is currently 24.3 cents per gallon, but since it takes 1.7 gallons of LNG to produce the same amount of energy that a gallon of diesel produces, LNG is effectively taxed at a rate 70% higher than that of diesel. Both gasoline and CNG are also taxed according to energy output, leaving LNG as the odd fuel out.
Taxing the fuels on an energy content basis rather than on a volume basis would create a level playing field for LNG, and Mac Thornberry, a member of the United States House of Representatives from Texas in 2013 introduced the LNG Excise Tax Equalization Act of 2013 (H.R.2202), to achieve that goal. Thornberry believes that this reform would promote expanded private-sector investment in LNG infrastructure and production.

IND
USTRY O
VERV
IEW
For more information visit www.ngvevent.com NGV INDUSTRY OVERVIEW | 23
Senator Michael Bennet of Colorado has introduced a companion bill, S. 1103, l into the United States Senate, but as of October 2013, the measures had been referred to their respective committees for consideration, and no further action has been taken on these measures.
The federal government currently has twenty-seven NG promotion policies in place, covering a range of areas, including infrastructural development, HOV lane use, aftermarket conversions, public transportation, and technological development. The DoE’s AFDC regularly updated website provides current summaries of existing federal policies: http://www.afdc.energy.gov/laws/laws/US/tech/3253
All states currently have at least one NG promotion policy in place, and the DoE’s AFDC website allows to search current such policies by fuel, and by state. Many urban states are strong NG supporters, including California (with 27 NG policies in place), Virginia (16), and Indiana (18). States that produce NG also promote its use, these include Colorado (11), Oklahoma (14) Texas (15), and Utah ( 10). http://www.afdc.energy.gov/laws/matrix/tech.
Policies fall to three broad areas: those that offset the incremental costs of NGV purchase; those that provide fuel incentives; and those that provide special privileges to NGV users (e.g., access to HOV lanes, additional parking, concessions on emissions inspections).
California has led the way in promoting clean air policies, and adopted its Air Pollution Control Act in 1947—nearly a decade before the federal government began to address air quality issues. The state has been at the forefront of promoting the use of alternative fuels, and currently has 27 NG state incentives in place—more than any other state— and these include policies to promote NGVs, to encourage NG infrastructural development, to advance the use of NG for public transit, and to foster NG-related technological development.
The DoE’s AFDC website summarises the state’s current policies http://www.afdc.energy.gov/laws/laws/CA/tech/3253
California has pioneered some innovative alternative fuel promotion policies, including parking incentives, and the ability to use HOV lanes regardless of the number of passengers in a vehicle. Drivers of qualifying alternative fuel vehicles—including CNG, hydrogen, electric, and plug-in hybrids-- that meet specified state and federal emissions standards are given special stickers. Vehicles are also exempted from certain toll charges, unless prohibited by federal law.
On September 28 Governor Jerry Brown signed into law a bill that will extend various other clean vehicle incentive programs until 2023. He also signed another piece of legislation that will extend for HOV lane access for certain alternative fuels vehicles until January 1, 2019.
2.3 Procurement policy
Both federal and state governments can advance the use of NGVs via the procurement policies they enact.
Federal policy President Obama issued a Presidential Memorandum in May 2011 directing all federal agencies to purchase or lease only alternative fuel passenger vehicles or LD trucks by 2015. This policy required no congressional action to be implemented and took immediate effect upon announcement. Mandating the use of alternative fuel vehicles for federal fleets was expected to have the direct effect of stimulating demand for such vehicles and, by creating economies of scale, reducing the upfront costs of such vehicles, thus increasing their attractiveness to a wider market. Further, in the case of NGVs, placing more of them on the road was also intended to increase utilization of existing NG infrastructure, and promote demand for additional fuelling stations. The policy was also expected to have indirect effects, as drivers of these vehicles will increase their familiarity with these vehicles and, in the case of NGVs, become aware of their far lower fuelling cost compared to petroleum-fuelled vehicles.
State policy States have followed the federal lead in developing their own NGV procurement policies. The governors of Colorado, Wyoming, Pennsylvania, and Oklahoma

IND
USTRY O
VERV
IEW
For more information visit www.ngvevent.com NGV INDUSTRY OVERVIEW | 24
announced a Memorandum of Understanding (MOU) in November 2011 to work together to convert their state vehicle fleets to NG. The MOU calls for a joint, multistate request for proposal for purchasing NGs for state fleets, and commits each state to purchase a specific number of NGVs. Many state fleets standing alone are not large enough convince OEMs that the vehicle needs of individual states represent a viable, stable, long-term market upon which to base product launch decisions. By developing a common proposal for NGV purchases and pooling their resources, the states hope to encourage OEMs to offer a wider range of NGVs. More than 20 states are now committed to follow this NGV sourcing approach.
These procurement policies have already influenced product offerings. The three major U.S.-headquartered OEMs – Chrysler, Ford, and GM (Chevrolet) – have all launched bi-fuel pickup trucks, and GM and Ford offer a bi-fuel van for commercial and fleet customers. Honda is the first OEM to offer a NG-fuelled automobile, the Civic NG, nationwide to non-fleet customers, and Chevrolet intends to offer its Impala model in a bi-fuel option for model year 2015. Various other companies offer competitive NG-conversion options.
Private initiativesThese public procurement initiatives have inspired the American Clean Skies Foundation to develop a wider procurement plan for the third-party transportation services used by the federal government. Every year, federal agencies spend roughly $150 billion on such transportation services.
The foundation has proposed requiring federal agencies to apply to third-party transportation providers the same kinds of alternative fuel targets, efficiency standards and reporting practices they currently apply to their own vehicle fleets. Such a policy would reduce overall oil consumption—and its associated economic and environmental costs. The foundation estimates that the programme it outlined in an August 2012 report could deliver approximately $7 billion in annual cost savings; cut petroleum consumption by billions of gallons each year; stimulate the introduction of tens of thousands of new alternatively fuelled vehicles; and reduce
greenhouse gas emissions by over 20 million metric tons annually. Moreover, the foundation emphasizes that by leveraging its influence with freight carriers and other suppliers, such a programme would allow the federal government an opportunity to create very large multiplier effects, and thus effectively reduce the dependence of the trucking industry and other private sector transportation providers on petroleum imports.
2.4 CAFÉ standards
The United States in 1975 first implemented Corporate Average Fuel Economy (CAFÉ standards) to encourage manufacturers to produce more fuel-efficient cars. The Obama administration and thirteen OEMs on August 28, 2012 announced new standards for automobiles, and light and medium duty trucks, levelling the playing field between NG and other alternative fuels for these categories of vehicles. These standards cover model years 2017-2025. The standards are ambitious ones, which by setting an average fuel economy standard of 54.5 miles per gallon (MPG) by 2025—double the 27.3 MPG 2011 average-- are intended to push OEMs toward technological innovation. The standards include tax incentives for purchase of certain types of alternative fuel vehicles, and an incentive multiplier to encourage adoption of fuel. The highest multiplier, 2.0, applies to electric vehicles; NGVs and hybrids enjoy a multiplier of 1.6—a significant improvement on the previous standard.
The Obama administration was the first to launch emissions standards for heavy-duty vehicles in 2011. These are due to be revised and extended soon, with a proposed rule expected imminently, which will be finalized sometime in 2015.

IND
USTRY O
VERV
IEW
For more information visit www.ngvevent.com NGV INDUSTRY OVERVIEW | 25
2.5 Environmental regulation: potential risk?
One potential risk factor for broader NGV development is whether additional environmental restrictions will be imposed on fracking operations. At the federal level, the Bureau of Land Management sets drilling standards for federal lands, and the Environmental Protection Agency (EPA) has broad influence over fracking due to its authority to set air and water quality standards. The EPA in 2012 set air quality standards for fracking operations, requiring companies to capture gases released in the process—but these measures only codified best industry practices. The EPA is expected to announce fracking-related water quality standards in 2014, and is expected to take a similar approach.
The fracking industry remains vulnerable to the risk of lawsuits, which are largely brought under state law. Landowners have targeted energy companies in many states where fracking is widespread, in some cases, via class action lawsuits. But the United States Supreme Court has in recent years made it much more difficult for private plaintiffs to succeed in such lawsuits, especially, in class actions. So far, no company has lost a fracking suit, and the barriers to prevailing in such litigation for alleged harms including groundwater contamination, triggering of earthquakes, or environmental degradation, are formidable. The possibility exists that lawsuits or state-level policy changes could slow the spread of fracking in certain states. Yet absent a major shift in the composition of either Congress or the Supreme Court, it is unlikely that fracking lawsuits will impose major constraints on energy producers nationwide.
2.6 Export policy: potential risk?
United States NG export policy could also have a significant impact on the development of NG as a transportation fuel. Until recently, NG from domestic sources was not traded widely outside North America, and the United States did not export significant quantities of NG. In fact, before the shale gas revolution began, plans were underway to allow importation of substantial quantities of NG, and these
included proposals to develop the infrastructure to achieve this goal. Some of the NG export terminals discussed below were originally intended to be import facilities.
Now, as domestic NG reserves continue to be developed, and the spread between NG and world oil prices continues to be so wide, this situation has reversed itself. Yet U.S. NG exports are subject to a complex export regime, which requires federal government approval of NG export facilities and involves separate permitting processes undertaken by the DoE and the Federal Energy Regulatory Commission (FERC). To date, the DoE has approved four applications to permit export of U.S.-produced LNG have been approved, and more than twenty are pending. In 2011, the DoE approved Cheniere Energy’s Sabine Pass project, located on the Sabine River in the Louisiana/Texas border, thus clearing the way for the first new LNG construction in forty years (this project had originally been planned as an import terminal). Final clearance for this project led to a pause in consideration of other export applications. During this period, two studies were undertaken that examined the expected impact of NG exports on domestic prices, and in this interim period, NG exports were authorized to countries with which the US has free trade agreements, such as Canada and Mexico -- both members of the North American Free Trade Agreement (NAFTA).
In 2013, the DoE has approved three projects for export to non free-trade agreement destinations: Freeport LNG’s in Quintana Island, Texas, in May; Lake Charles LLC’s in Lake Charles, Louisiana, in August; and Dominion Resources’s Cove Point facility on Maryland’s Chesapeake Bay, in September. The DoE has seemingly accelerated its review process in response to political and company complaints about previous delays, and is currently reviewing expansion of Freeport LNG’s terminal in Freeport, Texas; Sempra Energy’s proposed project in Cameron, Louisiana; and Veresen’s Jordan Cove project in Coos Bay, Oregon.

IND
USTRY O
VERV
IEW
For more information visit www.ngvevent.com NGV INDUSTRY OVERVIEW | 26
Table 4 LNG Export facilities approved
Company Location State Date
Cheniere Energy
Sabine Pass Louisiana/Texas border
Apr 2012
Freeport LNG Quintana Island
Texas May 2013
Lake Charles LLC
Lake Charles Louisiana Aug 2013
Dominion Resources
Cove Point (Chesapeake Bay)
Maryland Sep 2013
NG producers view exports as a way to earn higher prices than are available for NG in either the domestic U.S. or wider North American market. Yet significant LNG exports could distort the domestic supply/demand relationship, and thereby raise domestic NG prices. As long as NG is largely traded within North America, prices remain insulated from the volatility (and outright manipulation) that occurs in the world oil market.
The acceleration of export procedures is already provoking a backlash. Cove Point’s conditional approval to export up to 0.77 Bcf/d of NG raises the overall amount of permitted NG exports, breaching the export levels of 6 Bcf/d — the “low export scenario” — set forth in an earlier report commissioned by the DoE that examined the impact of NG exports on domestic prices and on which the agency relied in approving three previous LNG export applications.
America’s Energy Advantage (AEA), a coalition of manufacturers and consumers, is working to reserve US NG to promote a US manufacturing renaissance. AEA members include domestic-headquartered companies such as Alcoa, Celanese, Dow Chemical, Eastman, Huntsman, and Nucor, and trade associations, such as the American Public Gas Association (APGA). Its membership also includes firms such as Incitec Pivot, a global explosives and fertilizer manufacturer based in Australia, that recently began construction of an $850 million ammonia plant in Waggaman, Louisiana.
In September 2013, AEA filed a formal motion to intervene in the DOE’s proceeding evaluating Freeport LNG’s export application for its Freeport, Texas terminal. This application, if authorized would raise the cumulative volume of authorized LNG exports to 8.31 Bcf/d.
AEA seeks to encourage the DoE to develop a more formal rulemaking process based on current data and assessments of the current supply and demand environment. AEA asserts that current LNG export applications are being granted based on guidelines developed for NG imports in the 1980s. AEA’s motion also alleges that the legal standards the DOE used to analyse the public interest in two previous permitting applications were not “adequate, appropriate, or sustainable.”
APGA and the Industrial Energy Consumers of America (IECA) are working toward developing a responsible production policy, arguing that while exporting NG might maximize the price domestic producers receive for their product, it will reduce the price advantage NG currently enjoys relative to refined diesel or gasoline, and thus reduce the attractiveness of NG as a transportation fuel. If that occurs, these organizations emphasize, NG’s full potential to reduce America’s energy dependency will not be achieved.
The DOE may choose to undertake another pause in its permitting procedures, but this is unlikely to occur before year-end 2013, when new data should be available from the Energy Information Administration’s preliminary annual energy outlook for 2014.
A lively debate is raging on how America’s NG reserves should be deployed—to maximize producer revenues, or to support domestic manufacturing and encourage energy self-sufficiency. Opponents of increased NG exports emphasise that if all pending export applications were to be approved, half of current NG supply would be exported. Instead, they advocate building necessary infrastructure to consume NG domestically, not only for transportation uses, but for power generation as well.

IND
USTRY O
VERV
IEW
For more information visit www.ngvevent.com NGV INDUSTRY OVERVIEW | 27
2.8 Conclusion
Government policies, both federal and state, have played a major role in promoting the development of NG as a transportation fuel, and will continue to do so both in the near-term ad over the coming decades.
California has been a leader in developing alternative fuels, and currently has the most comprehensive NG fuelling infrastructure. While the state continues to lead the way in policy innovation, many other states are also on the NG bandwagon, and are providing various incentives as well as setting their own procurement policies, to promote NG use.
Although it at this point appears unlikely that environmental regulations or public or private lawsuits, may significantly slow U.S. shale gas production, the long-term shape of U.S. NG export policy is a cause for some concern, as it has the potential to equalise somewhat domestic and world NG prices, and thereby, reduce the economic case for fleets to switch to NG. A lively debate is brewing over whether NG should be reserved for domestic uses, pitting conflicting interests of NG producers against other among NG stakeholders. Since the setting of export policy requires federal government action, this debate will require political resolution at the highest level.

IND
USTRY O
VERV
IEW
For more information visit www.ngvevent.com NGV INDUSTRY OVERVIEW | 28
Chapter 3: Converting to Natural Gas, Vehicle issues
3.0 Introduction
Despite the relative cost advantage for fuelling NGVs compared to traditional diesel or gasoline-fuelled models, the higher relative costs of NGVs compared to traditionally-fuelled vehicles has presented a major obstacle to wider use of NG as a transportation fuel. This chapter focuses on costs and other issues that should be considered when contemplating switching to NGVs, while the next discusses the equally important issue of ensuring access to adequate fuelling infrastructure.
OEMs have started to offer a wider range of NG options, from automobiles, to vans—both passenger and cargo—and light and medium-duty truck options. Total sales have been modest but growing, and each OEM has announced plans for expansion of NG product offerings in forthcoming model years. At least twenty-one states provide some form of incentive for fleets to convert to light-duty CNG vehicles, in the form of grants or rebates, loans, state tax credits, or combinations of these policies. With OEMs now offering a wider range of NGVs, the impact of these incentive policies may now be more pronounced. All major heavy-duty truck manufacturers offer NG options, either in CNG or LNG formats.
3.1 Passenger automobiles
The US market lags significantly behind the European market in the number of NG options offered as passenger vehicles. Currently, only Honda offers a CNG option, the Civic NG, nationwide in the US, compared to Europe, where many automakers, including Fiat, GM, Mercedes, Peugeot, Toyota and Volkswagen, offer CNG options. Honda is strongly committed to develop the US NGV market and has offered a CNG automobile option since 1998 in the US.
Chevrolet announced in October 2013 that it will launch a bi-fuel Impala, beginning with the 2015 model year, to both passenger and fleet customers. The vehicle will include both a CNG tank in the trunk, and a gasoline tank, allowing for a total range of up to 500 miles by switching between the two fuels-- 150 miles on CNG and 350 miles on gasoline. GM has neither announced an expected price, nor projected fuel economy figures, and expects to sell as many as 1000 vehicles, largely to fleets, during its first model year.
Despite a lack of strong consumer demand, OEMs recognize that shifting to NG provides immediate emissions benefits, without any need for further technological innovation, and thus help fulfil their obligations to meet emissions standards for their product offerings.
Two major obstacles have prevented wider consumer adoption of NGVs. Although the costs of operating CNG vehicles are much lower, consumers must first pay the higher incremental cost of buying a CNG vehicle. The actual break-even point depends on the higher incremental cost for the CNG vehicle, and average number of miles driven. Moreover, passenger cars face greater infrastructural obstacles, for unlike fleets, they do not necessarily drive in consistent and familiar patterns, and they lack access to dedicated fuelling arrangements—either company-owned, or third-party— that are available to fleets.
Use of NG is impractical, at present, for non-fleet passenger vehicles, outside of states that have well-developed CNG infrastructure, such as California, New York, Oklahoma, Texas, and Utah. In the near-term, there are other pockets where use of such vehicles might catch on, especially in bi-fuel options, which can reduce fuelling and range anxiety.

IND
USTRY O
VERV
IEW
For more information visit www.ngvevent.com NGV INDUSTRY OVERVIEW | 29
One looming technological innovation might promote popularity of NG as a transportation fuel for passenger vehicles: the development of a cheap, widely available home refuelling option. At present, consumers are making a switch in how they view fuelling options. Outside of remote rural areas, drivers are not accustomed to considering refuelling possibilities when they drive passenger cars. But this is changing, with the hybrids such as Toyota’s Prius and Chevrolet’s Volt.
Wider use of such vehicles may promote a shift in how drivers think about fuelling their cars. Electric vehicles have limited range, and are generally most useful for commuting short distances. Drivers are able to charge their batteries when the vehicle returns home.
The lack of a cost-effective home fuelling appliance is seen as a major impediment to the development
of the NGV passenger automobile market, one which the federal government has devoted part of $30 million in research funds to finance proposals to create such appliances. The Drive Natural Gas Initiative (DNGI), a major industry trade association launched its Home Fueling Appliance Task Force determine specifications for such a product. The appliance should be able to provide a fuelling rate of 1 GGE per hour, should provide for 6,000 hours of service, and should cost less than $1,500. This translates to a fuelling cost per GGE of CNG of $0.25 (in addition with the cost of the fuel itself and the cost of the electricity to run the compressor). The task force decided that the cost of the appliance, plus the premium paid for the CNG vehicle (compared to the same non-CNG model), must payout in 3 years or less, in order to support a sustainable market. Several utilities, and manufacturers, are joining to develop products that meet these specifications. The timeframe for launch remains at least eighteen months away.
Table 5 Home fuelling specifications
Source: America’s Natural Gas Alliance
3.2 Light and medium duty trucking vehicle options
The major OEMs have responded to demand for CNG-fuelled vehicles, and either now offer, or plan to offer for model year 2014, a mix of vans, and light and heavy duty pick-up trucks.
FordFord expects to sell 15,000 CNG/LPG-prepped vehicles in 2013, representing a 25% increase on its 2012 sales
of similar vehicles. Beginning with model year 2014, Ford intends to extend its product range and offer its F-150 truck with a gaseous-fuel prep option on the 3.7-liter V6 engine, enabling the vehicle to run on CNG or LPG. This prep package includes hardened valves, valve seats, pistons and rings so it can operate on either CNG/LPG or gasoline through separate fuel systems, and from the factory costs approximately
TCO
Base Case Miles % CNG NGV Cost HFA Cost High-Miles /High CNG %
Actual miles 13,476 26,583 18,719
Daily miles 37 73 51
CNG percent 55% 106% 80%
NGV Premium $4,000 723 -$1,277
HFA (installed) $2,000
Simple Payout (yrs) 8.0 3.0 3.0 3.0 3.0 3.0
Market of 10 millioncommuters

IND
USTRY O
VERV
IEW
For more information visit www.ngvevent.com NGV INDUSTRY OVERVIEW | 30
$315 before the customer chooses a Ford Qualified Vehicle Modifier to supply fuel tanks, fuel lines and unique fuel injectors. Upfits run approximately $7,500 to $9,500, depending on fuel tank capacity.So equipped, F-150s would be able to run more than 750 miles on one tank of gas, depending on the tank size selected. The Ford F-150 averages 23 mpg on the highway. Ford expects that CNG versions of the F-150 will qualify for California HOV lane status certification, thus providing its commercial customers with a significant time advantage, in addition to the cost savings they can expect to achieve on fuel.With the addition of the F-150, Ford will have eight commercial vehicles available to run on CNG/LPG.
Table 6 Ford CNG model options (as of model year 2014)
Model Type
F-150 Light-duty pick up
Transit Connect van and wagon
Transit van, wagon, cutaway, and stripped chassis
E-Series van, wagon, cutaway, and stripped chassis
F-Series Super Duty pick-up
F350 chassis cab
F-Series Super Duty (F-450, F-550)
chassis cab
F-650 medium-duty truck
F53 and F59 stripped chassis
Source: Ford September 19, 2013 press release Chrysler
Chrysler launched the Ram 2500 CNG pick-up in 2012 and sold its first vehicles in 2013. This is a bi-fuel vehicle that uses CNG as its primary fuel source, but automatically switches to gasoline when the CNG tanks are emptied. Using its two CNG tanks, the vehicle’s range exceeds 250 miles, and its back-up gasoline tank extends this range to nearly 370 miles. The Ram 2500 is available to fleet and retail customers, and is powered by a Hemi 5.7 liter V8 engine.Of the three major US OEMs, Chrysler offers the smallest range of CNG products, offering a pick-up only for model year 2014.
Table 7 Chrysler CNG model options (as of model year 2014)
Model Type
Dodge Ram 2500 Bi-fuel pick up
Source: Chrysler March 6, 2013 press release
GMIn 2013, GMC introduced its bi-fuel CNG Silverado 2500 HD extended cab pick-up truck (the equivalent Chevrolet model is called the Sierra 2500 HD), and expects to sell 1300 of these vehicles during the 2013 model year. The vehicle incorporates factory-installed hardened exhaust valves and intake/exhaust valve seats, both of which are engineered to GM durability standards for gaseous fuel use.The bi-fuel CNG option is available on long- or standard-bed models in either 2WD or 4WD. The fuel system automatically switches to gasoline when the CNG tank is empty, or the driver may manually switch between fuel sources while driving. The combined 17 GGE CNG tank and 36-gallon gasoline tank allow for a total range of about 650 miles.
GMC and Chevrolet expect to offer a range of several truck and cargo van options for the 2014 model year. Chevrolet has also announced plans to offer its Impala automobile in a CNG configuration (see section 3.1 above.)
Table 8 GMC and Chevrolet CNG model options (as of model year 2014)
Model Type
Bi-Fuel CNG Chevrolet Silverado 2500HD extended cab
pick-up
Bi-Fuel CNG GMC Sierra 2500HD extended cab
pick-up
Chevrolet Express 3500 cut-away
GMC Savana 3500 cut-away
Chevrolet Express Cargo 2500 cargo van
GMC Savana Cargo 2500 cargo van
Chevrolet Express Cutaway 4500 cut-away
Chevrolet Express Cargo 2500 cargo van
Source: GM website http://www.gmfleet.com/vehicle-overviews/fuel-efficiency/bi-fuel.html

IND
USTRY O
VERV
IEW
For more information visit www.ngvevent.com NGV INDUSTRY OVERVIEW | 31
Payback: Bottom lineAssessing the conditions under which switching to NG may be a commercially viable strategy for light and medium-duty LGVs relies on a careful assessment of over what timespan the additional premium for purchasing differential vehicle can be recouped by the cost savings for CNG fuel—which currently average between $1.50 and $2 per DGE or GGE (as discussed more fully in section 1.1 above).
Leaving aside access to fuelling infrastructure—which will be discussed more fully in chapter 4 below—a fleet operator must consider how many miles can be driven fuelled by CNG alone, since most OEM bi-fuel options actually are currently configured with a much higher gasoline capacity compared to CNG. In general, payback calculations are a less certain value proposition, since vehicles in these classes already have higher fuel economy, and travel fewer models.
Figure 16 Calculation of light-duty truck payback, based on various fuel price and truck premium assumptions
Source: Paul Armstrong, GTI Director of Business Development, to Guild of Gas Managers, April 3, 2012.
Many states offer significant incentives in switching to CNG, but these vary widely among states, and many of them are time-bound. These factors may tip the balance toward CNG significantly beyond what market factors alone would dictate.
3.3 State subsidies for light-duty NGVS
As of September 2013, 27 states offer some form of incentives for converting fleets to light-duty NGVs, according to VNG.CO, a company that offers a nationwide CNG retail-centric fuelling facility program to owners and operators of light-duty NGVs. Thirteen states offer grants or rebates, eight states offer tax credits, and six offer loan financing at concessionary rates. Several states offer various combinations of these incentives.
Table 9 Summary of state incentives for light-duty CNG vehicles
Type of Incentive Number of states
Description
Grants or rebates 13 $2500 to $25,000 per vehicle
Loans 6 Rates from 0% to 5%
State tax credits 8 $500 to $7500 per vehicle
Source: VNG.CO website
$16,000$0.00
$1.00
$2.00
$3.00
$4.00
$5.00
$6.00
$7.00
$8.00
$9.00
$10.00
$8,000 $0
12,000 miles per yr - 3 yr Payback
20,000 miles per yr - 3 yr Payback
12,000 miles per yr - 5 yr Payback
20,000 miles per yr - 5 yr Payback

IND
USTRY O
VERV
IEW
For more information visit www.ngvevent.com NGV INDUSTRY OVERVIEW | 32
Figure 17 Map of states offering various incentives for light-duty CNG vehicles
Tax Credit
Rebate/Grant
Loan
■Arkansas Up to $5,000 (<8,501 lbs) or up to $8,000 (8,501-14,000 lbs)
■California $3,000 (<8,501 lbs) or $8,000 (8,501-14,000 lbs)
■Colorado 10.5% of total vehicle costs, up to $6,000 per vehicle
■Connecticut Unspecified funding for public fleet NGVs only
■Florida 50% of incremental costs, up to $25,000
■Georgia 10% of total vehicle costs, up to $2,500
■ Illinois 80% of incremental costs, up to $4,000
■ Indiana Up to $150,000 per fleet conversion project (max for all vehi-cles purchased)
■Louisiana 50% of incremental costs
■Maryland $3,000 (<8,501 lbs) or $5,000 (8,501-14,000 lbs)
■Mississippi Zero-interest loans for municipal vehicle NGV fleets only
■Montana 50% of conversion costs, up to $500
■Nebraska 5% interest loans, up to $750,000 per borrower
■North Carolina Up to 80% of incre-mental costs
■ Oklahoma Tax credits of 50% of incremental costs, 3% interest loans
■Oregon Low-interest loans (terms not specified)
■Pennsylvania 50% of incremental costs, up to $25,000
■Texas $2,500 rebates (up to 9,600 lbs), grants up to 90% of total costs (8,501+ lbs)
■ Utah Tax credits of 35% of total cost up to $2,500, grants of 50% incremental costs
■ Virginia Unspecified grants and loans for public fleets only
■Washington Exemption from 6.8% state sales tax on vehicle purchase
■West Virginia 35% of new vehicle purchase price or 50% of conver-sion costs, up to $7,500
VNG.go provides details on these state programmes, as of September 2013, at the following link: http://vng.co/wp-content/uploads/2013/09/VNG-State-Incentive-Summary-September-2013.pdf
This information is presented in a more user-friendly summary form than the more comprehensive information available at the DoE’s AFDC site, which includes links to relevant state statutory and regulatory information. http://www.afdc.energy.gov/laws/matrix/tech.

IND
USTRY O
VERV
IEW
For more information visit www.ngvevent.com NGV INDUSTRY OVERVIEW | 33
3.4 Heavy duty trucking
Fleets operating heavy-duty trucks now have the option to consider both CNG or LNG options. All major truck manufacturers currently offer NG engine options, including Freightliner, Isuzu, Kenworth, Navistar, Peterbilt, and Volvo/Mack. These are based around engines offered & manufactured by Westport Innovations, in a 15 liter LNG option only, and in a joint venture between Westport and Cummins, in both CNG and LNG versions, and 8.9 liter and 11.9 liter sizes. Volvo has announced plans to launch its own 13 liter LNG engine sometime in 2015.
Technological innovation should over the longer term reduce these premiums. Manufacturers are currently developing new tank designs for both CNG and LNG. Additionally, innovations in the fuel system space-- which accounts for the majority of the premium, should reduce overall truck premiums as well.
Some idea of the current premium for heavy duty CNG or LNG rigs can be derived from Table 10, which compares a CNG truck equipped with saddle tanks with 90 DGE of storage capacity to a single tank LNG truck with 75 DGE of storage capacity. All of these figures are provisional, and are highly dependent on the relationships between suppliers and fleet managers.
Table 10 Heavy-Duty engine options
Manufacturer Model CNG engine price premium
LNG engine price premium
Cummins/Westport
ISL G 8.9 L $32,000-$40,000
$35,000-$58,000
Cummins/Westport
ISX G 11.9 L $47,000-$80,000
$60,000-$98,000
Westport Innovations
HPDI 15 L LNG option only
$75,000-$120,000
Source: Love’s Travel Stops, August 3, 2013 presentation
Figure 18 Natural gas engine comparison-- power (hp)
250
CWI ISL G CWI ISX12 G Westport 15L
375 400 475 500 Source: http://www.westport.com/products/engines/15 Figure 19 Natural gas engine comparison – torque (ft-lb)
600
CWI ISL G CWI ISX12 G Westport 15L
1,000 1,4001,200 1,600 1,800
Source: http://www.westport.com/products/engines/15
CNG to LNG comparedFor heavy-duty trucks, both CNG and LNG options are available, and fleets looking to switch must carefully consider which option better suits their needs. CNG trucks are heavier—due largely to tank design, and LNG has fuel-economy advantages in long-haul situations. The additional weight required for its tanks disadvantages CNG, but since 75% of heavy-duty trucks cube out before they weigh out, this is not necessarily dispositive, particularly given the currently more extensive CNG filling station network. (See section 4.2 below, and especially Table 12, for more discussion of these considerations.)

IND
USTRY O
VERV
IEW
For more information visit www.ngvevent.com NGV INDUSTRY OVERVIEW | 34
3.5 Factors to consider in HD fleet conversions
Assuming access to adequate fuelling infrastructure, without the need to construct or secure access to a private fuelling network, many calculations of expected payback on conversion from diesel to either CNG or LNG rely only on the average differential in fuel price—currently about $2 for CNG, and $1 for LNG. Yet there are other inefficiencies necessary to consider when running heavy-duty trucks, and these should be quantified on a per unit basis and deducting the sum of inefficiencies from the gross discount.
LNG Filling issues LNG may vent fuel into the atmosphere to avoid explosion in a vacuum tank, and it may have a shelf life as short as four days. Filling completely empty methane tanks can be problematic, as methane may expand rapidly as LNG enters a tank at ambient temperature, sometimes delaying operations by up to one day until a complete fill can be achieved. Dealing with low temperature LNG raises some safety concerns; dealing with these imposes certain training costs and also raises possible workers’ compensation concerns.
Figure 20 Sample calculation of expected payback for HD fleet conversion
CNG vs. LNG Comparison CNG LNG
Diesel Price $4.000 $4.000
Natural Gas Retail Price $2.000 $3.000
Gross Discount to Diesel $2 .000 $1 .000
Truck Inefficiencies
Fuel Economy Loss (12%) -0.240 -0.360
Out of Route Miles -0.025 -0.025
Payload Loss -0.050 -0.020
Additional Maintenance -0.030 -0.030
Fuel Loss from Venting - -0.015
Salvage Value Deduction -0.060 -0.060
Total Inefficiencies -0 .405 -0 .510
Net Discount to Diesel $1 .595 $0 .490
Truck Comparison CNG LNG
Miles Driven (Annual) 125,000 125,000
Fuel Economy 6.20 6.20
Fuel Consumption 20,161 20,161
Truck Premium (CW 11.9L) 60,000 60,000
Net Discount to Diesel $1.60 $0.49
Fuel Savings (Annual) $32,157 $9,879
Payback (Years) 1 .87 6 .07
Source: Love’s Travel Stops, August 3, 2013 presentation
Range considerationsOnboard fuel capacity dictates the range for both CNG and LNG trucks. Standard CNG fuel systems come equipped with the option of either 90 DGE saddle tanks or 120 DGE behind-the-cab tanks. Only about 90% of this capacity is considered usable, since a CNG truck also experiences a shortfall when filling at rates higher than ten DGEs per minute. Although fuel is not lost, the rapid fuelling produces heat which expands the hydrocarbons, thus taking up more space, and resulting in a capacity loss of approximately 5%, leaving total range for a CNG vehicle with saddle tanks at about 450 miles of range.

IND
USTRY O
VERV
IEW
For more information visit www.ngvevent.com NGV INDUSTRY OVERVIEW | 35
Figure 21 Sample CNG range calculation
90 DGE Storage Capacity – (9 DGE Unusable + 4.5 DGE Heat Expansion) = 76 .5 DGE Useable Capacity
76.5 DGE Useable Capacity * 6 Miles Per Gallon Fuel Economy = 459 Miles of Range
Source: Love’s Travel Stops, August 3, 2013 presentation
CNG fuel systems are currently available with up to 150 DGE capacity that yield over 750 miles of range.
LNG has a fuel system design which allows a truck to use one hundred 100% of all fuel capacity, usually 75 DGE for a single tank or one 150 DGE for dual saddle tanks. Using the same fuel economy calculations as for CNG above, LNG vehicles can achieve a range of up to 900 miles.
Truck Weight The additional weight differential for an NGV truck is often overstated since it considers only the additional weight of needed storage tanks and mounting brackets, without subtracting the weight of parallel components required by diesel trucks, or the weight advantage of CNG itself compared to an equivalent energy output of diesel. An aluminium diesel tank with mounting kit can weigh between 100 and 200 pounds. Also, depending on API gravity, diesel fuel can weigh between 6.95 and 7.05 pounds per gallon versus a natural gas DGE at 6.50 pounds per gallon, giving NG a weight advantage of .50 pounds per gallon. Neither do spark ignited NG engines require SCR systems or a DEF tank.
Table 11 Weight diesel truck compared to CNG truck and LNG truck (full tanks in lbs)
CNG 80 DGE LNG 75 DGE
NG tank weight 1600 1200
Less
Diesel tank weight (75 gallon)
665 665
SCR System and DEF weight
458 458
Net additional NG weight 477 77
Source: Love’s Travel Stops, August 3, 2013 presentation
* Note, however, that trucks that use HPDI technology, such as the Westport 15 Liter Engine, are compression ignited and require an SCR system under current emissions standards.
Payback: Bottom LineWhen all these factors are carefully considered-- and once again, emphasising that all necessary costs for any infrastructural construction are left to chapter 4 to discuss, payback for fleet conversion, assuming 125,000 miles driven annually, can be fewer than 2 years for CNG vehicles using a Cummins/Westport 11.9 liter engine, and just over 6 years for an equivalent LNG rig. These calculations do not consider possible state subsidies, which are summarised in the next section.
The preceding analysis is based on calculations done by Love’s Travel Stores, but others have made similar calculations—on slightly different assumptions.

IND
USTRY O
VERV
IEW
For more information visit www.ngvevent.com NGV INDUSTRY OVERVIEW | 36
Figure 22 Calculation of Heavy-duty truck payback, based on various fuel price and truck premium assumptions
$0.00$100,000 $90,000 $80,000 $70,000 $60,000 $50,000 $40,000 $20,000$30,000
$0.50
$1.00
$1.50
$2.00
$2.50
NG Truck Price Premium
Die
sel t
o N
G P
rice
Spre
ad F
or E
cono
mic
Pay
back
2 yr Payback 4 yr Payback
High fuel price differential
Lower cost NGV options (as volume grows)
Source: Paul Armstrong, GTI Director of Business Development, to Guild of Gas Managers, April 3, 2012. http://www.northeastgas.org/pdf/p_armstrong_gti_040412.pdf
Gemini, Love’s private truck fleet that hauls fuel to its 300 retail locations in 39 states has opted to purchase 50 Freightliner 400 HP trucks equipped with the Cummins Westport ISX G 11.9 liter engine.
Robert Transport, a Canadian long-distance trucking firm has opted to begin converting to LNG, using Westport 15 Liter HPDI engines in Peterbilt and Kenworth Trucks, driven by price, energy security, and emissions concerns.
3.6 State subsidies for heavy-duty fleet conversion
The DoE’s AFDC is the best source for current subsidies for heavy-duty fleets. http://www.afdc.energy.gov/laws/matrix/tech.
As of September 2013, Cummins-Westport has summarized some of the principal incentives available for heavy-duty vehicles in Canada and the US in a more user-friendly framework.

IND
USTRY O
VERV
IEW
For more information visit www.ngvevent.com NGV INDUSTRY OVERVIEW | 37
Figure 23 Heavy-duty incentives, Canada and US (as of August 2013)
New Existing
BRITISH COLUMBIAFORTIS Natural Gas for Transport (NGT) Incentive Program for LNG
• Covers up to 70% of incremental
• LNG only:HD Class 8 (11,793kg +) MD Vocational (incl. waste, transit, marine)
FORTIS Light Duty Vehicle Incentive Program
• Bi-fuel WiNG 250-550 eligible up to $10,000 per vehicle
• No close date
COLORADOAlternative Fuel Income Tax Credit
• 35% tax creditcapped at $6,000 for vehicles under 26,000lbs
• CNG and bi-fuel
• Until 2016
CALIFORNIASJVAD Drive Clean Rebate Program
• Rebate up to $3,000
• BAF products on eligibility list
• Ongoing
TEXASH-GAC Clean Vehicles Grant Program
• $20 - $40,000 for HD
• CNG/ LNG/ bi-fuel
• Open until funds exhaust
QUEBECAccelerated Capital Cost Allowance
• 60% depreciation for LNG trucks
WEST VIRGINIA• AFV Tax credit of 35%
• $7500 < 26,000lbs
• $25,000 > 26,000lbs
• Dedicated or bi fuel CNG/LNG
OKLAHOMA• One-time income tax
credit for 50% of the incremental costs
• Until Sept. 10, 2013
NORTH CAROLINA• Reimbursement
program, up to 80% of incremental costs
• Until Sept. 10, 2013
LOUISIANA• Income tax credit up to
50% of the incremental cost up to $3,000
• Dedicated CNG/LNG only
ARKANSAS• 50% rebates for CNG
and LNG conversions, up to $4500
Source: http://www.cumminswestport.com/pdfs/general/Aug%20-%20Sept%202013%20NA%20On-Road%20Incentives.pdf
3.7 Conclusion
Manufacturers have stepped up their offerings of NGVs, across vehicle classes, especially in the heavy-duty truck sector, where customers are responding to the potential significant fuel costs savings. The value proposition for passenger cars is less certain, outside certain regions already well-served by adequate fuelling infrastructure, in the absence of a home refuelling option. In the light-duty sector, the value proposition is also at present somewhat
ambiguous, but should improve, once technological improvements and economies of scale drive the premiums for NGVs downward. At the moment, many of the NGVs on offer are not fully configured by the OEM, but involce conversion elements. Costs should fall when OEMs commit to fully configuring NGVS themselves, rather than relying on outsourcing and conversions.

IND
USTRY O
VERV
IEW
For more information visit www.ngvevent.com NGV INDUSTRY OVERVIEW | 38
Chapter 4: Building Dedicated Fuelling Infrastructure, CNG and LNG
4.1 Introduction
Infrastructural considerations continue to loom large in decisions to convert all or part of a fleet’s vehicles to NGV, and with the increasing availability of various types of NGVs, are the largest consideration in fleet conversion decisions. Although more infrastructure, both CNG and LNG, is continually coming on-line, as described in (sections 1.3 and 1.4 above), at present, fleets located in most regions — with the exception of California, New York, Oklahoma, Texas, and Utah — still need to construct or secure access to independent fuelling infrastructure, as existing public access infrastructure alone cannot support fleet range needs. Companies have sometimes found that they may enter into access arrangements with other companies or utilities that have already constructed their own NG infrastructure.
Yet the time is coming when more fleets will be able to rely on either public networks, or arrangements negotiated with other private stations, for either CNG or LNG refuelling needs. Development of CNG infrastructure to date has been largely locally or regionally concentrated— although major initiatives announced by Trillium and Love’s Travel Stops are somewhat shifting this pattern. Separate initiatives are also underway, announced by Clean Energy, ENN/Blu LNG, and Shell, to connect up these regional CNG hubs, via long-distance orientated LNG or LCNG fuelling networks.
4.2 Basic cost considerations, CNG compared to LNG
CNG currently enjoys three significant cost benefits compared to LNG.
Compression compared to liquefaction CNG uses multistage compressors, which take NG at pipeline pressure and condense it to volumes. LNG also takes NG off a pipeline at line pressure, but uses
a much more complex liquefaction process, involving compression and a multistage heat exchanger either using liquid nitrogen or newer methods involving methane, at significantly greater cost than applies to CNG. Pipeline compared to trucking CNG is transported to a retail location via an existing NG pipeline. Although significant variations exist in delivered costs— due to existing load on the pipeline, and distance from NG sources of supply-- delivery via a NG pipeline remains the cheapest available method of NG transportation. LNG, by contrast, is delivered via a tanker truck, and the length of such hauls is typically two to five times that of a traditional diesel haul. To be sure, the construction of additional liquefaction plants can reduce the average length of such hauls, but this construction comes at a cost, as the average capital costs of new liquefaction facilities currently exceeds a minimum of 150,000,000 dollars (although development of simpler and modular solutions, such as GE’s LNG in A Box system, and Micro LNG facilities, are reducing such capital and operational costs). Differential tax treatmentCNG and LNG are taxed differently, and CNG is currently taxed more favourably, based on energy content sold, per DGE. LNG is taxed on the basis of an LNG gallon (as discussed more fully in section 2.2 above). The net result is a $0.15-$0.25 cost advantage for CNG. This cost differential should be taken into account when choosing between CNG and LNG, yet since this cost difference is caused by government policy, it could more easily be erased than the previous two cost differentials.
Total cost differential The net result of these cost differences is that CNG is roughly $2.00 cheaper than diesel, for energy equivalent amounts, while LNG is $1.00 cheaper.

IND
USTRY O
VERV
IEW
For more information visit www.ngvevent.com NGV INDUSTRY OVERVIEW | 39
For some applications—passenger vehicles, cargo vans, and light-duty trucks— CNG is the only option available. Fuel cost differentials, however, are only one consideration in deciding whether to opt for CNG or LNG in applications where both are viable, such as heavy-duty trucks and marine applications.
Table 12 CNG to LNG compared
CNG LNG
Stored in high-pressure cylinders, typically at 3000-3600 psi
Stored in vacuum tanks, at stations and on vehicles
Same methane as in NG pipelines; emerging sources in landfills
Methane cryogenically frozen, to temperatures lower than -200 F
Lowest price (wheel to well), but require access to NG pipeline; increased NG demands may lead to pipeline expansion to eliminate bottlenecks
Price higher due to cost of freezing, need to transport via truck, and differential tax treatment
CNG will always be cheaper than LCNG
LNG can be turned into LCNG, but not vice versa
Not tied to a manufacturing facility or on-road logistics, so multiple suppliers should maximize competition
Fewer supply options can lead to attempted price manipulation
Heaviest fuel Heavier than diesel, lighter than CNG
Multiple tanks required to carry fuel supply
Better range and fuel economy
About a 5% efficiency loss results when filling at rates greater than 10 GGE per minute, since the rapid fuelling produces heat which expands the hydrocarbons taking up more space (although no fuel is lost)
LNG vents to atmosphere as it warms in storage tanks, creating an efficiency loss
CNG is non-toxic, requires no personal protective equipment, does not require spill containment, and has no evaporative issues
LNG raises safety concerns, and zoning regulations restrict where facilities can be sited, particularly in urban areas
Currently more popular for vehicles following local and regional ranges, and is reflected in structure of CNG fuelling network
Build-out of better fuelling infrastructure may increase attractiveness for long-haul trucking
4.3 Design, planning, and siting of CNG fuelling stations
Many considerations go into design, planning, and siting of CNG stations. These considerations differ for different types of companies that are considering building a CNG station. There is no such thing as a one-size-fits-all, standard CNG station model. The cost of such stations can vary greatly, and needs to be carefully designed to suit its intended purposes.
Generally speaking, three types of companies have either constructed or have on the drawing board planned CNG fuelling networks:
• producers or utilities, including Sempra Utilities, Apache Corporation, and Trillium (which have also often adopted CNG for their own fleets);
• fleets, comprising a wide range of users, which have different siting considerations, depending on the patterns of truck usage, and how often they return to base; some representative companies include waste management firms (Waste Management, Emterra) and trucking companies (Dillon Transport and Ryder); and delivery companies (UPS, FedEx).
• convenience stores and truck stops, which are generally adding CNG (or as described below LNG or LCNG) to existing product offerings; companies include Kwik Trip, Love’s Travel Stops; these companies are also opting for CNG vehicles for their own fleets.
Filling times Using current technologies, neither CNG nor LNG fills at the speed of diesel. Typically, CNG fill times have averaged no more than five DGEs per minute, with NG flowing from on-site storage tanks to the dispenser. Yet Trillium’s technology, for example, can fill at speeds of up to 12 GGE per minute.
Faster fuelling, however, increases costs: in general, the faster the fill, the more expensive the cost. Slow-fill posts cost less, and in general, do not require large, expensive compressors to configure adequately. Many fleets that cover a limited range — such as California’s Sempra Utilities—find the most cost-effective way to construct stations is to rely slow

IND
USTRY O
VERV
IEW
For more information visit www.ngvevent.com NGV INDUSTRY OVERVIEW | 40
fill posts, which can fill a vehicle overnight when it returns to base; Canada’s waste hauler Emterra has adopted a similar strategy. Another advantage of slow-fill overnight is that an operator does not need to take time out of the day to refill a vehicle. Relying on the slow-fill option does not mean eschewing some fast-fill capacity in station design, as some such capacity is usually necessary, especially for larger fleets.
Truck stops and some convenience stores are designing systems around such high-speed fuelling capacity to create a filling experience that resembles that of conventional petroleum-based fuels. Love’s Travel Stops, for example, which is constructing CNG fuelling facilities to serve commercial markets, aims to make it possible for a truck to perform all necessary functions and exit within ten minutes, regardless of whether it enters a diesel or CNG lane. Love’s employs newer technologies specifically designed for trucks with larger tank capacities that require faster fill times. Direct fill applications have been engineered for heavy-duty fill application without having to use on site CNG storage tanks, and can achieve fill rates of 12 DGEs.
Site designOptimal equipment configuration is only one component of site design. Companies must also consider the size of vehicles that will use its station, their turning radius, typical vehicle capacity, and location of exits and entrances.
System redundancyThe degree of necessary system redundancy is a major cost consideration. Utah state utility Questar—a pioneer in CNG infrastructure, due to the state’s ownership of its own natural gas supplies— has followed a simple standardization model, building facilities at minimal cost. Questar eschews installing a back-up compressor on-site for each of its stations, preferring to rely on a mobile compressor that can be moved into place if a station’s compressor is not working. Emterra, which recently constructed the largest CNG fuelling facility in Canada, opted to include two compressors in its site design. Even more important than having two compressors is setting up alternative fuelling sites.
Public or private access, or hybridsIn designing stations, companies need to consider the expected load on a station. Some companies such as Waste Management and many of the utilities are generally committed to constructing public access stations. Likewise (and somewhat obviously), that is also the model for convenience stores and truck stops. Whichever model is followed, companies often seek to sign up an anchor tenant before committing to station construction, as this provides a way to recoup their upfront capital expenditures.
SizingStations take time to come on-board, whereas purchasing vehicles can be done quickly and at relatively lower cost. Companies should therefore err on the side of initially overbuilding fuelling infrastructure, particularly if they service remote locations, so there is sufficient capacity to accommodate expanded CNG fleets. If, for example, a company purchases ten CNG vehicles upfront, but expects to have 50 CNG vehicles in service within 5 years, it should construct facilities with that higher target number in mind.
CNG source compared to demand In designing its projected long-distance CNG fuelling network, Trillium has carefully compared potential source—e.g., location on existing pipeline networks—to projected demand—e.g., current trucking volumes (see the discussion in section 1.4 and the associated figures therein).
Emterra, Canada’s largest waste hauler with operations that also extend to Michigan and a fleet of 400 vehicles, has launched the largest CNG filling station in Canada, to serve about 60 vehicles—making it the largest user of CNG trucks for waste haulage applications globally. The station is configured to include 65 time fill posts, which it expects to expand to 80 posts. The entire CNG fleet can be filled via slow fill posts in 7 hours, and the station also includes fast-fill capacity to fill a truck in 10 minutes. The station has two compressors on site.

IND
USTRY O
VERV
IEW
For more information visit www.ngvevent.com NGV INDUSTRY OVERVIEW | 41
In constructing its planned network of stations, Trillium considers three factors: good customer thoroughfare, secured by a base or anchor tenant; good accessibility to high traffic corridors that will eventually draw more customers; and pipeline access. Working with pipeline transmission systems and utilities, Trillium identifies where the pipelines are, and cross-references this information by customer demand points, to decide where to site stations. Trillium avoids building stations on speculation because that locks up capital, and instead looks to lock up a base or anchor
tenant before it commits capital to a station, and to commit the tenant to a take or pay contract over a specific term. In performing a pro forma cost estimate, the company looks carefully at the load promised by the anchor tenant, prospective public demand (which is assumed will grow from a baseline, rather than shrink), and if it meets certain thresholds, Trillium proceeds with the station. Although no company is in the business of building stations it thinks will lose money, sometimes, it is necessary to build stations so as to avoid a CNG desert.
Modular solutions: CNG in a Box™In partnership with Chesapeake Energy Corporation, GE developed and is marketing a proprietary CNG In A Box™ technology, a plug and play unit that NG from the existing pipeline network and compresses it onsite. The fuel dispensers are similar to those currently used for diesel or gasoline fuelling, and provide the end user with fuelling times of about 7 GGEs per minute. The CNG In A Box™ units provide a quicker path to a more robust NG infrastructural
market, and other companies may elect to market similar products. One advantage of modular systems is that they are mobile, making initial siting decisions less crucial than they might be for fixed infrastructure. They may be maintained remotely, and breakage is not a major issue. Some other manufacturers are developing similar systems, but the lowest initial bid is not necessarily the cheapest comprehensive long-term solution.
Figure 24 GE CNG in a Box
The CNG In A Box™ design allows for easier gas compression, storage, cooling, drying, and cooling; the system’s controls are easy to ship and maintain.
Units come in two configurations: an 8 foot x 20 foot container or an 8 foot x 40 foot container.
The system is designed to be modular and intuitive, and plug and play on-site.
The system can include GE Wayne branded dispensers with credit card capability and provision for point of sale interface.
Fuel is dispensed at a rate of approximately 7 GGEs per minute.
The CNG In ABox™ designallows for easiergas compression,storage, cooling,drying, andcooling; thesystem’s controlsare easy to shipand maintain.
Units comein twoconfigurations:an 8 foot x 20foot containeror an 8 foot x 40foot container.
The system isdesigned to bemodular andintuitive, andplug and playon-site.
The systemcan include GEWayne brandeddispenserswith credit cardcapability andprovision forpoint of saleinterface
Fuel is dispensedat a rate ofapproximately 7GGEs per minute.

IND
USTRY O
VERV
IEW
For more information visit www.ngvevent.com NGV INDUSTRY OVERVIEW | 42
Overall cost estimates for CNG stationsCost estimates for CNG stations vary widely, depending on station’s configuration. Excluding land, costs can range from $100,000 to $1.5 million. A small station with only a few slow-fill posts can cost as little as $100,000 to configure, excluding land and site preparation, and could support a fleet of a dozen pick-up trucks, for example. Fast-fill stations pumping 1000 GGE could cost upwards of 1 million. The trade-off is usually between compression and storage. Storage is less expensive, but requires more space, whereas compression is noisy, but takes less space. Optimal configurations may therefore vary, depending on land costs, and noise restrictions. There is no one-size-fits all model for CNG stations, and companies need to consider carefully their fuelling needs, as well as existing and projected fuelling network development in the areas their fleets cover, in deciding what, if any, infrastructural investments are necessary.
4.4 Design, planning, and siting of LNG fuelling stations
The process of designing, planning, and siting LNG facilities differs from CNG siting, in that LNG facilities need to be located with an eye to existing or planned liquefaction facilities. CNG thus far has had an advantage, because it is easier to select a site, and the existing pipeline distribution system is already built.Traditional large LNG liquefaction facilities are custom facilities, and are project based. They require huge upfront capital outlays, and can take up to 72 months to be operational. As discussed in section 1.5 above, crucial to LNG rollout is increasing geographic access
to its supply, which is occurring in part developing small and midscale LNG liquefaction infrastructure. Gas producers, suppliers, utilities, and public companies are planning and building new facilities (see figure 15 above).
The aggressive timetables set for nationwide LNG networks, by Clean Energy, Shell, and Blu LNG/ENN, do not allow for such extensive lead times. Instead, led by GE, LNG for many transportation applications is moving toward smaller facilities, with 6-24 month lead times, and reduced capital and operational expenditure requirements. These solutions are modular and simplified, and focus on product rather than project.
Modular solutions: GE’s LNG in a Box™As with CNG, GE has worked to develop modular and streamlined solutions that can reduce the potential costs of planned LNG facilities. With a capacity of 10,000-50,00 gallons per day of fuelling capacity, this system is deigned to be used for fuelling stations that cater to heavy-duty trucks, and can include waste haulers, long-distance trucking applications, and remote industrial applications. The inlet gas for this system comes from a pipeline—so that this LNG solution gets the benefits associated with pulling gas off a pipeline, and reducing trucking costs. Being pipeline-dependent imposes costs as well. As with the parallel CNG in a Box™ system the modular nature of LNG in a Box™ reduces the importance of initial siting decisions. The lead-time for such a facility is 6-12 months.

IND
USTRY O
VERV
IEW
For more information visit www.ngvevent.com NGV INDUSTRY OVERVIEW | 43
Figure 25 GE LNG in a Box™
Performance:• 10,000-50,000 gallons per day LNG
production• Inlet gas: Pipeline• Gas recovery: 80-82%• Specific power 1.4 kWh/gal (1.3MJ/liter)
Features• Modular, rapidly (re)deployable design• Simple methane cycle• Minimal pad prep & quick installation• 6-12 month lead time• Highly automated operation• Gas engine option available• Equipment financing available
Source: http://www.gastechnology.org/Training/Documents/LNG17-proceedings/Transport-18-Ujjwal-Kumar-Presentation.pdf
Micro LNGMicro LNG facilities, also pioneered by GE, are capable of producing 100,000-300,000 gallons per day. They too source inlet gas from a pipeline. The capacity of
the systems is designed for use in heavy-duty trucking hubs, and they require a 12-15 month lead-time to be operational.
Figure 26 Micro LNG
•
• •
• • •
Performance:• 100,000-300,000 gallons per day LNG production• Inlet gas: Pipeline
Features• Methane based system with boil off recovery• 8% improved power efficiency• 40% reduced wasted methane• Scalable design w/ multiple standard packages
for rapid deployment• Factory tested skids• Plug & play, light civil work• Targeting 12-15 month lead time
Source: http://www.gastechnology.org/Training/Documents/LNG17-proceedings/Transport-18-Ujjwal-Kumar-Presentation.pdf

IND
USTRY O
VERV
IEW
For more information visit www.ngvevent.com NGV INDUSTRY OVERVIEW | 44
Overall cost estimates for LNG stationsCosts of LNG stations currently range from $500,000-$750,000 for private stations, to public facilities that may cost between $1.5 - $2 million.
4.5 Conclusion
The future of NG infrastructure in the United States will combine a network of CNG, LNG, and LCNG stations. In deciding whether to opt for CNG of LNG, managers need to consider what is better for their fleets. This depends on where the fleet will operate, and what its range needs are. This chapter has discussed various considerations that determine whether CNG or LNG makes most sense for a fleet, as well as what considerations should go into a company’s decision to construct fuelling stations—whether CNG, or LNG.