NATURAL GAS MARKET WINTER OUTLOOK 2018/2019 - … · Having grown 3 BCFD summer-over-summer, power...
16
NATURAL GAS MARKET WINTER OUTLOOK 2018/2019 SEPTEMBER 24, 2018 Prepared for: NATURAL GAS SUPPLY ASSOCIATION Prepared by: ENERGY VENTURES ANALYSIS Henan Xu Michael Schaal ENERGY VENTURES ANALYSIS WINTER 18/19 1901 N. Moore Street 703-276-8900 Suite 1200 www.evainc.com Arlington, VA 22209-1706 © 2018 Energy Ventures Analysis
Transcript of NATURAL GAS MARKET WINTER OUTLOOK 2018/2019 - … · Having grown 3 BCFD summer-over-summer, power...

NATURAL GAS MARKET WINTER OUTLOOK 2018/2019 SEPTEMBER 24, 2018
Prepared for:
NATURAL GAS SUPPLY ASSOCIATION
Prepared by:
ENERGY VENTURES ANALYSIS Henan Xu Michael Schaal
ENER
GY
VEN
TUR
ES A
NA
LYSI
S W
INTE
R 1
8/1
9
1901 N. Moore Street 703-276-8900 Suite 1200 www.evainc.com Arlington, VA 22209-1706 © 2018 Energy Ventures Analysis

WINTER OUTLOOK WINTER 18/19
© 2018 ENERGY VENTURES ANALYSIS 2
Table of Contents I. OVERVIEW ...................................................................................................................................................................... 3
II. OUTLOOK FOR DEMAND ................................................................................................................................................. 4
Power .................................................................................................................................................................................. 4
Industrial demand ............................................................................................................................................................... 7
Residential and Commercial ............................................................................................................................................... 9
Exports .............................................................................................................................................................................. 11
III. OUTLOOK FOR SUPPLY ............................................................................................................................................ 14
Production ........................................................................................................................................................................ 14
Imports from Canada ........................................................................................................................................................ 18
LNG Imports ...................................................................................................................................................................... 19
IV. STORAGE WITHDRAWAL.......................................................................................................................................... 20
V. APPENDICES .................................................................................................................................................................. 22
1. The Impacts of Freeze-offs on Natural Gas Production ........................................................................................... 22
2. LNG’s Application in Marine Transportation ........................................................................................................... 24
3. Global Macroeconomic Growth Outlook ................................................................................................................. 26
4. EIA’s Short-Term Forecast Versus NYMEX ............................................................................................................... 27
5. LNG Facilities ........................................................................................................................................................... 27
6. Winter Imports and Exports of Natural Gas ............................................................................................................ 27
7. Total 2017 Primary Natural Gas Demand by EIA Natural Gas Region and Time of Year (Excluding Exports) .......... 28
8. Total 2017 Natural Gas Demand by Sector and Time of Year (Including Exports) .................................................. 28
9. 2017 Power Natural Gas Demand by Natural Gas Region and Time of Year ........................................................... 28
10. Weather .............................................................................................................................................................. 29
11. U.S. Macro Indicators .......................................................................................................................................... 29
12. U.S. Lower 48 Gas Consumption (Winter Season Nov-Mar, BCFD) ..................................................................... 29
13. Natural Gas Supply (Winter Season Nov-Mar, BCFD).......................................................................................... 30
14. Performance Characteristics of Natural Gas Combined Cycle Units by Region .................................................. 31

WINTER OUTLOOK WINTER 18/19
© 2018 ENERGY VENTURES ANALYSIS 3
I. OVERVIEW Winter 2018-20191 is forecast to start the season with a low natural gas storage inventory level of 3.30 TCF at
the end of October, the lowest level since over a decade. Weather is forecast to be near normal and slightly
warmer than last winter.
Total demand for gas2 is forecast to grow by 3.4 BCFD over the prior winter (see summary table below). The
exports sector is forecast to dominate the growth, with LNG demand to grow by 1.7 BCFD as three new LNG
trains are coming online. Exports to Mexico will also grow by 0.8 BCFD thanks to the domestic pipelines that
have been, and will be, completed this year. Having grown 3 BCFD summer-over-summer, power burn’s growth
in the winter will be less significant, only 0.7 BCFD due to the high efficiencies of new gas units and less
electricity demand in the winter. Industrial demand will contribute 0.4 BCFD of growth winter-over-winter
because of the additions of gas feedstock projects as well as petrochemical projects. Residential and
commercial demand (ResComm) will relieve some of the demand pressure, declining by a total of 1 BCFD due
to the return to normal weather as well as efficiency gains.
WINTER OUTLOOK FUNDAMENTALS SUMMARY TABLE
BCFD WINTER
2018/2019 WINTER
2017/2018 WINTER-OVER-
WINTER CHANGES
Dry Production 84.9 77.4 7.4
Net Canadian Imports 5.2 5.4 -0.2
LNG Imports 0.2 0.5 -0.2
Total Supply 90.3 83.3 7.0
Power Burn 24.8 24.1 0.7
Industrial 24.5 24.1 0.4
Residential and Commercial 36.9 37.8 -1.0
Lease Plant and Pipeline Fuel 6.7 5.9 0.8
Mexico Exports 5.2 4.4 0.8
LNG Exports 4.7 3.0 1.7
Total Demand 102.7 99.3 3.4
Withdrawals 12.4 16.0 -3.6
HDDs 3,455 3,497 -42.0 Source: EVA
Production is forecast to grow at a rate more than adequate to make up the difference between low storage
and elevated winter demand. Production for the lower 48 is forecast to grow by 7.4 BCFD winter over winter.
Most of this growth will come from the Northeast. Having increased by 2.3 BCFD since the beginning of the
year, the Northeast will push higher by another 3 BCFD from August to the end of March. Associated gas
production will also add to the growth this winter, however, it is likely to run into infrastructure constraints.
Permian’s drilled but uncompleted wells have started to accumulate, representing both challenges and
opportunities.
Partially offsetting the growth of production, net Canadian imports and LNG imports are forecast to decline by
0.2 BCFD each. The addition of Rover and Nexus pipelines this winter will lead to more Northeast gas flowing
to East Canada. This increase in exports could lead to a decrease in net imports from Canada. Although Elba
1For the purpose of this report, winter refers to November through March which is, in general, the natural gas withdrawal season. 2 Gas is a short form for natural gas in this report.

WINTER OUTLOOK WINTER 18/19
© 2018 ENERGY VENTURES ANALYSIS 4
Island and Cove Point will become bidirectional LNG terminals, it would be rare to see the terminal import and
export at the same time unless regional demand comes in way above normal. Therefore, LNG imports are likely
to be restricted to only the Everett terminal in New England.
Storage inventory is forecast to reach 1.43 TCF by March 2019, which is 200 BCF below the five-year average.
Withdrawals will be 3.6 BCFD lower than last winter thanks to the high production that currently exists, and
which is forecast to grow. The inventory deficit has become less of an issue as production has ramped up by 14
BCFD since 2013, partially offsetting the need for storage, particularly as some pipeline expansions are
scheduled to come online just before the winter season. An interesting emerging trend is that winter storage
withdrawals per HDD have slightly declined (see figure below), further evidence of a reduced market reliance
on storage.
II. OUTLOOK FOR DEMAND Power Power demand for natural gas is forecast to increase by 0.7 BCFD winter over winter, averaging 24.8 BCFD (see
figure below). The forecasted winter growth appears relatively low in comparison to summer of 2017 to
0
0.1
0.2
0.3
0.4
0.5
0.6
0.7
0.8
0.9
12/13 13/14 14/15 15/16 16/17 17/18 18/19
(BCF)
WINTER SEASON WITHDRAWAL PER HDD
Source: EVA
64.866.8
72.6 73.3 70.577.4
84.9
30
40
50
60
70
80
90
12/13 Winter 13/14 Winter 14/15 Winter 15/16 Winter 16/17 Winter 17/18 Winter 18/19 Winter
WINTER PRODUCTION(BCFD)
Source: EVA

WINTER OUTLOOK WINTER 18/19
© 2018 ENERGY VENTURES ANALYSIS 5
summer of 2018’s power burn growth of 3 BCFD. Part of that 3 BCFD is due to above normal temperatures this
summer. In comparison, the low winter-over-winter growth appears counterintuitive at first, as 2018 has seen
massive combined cycle gas turbine (CCGT) capacity additions, especially in the East region (see figure below).
One of the reasons for the limited growth of power burn is the weather. HDDs are expected to be slightly lower
this coming winter, reducing electric heating demand. Secondly, fundamentals are expected to place slightly
upward pressure on Henry Hub prices this winter compared to the last, which will discourage coal-to-gas
switching. Thirdly, the CCGT units added in the East region feature lower heat rates than the existing fleet,
which will create gas-on-gas competition, displacing generation from inefficient gas units. This trend can be
illustrated by the structural growth in gas burn as demonstrated in the figure below. Total coal-to-gas switching
compared to the base year 2013 after adjusted for weather can be divided into structural growth and economic
switching. Structural growth represents increased gas generation from units that were built after 2013. The
economic switching portion represents coal-to-gas switching at existing units given fuel economics. Economic
switching can be negative. For example, in 2014, prices were higher, power producers partially switched back
to burning coal. More recently in 2017 and 2018, more generation was observed to come from new gas units
which crowded out the switching that could have happened at the older gas units. These more modern and
more efficient units are limiting gas burn growth as they consume less gas for each MWh generated. This
phenomenon is more prevalent in the winter time, as electricity demand is low, only the more efficient units
are dispatched versus in the summer time, more units, old or new, are dispatched when demand is at its peak.
19.7 20.1 21.824.3
21.224.1 24.8
0
5
10
15
20
25
30
12/13 13/14 14/15 15/16 16/17 17/18 18/19
WINTER ELECTRIC DEMAND FOR GAS(BCFD)
Note: light blue=cold winter, red=warm winter, dark blue-normal winter. Source: EVA
-0.8 -0.4-2.3
11.4
2.6
-4.4-1.6
0.0
-5.8-3.0
-8-6-4-202468
101214
South Central Mountain Pacific East Midwest
Net Gas Additions/Retirements Coal Retirements
GENERATION CAPACITY CHANGES FROM NOV 17 TO NOV 18
(GW)
Source: EVA

WINTER OUTLOOK WINTER 18/19
© 2018 ENERGY VENTURES ANALYSIS 6
WEATHER ADJUSTED POWER BURN INCREASES FROM BASE YEAR 2013
Last but not least, 2018 saw continued gains in wind and solar capacity. Going forward, wind and solar capacity
additions are forecast to exceed gas capacity additions (see figure below). The buildout of renewables has also
limited the growth in gas burn and will continue to compete for market share.
Regionally, the Pacific region will see some declines in power burn (see map below). The drop is due to the
retirement of 2.3 GW of gas generation capacity since the beginning of the last winter. Burn in the East and
South Central regions will grow the most, as more than 10 GW of coal capacity retired in the two regions since
last winter. Also included in the map is the sensitivities of power burn given a 10-cents increase or decrease in
average winter season Henry Hub prices. At the U.S. level, more downside exists for power burn when prices
increase by 10 cents. Given the current lower prices, the coal-to-gas switching potential is almost exhausted,
therefore, if prices drop by 10 cents, there will not be as much upside potential for gas burn as the downside
0
5
10
15
20
2016 2017 2018 2019 2020
Wind addition Solar addition Gas addition
CAPACITY ADDITIONS(GW)
Source: EVA
Steam – Peaker
Gas & Oil & Other
2016 -7.8 4.5 0.8 0.9 0.7 0.3 0.6 8.8 8.0
2017 -8.5 7.7 -1.2 -5.3 - -0.1 0.3 6.3 4.6
2018 -16.8 17.3 1.5 -3.7 -0.6 0.0 0.2 5.9 6.2
2019 -4.7 4.5 0.8 -0.6 -1.5 0.0 0.0 7.5 6.5
2020 -3.7 6.6 0.5 -2.3 1.6 - 0.0 9.3 8.3
YEARLY NET CAPACITY ADDITIONS AND RETIREMENTS (GW)
Coal CCGTGas
TurbineNuclear Hydro Wind Solar

WINTER OUTLOOK WINTER 18/19
© 2018 ENERGY VENTURES ANALYSIS 7
potential when prices increase. However, if prices fall below $2/MMBtu like the winter of 2015-2016, power
burn can average as high as 27.9 BCFD, 4.2 BCFD higher than the base case.
Industrial demand Industrial demand has been quite robust this year, growing by 1.2 BCFD YTD compared to demand during the
same period last year. While some of this growth can be attributed to below-normal temperatures from January
to April, the rest are structural growth which is expected to continue into the winter. Industrial demand is
forecast to grow by 0.45 BCFD winter over winter to average 24.5 BCFD.
In 2018, healthier activity in the energy-intensive industries provided a solid base for industrial sector demand,
and new facilities have also contributed to growth. The industrial sectors’ performance, as measured by the
U.S. Federal Reserve’s production indices, as well as industrial capacity utilization, has recovered from the lows
21.3
22.7 22.422.1
22.9
24.1 24.5
19
20
21
22
23
24
25
12/13 13/14 14/15 15/16 16/17 17/18 18/19
WINTER INDUSTRIAL DEMAND(BCFD)
Note: light blue=cold winter, red=warm winter, dark blue-normal winter. Source: EVA
WINTER OUTLOOK WINTER 18/19
© 2018 ENERGY VENTURES ANALYSIS 8
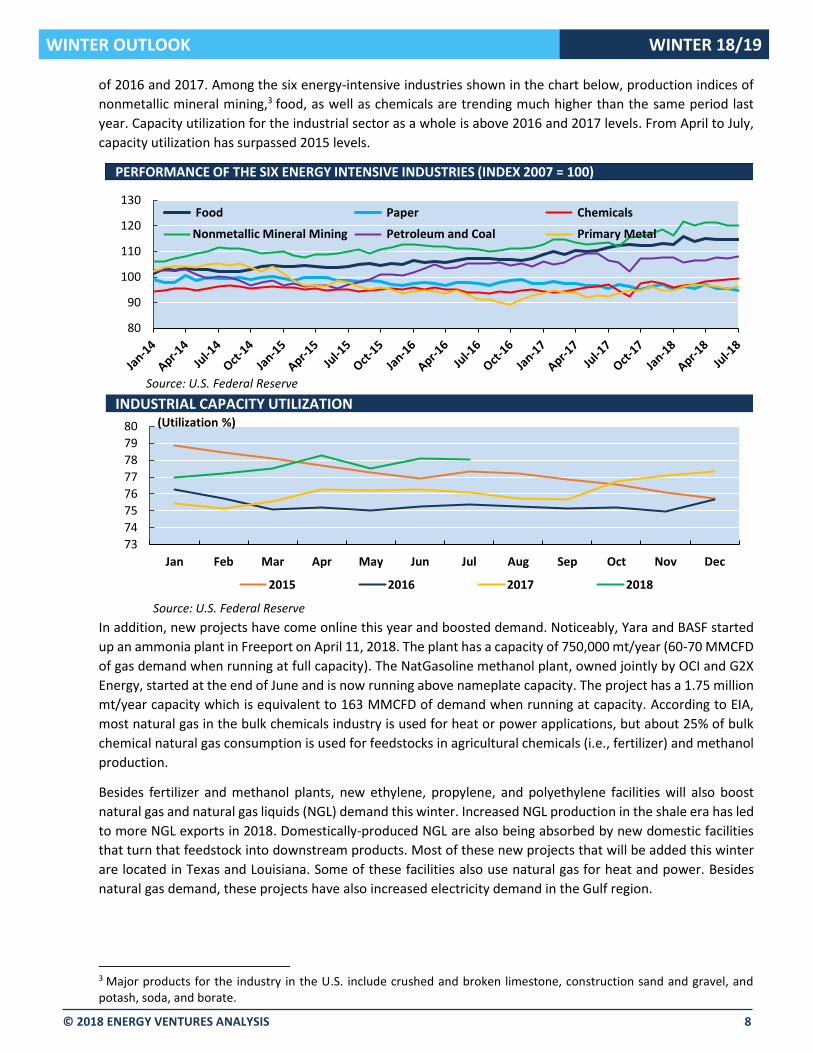
of 2016 and 2017. Among the six energy-intensive industries shown in the chart below, production indices of
nonmetallic mineral mining,3 food, as well as chemicals are trending much higher than the same period last
year. Capacity utilization for the industrial sector as a whole is above 2016 and 2017 levels. From April to July,
capacity utilization has surpassed 2015 levels.
In addition, new projects have come online this year and boosted demand. Noticeably, Yara and BASF started
up an ammonia plant in Freeport on April 11, 2018. The plant has a capacity of 750,000 mt/year (60-70 MMCFD
of gas demand when running at full capacity). The NatGasoline methanol plant, owned jointly by OCI and G2X
Energy, started at the end of June and is now running above nameplate capacity. The project has a 1.75 million
mt/year capacity which is equivalent to 163 MMCFD of demand when running at capacity. According to EIA,
most natural gas in the bulk chemicals industry is used for heat or power applications, but about 25% of bulk
chemical natural gas consumption is used for feedstocks in agricultural chemicals (i.e., fertilizer) and methanol
production.
Besides fertilizer and methanol plants, new ethylene, propylene, and polyethylene facilities will also boost
natural gas and natural gas liquids (NGL) demand this winter. Increased NGL production in the shale era has led
to more NGL exports in 2018. Domestically-produced NGL are also being absorbed by new domestic facilities
that turn that feedstock into downstream products. Most of these new projects that will be added this winter
are located in Texas and Louisiana. Some of these facilities also use natural gas for heat and power. Besides
natural gas demand, these projects have also increased electricity demand in the Gulf region.
3 Major products for the industry in the U.S. include crushed and broken limestone, construction sand and gravel, and potash, soda, and borate.
80
90
100
110
120
130 Food Paper Chemicals
Nonmetallic Mineral Mining Petroleum and Coal Primary Metal
PERFORMANCE OF THE SIX ENERGY INTENSIVE INDUSTRIES (INDEX 2007 = 100)PERFORMANCE OF THE SIX ENERGY INTENSIVE INDUSTRIES (INDEX 2007 = 100)
Source: U.S. Federal Reserve
73
74
75
76
77
78
79
80
Jan Feb Mar Apr May Jun Jul Aug Sep Oct Nov Dec
2015 2016 2017 2018
INDUSTRIAL CAPACITY UTILIZATION(Utilization %)
Source: U.S. Federal Reserve

WINTER OUTLOOK WINTER 18/19
© 2018 ENERGY VENTURES ANALYSIS 9
33 projects (2015-2017), total natural gas demand: 1.5 BCFD, total investment $53 billion 46 projects (2018-2023), total natural gas demand: 2.1 BCFD, total investment $79 billion *A couple projects in 2018 are steel/aluminum plants restarts, which could be the results of the section 232 imports tariffs on steel and aluminum. A couple fertilizer projects were eliminated in the estimates as they have had no news on further developments, likely a result of the ammonia market saturation. The green bar in 2022 is a methanol facility being developed by IGP Methanol, LLC (IGPM) near Myrtle Grove, in Plaquemines Parish, Louisiana.
In the medium to long term, import tariffs could have mixed impacts on U.S. industrial gas demand. Steel tariffs could encourage moderate expansion in domestic steel production. However, it could increase costs for consumers such as the oil and gas industry, the petrochemicals industry as well as second-wave LNG exports terminals. Furthermore, the potential tariffs on chemical products could hurt domestic manufacturers as the chemical industry touches 96% of all manufactured goods.
Residential and Commercial Residential and commercial demand in the winter follows an almost perfect linear relationship with total HDDs.
Assuming NOAA’s weather forecast, which is only slightly warmer than the 10-year normal, ResComm is
estimated to average 36.9 BCFD for the winter, about 1 BCFD lower than last winter. Note that ResComm can
swing from 32 BCFD to 41 BCFD in the winter depending on the weather (see figure below). This one factor
alone can swing total winter storage withdrawals by 0.6 TCF from the forecasted level.
-
0.10
0.20
0.30
0.40
0.50
0.60
0.70
0.80
-
2
4
6
8
10
12
14
16
18
20
No
.
De
man
d
No
.
De
man
d
No
.
De
man
d
No
.
De
man
d
No
.
De
man
d
No
.
De
man
d
No
.
De
man
d
No
.
De
man
d
No
.
De
man
d
2015 2016 2017 2018 2019 2020 2021 2022 2023
Online Under Construction Permit Received AnnouncedDemand (BCFD)(No. of Projects)
INDUSTRIAL PROJECTS AND GAS DEMAND
Source: EVA
90.4
8
0.5
16
0.613
0.3
18 0.7
8 0.3
40.1 2
0.6
10.1
35.941.3 39.5
31.933.7 37.8 36.9
0
1000
2000
3000
4000
5000
0
10
20
30
40
50
2012/2013 2013/2014 2014/2015 2015/2016 2016/2017 2017/2018 2018/2019
ResComm HDD
WINTER RESCOMM DEMAND(BCFD)
Source: EVA
(HDDs)

WINTER OUTLOOK WINTER 18/19
© 2018 ENERGY VENTURES ANALYSIS 10
ResComm demand has not shown visible structural growth even though numbers of customers in the
residential and commercial sectors have grown in the past ten years, by 6.6% and 3.8% respectively. One of the
reasons for the sluggish growth is efficiency gains. Average annual consumption per customer exhibits a
downward shaping trend as shown in the figure above.
Second, U.S. population continued to migrate to the South and the West from the Northeast and the Midwest,4 resulting in less heating need in the winter time. Third, electric heat pumps continued to gain popularity in new housing, especially in the multifamily units (see figures below).
4 According to U.S. Census data that was released in 2016.
0
200
400
600
800
0
20
40
60
80
100
120
1987 1992 1997 2002 2007 2012
Residental consumption per customerCommercial consumption per customer (right axis)Linear (Residental consumption per customer)Linear (Commercial consumption per customer (right axis))
(Residential, MCF)
ANNUAL CONSUMPTION PER CUSTOMER
Source: EVA
(Commercial, MCF)
050
100150200250300350400450
Gas Electricity Gas Electricity
Forced-air Furnace Heat Pump
2015 2016
SINGLE FAMILY HOUSES COMPLETED BY TYPE OF HEATING FUEL
(# of Units in Thousands)
Source: EVA
020406080
100120140160
Gas Electricity Gas Electricity
Forced-air Furnace Heat Pump
2015 2016
MULTIFAMILY UNITS COMPLETED BY TYPE OF HEATING FUEL
(# of Units in Thousands)
Source: EVA

WINTER OUTLOOK WINTER 18/19
© 2018 ENERGY VENTURES ANALYSIS 11
Exports
Winter 18/19’s LNG exports demand is forecast to average 4.7 BCFD (see figure below). Winter is the global
peak in LNG demand season. The trough to peak demand gap from the lowest demand month in summer 2017
to the highest demand month last winter was about 7.3 BCFD (see figure below). Three new LNG trains are
expected to come online this winter in the U.S. to serve peak LNG demand, translating into a 1.7 BCFD of LNG
exports growth winter over winter.
The new trains that are coming online include Elba Island Phase I (0.22 BCFD), Corpus Christi Train 1 (0.66 BCFD),
and Sabine Pass Train 5 (0.66 BCFD). These new trains have contracts with utilities in Spain, U.K., and portfolio
traders, indicating that some of the cargoes could land in Europe. This past June, Rough Storage, a facility that
provided 70% of U.K.’s total gas storage capacity, closed after 30 years of operations. The closure means that
U.K. now has about five days of storage capacity instead of 15 days, which could cause NBP to spike sharply
over the winter months, attracting U.S. cargoes.
The majority of U.S. LNG cargoes are still expected to head to Asia. 60% of the U.S. cargoes were shipped to
Asia last winter (see map below). The global LNG market has been tight this year to date. The global supply glut
of LNG caused by the newly commissioned U.S. and Australian trains was quickly absorbed by the fast growth
of global demand, most noticeably in China. Policy interventions, aimed at lowering particulate emissions, are
pushing natural gas to play a more significant role in China’s transportation, industrial and power sectors.
Further boosting demand in China this winter, ENN's Zhoushan terminal (3 MMTPA) and CNOOC's Shenzhen
terminal (4 MMTPA) have come online in August. Another terminal in Tianjin (3.5 MMTPA) is on track to start
in October. Indian LNG demand is also poised to take off. LNG demand was reportedly 20% higher in the first
half of 2018. The Mundra and Ennore LNG terminals (a combined 10 MMTPA in regasification capacity) are
expected to begin taking shipments in the second half of this year.
Given the growing demand, global prices are looking strong this winter, judging from the forward prices. Based
on the forward prices, EVA’s estimated netbacks, even after including the fixed costs, are looking profitable for
the U.S. cargoes, ensuring strong exports this winter (see chart below).
- 1 2 3 4 5 6 7 8 9
10
Jan
-16
Jun
-16
No
v-1
6
Ap
r-1
7
Sep
-17
Feb
-18
Jul-
18
De
c-1
8
May
-19
Oct
-19
Mar
-20
Au
g-2
0
Sabine Pass LNG Cove PointElba Island Cameron LNGCorpus Christi LNG Freeport LNGLNG Exports
U.S. LNG EXPORTS CAPACITY BY PROJECT
(BCFD)
Source: EVA
0
5
10
15
20
25
30
35
40
Jan
-14
May
-14
Sep
-14
Jan
-15
May
-15
Sep
-15
Jan
-16
May
-16
Sep
-16
Jan
-17
May
-17
Sep
-17
Jan
-18
AsiaMENAEuropeSouth AmericaNorth and Central America
GLOBAL LNG IMPORTS SEASONALITY
(BCFD)
Source: EVA

WINTER OUTLOOK WINTER 18/19
© 2018 ENERGY VENTURES ANALYSIS 12
WINTER 2017-2018 U.S. LNG EXPORTS
2018 U.S. LNG EXPORTS COMPARED TO 2017 (JAN TO AUG)
Total 399 BCF in Winter 2017-2018
Top Three Importers of U.S. LNG
• South Korea 102 BCF
• China 75 BCF
• Mexico 68 BCF
Total 640 BCF in Jan to Aug of 2018
Top Three Importers of U.S. LNG
• Mexico 138 BCF
• South Korea 132 BCF
• China 88 BCF

WINTER OUTLOOK WINTER 18/19
© 2018 ENERGY VENTURES ANALYSIS 13
U.S.’s LNG exports to Mexico remained high this year. Even though a few pipelines that were delayed in Mexico
finally came online, their reach to the market is limited as downstream pipelines are still under construction.
Mexico’s domestic production has stabilized this year after a fast decline in 2017. However, production has
shown no signs of recovery. On the other hand, the growing demand in Mexico is calling for more imports in
the form of either LNG or pipeline imports. Pipeline imports have already pushed above 5 BCFD thanks to the
pipelines that came online this summer (see table below). As more pipelines get completed later this year (see
second table below), it’s likely that LNG imports could be partially displaced. But more displacement will be
seen in 2019. TransCanada’s Sur de Texas – Tuxapan pipeline is delayed until 2019 and this pipeline will be able
to bring gas from South Texas to Tuxapan where demand used to be served by LNG imports at Altamira. Once
this 2.6 BCFD pipeline comes online, LNG imports to Mexico are expected to drop. The La Laguna-Aguascalientes
pipeline will be able to ship gas from La Laguna to central Mexico, completing the supply route all the way from
Permian. If completed in time later this year, exports from West Texas to Mexico are also expected to grow.
Pipeline exports to Mexico are forecast to grow by 0.8 BCFD winter over winter. This forecast is risk-weighted,
assuming there could be some delays to the pipelines as well as the power plants that the pipelines are expected
to serve. In the long term, pipeline exports to Mexico is forecast to grow to 6.1 BCFD by 2020.
PIPELINES THAT HAVE COME ONLINE SINCE MAY 2018 Pipeline Additions Capacity (BCFD)
Tarahumara expansion 0.2
Nueva Era 0.5
TGP cross-border capacity increase 0.4
El Encino – La Laguna 1.5
El Encino-Topolobampo 0.7
Argüelles pipeline capacity increase 0.15
PIPELINES THAT ARE COMING ONLINE THIS WINTER
Pipeline Additions Capacity (BCFD) Expected Online Month
La Laguna Aguascalientes 1.2 Nov 2018
Samalayuca-Sasabe 0.5 Nov 2018
MEXICO’S GAS PIPELINE EXPANSIONS
-6-4-202468
10
Jan
-16
Mar
-16
May
-16
Jul-
16
Sep
-16
No
v-1
6
Jan
-17
Mar
-17
May
-17
Jul-
17
Sep
-17
No
v-1
7
Jan
-18
Mar
-18
May
-18
Jul-
18
Sep
-18
No
v-1
8
Jan
-19
Mar
-19
May
-19
Jul-
19
Sep
-19
No
v-1
9
Full Netback to Europe Full Netback to East Asia
Variable Netback to Europe Variable Netback to East Asia
($/MMBTU)
NETBACKS OF US LNG
Estimated Based on Forward Curves

WINTER OUTLOOK WINTER 18/19
© 2018 ENERGY VENTURES ANALYSIS 14
III. OUTLOOK FOR SUPPLY
Production Production has grown by 9 BCFD year over year to 81.9 BCFD as of August 2018 and will continue to push higher
to 85.5 BCFD by the end of winter 18/19. The growth so far has been split between dry gas and associated gas
(see chart below). Although Permian grabbed the headlines this year, most of the increase in gas production
happened in the Marcellus and Utica in the Northeast.
Source: EVA, as of Aug 2018

WINTER OUTLOOK WINTER 18/19
© 2018 ENERGY VENTURES ANALYSIS 15
One of the reasons why Permian has not contributed more to the gas production is that Permian wells have
lower gas initial production rate (IP rate) compared to a typical Northeast well. Approximately, three Permian
wells are equivalent to one Northeast well regarding initial gas production. Secondly, although Permian has
added rigs, part of the drilling activities has resulted in increasing DUCs (drilled but uncompleted wells, see
figure below) due to the infrastructure constraints on both the crude and the natural gas side. The 3,470 DUC
wells in Permian could translate into 6 BCFD of production if all were to come online in one year. Realistically,
one-third of these DUCs represent a “base” inventory which will remain. Secondly, DUC completions are usually
phased in over a time period. Therefore the 6 BCFD potential could be reduced to 2 BCFD when the pipelines
become available in Permian.
A handful of gas pipeline projects have been announced to provide gas takeaway outlets from the Permian
Basin. In a sense, Permian has become the new Northeast in terms of pipeline proposals. The difference is that
Permian has a crude oil focus versus the Northeast producers are mostly targeting dry gas and NGL. A couple
of small brownfield projects are expected to be completed in 2018 and increase takeaway capacity slightly. The
big greenfield projects won’t be ready in time for this winter, instead will come online later in 2019 (see map
below). The infrastructure situation has, and will, limit the growth in Permian until late 2019. Currently, the
-1.0
-0.5
0.0
0.5
1.0
1.5
2.0M
arce
llus
Dry
Uti
ca
Hay
ne
svill
e
Faye
tte
ville
Eagl
e Fo
rd D
ry
Bar
ne
tt D
ry
Mar
cellu
s W
et
Eagl
e Fo
rd W
et
Pe
rmia
n
Bar
ne
tt W
et
DJ
& G
ree
n R
iver
Okl
aho
ma
Bak
ken
Gu
lf o
f M
exi
co
Re
st o
f th
e C
ou
ntr
y
Dry Wet/Oil
PRODUCTION TRENDS BY PLAY (AUGUST 2018 VS. AUGUST 2017)(BCFD)
Source: PointLogic, EVA
Dry production grew by 4.6 BCFD Associated production grew by 4.4 BCFD
-
2,000
4,000
6,000
8,000
10,000
De
c-1
3
Mar
-14
Jun
-14
Sep
-14
De
c-1
4
Mar
-15
Jun
-15
Sep
-15
De
c-1
5
Mar
-16
Jun
-16
Sep
-16
De
c-1
6
Mar
-17
Jun
-17
Sep
-17
De
c-1
7
Mar
-18
Jun
-18
Anadarko Appalachia Bakken Eagle Ford
Haynesville Niobrara Permian
DRILLED BUT UNCOMPLETED WELLS
Source: EIA, EVA

WINTER OUTLOOK WINTER 18/19
© 2018 ENERGY VENTURES ANALYSIS 16
Midland crude differential to WTI has widened to $15/bbl due to the crude takeaway constraints, which has
slowed down rig activities in Permian.
PERMIAN TAKEAWAY GAS PIPELINES
In the long term, Permian gas production is expected to grow to 11 BCFD by the end of 2020 assuming the
buildout of planned pipeline additions. Given the low breakeven prices of Permian crude, the relatively friendly
environment in Texas to build petroleum and natural gas infrastructure, as well as the high DUC inventories,
there appear to be few risks to the growth in Permian production.
Given that associated gas (excluding Marcellus Wet) is more than one-third of the total production, the price
fluctuations in the crude and NGL markets will impact total U.S. gas production in the medium to long-term. As
shown in the figure below, when crude oil prices plummeted in late 2014, associated production started to
decline, and as oil price picked up this year, associated gas production resumed growth. If global demand for
oil drops or OPEC increases production, the impact on crude oil markets will also be felt in natural gas markets,
0
5
10
15Existing Spare Capacity WT-1 Compressor Station Modification
North Texas (Energy Transfers) Pecos Trail
Waha Deliverability Expansion Gulf Coast Express
El Paso South Mainline Expansion Permian to Katy
Bluebonnet Market Express Whistler
PERMIAN PIPELINE TAKEAWAY CAPACITY VS. PRODUCTION GROWTH(BCFD)
Source: EVA
Source: EVA


![SPE 165832 China Shale Gas and Shale Oil Resource ... · PDF file2 [165832] China’s National Energy Administration’s mean shale gas output target is 7.7 Bcfd by 2020, but industry](https://static.fdocuments.in/doc/165x107/5a6ff52a7f8b9aac538b7b52/spe-165832-china-shale-gas-and-shale-oil-resource-wwwadv-rescompdfchinashalegasandshaleoilresourcepdf.jpg)