Natural Docosahexaenoic Acid in the Triglyceride Form...
15
nutrients Article Natural Docosahexaenoic Acid in the Triglyceride Form Attenuates In Vitro Microglial Activation and Ameliorates Autoimmune Encephalomyelitis in Mice Pilar Mancera 1 , Blanca Wappenhans 1 , Begoña Cordobilla 2 , Noemí Virgili 1 , Marco Pugliese 1,3 ,Fèlix Rueda 2 , Juan F. Espinosa-Parrilla 1,† and Joan C. Domingo 2, * ,† 1 Neurotec Pharma SL, Bioincubadora PCB-Santander, Parc Científic de Barcelona, Baldiri Reixac 15, E-08028 Barcelona, Spain; [email protected] (P.M.); [email protected] (B.W.); [email protected] (N.V.); [email protected] (M.P.); [email protected] (J.F.E.-P.) 2 Departament de Bioquímica i Biologia Molecular, Falcutat de Biologia, Universitat de Barcelona, Avinguda Diagonal 643, E-08028 Barcelona, Spain; [email protected] (B.C.); [email protected] (F.R.) 3 Unitat de Bioquímica i Biologia Molecular, Departament de Ciències Fisiològiques I, Facultat de Medicina, Institut d’Investigacions Biomèdiques August Pi i Sunyer (IDIBAPS) and Centro de Investigación Biomédica en Red sobre Enfermedades Neurodegenerativas (CIBERNED), Casanova 143, E-08036 Barcelona, Spain * Correspondence: [email protected]; Tel.: +34-93-4021214 † These authors contributed equally to this work. Received: 21 February 2017; Accepted: 26 June 2017; Published: 30 June 2017 Abstract: Many neurodegenerative diseases are associated, at least in part, to an inflammatory process in which microglia plays a major role. The effect of the triglyceride form of the omega-3 polyunsaturated fatty acid docosahexaenoic acid (TG-DHA) was assayed in vitro and in vivo to assess the protective and anti-inflammatory activity of this compound. In the in vitro study, BV-2 microglia cells were previously treated with TG-DHA and then activated with Lipopolysaccharide (LPS) and Interferon-gamma (IFN-γ). TG-DHA treatment protected BV-2 microglia cells from oxidative stress toxicity attenuating NO production and suppressing the induction of inflammatory cytokines. When compared with DHA in the ethyl-ester form, a significant difference in the ability to inhibit NO production in favor of TG-DHA was observed. TG-DHA inhibited significantly splenocyte proliferation but isolated CD4+ lymphocyte proliferation was unaffected. In a mice model of autoimmune encephalomyelitis (EAE), 250 mg/kg/day oral TG-DHA treatment was associated with a significant amelioration of the course and severity of the disease as compared to untreated animals. TG-DHA-treated EAE mice showed a better weight profile, which is a symptom related to a better course of encephalomyelitis. TG-DHA may be a promising therapeutic agent in neuroinflammatory processes and merit to be more extensively studied in human neurodegenerative disorders. Keywords: docosahexaenoic acid; microglia; omega-3 polyunsaturated fatty acid; oxidative stress; anti-inflammatory process; EAE model 1. Introduction Nerve injury and neuroinflammation can result from a number of physical, chemical, infectious, and immunological causes. Although, in general, microglia cells play a beneficial role in various aspects of maintenance and repair of the central nervous system (CNS), they also contribute to CNS damage through several pathways involved in neuroinflammatory or autoimmune conditions, such as secretion of inflammatory cytokines (e.g., interleukin (IL)-6, tumor necrosis factor (TNF)-α, IL-1) and nitric oxide (NO) [1]. Furthermore, microglia cells in the presence of T-cells are the main factor responsible for the induction of the immune response in brain, where they play a role similar to that of dendritic cells in the periphery in the recognition and presentation of self and foreign antigens Nutrients 2017, 9, 681; doi:10.3390/nu9070681 www.mdpi.com/journal/nutrients
-
Upload
nguyenkhue -
Category
Documents
-
view
214 -
download
0
Transcript of Natural Docosahexaenoic Acid in the Triglyceride Form...

nutrients
Article
Natural Docosahexaenoic Acid in the TriglycerideForm Attenuates In Vitro Microglial Activation andAmeliorates Autoimmune Encephalomyelitis in Mice
Pilar Mancera 1, Blanca Wappenhans 1 , Begoña Cordobilla 2 , Noemí Virgili 1,Marco Pugliese 1,3, Fèlix Rueda 2, Juan F. Espinosa-Parrilla 1,† and Joan C. Domingo 2,*,†
1 Neurotec Pharma SL, Bioincubadora PCB-Santander, Parc Científic de Barcelona, Baldiri Reixac 15,E-08028 Barcelona, Spain; [email protected] (P.M.); [email protected] (B.W.);[email protected] (N.V.); [email protected] (M.P.); [email protected] (J.F.E.-P.)
2 Departament de Bioquímica i Biologia Molecular, Falcutat de Biologia, Universitat de Barcelona,Avinguda Diagonal 643, E-08028 Barcelona, Spain; [email protected] (B.C.); [email protected] (F.R.)
3 Unitat de Bioquímica i Biologia Molecular, Departament de Ciències Fisiològiques I, Facultat de Medicina,Institut d’Investigacions Biomèdiques August Pi i Sunyer (IDIBAPS) and Centro de Investigación Biomédicaen Red sobre Enfermedades Neurodegenerativas (CIBERNED), Casanova 143, E-08036 Barcelona, Spain
* Correspondence: [email protected]; Tel.: +34-93-4021214† These authors contributed equally to this work.
Received: 21 February 2017; Accepted: 26 June 2017; Published: 30 June 2017
Abstract: Many neurodegenerative diseases are associated, at least in part, to an inflammatoryprocess in which microglia plays a major role. The effect of the triglyceride form of the omega-3polyunsaturated fatty acid docosahexaenoic acid (TG-DHA) was assayed in vitro and in vivo to assessthe protective and anti-inflammatory activity of this compound. In the in vitro study, BV-2 microgliacells were previously treated with TG-DHA and then activated with Lipopolysaccharide (LPS)and Interferon-gamma (IFN-γ). TG-DHA treatment protected BV-2 microglia cells from oxidativestress toxicity attenuating NO production and suppressing the induction of inflammatory cytokines.When compared with DHA in the ethyl-ester form, a significant difference in the ability to inhibitNO production in favor of TG-DHA was observed. TG-DHA inhibited significantly splenocyteproliferation but isolated CD4+ lymphocyte proliferation was unaffected. In a mice model ofautoimmune encephalomyelitis (EAE), 250 mg/kg/day oral TG-DHA treatment was associated witha significant amelioration of the course and severity of the disease as compared to untreated animals.TG-DHA-treated EAE mice showed a better weight profile, which is a symptom related to a bettercourse of encephalomyelitis. TG-DHA may be a promising therapeutic agent in neuroinflammatoryprocesses and merit to be more extensively studied in human neurodegenerative disorders.
Keywords: docosahexaenoic acid; microglia; omega-3 polyunsaturated fatty acid; oxidative stress;anti-inflammatory process; EAE model
1. Introduction
Nerve injury and neuroinflammation can result from a number of physical, chemical, infectious,and immunological causes. Although, in general, microglia cells play a beneficial role in variousaspects of maintenance and repair of the central nervous system (CNS), they also contribute to CNSdamage through several pathways involved in neuroinflammatory or autoimmune conditions, suchas secretion of inflammatory cytokines (e.g., interleukin (IL)-6, tumor necrosis factor (TNF)-α, IL-1)and nitric oxide (NO) [1]. Furthermore, microglia cells in the presence of T-cells are the main factorresponsible for the induction of the immune response in brain, where they play a role similar to thatof dendritic cells in the periphery in the recognition and presentation of self and foreign antigens
Nutrients 2017, 9, 681; doi:10.3390/nu9070681 www.mdpi.com/journal/nutrients
Nutrients 2017, 9, 681 2 of 15
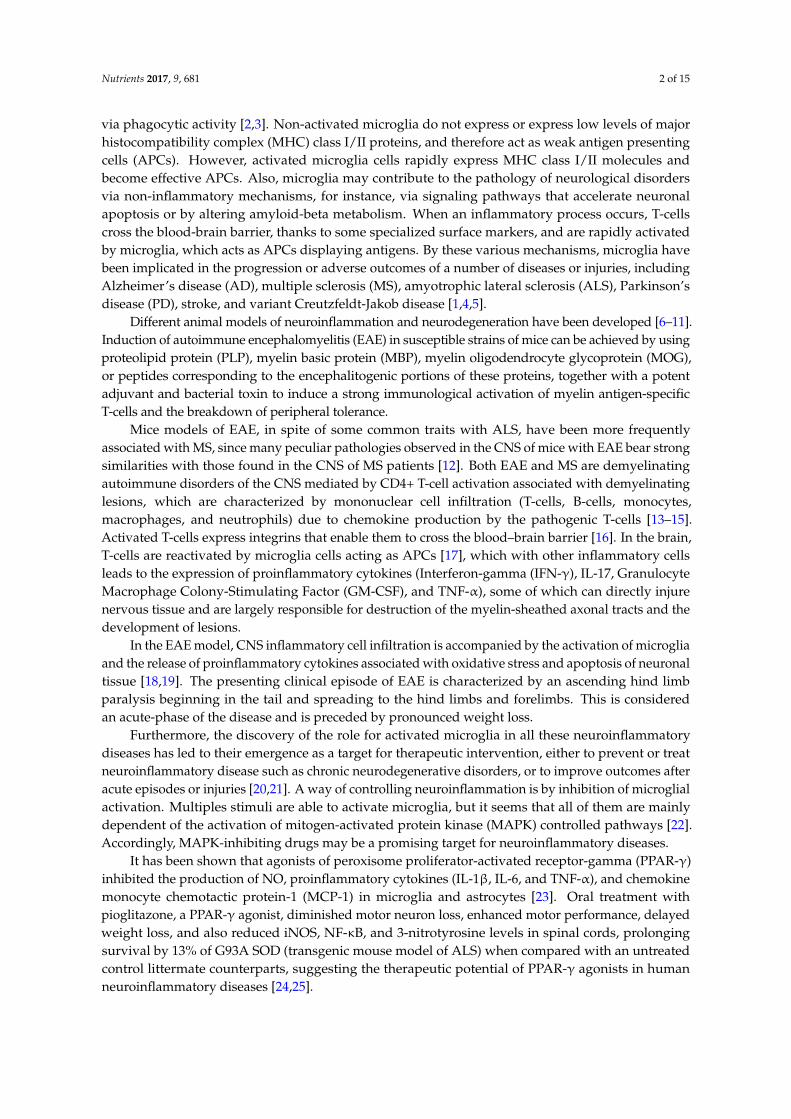
via phagocytic activity [2,3]. Non-activated microglia do not express or express low levels of majorhistocompatibility complex (MHC) class I/II proteins, and therefore act as weak antigen presentingcells (APCs). However, activated microglia cells rapidly express MHC class I/II molecules andbecome effective APCs. Also, microglia may contribute to the pathology of neurological disordersvia non-inflammatory mechanisms, for instance, via signaling pathways that accelerate neuronalapoptosis or by altering amyloid-beta metabolism. When an inflammatory process occurs, T-cellscross the blood-brain barrier, thanks to some specialized surface markers, and are rapidly activatedby microglia, which acts as APCs displaying antigens. By these various mechanisms, microglia havebeen implicated in the progression or adverse outcomes of a number of diseases or injuries, includingAlzheimer’s disease (AD), multiple sclerosis (MS), amyotrophic lateral sclerosis (ALS), Parkinson’sdisease (PD), stroke, and variant Creutzfeldt-Jakob disease [1,4,5].
Different animal models of neuroinflammation and neurodegeneration have been developed [6–11].Induction of autoimmune encephalomyelitis (EAE) in susceptible strains of mice can be achieved by usingproteolipid protein (PLP), myelin basic protein (MBP), myelin oligodendrocyte glycoprotein (MOG),or peptides corresponding to the encephalitogenic portions of these proteins, together with a potentadjuvant and bacterial toxin to induce a strong immunological activation of myelin antigen-specificT-cells and the breakdown of peripheral tolerance.
Mice models of EAE, in spite of some common traits with ALS, have been more frequentlyassociated with MS, since many peculiar pathologies observed in the CNS of mice with EAE bear strongsimilarities with those found in the CNS of MS patients [12]. Both EAE and MS are demyelinatingautoimmune disorders of the CNS mediated by CD4+ T-cell activation associated with demyelinatinglesions, which are characterized by mononuclear cell infiltration (T-cells, B-cells, monocytes,macrophages, and neutrophils) due to chemokine production by the pathogenic T-cells [13–15].Activated T-cells express integrins that enable them to cross the blood–brain barrier [16]. In the brain,T-cells are reactivated by microglia cells acting as APCs [17], which with other inflammatory cellsleads to the expression of proinflammatory cytokines (Interferon-gamma (IFN-γ), IL-17, GranulocyteMacrophage Colony-Stimulating Factor (GM-CSF), and TNF-α), some of which can directly injurenervous tissue and are largely responsible for destruction of the myelin-sheathed axonal tracts and thedevelopment of lesions.
In the EAE model, CNS inflammatory cell infiltration is accompanied by the activation of microgliaand the release of proinflammatory cytokines associated with oxidative stress and apoptosis of neuronaltissue [18,19]. The presenting clinical episode of EAE is characterized by an ascending hind limbparalysis beginning in the tail and spreading to the hind limbs and forelimbs. This is consideredan acute-phase of the disease and is preceded by pronounced weight loss.
Furthermore, the discovery of the role for activated microglia in all these neuroinflammatorydiseases has led to their emergence as a target for therapeutic intervention, either to prevent or treatneuroinflammatory disease such as chronic neurodegenerative disorders, or to improve outcomes afteracute episodes or injuries [20,21]. A way of controlling neuroinflammation is by inhibition of microglialactivation. Multiples stimuli are able to activate microglia, but it seems that all of them are mainlydependent of the activation of mitogen-activated protein kinase (MAPK) controlled pathways [22].Accordingly, MAPK-inhibiting drugs may be a promising target for neuroinflammatory diseases.
It has been shown that agonists of peroxisome proliferator-activated receptor-gamma (PPAR-γ)inhibited the production of NO, proinflammatory cytokines (IL-1β, IL-6, and TNF-α), and chemokinemonocyte chemotactic protein-1 (MCP-1) in microglia and astrocytes [23]. Oral treatment withpioglitazone, a PPAR-γ agonist, diminished motor neuron loss, enhanced motor performance, delayedweight loss, and also reduced iNOS, NF-κB, and 3-nitrotyrosine levels in spinal cords, prolongingsurvival by 13% of G93A SOD (transgenic mouse model of ALS) when compared with an untreatedcontrol littermate counterparts, suggesting the therapeutic potential of PPAR-γ agonists in humanneuroinflammatory diseases [24,25].
Nutrients 2017, 9, 681 3 of 15
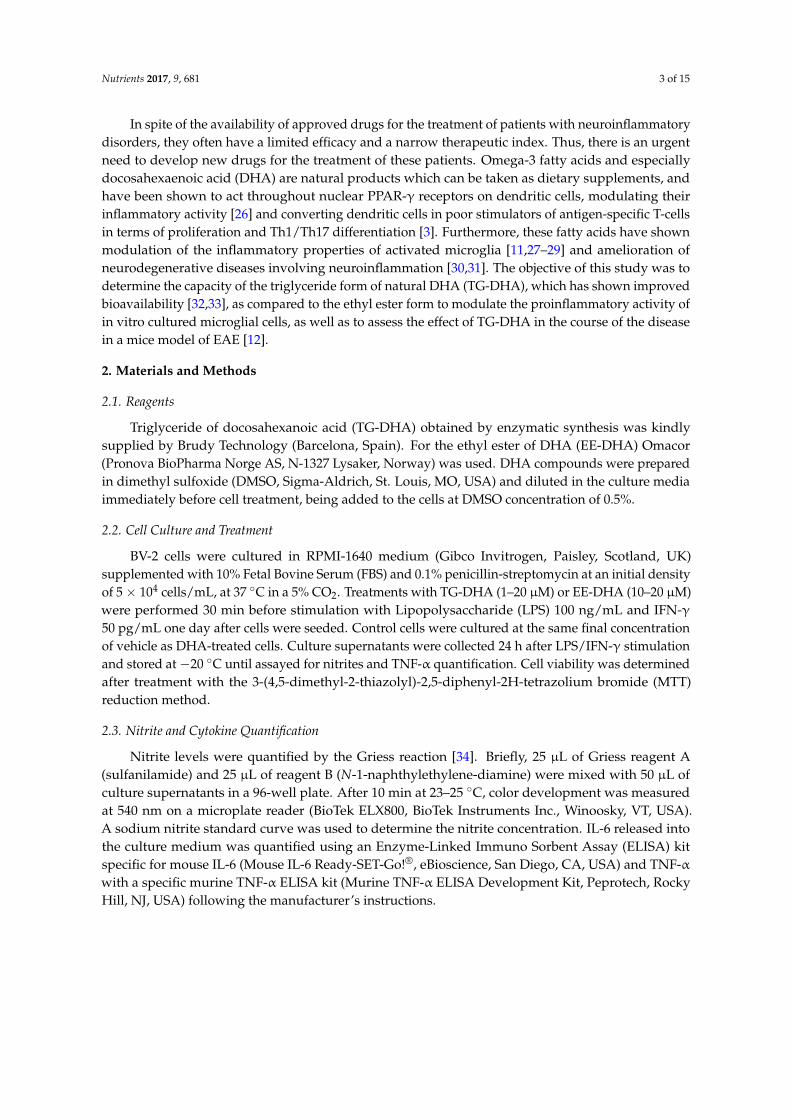
In spite of the availability of approved drugs for the treatment of patients with neuroinflammatorydisorders, they often have a limited efficacy and a narrow therapeutic index. Thus, there is an urgentneed to develop new drugs for the treatment of these patients. Omega-3 fatty acids and especiallydocosahexaenoic acid (DHA) are natural products which can be taken as dietary supplements, andhave been shown to act throughout nuclear PPAR-γ receptors on dendritic cells, modulating theirinflammatory activity [26] and converting dendritic cells in poor stimulators of antigen-specific T-cellsin terms of proliferation and Th1/Th17 differentiation [3]. Furthermore, these fatty acids have shownmodulation of the inflammatory properties of activated microglia [11,27–29] and amelioration ofneurodegenerative diseases involving neuroinflammation [30,31]. The objective of this study was todetermine the capacity of the triglyceride form of natural DHA (TG-DHA), which has shown improvedbioavailability [32,33], as compared to the ethyl ester form to modulate the proinflammatory activity ofin vitro cultured microglial cells, as well as to assess the effect of TG-DHA in the course of the diseasein a mice model of EAE [12].
2. Materials and Methods
2.1. Reagents
Triglyceride of docosahexanoic acid (TG-DHA) obtained by enzymatic synthesis was kindlysupplied by Brudy Technology (Barcelona, Spain). For the ethyl ester of DHA (EE-DHA) Omacor(Pronova BioPharma Norge AS, N-1327 Lysaker, Norway) was used. DHA compounds were preparedin dimethyl sulfoxide (DMSO, Sigma-Aldrich, St. Louis, MO, USA) and diluted in the culture mediaimmediately before cell treatment, being added to the cells at DMSO concentration of 0.5%.
2.2. Cell Culture and Treatment
BV-2 cells were cultured in RPMI-1640 medium (Gibco Invitrogen, Paisley, Scotland, UK)supplemented with 10% Fetal Bovine Serum (FBS) and 0.1% penicillin-streptomycin at an initial densityof 5 × 10⁴ cells/mL, at 37 ◦C in a 5% CO2. Treatments with TG-DHA (1–20 µM) or EE-DHA (10–20 µM)were performed 30 min before stimulation with Lipopolysaccharide (LPS) 100 ng/mL and IFN-γ50 pg/mL one day after cells were seeded. Control cells were cultured at the same final concentrationof vehicle as DHA-treated cells. Culture supernatants were collected 24 h after LPS/IFN-γ stimulationand stored at −20 ◦C until assayed for nitrites and TNF-α quantification. Cell viability was determinedafter treatment with the 3-(4,5-dimethyl-2-thiazolyl)-2,5-diphenyl-2H-tetrazolium bromide (MTT)reduction method.
2.3. Nitrite and Cytokine Quantification
Nitrite levels were quantified by the Griess reaction [34]. Briefly, 25 µL of Griess reagent A(sulfanilamide) and 25 µL of reagent B (N-1-naphthylethylene-diamine) were mixed with 50 µL ofculture supernatants in a 96-well plate. After 10 min at 23–25 ◦C, color development was measuredat 540 nm on a microplate reader (BioTek ELX800, BioTek Instruments Inc., Winoosky, VT, USA).A sodium nitrite standard curve was used to determine the nitrite concentration. IL-6 released intothe culture medium was quantified using an Enzyme-Linked Immuno Sorbent Assay (ELISA) kitspecific for mouse IL-6 (Mouse IL-6 Ready-SET-Go!®, eBioscience, San Diego, CA, USA) and TNF-αwith a specific murine TNF-α ELISA kit (Murine TNF-α ELISA Development Kit, Peprotech, RockyHill, NJ, USA) following the manufacturer’s instructions.

Nutrients 2017, 9, 681 4 of 15
2.4. Cell Viability: 3-(4,5-dimethyl-2-thiazolyl)-2,5-diphenyl-2H-tetrazolium bromide (MTT)Reduction Method
Cell viability was established by MTT reduction assay. Briefly, 96 microplate wells were filledwith MTT (Sigma-Aldrich) at a final concentration of 0.5 mg/mL per well and incubated at 37 ◦C,then DMSO was added and cells were gently resuspended. Absorbance was read at 560 and 620 ina microplate reader (BioTek ELX800, BioTek Instruments Inc., Winoosky, VT, USA).
2.5. Mice
Female C57BL/6J mice (8 to 10 weeks old) purchased from Charles River (Sulzfeld, Germany)were handled according to European legislation (86/609/EEC) as previously described [34]. All theexperiments and procedures were approved by the Ethics Committee of the University of Barcelonaunder the supervision of the Generalitat of Catalunya, Spain.
2.6. EAE Induction and Treatment
EAE was induced by immunization with >95% pure synthetic MOG35-55 peptide (rat MOG35-55,MEVGWYRSPFSRVVHLYRNGK, EspiKem Srl, Florence, Italy). Mice were injected subcutaneouslyat one side of the flank with 100 µL solution containing 150 µg of rat MOG in complete Freund’sadjuvant (Sigma-Aldrich) and 5 mg/mL Mycobacterium tuberculosis H37Ra (Difco Laboratories, Detroit,MI, USA). Forty-eight hours after MOG injection, 150 ng pertussis toxin (Sigma-Aldrich) in 100 µLPBS were injected intraperitoneally. The animals were monitored every other day for the developmentof clinical symptoms, which typically become evident between 12 and 20 days after immunization.Once the disease had developed, mice were assessed daily for changes in severity. Signs of EAE werescored daily on a 0 to 6 scale using the following criteria: 0, no clinical signs; 1, distal limp tail; 1.5,complete limp tail; 2, mild paraparesis of the hind limbs, unsteady gait, and impairment of rightingreflex; 3, moderate paraparesis, partial hind limb paralysis, voluntary movements still possible, andataxia; 4, paraplegia and forelimb weakness; 5, tetraparesis; 6, moribund state. Mice were treated dailyby oral administration of 50 mg/kg TG-DHA, 250 mg/kg TG-DHA, or vehicle (0.3% DMSO in water)over a total of 56 days, with treatment beginning 15 days prior to EAE induction. At this time micewere euthanized under deep anesthesia to obtain blood and tissues to perform analysis describedbelow. No treatment-related adverse effects were observed in any of either healthy or EAE-inducedmice following standard criteria [35]. Experiments were performed with groups (n = 10) of C57BL/6Jhealthy untreated mice (healthy untreated group), healthy DHA-treated mice (healthy DHA-treatedgroup), EAE-induced untreated mice (EAE untreated group), and EAE-induced DHA-treated mice(EAE-DHA-treated group) as indicated. The groups of mice were randomized. No previous selectionwas made for any characteristics, such as weight, size, etc.
2.7. Mouse Splenocytes and CD4+ T-Cells Preparation
Splenocytes were isolated from the spleens of female C57BL/6J mice. Cells were flushed out fromthe spleens gently using a syringe plunger with PBS and then centrifuged (×1000 rpm, 4 ◦C). The pelletwas resuspended and left 5 min on ice in ACK lysing buffer (Invitrogen, Eugene, OR, USA) to removeerythrocytes. After further centrifugations, cells were resuspended in 10 mL of complete mediumRPMI (Invitrogen) supplemented with 10% Fetal Bovine Serum (FBS, Invitrogen), Hepes 10 mM(Invitrogen), sodium pyruvate 1 mM (Invitrogen), non-essential amino acids 1% (Sigma-Aldrich), and50 µM β-mercaptoethanol (Sigma-Aldrich).
CD4+ T-cells were isolated using Dynabeads FlowComp Mouse CD4 kit (DYNAL, Invitrogen)following the manufacturer’s instructions. After isolation, cells were counted and the viabilitywas determined by trypan blue exclusion, while the purity for CD4+ cells (>92%) was assessedby fluorescence activated cell sorting (FACS) (Gallios BD Bioscience).
Nutrients 2017, 9, 681 5 of 15
2.8. Proliferative Response of Lymphocytes
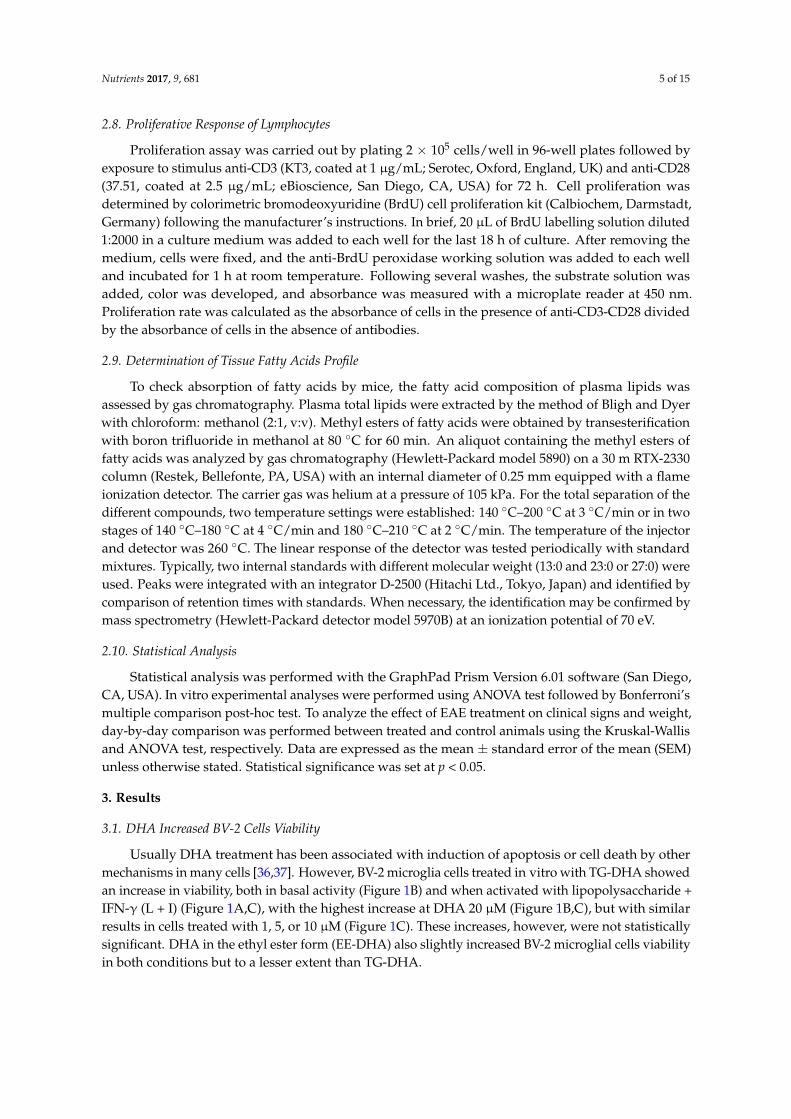
Proliferation assay was carried out by plating 2 × 10⁵ cells/well in 96-well plates followed byexposure to stimulus anti-CD3 (KT3, coated at 1 µg/mL; Serotec, Oxford, England, UK) and anti-CD28(37.51, coated at 2.5 µg/mL; eBioscience, San Diego, CA, USA) for 72 h. Cell proliferation wasdetermined by colorimetric bromodeoxyuridine (BrdU) cell proliferation kit (Calbiochem, Darmstadt,Germany) following the manufacturer’s instructions. In brief, 20 µL of BrdU labelling solution diluted1:2000 in a culture medium was added to each well for the last 18 h of culture. After removing themedium, cells were fixed, and the anti-BrdU peroxidase working solution was added to each welland incubated for 1 h at room temperature. Following several washes, the substrate solution wasadded, color was developed, and absorbance was measured with a microplate reader at 450 nm.Proliferation rate was calculated as the absorbance of cells in the presence of anti-CD3-CD28 dividedby the absorbance of cells in the absence of antibodies.
2.9. Determination of Tissue Fatty Acids Profile
To check absorption of fatty acids by mice, the fatty acid composition of plasma lipids wasassessed by gas chromatography. Plasma total lipids were extracted by the method of Bligh and Dyerwith chloroform: methanol (2:1, v:v). Methyl esters of fatty acids were obtained by transesterificationwith boron trifluoride in methanol at 80 ◦C for 60 min. An aliquot containing the methyl esters offatty acids was analyzed by gas chromatography (Hewlett-Packard model 5890) on a 30 m RTX-2330column (Restek, Bellefonte, PA, USA) with an internal diameter of 0.25 mm equipped with a flameionization detector. The carrier gas was helium at a pressure of 105 kPa. For the total separation of thedifferent compounds, two temperature settings were established: 140 ◦C–200 ◦C at 3 ◦C/min or in twostages of 140 ◦C–180 ◦C at 4 ◦C/min and 180 ◦C–210 ◦C at 2 ◦C/min. The temperature of the injectorand detector was 260 ◦C. The linear response of the detector was tested periodically with standardmixtures. Typically, two internal standards with different molecular weight (13:0 and 23:0 or 27:0) wereused. Peaks were integrated with an integrator D-2500 (Hitachi Ltd., Tokyo, Japan) and identified bycomparison of retention times with standards. When necessary, the identification may be confirmed bymass spectrometry (Hewlett-Packard detector model 5970B) at an ionization potential of 70 eV.
2.10. Statistical Analysis
Statistical analysis was performed with the GraphPad Prism Version 6.01 software (San Diego,CA, USA). In vitro experimental analyses were performed using ANOVA test followed by Bonferroni’smultiple comparison post-hoc test. To analyze the effect of EAE treatment on clinical signs and weight,day-by-day comparison was performed between treated and control animals using the Kruskal-Wallisand ANOVA test, respectively. Data are expressed as the mean ± standard error of the mean (SEM)unless otherwise stated. Statistical significance was set at p < 0.05.
3. Results
3.1. DHA Increased BV-2 Cells Viability
Usually DHA treatment has been associated with induction of apoptosis or cell death by othermechanisms in many cells [36,37]. However, BV-2 microglia cells treated in vitro with TG-DHA showedan increase in viability, both in basal activity (Figure 1B) and when activated with lipopolysaccharide +IFN-γ (L + I) (Figure 1A,C), with the highest increase at DHA 20 µM (Figure 1B,C), but with similarresults in cells treated with 1, 5, or 10 µM (Figure 1C). These increases, however, were not statisticallysignificant. DHA in the ethyl ester form (EE-DHA) also slightly increased BV-2 microglial cells viabilityin both conditions but to a lesser extent than TG-DHA.

Nutrients 2017, 9, 681 6 of 15Nutrients 2017, 9, 681 6 of 14
Figure 1. Effect of docosahexaenoic acid (DHA) on BV-2 microglial cells viability. (A) Optical microscopy pictures of BV-2 microglia cells cultures activated with L + I and treated with triglyceride (TG)-DHA 20 µM (right) or L + I activated but untreated (center). Controls not activated and untreated are presented in the left picture. BV-2 cells were treated with DHA and then stimulated (C) or not (B) with lipopolysaccharide + Interferon-gamma (L + I) for 24 h. Cell viability was examined by 3-(4,5-dimethyl-2-thiazolyl)-2,5-diphenyl-2H-tetrazolium bromide (MTT) reduction assays and the results were expressed as percentage of surviving cells over untreated control cells (Ctrl). Each value indicates the mean ± standard error of mean (SEM) values obtained in each of the three independent experiments. DHA was added in the triglyceride form (TG-DHA) or in the ethyl ester form (EE-DHA). In spite of the tendencies observed in favor of TG-DHA, differences were not statistically significant.
3.2. DHA Attenuated NO Production and Suppressed Induction of Inflammatory Cytokines in LPS-Stimulated BV-2 Microglia Cells
It has been described that nitric oxide (NO), depending of the concentrations and pathophysiological conditions, is able to regulate cell proliferation, cell cycle arrest, and apoptosis in an opposite way. Thus, at relatively low concentrations NO may induce cell proliferation and anti-apoptotic activity, but at higher concentrations NO seems to activate pathways which induce cell cycle arrest, mitochondria respiration, senescence, or apoptosis [36–38].
At doses from 5 to 20 µM, TG-DHA dramatically reduced NO production of L + I activated BV-2 microglia cells in a concentration-dependent manner (Figure 2A). Interestingly, TG-DHA at 1 µM increased, although not significantly, NO production with respect to controls, suggesting a threshold mechanism.
The effect of TG-DHA in the ability to inhibit NO production was significantly higher as compared with EE-DHA (Figure 2D).
TG-DHA also induced a significant inhibition of the production of inflammation-associated cytokines (TNF-α and IL-6) by L + I-activated BV-2 microglia cells at concentrations ranging from 1 to 20 µM (Figure 2B,C) but differences between TG-DHA and EE-DHA were not observed (Figure 2E). Taking into account the increase of viability of the BV-2 microglia cells observed above (Figure 1), the inhibition of cytokine production should be considered even higher.
Figure 1. Effect of docosahexaenoic acid (DHA) on BV-2 microglial cells viability. (A) Opticalmicroscopy pictures of BV-2 microglia cells cultures activated with L + I and treated with triglyceride(TG)-DHA 20 µM (right) or L + I activated but untreated (center). Controls not activated and untreatedare presented in the left picture. BV-2 cells were treated with DHA and then stimulated (C) or not(B) with lipopolysaccharide + Interferon-gamma (L + I) for 24 h. Cell viability was examined by3-(4,5-dimethyl-2-thiazolyl)-2,5-diphenyl-2H-tetrazolium bromide (MTT) reduction assays and theresults were expressed as percentage of surviving cells over untreated control cells (Ctrl). Each valueindicates the mean ± standard error of mean (SEM) values obtained in each of the three independentexperiments. DHA was added in the triglyceride form (TG-DHA) or in the ethyl ester form (EE-DHA).In spite of the tendencies observed in favor of TG-DHA, differences were not statistically significant.
3.2. DHA Attenuated NO Production and Suppressed Induction of Inflammatory Cytokines in LPS-StimulatedBV-2 Microglia Cells
It has been described that nitric oxide (NO), depending of the concentrations andpathophysiological conditions, is able to regulate cell proliferation, cell cycle arrest, and apoptosisin an opposite way. Thus, at relatively low concentrations NO may induce cell proliferation andanti-apoptotic activity, but at higher concentrations NO seems to activate pathways which induce cellcycle arrest, mitochondria respiration, senescence, or apoptosis [36–38].
At doses from 5 to 20 µM, TG-DHA dramatically reduced NO production of L + I activatedBV-2 microglia cells in a concentration-dependent manner (Figure 2A). Interestingly, TG-DHA at1 µM increased, although not significantly, NO production with respect to controls, suggestinga threshold mechanism.
The effect of TG-DHA in the ability to inhibit NO production was significantly higher as comparedwith EE-DHA (Figure 2D).
TG-DHA also induced a significant inhibition of the production of inflammation-associatedcytokines (TNF-α and IL-6) by L + I-activated BV-2 microglia cells at concentrations ranging from 1 to20 µM (Figure 2B,C) but differences between TG-DHA and EE-DHA were not observed (Figure 2E).Taking into account the increase of viability of the BV-2 microglia cells observed above (Figure 1), theinhibition of cytokine production should be considered even higher.
Nutrients 2017, 9, 681 7 of 15Nutrients 2017, 9, 681 7 of 14
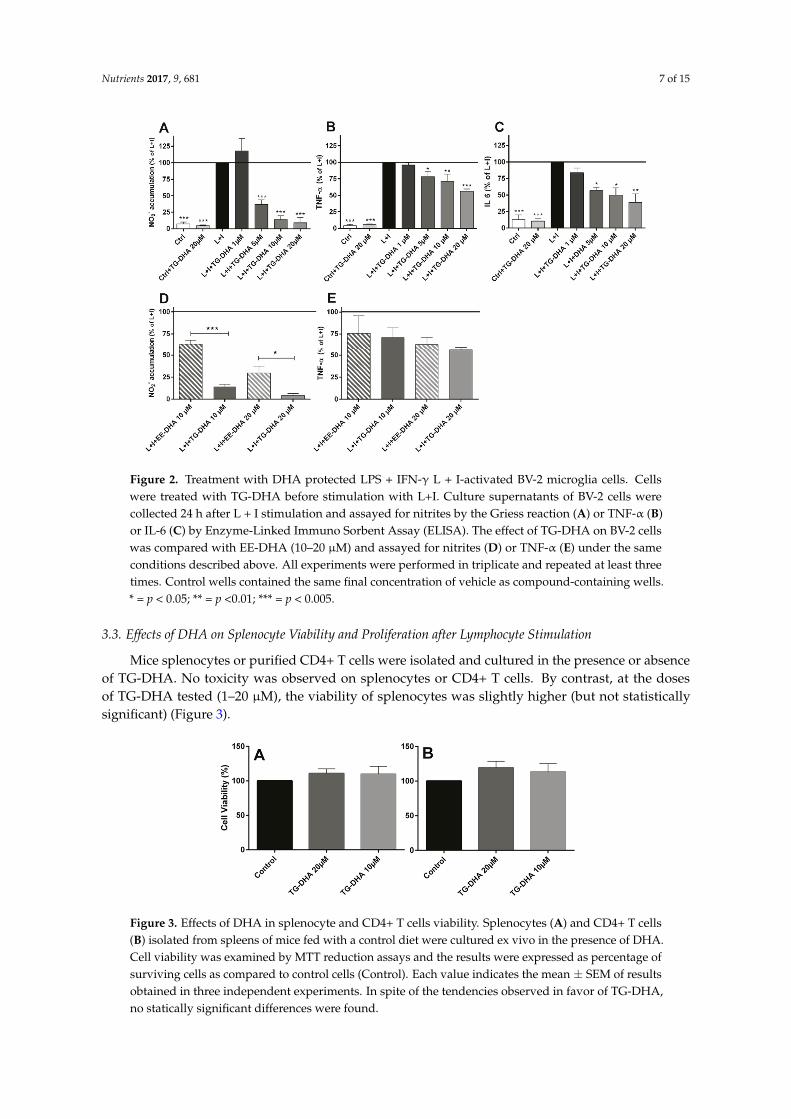
Figure 2. Treatment with DHA protected LPS + IFN-γ L + I-activated BV-2 microglia cells. Cells were treated with TG-DHA before stimulation with L+I. Culture supernatants of BV-2 cells were collected 24 h after L + I stimulation and assayed for nitrites by the Griess reaction (A) or TNF-α (B) or IL-6 (C) by Enzyme-Linked Immuno Sorbent Assay (ELISA). The effect of TG-DHA on BV-2 cells was compared with EE-DHA (10–20 µM) and assayed for nitrites (D) or TNF-α (E) under the same conditions described above. All experiments were performed in triplicate and repeated at least three times. Control wells contained the same final concentration of vehicle as compound-containing wells. * = p < 0.05; ** = p <0.01; *** = p < 0.005.
3.3. Effects of DHA on Splenocyte Viability and Proliferation after Lymphocyte Stimulation
Mice splenocytes or purified CD4+ T cells were isolated and cultured in the presence or absence of TG-DHA. No toxicity was observed on splenocytes or CD4+ T cells. By contrast, at the doses of TG-DHA tested (1–20 µM), the viability of splenocytes was slightly higher (but not statistically significant) (Figure 3).
Figure 3. Effects of DHA in splenocyte and CD4+ T cells viability. Splenocytes (A) and CD4+ T cells (B) isolated from spleens of mice fed with a control diet were cultured ex vivo in the presence of DHA. Cell viability was examined by MTT reduction assays and the results were expressed as percentage of surviving cells as compared to control cells (Control). Each value indicates the mean ±
Figure 2. Treatment with DHA protected LPS + IFN-γ L + I-activated BV-2 microglia cells. Cellswere treated with TG-DHA before stimulation with L+I. Culture supernatants of BV-2 cells werecollected 24 h after L + I stimulation and assayed for nitrites by the Griess reaction (A) or TNF-α (B)or IL-6 (C) by Enzyme-Linked Immuno Sorbent Assay (ELISA). The effect of TG-DHA on BV-2 cellswas compared with EE-DHA (10–20 µM) and assayed for nitrites (D) or TNF-α (E) under the sameconditions described above. All experiments were performed in triplicate and repeated at least threetimes. Control wells contained the same final concentration of vehicle as compound-containing wells.* = p < 0.05; ** = p <0.01; *** = p < 0.005.
3.3. Effects of DHA on Splenocyte Viability and Proliferation after Lymphocyte Stimulation
Mice splenocytes or purified CD4+ T cells were isolated and cultured in the presence or absenceof TG-DHA. No toxicity was observed on splenocytes or CD4+ T cells. By contrast, at the dosesof TG-DHA tested (1–20 µM), the viability of splenocytes was slightly higher (but not statisticallysignificant) (Figure 3).
Nutrients 2017, 9, 681 7 of 14
Figure 2. Treatment with DHA protected LPS + IFN-γ L + I-activated BV-2 microglia cells. Cells were treated with TG-DHA before stimulation with L+I. Culture supernatants of BV-2 cells were collected 24 h after L + I stimulation and assayed for nitrites by the Griess reaction (A) or TNF-α (B) or IL-6 (C) by Enzyme-Linked Immuno Sorbent Assay (ELISA). The effect of TG-DHA on BV-2 cells was compared with EE-DHA (10–20 µM) and assayed for nitrites (D) or TNF-α (E) under the same conditions described above. All experiments were performed in triplicate and repeated at least three times. Control wells contained the same final concentration of vehicle as compound-containing wells. * = p < 0.05; ** = p <0.01; *** = p < 0.005.
3.3. Effects of DHA on Splenocyte Viability and Proliferation after Lymphocyte Stimulation
Mice splenocytes or purified CD4+ T cells were isolated and cultured in the presence or absence of TG-DHA. No toxicity was observed on splenocytes or CD4+ T cells. By contrast, at the doses of TG-DHA tested (1–20 µM), the viability of splenocytes was slightly higher (but not statistically significant) (Figure 3).
Figure 3. Effects of DHA in splenocyte and CD4+ T cells viability. Splenocytes (A) and CD4+ T cells (B) isolated from spleens of mice fed with a control diet were cultured ex vivo in the presence of DHA. Cell viability was examined by MTT reduction assays and the results were expressed as percentage of surviving cells as compared to control cells (Control). Each value indicates the mean ±
Figure 3. Effects of DHA in splenocyte and CD4+ T cells viability. Splenocytes (A) and CD4+ T cells(B) isolated from spleens of mice fed with a control diet were cultured ex vivo in the presence of DHA.Cell viability was examined by MTT reduction assays and the results were expressed as percentage ofsurviving cells as compared to control cells (Control). Each value indicates the mean ± SEM of resultsobtained in three independent experiments. In spite of the tendencies observed in favor of TG-DHA,no statically significant differences were found.
Nutrients 2017, 9, 681 8 of 15
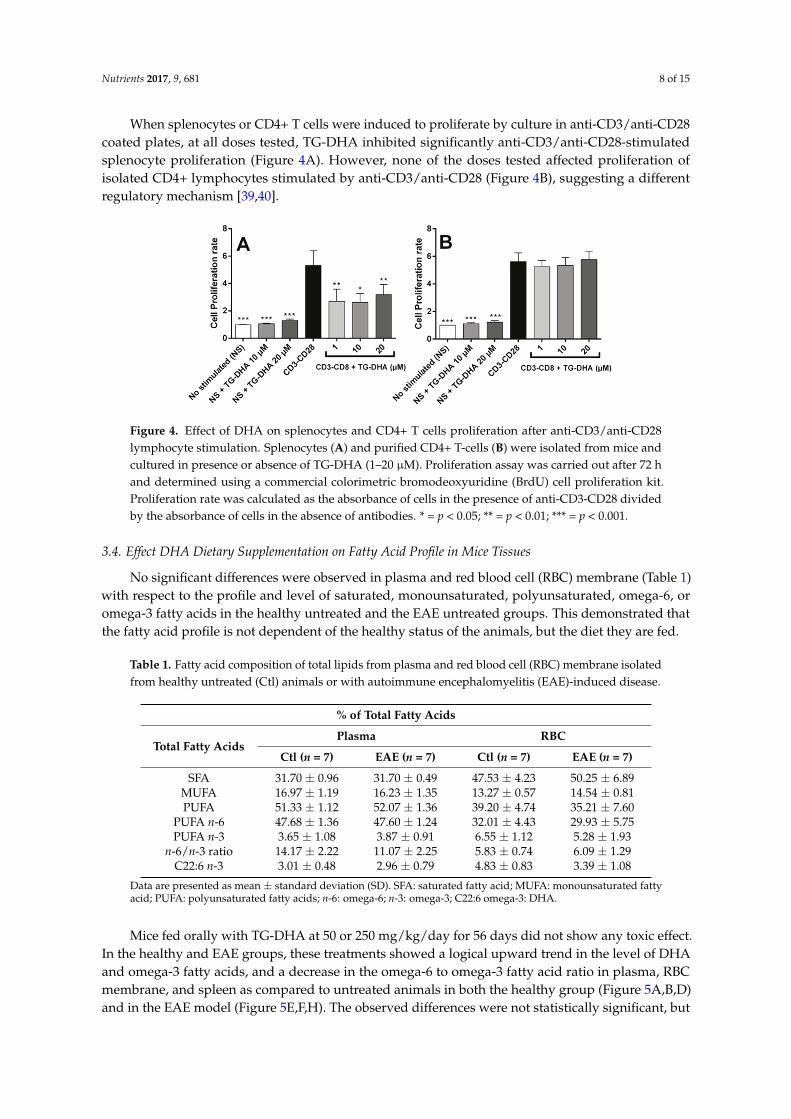
When splenocytes or CD4+ T cells were induced to proliferate by culture in anti-CD3/anti-CD28coated plates, at all doses tested, TG-DHA inhibited significantly anti-CD3/anti-CD28-stimulatedsplenocyte proliferation (Figure 4A). However, none of the doses tested affected proliferation ofisolated CD4+ lymphocytes stimulated by anti-CD3/anti-CD28 (Figure 4B), suggesting a differentregulatory mechanism [39,40].
Nutrients 2017, 9, 681 8 of 14
SEM of results obtained in three independent experiments. In spite of the tendencies observed in favor of TG-DHA, no statically significant differences were found.
When splenocytes or CD4+ T cells were induced to proliferate by culture in anti-CD3/anti-CD28 coated plates, at all doses tested, TG-DHA inhibited significantly anti-CD3/anti-CD28-stimulated splenocyte proliferation (Figure 4A). However, none of the doses tested affected proliferation of isolated CD4+ lymphocytes stimulated by anti-CD3/anti-CD28 (Figure 4B), suggesting a different regulatory mechanism [39,40].
Figure 4. Effect of DHA on splenocytes and CD4+ T cells proliferation after anti-CD3/anti-CD28 lymphocyte stimulation. Splenocytes (A) and purified CD4+ T-cells (B) were isolated from mice and cultured in presence or absence of TG-DHA (1–20 µM). Proliferation assay was carried out after 72 h and determined using a commercial colorimetric bromodeoxyuridine (BrdU) cell proliferation kit. Proliferation rate was calculated as the absorbance of cells in the presence of anti-CD3-CD28 divided by the absorbance of cells in the absence of antibodies. * = p < 0.05; ** = p < 0.01; *** = p < 0.001.
3.4. Effect DHA Dietary Supplementation on Fatty Acid Profile in Mice Tissues
No significant differences were observed in plasma and red blood cell (RBC) membrane (Table 1) with respect to the profile and level of saturated, monounsaturated, polyunsaturated, omega-6, or omega-3 fatty acids in the healthy untreated and the EAE untreated groups. This demonstrated that the fatty acid profile is not dependent of the healthy status of the animals, but the diet they are fed.
Table 1. Fatty acid composition of total lipids from plasma and red blood cell (RBC) membrane isolated from healthy untreated (Ctl) animals or with autoimmune encephalomyelitis (EAE)-induced disease.
% of Total Fatty Acids
Total Fatty Acids Plasma RBC
Ctl (n = 7) EAE (n = 7) Ctl (n = 7) EAE (n = 7)SFA 31.70 ± 0.96 31.70 ± 0.49 47.53 ± 4.23 50.25 ± 6.89
MUFA 16.97 ± 1.19 16.23 ± 1.35 13.27 ± 0.57 14.54 ± 0.81 PUFA 51.33 ± 1.12 52.07 ± 1.36 39.20 ± 4.74 35.21 ± 7.60
PUFA n-6 47.68 ± 1.36 47.60 ± 1.24 32.01 ± 4.43 29.93 ± 5.75 PUFA n-3 3.65 ± 1.08 3.87 ± 0.91 6.55 ± 1.12 5.28 ± 1.93
n-6/n-3 ratio 14.17 ± 2.22 11.07 ± 2.25 5.83 ± 0.74 6.09 ± 1.29 C22:6 n-3 3.01 ± 0.48 2.96 ± 0.79 4.83 ± 0.83 3.39 ± 1.08
Data are presented as mean ± standard deviation (SD). SFA: saturated fatty acid; MUFA: monounsaturated fatty acid; PUFA: polyunsaturated fatty acids; n-6: omega-6; n-3: omega-3; C22:6 omega-3: DHA.
Figure 4. Effect of DHA on splenocytes and CD4+ T cells proliferation after anti-CD3/anti-CD28lymphocyte stimulation. Splenocytes (A) and purified CD4+ T-cells (B) were isolated from mice andcultured in presence or absence of TG-DHA (1–20 µM). Proliferation assay was carried out after 72 hand determined using a commercial colorimetric bromodeoxyuridine (BrdU) cell proliferation kit.Proliferation rate was calculated as the absorbance of cells in the presence of anti-CD3-CD28 dividedby the absorbance of cells in the absence of antibodies. * = p < 0.05; ** = p < 0.01; *** = p < 0.001.
3.4. Effect DHA Dietary Supplementation on Fatty Acid Profile in Mice Tissues
No significant differences were observed in plasma and red blood cell (RBC) membrane (Table 1)with respect to the profile and level of saturated, monounsaturated, polyunsaturated, omega-6, oromega-3 fatty acids in the healthy untreated and the EAE untreated groups. This demonstrated thatthe fatty acid profile is not dependent of the healthy status of the animals, but the diet they are fed.
Table 1. Fatty acid composition of total lipids from plasma and red blood cell (RBC) membrane isolatedfrom healthy untreated (Ctl) animals or with autoimmune encephalomyelitis (EAE)-induced disease.
% of Total Fatty Acids
Total Fatty AcidsPlasma RBC
Ctl (n = 7) EAE (n = 7) Ctl (n = 7) EAE (n = 7)
SFA 31.70 ± 0.96 31.70 ± 0.49 47.53 ± 4.23 50.25 ± 6.89MUFA 16.97 ± 1.19 16.23 ± 1.35 13.27 ± 0.57 14.54 ± 0.81PUFA 51.33 ± 1.12 52.07 ± 1.36 39.20 ± 4.74 35.21 ± 7.60
PUFA n-6 47.68 ± 1.36 47.60 ± 1.24 32.01 ± 4.43 29.93 ± 5.75PUFA n-3 3.65 ± 1.08 3.87 ± 0.91 6.55 ± 1.12 5.28 ± 1.93
n-6/n-3 ratio 14.17 ± 2.22 11.07 ± 2.25 5.83 ± 0.74 6.09 ± 1.29C22:6 n-3 3.01 ± 0.48 2.96 ± 0.79 4.83 ± 0.83 3.39 ± 1.08
Data are presented as mean ± standard deviation (SD). SFA: saturated fatty acid; MUFA: monounsaturated fattyacid; PUFA: polyunsaturated fatty acids; n-6: omega-6; n-3: omega-3; C22:6 omega-3: DHA.
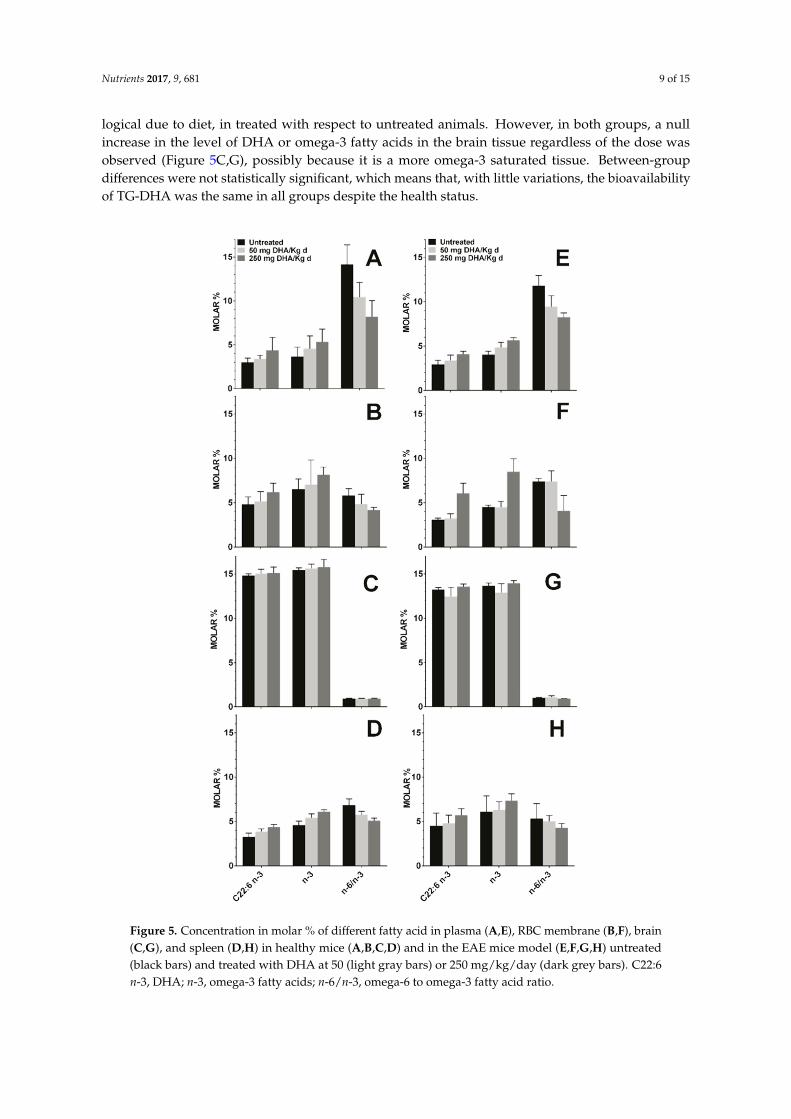
Mice fed orally with TG-DHA at 50 or 250 mg/kg/day for 56 days did not show any toxic effect.In the healthy and EAE groups, these treatments showed a logical upward trend in the level of DHAand omega-3 fatty acids, and a decrease in the omega-6 to omega-3 fatty acid ratio in plasma, RBCmembrane, and spleen as compared to untreated animals in both the healthy group (Figure 5A,B,D)and in the EAE model (Figure 5E,F,H). The observed differences were not statistically significant, but
Nutrients 2017, 9, 681 9 of 15
logical due to diet, in treated with respect to untreated animals. However, in both groups, a nullincrease in the level of DHA or omega-3 fatty acids in the brain tissue regardless of the dose wasobserved (Figure 5C,G), possibly because it is a more omega-3 saturated tissue. Between-groupdifferences were not statistically significant, which means that, with little variations, the bioavailabilityof TG-DHA was the same in all groups despite the health status.
Nutrients 2017, 9, 681 9 of 14
Mice fed orally with TG-DHA at 50 or 250 mg/kg/day for 56 days did not show any toxic effect. In the healthy and EAE groups, these treatments showed a logical upward trend in the level of DHA and omega-3 fatty acids, and a decrease in the omega-6 to omega-3 fatty acid ratio in plasma, RBC membrane, and spleen as compared to untreated animals in both the healthy group (Figure 5A,B,D) and in the EAE model (Figure 5E,F,H). The observed differences were not statistically significant, but logical due to diet, in treated with respect to untreated animals. However, in both groups, a null increase in the level of DHA or omega-3 fatty acids in the brain tissue regardless of the dose was observed (Figure 5C,G), possibly because it is a more omega-3 saturated tissue. Between-group differences were not statistically significant, which means that, with little variations, the bioavailability of TG-DHA was the same in all groups despite the health status.
Figure 5. Concentration in molar % of different fatty acid in plasma (A,E), RBC membrane (B,F), brain (C,G), and spleen (D,H) in healthy mice (A,B,C,D) and in the EAE mice model (E,F,G,H)
Figure 5. Concentration in molar % of different fatty acid in plasma (A,E), RBC membrane (B,F), brain(C,G), and spleen (D,H) in healthy mice (A,B,C,D) and in the EAE mice model (E,F,G,H) untreated(black bars) and treated with DHA at 50 (light gray bars) or 250 mg/kg/day (dark grey bars). C22:6n-3, DHA; n-3, omega-3 fatty acids; n-6/n-3, omega-6 to omega-3 fatty acid ratio.
Nutrients 2017, 9, 681 10 of 15
3.5. Dietary DHA Showed a Beneficial Effect on EAE Clinical Course
To assess the effects of essential fatty acids on the clinical course of the EAE mice model, animalswere treated with oral TG-DHA 50 or 250 mg/kg/day (n = 10 for each group) during 15 daysbefore induction of encephalomyelitis and over the next 41 days (total days of treatment 56). TheEAE-untreated group were animals without TG-DHA treatment. EAE disease severity scoring andweight measurement were performed daily.
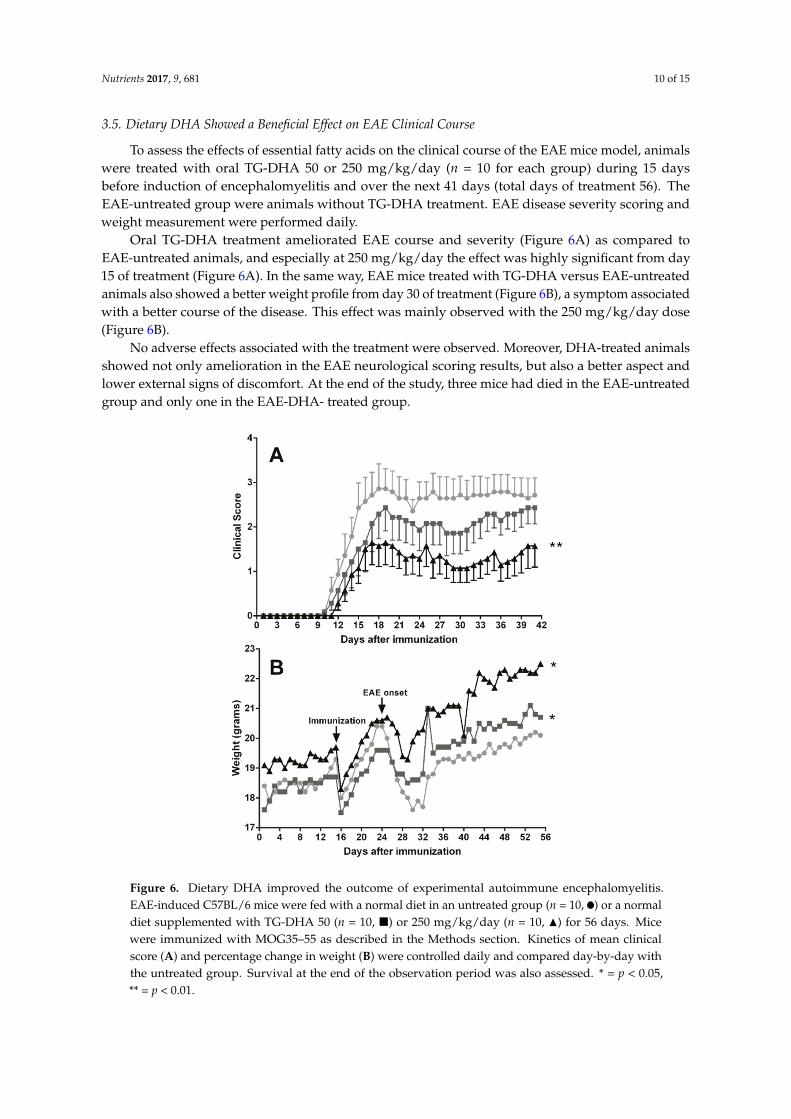
Oral TG-DHA treatment ameliorated EAE course and severity (Figure 6A) as compared toEAE-untreated animals, and especially at 250 mg/kg/day the effect was highly significant from day15 of treatment (Figure 6A). In the same way, EAE mice treated with TG-DHA versus EAE-untreatedanimals also showed a better weight profile from day 30 of treatment (Figure 6B), a symptom associatedwith a better course of the disease. This effect was mainly observed with the 250 mg/kg/day dose(Figure 6B).
No adverse effects associated with the treatment were observed. Moreover, DHA-treated animalsshowed not only amelioration in the EAE neurological scoring results, but also a better aspect andlower external signs of discomfort. At the end of the study, three mice had died in the EAE-untreatedgroup and only one in the EAE-DHA- treated group.
Nutrients 2017, 9, 681 10 of 14
untreated (black bars) and treated with DHA at 50 (light gray bars) or 250 mg/kg/day (dark grey bars). C22:6 n-3, DHA; n-3, omega-3 fatty acids; n-6/n-3, omega-6 to omega-3 fatty acid ratio.
3.5. Dietary DHA Showed a Beneficial Effect on EAE Clinical Course
To assess the effects of essential fatty acids on the clinical course of the EAE mice model, animals were treated with oral TG-DHA 50 or 250 mg/kg/day (n = 10 for each group) during 15 days before induction of encephalomyelitis and over the next 41 days (total days of treatment 56). The EAE-untreated group were animals without TG-DHA treatment. EAE disease severity scoring and weight measurement were performed daily.
Oral TG-DHA treatment ameliorated EAE course and severity (Figure 6A) as compared to EAE-untreated animals, and especially at 250 mg/kg/day the effect was highly significant from day 15 of treatment (Figure 6A). In the same way, EAE mice treated with TG-DHA versus EAE-untreated animals also showed a better weight profile from day 30 of treatment (Figure 6B), a symptom associated with a better course of the disease. This effect was mainly observed with the 250 mg/kg/day dose (Figure 6B).
No adverse effects associated with the treatment were observed. Moreover, DHA-treated animals showed not only amelioration in the EAE neurological scoring results, but also a better aspect and lower external signs of discomfort. At the end of the study, three mice had died in the EAE-untreated group and only one in the EAE-DHA- treated group.
Figure 6. Dietary DHA improved the outcome of experimental autoimmune encephalomyelitis. EAE-induced C57BL/6 mice were fed with a normal diet in an untreated group (n = 10, ●) or a normal diet supplemented with TG-DHA 50 (n = 10, ■) or 250 mg/kg/day (n = 10, ▲) for 56 days. Mice were immunized with MOG35–55 as described in the Methods section. Kinetics of mean clinical score (A) and percentage change in weight (B) were controlled daily and compared day-by-day with the untreated group. Survival at the end of the observation period was also assessed. * = p < 0.05, ** = p < 0.01.
Figure 6. Dietary DHA improved the outcome of experimental autoimmune encephalomyelitis.EAE-induced C57BL/6 mice were fed with a normal diet in an untreated group (n = 10, ) or a normaldiet supplemented with TG-DHA 50 (n = 10, �) or 250 mg/kg/day (n = 10, N) for 56 days. Micewere immunized with MOG35–55 as described in the Methods section. Kinetics of mean clinicalscore (A) and percentage change in weight (B) were controlled daily and compared day-by-day withthe untreated group. Survival at the end of the observation period was also assessed. * = p < 0.05,** = p < 0.01.
Nutrients 2017, 9, 681 11 of 15
4. Discussion
Neuroinflammatory processes due to a variety of causes ranging from infectious diseasesto chemical toxicity injuries are the underlying pathophysiological mechanism of manyneurodegenerative disorders in which microglia cells play an important role. In this study, thetriglyceride of omega-3 polyunsaturated fatty acid docosahexaenoic acid (TG-DHA) has been assayedin vitro and in vivo as compared to the DHA ethyl ester form, to determine its capacity to protectcells from oxidative stress injury and inflammatory cytokine damage activity. The beneficial effects ofTG-DHA have also been studied in a mice model of EAE.
The role of omega-3 polyunsaturated fatty acid (n-3 PUFA) in different cellular systems is stillcontroversial, ranging from death induction by means of oxidative stress products [36,37,41] toprotective activity increasing survival and anti-oxidative stress [42–46]. However, the anti-inflammatoryactivity of omega-3 PUFA and especially of DHA has been reported for a long time as a general behaviorin dendritic [26,30,47–49] and microglia cells [11,27–29]. Moreover, treatment with DHA has beenreported to ameliorate neurodegenerative diseases involving neuroinflammation [30,31], includingEAE [3]. In the present study, we demonstrated that with respect to EE-DHA, TG-DHA treatment showsan increased protection on BV-2 microglia cells activated with LPS and IFN-γ from toxicity, increasingviability, attenuating NO production, and suppressing the induction of pro-inflammatory cytokines(Figures 1 and 2). This behavior could be related to the better bioavailability of the TG-DHA comparedto EE-DHA [32,33].
TG-DHA significantly inhibited mice splenocyte proliferation but did not affect proliferation ofisolated CD4+ lymphocytes cultured in anti-CD3/anti-CD28 coated plates (Figure 4). This fact suggeststhe possibility of an indirect mechanism in which the anti-proliferative effects of TG-DHA could beassociated with a modulation of the monocyte-dendritic cell antigen presentation activity, as observedpreviously [26]. However, T-cell inhibition has been confirmed by other authors [39,40], suggesting thatanti-proliferative effects of TG-DHA are probably associated with a macrophage/monocyte modulationinstead of a direct activity on lymphocytic immunomodulation. Although molecular mechanisms arenot exclusive of the myeloid cells and omega-3 fatty acids could inhibit T-lymphocytes through severalmechanisms (like PPARγ upregulation and activation which induce Treg proliferation) [25,50,51],at the conditions of the present assay, there probably was not enough time to develop regulatory T-cellsto induce CD4+ T-cell inhibition (Figure 4B).
No differences in the profile and level of fatty acids from plasma and RBC membranes of healthyanimals were observed in comparison with those from the mouse EAE model (Table 1). When micewere fed with a supplement of 50 to 250 mg/kg/day of TG-DHA, a slightly but upward trend of thelevel of DHA and the omega-3 in the peripheral tissues (plasma, RBC, and spleen) was observed ina dose-dependent manner, both in healthy animals and in those with a EAE (Figure 5). However, nochanges or almost undetectable changes were observed in the CNS tissues (Figure 5).
In a mouse model of EAE, when comparing untreated animals with high and low doses ofTG-DHA treatment, it was observed that high doses significantly ameliorated the clinical course andseverity of disease in a dose and time dependent manner (Figure 6), in relation to both the EAE clinicalscore and weight profile (a symptom associated with a better course of the disease). Our results withTG-DHA confirm and improve previous results from Kong W. et al. [3], demonstrating that TG-DHAwith a DHA high content (>70% of total fatty acids) is a more effective treatment and improvesthe outcome and disease evolution in the mouse model of EAE. Our data suggest that prophylacticadministration of TG-DHA confers significant protection against the development of EAE at clinicaland molecular levels.
Among the strengths of this study were the approach of the problem with the types of cellsinvolved in the neuroinflammation processes and their phenotypic and functional changes, thecomparative study of different doses of DHA in its different chemical forms and with a highcontent in DHA, the strict control of the animals involved in the study, and the assessment of thevariations in the composition of the content of fatty acids in cell membranes and plasma. However,

Nutrients 2017, 9, 681 12 of 15
some limitations in this work remain. Further, there is a paucity of studies on the mechanismsof DHA on neuroinflammation pathways in vivo. It is hypothesized that omega-3 PUFA areanti-inflammatory via their enzymatically-derived metabolites, however, comprehensive lipidomicsprofiling during neuroinflammation has not been reported yet and the pathways that they mediateshould be investigated. Nevertheless, the results presented here advance our understanding of theanti-inflammatory effect of DHA in EAE, and further studies should be conducted to address theconcerns raised.
5. Conclusions
We conclude that DHA, a natural product that can be taken as a dietary supplement, showedno toxic effects on microglial cells in the in vitro studies as well as the in vivo studies of mice treatedwith high DHA doses for a long period of time. In the supplement used in this study, DHA waspresent in the form of triglycerides, nutrients naturally recognized by the body, to guarantee highdigestibility and intestinal absorption. Furthermore, TG-DHA modulates the in vitro activity ofmicroglia cells and T-cells, suggesting a neuronal cell protection from cytotoxic insults. In the EAEmouse model, treatment with TG-DHA had a beneficial effect on the clinical course and severity ofautoimmune encephalomyelitis. The beneficial and protective effects of TG-DHA are mediated, atleast in part, through oxidant effects and by modulating the autoimmune responses within the CNSas well as at the systemic level. According to these results, TG-DHA may be a promising nutritionalimmunomodulating agent in neuroinflammatory processes, suggesting potential favorable effects inhuman neurodegenerative disorders.
Acknowledgments: This project was supported by the Spanish Ministerio de Economía y Competitividadunder the National Program for Public-Private Cooperation (Subprogramme Innpacto). We like to thank BrudyTechnology SL (Spain) who provided the TG-DHA oil and the funds for covering the costs to publish in openaccess. The authors thank Marta Pulido for editing the manuscript.
Author Contributions: J.C. Domingo and J.F. Espinosa-Parrilla conceived and designed the experiments;P. Mancera, B. Wappenhans, B. Cordobilla, N. Virgili, and M. Pugliese performed the experiments; J.C. Domingo,J.F. Espinosa-Parrilla, and F. Rueda analyzed the data; F. Rueda wrote the paper.
Conflicts of Interest: The authors declare that they have no conflicts of interest. The funding sources had noinvolvement in study design; in the collection, analysis and interpretation of data; in the writing of the report;and in the decision to submit the article for publication.
References
1. Streit, W.J.; Mrak, R.E.; Griffin, W.S. Microglia and neuroinflammation: A pathological perspective.J. Neuroinflamm. 2004, 1, 14. [CrossRef] [PubMed]
2. Matyszak, M.K.; Denis-Donini, S.; Citterio, S.; Longhi, R.; Granucci, F.; Ricciardi-Castagnoli, P. Microgliainduce myelin basic protein-specific t cell anergy or t cell activation, according to their state of activation.Eur. J. Immunol. 1999, 29, 3063–3076. [CrossRef]
3. Kong, W.; Yen, J.H.; Ganea, D. Docosahexaenoic acid prevents dendritic cell maturation, inhibitsantigen-specific th1/th17 differentiation and suppresses experimental autoimmune encephalomyelitis.Brain Behav. Immun. 2011, 25, 872–882. [CrossRef] [PubMed]
4. Aloisi, F. Immune function of microglia. Glia 2001, 36, 165–179. [CrossRef] [PubMed]5. Graeber, M.B.; Li, W.; Rodriguez, M.L. Role of microglia in cns inflammation. FEBS Lett. 2011, 585, 3798–3805.
[CrossRef] [PubMed]6. Calvo, A.C.; Manzano, R.; Atencia-Cibreiro, G.; Olivan, S.; Munoz, M.J.; Zaragoza, P.; Cordero-Vazquez, P.;
Esteban-Perez, J.; Garcia-Redondo, A.; Osta, R. Genetic biomarkers for als disease in transgenic sod1(g93a)mice. PLoS ONE 2012, 7, e32632. [CrossRef] [PubMed]
7. Sanagi, T.; Yuasa, S.; Nakamura, Y.; Suzuki, E.; Aoki, M.; Warita, H.; Itoyama, Y.; Uchino, S.; Kohsaka, S.;Ohsawa, K. Appearance of phagocytic microglia adjacent to motoneurons in spinal cord tissue froma presymptomatic transgenic rat model of amyotrophic lateral sclerosis. J. Neurosci. Res. 2010, 88, 2736–2746.[CrossRef] [PubMed]

Nutrients 2017, 9, 681 13 of 15
8. Sherer, T.B.; Betarbet, R.; Kim, J.H.; Greenamyre, J.T. Selective microglial activation in the rat rotenone modelof parkinson’s disease. Neurosci. Lett. 2003, 341, 87–90. [CrossRef]
9. Tada, S.; Okuno, T.; Yasui, T.; Nakatsuji, Y.; Sugimoto, T.; Kikutani, H.; Sakoda, S. Deleterious effects oflymphocytes at the early stage of neurodegeneration in an animal model of amyotrophic lateral sclerosis.J. Neuroinflamm. 2011, 8, 19. [CrossRef] [PubMed]
10. Turner, B.J.; Talbot, K. Transgenics, toxicity and therapeutics in rodent models of mutant sod1-mediatedfamilial als. Prog. Neurobiol. 2008, 85, 94–134. [CrossRef] [PubMed]
11. Lu, D.Y.; Tsao, Y.Y.; Leung, Y.M.; Su, K.P. Docosahexaenoic acid suppresses neuroinflammatory responsesand induces heme oxygenase-1 expression in bv-2 microglia: Implications of antidepressant effects foromega-3 fatty acids. Neuropsychopharmacology 2010, 35, 2238–2248. [CrossRef] [PubMed]
12. McCarthy, D.P.; Richards, M.H.; Miller, S.D. Mouse models of multiple sclerosis: Experimental autoimmuneencephalomyelitis and theiler’s virus-induced demyelinating disease. Methods Mol. Biol. 2012, 900, 381–401.[PubMed]
13. Kroenke, M.A.; Carlson, T.J.; Andjelkovic, A.V.; Segal, B.M. Il-12- and il-23-modulated t cells induce distincttypes of eae based on histology, cns chemokine profile, and response to cytokine inhibition. J. Exp. Med.2008, 205, 1535–1541. [CrossRef] [PubMed]
14. Lees, J.R.; Golumbek, P.T.; Sim, J.; Dorsey, D.; Russell, J.H. Regional cns responses to ifn-gamma determinelesion localization patterns during eae pathogenesis. J. Exp. Med. 2008, 205, 2633–2642. [CrossRef] [PubMed]
15. Swanborg, R.H. Experimental autoimmune encephalomyelitis in rodents as a model for humandemyelinating disease. Clin. Immunol. Immunopathol. 1995, 77, 4–13. [CrossRef]
16. Yednock, T.A.; Cannon, C.; Fritz, L.C.; Sanchez-Madrid, F.; Steinman, L.; Karin, N. Prevention of experimentalautoimmune encephalomyelitis by antibodies against alpha 4 beta 1 integrin. Nature 1992, 356, 63–66.[CrossRef] [PubMed]
17. Kawakami, N.; Lassmann, S.; Li, Z.; Odoardi, F.; Ritter, T.; Ziemssen, T.; Klinkert, W.E.; Ellwart, J.W.; Bradl, M.;Krivacic, K.; et al. The activation status of neuroantigen-specific t cells in the target organ determines theclinical outcome of autoimmune encephalomyelitis. J. Exp. Med. 2004, 199, 185–197. [CrossRef] [PubMed]
18. Glass, C.K.; Saijo, K.; Winner, B.; Marchetto, M.C.; Gage, F.H. Mechanisms underlying inflammation inneurodegeneration. Cell 2010, 140, 918–934. [CrossRef] [PubMed]
19. Lull, M.E.; Block, M.L. Microglial activation and chronic neurodegeneration. Neurotherapeutics 2010, 7,354–365. [CrossRef] [PubMed]
20. Cartier, N.; Lewis, C.A.; Zhang, R.; Rossi, F.M. The role of microglia in human disease: Therapeutic tool ortarget? Acta Neuropathol. 2014, 128, 363–380. [CrossRef] [PubMed]
21. Tang, Y.; Le, W. Differential roles of m1 and m2 microglia in neurodegenerative diseases. Mol. Neurobiol.2016, 53, 1181–1194. [CrossRef] [PubMed]
22. Suzumura, A. Neuron-microglia interaction in neuroinflammation. Curr. Protein Pept. Sci. 2013, 14, 16–20.[CrossRef] [PubMed]
23. Storer, P.D.; Xu, J.; Chavis, J.; Drew, P.D. Peroxisome proliferator-activated receptor-gamma agonists inhibitthe activation of microglia and astrocytes: Implications for multiple sclerosis. J. Neuroimmunol. 2005, 161,113–122. [CrossRef] [PubMed]
24. Kiaei, M. Peroxisome proliferator-activated receptor-gamma in amyotrophic lateral sclerosis andhuntington’s disease. PPAR Res. 2008, 2008, 418765. [CrossRef] [PubMed]
25. Kiaei, M.; Kipiani, K.; Chen, J.; Calingasan, N.Y.; Beal, M.F. Peroxisome proliferator-activated receptor-gammaagonist extends survival in transgenic mouse model of amyotrophic lateral sclerosis. Exp. Neurol. 2005, 191,331–336. [CrossRef] [PubMed]
26. Zapata-Gonzalez, F.; Rueda, F.; Petriz, J.; Domingo, P.; Villarroya, F.; Diaz-Delfin, J.; de Madariaga, M.A.;Domingo, J.C. Human dendritic cell activities are modulated by the omega-3 fatty acid, docosahexaenoicacid, mainly through ppar(gamma): Rxr heterodimers: Comparison with other polyunsaturated fatty acids.J. Leukoc. Biol. 2008, 84, 1172–1182. [CrossRef] [PubMed]
27. Pettit, L.K.; Varsanyi, C.; Tadros, J.; Vassiliou, E. Modulating the inflammatory properties of activatedmicroglia with docosahexaenoic acid and aspirin. Lipids Health Dis. 2013, 12, 16. [CrossRef] [PubMed]
28. Ajmone-Cat, M.A.; Salvatori, M.I.; De Simone, R.; Mancini, M.; Biagioni, S.; Bernardo, A.; Cacci, E.;Minghetti, L. Docosahexaenoic acid modulates inflammatory and antineurogenic functions of activatedmicroglial cells. J. Neurosci. Res. 2012, 90, 575–587. [CrossRef] [PubMed]

Nutrients 2017, 9, 681 14 of 15
29. Corsi, L.; Dongmo, B.M.; Avallone, R. Supplementation of omega 3 fatty acids improves oxidative stress inactivated bv2 microglial cell line. Int. J. Food Sci. Nutr. 2015, 66, 293–299. [CrossRef] [PubMed]
30. Bazan, N.G.; Molina, M.F.; Gordon, W.C. Docosahexaenoic acid signalolipidomics in nutrition: Significancein aging, neuroinflammation, macular degeneration, alzheimer’s, and other neurodegenerative diseases.Annu. Rev. Nutr. 2011, 31, 321–351. [CrossRef] [PubMed]
31. Orr, S.K.; Trepanier, M.O.; Bazinet, R.P. N-3 polyunsaturated fatty acids in animal models withneuroinflammation. Prostaglandins Leukot. Essent. Fat. Acids 2013, 88, 97–103. [CrossRef] [PubMed]
32. Kohler, A.; Sarkkinen, E.; Tapola, N.; Niskanen, T.; Bruheim, I. Bioavailability of fatty acids from krill oil,krill meal and fish oil in healthy subjects-a randomized, single-dose, cross-over trial. Lipids Health Dis. 2015,14, 19. [CrossRef] [PubMed]
33. Dyerberg, J.; Madsen, P.; Moller, J.M.; Aardestrup, I.; Schmidt, E.B. Bioavailability of marine n-3 fatty acidformulations. Prostaglandins Leukot. Essent. Fat. Acids 2010, 83, 137–141. [CrossRef] [PubMed]
34. Virgili, N.; Espinosa-Parrilla, J.F.; Mancera, P.; Pasten-Zamorano, A.; Gimeno-Bayon, J.; Rodriguez, M.J.;Mahy, N.; Pugliese, M. Oral administration of the katp channel opener diazoxide ameliorates diseaseprogression in a murine model of multiple sclerosis. J. Neuroinflamm. 2011, 8, 149. [CrossRef] [PubMed]
35. Lien, E.L. Toxicology and safety of dha. Prostaglandins Leukot. Essent. Fat. Acids 2009, 81, 125–132. [CrossRef][PubMed]
36. Fasano, E.; Serini, S.; Piccioni, E.; Toesca, A.; Monego, G.; Cittadini, A.R.; Ranelletti, F.O.; Calviello, G.DHA induces apoptosis by altering the expression and cellular location of grp78 in colon cancer cell lines.Biochim. Biophys. Acta 2012, 1822, 1762–1772. [CrossRef] [PubMed]
37. Fyfe, D.J.; Abbey, M. Effects of n-3 fatty acids on growth and survival of j774 macrophages. ProstaglandinsLeukot. Essent. Fat. Acids 2000, 62, 201–207. [CrossRef] [PubMed]
38. Napoli, C.; Paolisso, G.; Casamassimi, A.; Al-Omran, M.; Barbieri, M.; Sommese, L.; Infante, T.; Ignarro, L.J.Effects of nitric oxide on cell proliferation: Novel insights. J. Am. Coll. Cardiol. 2013, 62, 89–95. [CrossRef][PubMed]
39. Arrington, J.L.; Chapkin, R.S.; Switzer, K.C.; Morris, J.S.; McMurray, D.N. Dietary n-3 polyunsaturated fattyacids modulate purified murine t-cell subset activation. Clin. Exp. Immunol. 2001, 125, 499–507. [CrossRef][PubMed]
40. Manzoni Jacintho, T.; Gotho, H.; Gidlund, M.; Garcia Marques, C.; Torrinhas, R.; Mirtes Sales, M.; LinetzkyWaitzberg, D. Anti-inflammatory effect of parenteral fish oil lipid emulsion on human activated mononuclearleukocytes. Nutr. Hosp. 2009, 24, 288–296. [PubMed]
41. Schley, P.D.; Jijon, H.B.; Robinson, L.E.; Field, C.J. Mechanisms of omega-3 fatty acid-induced growthinhibition in mda-mb-231 human breast cancer cells. Breast Cancer Res. Treat. 2005, 92, 187–195. [CrossRef][PubMed]
42. Crupi, R.; Marino, A.; Cuzzocrea, S. N-3 fatty acids: Role in neurogenesis and neuroplasticity. Curr. Med.Chem. 2013, 20, 2953–2963. [CrossRef] [PubMed]
43. Kusunoki, C.; Yang, L.; Yoshizaki, T.; Nakagawa, F.; Ishikado, A.; Kondo, M.; Morino, K.; Sekine, O.; Ugi, S.;Nishio, Y.; et al. Omega-3 polyunsaturated fatty acid has an anti-oxidant effect via the nrf-2/ho-1 pathwayin 3t3-l1 adipocytes. Biochem. Biophys. Res. Commun. 2013, 430, 225–230. [CrossRef] [PubMed]
44. Lee, L.K.; Shahar, S.; Rajab, N.; Yusoff, N.A.; Jamal, R.A.; Then, S.M. The role of long chain omega-3polyunsaturated fatty acids in reducing lipid peroxidation among elderly patients with mild cognitiveimpairment: A case-control study. J. Nutr. Biochem. 2013, 24, 803–808. [CrossRef] [PubMed]
45. Liu, S.H.; Chang, C.D.; Chen, P.H.; Su, J.R.; Chen, C.C.; Chaung, H.C. Docosahexaenoic acid andphosphatidylserine supplementations improve antioxidant activities and cognitive functions of thedeveloping brain on pentylenetetrazol-induced seizure model. Brain Res. 2012, 1451, 19–26. [CrossRef][PubMed]
46. Saw, C.L.; Huang, Y.; Kong, A.N. Synergistic anti-inflammatory effects of low doses of curcuminin combination with polyunsaturated fatty acids: Docosahexaenoic acid or eicosapentaenoic acid.Biochem. Pharmacol. 2010, 79, 421–430. [CrossRef] [PubMed]
47. Bazan, N.G. Neuroprotectin d1-mediated anti-inflammatory and survival signaling in stroke, retinaldegenerations, and alzheimer’s disease. J. Lipid Res. 2009, 50 (Suppl. S400–S405). [CrossRef] [PubMed]
48. Park, K.S.; Lim, J.W.; Kim, H. Inhibitory mechanism of omega-3 fatty acids in pancreatic inflammation andapoptosis. Ann. N. Y. Acad. Sci. 2009, 1171, 421–427. [CrossRef] [PubMed]

Nutrients 2017, 9, 681 15 of 15
49. Siddiqui, R.A.; Harvey, K.A.; Ruzmetov, N.; Miller, S.J.; Zaloga, G.P. N-3 fatty acids prevent whereastrans-fatty acids induce vascular inflammation and sudden cardiac death. Br. J. Nutr. 2009, 102, 1811–1819.[CrossRef] [PubMed]
50. Akhtar Khan, N. Polyunsaturated fatty acids in the modulation of t-cell signalling. Prostaglandins Leukot.Essent. Fat. Acids 2010, 82, 179–187. [CrossRef] [PubMed]
51. Yuan, Z.; Liu, Y.; Liu, Y.; Zhang, J.; Kishimoto, C.; Ma, A.; Liu, Z. Peroxisome proliferator-activatedreceptor-gamma ligands ameliorate experimental autoimmune myocarditis associated with inhibitionof self-sensitive t cells. J. Cardiovasc. Pharmacol. 2004, 43, 868–875. [CrossRef] [PubMed]
© 2017 by the authors. Licensee MDPI, Basel, Switzerland. This article is an open accessarticle distributed under the terms and conditions of the Creative Commons Attribution(CC BY) license (http://creativecommons.org/licenses/by/4.0/).