Natural convection solid/liquid phase change in...
12
hf. J. Hcut Mau lian~fir. Vol 31, No. I, pp. 3546. 1988 0017-9310/88$3.00+0.00 Prmtcd in Great Br~tam :r‘ 1988 Pergamon Journals Ltd Natural convection solid/liquid phase change in porous media C. BECKERMANN and R. VISKANTA Heat Transfer Laboratory, School of Mechanical Engineering, Purdue University, West Lafayette, IN 47907, U.S.A. (Received 21 February 1987 and in final form 29 May 1987) Abstract-A combined numerical and experimental study is reported of solid/liquid phase change in porous media with natural convection in the melt region. The model is based on volume averaged transport equations, while phase change is assumed to occur over a small temperature range. Experiments are performed in a vertical, square enclosure using gallium and glass beads as the fluid and the porous matrix, respectively. For natural convection, melting and solidification (with initial supercooling), the numerical results show reasonable agreement with the temperature and interface position measurements. Natural convection in the melt as well as heat conduction in the solid is found to considerably influence the interface shape and movement during both the melting and solidification experiments. INTRODUCTION Sot_m/liquid phase change in saturated porous media occurs in a wide variety of systems in nature and engineering. Applications include the freezing and melting of soils [l], artificial freezing of ground for mining and construction purposes [2], thermal energy storage [3], freezing of soil around the heat exchanger coils of a ground based heat pump [4, 51, food pro- cessing, etc. The present study is, however, motivated by solidification of multi-component mixtures. Due to the extended freezing temperature range of a mixture, a mushy zone might exist, consisting of a fine meshwork of dendrites growing into the melt region. In the past, this mushy zone has been modeled as a porous medium [6]. All of the above systems are characterized by microscopically complicated struc- tures of the solid/liquid interface. In addition, natural convection of the fluid occupying the void spaces of the solid matrix may strongly influence the heat trans- fer and phase-change processes. While liquid/gas phase change (i.e. condensation and evaporation) in porous media has received con- siderable research attention [7, 81, little work has been done in the area of melting and solidification of a liquid saturated porous medium [S]. Freezing and melting of water saturated porous media contained in various enclosures has been studied by Weaver and Viskanta [l&12]. Their freezing experiments in a ver- tical rectangular cavity [12] clearly show the influence of natural convection on the solid/liquid interface shape and motion. O’Neill and Albert [13] have numerically modeled solidification of porous media in the presence of natural convection using a finite element method. The energy equations for the frozen and unfrozen zones have been coupled by an appro- priate interface energy balance. Their computed results for a vertical square cavity indicate a strong interaction between the solid/liquid interface motion and natural convection. With the exception of the studies by Weaver and Viskanta [lO-121, no exper- imental investigations of solid/liquid phase change of porous media contained in an enclosure with natural convection in the melt region have, apparently, been reported in the literature. Due to the fundamental nature and practical rele- vance of such problems, the objective of the present study is to develop a general model for solid/liquid phase change in a porous medium with natural con- vection in the melt region. In order to account for the complicated interfacial structures of the various constituents, the model equations are based on volu- metric averaging of the microscopic conservation equations. Although it may be possible to obtain simi- lar model equations directly from macroscopic bal- ance considerations, it is believed that a rigorous aver- aging process will offer additional insight into the assumptions involved [14]. In addition, the volume averaged equations employed in the present study are of a more general nature than equations which are primarily based on empirical relationships (e.g. Darcy’s law). For example, the averaged equations are valid for any volume fractions of the porous matrix and the liquid and solid phases. Hence, the present approach offers the advantage that the entire domain can be treated as a single region governed by one set of conservation equations. In other words, the same equations can be used for the melt as for the fully solidified regions. Theoretically, the model can also be utilized for solidification of multi-component mix- tures, where the porous matrix is formed by the solid phase of the fluid alone (i.e. dendritic growth). Again, the model equations would be valid for the pure liquid and solid regions as well as for the porous mushy zone. In the present study, the averaged conservation 35
Transcript of Natural convection solid/liquid phase change in...

hf. J. Hcut Mau lian~fir. Vol 31, No. I, pp. 3546. 1988 0017-9310/88$3.00+0.00
Prmtcd in Great Br~tam :r‘ 1988 Pergamon Journals Ltd
Natural convection solid/liquid phase change in porous media
C. BECKERMANN and R. VISKANTA
Heat Transfer Laboratory, School of Mechanical Engineering, Purdue University, West Lafayette, IN 47907, U.S.A.
(Received 21 February 1987 and in final form 29 May 1987)
Abstract-A combined numerical and experimental study is reported of solid/liquid phase change in porous media with natural convection in the melt region. The model is based on volume averaged transport equations, while phase change is assumed to occur over a small temperature range. Experiments are performed in a vertical, square enclosure using gallium and glass beads as the fluid and the porous matrix, respectively. For natural convection, melting and solidification (with initial supercooling), the numerical results show reasonable agreement with the temperature and interface position measurements. Natural convection in the melt as well as heat conduction in the solid is found to considerably influence the interface
shape and movement during both the melting and solidification experiments.
INTRODUCTION
Sot_m/liquid phase change in saturated porous media occurs in a wide variety of systems in nature and engineering. Applications include the freezing and melting of soils [l], artificial freezing of ground for mining and construction purposes [2], thermal energy storage [3], freezing of soil around the heat exchanger coils of a ground based heat pump [4, 51, food pro- cessing, etc. The present study is, however, motivated by solidification of multi-component mixtures. Due to the extended freezing temperature range of a mixture, a mushy zone might exist, consisting of a fine meshwork of dendrites growing into the melt region. In the past, this mushy zone has been modeled as a porous medium [6]. All of the above systems are characterized by microscopically complicated struc- tures of the solid/liquid interface. In addition, natural convection of the fluid occupying the void spaces of the solid matrix may strongly influence the heat trans-
fer and phase-change processes. While liquid/gas phase change (i.e. condensation
and evaporation) in porous media has received con- siderable research attention [7, 81, little work has been done in the area of melting and solidification of a liquid saturated porous medium [S]. Freezing and melting of water saturated porous media contained in various enclosures has been studied by Weaver and Viskanta [l&12]. Their freezing experiments in a ver- tical rectangular cavity [12] clearly show the influence of natural convection on the solid/liquid interface shape and motion. O’Neill and Albert [13] have numerically modeled solidification of porous media in the presence of natural convection using a finite element method. The energy equations for the frozen and unfrozen zones have been coupled by an appro- priate interface energy balance. Their computed results for a vertical square cavity indicate a strong
interaction between the solid/liquid interface motion and natural convection. With the exception of the studies by Weaver and Viskanta [lO-121, no exper- imental investigations of solid/liquid phase change of porous media contained in an enclosure with natural convection in the melt region have, apparently, been reported in the literature.
Due to the fundamental nature and practical rele- vance of such problems, the objective of the present study is to develop a general model for solid/liquid phase change in a porous medium with natural con- vection in the melt region. In order to account for the complicated interfacial structures of the various constituents, the model equations are based on volu- metric averaging of the microscopic conservation equations. Although it may be possible to obtain simi- lar model equations directly from macroscopic bal- ance considerations, it is believed that a rigorous aver- aging process will offer additional insight into the assumptions involved [14]. In addition, the volume averaged equations employed in the present study are of a more general nature than equations which are primarily based on empirical relationships (e.g. Darcy’s law). For example, the averaged equations are valid for any volume fractions of the porous matrix and the liquid and solid phases. Hence, the present approach offers the advantage that the entire domain can be treated as a single region governed by one set of conservation equations. In other words, the same equations can be used for the melt as for the fully solidified regions. Theoretically, the model can also be utilized for solidification of multi-component mix- tures, where the porous matrix is formed by the solid phase of the fluid alone (i.e. dendritic growth). Again, the model equations would be valid for the pure liquid and solid regions as well as for the porous mushy zone.
In the present study, the averaged conservation
35
5 C. BECKERMA~N and R. VISKA~TA
A
FY
Da
9 h
Ah H k
K L
P P
Pr
Ra
Ste t
T u
u V
x
Y
NOMENCLATURE
aspect ratio, H/L specific heat [J kg- ’ K - ‘1 inertia coefficient Darcy number, K/L’ gravitational acceleration (m s-‘) enthalpy [J kg _ ‘1 latent heat of fusion [J kg- ‘] height of enclosure [m] thermal conductivity [W rn- ’ K- ‘1 ~rmeab~lity ]m”] length of enclosure [m] pressure [N m- ‘1 dimensionless pressure, pL,“/(p,v,cc,) Prandtl number, v& Rayleigh number, g/$(Tn - Tc)L3/(v& Stefan number, c,( 7’n - Tc)/A.h time [s] temperature [K] velocity [m s- ‘1 dimensionless velocity, uL/ct,
volume [m ‘1 horizontal coordinate fm] vertical coordinate [ml.
Greek symbols
;
thermal diffusivity, k,/(~c,) [m’s_ ‘1 coefficient of thermal expansion [K- ‘1
Y liquid fraction, see equation (1 b) 6 liquid fraction, see equation (lc) & porosity, see equation (la)
9 dimensionless vertical coordinate, y/L
0 dimensionless temperature,
(T- 7’c)I(Tn - Tc) K permeability ratio, K&/K A thermal conductivity ratio, keff/kl
p dynamic viscosity [N s mm ‘1 V kinematic viscosity [m’s_ ‘1
5 dimensionless horizontal coordinate, x/L
z dimensionless time, toll/L2
cf, quantity, see equation (2) 0. thermal capacitance ratio, jZ/( p,c,).
Subscripts C cold eff effective f fluid H hot
: initial liquid
m fusion p porous matrix ref reference S solid c( constituent E porosity.
Superscripts * microscopic
average. -I
equations are applied to phase change of a fluid inside a vertical rectangular enclosure filled with a porous matrix. The governing equations are solved numeri- cally. Some aspects of the model are verified by con- ducting a limited number of natural convection, melt- ing and solidification experiments in a rectangular test cell heated and cooled from the sides. The porous matrix used in the experiments consists of spherical glass beads. Because of its low melting temperature and well established thermophysical properties, gal- lium is chosen as the fluid occupying the void spaces and undergoing phase change.
ANALYSIS
Mathematical formulation The complicated interfacial geometry of the porous
matrix and the solid and liquid phases prohibits a solution of the microscopic conservation equations for mass, momentum and energy. Therefore, some form of a macroscopic description of the transport processes must be employed. The present model is based on the volumetric averaging technique [14] for obtaining the macroscopic conservation equations. In this technique, the microscopic equations, valid for
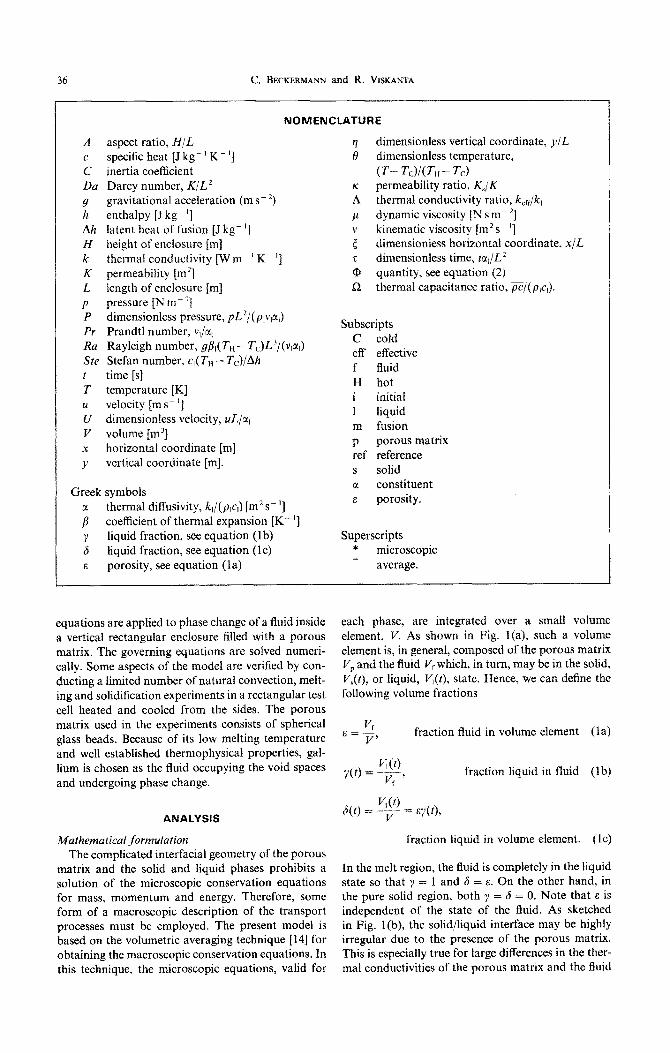
each phase, are integrated over a small volume element, V. As shown in Fig. l(a), such a volume element is, in general, composed of the porous matrix VP and the fluid V, which, in turn, may be in the solid, V,(t), or liquid, V,(t), state. Hence, we can define the following volume fractions
fraction fluid in volume element
fraction liquid in fluid
fraction liquid in volume element.
In the melt region, the fluid is completely in the liquid state so that y = 1 and 6 = E. On the other hand, in the pure solid region, both y = 6 = 0. Note that E is independent of the state of the fluid. As sketched in Fig. l(b), the solid/liquid interface may be highly irregular due to the presence of the porous matrix. This is especially true for large differences in the ther- mal conductivities of the porous matrix and the fluid

Natural convection solid/liquid phase change in porous media 37
(4
2 t Solid
0 0.5 IO
(b)
,,o!_____ -
0 + I
T,-AT Tm T,+ AT
T
(4
FIG. 1. Illustration of the phase-change process in a porous medium : (a) schematic of a control volume used for aver- aging; (b) typical liquid fraction profile ; (c) variation of the
liquid fraction with temperature.
[15]. Hence, a volume element close to the fusion temperature of the fluid, T,,,, may be simultaneously occupied by the solid and liquid phases (and the porous matrix). In these volume elements, we have that 0 < y < 1 and 0 < 6 < E.
In addition to the various volume fractions, it is appropriate to state the definitions of the averaged quantities appearing in the following equations. The intrinsic average of a quantity 4 is defined as [14]
where 4:and 4a are local (‘microscopic’) and averaged (‘macroscopic’) quantities, respectively, associated with constituent c( (i.e. the porous matrix, liquid, or solid). In addition, a superficial (‘Darcian’) velocity, II, can be defined as
II = &I, (3)
where II, is the average (‘pore’) velocity of the liquid. The following simplifying assumptions are made to
obtain the volume averaged conservation equations :
(1) The flow and heat transfer are two-dimensional
and laminar. (2) The thermophysical properties of the porous
matrix as well as of the solid and liquid phases are homogeneous and isotropic.
(3) The porous matrix and the fluid (solid or liquid) are in local thermal equilibrium (i.e. T, = T, = T, = T).
(4) The porous matrix and the solid are rigid (i.e. UP = II, = 0).
(5) The porous matrix/fluid mixture is incom- pressible and the Boussinesq approximation can be
invoked. (6) The thermophysical properties are constant, but
may de different for the porous matrix (p), liquid (1) and solid (s).
(7) The dispersion fluxes due to velocity fluctuations are negligibly small.
(8) Velocities due to density change upon phase change are neglected (i.e. p, = pS = pr).
The averaging process of the microscopic con- servation equations for each constituent is described in detail in refs. [14, 16181 and does not need to be repeated here. It should be mentioned, however, that the mass and energy equations are obtained by com- bining the averaged conservation equations for each constituent, while momentum conservation needs to be considered for the liquid phase only. The averaged mass and momentum conservation equations are
v*u=o (4)
PI au PI ~gfs’(U.V)U= -VP++
- (g + Al+-P,~lMT- Tr,,). (5)
The third and fourth terms on the right-hand side of equation (5) are empirical expressions [l&18] to account for the first (Darcy’s term) and second (Forchheimer’s extension) order drag forces, respec- tively, between the liquid and the rigid constituents. The value of the permeability, K, can be calculated from the Kozeny-Carman equation
where d,,, is the mean ‘particle size’ (e.g. the diameter of the beads). The value of the ‘inertia’ coefficient C in Forchheimer’s extension has been measured exper- imentally by Ward [19]. Although it is now generally accepted that C is a function of the microstructure of the porous medium [20], Ward found that for a large variety of porous media C can be taken as a constant equal to approximately 0.55. This value is used in all calculations in this paper. The second term on the right-hand side of equation (5) accounts for the macroscopic viscous shear in the liquid and is often called Brinkman’s extension. The value of the
38 C. BECKERMANN and R. VISKANTA
Table 1. Summary of experimental test conditions [A = 1 .O, Da = 1.37 x 10 _ ‘, Pr = 0.0208, A = 0.2719 (with k, = k,), Q = 0.8604 (in melt), R = 0.8352 (in solid)]
Exp. Test
1 Natural convection 51.9 30.5 7.198~10~ - - 2 Melting 45.0 20.0 8.409 x lo5 0.1241 0.3912 3 Solidification 40.0 20.0 6.727 x IO’ 0.0993 0.489
~--.
effective viscosity in Brinkman’s extension is taken equal to the liquid viscosity in the present study [21].
According to the local value of the liquid fraction, 6, the permeability, K, is equal to K(6 = E) in the melt region, while it varies between K(6 = E) and K(6 = 0) in the volume elements simultaneously occupied by the liquid and solid phases. In the pure solid region (i.e. 6 = 0), the permeability approaches zero. By using the local values of the liquid fraction and per- meability in the solution of the momentum equation (see Numerical Procedures), the flow is correctly cal- culated in all regions of the physical domain. Note that with K -+ 0, the velocities automatically approach zero in the solid region and equation (5) reduces to a hydrostatic pressure dist~bution equation.
It should be mentioned that for the conditions of the present experiments (see Table 1) the second term on the left-hand side of equation (5) as well as Brink- man’s extension may be small compared to the Darcy term [22]. These terms are, however, a direct result of the averaging process [ 181. In its present form, equa- tion (5) is valid for any liquid fraction. For example, equation (5) reduces to the usual ‘Boussinesq’ momen- tum equation for a pure fluid in the limit of 6 -+ 1. This case would be of interest for modeling of the flow in the pure liquid region during dendritic solidification of a multi-component mixture. Such generality would not be possible if a reduced form of the momentum equation (i.e. the simple Darcy law) had been used.
The averaged energy equation for the porous matrix/solid/liquid mixture can be written as [14, 181
&Wh, + (l-?)/@,)+ Cl-4PrAl
+ v * (p,h,u) = v * (k&VT) (7)
where keff and Tare the effective thermal conductivity and temperature of the mixture, respectively, while h, is the enthalpy of constituent CC For a pure fluid, phase change occurs at a fixed temperature, T,. At this temperature, the difference between the liquid and solid enthalpies is equal to the latent heat of fusion, Ah. Since the phases are assumed to be in local thermal equilibrium, a volume element simultaneously occu- pied by liquid and solid should, theoretically, be at the fusion temperature, T,,,. In reality, however, the mean temperature, T, of a volume element which con- tains mostly liquid (i.e. y is close to unity) may be slightly above the fusion temperature, although the local temperature at the solid/liquid interface is equal to T,,,. Similarly, an almost completely solidified vol-
ume element may be slightly below the fusion tem- perature. It is realized that the above scenario does violate the assumption of local thermal equilibrium, but it may be a good approximation for the case where finite temperature gradients exist within a volume element. Hence, in the present study it is assumed that liquid and solid may exist simultaneously in a volume element if the mean temperature, T, is within a small interval, 2AT, around the fusion temperature, T,,,. A typical variation of the liquid fraction, y, with the mean temperature is shown in Fig, l(c). Note that the liquid fraction, y, is assumed to be equal to 0.5 for T = T,,,. Hashemi and Sliepcevich [23], who utilized a similar approach, have found that the solution of the energy equation is insensitive to the assumed variation of y with T, if AT is relatively small. In the present study, a linear relationship is chosen (see Fig. l(c)). The extent of the liquid/solid zone (see Fig. l(b)) depends on the gradients in the mean temperature and can be controlled by the choice of AT to simulate the actual phase-change process closely.
For a volume element undergoing phase change (i.e. for 0 < y < I), a change in the mean enthalpy of the fluid is due to a change in the sensible heat of the liquid/solid mixture plus the contribution of the latent heat. To a good approximation, this can be expressed as
dt?Mi+(l -Y)P&
= [YP,C, + (1 -Y)P,c,~ dT+p,Ah dy (8)
where c, is the specific heat of constituent a. Sub- stituting equation (8) into equation (7) results, after a few steps, in
where the mean thermal capacitance of the mixture, ,C, is defined as
pc = EPF[YC, + (1 -y)c,l+(l-“)pp’p. (10)
Note that the term in equation (9) containing the latent heat is equal to zero in regions where no phase change takes place (i.e. 1’ = const.). Equation (9) reduces to the correct limits for y -+ 0 or 1 (i.e. the melt and solid regions) and can, thus, be utilized throughout the domain of interest.
The (stagnant) effective thermal conductivity depends, in general, on the structure of the porous medium as well as on the thermal conductivities and volume fractions of each constituent. Typically, the
Natural convection solid/liquid phase change in porous media 39
Adiabatic
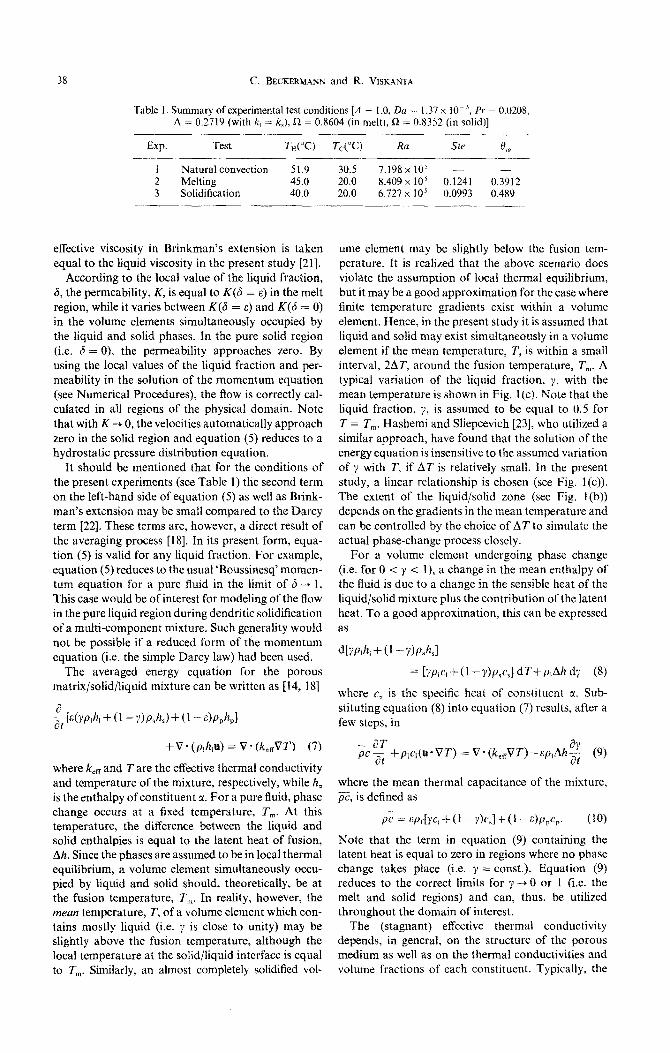
FIG. 2. Schematic of the sample problem and coordinate system.
thermal conducti~ti~s of the liquid and solid phases of a fluid are not too different so that the mean thermal conductivity of the liquid/solid mixture may be approximated by
k, = yk, + (1 - y)k,. (11)
On the other hand, the thermal conductivity of the porous matrix used in the present study (i.e. spherical glass beads) is much lower than that of the fluid (i.e. gallium). Veinberg [24] proposed a non-linear equa- tion which he claimed to be universally applicable for a medium with randomly distributed spherical inclusions
ke,+& [ 1 $$ k;k3 -k, = 0. (12)
From a comparison of the predicted and measured temperature distributions (see below), it was found that the use of the Veinberg model gave good agree- ment for the present system.
Equations (4), (5) and (9) express the conservation of mass, momentum and energy, respectively, for solid/liquid phase change in a porous medium with natural convection in the melt region. Because of the complicated interfacial structures of the constituents, the model was based on volume averaged equations describing the ‘macroscopic’ transport processes. Phase change was assumed to occur over a small tem- perature range. The equations are valid for the entire domain of interest (melt and solid regions), while the properties depend on the state of the fluid occupying the void spaces of the porous matrix. In order to illustrate the utility of the present model, a sample problem is now selected and the relevant dimen- sionless parameters are identified.
The physical system considered in the present study is shown in Fig. 2. The vertical walls of the enclosure are of height H and are held at the temperatures TH
and Tc. The connecting horizontal walls of length L are considered adiabatic. The enclosure is filled uniformly with a rigid, porous matrix which is satu- rated with a fluid. Initially, the system is at a uniform temperature, T,, equal to TH (for solidification) or T, (for melting). The hot wall temperature, T,, is above the fusion temperature, T,,,, while Tc is below T,,,. For T, equal to T&T,), the fluid is initially in the liquid (solid) state and at time t > 0, the solidification (melt- ing) process is initiated by imposing the cold (hot) temperature, T,-( TH), on one of the vertical sidewalls.
The dimensionless parameters governing this sys- tem can be obtained by introducing dimensionless variables (see Nomenclature) into the model equa- tions. The resulting dimensionless mass, momentum and energy equations, respectively, are
v-u=0 (13)
; [ ;~+;(u.v)u 1 = -vp+;v2u
- _Ik+_ c Da f, slUl)U+Ra% (14)
^/ C2~+UW=V.(AvIQ-&$ (15)
In addition, the relationship describing 6 (or y) as a function of temperature (see Fig. l(c)) is given in dimensionless form by
for
for i3<8,-AtL
(16)
The boundary and initial conditions for the present system are
@=l, U=O at {=O, O<q<A
Q=O, U=O at t=l, O<:?GA (17)
ae
e = 0 for melting
1 for solidification for z < 0.
From equations (13) to (17) it can be seen that the system behavior is governed by six dimensionless par- ameters, i.e.
Ra = siWn - T&L3 W
Rayleigh number
Pr = 2
&R(E> L2
Prandtl number
Darcy number

40 C. BECKERMANN and R. VISKANTA
Ste = COH- 5)
Ah Stefan number
aspect ratio
Tm--Tc 8, = ___
T,-T, fusion temperature.
Note that all dimensionless parameters and variables are based on the liquid properties. The property ratios tc, Q, and A are functions of the liquid fraction 6 and, therefore, constant in the melt and solid regions but variable in the region where phase change takes place. The inertia coefficient, C( = 0.55), as well as A@ are constant and independent of the specific physical situ- ation A value of AB = 0.02 is utilized in all cal- culations of the present study.
Numerical procedures The dimensionless conservation equations, equa-
tions (13 j( 15), were solved numerically utilizing the iterative SIMPLER algorithm [25]. This algorithm is based on a fully-implicit discretization scheme for the unsteady terms, while the power-law scheme is used to approximate the combined convective and diffusive fluxes. The harmonic mean formulation is adopted for the di~usion coefficients which ensures physically realistic results for abrupt changes in these coefIlcients, for example, in the phase-change region, without requiring an excessively fine grid. The last three terms on the right-hand side of equation (14) as well as the latent heat term in equation (15) represent source terms and are treated according to the pro- cedure outlined in ref. 1251. The governing equations are solved throughout the physical domain, including the pure solid region, As discussed previously, the velocities automatically approach zero in the limit of 6 -+ 0 (i.e. pure solid). Since the numerical solution of the momentum equation in the pure solid region is trivial, this method is somewhat wasteful of computer time and storage. The convenience of using a fixed and regular grid for the arbitrary geometry of the solid and liquid regions offers, however, a significant advantage.
In the compa~sons with the experiments (see below), a uniform grid of 26 x 26 nodal points and a dimensionless time step of z = 6 x 10el were utilized. Preliminary calculations performed on a grid of 50 x 50 nodal points did not result in significant improvements in the accuracy of the results obtained for pure natural convection. This is mainly due to the relatively small values of the Rayleigh (Ru) and Darcy (Da) numbers in the present experiments. It is realized, however, that the 26 x 26 grid might not be sufficient to accurately resolve the flow structure and solid/ liquid interface shape during the simulations of the phase-change experiments. The selected mesh size (and time step) should only be viewed as a compro- mise between accuracy and computational cost. For
each time step, the iterations were terminated when the dependent variables agreed to four significant digits at each nodal point and the residual source of mass was less than 10 5. The calculations were performed on a CYBER 205 computer and required up to 5000 CPU seconds for a full simulation of a phase-change experiment. Additional tests of the accu- racy of the numerical algorithm were performed for the limiting cases of no phase change and fully fluid (i.e. 6 + 1) and fully porous enclosures [26] and good agreement with results reported in the literature was found.
EXPERIMENTS
Experiments were performed in a well insulated test cell of square cross-section. The test cell had inside dimensions of 4.76 cm in height and width and 3.81 cm in depth. The horizontal top and bottom walls were constructed of phenolic plates, while the vertical front and back walls were made of Plexiglass. The two vertical sidewalls, which served as the heat source/ sink, were multipass heat exchangers machined out of a copper plate. The heat exchangers were connected through a valve system to two constant temperature baths (Haake A82). Through an appropriate valve setting the vertical sidewalls could be maintained at either the same (for z < 0) or different (for z > 0) temperatures. For the conditions of the present study, the time for a heat exchanger to reach the desired temperature after a valve switch was usually less than 20 s. The temperatures of each copper heat exchanger were measured with three thermocouples epoxied sep- arately into small-diameter holes which were drilled close to the surface of the copper plate facing the fluid. In all experiments, the temperatures of the heat exchangers were uniform to within 3% of the total temperature difference across the test cell.
Measurement of the temperature distribution inside the test cell was made with 33 the~ocouples with a wire diameter of 0. I27 mm. They were placed in three different rakes which were located at heights of 0.635, 2.38, and 4.125 cm measured from the bottom of the test cell. The rakes were positioned such that the temperatures were measured along the vertical centerplane of the test cell. All the~ocouples were calibrated with an accuracy of +O.l”C. The thermo- couples were connected to a HP-85 data-logger and computer through which the temperatures could be measured and stored at preselected time intervals.
The porous matrix consisted of a random packing of spherical glass beads with a diameter of 6.0 mm. The the~ophysical properties were obtained by knowing the chemical composition of the beads 1271. The porosity (E) of the porous matrix was measured for the present combination of glass beads and test cell and found to be equal to F. = 0.385. The fluid used was 99.99% pure gallium with a fusion temperature of T, = 29.78”C 1281. The thermophysical properties of solid and liquid gallium were taken from the litera-

Natural convection solid/liquid phase change in porous media 41
ture [28]. It should be mentioned that an attempt to use 2.89 mm glass beads failed because it proved impossible to wet the small beads with gallium. This can be explained by the high surface tension between glass and gallium.
A number of different experiments have been per- formed, but only three were selected for the com- parison with the model predictions. The experimental conditions together with the values of the dimen- sionless parameters are summarized in Table 1. All properties were evaluated at a temperature of (Tn + TJ2. Experiment 1 was a pure natural con- vection experiment, while experiments 2 and 3 involved also melting and solidification, respectively. The solid/liquid interface positions in the phase- change experiments were determined by interpolating the fusion temperature from the thermocouple read- ings. Since the horizontal distance between two ther- mocouple junctions was 4.76 mm, the error in the calculated interface location was estimated to be less than 1 mm. Because of the presence of the glass beads (with a diameter of 6.0 mm), the solid/liquid interface is expected to be highly irregular making an accurate measurement of the progress of the phase-change pro- cess difficult. It is believed, however, that the present measurements provide good estimates of the average interface locations. The accuracy of this method was also tested by performing corresponding phase- change experiments without the porous matrix (i.e. with pure gallium). A dip-stick connected to an x-y measurement system was used to infer the solid/liquid interface positions and good agreement with values calculated from simultaneous temperature measure- ments was found.
Finally, it should be mentioned that in the sol- idification experiment, considerable problems were encountered with supercooling of the liquid gallium. Although the temperature of the cold wall in experi- ment 3 was almost 10°C below the fusion temperature (for r > 0), no solidification occurred for approxi- mately the first 5 min (7 z 1.83). Then, solidification started abruptly which could easily be inferred from the temperature measurements. Because of their high surface tension, supercooling of the melt is par- ticularly serious with liquid metals [29]. Even slight agitation of the system with a hammer did not initiate solidification. The implications of the supercooling are discussed in the following section. In the melting experiment, no superheating of the solid was observed.
RESULTS AND DISCUSSION
Natural convection The results for experiment 1 are shown in Fig. 3.
Both, the measured and predicted temperature pro- files indicate relatively weak natural convection. This is expected because of the small value of the Darcy number (relative to the Rayleigh number) and the high effective thermal conductivity of the gallium/
0.6
“0 0.2 0.4 0.6 0.0 1.0
FIG. 3. Measured and predicted temperature profiles for experiment 1.
glass bead mixture, both of which tend to sup- press natural convection flow. Preliminary experi- ments with gallium and aluminum beads (not pre- sented here) showed that an even higher effective ther- mal conductivity results in completely linear temperature profiles and, thus, heat transfer by pure conduction.
In general, the agreement between the measured and predicted temperatures is better than 5% of the total temperature difference across the test cell. Some of the discrepancies are possibly due to non- uniformities in the porosity, especially in the vicinity of the walls. The measured temperatures near the hot and cold walls indicate some channeling of the flow
which is to be expected when using spherical beads as the porous matrix. In addition, some experimental error might be due to the nonuniformities in the hot and cold wall temperatures (< 3%) and imperfect adiabatic boundary conditions at the top and bottom walls. A possible error in the predicted results might be due to the uncertainties in the calculated effective thermal conductivity and the permeability of the porous medium. In fact, it may be inferred from the temperature profile at r] = 0.5 that in the experiment, natural convection is slightly stronger than indicated by the predictions, suggesting that the calculated effective thermal conductivity may be too high or the calculated permeability too low. In view of the above uncertainties in the measurements and predictions, the agreement between the results can be considered very good. Although the above comparison of the temperature data does not validate the entire model, some confidence in the numerical solution procedures was established. Due to the strong coupling of the heat transfer and fluid flow in the present natural convection system, it may be inferred that the pre- dicted streamlines closely match the flow patterns in the experiment.
C. BECKERMANN and R. VISKANTA 42
1.0
075
? 0.5
0.25
0 0.25 0.5 0.75 1.0
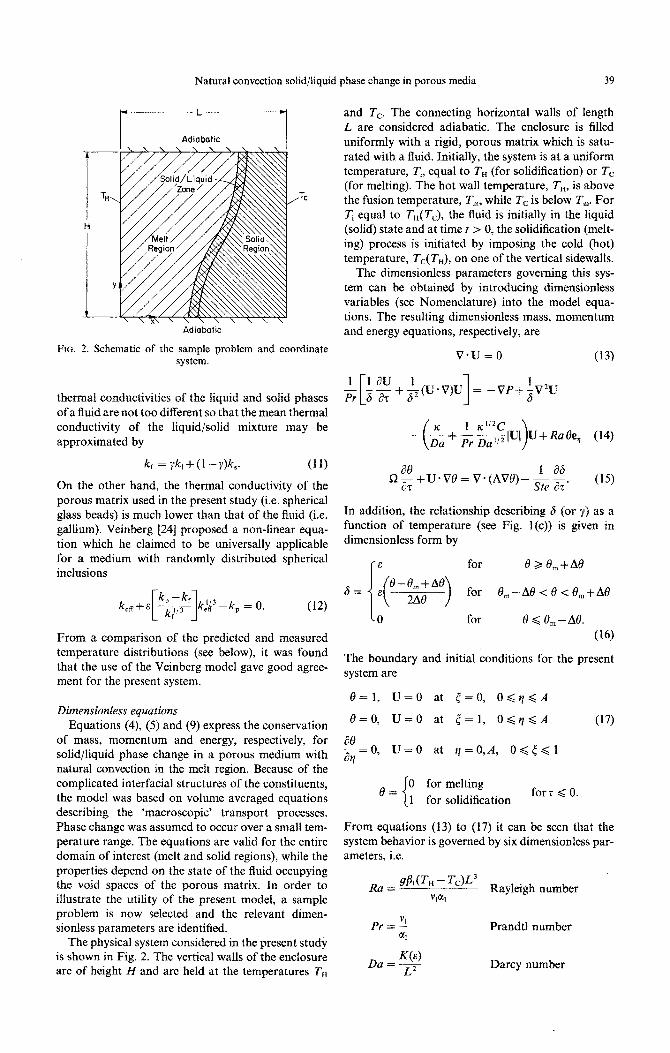
FIG. 4. Measured and predicted interface positions for experiment 2.
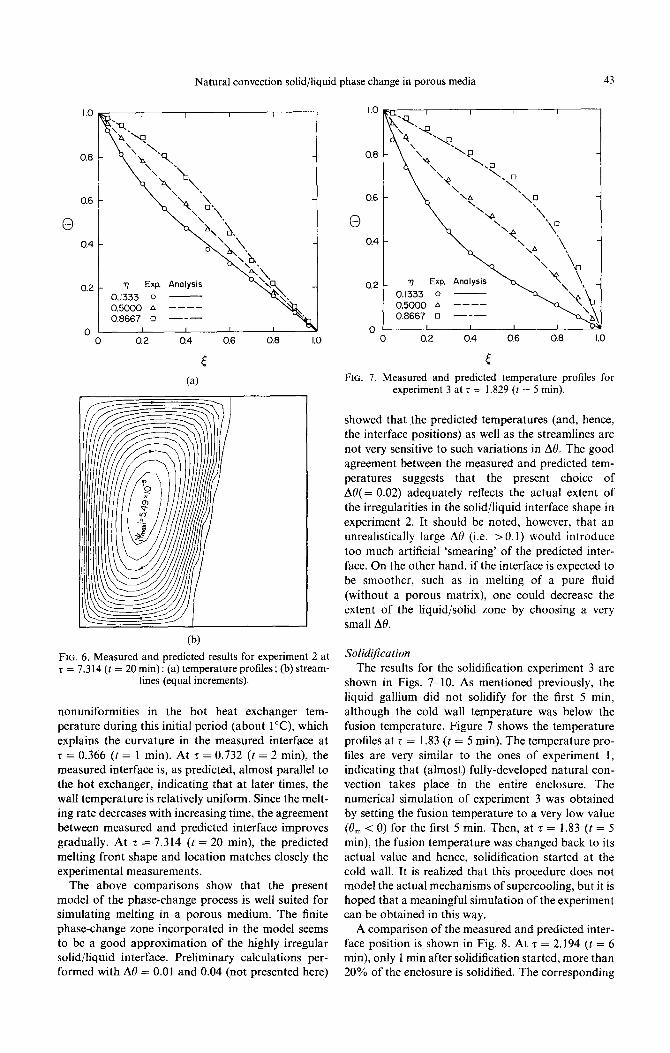
The measured and predicted results for experiment 2 are shown in Figs. 4-6. Figure 4 illustrates the time evolution of the melting front. Measurements of the solid/liquid interface position (symbols) were obtained at three different heights. The solid lines represent the numerical predictions of the isotherm 6 = B,, where the liquid fraction, y, is equal to 0.5. In the simulations, the extent of the phase-change region (0 < y < 1) was of the same order of magnitude as the diameter of the glass beads. From Fig. 4, it can be seen that for the initial 5 min, the melting front is almost parallel to the hot wall indicating a conduction dominated melting process. This is also confirmed by the measured and predicted temperature profiles and the predicted streamlines shown in Figs. 5(a) and (b), respectively, for z = 1.829 (i.e. t = 5 min). Note that the temperature profiles at z = 1.829 (Fig. S(a)) are not linear but show a variation characteristic of a transient evolution of a temperature field [30].
After this initial period, the melt front gradually exhibits a shape typical for convection dominated melting [30, 311. The interface moves faster near the top where the liquid, heated by the hot wall, impinges. The melting rate decreases toward the bottom, since the liquid cools down as it descends along the inter- face. As expected, the interface always intersects the adiabatic top and bottom boundaries at right angles [31]. With increasing time, the temperature gradients in the solid phase increase, causing the melting process to slow down. This behavior was also observed in melting ex~~ments without a porous matrix ]30]. In addition, the curvature of the interface is less than what is encountered in melting without heat con- duction in the solid region [31]. After approximately 30 min (T = 10.97), the interface reaches a stationary position and the heat transfer rates at the hot and cold walls become equal. The tem~rature profiles and streamlines for z = 7.314 (i.e. t = 20 min) are shown
0.8
0.6
8
0.4
0 0.2 0.4 0.6 0.8
E
(a)
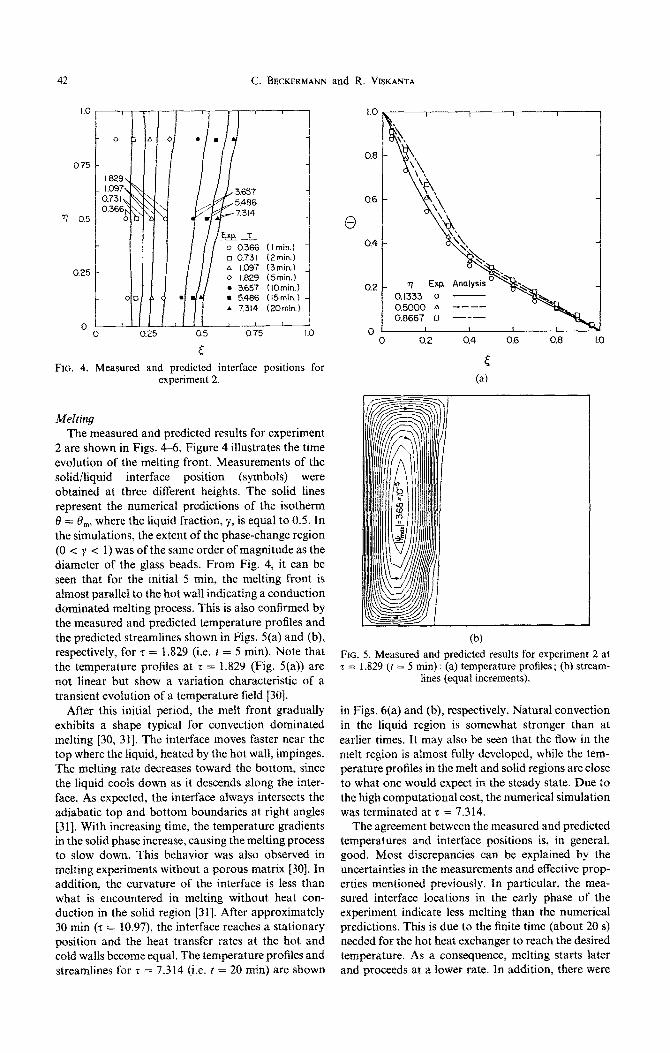
(b) FIG. 5. Measured and predicted results for experiment 2 at r = 1.829 (t = 5 min) : (a) temperature profiles; (b) stream-
lines (equal increments).
in Figs. 6(a) and (b), respectively. Natural convection in the liquid region is somewhat stronger than at earlier times. It may also be seen that the flow in the melt region is almost fully developed, while the tem- perature profiles in the melt and solid regions are close to what one would expect in the steady state. Due to the high computational cost, the numerical simulation was terminated at r = 7.314.
The agreement between the measured and predicted temperatures and interface positions is, in general, good. Most discrepancies can be explained by the uncertainties in the measurements and effective prop- erties mentioned previously. In particular, the mea- sured interface Iocations in the early phase of the experiment indicate less melting than the numerical predictions. This is due to the finite time (about 20 s) needed for the hot heat exchanger to reach the desired temperature. As a consequence, melting starts later and proceeds at a lower rate. In addition, there were
0.6
0
0.4
Natural convection solid/liquid phase change in porous media 43
7) Exp. Analysis
0.1333 0 - 0.5000 A ----
0 0.2 0.4 0.6 0.0 1.0
E (4
FIG. 6. Measured and predicted results for experiment 2 at 5 = 7.3 14 (t = 20 min) : (a) temperature profiles ; (b) stream-
lines (equal increments).
nonuniformities in the hot heat exchanger tem- perature during this initial period (about l”C), which explains the curvature in the measured interface at 7 = 0.366 (t = 1 min). At 7 = 0.732 (t = 2 min), the measured interface is, as predicted, almost parallel to the hot exchanger, indicating that at later times, the wall temperature is relatively uniform. Since the melt- ing rate decreases with increasing time, the agreement between measured and predicted interface improves gradually. At 7 = 7.314 (t = 20 min), the predicted melting front shape and location matches closely the experimental measurements.
The above comparisons show that the present model of the phase-change process is well suited for simulating melting in a porous medium. The finite phase-change zone incorporated in the model seems to be a good approximation of the highly irregular solid/liquid interface. Preliminary calculations per- formed with A@ = 0.01 and 0.04 (not presented here)
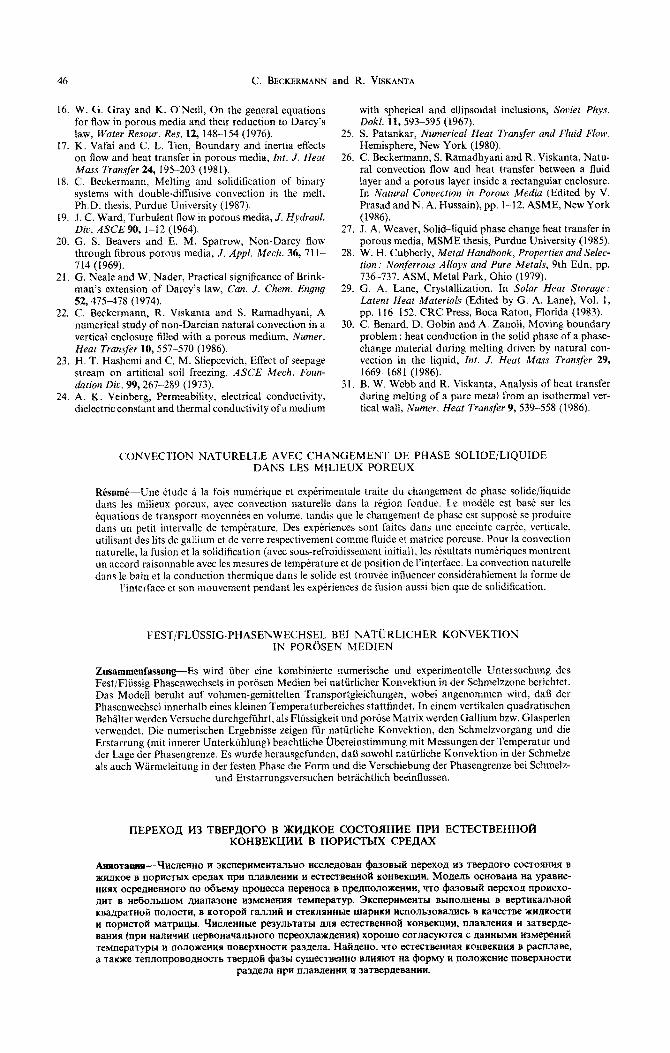
J 0 0.2 0.4 0.6 0.8 1.0
E
FIG. 7. Measured and predicted temperature profiles for experiment 3 at 5 = 1.829 (t = 5 min).
showed that the predicted temperatures (and, hence, the interface positions) as well as the streamlines are not very sensitive to such variations in A@. The good agreement between the measured and predicted tem- peratures suggests that the present choice of A@(= 0.02) adequately reflects the actual extent of the irregularities in the solid/liquid interface shape in experiment 2. It should be noted, however, that an unrealistically large AB (i.e. >O.l) would introduce too much artificial ‘smearing’ of the predicted inter- face. On the other hand, if the interface is expected to be smoother, such as in melting of a pure fluid
(without a porous matrix), one could decrease the extent of the liquid/solid zone by choosing a very small A@.
Solidlfkation The results for the solidification experiment 3 are
shown in Figs. 7-10. As mentioned previously, the liquid gallium did not solidify for the first 5 min, although the cold wall temperature was below the fusion temperature. Figure 7 shows the temperature profiles at 7 = 1.83 (t = 5 min). The temperature pro- files are very similar to the ones of experiment 1, indicating that (almost) fully-developed natural con- vection takes place in the entire enclosure. The numerical simulation of experiment 3 was obtained by setting the fusion temperature to a very low value (0, < 0) for the first 5 min. Then, at 7 = 1.83 (t = 5 min), the fusion temperature was changed back to its actual value and hence, solidification started at the cold wall. It is realized that this procedure does not model the actual mechanisms of supercooling, but it is hoped that a meaningful simulation of the experiment can be obtained in this way.
A comparison of the measured and predicted inter- face position is shown in Fig. 8. At z = 2.194 (I = 6 min), only 1 min after solidification started, more than 20% of the enclosure is solidified. The corresponding

C. BECKERMANN and R. VISKANTA 44
1.0
0.75
77 0.5
0.25
6
ei?z..L o 2.194 (6min.f l ’ ’ 53 3.657 (lOinin.) A 5.486 (15min.) l 7.314 (ZOmin.) i
Ia
h
**cl 0
0
~
'2.194 _ 3.657
1.0
FIG. 8. Measured and predicted interface positions for experiment 3
0.6
0
0.4
0.2
0
t Exp Analysis
0.1333 0 - 0.5000 A ---- 0.8667 0 ---
I 1 I I 0 0.2 0.4 0.6 0.8 1.0
(b) Fro. 9. Measured and predicted results for experiment 3 at r = 2.194 (t = 6 min): (a) tem~ratu~ profiles; (b) stream-
lines (equal increments).
8
0.4 -
0.2- 7 Exp. Analysis
0.1333 0 -
0 0.2 0.4 0.6 0.8
E (a)
0)) FIG. 10. Measured and predicted results for experiment 3 at r = 7.3 14 (t = 20 min) : (a) temperature profiles ; (b) stream-
lines (equal increments).
temperature profiles and streamlines are shown in Figs. 9(a) and (b), respectively. It can be seen that there is relatively strong natural convection in the melt region, while there exist steep temperature gradients in the solidified region. With increasing time, the tem- perature gradients in the solid decrease, causing the solidification process to slow down. Throughout the experiment, the interface shows a curvature typical of natural convection dominated solidification, i.e. the solidification rate increases from the top to the bottom of the enclosure. The interface reaches a stationary position at approximately z = 10.97 (E = 30 min). The temperature profiles and streamlines for r = 7.314 (t = 20 min) are shown in Figs. 10(a) and (b), respec- tively. Again, the simulation was terminated at this time. Due to the smaller extent of the melt region, natural convection is somewhat weaker than at earlier

Natural convection solid/liquid phase change in porous media 45
times. The temperature profiles indicate that the the interface shape and motion during both the melt-
steady state is almost reached. ing and solidification experiments.
A comparison of the predicted and measured tem- peratures and interface positions suggests that the present procedure of treating the initial supercooling yields reasonable agreement with the experiment. For T = 2.194 (t = 6 min), there is, however, a relatively large discrepancy between the measured and predicted interface position at q = 0.133 (see Fig. 8). This can be explained by the fact that the temperature gradients in this region are very small, while the temperatures are very close to the fusion temperature (see Fig. 9(a)). This results in a large phase-change zone (i.e. where 0 < y < 1) in the simulation and also produces a large uncertainty in the measured interface location. Actu- ally, the measured interface location at 7 = 2.194 cor- responds to a liquid fraction y of about 0.8 in the predictions, which is well inside the phase-change zone. Theoretically, this problem could be overcome by choosing a smaller AB. A preliminary attempt to decrease A0 resulted, however, in convergence diffi- culties, which can be attributed to the large transients present during this time period. As in the melting experiment, the agreement between the measured and predicted interface positions becomes better as the steady state is approached. In general, the previous discussions of the uncertainties in the measurements and predictions apply to this experiment.
Obviously, additional experiments using different test cells and fluid/porous matrix combinations are needed to fully understand the complicated processes during solid/liquid phase change in porous media. Ex- periments involving dendritic solidification of multi- component mixtures would be of interest to validate the present model for the case where a pure liquid region (i.e. E = y = 6 = 1) exists in addition to the porous mushy zone and the solid. Finally, modeling of porosity and property variations as well as of the effective properties need more research attention.
Acknowledgements-The work reported in this paper was supported, in part, by the National Science Foundation under Grant No. CBT-8313573. Computer facilities were made available by Purdue University Computing Center.
REFERENCES
1.
2.
3.
4.
CONCLUSIONS 5.
A fundamental study of solid/liquid phase change in porous media is performed. In the analytical part of the study, a model is developed which treats the entire domain as a single region governed by one set of conservation equations. In order to account for the complicated interfacial structures of the constituents, volume averaged conservation equations are utilized. Phase change is assumed to occur over a small, but finite temperature range. Theoretically, the model is also able to handle phase change in a pure fluid (with- out a porous matrix), if the porosity, E, is set equal to unity. In addition, the present model might be useful for phase change in multi-component mixtures, where melting or solidification does occur over a finite tem- perature range.
6.
The dimensionless equations are solved numerically utilizing a standard algorithm. The model is partially validated through experiments conducted in a vertical square cavity with gallium and glass beads as the fluid and the porous matrix, respectively. Natural con- vection, melting and solidification (with initial supercooling) experiments are performed and the uncertainties in the measurements are identified. A discussion of the deficiencies in the model (as revealed by the comparison of the experimental and predicted results) as well as of the physical phenomena occur- ring in the experiments is presented. It is found that natural convection in the melt region as well as heat conduction in the solid region considerably influence
7.
8.
9.
10.
11.
12.
13.
14.
15.
R. D. Miller, Freezing phenomena in soils. In Appli- cations of Soil Physics (Edited by D. Hillel), pp. 254 318. Academic Press, New York (1980). F. J. Sanger, Ground freezing in construction, ASCE Mech. Foundation Div. 94, 131-158 (1968). M. E. Staff, Seasonal thermal energy storage, Mech. Engng 105,28-34 (1983). P. D. Metz, A simple computer program to model three- dimensional underground heat flow with realistic bound- ary conditions, ASME J. Solar Energy Engng 105, 42- 49 (1983). 0. Svec, L. E. Goodrich and J. H. L. Planar, Heat transfer characteristics of inground heat exchangers, J. Energy Res. 7,263-278 (1983). K. M. Fisher, The effects of fluid flow on the sol- idification of industrial castings and ingots, Physico- Chem. Hydrodyn. 2,311-326 (1981). E. R. G. Eckert and E. Pfender, Heat and mass transfer in porous media with phase-change. In Heat Trunsfer- 1978, Vol. I, pp. l-12. Hemisphere, Washington, D.C. (1978). K. E. Torrance, Phase change heat transfer in porous media. In Heat Transfer 1986 (Edited by C. L. Tien, V. P. Carey and J. K. Ferrell), Vol. I, pp. 181-188. Hemisphere, Washington, D.C. (1986). _ W. Aune and Y. Yener. Research directions in natural convecti&. In Natural Convection (Edited by S. Kakac, W. Aung and R. Viskanta), pp. 1155-1171. Hemisphere, Washington, D.C. (1985). J. A. Weaver and R. Viskanta, Freezing of liquid-satu- rated porous media, ASME J. Heat Transfer 108, 654 659 (1986). J. A. Weaver and R. Viskanta, Melting of frozen porous media contained in a horizontal or a vertical, cylindrical capsule, Znt. J. Heat Mass Transfer29,1943%1951 (1986). J. A. Weaver and R. Viskanta, Freezing of water satu- rated porous media in a rectangular cavity, Znt. Commun. Heal Mass Transfer 13,245-252 (1986). K. O’Neill and M. R. Albert, Computation of porous media natural convection flow and phase change. In Finite Elements in Water Resources (Edited by J. P. Laible, C. A. Brebbia, W. Gray and G. Pinder), pp. 213- 229. Springer, Berlin (1984). P. Cheng,- Heat transfer in geothermal systems. In Advances in Heat Transfer (Edited bv T. F. Irvine. Jr. and J. P. Hartnett), Vol.” 14, pp, l-10<. Academic Press, New York (1978). S. Chellaiah, Personal communication (1987).
46 C. BECKERMANN and R. VISKANTA
16.
17.
18.
19.
20.
21.
22.
23.
24.
W. G. Gray and K. OWeill, On the general equations for flow in porous media and their reduction to Darcy’s law, Water &sour. Rex. 12, 148-154 (1976). K. Vafai and C. L. Tien, Boundary and inertia effects on flow and heat transfer in porous media, Int. J. Heut Muss Transfer 24, 195-203 (1981). C. Beckermann, Melting and solidification of binary systems with double-diffusive convection in the melt, Ph.D. thesis, Purdue University (1987). J. C. Ward, Turbulent flow in porous media, J. HydrauZ. Div. ASCE90, l--l2 (1964). G. S. Beavers and E. M. Sparrow, Non-Darcy flow through fibrous porous media, J. Appl. Mech. 36, 71 l- 714 (1969). G. Neale and W. Nader, Practical significance of Brink- man’s extension of Darcy’s law, Can. 1. Chem. Engng 52,475-478 (1974). C. Be~ke~ann, R. Viskanta and S. Ramadhyani, A numerical study of non-Darcian natural convection in a vertical enclosure filled with a porous medium, Namer. Heat Transfer 10, 557-570 (1986). H. T. Hashemi and C. M. Sliepcevich, Effect of seepage stream on artificial soil freezing, AXE Mech. Foun- dation Div. 99,267-289 (1973). A. K. Veinberg, Permeability, electrical conductivity, dielectric constant and thermal eondu~tivity of a medium
25.
26.
27.
28.
29.
30.
31.
with spherical and ellipsoidal inclusions, Soviet Phys. Dokl. ii, 593-595 (1967). S. Patankar. Numeriea~ Heat T~~~fer and F&id Flow. Hemisphere: New York (1980). ” C. Beckermann, S. Ramadhyani and R. Viskanta, Natu- ral convection flow and heat transfer between a fluid layer and a porous layer inside a rectangular enclosure. In- Natural ?onvecti& in Porous Media (Edited by V. Prasad and N. A. Hussain), pp. t-12. ASME, New York (1986). J. A. Weaver, Solid-liquid phase change heat transfer in porous media, MSME thesis, Purdue University (1985). W. H. Cubberly, Metal Handbook, Properties and Selec- tion: Nonferrous Alloys and Pure Metals, 9th Edn, pp. 736-737. ASM, Metal Park, Ohio (1979). G. A. Lane, Crystallization. In Solar Heat Storage: Latent Heat Materials (Edited by G. A. Lane), Vol. 1, tm. 116152. CRC Press. Boca Raton, Florida f 19833. y. Benard, D. Gobin and A. Zanoli, Moving bbundary problem : heat conduction in the solid phase of a phase- change material during melting driven by natural con- vection in the liquid, ht. J. Heut Mass Transfer 29, 1669-1681 (1986). 8. W. Webb and R. Viskanta, Analysis of heat transfer during melting of a pure metal from an isothermal ver- tical wall, Numer. Heat Transfer 9, 539-558 (1986).
CONVECTION NATURELLE AVEC CHANGEMENT DE PHASE SOLIDE/LIQUIDE DANS LES MILIEUX POREUX
R&sum&Une &de ii la fois numerique et expCrimentale traite du changement de phase solidejliquide dans les milieux poreux, avec convection naturelle dans la rkgion fondue. Le modtle est bask sur les kquations de transport moyennees en volume, tandis yue le changement de phase est suppos$ se produire dans un petit intervalle de temperature. Des exptriences sont faites dans une enceinte car&e, verticale, utilisant des lits de gallium et de verre respectivement comme fluide et matrice poreuse. Pour la convection naturelle, la fusion et la solidification (avec sous-refroidissement initial). les r&sultats numkriques montrent un accord raisonnable avec les mesures de tempkrature et de position de I’interface. La convection naturelle dans le bain et la conduction thermique dans le solide est trouvCe influencer consid&ablement la forme de
l’interface et son mouvement pendant les exptriences de fusion aussi bien que de solidification.
FEST/FLUSSIG-PHASENWECHSEL BE1 NATURLICHER KONVEKTION IN PORijSEN MEDIEN
Zusammeufassung-Es wird iiber eine kombinierte numerische und experimentelle Untersuchung des Fest~Fl~ssig-Phasenwechsels in porBsen Medien bei nat~rlicher Konvektion in der Schmelzzone berichtet. Das Model1 beruht auf volumen-~emittelten Transpo~gleich~gen, wobei angenommen wird, dal3 der Phasenwechsel innerhalb eines kleinen Temperaturbereiches stattfindet. In einem vertikalen quadratischen Behllter werden Versuche durchgefiihrt, als Fliissigkeit und poriise Matrix werden Gallium bzw. Glasperlen verwendet. Die numerischen Ergebnisse zeigen fiir natijrliche Konvektion, den Schmelzvorgang und die Erstarrung (mit innerer Unterkiihlung) beachtliche ijbereinstimmung mit Messungen der Temperatur und der Lage der Phasengrenze. Es wurde herausgefunden, da13 sowohl natiirlichc Konvektion in der Schmelze als such ~~rnleleitung in der festen Phase die Form und die Verschiebung der Phasengrenze bei Schmelz-
und Erstarrungsversu~hen ~tr~chtlich beeinflussen.
I-IEPEXOA M3 TBEPAOI”0 B mr?AKOE COCTOIIHME I-IPM. ECTECTBEHHOR KOHBEKL&IM B I-IOPMICTbIX CPEJ$4X
A~oTa~-~uc~eHHo a 3Kc~ep~MeHT~bHo H~~exo~H +a3OSbIii nepexon 83 XIepaoro coc~oxmi~i B xcnmoe B nopucrblx cpenax npzi nza6nemisi w ecrecraemiol KoHBexumi. Monenb ocHoBaHa na ypaese- ~m.x ocpeAHenHor0 no 06z.e~y npouecca nepeHoca a npennonomemni, wo +a3oeb& nepexon npoecxo- nel B He6OJIbmOM naana3oee U3MeHemin rehtnepaTyp. 3KcnepaMeHTbr BbmonHeHbI a aepruranbeofi KsanpaTHoii nonocTn, B ~o~opok rann~ii w ~ewnnnible mapaxB ucnonb30aaJmcb B KaqecTae xcBnKoc~B A nopHcToii MaTpeubl. ZIacneHHbre pesynbraTb1 Ann ecrecTaeHHoiI KoHB~KWM, nnaanemin 5i 3aTsepne- Batnix (npH HaJwiw nepaoHaSanbnor0 nepeoxnamneeun) xopomo cornacywrcp c AaHHbwH a3MepeHeE rebfnepaTypbI II nonoXemiil noaepxwcw pa3nena. HakeHo, 9To ecTeeraeiitias voHseKmir a pacnnaae, a -raKXe Ten~onpoaoAH~b ~aepnoii +a3bl c~~Taen~0 BJIUIIIOT Ha QtopMy B nonoXeHne noaepxfiocrzi
pasitenanpennaBneHHas3afaepnesanna.