Natural compounds with the capacity to reactivate the gene ...
119
INSTITUTO POLITÉCNICO DE LISBOA Instituto Superior de Engenharia de Lisboa Escola Superior de Tecnologia da Saúde de Lisboa Natural compounds with the capacity to reactivate the gene of gamma-globin and induction of fetal hemoglobin - In vitro test Elisabete Cristina Conceição de Matos Thesis to obtain the Master degree in Biomedical Engineering Definitive version Supervisors Dr. Rui Miguel Duque de Brito (ESTeSL) Dr. Edna Soraia Gregório Ribeiro (ESTeSL) June 2020
Transcript of Natural compounds with the capacity to reactivate the gene ...

INSTITUTO POLITÉCNICO DE LISBOA
Instituto Superior de Engenharia de Lisboa
Escola Superior de Tecnologia da Saúde de Lisboa
Natural compounds with the capacity to reactivate the gene of gamma-globin and induction of fetal
hemoglobin - In vitro test
Elisabete Cristina Conceição de Matos
Thesis to obtain the Master degree in Biomedical Engineering
Definitive version
Supervisors Dr. Rui Miguel Duque de Brito (ESTeSL)
Dr. Edna Soraia Gregório Ribeiro (ESTeSL)
June 2020

INSTITUTO POLITÉCNICO DE LISBOA
Instituto Superior de Engenharia de Lisboa
Escola Superior de Tecnologia da Saúde de Lisboa
Natural compounds with the capacity to reactivate the gene of gamma-globin and induction of fetal
hemoglobin - In vitro test
Elisabete Cristina Conceição de Matos
Thesis to obtain the Master degree in Biomedical Engineering
Definitive version
Supervisors
Dr. Rui Miguel Duque de Brito (ESTeSL) Dr. Edna Soraia Gregório Ribeiro (ESTeSL)
Examination Committee Chairperson: Dr. Cecília Ribeiro da Cruz Calado (ISEL)
Members of the Committee: Dr. Maria Paula Duarte Faustino Gonçalves (INSA) . Dr. Edna Soraia Gregório Ribeiro (ESTeSL)
June 2020

ii
Natural compounds with the capacity to reactivate
the gene of gamma-globin and induction of fetal
hemoglobin - In vitro test
Elisabete Cristina Conceição de Matos
2020
This project was supported by Instituto Politécnico de Lisboa under the grant IDI&CA-
IPL/2019/HemoFet/ESTeSL. The present work was conducted in the Health & Technology
Research Center (H&TRC), located in Escola Superior de Tecnologia da Saúde de Lisboa,
under the direct supervision of Rui Miguel Duque de Brito (ESTeSL) and Edna Soraia Gregório
Ribeiro (ESTeSL).
iii
Statement of Original Authorship
I certify that the work in this thesis has not previously been submitted for a degree nor has
it been submitted as part of requirements for a degree except as fully acknowledged within the
text.
I also certify that the thesis has been written by me. Any help that I have received in my
research work and the preparation of the thesis itself has been acknowledged. In addition, I
certify that all information sources and literature used are indicated in the thesis.
Signature of Student

iv
Statement of Copyright
Instituto Politécnico de Lisboa has the right to archive and publish this dissertation and to
disseminate it through scientific repositories for non-commercial educational or research
purposes, provided that the author and publisher are given credit.
Copyright© 2020 – Elisabete Matos

v
Dedication
I dedicate this work to all individuals with hemoglobinopathies who regardless of the clinical
complications with which they live, see in researchers and in their research reasons for trust
and hope.

vi
Acknowledgments
Firstly, I would like to thank my mentors: Professor Doctor Miguel Brito and Professor Doctor
Edna Ribeiro. The door (and email) was always open for my many questions, doubts and
problems. I appreciate your willingness and generosity to guide me in this odyssey that was
the realization of this thesis.
To Mariana Delgadinho and Daniela Sousa, who collaborated with me on this research,
whom I deeply appreciate their availability and their very important contribution to the study,
because without them the work would not be completed in a timely manner.
To the Professors: Vanessa Mateus, Inês Silva and Ana Almeida, for their collaboration in
this project and for all the recommendations and knowledge transmitted.
To the Professors and colleagues of the Master in Biomedical Engineering and the staff of
LNEG and DGEG for their support, sharing and friendship in this important stage of my life.
To my friends who always supported me and understood my absences.
Special thanks to Dr. Francisco Castro for all his understanding and support at this stage
and over these eight years. Without him, none of this would be possible.
Last but not least, I would especially like to thank my amazing family (parents, sister and
grandparents) for their love, support and constant encouragement.

vii
Abstract
β-hemoglobinopathies are the most common recessive genetic diseases worldwide.
Currently available treatments for these disorders are expensive and associated with severe
side effects.
Pharmacological reactivation of Fetal Hemoglobin (HbF) is seen as a promising therapeutic
strategy. Hydroxyurea (HU), a potent ribonucleotide reductase inhibitor, is the only Food and
Drug Administration (FDA) approved HbF inducing agent. However, its cytotoxicity, potential
carcinogenicity and variable clinical effects limit severely its use.
Identification of novel agents, with higher HbF inducing activity, lower cytotoxicity and
available in low-income countries, such as natural compounds, has become a great challenge
today.
Here, we performed an assessment of potential transcriptional effects induced by two
natural bioactive compounds, namely Genistein (GN) a naturally occurring flavonoid found in
soybean and soy derivates and Epigallocatechin-3-gallate (EGCG) the major polyphenol
component of green tea, in globin and HbF regulators/silencer genes.
K562 cell line was exposed for 72 and 96 hours to three different concentrations of GN and
EGCG that mimic cellular exposure in vivo after supplementation (100 ƞg/ml, 250 ƞg/ml and
500 ƞg/ml), and 25 µg/ml HU was used as a positive control. Cell viability and proliferation
were measured and the transcriptional effects of GN and EGCG on α, β and γ-globin genes,
as well as the HbF regulators genes BCL11A and KLF1, were evaluated by qRT-PCR using
specific primers.
Our results demonstrated that both compounds impact cellular metabolism and proliferation
with no cytotoxic effects and have a potential specific molecular target for BCL11A with
associated downregulation, without altering KLF1 levels. GN and EGCG also affected globin
expression levels in a dose and time-dependent manner. Interestingly, transcriptional analysis
of both compounds revealed non-monotonic dose-responses (NMDRs).
Overall, our preliminary study sustains the potential of these compounds for γ-globin
reactivation and consequently HbF induction, which indicates that GN and EGCG may be
potential candidates for new therapeutic strategies. Further research must be performed in
order to assess the effectiveness of HbF induction and the underlying molecular mechanisms.
Keywords: β-hemoglobinopathies; Fetal Hemoglobin reactivation; Genistein;
Epigallocatechin-3-gallate; globin expression; BCL11A; KLF1

viii
Resumo
As β-hemoglobinopatias são as doenças genéticas recessivas mais comuns no mundo. No
entanto, os tratamentos atualmente disponíveis são dispendiosos e apresentam graves efeitos
secundários.
A reativação farmacológica da Hemoglobina Fetal (HbF) é vista como uma estratégia
terapêutica promissora. A Hidroxiureia (HU), um potente inibidor da ribonucleotídeo redutase,
é atualmente o único fármaco indutor de HbF aprovado pela FDA. No entanto, a sua
citotoxicidade, potencial carcinogénico e efeitos clínicos variáveis, limitam severamente o seu
uso.
A identificação de novos agentes, com alta atividade indutora de HbF, baixa citotoxicidade
e disponíveis nos países em desenvolvimento, como os compostos naturais, é um dos
grandes desafios da atualidade.
Neste projeto avaliámos os efeitos transcricionais induzidos por dois compostos naturais,
a Genisteína (GN), um flavonoide natural encontrado na soja e derivados da soja e a
Epigalocatequina-3-galato (EGCG), o principal componente polifenol do chá verde, nos genes
reguladores/silenciadores da globina e HbF.
A linhagem celular K562 foi exposta por 72 e 96 horas a três concentrações diferentes de
GN e EGCG (100 ƞg/ml, 250 ƞg/ml e 500 ƞg/ml) que reproduzem a exposição celular in vivo
após suplementação, e 25 µg/ml de HU foi utilizada como controlo positivo. A viabilidade e
proliferação celular foram medidas e os efeitos transcricionais da GN e EGCG nos genes da
α, β e γ-globina, bem como nos genes reguladores da HbF, BCL11A e KLF1, foram avaliados
por qRT-PCR utilizando primers específicos.
Os nossos resultados demonstraram que ambos os compostos afetam o metabolismo e
proliferação celular sem efeitos citotóxicos observáveis, e têm como potencial alvo molecular
o BCL11A, associado à regulação negativa deste gene, sem alterar os níveis do KLF1. A GN
e EGCG também afetaram a expressão das globinas em função da dose e do tempo. A análise
transcricional de ambos os compostos, revelou que ambos apresentam respostas não
monotónicas em relação à dose (NMDRs).
Este estudo sustenta o potencial desses compostos para reativação da γ-globina e,
consequentemente, indução da HbF, o que indica que a GN e EGCG podem ser potenciais
candidatos a novas estratégias terapêuticas. Mais pesquisas devem ser realizadas para
avaliar a eficácia na indução da HbF e os mecanismos moleculares subjacentes.
Palavras-chave: β-hemoglobinopatias; reativação da Hemoglobina Fetal; Genisteína;
Epigalocatequina-3-galato; expressão da globina; BCL11A; KLF1

ix
Relevant publications in the field
Conference-papers
Matos, E; Sousa, D; Delgadinho, M; Mateus, V; Silva, I; Ribeiro, E; Brito, M. (R33.) Potencial
da genisteína na reativação da expressão do gene da γ-globina e indução da hemoglobina
fetal. III Congresso Nacional de Ciências Biomédicas Laboratoriais. Lisbon, October 2019.
Available from: https://iii-cncbl.site123.me/resumo-das-comunicações-livres
Delgadinho, M; Matos, E; Sousa, D; Ribeiro, E; Brito, M. The potential of natural compounds
in HBG gene reactivation and fetal hemoglobin induction. Abstract submitted to 4th Global
Congress on Sickle Cell Disease. Paris, April 7-9, 2020 (postponed to an undetermined date)
Poster
Sousa, D; Matos, E; Delgadinho, M; Ribeiro, E; Mateus, V; Silva, I; Brito, M. (R15.) O potencial
da epigalocatequina-3-galato na reativação da expressão do gene da γ-globina e indução da
hemoglobina fetal. III Congresso Nacional de Ciências Biomédicas Laboratoriais. Lisbon,
Available from: October 2019. https://iii-cncbl.site123.me/resumo-dos-posteres
Journal article - manuscript submitted
Ribeiro, E; Delgadinho, M; Matos, E; Sousa, D; Galante, H; Brito, M. Epigallocatechin-3-
gallate and Genistein potential HbF inducers? An in vitro and in vivo approach. Manuscript
submitted to Molecular and Cellular Biochemistry

x
Table of Contents
Statement of Original Authorship ......................................................................................iii
Statement of Copyright .......................................................................................................iv
Dedication ............................................................................................................................ v
Acknowledgments ...............................................................................................................vi
Abstract ..............................................................................................................................vii
Resumo .............................................................................................................................. viii
Relevant publications in the field .......................................................................................ix
Table of Contents ................................................................................................................ x
List of Figures ....................................................................................................................xii
List of Tables ..................................................................................................................... xiv
List of Abbreviations ..........................................................................................................xv
Chapter 1: Introduction ....................................................................................................... 1
1.1 Hemoglobinopathies .................................................................................................... 2
1.1.1 Motivation .............................................................................................................. 3
1.1.2 Thesis overview ..................................................................................................... 3
1.2 Human hemoglobin molecule ....................................................................................... 5
1.3 Regulation of γ-globin gene expression ....................................................................... 7
1.3.1 BCL11A ................................................................................................................. 9
1.3.2 KLF1...................................................................................................................... 9
1.3.3 SOX6....................................................................................................................10
1.3.4 HBS1L-MYB (HMIP) .............................................................................................10
1.3.5 GATA1 .................................................................................................................11
1.3.6 Epigenetic regulation of fetal globin gene expression ...........................................11
1.3.6.1 DNA methylation ............................................................................................12
1.3.6.2 Histone acetylation/methylation ......................................................................13
1.3.6.3 microRNAs .....................................................................................................13
1.3.7 Signaling pathways - p38 mitogen-activated protein kinase (p38 MAPK) ..............13
1.4 Sickle cell disease .......................................................................................................14
1.5 Beta-thalassemia ........................................................................................................19
1.6 Treatments for β-hemoglobinopathies .........................................................................23
1.6.1 Stem cell transplantation ......................................................................................24
1.6.2 Blood transfusion therapy .....................................................................................25
1.6.3 Gene therapy ........................................................................................................26
1.6.4 Reactivation of fetal hemoglobin ...........................................................................28
1.6.4.1 DNMT Inhibitors: 5-azacytidine and decitabine ..............................................29

xi
1.6.4.2 HDAC Inhibitor: butyrate ................................................................................30
1.6.4.3 Erythropoietin .................................................................................................30
1.6.4.4 Hydroxyurea ..................................................................................................30
1.6.4.5 Natural inducers of fetal hemoglobin ..............................................................33
1.6.4.6 Potential new natural inducers of fetal hemoglobin ........................................34
1.6.4.6.1 Genistein .................................................................................................34
1.6.4.6.2 Epigallocatechin-3-gallate ........................................................................35
1.7 K562 cell line ..............................................................................................................36
Chapter 2: Objectives.........................................................................................................39
2.1 Study potential, specific aims and expected outcomes................................................40
Chapter 3: Materials and Methods ....................................................................................43
3.1 Cell culture and reagents ............................................................................................44
3.2 Drugs and treatments .................................................................................................45
3.3 Cell viability assays .....................................................................................................46
3.4 Total RNA extraction ...................................................................................................48
3.5 RNA quantification ......................................................................................................49
3.6 cDNA synthesis and real-time quantitative PCR (qRT-PCR) .......................................49
3.7 Statistical analysis .......................................................................................................52
Chapter 4: Results ..............................................................................................................53
4.1 Cell proliferation and viability ......................................................................................54
4.1.1 GN affects proliferation and cellular metabolism with no effects on K562 cell viability
......................................................................................................................................54
4.1.2 EGCG affects proliferation and cellular metabolism with no effects on K562 cell
viability ..........................................................................................................................57
4.2 Transcriptional effects on BCL11A and KLF1 gene expression ...................................60
4.2.1 GN differentially affects mRNA of the genes related with silencing of HbF in K562
cells ...............................................................................................................................60
4.2.2 EGCG induces downregulation in BCL11A but does not affect KLF1 ...................62
4.3 Transcriptional effects on globins gene expression .....................................................63
4.3.1 GN down-regulates α-globin mRNA ......................................................................63
4.3.2 EGCG affects the expression of β and γ-globin genes. .........................................64
Chapter 5: Discussion and Conclusions ..........................................................................67
5.1 Discussion ..................................................................................................................68
5.2 Conclusions ................................................................................................................78
5.3 Future perspectives ....................................................................................................78
Bibliography .......................................................................................................................80
Appendices .........................................................................................................................98

xii
List of Figures
Fig. 1 Representative diagram of the general structure of the dissertation ............................ 4
Fig. 2 The composition of human hemoglobin ....................................................................... 5
Fig. 3 Normal developmental switches of globin expression.................................................. 7
Fig. 4 Summary of pathways regulating the switch from γ-globin to β-globin ......................... 8
Fig. 5 Pathogenesis of sickle cell disease: Induction of sickling RBCs by polymerization of the
HbS ......................................................................................................................................16
Fig. 6 Number of newborns (based on estimates) with sickle cell anemia in 2015 ...............18
Fig. 7 Molecular localizations and types of mutations in β-globin gene resulting in common β-
thalassemia worldwide. ........................................................................................................20
Fig. 8 Current and future therapies for β-hemoglobinopathies ..............................................24
Fig. 9 Multiple effects of hydroxyurea administration in sickle cell disease patients ..............31
Fig. 10 Natural inducers of fetal hemoglobin already reported..............................................33
Fig. 11 The generic structure of 17β-estradiol and genistein. ...............................................34
Fig. 12 Structure of Epigallocatechin-3-gallate .....................................................................36
Fig. 13 General morphology of a K562 cell. .........................................................................38
Fig. 14 Photos taken during the project: (A) Polaris vertical laminar airflow cabinet, class 100.
(B) Inverted phase-contrast microscope. (C) Cell culture in T-75 flask. ................................44
Fig. 15 Photos taken during the project: (A) Treatment in 6-well plates. (B) Treatment in 96-
well plates. ...........................................................................................................................46
Fig. 16 Photos taken during the project: Trypan blue exclusion assay in a Neubauer improved
hemocytometer.....................................................................................................................46
Fig. 17 Normal conversion of resazurin to resorufin by metabolically active cells .................47
Fig. 18 Effect of GN on the proliferation of K562 cells. .........................................................55
Fig. 19 Effect of GN on K562 cells viability by Trypan-Blue exclusion assay. .......................56
Fig. 20 Effect of GN on K562 cells viability by CellTiter-Blue assay......................................57

xiii
Fig. 21 Effect of EGCG on the proliferation of K562 cells. ....................................................58
Fig. 22 Effect of EGCG on the viability of K562 cells by Trypan-Blue exclusion assay. ........59
Fig. 23 Effect of EGCG on the viability of K562 cells by CellTiter-Blue assay. ......................59
Fig. 24 GN effects on expression of BCL11A gene. .............................................................61
Fig. 25 GN effects on expression of KLF1 gene. ..................................................................61
Fig. 26 EGCG effects on expression of BCL11A gene. ........................................................62
Fig. 27 EGCG effects on expression of KLF1 gene. .............................................................63
Fig. 28 GN effects on the expression of the globin genes. ...................................................65
Fig. 29 EGCG effects on the expression of the globin genes. ..............................................66

xiv
List of Tables
Table 1: Primer sequences and sizes of the real-time qRT-PCR ......................................... 51
Table 2: qRT-PCR amplification conditions .......................................................................... 51

xv
List of Abbreviations A, C, G, T Adenine, cytosine, guanine, thymine (organic bases that constitute the
nucleotides)
ACS Acute chest syndrome
ATP Adenosine triphosphate
BCL11A B Cell Lymphoma 11A
BME β-mercaptoethanol
cAMP Cyclic adenosine monophosphate
Cas9 CRISPR associated protein 9
cDNA Complementary DNA
CE Capillary electrophoresis
cGMP Cyclic guanosine monophosphate
CML Chronic myelogenous leukemia
CO Carbon monoxide
CO2 Carbon dioxide
CpG Cytosine-phosphate-guanosine
CRISPR Clustered Regularly Interspaced Short Palindromic Repeats
CT Cycle threshold
DHFR Dihydrofolate reductase
DMSO Dimethyl sulfoxide
DNA Deoxyribonucleic acid
DNMTs DNA methyltransferases
dNTP Deoxynucleotide
ECACC European Collection of Cell Cultures
EDCs Endocrine-disrupting chemicals
EFSA European Food Safety Authority
EGCG Epigallocatechin-3-gallate
EKLF Erythroid krüppel-like factor
EMA European Medicines Agency
EPO Erythropoietin
ER-α Estrogen receptor alpha
ER-β Estrogen receptor beta
ERK Extracellular-signal-regulated kinase
FBS Fetal bovine serum
FDA Food and Drug Administration
GATA1 GATA binding protein 1
GN Genistein
GTC Guanidine thiocyanate
GWA Genome-wide association
HATs Histone acetyltransferases
Hb Hemoglobin
HbA Adult hemoglobin
HbAS Sickle cell trait
HBB β-globin gene
HbF Fetal hemoglobin
HBG γ-globin gene

xvi
HCC Hepatocellular carcinoma
HbS Sickle hemoglobin
HbSS Homozygous for HbS - Sickle cell anemia
HDACs Histone deacetylases
HEPES Hydroxyethyl piperazine ethanesulfonic acid
HLA Human leukocyte antigen
HPFH Hereditary persistence of fetal hemoglobin
HPLC High-performance liquid chromatography
HSCT Hematopoietic stem cell transplantation
H&TRC Health & Technology Research Center
HU Hydroxyurea
IC50 Half maximal inhibitory concentration
IL-1 Interleukin-1
IEF Isoelectric focusing
JNK Jun N-terminal kinase
KLF1 Kruppel-like factor 1
LCR Locus control region
LD Linkage disequilibrium
LPS Lipopolysaccharide
MAPK Mitogen-activated protein kinase
MKPs MAPK phosphatases
miRNAs MicroRNAs
mRNA Messenger ribonucleic acid
NMDR Non-monotonic dose-response
NO Nitric oxide
NTDTs Non-transfusion dependent thalassemias
p38 MAPK P38 mitogen-activated protein kinase
PALOP From Portuguese “Países Africanos de Língua Oficial Portuguesa”
PBS Phosphate-buffered saline
PfEMP1 Erythrocytic Protein-1 encoded by P. falciparum
PI3K Phosphatidylinositol 3-kinase
PKA Protein kinase A
PPARγ Peroxisome proliferator-activated receptor gamma
PTK Protein tyrosine kinases
qRT-PCR Quantitative Reverse Transcription Polymerase Chain Reaction
RAR-beta Beta retinoic acid beta receptor
RBC Red blood cell
RLA RNA Lysis Buffer
RNA Ribonucleic acid
ROS Reactive oxygen species
rpm Revolutions per minute
RPMI Roswell Park Memorial Institute
rRNA Ribosomal ribonucleic acid
SAR1 Secretion Associated Ras Related GTPase 1
SCA Sickle cell anemia
SCD Sickle cell disease
SDS Sodium dodecyl sulfate
TDTs Transfusion-dependent thalassemias

xvii
TNF Tumor necrosis factor
TSGs Transcription of tumor-suppressor genes
VOC Vaso-occlusive pain crises
WHO World Health Organization

xviii
“The journey of a thousand miles begins with one step”
Lao Tzu

1
Chapter 1: Introduction

Introduction
2
1.1 Hemoglobinopathies
Hemoglobinopathies are the most common monogenic diseases worldwide. According to the
World Health Organization (WHO) 7% of the population carries with these disorders, recent
researches suggest that between 300.000 and 400.000 newborns are affected each year with
this problem and their prevalence is predicted to increase in the future (Cavazzana & Mavilio,
2018; Diepstraten & Hart, 2019; Goonasekera, Paththinige, & Dissanayake, 2018; Williams &
Weatherall, 2012). Hemoglobinopathies are hemoglobin (Hb) disorders resulting from changes
in genes responsible for the synthesis of globin chains. They can be characterized as qualitative
or structural changes (synthesis of mutated globin variants, e.g. sickle syndromes, hemoglobin
C, D, and E disease) and quantitative changes (decrease or abolition of globin chains production
called the thalassemia syndromes) (Cavazzana & Mavilio, 2018; Modell & Darlison, 2008). To
date, more than 1.000 hemoglobin disorders have been identified and characterized (Forget &
Bunn, 2013).
It is thought that the high prevalence of hemoglobinopathies is due to a selective advantage
of its carriers against malaria. As a consequence of this positive selection, these pathologies
have a high frequency in the geographic areas of the tropics and subtropics (sub-Saharan Africa,
the Mediterranean, and Southeast Asia) where malaria was endemic. However, due to
population migrations, they have also become increasingly prevalent in non-endemic regions,
making it a global health problem (Goonasekera et al., 2018; Modell & Darlison, 2008).
In Portugal, only three studies were carried out until the present to determine the prevalence
of hemoglobinopathies. These studies demonstrated the existence of a significant incidence in
the southern districts, explained by the occupation of these regions in the past by Arabs and
African slaves (Bento et al., 2006; Inez, Sequeira, Santos, Santos, & Nunes, 1993; Martins,
Olim, Melo, Magalhaes, & Rodrigues, 1993). Nowadays it is probable that prevalence has
increased dramatically due to the migration phenomenon verified in recent years coming from
Brazil, from the Portuguese-speaking African countries (PALOP) and East Europe (S. Costa,
Madeira, Sobral, & Delgadinho, 2016; Miranda et al., 2013).
Hemoglobinopathies were the first diseases to be analyzed using molecular biology and
helped to establish many of the general principles that nowadays support our understanding of
human molecular genetics (Higgs, Engel, & Stamatoyannopoulos, 2012).
Modifications in the β-globin gene are the most prevalent. Sickle cell disease (SCD) and β-
thalassemia are considered the most common hemoglobinopathies, with high rates of morbidity
and mortality (Sankaran, 2011; Thein, 2017).

Introduction
3
1.1.1 Motivation
Despite the high prevalence of β-hemoglobinopathies, available treatments continue to have
many limitations and are poorly available in low-income countries where affected patients are
frequently unable to sustain the high costs of clinical management (Dreuzy, Bhukhai, Leboulch,
& Payen, 2016).
Novel therapeutic approaches are currently being developed, in an effort to move beyond the
palliative management and the complications of the treatment (Dreuzy et al., 2016).
Pharmacological reactivation of Fetal hemoglobin (HbF) is seen as a promising therapeutic
strategy. Hydroxyurea (HU) is the only HbF inducing agent approved for the Food and Drug
Administration (FDA) for sickle cell disease treatment (Field & Nathan, 2014). However, its
cytotoxicity, potential carcinogenicity and the moderate effects obtained after administration
have limited their clinical use (Stamatoyannopoulos, 2005).
The inability of populations in the majority of highly endemic developing countries to access
proper medication and sustain the high costs lead to the necessity to develop new therapeutic
approaches with more accessible compounds at very low costs. That way, identification of novel
agents with higher HbF inducing activity, lower cytotoxicity and available to all populations as
natural compounds is one of today's greatest challenges (Theodorou et al., 2016).
In this context, this project aims to evaluate the potential of two naturally occurring
compounds with high biological activity, namely: the genistein (GN) (a naturally occurring
flavonoid found in soybean and soy derivates) (Nagaraju, Zafar, & El-Rayes, 2013) and
epigallocatechin-3-gallate (EGCG) (the major polyphenol component of green tea)
(Thichanpiang & Wongprasert, 2015), in the induction of γ-globin gene reactivation and HbF
expression, as a possible therapy for β-hemoglobinopathies.
1.1.2 Thesis overview
This project was developed at the Health & Technology Research Center (H&TRC), located
in Escola Superior de Tecnologia da Saúde de Lisboa, and funded by Instituto Politécnico de
Lisboa: project IDI&CA-IPL/2019/HemoFet/ESTeSL.
For a better reading experience, this section aims to describe the structure and relevance of
each chapter of this thesis.
The thesis is divided into 5 chapters, and the general organization is schematically
represented in Fig. 1.

Introduction
4
Fig. 1 Representative diagram of the general structure of the dissertation
The general introduction (Chapter 1) presents the theme in order to contextualize the reader
with the project, describing the motivation for the study as well as the importance of the work
presented here. In the first block of the thesis, the main theoretical concepts that support the
study are presented. A general introduction to hemoglobinopathies is made, followed by a
description of the structure of the human hemoglobin molecule and the main mechanisms
associated with the expression of the γ-globin gene. The following is a general description
encompassing the theoretical description and pathophysiology of SCD and β-thalassemia
(general contexts and prevalences are described). This chapter also describes the main
treatment methods available for β-hemoglobinopathies, with the main emphasis on HbF
induction, and a general description of the two compounds to be studied is made: genistein and
epigallocatechin-3-gallate. Lastly, a brief description/characterization of the K562 cell line is
made.
Chapter 2 describes the specific objectives of this investigation, the theoretical context and the
expected results. Materials and methodologies are described sequentially in Chapter 3.
In Chapter 4, the experimental results are listed simultaneously by demonstrating the cell
proliferation and viability, the transcriptional effects on BCL11A and KLF1 expression and the
transcriptional effects on globins gene expression.
Finally, in Chapter 5, the results are discussed: interpreting the results and comparing them
with the bibliography already published. The conclusions obtained in this experience are
presented, as well as some of the limitations and future perspectives in relation to the
continuation of the project.
Chapter 1:
Introduction
Hemoglobinopathies
Human hemoglobin
molecule Regulation of γ-globin
gene expression
Sickle cell disease
Beta-thalassemia
Treatments for β-
hemoglobinopathies
Genistein
Epigallocatechin-3-
gallate
Chapter 2: Objectives Chapter 3: Materials
and Methods Chapter 4: Results Chapter 5: Discussion
and Conclusions
K562 cell culture and
reagents
Drugs and treatments
Cell Viability Assays
Total RNA extraction
RNA quantification
cDNA synthesis and
qRT-PCR
Statistical analysis
Cell proliferation and
viability
Transcriptional effects
on BCL11A and KLF1
expression
Transcriptional effects
on globins expression
Discussion
Conclusions
Future perspectives
Study potential
Specific aims and
expected outcomes
K562 cell line

Introduction
5
1.2 Human hemoglobin molecule
Hemoglobin is a multiple subunits molecule, essential to the life of higher organisms (Forget
& Bunn, 2013).
Present in large quantities in erythrocytes and responsible for oxygen-transporting from the
lungs to all body in mammals, also interacts with three other gases such as carbon dioxide
(CO2), carbon monoxide (CO) and nitric oxide (NO). Hemoglobin thus plays a crucial role in the
maintenance of homeostasis and buffering of acidic metabolic waste products (Forget & Bunn,
2013; Schechter, 2008). Each red blood cell (RBC) contains approximately 300 million
molecules of hemoglobin, totaling about 30 picograms in weight per cell (Cappellini, Cohen,
Porter, Taher, & Viprakasit, 2014).
Adult human hemoglobin is a tetrameric protein composed of two pairs of polypeptide chains
(two α-globins and two β-globins - α2β2) folded into a compact globule. Each globin chain
contains a central oxygen-binding heme group responsible for the oxygen transport capacity
(Fig. 2) (Forget & Bunn, 2013; Goonasekera et al., 2018; Sankaran & Orkin, 2013; Schechter,
2008).
Fig. 2 The composition of human hemoglobin, adapted from (Diepstraten & Hart, 2019). Hemoglobin
is a tetramer of two α-like and two β-like globin subunits, each globin subunit contains a central heme
group with one iron atom.
In humans, hemoglobin synthesis is controlled by two similar multigenic clusters: the α-globin
gene cluster on the short arm of chromosome 16 (16p13.3) in a region near the telomere and
β-globin gene cluster on the short arm of chromosome 11 (11p15.5) (Schechter, 2008).
The α-globin cluster comprises about 30 kbp and contains an embryonic (ζ) gene and two
identical adult (α) genes differing only in their expression. The α2-globin gene encodes nearly
two to three times much of its protein in comparison with the α1-globin gene (Cui & Engel, 2017).

Introduction
6
β-globin agglomerate comprises approximately 1.6 kbp and is composed of five functional
genes: ε, γ1, γ2, δ, and β. The ε gene encodes an embryonic globin, γ1 and γ2 are fetal globin
genes expressed at the end of gestation and differ only by a single amino acid (glycine/alanine
at position 136), δ and β are two adult globin genes. β-like globin locus also contains the locus
control region (LCR), located 50 kb upstream from the gene, made up of five DNase I
hypersensitive sites responsible for high levels of β-like globin gene expression (Cui & Engel,
2017).
In both groups, there are also several globin pseudogenes with unknown function (Cui &
Engel, 2017).
Hemoglobin genes are arranged along the chromosome in the order which they are
expressed during the various development cycles to produce different tetramers (Cui & Engel,
2017; Goonasekera et al., 2018) in response to shifting needs for oxygen during these stages
(Diepstraten & Hart, 2019).
Two sequential changes occur from embryonic hemoglobin (Hb Gower-I [ζ2ε2], Hb Gower-II
[α2ε2] and Hb Portland [ζ2γ2]) to fetal hemoglobin (α2γ2) and from fetal hemoglobin to adult
hemoglobin (HbA [α2β2] and HbA2 [α2δ2]) by coordinate switching of gene expression. Initial
change occurs in the first trimester of pregnancy, from embryonic hemoglobin to fetal
hemoglobin (HbF) and coincides with the transition from embryonic (yolk sac) hematopoiesis to
definitive (fetal liver). The second alteration from HbF to adult Hb (HbA and HbA2) occurs near
birth, here there is a decrease in γ-globin gene expression and a marked increase in β-globin
expression as well as of the δ-globin (Fig. 3-A) (Goonasekera et al., 2018;
Stamatoyannopoulos, 2005; Taher, Weatherall, & Cappellini, 2018).
The gene expression changes from ε-globin to γ-globin and from γ-globin to β-globin are
controlled exclusively at the transcriptional level (Stamatoyannopoulos, 2005).
β-globin expression occurs via the interaction of the LCR with TATA, CCAAT, and CACCC
boxes, which are the binding sites for transcription factors such as erythroid Kruppel-like factor
1 (KLF1) and GATA-1 (Fig. 3-B) (Goonasekera et al., 2018).
Unlike humans, most species have only one hemoglobin change in the development cycle
(from embryonic to adult). Expression of γ genes during the fetal period is a relatively recent
event that occurred during the evolution of primates (Stamatoyannopoulos, 2005).
Adult hemoglobin phenotype is generally established up to the end of the first year of life and
consists approximately in HbA (α2β2, 97%), HbA2 (α2δ2, 2%) and HbF (α2γ2, 1%)
(Goonasekera et al., 2018).
However, in some cases, γ-globin expression persists in the adults, this condition is known
as hereditary persistence of fetal hemoglobin (HPFH) (Schechter, 2008). This condition may be
due to point mutations in the upstream promoter region of the γ-globin gene or to different
deletions affecting the β-globin gene cluster. Individuals with β-thalassemia or SCD who present

Introduction
7
with concomitant HPFH have milder clinical manifestations, in contrast to the serious illness in
homozygous patients for these disorders (Ye et al., 2016).
Fig. 3 Normal developmental switches of globin expression. (A) Levels of globin expression in the
different stages of development, adapted from (Richard, Haley, & Recht, 2012). (B) Structure of the α-like
and β-like globin gene clusters are shown together with the types of hemoglobin produced at each
developmental stage, adapted from (Taher et al., 2018).
1.3 Regulation of γ-globin gene expression
A better understanding of the molecular processes of globin switching is the primary focus of
many researcher’s intents on developing therapeutic approaches for HbF induction. Regulation
of γ-globin gene expression is complex and can be influenced by different regulatory pathways,
genetic and environmental factors (Pourfarzad et al., 2013).
Multiple transcription factors involve the genetics that regulates the switch from fetal to adult
hemoglobin, these factors interact with each other and with the promoters and enhancers of the

Introduction
8
β-globin gene as well as with the epigenetic factors namely related to chromatin (Sankaran &
Orkin, 2013).
Modulation of HbF gene expression involves the interaction of multiple proteins, such as
transcription factors KLF1, BCL11A and SOX6 and hematopoietic regulatory factor MYB, as well
as other genetic elements such as GATA 1 (Wilber, Nienhuis, & Persons, 2011).
Although numerous regulators of erythropoiesis and globin gene regulation have been
identified, none of the molecules examined appeared to be a specific regulator of the exchange
of HbF to HbA. However, relatively recent information on this process has come from studies
using human genetic approaches, notably genome-wide association (GWA) studies, to find
common genetic variants associated with variations in HbF levels. Initially, these studies were
performed in healthy subjects and showed the association of variants in three genomic loci
related to 45% variation in HbF levels, the β-globin locus on chromosome 11 (the XmnI
polymorphism [rs7482144], in the γ-globin gene promoter region, which predisposes an increase
in HbF expression), a region between the HBS1L and MYB genes on chromosome 6 and a
region within the BCL11A gene on chromosome 2. These findings have been replicated in
patients with SCD and β-thalassemia, and the intensifying effect of these sites on these diseases
has also been demonstrated in several other studies (Fig. 4) (Sankaran, 2011).
Erythropoiesis expanded by stress is also another key factor described for maximal HbF
expression (Ngo & Steinberg, 2015).
Fig. 4 Summary of pathways regulating the switch from γ-globin to β-globin, adapted from (Higgs
et al., 2012). Many factors are involved in the regulation of γ-globin gene expression, but two pathways
are the most described. HBS1L-MYB pathway increases the expression of MYB a proto-oncogene whose
expression is crucial for erythropoiesis. The reduction of MYB reduces the synthesis of two nuclear
receptors (TRF2 and TRF4) that repress the γ-globins by binding to their promoters. BCL11A pathway,
that normally cooperates with other repressors (e.g., Sox6), silence the γ-globin genes, when connecting
to the β-globin locus lying between the fetal and adult genes. The expression of BCL11A is also regulated
by the transcription factor KLF1 (a β-globin gene promoter).

Introduction
9
More than three decades have passed from cloning the β-globin gene to the current
understanding of hemoglobin exchange. It is hoped that in the future progress in this field may
proceed more rapidly for the benefit of patients with β-hemoglobinopathy disorders (Sankaran,
Xu, & Orkin, 2010).
1.3.1 BCL11A
B Cell Lymphoma 11A (BCL11A) is a zinc finger protein gene, that was first associated with
lymphoid malignancies in humans. Subsequently, studies have evaluated BCL11A as a
dominant regulator of developmental globin gene silencing. The reduced expression of BCL11A
mRNA is associated with higher HbF levels. In erythroid progenitors, BCL11A physically
interacts with the NuRD chromatin remodeling complex and the erythroid transcription factors
GATA1 and FOG1. The reduction of BCL11A in cultured human erythroid progenitors leads to
robust HbF expression, consistent with the role of BCL11A as a repressor of γ-globin and as a
key regulator of HbF to HbA in humans (Sankaran et al., 2010).
These findings suggest that BCL11A or its partner proteins may serve as excellent clues to
targeted therapeutic approaches to reactivate HbF in patients with β-hemoglobinopathies,
modified the clinical features of both diseases. Negative regulation of BCL11A expression or
impairment of BCL11A function may be promising strategies (Akinsheye et al., 2011; Sankaran
et al., 2010).
1.3.2 KLF1
Krüppel-Like Factor 1 (KLF1), originally known as Erythroid krüppel-like factor (EKLF), was
initially shown to be critical for adult β-globin gene transcription and to increase the ability of the
β-globin promoter to compete with the γ-globin promoter for the enhancer function of the β-
globin, through a highly conserved CACCC motif that was known to be mutated in human β‐
thalassaemias (Ginder, 2015; Sankaran et al., 2010).
That way KLF1 was initially thought to be a specific factor that facilitates HbF to HbA
switching. However, besides regulating β‐globin expression, studies demonstrated the crucial
role of KLF1 in regulating both definitive and primitive erythropoiesis. KLF1 also functions as a
transcriptional repressor by recruiting Sin3A and HDAC1. A more direct role of KLF1 in γ-globin
gene silencing occurs through its stimulation of BCL11A expression by binding to its promoter
so, KLF1 has a dual effect switching by directly on activating β-globin gene while repressing γ-
globin gene indirectly by activating BCL11A (Ginder, 2015). Knockdown of KLF1 in adult
erythroid progenitors reactivates γ-globin gene expression by decreasing BCL11A levels and
Introduction
10
by the concentration-dependent formation of KLF1 complexes that favor binding to the γ-globin
promoter (D. Zhou, Liu, Sun, Pawlik, & Townes, 2010).
Whether these effects of KLF1 on hemoglobin gene expression are directly mediated at the
locus or are due to indirect effects on erythroid maturation remains to be determined in future
studies. The role of KLF1 as a regulator of hemoglobin switching in human cells has yet to be
assessed directly. Further studies probably will provide critical insight into the mechanisms of
hemoglobin switching in humans through KLF1 (Sankaran et al., 2010).
1.3.3 SOX6
SOX6 is another important protein involved in γ-globin gene expression that cooperates in
silencing the γ-globin gene when interacting with BCL11A, but it also plays an important role in
cell protection against apoptosis by positively regulating Bcl-xL (an anti-apoptotic protein) in the
final stages of erythropoiesis (Sankaran et al., 2010).
If the effects of erythropoietin (EPO) on stimulating Bcl-xL expression decrease, SOX6 acts
as a compensatory factor activating the BCL-xL gene, protecting the cells from apoptosis
(Mahdavi, Pourfarzad, Kosaryan, & Akbari, 2017).
1.3.4 HBS1L-MYB (HMIP)
HMIP is an intergenic region between the HBSL1 and MYB genes on long arm of
chromosome 6 (6q23), the polymorphisms in the HMIP intergenic region, distributed in 3 linkage
disequilibrium (LD) blocks (HMIP blocks 1, 2, and 3), are associated with high HbF levels among
SCD patients (Akinsheye et al., 2011).
The HMIP blocks exhibit marks of active chromatin characteristics namely the histone
acetylation and RNA polymerase II binding sites (Wilber et al., 2011).
Recent data suggest that HMIP intergenic area that is highly associated with fetal hemoglobin
expression has properties like that of a regulatory element (Wilber et al., 2011).
The most significant polymorphism in HMIP responsible for HbF modulation is a 3 bp deletion
polymorphism [SNP rs9399137], located in the HMIP 2 block, 42.6 kb upstream of HBS1L and
83.8 kb upstream of MYB, common in European and Asian populations, although less frequent
in African populations. Near this polymorphism, there is a binding of 4 erythropoiesis-related
transcription factors, TAL1, E47, GATA2, and RUNX1 (Akinsheye et al., 2011).
HBS1L is described as a housekeeping gene, while MYB has a more restrictive expression
pattern and is crucial for hematopoiesis and erythropoiesis. Studies show that high levels of
MYB inhibit γ-globin gene expression in human erythroleukemia cells and low levels are

Introduction
11
speculated to result in fewer cell cycle events at the onset of erythropoiesis and early maturation
of erythroblasts produces red blood cells that contain higher levels of HbF (Wilber et al., 2011).
MYB expression is also reduced by GATA-1, and miRNA 15a and 16-1 (Sankaran, 2011).
The increased HbF effect is mediated, at least in part, through down-modulation of MYB via
targeting of its 3′ UTR by the microRNAs (Pule, Mowla, Novitzky, & Wonkam, 2016).
It's evident that MYB plays an important role in erythropoiesis, and more recent studies
indicate that it acts in part by transactivating KLF1 expression and other repressors (e.g., nuclear
receptors TRF2/TRF4) of γ-globin genes (Akinsheye et al., 2011; Thein, 2017).
1.3.5 GATA1
GATA binding protein 1 (GATA1) is a zinc-finger transcription factor that both activates and
represses target genes containing a consensus GATA binding motif (Sankaran et al., 2010).
Binding sites with this motif are present in many positions in the erythroid-expressed genes
namely in β-globin loci. GATA1 was first discovered as a β-globin locus-binding protein and is
essential for erythroid cell maturation (Sankaran et al., 2010).
GATA1 appears to participate in hemoglobin switch by facilitating chromatin loop formation
at the β-globin sites and has been shown that GATA1 binds to a region upstream of the promoter
(required for HbF silencing) of y1-globin and y2-globin in a FOG1-dependent manner, leading
to recruitment of the repressive NuRD complex (Sankaran et al., 2010).
1.3.6 Epigenetic regulation of fetal globin gene expression
The ideal target for the treatment of β-hemoglobin disorders would be one that mimics and
boosts the effect of the genetic variants that regulate HbF levels at loci such as MYB and
BCL11A without affecting other biological pathways. However, MYB has a pleiotropic role in
hematopoiesis and BCL11A plays key roles in neuronal and B-lymphocyte development (Thein,
2013).
Thus, in addition to the role of transcription factors in regulating γ-globin expression, in recent
years there has been increasing awareness of the role of epigenetic mechanisms in gene
regulation, in particular, gene silencing (Ginder, 2015).
The term epigenetics refers to post-synthetic modifications of chromosomal DNA and histone
proteins that affect gene expression and can be inherited through somatic replication. A better
understanding of the molecular mechanisms associated with epigenetic silencing of HbF
expression may facilitate the development of more effective β-hemoglobinopathies treatments

Introduction
12
and several researchers have focused their studies on the epigenetic induction of HbF
expression in clinical and laboratory conditions (Ginder, 2015).
Proposed epigenetic mechanisms of HbF regulation include methylation, histone
deacetylation, and chromosomal looping (Sankaran et al., 2010; Stamatoyannopoulos, 2005).
In the last years, some studies have focused on microRNAs (miRNAs) a family of small non-
coding RNAs of 19–25 nucleotides that regulate the gene expression by binding sequence-
specific of mRNAs and that could lead to HbF induction (D. Costa, Capuano, Sommese, &
Napoli, 2015).
The interplay between DNA methylation and histone modifications in regulating gene
expression is well recognized (Ginder, 2015) and numerous studies have demonstrated that
DNA hypomethylation and histone acetylation are effective in inducing γ-globin expression (Im,
Grass, Christensen, Perkins, & Bresnick, 2002), these studies also suggest that DNA
methylation and histone modification are dependent and each other reinforce. Any mark seems
able to establish the other by recruiting epigenetic enzymes, resulting in a cycle that reinforces
gene silencing (Ginder, 2015).
Additionally, histone modifications within γ-globin gene promoter regions, via activation of the
MAPK signaling pathways (such as p38 MAPK) were proven to be crucial for the induction of γ-
globin gene expression (Qian, Chen, Zhao, Guo, & Qian, 2013). The ability of several drugs and
compounds presently utilized for induction of γ-globin expression and consequently promotion
of HbF levels have been associated with epigenetic mechanisms and related signaling pathways
(DeSimone, Heller, Hall, & Zwiers, 1982).
1.3.6.1 DNA methylation
DNA methylation represents the most important epigenetic mechanism of transcriptional
repression through the binding of a methyl group in the 5′ position of cytosine residues in a
cytosine-phosphate-guanosine dinucleotide (CpG) by the DNA methyltransferases (DNMTs).
Generally, genes that contain the sequences with hypermethylated CpG islands present an
inactive state, those with the hypomethylated CpG islands are in an active state. In accordance
with this theory, during the fetal life γ-globin promoter is hypo-methylated while β-globin hyper-
methylated. In contrast, in adult life, γ-globin promoter becomes hyper-methylated with low
expression of HbF while β-globin becomes hypo-methylated with an increase of HbA (D. Costa
et al., 2015).

Introduction
13
1.3.6.2 Histone acetylation/methylation
Histone modification is another epigenetic mechanism. The N-terminal tails of histones are
enriched of lysine residues that are subject to several post-transcriptional modifications including
acetylation and methylation that can influence the chromatin structure. Usually, the acetylation
of lysine residues regulated by histone acetyltransferases (HATs) promotes an open
conformation of chromatin with activation of gene expression while the deacetylation promotes
a closed conformation with repression of gene expression by histone deacetylases (HDACs) (D.
Costa et al., 2015).
Recent large scale genetic studies identified the HDAC1 and HDAC2 inhibitors as inducers
of γ-globin gene expression (Ginder, 2015).
1.3.6.3 microRNAs
The microRNAs (miRNAs) are included in the category of epigenetic regulatory mechanisms.
These small RNAs are capable of well-characterized post-transcriptional gene silencing and
have been shown to direct epigenetic modifications, by binding to transcription factors that inhibit
their action (Ginder, 2015).
Several miRNAs have been implicated in the regulation of γ-globin gene expression, like
miRNA-486-3p that is regulated during fetal to adult erythroid development (Ginder, 2015).
Enforced expression of miRNA-486-3p result in increased γ-globin gene expression, part of
this effect was attributed to the effect on the expression of BCL11A. miRNA-486-3p was shown
to bind to the BCL11A mRNA 3′UTR region and downregulate its expression concomitant with
the upregulation of γ-globin gene expression (Ginder, 2015).
Thus, the regulation of miRNA-486-3p might contributes to HbF modulation among β-
hemoglobinopathies patients (Ginder, 2015).
The miRNA-15a/16-1,miRNA-96, miRNA-221/222, miRNA-451 and miRNA-26b are also
described as might be considered important therapeutic targets for increasing HbF levels to the
treatment of SCD and β-thalassemia (D. Costa et al., 2015; Ginder, 2015).
1.3.7 Signaling pathways - p38 mitogen-activated protein kinase (p38 MAPK)
Recent evidence demonstrates the importance of the role of signaling pathways in mediating
the reactivation of drug-induced γ-globin gene expression (Pace et al., 2003).
Introduction
14
Implicit signaling pathways include those involving cyclic guanosine monophosphate (cGMP)
and cyclic adenosine monophosphate (cAMP), nitric oxide (NO), ROS and p38 MAPK (Mabaera
et al., 2008).
p38 MAPK signaling pathway has been implicated in the actions of several γ-globin
expression inducing agents (Fung et al., 2011). Studies have shown that p38 MAPK is involved
in erythroid differentiation and is necessary for hypoxia-induced erythropoiesis and
erythropoietin production (Pace et al., 2003). Hydroxyurea (the only drug approved by the FDA
for HbF induction) acts by mediating erythroid differentiation and γ-globin expression by
inhibiting ERK and activating p38 MAPK signal transduction pathways (Fung et al., 2011).
The p38 MAPK is a member of the MAPK family that is essential for the regulation of many
cellular processes, including inflammation, cell differentiation, cell cycle disruption, and
apoptosis. The cells respond to changes in the physical and chemical properties of the
environment. In response to these changes, mammalian cells activate four well-characterized
subfamilies of mitogen-activated protein kinases (MAPKs): ERK1/2, ERK5, JNKs, and p38
MAPK (Cuenda & Rousseau, 2007). Inflammatory stimuli, such as lipopolysaccharide (LPS),
tumor necrosis factor (TNF) and interleukin-1 (IL-1) are the main inducers of p38 MAPK
activation, but p38 MAPK is also activated by heat stress, osmotic shock, light ultraviolet, and
cytotoxic chemicals. All p38 MAPKs are activated by double phosphorylation of tyrosine and
threonine residues, strongly regulated by phosphatases, such as MAPK phosphatases (MKPs)
(Dörner & Lipsky, 2010).
As most of the γ-globin inducing agents described so far are cytotoxic and many activate the
cell stress signaling pathway p38 MAPK, it is possible that the activation of the p38 MAPK
pathway may be the target of new therapeutic approaches, and this and others stress-related
pathways may be the keys to understanding γ-globin expression (Mabaera et al., 2008).
Therefore, compounds that also target the same signaling pathway are of extreme interest in
the study of new γ-globin inducing agents.
1.4 Sickle cell disease
The term sickle cell disease refers to a set of hematologic disorders that have in common
the presence of sickle hemoglobin (HbS), a variant of normal adult hemoglobin (HbA) (Lettre &
Bauer, 2016).
HbS (α2βs2) is caused by a missense mutation in the β-globin gene (HBB). In the 17th
nucleotide of this gene occurs a replacement of thymine by an adenine (GTG for GAG). This
substitution results in alteration of glutamic acid to valine in sixth amino acid of the β-globin
protein, originating the synthesis of abnormal hemoglobin with altered physical and biochemical
Introduction
15
characteristics (Fig. 5) (Fard, Hosseini, Shahjahani, Salari, & Jaseb, 2013; Rees, Williams, &
Gladwin, 2010; Sankaran, 2011).
Presence of HbS under hypoxia conditions predisposes the red blood cells (RBCs) to change
from biconcave discs into a sickle shape. When deoxygenated the HbS polymerizes resulting in
a semisolid crystalline polymer structure that modifies the shape of RBCs (Lettre & Bauer, 2016;
Piel, Steinberg, & Rees, 2017; Telen, Malik, & Vercellotti, 2019). Amino acid substitution causes
a loss of negative charge and a gain in hydrophobicity in β-globin protein that foment the binding
between β1 and β2 chains of two adjacent hemoglobin molecules (Fig. 5). HbS polymerization
is proportional to the duration of hemoglobin deoxygenation, the intracellular HbS concentration
and the presence of fetal hemoglobin in the RBCs (Rees et al., 2010; Telen et al., 2019).
The severity of the illness is mainly determined by the extent and rate of HbS polymerization
(Akinsheye et al., 2011).
Sickling reaction is reversible following reoxygenation of the hemoglobin. However, repeated
cycles of polymerization damage the RBCs membrane and cytoskeleton causing the premature
destruction of cells leading to chronic hemolytic anemia (sickled RBCs have a reduced life span
between 10 to 20 days and irreversibly sickled cells can be removed within a few hours (Field &
Nathan, 2014)). Epidemiological studies suggest that several complications are associated with
an increased rate of intravascular hemolysis like the cholelithiasis, cutaneous leg ulceration,
priapism, and pulmonary hypertension (Forget & Bunn, 2013; Lobitz et al., 2018; Rees et al.,
2010). Anemia is not the primary morbidity source in patients with SCD (Ashley-Koch, Yang, &
Olney, 2000).
Sickled RBCs are rigid, increase blood viscosity and vaso-occlusion of the capillaries and
postcapillary venules, causing tissue hypoxia and consequently cell death and tissue necrosis.
The vaso-occlusion is the leading cause of morbidity. Acute episodes are characterized by vaso-
occlusive pain crises (VOC), acute chest syndrome (ACS), cerebrovascular accidents, splenic
and renal dysfunction (Field & Nathan, 2014; Forget & Bunn, 2013; Rees et al., 2010). The
acute episodes can start early as 6-9 months of age and continue throughout adulthood.
Bacterial infections are also common and extremely serious (Ware, de Montalembert, Tshilolo,
& Abboud, 2017).
Individuals heterozygous with one copy of HbS and one copy of HbA (Fig. 5) are typically
asymptomatic. A high hypoxia level is necessary for them to experiences the disease
manifestations. This condition is called sickle cell trait or HbAS. Persons with this condition have
typically 40% HbS and 56% to 58% HbA (Forget & Bunn, 2013).
Individuals homozygous have two copies of HbS variant (HbSS) inherited from both parents
(Fig. 5). This is the most common and severe form of SCD (responsible for 70% of the cases
of SCD in African origin populations) called of sickle cell anemia which leads to acute and
chronic complications (Rees et al., 2010; Ware et al., 2017).

Introduction
16
Fig. 5 Pathogenesis of sickle cell disease: Induction of sickling RBCs by polymerization of the
HbS, adapted from (Kato et al., 2018). Normal adult hemoglobin (HbA) is formed by two α-globin subunits
and two β‐globin subunits. The sickle Hb (HbS) is an HBB allele in which a thymine-to-adenine substitution
results in the replacement of glutamic acid with valine at position 6 in the mature β-globin chain.
Deoxygenated HbS can polymerize, as deoxyhemoglobin S polymerizes, the fibers align and the red cell
is distorted into an elongated banana or “sickle” shape. Individuals with one βS allele have the sickle cell
trait (HbAS), and individuals with sickle cell anemia (SCA), the most common SCD genotype, have two
βS alleles (βS/βS).
Others heterozygous genotypes can cause clinical syndrome of the disease, where HbS is
express enough to cause intracellular sickling. These genotypes possess one copy of the HbS
variant plus one other copy of Hb, such as HbS with hemoglobin C (HbSC). The third major type
of SCD occurs when HbS is inherited with the β-thalassemia allele (HbS/β0-thalassemia or
(carrier)

Introduction
17
HbS/β+-thalassemia). Ten other genotypes that cause SCD have been described, although
most are rare like HbSD or HbSOArab (Ashley-Koch et al., 2000; Rees et al., 2010; Ware et al.,
2017).
To date, five haplotypes of the HbS gene (4 African and 1 Asian) have been defined,
indicating that the HbS mutation initially occurred at least twice and possibly on different
occasions (Rees et al., 2010).
The first observation of SCD was described in 1910 by Dr. James Herrick. He observed on a
microscope "peculiar, elongated and sickle-shaped" cells in the blood of a 20 years old student
with repeated episodes of pain and hemolysis. In the next 15 years were described several
similar cases, however, only in 1945 Linus Pauling hypothesizes that the disease might originate
from an abnormality in the hemoglobin. This hypothesis was validated in 1949 and SCD was
heralded as the first "molecular disease" and with an autosomal recessive inheritance. In 1977
the genetic basis for sickle cell mutation was identified to be a missense mutation in the β-globin
gene (Field & Nathan, 2014; Frenette & Atweh, 2007; Wienert, Martyn, Funnell, Quinlan, &
Crossley, 2018). Since then, hemoglobin biophysics and the underlying genetics of SCD have
been extensively studied and have helped to understand other molecular diseases (Rees et al.,
2010).
Today is very simple to diagnose sickle cell disease, there are numerous techniques that can
identify HbS and others hemoglobins variants. However, the most common technique is still the
electrophoresis of hemoglobins where the normal hemoglobins are separated from the abnormal
ones by using an alkaline gel, isoelectric focusing, capillary electrophoresis or high-performance
liquid chromatography (Ware et al., 2017).
Currently, DNA or antibody-based tests offer more accurate diagnoses possibility (Ware et
al., 2017).
Sickle-Cell disease presents a global distribution and it is considered the most common and
severe monogenic disorder in the world (Rees et al., 2010).
The prevalence of the disease it's more prominent in malaria-endemic regions like sub-
Saharan Africa, Mediterranean, Middle East and India (Piel et al., 2017). However, due to the
human migration phenomena that occurred over the centuries, HbS allele has spread from the
high malaria regions to other non-endemic regions like western Europe and the eastern coast
of the Americas (Piel et al., 2013).
A demographic study conducted by Piel et al. (2013) presents global estimates for the annual
number of HbAS and HbSS neonates in 2010. This study states that more than 5.000.000
babies are born with sickle cell trait and more than 300.000 with sickle cell anemia.
About 64.4% of the HbAS and 75.5% of HbSS neonates were born in sub-Saharan Africa.

Introduction
18
The vast majority of SCD births (about 50%) occur in only three countries: Nigeria
(1.223.330), India (1.038.579) and Democratic Republic of the Congo (527.963) (Fig. 6) (Piel et
al., 2013).
Expected that these numbers increase in all world, with estimated births with sickle cell
anemia being to exceed 400.000 by 2050 (Piel et al., 2017).
Although the information on SCD distribution and frequency is still limited it is clear that these
are remarkably high in many tropical countries (Williams & Weatherall, 2012).
These frequencies appear to reflect a natural selection whereby SCD carriers have protection
against severe forms of malaria (Williams & Weatherall, 2012).
Fig. 6 Number of newborns (based on estimates) with sickle cell anemia in 2015, adapted from (Piel
et al., 2017)
For more than 60 years the close similarity between the geographical distribution of SCD and
malaria has been documented by several investigators and has given the first clues on possible
protection against malaria by the SCD (Williams & Weatherall, 2012). Allison confirmed this
hypothesis in 1954. He found that individuals with sickled RBCs were significantly less likely to
be infected by malaria parasites. It also demonstrated that when inoculated intravenously with
large volumes of blood infected by parasites SCD patients have a lower probability of developing
a clinical malaria infection (Allison, 1954).
Over the past 30 years, several other studies have been conducted to prove this hypothesis.
In general, these studies have shown that HbAS heterozygotes exhibit 50% protection against
uncomplicated malaria and over 80% protection against severe malaria caused by P. falciparum
(Williams & Weatherall, 2012).
HbAS was also associated with a 45% protection against malaria mortality in children
between 2 and 16 months of age in a cohort study in Kenya (Aidoo et al., 2002).

Introduction
19
All studies seem to prove the protective effect of HbAS against malaria indicating that in
endemic environments genetic factors such as HbAS may confer an additional benefit (Williams
& Weatherall, 2012).
From the above, it is clear that HbAS is associated with reliable protection against all forms
of malaria. However, the mechanism that leads to this remains speculated (Williams &
Weatherall, 2012).
Some studies have proposed different hypotheses, such as reduction of invasion and
erythrocyte growth with P. falciparum under conditions of low oxygen tension; faster eradication
of infected erythrocytes; reduced pathogenicity of infected red blood cells due to reduced
expression of PfEMP1 (Erythrocytic Protein-1 encoded by P. falciparum parasites); and better
acquisition of specific immunity against malaria (the mechanism is not only innate but also
includes an acquired immunological component) (Williams & Weatherall, 2012).
However, there is a possibility that there is no single mechanism for the protective effect of
HbAS but that the protection results from the set of all mechanisms described or from a different
one (Williams & Weatherall, 2012).
The protective effect of HbAS against malaria is apparent; however, the effect of the HbSS
homozygote is more controversial (Williams & Weatherall, 2012).
People with HbSS appear to be less susceptible than heterozygotes to the development of
malaria infections, but if they are infected are highly vulnerable to the consequences, particularly
severe anemia. Malaria is undoubtedly one of the leading causes of premature mortality in
children born with HbSS in endemic areas. The early detection of SCD associated with active
malaria prevention plays a crucial role in mortality rates (Williams & Weatherall, 2012).
Studies in Kenya and Ghana have shown that when inherited in isolation both HbS and
thalassemia are strongly protective against malaria caused by P. falciparum, but the protective
effects of each are lost when both conditions are inherited together (Williams et al., 2005).
The high frequencies described in malaria-endemic areas are not only due to natural
protective malaria selection but are also attributed to a high rate of consanguineous marriages
(among family-related), as well as improvements in public health conditions in many of these
countries (Williams & Weatherall, 2012).
1.5 Beta-thalassemia
Beta-thalassemia is characterized by reduced (β+-thalassaemia) or absent (β0-thalassaemia)
of β-globin subunits synthesis, resulting in imbalances of globins chains numbers cause
hemolysis and impair erythropoiesis (Cao & Galanello, 2010; Galenello & Origa, 2010; Higgs et
al., 2012; Taher et al., 2018; Thein, 2005).

Introduction
20
The clinical manifestations of β-thalassemia are extremely diverse, broad from severe
anemia with transfusion-dependency, where the patients inherit from both parents’ deleterious
mutations in both β-globin genes to the asymptomatic state with a mutation affecting only one
nucleotide substitutions, deletions, or insertions β-globin gene (β-thalassemia trait) (Thein,
2005).
Molecular basis of the β-thalassemias is very heterogeneous, more than 300 β-thalassemia
alleles have been described until today in the database of human hemoglobin variants and
thalassaemias (http://globin.cse.psu.edu), which that causes a vast variety of phenotypes
resulting from this allelic heterogeneity at the β-globin locus (Thein, 2017).
Most mutations are single leading to frameshift. The different mutations that act in this way
may interfere with the action of the β-globin gene at the transcriptional level, in the processing
of the primary transcript, in the translation of β-globin messenger RNA, or the post-translational
stability of the β-globin gene product. Rarely, β-thalassemia results from large gene deletion
(only a 619 bp deletion at the 3’ end of the β-globin gene is common however restricted to the
Sind and Punjab populations of India and Pakistan). Large deletions of the β-globin gene are
responsible for the emergence of some rare forms like the δβ-thalassemias, the εγδβ-
thalassemias, and the hereditary persistence of fetal hemoglobin (HPFH) syndromes (Fig. 7)
(Bunn, 1997; Forget & Bunn, 2013; Olivieri, 1999; Stamatoyannopoulos, 2005; Ware et al.,
2017).
Fig. 7 Molecular localizations and types of mutations in β-globin gene resulting in common β-
thalassemia worldwide. The β-globin gene contains three exons and two introns between codons 30
and 31 and 104 and 105, respectively. In β-thalassemia, the primary action of all the mutations is to
abolish the output of β-globin chains (β0-thalassemia) or reduce the output (β+-thalassemia). The different
mutations that act in this way may interfere with the action of the β-globin gene at the transcriptional level,
in the processing of the primary transcript, in the translation of β-globin messenger RNA, or in the post-
translational stability of the β-globin gene product. Adapted from (Goonasekera et al., 2018; Olivieri,
1999). The four most prevalent mutations in the Portuguese population are highlighted by red circles.
Adapted from (Faustino et al., 1992).

Introduction
21
The severity of β-thalassemia is related to the extent of imbalance between the α-globin/non-
α chains, result from the insufficient synthesis of β chains to partner with the α-globin chains to
generate adult hemoglobin (HBA-α2β2) (Cao & Galanello, 2010). Excess α-globin precipitate in
red-cell precursors, causing defective maturation and ineffective erythropoiesis, leading to
chronic hemolytic anemia, splenomegaly, marrow expansion (by stimulation the synthesis of
erythropoietin), bone deformities (of the skull and face) and a variety of growth and metabolic
abnormalities, hypermetabolic state, and iron accumulation (Higgs et al., 2012; Olivieri, 1999;
Schrier & Angelucci, 2005).
In β-thalassemia often occurs a compensatory increase of HbA2 (α2δ2) and HbF (α2γ2)
(Goonasekera et al., 2018).
Diagnosis of β-thalassemia can be based on hematologic and molecular genetic testing,
however, the increased presence of HbA2 (> 3.5%) associated with decreased erythrocyte
indices is the first factor in considering (S. Costa et al., 2016).
Three main forms of β-thalassemia have been described: β-thalassemia major, intermedia
and minor (Galenello & Origa, 2010; Higgs et al., 2012).
Individuals with β-thalassemia major (also known as Mediterranean anemia or Cooley’s
Anemia) usually present within the first two years of life with severe anemia, requiring regular
red blood cell (RBC) transfusions to survive (Galenello & Origa, 2010).
Patients with β-thalassemia intermedia present later in life with moderate anemia and do not
require regular transfusions. β-thalassemia intermedia comprehend a clinically and
genotypically very heterogeneous group, ranging in severity from the asymptomatic carrier state
to the severe transfusion-dependent type (Galenello & Origa, 2010). β-thalassemia intermedia
is the less common clinical phenotype (Forget & Bunn, 2013).
Both β-thalassemia major and intermedia can result from the homozygous or compound-
heterozygous inheritance of mutations in the β-globin gene (Cao & Galanello, 2010).
β-thalassemia minor (trait or carrier), which results from heterozygosity for β-thalassemia, is
clinically asymptomatic, but some subjects may have moderate microcytic-anemia (Taher et al.,
2018).
β-thalassemia syndromes can also be classified phenotypically into two groups: transfusion-
dependent thalassemias (TDTs) and non-transfusion dependent thalassemias (NTDTs)
(Cappellini et al., 2014).
When β-thalassemia is co-inherited with the structural variant hemoglobin E (HbE/β-
thalassemia) results in a clinical state closely resembling β-thalassemia major with severe
anemia and transfusion-dependency (Higgs et al., 2012; Martin & Thompson, 2013; Taher et
al., 2018; Thein, 2005). 50% of seriously affected patients with β-thalassemia have the βE/βT
genotype (Higgs et al., 2012).

Introduction
22
Other rare thalassemias like, HbC/β-thalassemia also exhibit a great range in terms of
diversity of phenotypes and spectrum of severity (Cao & Galanello, 2010; Galenello & Origa,
2010). HbS/β-thalassemia leads to a clinical condition more similar to sickle cell disease than to
thalassemia major or intermedia (Galenello & Origa, 2010).
β-thalassemias can be detected using qualitative or quantitative tests: including acid and
alkaline Hb electrophoresis, capillary electrophoresis (CE), isoelectric focusing (IEF), and high-
performance liquid chromatography (HPLC) (Goonasekera et al., 2018).
WHO estimates that about 60.000 severely β-thalassemia affected infants are born every
year and about 1.5% (80 to 90 million people) of the world’s population might be carriers,
although the actual number of patients worldwide is probably underestimated (Higgs et al.,
2012).
The annual incidence of symptomatic individuals with β-thalassemias is estimated at 1 in
100.000 throughout the world and 1 in 10.000 in the European Union (Galenello & Origa, 2010).
The epidemiology of the various clinical forms of β-thalassemia is still poorly understood,
although the disease is known to be highly prevalent in Mediterranean countries, the Middle
East, Central Asia, India, Southern China, and the Far East as well as the coast of Africa north
countries and in South America (Galenello & Origa, 2010). That is, more than 90% of people
with β-thalassemia live in low or middle-income countries, and this number is expected to
increase in the coming years as infant mortality from infectious and nutritional causes decreases
due to improved treatments and public health (Taher et al., 2018).
About 50 years ago fewer than 2% of patients with thalassemia were older than 25 years,
nowadays, that number has risen to 36% (Martin & Thompson, 2013).
There is strong evidence that the high frequency of β-thalassemia throughout the tropics
reflects an advantage of heterozygotes against Plasmodium falciparum malaria, as has already
been demonstrated in SCD (Cao & Galanello, 2010; Olivieri, 1999).
Some of the proposed mechanisms of action for malaria resistance polymorphisms involving
β-thalassemia are: faster removal of parasite-infected red blood cells; difficulties in invasion and
growth of P. falciparum parasites in the RBCs of people with β-thalassemia; reduced
pathogenicity by reducing cytoadherence or resetting (Williams & Weatherall, 2012).
Population migration and intermarriage between different ethnic groups have introduced
thalassemia in almost every country of the world (Goonasekera et al., 2018; Thein, 2005).
According to the Thalassemia International Federation (TIF), only about 200.000 patients
with thalassemia major are registered as receiving regular treatment around the world (Galenello
& Origa, 2010; Higgs et al., 2012).

Introduction
23
1.6 Treatments for β-hemoglobinopathies
Currently available treatments for β-hemoglobinopathies still very limited mostly in low-
income countries (Ware et al., 2017). There are differences in the pathophysiology of these
diseases. Vasoclusion is a feature of sickle cell disease, while iron loading is a more dominant
problem in β-thalassemia (Dreuzy et al., 2016; Matte et al., 2019). However, treatment
methodology mostly follows the same methods. Most treatments prevent or manage
complications and help people live longer. Options vary according to what symptoms a person
has and how severe their symptoms are. Health maintenance starts with early diagnosis,
preferably in the newborn period and includes penicillin prophylaxis, vaccination against
pneumococcus bacteria and folic acid supplementation (Kato et al., 2018).
At present, the only curative treatment is allogeneic bone marrow or stem cell transplantation.
However, this procedure remains risky, and histocompatible donors are identified for only a
small fraction of patients, remaining like this inaccessible for most patients (Dreuzy et al., 2016).
Most patients with severe forms of β-hemoglobinopathies have to settle for long-term is
palliative management, namely, life-long red blood cell transfusion (which does not correct
ineffective erythropoiesis and exacerbates systemic iron accumulation), iron chelation and
splenectomy (removal of the spleen) (Martin & Thompson, 2013; Schrier & Angelucci, 2005;
Ware et al., 2017).
Nowadays the two more powerful and promising strategies for the treatment of β-
hemoglobinopathies are the pharmacological reactivation of Fetal hemoglobin (a tremendous
promise to improve the clinical symptoms of sickle cell disease and β-thalassemia) and gene
therapy (still in the experimental phase) (Fig.8) (Dreuzy et al., 2016; Lettre & Bauer, 2016;
Sankaran & Orkin, 2013).
To date, few therapies have been approved by the US Food and Drug Administration,
specifically for the treatment of SCD: Hydroxyurea (a pharmacological reactivator of HbF) and
L-glutamine (an antioxidant agent) (Telen et al., 2019). Crizanlizumab and voxelotor are two
new therapies that received FDA approval recently. Crizanlizumab is a humanized monoclonal
antibody that interrupts activation and adherence of leukocytes that may be drivers of VOC.
Voxelotor is a modulator and stabilizer of HbS that may improve oxygen-binding ability, prevent
polymerization, and subsequent RBC sickling and damage (Cieri-Hutcherson, Hutcherson,
Conway-Habes, Burns, & White, 2019).
Studies are also currently directed to anti-sickle cell agents, anti-adhesion agents, ischemia-
reperfusion and oxidative stress modulators, agents that combat free hemoglobin, anti-
inflammatory agents, antithrombotic agents and antiplatelet agents for the treatment of SCD
(Matte et al., 2019; Telen et al., 2019).

Introduction
24
Fig. 8 Current and future therapies for β-hemoglobinopathies, adapted from (Dreuzy et al., 2016).
Top left: Conventional therapy that includes regular red blood cell transfusions and iron chelation. Bottom
left: γ-globin chain inducers. Bottom right: Allogeneic transplantation with related or unrelated donor cells
from cord blood units or bone marrow. Top right: Gene therapy a promising single-dose therapy.
1.6.1 Stem cell transplantation
Hematopoietic stem cell transplantation (HSCT) derived from bone marrow, or other sources
(e. g. cord blood stem cells) currently offers the only hope of a definitive cure in patients with β-
hemoglobinopathies (Dreuzy et al., 2016).
HSCT is a total hematopoietic cell replacement therapy that eliminates ineffective
erythropoiesis and enables the body to produce new effective erythropoiesis (Dreuzy et al.,
2016).
One of the main barriers to HSCT with cells from HLA identical siblings is the limited number
of donors (Dreuzy et al., 2016), only 10-20% of patients have sibling donors, and many concerns

Introduction
25
remain about transplant-related mortality and long-term toxicities (Galenello & Origa, 2010;
Ware et al., 2017).
The positive outcome of treatment is influenced by the patient's pre-transplant clinical
conditions, specifically the presence of hepatomegaly, the extent of hepatic fibrosis, and the
magnitude of iron accumulation (Dreuzy et al., 2016). Children usually do not have the above
risk factors, so disease-free survival is greater than 90% after transplantation. Individuals with
all three risk factors have a reported survival rate of approximately 60%. Chronic graft versus
host disease can occur in 5-8% of transplant patients (Cao & Galanello, 2010).
Bone marrow transplantation from unrelated donors has been performed in a limited number
of individuals. However, as long as donor selection is based on strict HLA compatibility criteria
and individuals have no iron overload, the results are similar to those obtained when the donor
is a compatible sibling (Cao & Galanello, 2010; Galenello & Origa, 2010; Olivieri, 1999).
Hematopoietic stem cell transplantation is now widely applied with disease-free survival of
over 80% with HLA-compatible sibling donor transplants (HLA-A, B, C, eDRB1 and DQB1)
(Dreuzy et al., 2016; Taher et al., 2018).
The HSCT was successfully performed for the first time for the treatment of thalassemia 30
years ago by the Pesaro Group in Italy (Dreuzy et al., 2016; Martin & Thompson, 2013). Between
1981 and 2003, over 1.000 consecutive patients aged 1 to 35 years were transplanted in Pesaro.
The Kaplan Meier probability >20 years of thalassemia-free survival was 68% (Schrier &
Angelucci, 2005).
Concerning sickle cell disease, stem cell transplantation in adults allowed to report 87% of
event-free survival (Ware et al., 2017).
1.6.2 Blood transfusion therapy
The main treatment for severe forms of β-hemoglobinopathies remains red blood cell
transfusion, where transfusions begin before 1 year of age in β-thalassemia major and 90% of
SCD patients receive at least one transfusion during their lifetime (Martin & Thompson, 2013;
Ware et al., 2017).
The decision to initiate a transfusion regimen is based on clinical evaluation, notably on the
impact of chronic anemia on the patient's life. Factors such as impaired growth, bone
deformities, and fatigue are taken into consideration (Martin & Thompson, 2013; Olivieri, 1999).
Transfusions bring as immediate benefit the increased capacity of oxygen transport
(increasing the hemoglobin level to 9-12 g/dl) and improvement of blood volume and flow. It
allows normal growth and development and prevents congestive heart failure, severe bone
deformities, and endocrinopathies (Schrier & Angelucci, 2005; Taher et al., 2018).

Introduction
26
Despite proven benefits, transfusions have complications that may limit long-term use,
regularly transfused patients develop hemosiderosis (patients receiving 2 to 4 blood units/month
have an iron accumulation of 0.3 to 0.6 mg/kg per day) with deposition of parenchymal iron and
may suffer fatal complications. Iron chelation by oral or parenteral drug administration is
therefore essential in these cases to prevent accumulation in the various organs (Galenello &
Origa, 2010; Martin & Thompson, 2013; Olivieri, 1999; Schrier & Angelucci, 2005; Taher et al.,
2018; Ware et al., 2017).
Recurrent transfusions expose the patient to many samples of foreign blood, thus also
increasing the risk of red blood cell alloimmunization and infection (Ware et al., 2017).
Access to blood for transfusion therapy remains a challenge in resource-poor countries and
represents a substantial for public health burden (Taher et al., 2018).
1.6.3 Gene therapy
One of the most promising therapeutic strategies for the treatment of β-hemoglobinopathies
is to attempt to correct the mutated β-globin gene (Telen et al., 2019).
β-thalassemia may have several genetic causes with more than 300 different mutations,
while a single genetic mutation causes SCD. Repairing the disease-causing mutation in the β-
globin gene is an attractive strategy that could be applied to all patients with SCD (Wienert et
al., 2018), although it is a challenge to predict the correction of all the hundreds of mutations
that cause β-thalassemia. Stopping factors that silence γ-globin genes, such as BCL11A, may
allow more immediate treatment of β-thalassemia (Taher et al., 2018).
The concept of gene therapy involves the expression of a normal β-globin replacement gene
using a virus-introduced expression vector. Hematopoietic stem cells from a patient with β-
hemoglobinopathies are isolated and then incubated (ex vivo) with the virus containing the
additional gene. Following treatment with myeloablative chemotherapy, the patient receives
reinfusion of the modified autologous stem cells, which repopulate the marrow and express the
new gene (Ware et al., 2017).
Gene therapy is still at an early stage of development, but clinical trials have provided
evidence of sustained clinical efficacy. The most promising results were obtained with lentiviral
vectors (Dreuzy et al., 2016).
Gene therapy was included as a viable plan for the treatment of hemoglobinopathies in 1978
at the University of California, Los Angeles. However, it took more than 25 years to achieve
these goals, which were only possible by characterizing the regulatory elements of the β-globin
locus and the advent of lentiviral vectors, which can transfer complex sequences to
hematopoietic stem cells (Dreuzy et al., 2016).

Introduction
27
Lentivirus-mediated gene transfer can correct hematological defects and organ damage in
mice with sickle cell disease, and a clinical trial has been started in France (Rees et al., 2010).
The first clinical trial using a lentiviral β-globin construct to treat patients with β-thalassemia
was started in 2007. Two patients received gene therapy. The second patient had a hemoglobin
concentration of 90 to 100 g/L, due to the predicted increase in β-globin expression and also
due to an unexplained rise in fetal hemoglobin, remaining well and not transfusion dependent
for almost two years. However, a detailed analysis showed that the viral vector integrated with
a proto-oncogene, which could be a precursor of a leukemic transformation, as previously seen
in retrovirus gene therapy studies (Higgs et al., 2012).
A lentivirus vector containing HS2, 3, and 4 of LCR associated with a β-globin gene led to
partial correction of anemia in a β-thalassemia mouse. As for the alternative approach, in a
mouse model with sickle cell anemia, it was possible to correct the molecular defect by
homologous recombination by transfecting the embryonic stem cells of the affected mice with a
DNA fragment containing the normal β-globin gene. Hematopoietic stem cells, derived from ex
vivo corrected embryonic stem cells, could produce HbA and HbS, leading to a phenotype
similar to the human sickle cell trait. Similar experiments demonstrate the possibility of a cure
for hemoglobinopathies by homologous recombination in embryonic stem cells (Cao &
Galanello, 2010).
However, there are still many remaining problems that include identifying all sequences
necessary for stable, high-level gene expression and the development of safer and more
effective vectors (Olivieri, 1999). Further studies on new non-viral method technologies for the
introduction of the therapeutic gene into stem cells that can help standardize gene therapies
and make them more available and safer are also crucial (Cavazzana & Mavilio, 2018).
Instead of gene therapy, recent approaches have been developed to directly correct genetic
mutations in the cell's endogenous DNA or to disrupt specific DNA sequences in the genome.
This approach is known as genome editing and has been facilitated by the identification of
several enzymes, including CRISPR/Cas9, that can introduce DNA breaks into specific regions
of the genome (Taher et al., 2018). At this moment on clinicaltrials.gov there is information from
three clinical trials for the treatment of β-thalassemia using CRISPR/Cas9 technology. The
European Medicines Agency (EMA) approved in June 2019 a first gene therapy for β-
thalassemia, an orphan drug ZYNTEGLO™ (autologous CD34+ cells encoding βA-T87Q-globin
gene), previously known as LentiGlobin, for patients 12 years and older with TDT who do not
have a β0/β0 genotype. Developer Bluebird Bio, Inc. has priced the therapy at €1.58 million
($1.8 million) (Stanton, 2019).
The imminent explosion of gene therapies raises many accessibility issues for all health
systems, not just for low-income countries, the practical challenges of bringing these therapies
to patients who need them are not just a hypothetical issue for global health (F. Xu & Guo, 2018),

Introduction
28
these approaches will not be at the forefront of treatment options for some time, mainly as their
technical demands and cost may limit their application in countries with the highest numbers of
people with β-hemoglobinopathies (Telen et al., 2019).
1.6.4 Reactivation of fetal hemoglobin
In 1948, Janet Watson found that newborns had no sickle cell disease complications until
they were about six months old, predicting that red blood cells in sickle cell infants are relatively
protected from sickle cell disease compared with adults or older babies with the disease. These
infants were few symptoms and that their deoxygenated erythrocytes took longer to sickle and
did not deform as extensively. It was first hypothesized that this protection in infants would be
due to the high concentration of fetal hemoglobin (Akinsheye et al., 2011).
A few years later, reports of asymptomatic SCD patients who co-inherited a hereditary
persistence of the fetal hemoglobin (HPFH) phenotype were described. HPFH is typically
caused by large deletions in the β-globin gene or by point mutations in the promoters of the γ-
globin genes and is characterized by high lifetime fetal hemoglobin concentrations (Lettre &
Bauer, 2016).
More recently, some sickle cell populations in Saudi Arabia and India have been noted to
have higher concentrations of fetal hemoglobin and a milder form of sickle cell disease than
patients of African descent. Several studies have reported that these populations have a
relatively low prevalence and late-onset of many of the complications attributed to high fetal
hemoglobin production in adulthood (Lettre & Bauer, 2016).
Such evidence led to the initial hypothesis that HbF would have a potentiating effect on SCD
and, therefore, in recent decades, several studies based on epidemiological, clinical and
laboratory observations have attempted to identify an effective way to induce HbF synthesis as
a potential therapy to the SCD (Sankaran & Orkin, 2013).
In relation to β-thalassemia, increasing synthesis of γ-globin chains compensates for the
deficit of β-globin by improving the imbalance between α and non-α globin chains. The γ chains
combine with the excess of unmatched accumulative of α-globin chains. The combination
produces useful hemoglobin (HbF), but more importantly, reduces the burden of α chains that
produce most of the pathophysiology associated with β-thalassemia (Akinsheye et al., 2011;
Dreuzy et al., 2016).
Several compounds have been tested, including cytotoxic compounds and epigenetic
regulators (Akinsheye et al., 2011).
The first drug that was shown to increase γ-globin expression was 5-azacytidine via
epigenetic silencing. It has also been shown that small chain fatty acid derivatives increase the
expression of γ-globin, by inhibiting histone deacetylation. Erythropoietin (EPO) is also

Introduction
29
described as a potentiality for its proliferative and anti-apoptotic properties (Sankaran & Orkin,
2013).
HU is the only drug currently approved for inducing HbF in SCD. It works through multiple
mechanisms, but its cytotoxic activity is believed to accelerate the differentiation process and
stimulate cell stress response pathways, leading to a general increase in HbF numbers (Dreuzy
et al., 2016).
Currently, the new targets for HbF induction strategies are transcriptional γ-globin repressors
such as BCL11A, MYB, KLF1 and additional repressors belonging to the same family. As well
as regulators like Mi2β, which binds directly and regulates the KLF1 and BCL11A genes, making
these promising genes targets for HbF inducing therapy. Although there is currently no therapy
to target these molecules or related pathways, further work motivated by the findings already
reported may lead to the discovery of promising candidates for clinical HbF inducers in the near
future (Finotti et al., 2016).
1.6.4.1 DNMT Inhibitors: 5-azacytidine and decitabine
5-azacytidine is an antineoplastic drug that inhibits maintenance methylation of DNA (adult
β-globin genes are hypomethylated and the non-transcribed fetal γ-globin genes are
hypermethylated in adult life), caused a marked increase in HbF. These results prompted clinical
trials that demonstrated a significant, albeit less dramatic, induction of HbF production in patients
with sickle cell disease and β-thalassemia. In spite of those promising results, this drug was
never tested in large-scale clinical trials as a result of considerations concerning potential
carcinogenicity (Bunn, 1997; Frenette & Atweh, 2007).
Decitabine (5-aza-2’-deoxycytidine) is an analog of 5-azacytidine that does not incorporate
into RNA, with a safer side effect profile (Cappellini et al., 2014), resulting in a renewed interest
in the use of DNA hypomethylation therapy for the induction of HbF production. In recent clinical
trials in patients with SCD, treatment with decitabine resulted in significant increases in the
synthesis of HbF (Frenette & Atweh, 2007). In patients with β-thalassemia, in a single pilot study,
subcutaneous decitabine given at 0.2 mg/kg two times per week for 12 weeks increased total
hemoglobin from 78.8 to 90.4 g/l and absolute fetal hemoglobin from 36.4 to 42.9 g/l in five
patients (Cappellini et al., 2014).
The increase of HbF with decitabine was associated with significant improvement in several
factors that are important in the pathophysiology of SCD and β-thalassemia’s: as the RBC
adhesion, endothelial damage, and activation of the coagulation pathway. However, larger and
longer-term studies are needed to confirm the efficacy and safety of decitabine in the treatment
of SCD and its effectiveness in β-thalassemia (Frenette & Atweh, 2007).

Introduction
30
1.6.4.2 HDAC Inhibitor: butyrate
Observations that infants of diabetic mothers had a more delayed switch from fetal to adult
hemoglobin led to the hypothesis that short-chain fatty acids could act as inducers of HbF
(Cappellini et al., 2014).
Butyrate is a short-chain fatty acid that inhibits histone deacetylase (HDAC). It has been
shown to stimulate embryonic and fetal globin gene expression in chickens, mice, and baboons.
When it was administered intravenously to patients with SCD, it resulted in sustained induction
of HbF production in the majority, however, a pulsed, or intermittent, dosing regimen was
necessary to avoid cytotoxicity (Akinsheye et al., 2011; Frenette & Atweh, 2007).
In β-thalassemia patients, an initial study involving a 2-3-week butyrate infusion (at a dose of
500 mg/kg/day) in three β-thalassemia patients showed a decrease in globin chain imbalance.
However, a follow-up study extending this therapy to 13 weeks at a dose of 2000 mg/kg/day for
six days a week failed to achieve a primary hematological outcome of a rise in hemoglobin
(Cappellini et al., 2014).
Despite the considerable promise of this agent in the treatment of SCD, the difficulty of
administering large volumes of this drug through venous catheters presents a major therapeutic
challenge. The full potential of butyrate is unlikely to be realized until an oral compound that has
the same efficacy as butyrate is identified (Dreuzy et al., 2016; Frenette & Atweh, 2007).
1.6.4.3 Erythropoietin
Administration of pharmacological amounts of erythropoietin has been shown to cause a
reversal of fetal programming in the maturation of erythroid precursors, which involves an
increase in γ-globin synthesis (Schrier & Angelucci, 2005).
Some studies have demonstrated this benefit in patients with β-thalassemia. The
combination of HU and erythropoietin has been shown to be associated with higher increases
in total hemoglobin levels than HU alone (17 g/l versus 2 g/l after 6 months of therapy) in patients
with intermediate β-thalassemia. Limited further studies of these combined therapies have been
performed (Cappellini et al., 2014).
1.6.4.4 Hydroxyurea
Hydroxyurea (HU), alternatively known in some countries as Hydroxycarbamide, is the only
HbF inducer drug approved by the US FDA in 1998 and by the European Medicines Agency
(EMA) in 2007 for the treatment adults with SCD, and its use has led to a reduction of

Introduction
31
complications of SCD in adults, children and even infants, as well as prolonged survival (Kato
et al., 2018; Telen et al., 2019).
HU is a cytotoxic, antimetabolic, and an antineoplastic agent is known for its use in the
management of patients with myeloproliferative disorders (myeloid tumors) and human
immunodeficiency virus infection, where the drug acts as a potent inhibitor of ribonucleotide
reductase, an enzyme required for DNA synthesis and repair (Musallam, Taher, Cappellini, &
Sankaran, 2013). In addition to all these physiological effects, HU increases HbF expression by
inducing the γ-globin gene and reduce the expression of β-globin gene (in most individuals with
SCD), which decreases the total leukocyte count and prevents their activation and thereby
reduces the incidence of vaso-occlusive crises. HU thus reduces the number of hospitalizations
and mortality with an excellent safety profile, although some patients do not have a beneficial
response, usually due to limitations of treatment adherence, but also for pharmacogenomic
reasons (Kato et al., 2018).
Fig. 9 Multiple effects of hydroxyurea administration in sickle cell disease patients, adapted from
(Verma, Lakkakula, & Lakkakula, 2018). HU has been used for the treatment of SCD for some years. The
main justification behind its use is its ability to induce HbF. Several lines of evidence suggest that HU
induces HbF induction and offers clinical benefits to patients with SCD through a wide range of possible
mechanisms, with reported cellular and vascular effects.
Studies in SCD show a multiple action of HU, which increases HbF production, resulting in
late HbS polymerization, reducing hemolysis and increasing nitric oxide (NO) availability for
cyclic guanosine monophosphate (cGMP) production, modulating endothelial activation and
Introduction
32
reducing neutrophil count, contributing to the reduction of chronic inflammation (Fig. 9) (Matte
et al., 2019).
That way, HU interrupts SCD pathophysiology, the higher induction of HbF correlates
continuously with less renal damage, less pulmonary hypertension, fewer strokes, and longer
survival (Lavelle, Engel, & Saunthararajah, 2018).
HU is also widely used for β-thalassemia though the results are not been as consistent as in
SCD. A number of studies have shown a clear benefit from the use of this agent in some
patients, includes a decreased need for transfusion, an increase in hemoglobin levels (1-3 g/dl),
decreased markers of ineffective erythropoiesis, and decreased morbidities (Cappellini et al.,
2014; Schrier & Angelucci, 2005).
The exact mechanism by which HU increases HbF is unclear, however, its cytotoxic activity
is believed to accelerate the differentiation process and stimulate cell stress response pathways,
leading to an overall increase in F cell numbers (Dreuzy et al., 2016).
These response pathways include rapid erythroid regeneration, increased erythropoietin
(EPO) production, apoptosis, NO production, increased guanylate cyclase and SAR1 (a
guanosine triphosphate binding protein) activity, and via p38 MAPK (Pourfarzad et al., 2013).
It was demonstrated that HU increases the total intracellular hemoglobin in the human K562
erythroleukemia cell line and preferentially increases the γ-globin mRNA levels in these cells. In
two-phase mixed cultures of peripheral blood erythroid progenitor cells from normal donors, HU
significantly increases γ-globin and HbF mRNA levels and also has a comparatively small
stimulating effect on β-globin mRNA expression (Cokic et al., 2003).
Although HU has not been identified as a hypomethylating agent, an early study suggested
an association between HU exposure and decreased methylation within the γ-globin gene
accompanies increased in the expression of the gene (Platt et al., 1984). However, the
cytotoxicity, the potential carcinogenicity and the moderate effects obtained after the
administration of these agents have limited their clinical use (Cui & Engel, 2017).
HU does not improve HbF production in all patients, about half of patients do not improve
with this treatment, which requires regular monitoring of blood counts with intolerable side
effects observed in some patients (Field & Nathan, 2014; Saunthararajah, Lavelle, & DeSimone,
2004).
Myelosuppression is the most common and known side effect. Among the cutaneous effects
were observed: hyperpigmentation of nails, palms, and soles, besides the development of ulcers
in the lower limbs in patients with myeloproliferative syndromes. Nausea and gastrointestinal
symptoms have been associated with the use of HU. It should be borne in mind that due to renal
excretion, dose reduction is required in patients with renal impairment. To date is described a
low risk of developing cancer associated with HU. However, In vitro studies have indicated that
HU can induce mutations and chromosome instability and due to the concerns about the long-

Introduction
33
term administration of an antitumor drug in patients with a nonmalignant congenital disorder,
there is considerable interest in identifying safe alternatives to induce HbF production, which
has spurred the search for new compounds (Figueiredo, 2007; Saunthararajah et al., 2004).
1.6.4.5 Natural inducers of fetal hemoglobin
Several inducers of HbF were tested in clinical trials, but only HU received FDA approval,
and the effects of this therapeutic approach have stimulated the interest in identifying further
molecules capable of inducing HbF (Feriotto et al., 2018).
Vegetables are used largely in traditional medicine and represented a natural reservoir for
future therapeutic drugs (Feriotto et al., 2018). Recently, many efforts have been focused on
natural strategies for the treatment of β-hemoglobinopathies. Hoping that natural inducers can
increase the level of HbF and can also reduce iron overload, but most important of all: to make
them available to all populations (Kukreja, Wadhwa, & Tiwari, 2013).
Induction of HbF using natural agents is an effective approach already described in some
studies. Various natural agents like Angelicin, Rapamycin, Bergamot, Fructus trichosanthis,
Romidepsin, Wheat grass, Curcuma comosa, Astragalus, Apicidin, Curcuminoid, Piceatannol,
and Resveratrol (Fig.10) have been reported to induce HbF level. However, more research is
still needed in their biological activity. There is a need to find out the most promising natural
therapeutic agent which could effectively induce HbF production and reduce iron overload,
thereby improving the life span of diseased patients. More data are needed on the bioavailability
of these natural compounds and their effects on humans (Kukreja et al., 2013).
Fig. 10 Natural inducers of fetal hemoglobin already reported, adapted from (Kukreja et al., 2013)

Introduction
34
1.6.4.6 Potential new natural inducers of fetal hemoglobin
1.6.4.6.1 Genistein
Genistein (chemically known as 4', 5, 7-trihydroxyisoflavone) is a non-steroidal polyphenol
and is the major soy isoflavones, described with multiple beneficial effects including anti-
inflammatory, anti-oxidative, and protective properties (Mirahmadi et al., 2017; Yang, Kulkarni,
Zhu, & Hu, 2012).
Its many biological activities have made it a target for the many studies published in recent
years. Most of these studies have focused on the pharmacological activities of GN as a tyrosine
kinase inhibitor, its chemoprotection activities against cancers and cardiovascular disease, and
its phytoestrogen activity (Dixon & Ferreira, 2002).
GN is structurally similar to estrogen 17β-estradiol, particularly the phenolic ring and the
distance between its 4'- and 7'- hydroxyl groups (Fig. 11). This feature confers ability to bind
estrogen receptors and sex hormone-binding proteins, GN can thus exert both estrogenic and
antiestrogenic activity, the latter by competing for receptor binding by estradiol (Dixon & Ferreira,
2002) The binding affinity of GN for estrogen receptor α is 4% and for the estrogen receptor β
is 87% (Nagaraju et al., 2013).
Fig. 11 The generic structure of 17β-estradiol and genistein. (Nagaraju et al., 2013). Genistein it was
shown to possess a structural similarity with estrogen. Two benzene rings, linked through a heterocyclic
pyran ring, form the basis of its flavone nucleus. The C4 and C7 phenols of genistein are structurally and
functionally similar to the active -OH groups on 17b-estradiol.
GN modulates many nuclear events, including G2/M cell cycle arrest, inhibits several
adenosine triphosphates (ATP) binding enzymes in vitro, such as protein tyrosine kinases (PTK)
(Frey & Singletary, 2003).
GN has also been reported has a capacity to influence various cell-signaling pathways such
as mitogen-activated protein kinase (MAPK) superfamily that is composed of several signaling
pathways involved in growth regulation, GN rapidly and strongly activates p38 MAPK pathway
and inactivates the ERK1/ERK2. These data suggest that the interaction between the p38
Introduction
35
pathway and the G2 cell cycle checkpoint control may provide information on the possible
mechanisms by which this isoflavone may inhibit early events in carcinogenesis (Frey &
Singletary, 2003), and make it a good candidate as a chemopreventive agent, namely in breast
and prostate cancers (Dixon & Ferreira, 2002; Yang et al., 2012).
GN has been shown to play an important role in epigenetic modulation of the transcription of
genes involved in various stages of carcinogenesis. In prostate cancer GN has been shown to
alter chromatin configuration by increasing the acetylation of the H3 and H4 histones around the
p21 and p16 transcription sites, thereby upregulating the expression in the cancer cells. GN also
inhibits DNA methyltransferase (DNMT), leading to demethylation of CpG islands in the
promoter regions and causing reactivation of important tumor suppressor genes, such as beta
retinoic acid beta receptor (RAR-beta), p16 and O6-methylguanine methyltransferase in
squamous cancer of the esophagus and prostate (Nagaraju et al., 2013).
High intake of GN in the diet is described as having major health-promoting benefits, such as
antidiabetic, hepatoprotective, renoprotective, neuroprotective, and anti-inflammatory effects,
and improved learning and memory under various conditions (Mirahmadi et al., 2017).
Take in to account the presented results we consider that GN can be a candidate for new
natural inducers of fetal hemoglobin
1.6.4.6.2 Epigallocatechin-3-gallate
Green tea (Camellia sinensis) has been widely consumed (is next to the water in habitual
consumption) for more than 4000 years, and its medicinal applications associated with many
benefits have been actively studied with scientific methods in the last decades (Yamashita et
al., 2014; Q. Zhou et al., 2002).
(−)-epicatechin-3-gallate (EGCG) (Fig. 12) a polyphenolic compound is the major catechins
in green tea and accounting for 50–80% of a cup of green tea (Philips, Coyle, Morrisroe,
Chanchellor, & Yoshimura, 2009; Thichanpiang & Wongprasert, 2015).
EGCG is described as a powerful antioxidant, that prevents oxidative damage in healthy cells,
but also as an antiangiogenic and antitumor agent and as a modulator of tumor cell response to
chemotherapy (B. Singh, Shankar, & Srivastava, 2011).
Various clinical studies have revealed that treatment by EGCG inhibits tumor incidence and
multiplicity in different organ sites such as liver, stomach, skin, lung, mammary gland and colon,
and its effect on slowing the onset and progress of common chronic diseases such as
cardiovascular disease (possibly via their anti-inflammatory effects) is also reported (Shukla,
2007).
In vitro and in animal models studies have demonstrated that EGCG blocks carcinogenesis
by affecting a wide array of signal transduction pathways including JAK/STAT, MAPK,

Introduction
36
PI3K/AKT, Wnt and Notch (Hussain, & Ashafaq, 2018). EGCG triggers p38 MAPK signaling
pathway (Shu et al., 2018) as HU (Chou et al., 2015).
Fig. 12 Structure of Epigallocatechin-3-gallate, adapted from (B. Singh et al., 2011).
EGCG also stimulates telomere fragmentation through inhibiting telomerase activity. Recent
studies also demonstrated that EGCG acts as an epigenetic agent by reducing DNMTs,
proteases, and Dihydrofolate reductase (DHFR) activities, which would affect transcription of
tumor-suppressor genes (TSGs) and protein synthesis (B. Singh et al., 2011).
Another mechanism associated with catechins is the potential to induce beneficial gene
expression profiles (Muzolf-Panek et al., 2008).
EGCG thus has great potential in preventing various pathologies because it is clearly
palatable, inexpensive and widely available, and tea exhibits little or no toxic effects in normal,
healthy cells (Baek et al., 2004).
However, the high concentration of catechins employed in most studies might not be relevant
to those obtained by tea drinkers (Baek et al., 2004).
At present, medical specialty proof of the protecting result of tea consumption against the
event of human cancers isn't conclusive. This might be attributed to variables associated with
individual variations in tea preparation and consumption patterns and seasonal and geographic
variations in tea production (Chow et al., 2003).
Take in to account the presented results we consider that EGCG can be a candidate for new
natural inducers of fetal hemoglobin.
1.7 K562 cell line
K562 cell line is a transformed human erythroleukemic cell line isolated from a 53-year-old
patient with chronic myelogenous leukemia (CML) in 1975 by Lozzio & Lozzio and is positive for
the oncogenic Bcr-Abl fusion gene (ATCC, 2016).

Introduction
37
Erythroleukaemic cell lines have been used to study blood for decades due to their unlimited
differentiation potential, and therefore the ease with which they can be obtained and cultured
(Diepstraten & Hart, 2019).
K562 cells share phenotypical characteristics of embryonic erythroid progenitors and have
the potential to differentiate into cells from the erythroid, macrophage and megakaryocytic
lineages, and as a human cell line no require genetic modification to study the human globin
locus (Diepstraten & Hart, 2019).
Erythroid differentiation of K562 cells is associated with an increase of expression of
embryonic-fetal globin genes, such as the ζ‐, ε‐ and γ‐globin genes (Bianchi et al., 2001).
A number of agents have been shown to activate or suppress globin genes expression in
these cells (Fathallah, Portnoy, & Atweh, 2008). Published observations demonstrate that
hormones, cytotoxic agents (hydroxyurea), and agents associated with epigenetic mechanisms
(butyrate, 5‐azacytidine and decitabine) are capable of inducing HbF levels (γ-globin mRNA
accumulation) in K562 cells (Bianchi et al., 2001; Fathallah, Weinberg, Galperin, Sutton, &
Atweh, 2007).
That makes the K562 line a popular choice to study the molecular activators of fetal
hemoglobin expression which is of the fundamental importance for the understanding of disease
mechanisms such as β-thalassemia and sickle cell anemia (Diepstraten & Hart, 2019).
K562 cells contain two different β-globin alleles, both inactive or poorly transcribed during the
erythroid differentiation of these cells (Fordis, Anagnou, Dean, Nienhuis, & Schechter, 1984).
Studies of the epigenetic configuration of the β-globin cluster suggest that DNA methylation
and histones acetylation are important for the regulation of developmental stage-specific
expression of the β-like globin genes. The augmenting fetal hemoglobin levels in the K562 cell
line can be associated with increased histone acetylation and decreased DNA methylation of
the γ-globin genes, with opposite changes in the β-globin gene (Fathallah et al., 2008, 2007).
K562 cells have CpG sites at β-globin promoter hypermethylated. This effect can be changed
after exposure to epigenetic compounds (X. F. Li et al., 2012).
The methylation level at the γ-globin promoters is very low in K562 cells (< 5%) and your
expression has been demonstrated to be inversely correlated with the methylation level at the
promoter (Y. Li et al., 2013). There existed several binding sites for transcription factors in the
γ-globin promoter and these findings suggested that γ-globin promoter with hypomethylation
might become accessible to these transcription factors (X. F. Li et al., 2012).
The levels of acetylation of histone H3 at the β-globin cluster correlate with the level of
expression of the different genes of that cluster in the embryonic-fetal environment of K562 cells.
In other words, the high level of histone H3 acetylation at the promoters of the embryonic ε- and
fetal γ-globin genes is consistent with the high-level expression of these genes in K562 cells.
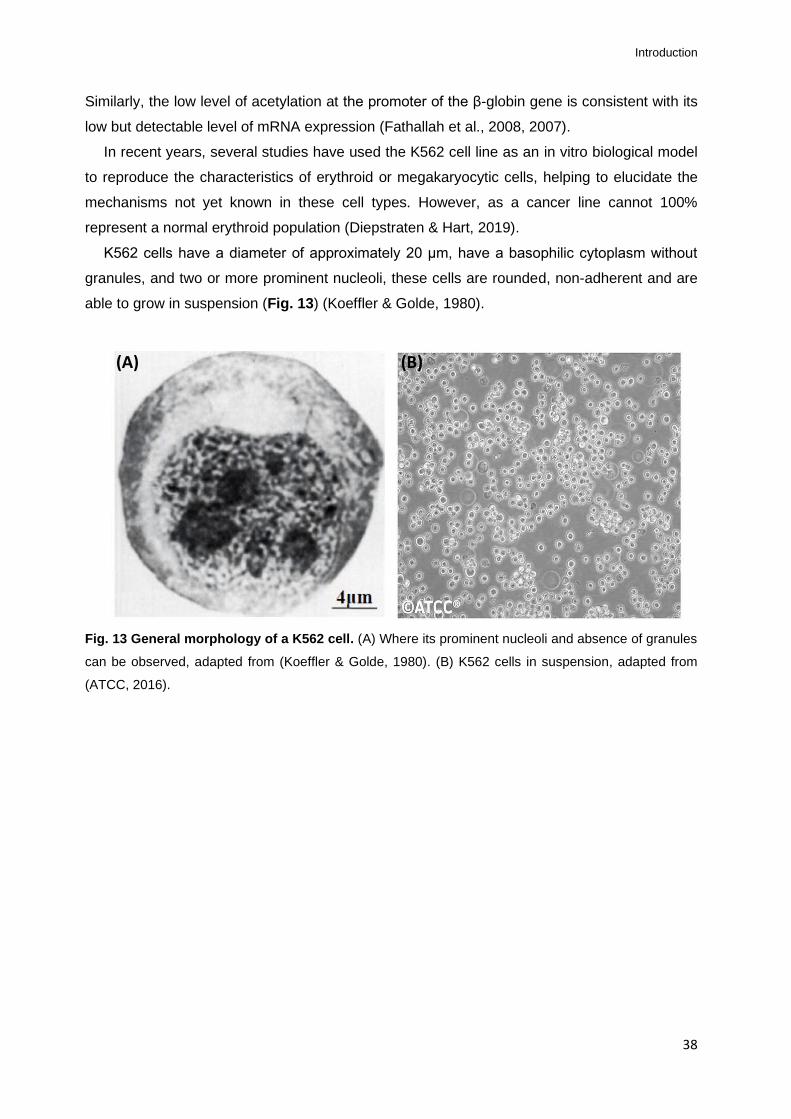
Introduction
38
Similarly, the low level of acetylation at the promoter of the β-globin gene is consistent with its
low but detectable level of mRNA expression (Fathallah et al., 2008, 2007).
In recent years, several studies have used the K562 cell line as an in vitro biological model
to reproduce the characteristics of erythroid or megakaryocytic cells, helping to elucidate the
mechanisms not yet known in these cell types. However, as a cancer line cannot 100%
represent a normal erythroid population (Diepstraten & Hart, 2019).
K562 cells have a diameter of approximately 20 μm, have a basophilic cytoplasm without
granules, and two or more prominent nucleoli, these cells are rounded, non-adherent and are
able to grow in suspension (Fig. 13) (Koeffler & Golde, 1980).
Fig. 13 General morphology of a K562 cell. (A) Where its prominent nucleoli and absence of granules
can be observed, adapted from (Koeffler & Golde, 1980). (B) K562 cells in suspension, adapted from
(ATCC, 2016).
(A) (B)

39
Chapter 2: Objectives

Objectives
40
2.1 Study potential, specific aims and expected outcomes
Research in the area of the hemoglobinopathies aims to develop curative therapies that
correct the pathogenic mechanisms underlying the disease. One approach to achieve this goal
is to look for new pharmacological agents that have HbF inducing properties (Mabaera et al.,
2008).
To date, over fifty HbF inducing compounds have been described in various experimental
systems, however, the exact mechanism of action of most of these remains elusive. Currently,
only HU is in clinical use, not showing positive results in all patients and often not available in
the most prevalent areas (Mabaera et al., 2008).
These considerations suggest that the most direct route for identifying new HbF inducing
compounds is to understand/identify which specific molecular targets that we intend to study
in relation to the mechanisms that act on cellular decisions that regulate globin exchange and
prevent programmed suppression in the development of HbF expression (Thein, 2013).
A current related model of the developmental switch of fetal to adult hemoglobin suggests
that KLF1 regulates HbF production through positive regulation of BCL11A, identified as the
dominant regulator of the γ-globin gene silencing. Therefore, the ideal target for the treatment
of β-hemoglobin disorders would be one that mimics and boosts the effect of the genetic
variants that regulate HbF levels at loci such as BCL11A and KLF1 without affecting other
biological pathways (Thein, 2013).
Other promising targets include epigenetic mechanisms that are also involved in the
developmental regulation of human β-globin gene expression and hence HbF silencing
(Ginder, 2015). The two main proposed epigenetic mechanisms of HbF regulation include
methylation of DNA and histone deacetylation (Sankaran et al., 2010; Stamatoyannopoulos,
2005). The interplay between DNA methylation and histone modifications in regulating gene
expression is well recognized (Ginder, 2015) and numerous studies have demonstrated that
DNA hypomethylation and histone acetylation are effective in inducing γ-globin expression (Im
et al., 2002). Additionally, histone modifications within γ-globin gene promoter regions, via
activation of the MAPK signaling pathways were proven to be crucial for the induction of γ-
globin gene expression (Qian et al., 2013). The ability of several drugs and compounds
presently used for induction of γ-globin expression and consequently promotion of HbF levels
have been associated with epigenetic mechanisms and related signaling pathways (DeSimone
et al., 1982; Ley et al., 1983).
Presently it is acknowledged that epigenetic mechanisms can be influenced by diet, as
nutrient-dependent epigenetic variations can significantly affect genome stability, mRNA and
protein expression (Vahid, Zand, Nosrat-Mirshekarlou, Najafi, & Hekmatdoost, 2015).

Objectives
41
Genistein (GN) a naturally occurring flavonoid found in soybean and soy derivates
constitutes an important component in the majority of people's daily diet and is one of the most
studied isoflavones associated to a variety of biological activities (Akiyama et al., 1987;
Akiyama & Ogawara, 1991; Nagaraju et al., 2013). Another main component of the human
daily diet is green tea (Camellia sinensis), epigallocatechin-3-gallate (EGCG) is the major
polyphenol component of green tea with potent antioxidant and anti-inflammatory properties
(Thephinlap et al., 2007; Thichanpiang & Wongprasert, 2015). EGCG was reported to
effectively inhibit in vitro dehydration of sickle red blood cells (Ohnishi, Ohnishi, & Ogunmola,
2001) and decrease oxidative stress in iron-treated erythrocytes (Thephinlap et al., 2007).
Relevantly, GN and EGCG health benefits have been associated to its epigenetic effects
as these compounds are able to target both histone acetyltransferases (HATs) and histone
deacetylases (HDACs), regulate acetylation of histones and non-histone chromatin proteins
(Vahid et al., 2015) and affect DNA methylation (Mirza et al., 2013; D. Wu et al., 2013).
The development of new compounds capable of HbF induction with high efficiency and
lower toxicity than the currently available therapeutic agents are the focus of an intense
investigation (Fard et al., 2013), particularly due to the high prevalence and incidence of these
diseases worldwide. Furthermore, the inability of populations in the majority of highly endemic
developing countries to access proper medication and sustain the high costs of clinical
management leads to the need to develop new therapeutic approaches with exceedingly
accessible compounds at very low costs. In this context, naturally occurring antioxidant
substances, such as polyphenols and flavonoids, derived from herbs, fruits, vegetables, and
medicinal plants, provide new insight into the prevention and therapy of numerous pathologies.
This project aims to evaluate the GN and EGCG in vitro potential, two naturally occurring
compounds with high biological activity that triggers p38 Mitogen-activated protein kinase (p38
MAPK) signaling pathway (Adler, Pellizzer, Paparella, Hartung, & Bremer, 2006; Shu et al.,
2018) as HU (Chou et al., 2015), in the induction of γ-globin gene reactivation and HbF
expression. Hypothesizing, in a first phase, whether if these induce HbF expression by
modulating of hemoglobin switching factors BCL11A and KLF1 activity, with consequent
influence on the globin genes, seeking to evaluate possible signaling pathways and epigenetic
mechanisms associated.
Specific aims: Evaluate the potential of GN and EGCG in the induction of γ-globin mRNA
and HbF expression in K562 cell line.
Expected Outcomes: This study will yield important endpoints, namely: discover the effect
of distinct concentrations of GN and EGCG on the transcriptional response of α-globin, β-

Objectives
42
globin, and γ-globin genes in the K562 cell line, and correlate the effects with the transcriptional
levels of key regulators of HbF expression (BCL11A and KLF1).
The data obtained will allow evaluating the potential involvement of signaling pathways in
reactivation of γ-globin and defining these two compounds as possible ways forward for a
pharmacological reactivation of HbF.
This project will undoubtedly generate important results with a significant impact in various
areas. It will allow doing to determine the potential of natural compounds that are highly
accessible and with affordable prices in the reactivation of human HbF.

43
Chapter 3: Materials and Methods

Materials and Methods
44
3.1 Cell culture and reagents
K562 cell line (ECACC NO: 89121407) was purchased from the European Collection of Cell
Cultures (ECACC, UK).
Under sterile conditions (Fig.14-A), according to the ECACC Laboratory Handbook 4th
Edition protocol, cells were thawed. Thawing was performed quickly in order to minimize
cellular damage caused by dimethyl sulfoxide (DMSO) cryoprotectant.
Cells were pipetted into a 15 ml Falcon™ centrifuge tube and added to a 10ml of RPMI
1640 (Sigma-Aldrich) media containing GlutaMAX-l, 25 mM HEPES (Invitrogen, USA) pre-
warmed at 37 °C and supplemented with 10% (v/v) fetal bovine serum (FBS), 100 U/ml
penicillin, 100 mg/ml streptomycin and 2 mM L-glutamine (G6784, Sigma-Aldrich). A 5 minutes
centrifugation at 1.500 rpm was performed in order to remove the cryoprotectant. Cell pellet
was resuspended in 5 ml of fresh media and transferred to a 75 cm2 culture flask (T-75) with
10 ml of fresh media (Fig.14-C). Cellular culture was maintained in suspension in a 5% (v/v)
CO2 humidified atmosphere at 37 °C for 3 days.
Fig. 14 Photos taken during the project: (A) Polaris vertical laminar airflow cabinet, class 100. (B)
Inverted phase-contrast microscope. (C) Cell culture in T-75 flask.
(A)
(B)
(C)

Materials and Methods
45
Cells were stabilized between the density of 1×10⁵ and 1×10
6 cells/ml, performing every
three days subcultures and examining microscopically (phase contrast) (Fig.14-B) regarding
their confluence, number, morphology and viability.
For subculture procedures, cells were washed by centrifugation with PBS (Sigma-Aldrich)
and the pellet was resuspended in fresh media.
For cellular cryopreservation, 2×10⁶ cells/ml were added to 1.5 ml EmbryoMax® 2X Cell
Culture Freezing Medium (ES-002-D; Sigma-Aldrich) formulated with 20% DMSO + FBS and
then frozen at - 80 °C.
For treatments and experiments, K562 cells were used between passages 1 and 14.
3.2 Drugs and treatments
Epigallocatechin-3-gallate (EGCG) (CAS number 989-51-5; Sigma-Aldrich) and Genistein
(GN) (CAS No 446-72-0; Sigma-Aldrich) were purchased as a crystalline solid of 50 mg and 5
mg, respectively. Two 5 mg/ml stock solutions were prepared by dissolving the EGCG in ultra-
pure water and GN was dissolved in DMSO because GN is soluble in organic solvents such
as DMSO and is practically insoluble in water. A volume of 50 μl was used as a working solution
and diluted in a 1:100 in RPMI 1640 media to yield the EGCG and GN final concentrations of
100 ƞg/ml, 250 ƞg/ml and 500 ƞg/ml.
Human clinical pharmacokinetic studies show that the effective plasma level of total GN is
in the micromolar range while the GN aglycone is in hundred nanomolar range in vivo (Yang
et al., 2012). However after supplementation of purified isoflavones, blood concentration may
increase (Raschke, Rowland, Magee, & Pool-Zobel, 2006) and steady-state plasma
concentration would be more readily maintained by repeated ingestions throughout the day
(Setchell et al., 2003). Previous human clinical trials demonstrated that 400 mg and 800 mg
of EGCG intake, results in peak serum concentrations in the range of 100 ƞg/ml to 400 ƞg/ml
(Chow et al., 2003) with no reported severe secondary effects. Therefore, the concentrations
of the compounds in this study are considered safe and mimic the in vivo cellular exposure of
GN and EGCG after supplementation.
For experiments, K562 cells at a density of 1×10⁴ cells/ml were exposed to EGCG and GN
at the three final concentrations of 100 ƞg/ml, 250 ƞg/ml and 500 ƞg/ml and seeded in 6-well
plates (3 ml/well) (Fig.15-A). For assessment of potential cytotoxic effects, K562 cells were
exposed to EGCG and GN and seeded in 96-well plates (100 µl/well) (Fig.15-B).
In this study, six biological replicates for each compound and concentration were performed.
Furthermore, K562 cells were exposed to 25 µg/ml Hydroxyurea (HYDREA®, USP) a known
HbF inductor compound was used as a positive control. A 500 mg HU capsule was diluted (in

Materials and Methods
46
biological safety cabinet) in 100 ml of ultra-pure water, obtaining a concentration of 5 mg/ml,
which was distributed in aliquots and frozen at -20 ºC. One of the aliquots was used to make
a 0.5 mg/ml stock solution by performing a 1:10 dilution in RPMI 1640 media.
As negative control cells were grown in the standard culture medium and in culture medium
500 ƞg/ml DMSO which corresponds to the final concentration of the vehicle solution in GN
exposed cells.
Exposed cells and controls were incubated at a humidified atmosphere of 5% CO2, at 37°C
for 72h and 96h, and harvested for post-treatment assays and analysis.
Fig. 15 Photos taken during the project: (A) Treatment in 6-well plates. (B) Treatment in 96-well plates.
3.3 Cell viability assays
Cellular proliferation was assessed trough trypan blue exclusion assay (Sigma, St. Louis,
USA) after 72h and 96h of exposure.
Under sterile conditions, 100 μl K562 cell suspension was removed from each well an equal
volume of trypan blue (1:1 dilution) added and incubated at room temperature for a few
minutes.
One side of hemocytometer (Fig.16) was filled with cell diluted samples (approximately 5 -
10 μl) and counted under an inverted-phase contrast microscope using magnification x20.
Fig. 16 Photos taken during the project: Trypan blue exclusion assay in a Neubauer improved hemocytometer.
(A)
(B)

Materials and Methods
47
The number of viable cells (seen as bright and colorless) and not viable (blue-stained) were
counted. Concentration of viable and non-viable cells and the percentage of cell viability were
calculated using the equations below:
Cellular viability was also evaluated through the CellTiter-Blue® Cell Viability Assay
(Promega). This assay is a method used to assess cellular viability by testing whether
metabolic processes remain active. Viable cells carry out metabolic reactions to generate the
energy required to maintain homeostatic processes and nonviable cells lose membrane
integrity and their ability to metabolic. This method provides a procedure for measuring the cell
viability by fluorescence or absorbance quantitation. The assay is based on the ability of the
living cells to convert the resazurin, a redox dye of blue color and no fluorescence, into
resorufin of pink color and intensely fluorescent (CellTiter-Blue® Cell Viability Assay protocol)
(Fig. 17).
Fig. 17 Normal conversion of resazurin to resorufin by metabolically active cells, adapted from
CellTiter-Blue® Cell Viability Assay protocol.
Nonviable cells do not reduce the dye for losing their metabolic capacity so do not generate
a fluorescent signal and the solution stays blue.

Materials and Methods
48
According to the manufacturer’s instructions, CellTiter-Blue® Reagent (20 μl/well) was
added directly to cells seeded in 96-well plates and incubated at 37 °C for 4h.
Evaluation of standard culture media and reagent was used as a “white's medium” to
compare the results as controls.
Viability was determined by measuring absorbance using a microplate reader
spectrophotometer (Optic Ivyman; System 2100C) with 580 ƞm and 620 ƞm filters. Absorbance
was used to monitor results by comparing the values of treatment with the blank wells. The
absorption is proportional to the number of viable cells.
Experiments were performed in the three replicates per treatment.
3.4 Total RNA extraction
Total RNA was extracted by centrifugation in a silica spin column using the SV Total RNA
Isolation System (Promega), according to the manufacturer's instructions.
EGCG and GN treated cells, as well as the positive and negative controls, were collected
for 15 ml Falcon™ tubes and centrifuged at 1.500 rpm for 5 minutes. The cell pellets were
washed by centrifugation twice with 10 ml of PBS, the supernatants were discarded and 175
μl of RNA Lysis Buffer (RLA) was adding.
RLA contains 4M of guanidine thiocyanate (GTC), 0.01M of Tris buffer (pH 7.5) and 0.97%
of β-mercaptoethanol (BME). The GTC and BME have disruptive and protective properties that
inactivate the ribonucleases present in cell extracts. The GTC in association with sodium
dodecyl sulfate solution (SDS) acts disrupted the nucleoproteins complexes allowing the RNA
to be released into solution and isolated free of proteins. Dilution of cell extracts in the presence
of high concentrations of GTC causes selective precipitation of cellular proteins to occur, while
the RNA remains in solution.
Cellular lysates were transferred into 1.5 ml tubes and 350 μl of RNA Dilution Buffer was
added. The tubes were incubated in the heating block at 70 °C for 3 minutes and centrifuged
at 11.000 rpm for 10 minutes. Lysates were pipetted into new microcentrifuge tubes and 200
μl of 95% ethanol was added. Each blend was transferred to Spin Column Assembly and
centrifuged for one minute.
Ethanol clears the lysate of proteins and cellular debris, precipitating the RNA into the silica
surface in Spin Basket due to the disruption of water molecules by the chaotropic salts favoring
adsorption of nucleic acids to the silica.
Furthermore, 600μl of Wash Solution RNA was added and centrifuged at 11.000 rpm for 1
minute.

Materials and Methods
49
DNase incubation mix solution was prepared, per each sample, by combining 40 μl Yellow
Core Buffer, 5 μl 0.09M MnCl2 and 5 μl of DNase I enzyme. 50 μl of this preparation was added
directly to the membrane inside of Spin Basket and incubated for 15 minutes at room
temperature. RNase-Free DNase I solution digests the contaminating genomic DNA.
200 μl of DNase Stop Solution was added to the Spin Basket and centrifuged, then, 600 μl
RNA Wash Solution was added and centrifuged for one more minute.
The Collection Tube was emptied, and a new wash was performed and centrifuged for two
minutes.
Washing steps purified the RNA from contaminating salts, proteins and cellular impurities
still present.
The Spin Basket was transferred from the Collection Tube to the Elution Tube and 100 μl
Nuclease-Free Water was added to the membrane and centrifuged.
This procedure yielded a substantially pure fraction of total RNA after only one round of
purification without organic extractions or precipitations.
3.5 RNA quantification
The concentrations of all RNA samples were determined by a fluorescence-based assay,
the Qubit™ RNA HS Assay Kit in Qubit™ 3.0 Fluorometer (Invitrogen, Carlsbad, CA, USA).
This assay is a highly selective method for low-abundance RNA samples and will not
quantitate DNA, proteins, free nucleotides and the common contaminants that are well
tolerated.
A Qubit™ working solution was prepared by a 1:200 dilution of Qubit™ RNA HS Reagent
in Qubit™ RNA HS Buffer. 190 μL working solution was added to two Qubit™ assay tubes
used as standards and 195 μL to individual Qubit™ assay tubes. 10 μL of the two Qubit™
standard and 5 μL of each sample were added to the appropriate tube, mixed by vortexing 2
to 3 seconds and incubated at room temperature for 2 minutes.
The first standard was read and then the second, they are high-quality RNA calibration
standards that run a calibration curve used to generate the quantification result. Each sample
was read, and the output sample concentration was expressed in ƞg/ml (Appendix 1).
3.6 cDNA synthesis and real-time quantitative PCR (qRT-PCR)
After verifying the concentration, 2.0 μg of total RNA from each sample were reverse
transcribed into cDNA using the Applied Biosystems™ TaqMan™ Reverse Transcription

Materials and Methods
50
Reagents (Invitrogen™, Thermo Fisher Scientific Inc.), with random hexamers as primers, in
a scaled-down (20 μL) RT reaction, according to the directions provided by the manufacturer.
Each reaction was comprised of 2.0 μL 10X Reverse-Transcription Buffer, 1.4 μL of MgCl2
Solution (1.75 mM), 4.0 μL of dNTP Mixture (2.5 mM each dNTP), 1.0 μL of DTT (5.0 mM), 1.0
µL of RNase Inhibitor (1.0 U/µL), 1.0 µL of MultiScribe™ Reverse Transcriptase (2.5 U/µL) and
1.0 µL of Random hexamers (2.5 µM). These components were prepared as a master mix and
then dispensed into 0.5 PCR reaction tubes. Total RNA was added in the amount needed to
make a final volume of 20 µl in each tube.
The Bio-Rad iCycler® Thermal Cycler was used to carry out the RT reactions using the
following conditions: 25°C for 10 min, 37°C for 30 min, 95°C for 5 min, hold at 4°C.
cDNA was used for the hemoglobin quantification using primers for α-globin, β-globin and
γ-globin mRNAs, as well as for the HbF regulators genes KLF1 and BCL11A.
Transcriptional analysis was performed by quantitative real-time PCR (qRT-PCR) on CFX
Connect™ Real-Time PCR Detection System (Bio-Rad) using iTaq™ Universal SYBR® Green
Supermix kit (Bio-Rad), with the specific primers listed in Table 1. The housekeeping gene,
human glyceraldehyde-3-phosphate dehydrogenase (GAPDH), was used for qRT-PCR
normalization.
iTaq™ Universal SYBR® Green Supermix is a mix optimized for dye-based quantitative
PCR (qPCR). It contains iTaq DNA polymerase, dNTPs, MgCl2, SYBR Green I dye, enhancers,
stabilizers, and a blend of passive reference dyes (including ROX and fluorescein).
SYBR Green I is a fluorophore that binds to double-stranded DNA as they are synthesized.
The SYBR Green I fluorescence is measured at the end of each elongation cycle and is an
indicator of the amount of DNA synthesized during that cycle.
Reactions were performed in a 20 μL volume containing: 10 μl of iTaq™ Universal SYBR®
Green supermix (2x); 0.6 μl of forward and reverse primer (300 nM each); 1 μl cDNA template
and nuclease-free water added until obtaining the final volume.
The reaction parameters used were: 95˚C for 2 minutes; 95˚C for 30 seconds, 55˚C for 30
seconds, 72˚C for 1 minute, this was repeated for 45 cycles (Table 2).
The cycles were followed by the acquisition of a melting curve, in order to check for primer-
dimer formation and contaminations.
qRT-PCR analysis of the results was obtained as threshold cycle (Ct) values. The Ct value
is the number of cycles required for the fluorescent signal to cross the threshold. The threshold
is defined as the noise, or background, fluorescence level in the absence of any amplicons.

Materials and Methods
51
Table 1: Primer sequences and sizes of the real-time qRT-PCR
*GenBank accession numbers (National Center for Biotechnology)
Table 2: qRT-PCR amplification conditions
Step (nº of cycles) Amplification Conditions
Initial Denaturation (1x) 95˚C, 2 minutes
Amplification (45x)
Denaturation 95˚C, 30 seconds
Annealing 55˚C, 30 seconds
Elongation 72˚C, 1 minute
Final elongation (1x) 72˚C, 15 minutes
Hold (∞) until analysis
The data obtained (Ct values) in the qRT-PCR was analyzed by relative quantification. The
relative quantification method shows the difference in the target gene expression relative to
some reference group. This reference group includes endogenous housekeeping genes such
as GAPDH that is expressed at a constant level (Sinhadri, 2009).
Primer Accession Number*
Sequence (5'→3')
Tm (ºC)
Size (bp)
Housekeeping GAPDH NM_002046
Forward GAGTCAACGGATTTGGTCGTA 56,2
245
Reverse GCAGAGATGATGACCCTTTTG 55,1
Globins
α-globin NM_000558.5
Forward TCCCCACCACCAAGACCTAC 64
63
Reverse CCTTAACCTGGGCAGAGCC 62
β-globin NM_000518.5
Forward GCACGTGGATCCTGAGAACT 62
117
Reverse GCCACCACTTTCTGATAGGC 62
γ- globin NM_000559.3
Forward TGGATGATCTCAAGGGCAC 58
258
Reverse TTGCAGAATAAAGCCTATCCTTGA 47,2
Signaling
KLF1 NM_006563.5
Forward GGTGTGATAGCCGAGAC 52,22
164
Reverse GCGTATGGCTTCTCCC 52,83
BCL11A NM_022893.4
Forward ATTCGGCGTAGTACCC 50,96
191
Reverse CAACGGCTTCTTGGAG 50,36
Materials and Methods
52
In this study, levels of mRNA were expressed as the relative fold/percentage using the 2-
ΔΔCt method to calculate the relative gene expression change. This method is summarized
below:
∆Ct (sample) = Ct (target gene)- Ct (GAPDH)
∆∆Ct = ∆Ct (sample)- Ct (reference)
Relative quantification = 2-∆∆Ct
The Ct (reference) is the Ct value of the calibrator, which is also normalized to the GAPDH. This
normalization is done by subtracting the Ct value of the housekeeping gene from the Ct value
of the calibrator.
In the treatment with GN, we used the vehicle solution (DMSO) as a calibrator, and for the
remaining treatments, the calibrator was the negative control (untreated cells).
Each reaction was performed in triplicate and a control PCRs were also performed for all
primer combinations without a template. Obtained values allowed to calculate the mean ±
standard deviation for the three independent experiments, and the control samples always had
a value of 0.
3.7 Statistical analysis
Statistical analysis was performed using IBM® SPSS® Statistics 25 software (Armonk, NY,
USA).
The significant differences between the two treatments, cells grown in standard medium (to
the EGCG) and the cells exposed to vehicle DMSO (to the GN) were assessed using Student's
t-test followed by one-way analysis of variance (ANOVA). The results are presented as means
± standard deviation. P-Values < 0.05 were considered significant.
All graphs were created and evaluated with Microsoft Excel 2016.

53
Chapter 4: Results

Results
54
With this study, we hypothesized that genistein and epigallocatechin-3-gallate may be
capable of modulating HbF expression in vitro, through modulation of BCL11A and KLF1
genes, with consequent effects on globin genes expression, as possible strategies for future
treatment of SCD and β-thalassemia patients.
To test these hypotheses the GN and EGCG effects were investigated in human
erythroleukemia cells (K562).
Prior to this dissertation, no studies have examined the molecular mechanism and in vitro
activity of GN and EGCG in HbF induction.
4.1 Cell proliferation and viability
Human K562 cell line accumulates HbF if appropriately stimulated, and it is this innate ability
to produce hemoglobin, their immortality and accessibility that renders K562 cells one of the
most used models as a first-line screen of potential agents (Theodorou et al., 2016). In this
study, K562 cell line was used to study the time-dependent and dose-dependent effects of GN
and EGCG on HbF induction.
To assess the effect of GN and EGCG on the proliferation of K562 cells, 1 × 10⁴ K562
cells/ml were cultured in the absence or presence of GN and EGCG at concentrations of 100
ƞg/ml, 250 ƞg/ml and 500 ƞg/ml, or in the presence of 25 µg/ml HU as positive control and 500
ƞg/ml DMSO as vehicle solution (GN dilution agent), for a period of up to 4 days. At 72h and
96h, 100 μl K562 cell suspensions were removed and potential cytotoxic and genotoxic effects
of exposure were evaluated by analyzing cell viability and proliferation using the Trypan-Blue
exclusion assay, that exploits the loss of membrane integrity, and CellTiter-Blue assay, that
assesses metabolic activity.
4.1.1 GN affects proliferation and cellular metabolism with no effects on K562
cell viability
Viable cell counting was studied by the trypan-blue method. From the result of the assay, a
dose and time-dependent bar chart was drafted (Fig. 18).
Results show no significant differences in dose-dependent proliferation (with increasing
concentrations) to GN exposure (p > 0.05). However, significant results (p = 0.002) regarding
time-dependent exposure were observed, for each of the three concentrations studied, cell
proliferation increased from 72h to 96h: after 96h of culture, the proliferation rates for 100
ƞg/ml, 250 ƞg/ml and 500 ƞg/ml GN were 8.64×10⁵cells/ml ± 11.96%, 7.75×10
5cells/ml ± 9.4%,

Results
55
and 7.73×10⁵cells/ml ± 7.63%, respectively. Maximal stimulation of K562 was observed at a
GN concentration of 100 ƞg/ml after 96h of exposure: 8.64×10⁵cells/ml ± 11.96%.
High cell proliferation and a time-dependent response were also observed in the untreated
control and vehicle solution.
GN was shown to have the same pattern of cell growth as the negative control, however,
showing a significantly higher proliferation rate at 72h (p = 0.020).
Proliferation of vehicle solution showed no significant differences in relation to GN (72h [p
= 0.610] and 96h [p = 0.371]).
HU inhibited almost 50% of cell proliferation (both times) compared to the other compounds
studied, presenting a very significant difference in relation to GN (72h [p = 0.004] and 96h [p =
0.009]). This was the only compound with possible observable cytostatic effects at the
concentration studied.
Fig. 18 Effect of GN on the proliferation of K562 cells. Proliferation of K562 cells after 72h and 96h
culture in control (control medium), vehicle (control media supplemented with 500 ƞg/ml DMSO), 25
µl/ml HU (positive control) and 100 ƞg/ml, 250 ƞg/ml and 500 ƞg/ml of GN. Cultivation and viability
assays were performed simultaneously for all growth conditions. Results are presented as the number
of viable cells ± standard deviation of three independent experiments. Student’s t-test significant
differences in mean are shown as **p < 0.01 and *p < 0.05.
Monitoring the viability of cells (cytotoxicity of test compounds) is one of the most important
steps when conducting drug trials. All the effectiveness of drugs is monitored by survival
outcomes. This emphasizes the crucial importance of having a viability technique that can be
as accurate and precise as possible.
Potential cytotoxic and genotoxic effects on K562 cells using Trypan-Blue exclusion assay
(Fig.19) show no significant differences (p > 0.05) in cellular viability associated with dose and
Genistein 100 ƞg/ml
Genistein 250 ƞg/ml
Genistein 500 ƞg/ml
Hidroxyurea Vehicle Control
72h 5,70E+05 5,66E+05 5,27E+05 1,13E+05 6,60E+05 3,65E+05
96h 8,64E+05 7,75E+05 7,73E+05 1,65E+05 7,36E+05 6,96E+05
0,00E+00
2,00E+05
4,00E+05
6,00E+05
8,00E+05
1,00E+06
Num
be
r o
f ce
lls (
ce
lls/m
l)
K562 cells proliferation
** ** **
** * EG-HU 72h and 96h
** *
← GN-C (72h)
V-C (72h)

Results
56
time exposure (98% of viability for 100 ƞg/ml, 250 ƞg/ml and 500 ƞg/ml at 72h and 96h). There
are also no significant differences between GN and negative control. The negative control at
96h presented the highest cell viability rate (99% ± 1,5%).
Vehicle solution also demonstrates not to affect cellular viability for the period of study. HU
concentration optimization results showed that 25 μg/ml HU had worse results than GN, toxic
effects were minimal and not significant, but more cells exposed to HU died, mainly at 72h
(96% ± 2.6%).
Fig. 19 Effect of GN on K562 cells viability by Trypan-Blue exclusion assay. Viability assay of K562
cells after 72h and 96h culture in control (control medium), vehicle (control media supplemented with
500 ƞg/ml DMSO), 25 µl/ml HU (positive control) and 100 ƞg/ml, 250 ƞg/ml and 500 ƞg/ml of GN.
Cultivation and viability assays were performed simultaneously for all growth conditions. Results are
presented as the percentage of viable cells ± standard deviation of three independent experiments,
calculated by dividing the number of viable cells by the number of total cells and multiplying by 100.
Cellular viability measurements based on cellular metabolic capacity through the Cell-Titer
Blue assay method demonstrated that GN had no effects after 72h of exposure (Fig. 20).
Interestingly at 96h of 100 ƞg/ml GN exposure resulted in a decrease in the parameter in
relation to control. Vehicle solution did not affect cellular metabolic activity at any time point
whereas HU effects exposure resulted in altered cellular metabolism with time divergent effects
(72h [54,8% ± 16%] and 96h [-22,7% ± 11,5%]).
The experiment was performed simultaneously for all growing conditions using three
replicates for each condition tested and was repeated at least twice. The absorbance value for
each well was discounted from the result obtained in "white's medium", and the results are
presented as percentage of variation over control, for an absorbance intensity of 590 ƞm (using
560 ƞm for excitation).
Genistein 100 ƞg/ml
Genistein 250 ƞg/ml
Genistein 500 ƞg/ml
Hidroxyurea Vehicle Control
72h 98 98 98 96 99 98
96h 98 98 98 97 98 99
90
92
94
96
98
100
Cell
pe
rce
nta
ge
(%
)
K562 cells Viability by Trypan blue

Results
57
Fig. 20 Effect of GN on K562 cells viability by CellTiter-Blue assay. Viability assay of K562 cells
after 72h and 96h culture in the vehicle (control media supplemented with 500 ƞg/ml DMSO), 25 µl/ml
HU (positive control) and 100 ƞg/ml, 250 ƞg/ml and 500 ƞg/ml of GN. Cultivation and viability assays
were performed simultaneously for all growth conditions. Results are presented as percentage of
variation over control of three independent experiments. ***p < 0.001 and *p < 0.05 for Student’s t-test
in relation to control.
4.1.2 EGCG affects proliferation and cellular metabolism with no effects on
K562 cell viability
EGCG potential impact on cell proliferation was also evaluated through trypan blue
exclusion assay, after 72h and 96h for EGCG concentrations of 100 ƞg/ml, 250 ƞg/ml and 500
ƞg/ml (Fig. 21).
Just like GN, EGCG has not demonstrated significant dose-dependent differences (for
equal exposure times) between each treatment, however the time-dependent difference (for
each dosage) was quite significant (p ≤ 0.000), with an increased cell concentration at 96h
compared to 72h: after 96h of culture, the proliferation rates for 100 ƞg/ml, 250 ƞg/ml and 500
ƞg/ml EGCG were 5.18×10⁵cells/ml ± 19.24%, 5.24×10
5cells/ml ± 2.38%, and
4.92×10⁵cells/ml ± 5.58%, respectively. High cell proliferation and a time-dependent response
were also observed in the negative control.
EGCG had a lower proliferation rate than the negative control (72h [p = 0.002] and 96h [p
= 0.011]), however, cell proliferation obtained for EGCG was superior to that obtained for the
positive control (HU) (72h [p = 0.012] and 96h [p = 0.003]), which seems to have a cytostatic
effect.
Because EGCG follows the same growth pattern as the negative control and the
proliferation values are higher than HU, we can consider the result obtained for EGCG as not
negatively affecting cell proliferation.
-100
-50
0
50
100
Genistein 100 ƞg/ml
Genistein 250 ƞg/ml
Genistein 500 ƞg/ml
Vehicle Hidroxyurea
%K562 cells Viability by Cell Titer-Blue
72h 96h
***
* *

Results
58
Fig. 21 Effect of EGCG on the proliferation of K562 cells. Proliferation of K562 cells after 72h and
96h culture in control (control medium), 25 µl/ml HU (positive control) and 100 ƞg/ml, 250 ƞg/ml and 500
ƞg/ml of EGCG. Cultivation and viability assays were performed simultaneously for all growth conditions.
Results are presented as the number of viable cells ± standard deviation of three independent
experiments. Student’s t-test significant differences in mean are shown as ***p < 0.001, **p < 0.01 and
*p < 0.05.
When comparing the results of cell proliferation of GN and EGCG, it appears that treatment
with GN had a significantly higher value (72h [p = 0.012] and 96h [p = 0.003]) of cell number
than treatment with EGCG. The EGCG proliferation values are closer to those found for
negative control, than in relation to GN.
EGCG does not show significant differences between the different doses of study in the cell
viability evaluated by Trypan blue assay (Fig. 22). Viability observed was greater at 96h (72h
≥ 97% and 96h 100%). Differences between EGCG, HU and negative control (dose and time-
dependent) were not significant (p > 0.05).
However, the differences in EGCG treatment were significant (p = 0.020) when compared
to the same study concentrations to both exposure times (time-dependent difference).
EGCG was also shown not to affect cell metabolism at the three concentrations studied with
the CellTiter-Blue assay after 72h, whereas after 96h of 250 ƞg/ml and 500 ƞg/ml EGCG
exposure increased cell metabolic activity was reported (Fig. 23).
The results obtained for EGCG at 72h present quite significant differences (p ≤ 0.000) in
relation to the HU (similar result to the obtained to the GN and HU at 72h).
EGCG 100 ƞg/ml
EGCG 250 ƞg/ml
EGCG 500 ƞg/ml
Hidroxyurea Control
72h 1,75E+05 1,83E+05 1,88E+05 1,13E+05 3,65E+05
96h 5,18E+05 5,24E+05 4,92E+05 1,65E+05 6,96E+05
0,00E+00
2,00E+05
4,00E+05
6,00E+05
8,00E+05
1,00E+06
Nu
mb
er
of ce
lls (
ce
lls/m
l)K562 cells proliferation
*** *** ***
** EGCG-HU 72h and EGCG-C 96h EGCG-HU 96h and EGCG-C 72h
* **

Results
59
Fig. 22 Effect of EGCG on the viability of K562 cells by Trypan-Blue exclusion assay. Viability
assay of K562 cells after 72h and 96h culture in control (control medium), 25 µl/ml HU (positive control)
and 100 ƞg/ml, 250 ƞg/ml and 500 ƞg/ml of EGCG. Cultivation and viability assays were performed
simultaneously for all growth conditions. Results are presented as the percentage of viable cells ±
standard deviation of three independent experiments, calculated by dividing the number of viable cells
by the number of total cells and multiplying by 100. Student’s t-test significant differences in mean are
shown as *p < 0.05.
Fig. 23 Effect of EGCG on the viability of K562 cells by CellTiter-Blue assay. Viability assay of K562
cells after 72h and 96h culture in 25 µl/ml HU (positive control) and 100 ƞg/ml, 250 ƞg/ml and 500 ƞg/ml
of EGCG. Cultivation and viability assays were performed simultaneously for all growth conditions.
Results are presented as percentage of variation over control of three independent experiments. ***p <
0.001 and *p < 0.05 for Student’s t-test in relation to control.
EGCG 100 ƞg/ml
EGCG 250 ƞg/ml
EGCG 500 ƞg/ml
Hidroxyurea Control
72h 98 97 98 96 98
96h 100 100 100 97 99
90
92
94
96
98
100
Ce
ll p
erc
en
tag
e (
%)
K562 cells Viability by Trypan blue
-100
-50
0
50
100
EGCG 100 ƞg/ml EGCG 250 ƞg/ml EGCG 500 ƞg/ml Hidroxyurea
%
K562 cells Viability by Cell Titer-Blue
72h 96h
***
*
* *
* * *

Results
60
4.2 Transcriptional effects on BCL11A and KLF1 gene expression
The activity of BCL11A and KLF1 are critical to the silencing of HbF during development
(Ginder, 2015). To determine whether GN and EGCG modulate these two key factors involved
in the repression of HbF, we assayed by qRT-PCR the inducing effects on KLF1 and BCL11A
mRNA expression, using the GAPDH mRNA as normalizing reference.
Results represent the mean of three independent experiments (n = 3), the group means of
GN treated cells were compared to vehicle (DMSO) as calibrator, EGCG and HU treated cells
were compared to the negative control (untreated cells), using the statistical tests previously
described (Chapter 3) through the SPSS statistical software.
4.2.1 GN differentially affects mRNA of the genes related with silencing of HbF
in K562 cells
The transcriptional effects on BCL11A and KLF1 expression after GN administration at 72h
and 96h, relative to the vehicle solution, were expressed as Log2Fold Change (Log2FC) ±
standard deviation.
Relative expression of HbF main repressor (BCL11A) was analyzed in K562 cells, through
qRT-PCR, after exposure to different and relevant GN concentrations (100 ƞg/ml, 250 ƞg/ml
and 500 ƞg/ml).
We observed that all GN concentrations evaluated at both exposure times induced the
downregulation of BCL11A mRNA levels (Fig. 24). The downregulation was significant at 72h
for the lowest (100 ƞg/ml p = 0.038) and highest (500 ƞg/ml p = 0.003) concentrations of study,
this result was higher than that observed for the positive control which did not obtain a
significant result at 72h.
In intermediate GN concentration (250 ƞg/ml) with increasing exposure time (96h) a
significant response (p = 0.003) was also obtained for the downregulation of BCL11A (Log2FC
= -0,500 ± 0,155), non-observable at the concentrations of 100 ƞg/ml and 500 ƞg/ml.
The most significant result for repression of BCL11A was obtained by HU at 96h (p ≤ 0.000).

Results
61
Fig. 24 GN effects on expression of BCL11A gene. Graphic representation showing quantitative real-
time PCR analysis of BCL11A gene transcription after exposure to GN and HU. Log2Fold changes
[Log2(2-ΔΔCt)] ± standard deviation of three independent experiments, in gene expression after 72h and
96h of GN exposure at 100 ƞg/ml, 250 ƞg/ml and 500 ƞg/ml. GAPDH was utilized as a reference gene
and Student’s t-test significant differences in average mean Log2fold changes are shown as ***p < 0.001,
**p < 0.01 and *p < 0.05.
The relative expression of KLF1, described as a silencer of the γ-globin gene by stimulating
BCL11A expression (Ginder, 2015), was analyzed using the same conditions as described for
BCL11A.
Fig. 25 GN effects on expression of KLF1 gene. Graphic representation showing quantitative real-
time PCR analysis of KLF1 gene transcription after exposure to GN and HU. Log2Fold changes [Log2(2-
ΔΔCt)] ± standard deviation of for three independent experiments, in gene expression after 72h and 96h
of GN exposure at 100 ƞg/ml, 250 ƞg/ml and 500 ƞg/ml. GAPDH was utilized as a reference gene and
Student’s t-test significant differences in average mean Log2fold changes are shown as *p < 0.05.
-2,0
-1,5
-1,0
-0,5
0,0
0,5
1,0
Genistein 100 ƞg/ml Genistein 250 ƞg/ml Genistein 500 ƞg/ml Hidroxyurea
Lo
g2
fold
ch
an
ge
BCL11A
72h 96h
-1,0
-0,5
0,0
0,5
1,0
Genistein 100 ƞg/ml Genistein 250 ƞg/ml Genistein 500 ƞg/ml Hidroxyurea
Lo
g2
fold
ch
an
ge
KLF1
72h 96h
* ** ** ***
*

Results
62
Although the three GN concentrations of the study showed a slight downregulation of KLF1,
we only obtained a significant response (p = 0.028) of GN for the higher dose with increased
exposure time (500 ƞg/ml at 96h). No significant response of HU on KLF1 mRNA was obtained
in the exposure periods (Fig. 25).
4.2.2 EGCG induces downregulation in BCL11A but does not affect KLF1
Results of the EGCG proved to be promising in relation to the suppression of the BCL11A
mRNA (Fig. 26).
For exposure to 100 ƞg/ml EGCG at 72h a significant response (p ≤ 0.000) was obtained
regarding to BCL11A downregulation, this result was identical to that obtained for the 96h
positive control (HU) and appeared to have until a repressive effect greater than HU 96h of
treatment (Log2FC EGCG [100 ƞg/ml at 72h] = -1.093 ± 0.053 and Log2FC HU [25 µ/ml at 96h]
= -0.943 ± 0.548). EGCG at 250 ƞg/ml at 96h also shows a downregulation in BCL11A (p =
0.041) not observed at the lowest and highest concentration with increasing exposure time.
Fig. 26 EGCG effects on expression of BCL11A gene. Graphic representation showing quantitative
real-time PCR analysis of BCL11A gene transcription after exposure to EGCG and HU. Log2Fold
changes [Log2(2-ΔΔCt)] ± standard deviation of three independent experiments, in gene expression after
72h and 96h of EGCG exposure at 100 ƞg/ml, 250 ƞg/ml and 500 ƞg/ml. GAPDH was utilized as a
reference gene and Student’s t-test significant differences in average mean Log2fold changes are shown
as ***p < 0.001, **p < 0.01 and *p < 0.05.
Although the effects of EGCG at the two lowest concentrations tended to suppress KLF1
mRNA, the results were not significant for this gene (Fig. 27).
-2,0
-1,5
-1,0
-0,5
0,0
0,5
1,0
EGCG 100 ƞg/ml EGCG 250 ƞg/ml EGCG 500 ƞg/ml Hidroxyurea
Lo
g2
fold
ch
an
ge
BCL11A
72h 96h
*** * ***
**

Results
63
Fig. 27 EGCG effects on expression of KLF1 gene. Graphic representation showing quantitative real-
time PCR analysis of KLf1 gene transcription after exposure to EGCG and HU. Log2Fold changes
[Log2(2-ΔΔCt)] ± standard deviation of three independent experiments, in gene expression after 72h and
96h of EGCG exposure at 100 ƞg/ml, 250 ƞg/ml and 500 ƞg/ml.
4.3 Transcriptional effects on globins gene expression
Possible HbF expression in K562 cells by GN and EGCG will be associated with the positive
regulation of γ-globin gene expression (Chou et al., 2015). To verify this condition, the
expression of globin genes (α, β and γ-globin) were analyzed by qRT-PCR using the
expression of GAPDH mRNA as an internal control.
4.3.1 GN down-regulates α-globin mRNA
Representative results of globins genes analysis of GN treatment are shown in Fig. 28. GN
exposure exclusively affected α-globin with downregulation of mRNA levels at 250 ƞg/ml (p =
0.006) after 72h and 100 ƞg/ml (p ≤ 0.000) after 96h of exposure (Fig. 28-A).
For the second exposure time (96h), there was a significant dose-response (p = 0.001)
between the concentrations of 100 ƞg/ml and 250 ƞg/ml, and between 100 ƞg/ml and 500
ƞg/ml for the α-globin gene.
Cells treated with HU did not show significant results for the expression of α-globin.
The expression of β-globin mRNA (Fig. 28-B) did not show significant results in relation to
the repression of this gene by GN. However, at 72h exposure, a dose-dependent effect is
observed between 100 ƞg/ml and 250 ƞg/ml concentrations (p = 0.008) and between 100 ƞg/ml
and 500 ƞg/ml (p = 0.030), as 100 ƞg/ml appears to have a repression effect while 250 ƞg/ml
-1,0
-0,5
0,0
0,5
1,0
EGCG 100 ƞg/ml EGCG 250 ƞg/ml EGCG 500 ƞg/ml Hidroxyurea
Log
2fo
ld c
hange
KLF1
72h 96h

Results
64
and 500 ƞg/ml appears to have an inducing effect on the β-globin gene at the lowest exposure
time. Positive control has not been shown to have significant results for the β-globin gene.
At study concentrations and exposure times, GN and HU have not yet been shown to have
a significant effect on the expression of γ-globin mRNA (Fig. 28-C).
4.3.2 EGCG affects the expression of β and γ-globin genes.
Study of the EGCG effect on globin mRNA expression is shown in Fig. 29.
The three EGCG concentrations (100 ƞg/ml, 250 ƞg/ml and 500 ƞg/ml) as well as the 25
µg/ml HU, at 72h and 96h, showed no significant effects on α-globin expression (p > 0.05)
(Fig. 29-A).
EGCG has been shown to have a significant effect on β-globin repression (Fig. 29-B). A
significant downregulation of β-globin levels was reported at 72h time point for lower tested
concentrations, namely 100 ƞg/ml (p = 0.003) and 250 ƞg/ml (p = 0.015). The repression of β-
globin at 72h for 500 ƞg/ml apparently will also be significant, due to its pattern similar to the
lowest concentrations, however, the high standard deviation may have influenced the
statistical result.
On the other hand, in relation to γ-globin mRNA expression, a downregulation was observed
for 100 ƞg/ml exposure after 72h (p = 0.027) and 250 ƞg/ml after 96h (p = 0.036) (Fig. 29-C)
Positive control had no significant effect on γ-globin expression (p > 0.05).

Results
65
Fig. 28 GN effects on the expression of the globin genes. GN effects on the expression of the globin
genes. Graphic representation showing quantitative real-time PCR analysis of globins genes
transcription after exposure to GN and HU. Log2Fold changes [Log2(2-ΔΔCt)] ± standard deviation of for
three independent experiments, in gene expression after 72h and 96h of GN exposure at 100 ƞg/ml,
250 ƞg/ml and 500 ƞg/ml are shown for (A) α-globin, (B) β-globin and (C) γ-globin. GAPDH was utilized
as a reference gene and Student’s t-test significant differences in average mean Log2fold changes are
shown as ***p < 0.001, **p < 0.01 and *p < 0.05.
-1,0
-0,5
0,0
0,5
1,0
Genistein 100 ƞg/ml Genistein 250 ƞg/ml Genistein 500 ƞg/ml Hidroxyurea
Lo
g2
fo
ld c
ha
ng
eα-globin
72h 96h
-1,0
-0,5
0,0
0,5
1,0
Genistein 100 ƞg/ml Genistein 250 ƞg/ml Genistein 500 ƞg/ml Hidroxyurea
Lo
g2
fo
ld c
ha
ng
e
β-globin
72h 96h
-1,0
-0,5
0,0
0,5
1,0
Genistein 100 ƞg/ml Genistein 250 ƞg/ml Genistein 500 ƞg/ml Hidroxyurea
Lo
g2
fo
ld c
ha
ng
e
γ-globin
72h 96h
** ***
**
(A)
(B)
(C)
**
** *

Results
66
Fig. 29 EGCG effects on the expression of the globin genes. EGCG effects on the expression of the
hemoglobin genes. Graphic representation showing quantitative real-time PCR analysis of globins
genes transcription after exposure to EGCG and HU. Log2Fold changes [Log2(2-ΔΔCt)] ± standard
deviation of three independent experiments, in gene expression after 72h and 96h of EGCG exposure
at 100 ƞg/ml, 250 ƞg/ml and 500 ƞg/ml are shown for (A) α-globin, (B) β-globin and (C) γ-globin. GAPDH
was utilized as a reference gene and Student’s t-test significant differences in average mean Log2fold
changes are shown as **p < 0.01 and *p < 0.05.
-1,0
-0,5
0,0
0,5
1,0
EGCG 100 ƞg/ml EGCG 250 ƞg/ml EGCG 500 ƞg/ml Hidroxyurea
Lo
g2
fo
ld c
ha
ng
eα-globin
72h 96h
-1,0
-0,5
0,0
0,5
1,0
EGCG 100 ƞg/ml EGCG 250 ƞg/ml EGCG 500 ƞg/ml Hidroxyurea
Lo
g2
fo
ld c
ha
ng
e
β-globin
72h 96h
-1,0
-0,5
0,0
0,5
1,0
EGCG 100 ƞg/ml EGCG 250 ƞg/ml EGCG 500 ƞg/ml Hidroxyurea
Lo
g2
fo
ld c
ha
ng
e
γ-globin
72h 96h
(C)
(B)
(A)
** *
* *

67
Chapter 5: Discussion and Conclusions

Discussion and Conclusions
68
5.1 Discussion
The benefits of increased HbF in individuals with β-hemoglobinopathies are well established
and acknowledged by the scientific community. Currently, pharmacologic compounds with
capacity for HbF induction both in vitro and in vivo are available, however, these therapies
have major hazardous effects (there are concerns over their cytotoxicity and carcinogenic
potential in humans) and mechanisms by which expression of HbF occurs in response to these
agents are not established (Theodorou et al., 2016).
Cytostatic drugs, such as HU, induce HbF by "slowing" the process of erythroid
differentiation and creating a pool of more immature erythroid progenitors, a milieu that favors
HbF production (Lavelle et al., 2018). More recently researchers have begun to examine the
effects of HbF inducing agents on specific signaling molecules and signal transduction
pathways. Cyclic guanosine monophosphate (cGMP) and cyclic adenosine monophosphate
(cAMP), nitric oxide (NO), p38 MAPK, reactive oxygen species (ROS) and cytokine signaling
have all been implicated in drug induced HbF production. A comparison of the modes of action
of known HbF inducers might provide clues for more effective therapy (Mabaera et al., 2008).
Several in vivo and in vitro studies have indicated that a variety of naturally occurring
flavonoids have been found to have beneficial effects in health. These compounds have drawn
attention because of their relative safe-ness in animals and humans (Panche, Diwan, &
Chandra, 2016), and also activate p38 MAPK signaling pathway (Adler et al., 2006; Shu et al.,
2018) as HU (Chou et al., 2015). Flavonoids are polyphenolic compounds that are present in
fruits, vegetables, and beverages derived from plants (tea and wine), as well as many dietary
supplements or herbal remedies, and are categorized, according to chemical structure, as
flavanols, flavones, flavanones, isoflavones, anthocyanidins, and chalcones (Lv, Shao, Chen,
Ho, & Sang, 2011).
The purpose of this dissertation was to analyze the potential of epigallocatechin 3-gallate a
dietary flavonoid from green tea, and genistein (5,7,4'-trihydroxyisoflavone) one of the major
dietary isoflavones present at a relatively high level in soybeans and plant-derived foods, in
fetal hemoglobin reactivation and its possible therapeutic potential for β-hemoglobinopathies,
in K562 leukemic cells line. It was hypothesized that GN and EGCG may endorse HbF
expression mediated through suppression of KLF1 and BCL11A genes, two signaling
molecules involved in the silencing of the duplicated γ-globin genes (Sankaran, 2011).
In humans, plasma or serum levels of GN from soy food ingestion range from less than 1
μM to about 5 μM. Since much of the “free” GN in serum may become bound to serum proteins,
the actual concentration of biologically active GN in serum is more likely to be in the nanomolar
range. Plasma levels of GN have been reported at 2-5 ƞg/ml (7-18 ƞM) in individuals

Discussion and Conclusions
69
consuming standard western diets, with measurably higher levels of GN in individuals
consuming vegetarian diets (0.04-0.09 μM) or high-soy diets (0.27-1.2 μM) (Klein & King,
2007).
In a study where single oral doses of 30 mg, 60 mg, 150 mg and 300 mg of GN were
administered to 40 healthy volunteers, were rapidly absorbed and the kinetic profiles revealed
a one-peak plasma concentration-time course. The mean maximum concentration values were
241 ƞg/mL, 550 ƞg/mL,1484 ƞg/mL and 1773 ƞg/mL, respectively in the 30 mg, 60 mg, 150
mg and 300 mg dose groups, these values were reached after 4h to 6h, and after 48h GN was
nearly completely eliminated from the blood (Ullmann, Metzner, Frank, Cohn, & Riegger,
2005).
In consideration of human dietary intake of soy foods and resulting serum/plasma levels of
GN, we defined for the study three “low” concentrations of GN (100 ƞg/ml [~0.37 μM], 250
ƞg/ml [~0.93 μM] and 500 ƞg/ml [~1.85 μM]), since it is reasonably certain that the
physiological serum levels of GN in humans are unlikely to be achieved by diet or
supplementation in concentrations above these.
A study of Chow et al. (2003) was observed that EGCG intake at the doses of 400 mg and
800 mg, established peak serum concentrations of both free and total EGCG at the nanomolar
range (lower than 1 µM) (Chow et al., 2003). Maximum plasma concentrations of EGCG are
reached in 1-2 hours in healthy individuals and these levels gradually decrease to undetectable
levels at 24 h. The EGCG elimination half-life occurs at 3.4 ± 0.3h. Most of the EGCG ingested
apparently does not enter the blood, since absorption occurs in the small intestine and
substantial amounts pass into the large intestine, where it undergoes further degradation by
the action of the local microbiota. Therefore, the bioavailability of EGCG needs to be
considered when extrapolating the results obtained in vivo to in vitro situations (Mereles &
Hunstein, 2011). The consumption of 400 mL green tea per day equals approximately to ~247
mg of EGCG and in ~692 mg of total catechins (Wolfram, 2007). Relevant plasma
concentrations of EGCG must be in the high nanomolar range. Therefore, high micromolar
concentrations are unlikely to be established in the bloodstream of individuals that simply drink
green tea or ingest only two to three capsules of green tea extract each day (Davis, Singh,
Bhuiyan, & Sarkar, 1998). The most in vitro studies use EGCG concentrations in the range of
5–100 μM. Therefore, studies are needed using lower in vitro doses, which can still be effective
to exert biological activities and which could be more readily achieved in vivo in humans (F.
Wu et al., 2012).
Thus, based on bibliographic data that suggest serum levels after drinking green tea in the
nanomolar order, we selected the concentrations of (100 ƞg/ml [~0.22 μM], 250 ƞg/ml [~0.55
μM] and 500 ƞg/ml [~1.09 μM]) of EGCG for our study.

Discussion and Conclusions
70
This project was part of a pilot study, who’s observed effects, if promising, will allow the
continuation of the investigation, in relation to specific mechanisms (epigenetic) and signaling
pathways that regulate the fetal-to-adult hemoglobin switch.
To better understand the effectiveness of any compound that is a candidate for a type of
treatment, it is essential to determine the effectiveness of that compound in vitro as accurately
as possible. A variety of indicators are generally assessed as a starting point for assessing the
effectiveness of the compound, including the impact on cell viability, cytotoxicity, and cell
proliferation. Generally, when cells are exposed to compounds with different concentrations,
they can react through many different pathways and at different rates that depend on exposure
dosage (Riss & Moravec, 2004). Therefore, the evaluation of cell proliferation and viability
constitutes the first significant step in the toxicological studies necessary to determine the
activity of the compound and the pharmacological safety at the cellular and even molecular
level, of any candidate to a therapeutic drug (Horváth, 1980). Cell viability represents the
number of healthy cells present in the culture and cell proliferation represents the ability of
healthy cells to divide and create "daughter cells" (Gordon, Brown, & Reynolds, 2018).
GN and EGCG impact on cell proliferation and viability were measured trough two methods
(Trypan blue assay and CellTiter-Blue assay) to quantify the number of healthy K562 cells and
their growth rate after exposure to the two compounds.
Our data demonstrated that after 72h of exposure GN and EGCG do not affect cellular
metabolic capacity, however, after 96h of exposure we reported divergent effects, whereas
EGCG exposure resulted in increased metabolic capacity in a dose-dependent manner, and
GN at the lowest concentration tested results were similar to HU. Nevertheless, no effect on
cellular proliferation or viability was reported.
Previous studies have demonstrated that high GN and EGCG concentrations (greater than
5 μM) are genotoxic, and resulted in decreased cellular proliferation as well as viability
(associated with its anti-tumor properties) (Klein & King, 2007; F. Wu et al., 2012). On the other
hand, GN biological effects diverge in relation to doses applied (Russo et al., 2016) including
metabolic alterations and decreased cellular proliferation (Ganai & Farooqi, 2015).
Among the many properties of GN and EGCG described, chemopreventive and
chemoprotective activities are the most reported, possessing the ability to inhibit the
proliferation of several cell lines, however only in high concentrations (Ingram, Sanders,
Kolybaba, & Lopez, 1997; Kurahashi et al., 2007; Lee et al., 2003).
GN has been investigated extensively for its chemopreventive potential, especially against
tumors of breast and prostate origin (Park & Surh, 2004). In vitro studies often attribute to GN
the inhibition of tyrosine kinase which inhibits cell growth (Klein & King, 2007). Davis et al.
(1998) have shown that induction of apoptosis by GN is accompanied by G2/M arrest, up-

Discussion and Conclusions
71
regulation of p21 and down-regulation of cyclin B in prostate carcinoma cells (Davis et al.,
1998).
Hsu et al. (2001) demonstrate that EGCG affects a p57-mediated survival pathway in
normal epithelial cells while inducing a proapoptotic pathway in oral carcinoma cells (Hsu et
al., 2001). It has been suggested by Kong et al. (2000) that at low concentrations of EGCG,
the expression of MAPKs (ERK2, JNK1, p38) and consequently survival genes can be
activated, providing survival and protective mechanisms as a homeostatic response. At
increased concentrations, both MAPK and caspase pathways are activated, leading to
apoptosis (potential cytotoxicity), and EGCG at suprapharmacological doses predominantly
causes cell death (Kong, Yu, Chen, Mandlekar, & Primiano, 2000). EGCG at concentrations
between 100 and 250 μM strongly activated ERK, JNK, and p38, as well as induction of ARE-
reporter gene activity, whereas potent cytotoxic effects were evident at 500 μM (Park & Surh,
2004). It is speculated that apoptotic cell death occurs with EGCG treatment through G0/G1
cell arrest (Ahmad, Adhami, Gupta, Cheng, & Mukhtar, 2002).
In this work, we selected concentrations of GN and EGCG considered safe (for cell survival)
and that in vitro mimic the plasma concentrations obtained after ingestion of these two
compounds (Klein & King, 2007; F. Wu et al., 2012), Thus we predicted that they would not
affect cell viability, which was confirmed by the results obtained.
There were no significant differences in cell proliferation between the three studied
concentrations of GN and EGCG under the study; however, it was possible to verify time-
dependent differences with the increase in proliferation being significant at 96h compared to
72h. Doses between 100 ƞg/ml and 500 ƞg/ml of GN and EGCG, had no apparent cell growth
negative inhibitory effect. Our data demonstrated that after 72h of exposure EGCG and GN do
not affect cellular metabolic capacity, however, after 96h of exposure we reported divergent
effects, whereas EGCG exposure resulted in increased metabolic capacity in a dose-
dependent manner, and GN at the lowest concentration tested results in decreased cell
metabolism. Interestingly the higher proliferation level of K562 was observed at a GN
concentration of 100 ƞg/ml after 96h of exposure inversely to cellular metabolic activity.
Our results are consistent with previously published studies that prove that at
concentrations up to 5 µM these two naturally occurring flavonoids have a significant effect on
cell proliferation and metabolism (Chung et al., 2003; Fu et al., 2010; Pan, Han, Zhong, &
Geng, 2012).
It was demonstrated that GN induced the proliferation of INS1cells and human clonal β-
cells after 24h of incubation, with 0.1 μM, 1 μM and 5 μM, being suggested that the GN
stimulated β-cell proliferation is dependent of protein kinase A (PKA) and ERK1/2 (Fu et al.,
2010). 20 ƞM to 2000 ƞM of GN significantly promoted H19-7/IGF-IR neural cell line viability

Discussion and Conclusions
72
and proliferation, inducing an increase in the percentage of cells in the S phase. These effects
might be mediated by the BDNF-Trk pathway (Pan et al., 2012).
Treatment of cultured keratinocytes with EGCG for 5 days significantly increased their
proliferation in a dose-dependent manner up to 1.0 μM (0.01 μM, 0.1 μM, 0.5 μM, and 1.0 μM).
However, concentrations of EGCG >100 μM significantly inhibited the proliferation of cultured
keratinocytes (Chung et al., 2003).
In addition to studying the cell viability/proliferation of the two compounds in the study, it
was also important to determine the level of proliferation and cytotoxicity of the positive control
(HU), the negative control (untreated cells) and the vehicle solution (DMSO).
The negative control showed positive results regarding the proliferation and cytotoxicity of
K562 cells coinciding with the cell counts of the cells in the maintenance RPMI 1640 media.
DMSO is commonly used as a cryoprotective agent during the process of freezing cells for
storage. DMSO has also been widely used as a vehicle for several drugs (Hebling et al., 2015).
In this study, DMSO was used as a vehicle solution for GN, at a concentration of 500 ƞg/ml
(6.4 µM). Our study showed that DMSO alone did not affect cell viability and proliferation (at
96h, however at 72h a higher proliferation is observed) compared to untreated control.
Our results indicate that low-concentration DMSO may have an effect similar to other
studies in which the low concentration of DMSO is shown to have no cytotoxic activity (Adler
et al., 2006; Hebling et al., 2015). One study showed that 0.05 mM to 1 mM DMSO did not
affect the number, adherence and cell death of odontoblast cells. An increase in cell viability
was observed with concentrations of 0.3 and 0.5 mM DMSO (Hebling et al., 2015). Adler et al.
(2006), using different embryonic stem cell lines, demonstrated that there were no changes in
cell viability up to 0.5% of the DMSO concentration, with other cell lines, the viability remained
unchanged up to 1% of the DMSO concentration (Adler et al., 2006).
It should be noted that all of these studies tested DMSO at even higher concentrations than
those used in this study, so the fact that the vehicle solution does not alter cell viability, is in
line with expectations for concentrations below 0.05 mM (50 µM). Although studies suggest
that DMSO in low concentrations can be used as a vehicle solution without causing significant
damage to cells (Adler et al., 2006; Hebling et al., 2015), it is always important to study the
possible effects of this compound when used as a vehicle.
In our experiments, HU showed a substantially high growth-inhibitory effect towards K562
cells at an effective concentration of 25.0 μg/mL (~329 μM), probably due to its potent
ribonucleotide reductase inhibitory activity (Musallam et al., 2013). Ribonucleotide reductase
catalyzes rate limitation in the biosynthesis of all precursors for DNA replication, and its activity
is tightly regulated during the cell cycle, which generates a periodic fluctuation in the
concentration of dNTP in proliferating cells. In the presence of HU, proliferating cells are

Discussion and Conclusions
73
stopped in the S-phase due to decreased levels of dNTPs, which decreases the movement of
DNA polymerase (A. Singh & Xu, 2016).
The results obtained with the positive control (HU) are in accordance with what has already
been demonstrated for the concentration of study in relation to its effect on K562 cells (K. Liu,
Xing, Zhang, Liu, & Fung, 2010). HU at a concentration of 25.0 μg/mL has been shown to
inhibit nearly 75% of K562 cell proliferation (p <0.001) after 6 days of incubation. In this study,
the IC50 of the HU was calculated at 63.1 μg/mL (K. Liu et al., 2010). After 5 days of exposure
to 150 µM HU, the percentage of K562 cell survival was 38.9% (Theodorou et al., 2016).
If we compare the results of cell proliferation of GN and EGCG treatments, we found that
treatment with GN had a significantly higher value (72h [p = 0.012] and 96h [p = 0.003]) of cell
number than treatment with EGCG. However, other studies that analyzed simultaneously the
effects of GN and EGCG in cell cultures, demonstrate that for the same concentrations, in cells
incubated with lower concentrations, EGCG shows to have a lower effect on cell proliferation
compared to GN (Bhatia & Agarwal, 2001; Zhang & Zhuo, 2006), which is in accordance with
our result. The divergence may be related to the activation of different signaling pathways,
between the two compounds at lower concentrations.
In a study where GN and EGCG effects were assessed on hepatic stellate cells, T6/GFAP-
lacZ cells (rat HSC-T6 cell line transfected with a GFAP-lacZ reporter transgene) were treated
with increasing concentrations of GN and EGCG (0 to 80 μM) and cell proliferation was
evaluated after 48h. It was possible to verify that up to 5 μM (lower concentrations) GN has a
proliferative effect superior (± 20%) to EGCG (which demonstrates inhibitory activity from the
beginning). At concentrations above 5 μM the effect of GN and EGCG on cell proliferation was
similar, showing both a strong inhibitory effect. IC50 was 31 μM for EGCG and 25 μM for GN
respectively (Zhang & Zhuo, 2006). In DU145 cells treated with similar doses (100–200 μM) of
GN and EGCG, higher doses of GN showed a cytotoxic effect causing 30–40% cell death. A
more profound cytotoxic effect was observed with EGCG accounting for 50% cell death at
lower doses and complete loss of viability at higher doses (Bhatia & Agarwal, 2001).
From the in vitro analysis of cell viability and proliferation, we can discuss that GN and
EGCG (with the study concentrations) have the potential to be used as possible
pharmacological agents, showing no cytostatic effects. It is very important that the cellular
induction is not associated with inhibition or excessive proliferation. For this reason, these two
compounds have a significant advantage over other known inducers, such HU, which exerts a
greater inhibitory effect on cell proliferation.
The activity of BCL11A and KLF1 are critical to the silencing of HbF during development
(Sankaran, 2011). This study investigated a possible induction of HbF by GN and EGCG
exposures and if it could operate through transcriptional regulation of BCL11A and KLF1, by
analyzing the expression mRNA in the K562 cell line.

Discussion and Conclusions
74
In vivo, the possible efficacy of EGCG in increasing HbF concentrations has already been
demonstrated through the ingestion of green tea extract.
In a simultaneously ongoing study at H&TRC, researchers demonstrated that prolonged
human exposure (90 days) to EGCG significantly increase HbF levels in vivo. Healthy
individuals ingested green tea extract capsules for 90 days (containing 225 mg of EGCG per
capsule), and hematological parameters were tested at time 0 and 90 (days). Only the
hemoglobin associated parameters from the performed complete blood count were
significantly affected after EGCG oral exposure, particularly increase in HbF (manuscript
currently submitted for publication).
The promising results observed in vivo stimulate us to understand the mechanisms involved
in these responses, namely if BCL11A and KLF1, the main repressors of the γ-globin gene
(Sankaran, 2011), it would have a central role in this result and if consequently, the same is
observed in the expression of the globin genes.
GN, in the three studied concentrations and in the two periods of exposure, significantly
suppressed the BCL11A mRNA. This effect was observed at 72h for the concentrations of 100
ƞg/ml and 500 ƞg/ml and at 96h for the concentration of 250 ƞg/ml.
Our results clearly demonstrated that GN effects on K562 cells follow a non-monotonic
dose-response (NMDR) and time divergent response, which is common in hormones as well
as endocrine-disrupting chemicals (EDCs) such as phytoestrogens (Vandenberg et al., 2012).
In classical risk assessment, adverse responses are proportional to the exposure, which
implies that higher doses of chemicals should cause greater effects than low doses, mainly
based on the theories of “harmfulness from dosage” and “the dose makes the poison” (Z. Xu,
Liu, Wu, Huang, & Pan, 2017), where assumes that there is no adverse effect below a certain
exposure level. However, there is a class of toxins and EDCs, for which there is evidence that
they do not obey the principles of toxicology (Beausoleil et al., 2013). There are several generic
nonlinear dose-response curves that no linear relationship over the range from low to high
doses, described as NMDRs (Z. Xu et al., 2017). In these cases, it is impossible to predict the
potential harmfulness of low doses using data from high-exposure situations, so the entire
dose-response curve must be investigated. Unfortunately, the mechanisms involved in the
nonmonotonic response are complex and time-consuming to elucidate. A few researchers
have hypothesized that the NMDRs reflect various mechanisms including genomic and
nongenomic pathways, as well as the time frame of the response (Z. Xu et al., 2017).
Phytoestrogens exert estrogenic effects at low concentrations and antiestrogenic effects at
high concentrations. Therefore, it could be that high doses of GN may weaken the beneficial
effects of GN through its actions on the estrogen pathway (Kohara, Kuwahara, Kawaguchi,
Jojima, & Yamashita, 2014). GN is described as acts as an estrogen and inhibits lipogenesis
by ER-β signaling at low concentrations, but it promotes lipogenesis at high concentrations

Discussion and Conclusions
75
through the peroxisome proliferator-activated receptor-gamma (PPARγ) molecular pathway
(Penza et al., 2006). PPARγ is a class of ligand-activated cytokine of the steroid hormone
receptor, its most important function is the mediation of gene transcription and subsequent
regulation on its activation after combining with its ligands (S. Xu & Xu, 2018).
The downregulation of BCL11A by GN has already been reported in a study in which the
exposure of LNCaP cells to 50 µM of treatment with GN resulted in the negative regulation of
this gene (Merchant et al., 2012).
In addition to BCL11A, GN is described as capable of influencing the expression of other
genes (Sundaram et al., 2019).
The EGCG in our experiment also demonstrated a strongly downregulated BCL11A mRNA
levels after 72h of EGCG exposure at the lowest concentration and at 96h time point, a more
subtle but significant effect was observed for the intermediate dosage (250 ng/ml), which is
also suggestive of a NMDR effect. This effect has not yet been reported previously for this
compound. However, there is evidence in very recent previous studies which demonstrate that
EGCG also targets estrogen receptors (ER-α and ERα36) (Chen et al., 2019; Shu et al., 2018).
It suggests that estrogen receptors might be efficient targets of EGCG, so perhaps it can
reproduce NMDR effects like those reported for GN.
EGCG exerts an anti-tumoral (anti-proliferation and pro-apoptosis) effect in HCC
(hepatocellular carcinoma) cell lines by inhibiting ERα36 (a new isoform of estrogen receptor
alpha [ER-α]). Inhibiting ERα36-EGFR-Her-2 feedback and PI3K/Akt, MAPK/ERK pathway,
activating caspase 3, and accumulating p-ERK in the cytoplasm. It suggests that ERα36 and
other estrogen receptors might be efficient targets of EGCG (Chen et al., 2019).
EGCG has also been described as having the potential to inhibit the human aortic smooth
muscle cell (HASMC) proliferation through the PGC‐1α/ERR‐α/Mfn‐2 pathway (Shu et al.,
2018).
HU at 96h exposure also induced the downregulation of the BCL11A gene, emphasized
that this was the only significant effect that we obtained for the positive control throughout the
experiment. This result is quite similar to obtain in the treatment with 100 ƞg/ml and 500 ƞg/ml
of GN at 72h, and lower than that obtained for EGCG 100 ƞg/ml at 72h.
The repression of BCL11A by HU is already described in the literature, for example: after
6h and 12h of 100 µM HU treatment existed a down-regulation of BCL11A that was associated
with a seven-fold increase in γ-globin expression in both primary and K562 cells (Pule et al.,
2016). However, the mechanism of the molecular action of HU in inducing γ-globin is not
completely understood. Only two transcription factors the BCL11A and SOX6 have been
shown to decrease in response to HU in vivo in sickle cell reticulocytes (Grieco, Billett, Green,
Driscoll, & Bouhassira, 2015).

Discussion and Conclusions
76
Current models suggest that KLF1 positively regulates the expression of the γ-globin gene
repressor BCL11A by interacting with the BCL11A promoter and other regions of control in the
β-globin-like cluster (Ginder, 2015). In this way we expected that the downregulation that we
observed in BCL11A would be, at least in part, explained by a reduction in the levels of
intracellular proteins of KLF1, that is, the depletion of KLF1 would secondarily decrease the
levels of BCL11A and thus reduce its ability to repress the expression of γ-globin genes.
However, we only observed the downregulation of KLF1 in the highest concentration of GN
(500 ƞg/ml) at 96h, which indicates that the downregulation observed in BCL11A is not caused
by the reduction in KLF1.
These results suggest that both GN and EGCG may have a specific molecular target for
BCL11A but not KLF1.
The repression of BCL11A, without altering KLF1 levels, has already been described as
capable of strongly inducing HbF, by other compounds such as e.g. Pomalidomide.
Pomalidomide is an FDA-approved third-generation immunomodulatory drug, and originally
developed for the treatment of myeloma. However, further studies demonstrated that
pomalidomide induces HbF production by promoting erythropoiesis both in vitro and in vivo,
nevertheless, the molecular pathway by which modulates erythropoiesis, leading to HbF
induction, is unknown (Dulmovits et al., 2016). Appiah-Kubi et al. (2013), presented evidences
that pomalidomide significant decrease in BCL11A expression levels, but it does not affect the
expression of the KLF1. Pomalidomide appears to target the erythroid-specific BCL11A but
not the more pleiotropic transcription regulator KLF1 (Appiah-Kubi et al., 2013).
Despite erythroid-specific BCL11A downregulation, no significant effects were observed
regarding γ-globin induction. However, considering that exposure to HU which is currently
utilized for treatment of SCD patients (Field & Nathan, 2014) due to γ-globin gene induction
and reduce β-globin gene expression (Chou et al., 2015), also did not result in augmented γ-
globin transcription or diminished β-globin gene expression we postulated that exposure time
should be increased in further studies.
On the other hand, the treatment with GN in the lowest concentration (100 ƞg/ml) at 96h
caused very significant repression of the expression of α-globin mRNA. This effect was also
observed in the concentration of 250 ƞg/ml but was suppressed with the increase in
concentration and exposure time, this result is again characteristic of an NMDR effect.
The EGCG did not influence the expression of α-globin mRNA, however, it significantly
repressed the expression of β-globin, however, this repression was lost with the increase in
the time of exposure and concentration (a possible feature of its also NMDR).
Despite the erythroid differentiation of K562 cells is only associated with an increase of
expression of embryonic-fetal globin genes (Bianchi et al., 2001), it is known that the

Discussion and Conclusions
77
transcription of the β-globin gene in K562 cell line can be influenced by epigenetic mechanisms
(Fathallah et al., 2007).
In a study using K562 cells, were analyzed the effect of catechol (found in fruits and
vegetables) on erythroid differentiation and DNA methylation levels in specific genes of the
erythroid lineage. After K562 cells were treated with catechol, the mRNA expression of the α,
β, and γ-globin genes showed a significant concentration-dependent increase, associated with
a decrease in DNA methylation levels (X. F. Li et al., 2012).
For this reason, we also chose to analyze the transcriptional levels of the β-globin gene,
associated with possible epigenetic mechanisms by GN and EGCG.
The fact that our results have not induced the expression of γ-globin suggest that probably
the BCL11A protein level may not yet have decreased with the reduction of its mRNA, so, the
result regarding the induction of γ-globin is not yet visible, as protein synthesis takes time, and
changes in transcription affect protein levels with a delay of time. Variations in mRNAs, as well
as the availability of resources for protein biosynthesis, can strongly influence the relationship
between protein levels and transcripts. During highly dynamic phases, such as cell
differentiation or stress response (as in the case of cell treatments), post-transcriptional
processes can lead to stronger deviations from an ideal correlation, and transcription levels
alone are not sufficient to predict levels of proteins in many scenarios (Y. Liu, Beyer, &
Aebersold, 2016).
Another justification may be due to the fact that the studied concentrations are quite low.
In a study by Naciff et al. (2016), with the objective of evaluating the transcriptional response
of human endometrial cancer cells to treatment with GN (10 ρM, 1 ƞM, 100 ƞM and 10 μM),
the response in the gene expression to exposure to GN was time and dose-dependent.
Although the response in genetic expression to low doses (10 ρM - 100 ƞM) of GN was
extremely limited. The authors also determined that the response of Ishikawa cells to exposure
to GN is progressive and results in changes in specific pathways at different times (Naciff et
al., 2016).
Taking our results into account, we consider that by increasing the dose and exposure time
of the two compounds, to levels still considered non-cytotoxic and representative of food intake
or by supplementing soy and green tea, we can probably obtain more robust results and the
decrease in BCL11A mRNA may have time to influence the decrease in the level of its protein
with effects on the expression of γ-globin and consequent induction of HbF.

Discussion and Conclusions
78
5.2 Conclusions
In summary, we have demonstrated that GN and EGCG, at concentrations physiologically
attainable by diet or supplementation, can downregulate the expression of BCL11A, which is
considered the main repressor of HbF, more strongly than HU which is currently the only FDA-
approved HbF inducer.
The conclusions obtained are summarized below:
GN and EGCG are not cytotoxic (> 95% viability), do not negatively influence cell
proliferation, and have an influence on cell metabolism; the two compounds were shown to
have a non-monotonic dose-response (NMDR) effects; GN and EGCG strongly and
significantly downregulate the transcription of the BCL11A gene, an effect greater than that
observed for HU.
This study presents a possible new potential for GN and EGCG to induce fetal hemoglobin
expression. Our data encourage further study of the effects of GN and EGCG and structurally
related analogs not only in immortalized cell lines but also in erythroid progenitor cells (with
the potential to express embryonic, fetal and adult globin genes), to conclusively determine the
potential use of such agents in the treatment of β-hemoglobinopathies.
This project was carried out to support the concept that, among the compounds identified
from nature, some of them may exhibit the ability to increase HbF expression. We firmly believe
that this field is exciting from a scientific point of view, but it also represents hope for several
patients, whose survival will depend on the possible use of drugs that do not require blood
transfusion and consequent chelation therapy, which are easily accessible.
5.3 Future perspectives
The promising results obtained in relation to the suppression of the BCL11A gene support
the continuation of this study.
As mentioned earlier, we obtained results compatible with NMDR for both GN and EGCG,
that is, these two compounds probably interact and activate their receptors in a non-linear
manner. As most of the significant effects that we obtained were observed at the lowest
concentrations, we can predict that the dose-response curve will be in the form of a "U", in
which the maximum responses will be observed at the lowest and highest doses, respectively.
Thus, we predict that, by increasing the concentration and the exposure time (so that the
decrease in the BCL11A transcript causes observable effects), the results may be more robust

Discussion and Conclusions
79
and, possibly, we will obtain a significant response in relation to the induction of γ-globin. In
this way, we will also better understand GN and EGCG effectiveness and safety.
The conditions of exposure to GN and EGCG with effects demonstrated in the repression
of BCL11A gene identified in this project will be selected for further analysis, with the addition
of a higher concentration of 800 ƞg/ml (~3 μM of GN and ~1,7 μM of EGCG), increasing the
exposure time to 120h.
These doses are still considered safe (< 5 μM) and representative of the plasma
concentration after alimentation or supplementation. For example, when taken as food
supplements, catechin doses at or above 800 mg/day, corresponding to a plasma peak of
1682.1 ƞg/ml (Ullmann et al., 2004), and plasma concentrations of GN in the range from 50 to
800 ƞg/ml have been reported, in adults after consumption of soy foods in Japanese traditional
diet (Cassidy, Hanley, & Lamuela-Raventos, 2000).
On the other hand, given to the all complexity of factors involved in the γ-globin gene
expression, the mechanism by which GN and EGCG acts need to be elucidated. Further
studies regarding mediated epigenetic effects and p38 MAPK signaling pathway activation,
must be performed in order to better understand the molecular mechanisms underlying HbF
induction and its potential use as a new therapy approach.
The continuation of the study is considered promising with the following conditions:
• Increase the exposure time to 120h.
• Increase the dose of GN and EGCG to 800 ƞg/ml.
• Evaluate the expression of the MYB regulatory gene.
• Treatment in human erythroid progenitor cells.
• Evaluate protein expression.
• Study the involvement of MAPK signaling pathways.
• Study the epigenetic mechanisms of GN and EGCG possibly associated with the
reactivation of γ-globin (DNMTs and HDACs).

80
Bibliography

Bibliography
81
Adler, S., Pellizzer, C., Paparella, M., Hartung, T., & Bremer, S. (2006). The effects of solvents
on embryonic stem cell differentiation. Toxicology in Vitro, 20(3), 265–271.
https://doi.org/10.1016/j.tiv.2005.06.043
Ahmad, N., Adhami, V. M., Gupta, S., Cheng, P., & Mukhtar, H. (2002). Role of the
retinoblastoma (pRb)-E2F/DP pathway in cancer chemopreventive effects of green tea
polyphenol epigallocatechin-3-gallate. Archives of Biochemistry and Biophysics, 398(1),
125–131. https://doi.org/10.1006/abbi.2001.2704
Aidoo, M., Terlouw, D. J., Kolczak, M. S., McElroy, P. D., Ter Kuile, F. O., Kariuki, S., …
Udhayakumar, V. (2002). Protective effects of the sickle cell gene against malaria
morbidity and mortality. Lancet, 359(9314), 1311–1312. https://doi.org/10.1016/S0140-
6736(02)08273-9
Akinsheye, I., Alsultan, A., Solovieff, N., Ngo, D., Baldwin, C. T., Sebastiani, P., … Steinberg,
M. H. (2011). Fetal hemoglobin in sickle cell anemia. Blood, 118(1), 19–27.
https://doi.org/10.1182/blood-2011-03-325258
Akiyama, T., Ishida, J., Nakagawa, S., Ogawara, H., Watanabe, S., Itoh, N., … Fukami, Y.
(1987). Genistein, a specific inhibitor of tyrosine-specific protein kinases. Journal of
Biological Chemistry, 262(12), 5592–5595. https://doi.org/10.1016/j.tet.2008.05.104
Akiyama, T., & Ogawara, H. (1991). Use and Specificity of Genistein as Inhibitor of Protein-
Tyrosine Kinases. Methods in Enzymology, 201, 362–370. https://doi.org/10.1016/0076-
6879(91)01032-W
Allison, A. C. (1954). The distribution of the sickle-cell trait in East Africa and elsewhere, and
its apparent relationship to the incidence of subtertian malaria. Transactions of The Royal
Society of Tropical Medicine and Hygiene, 48(4), 312–318. https://doi.org/10.1016/0035-
9203(54)90101-7
Appiah-Kubi, A. O., Blanc, L., Singh, S. A., Didier, S., Dsilva, S., Chan, K. W. H., … Liu, J. M.
(2013). Pomalidomide Augments Fetal Hemoglobin Production In Primary Erythroid Cells
By a Novel Mechanism Modulating BCL11A But Not KLF-1. Blood, 122(21), 314.
https://doi.org/https://doi.org/10.1182/blood.V122.21.314.314
Ashley-Koch, A., Yang, Q., & Olney, R. S. (2000). Sickle hemoglobin (HbS) allele and sickle
cell disease: a HuGE review. American Journal of Epidemiology, 151(9), 839–845.
https://doi.org/10.1093/oxfordjournals.aje.a010288
ATCC. (2016). K-562-s (ATCC® CCL-3343TM) Homo sapiens bone marrow chronic
myelogenous leukemia. Retrieved December 20, 2019, from https://www.lgcstandards-

Bibliography
82
atcc.org/Products/All/CRL-3343.aspx?geo_country=pt#characteristics
Baek, S. J., Kim, J., Jackson, F. R., Eling, T. E., Mcentee, M. F., & Lee, S. (2004). Epicatechin
gallate-induced expression of NAG-1 is associated with growth inhibition and apoptosis
in colon cancer cells. Carcinogenesis, 25(12), 2425–2432.
https://doi.org/10.1093/carcin/bgh255
Beausoleil, C., Ormsby, J. N., Gies, A., Hass, U., Heindel, J. J., Holmer, M. L., … Schoenfelder,
G. (2013). Low dose effects and non-monotonic dose responses for endocrine active
chemicals: Science to practice workshop: Workshop summary. Chemosphere, 93(6),
847–856. https://doi.org/10.1016/j.chemosphere.2013.06.043
Bento, C., Relvas, L., Vazão, H., Campos, J., Rebelo, U., & Ribeiro, M. L. (2006). The use of
capillary blood samples in a large scale screening approach for the detection of β-
thalassemia and hemoglobin variants. Haematologica, 91(11), 1565. Retrieved from
http://www.haematologica.org/content/91/11/1565.full.pdf+html
Bhatia, N., & Agarwal, R. (2001). Detrimental effect of cancer preventive phytochemicals
silymarin, genistein and epigallocatechin 3-gallate on epigenetic events in human
prostate carcinoma DU145 cells. The Prostate, 46(2), 98–107.
https://doi.org/10.1002/1097-0045(20010201)46:2<98::AID-PROS1013>3.0.CO;2-K
Bianchi, N., Chiarabelli, C., Borgatti, M., Mischiati, C., Fibach, E., & Gambari, R. (2001).
Accumulation of γ-globin mRNA and induction of erythroid differentiation after treatment
of human leukaemic K562 cells with tallimustine. British Journal of Haematology, 113(4),
951–961. https://doi.org/10.1046/j.1365-2141.2001.02843.x
Bunn, H. F. (1997). Pathogenesis and treatment of sickle cell disease. The New England
Journal of Medicine, 337(11), 762–769. https://doi.org/10.1056/NEJM199709113371107
Cao, A., & Galanello, R. (2010). Beta-thalassemia. Genetics in Medicine, 12(2), 61–76.
https://doi.org/10.1097/GIM.0b013e3181cd68ed
Cappellini, M., Cohen, A., Porter, J., Taher, A., & Viprakasit, V. (2014). Guidelines for the
Management of Transfusion Dependent Thalassaemia (TDT). 3rd edition. Nicosia (CY):
Thalassaemia International Federation. Retrieved from
https://www.resonancehealth.com/images/files/clinician-information/patient-
management-guidelines/TIF Guidelines for the Management of Transfusion Dependent
Thalassaemia.pdf
Cassidy, A., Hanley, B., & Lamuela-Raventos, R. M. (2000). Isoflavones, lignans and stilbenes
- origins, metabolism and potential importance to human health. Journal of the Science

Bibliography
83
of Food and Agriculture, 80(7), 1044–1062. https://doi.org/10.1002/(SICI)1097-
0010(20000515)80:7<1044::AID-JSFA586>3.0.CO;2-N
Cavazzana, M., & Mavilio, F. (2018). Gene therapy for hemoglobinopathies. Human Gene
Therapy, 29(10), 1106–1113. https://doi.org/10.1089/hum.2018.122
Chen, J., Chen, L., Lu, T., Xie, Y., Li, C., Jia, Z., & Cao, J. (2019). ERα36 is an effective target
of epigallocatechin-3-gallate in hepatocellular carcinoma. International Journal of Clinical
and Experimental Pathology, 12(9), 3222–3234. Retrieved from
https://www.ncbi.nlm.nih.gov/pmc/articles/PMC6949832/
Chou, Y.-C., Chen, R.-L., Lai, Z.-S., Song, J.-S., Chao, Y.-S., & Shen, C.-K. J. (2015).
Pharmacological Induction of Human Fetal Globin Gene in Hydroxyurea-Resistant
Primary Adult Erythroid Cells. Molecular and Cellular Biology, 35(14), 2541–2553.
https://doi.org/10.1128/mcb.00035-15
Chow, H. H. S., Cai, Y., Hakim, I. A., Crowell, J. A., Shahi, F., Brooks, C. A., … Alberts, D. S.
(2003). Pharmacokinetics and safety of green tea polyphenols after multiple-dose
administration of epigallocatechin gallate and polyphenon E in healthy individuals. Clinical
Cancer Research, 9(9), 3312–3319. Retrieved from
https://clincancerres.aacrjournals.org/content/9/9/3312
Chung, J. H., Han, J. H., Hwang, E. J., Seo, J. Y., Cho, K. H., Kim, K. H., … Eun, H. C. (2003).
Dual mechanisms of green tea extract (EGCG)-induced cell survival in human epidermal
keratinocytes. The FASEB Journal, 17(13), 1913–1915. https://doi.org/10.1096/fj.02-
0914fje
Cieri-Hutcherson, N. E., Hutcherson, T. C., Conway-Habes, E. E., Burns, B. N., & White, N. A.
(2019). Systematic Review of l-glutamine for Prevention of Vaso-occlusive Pain Crisis in
Patients with Sickle Cell Disease. Pharmacotherapy, 39(11), 1095–1104.
https://doi.org/10.1002/phar.2329
Cokic, V. P., Smith, R. D., Beleslin-Cokic, B. B., Njoroge, J. M., Miller, J. L., Gladwin, M. T., &
Schechter, A. N. (2003). Hydroxyurea induces fetal hemoglobin by the nitric oxide-
dependent activation of soluble guanylyl cyclase. Journal of Clinical Investigation, 111(2),
231–239. https://doi.org/10.1172/JCI200316672
Costa, D., Capuano, M., Sommese, L., & Napoli, C. (2015). Impact of epigenetic mechanisms
on therapeutic approaches of hemoglobinopathies. Blood Cells, Molecules, and
Diseases, 55(2), 95–100. https://doi.org/10.1016/j.bcmd.2015.05.004
Costa, S., Madeira, S., Sobral, M. A., & Delgadinho, G. (2016). Hemoglobinopatias em

Bibliography
84
Portugal e a intervenção do médico de família. Revista Portuguesa de Medicina Geral e
Familiar, 32(6), 416–424. https://doi.org/http://dx.doi.org/10.32385/rpmgf.v32i6.11963
Cuenda, A., & Rousseau, S. (2007). p38 MAP-Kinases pathway regulation, function and role
in human diseases. Biochimica et Biophysica Acta, 1773(8), 1358–1375.
https://doi.org/10.1016/j.bbamcr.2007.03.010
Cui, S., & Engel, J. D. (2017). Reactivation of Fetal Hemoglobin for Treating β -Thalassemia
and Sickle Cell Disease. In P. Malik & J. Tisdale (Eds.), Gene and Cell Therapies for Beta-
Globinopathies. Advances in Experimental Medicine and Biology (Vol. 1013, pp. 177–
202). Springer, New York, NY. https://doi.org/https://doi.org/10.1007/978-1-4939-7299-
9_7
Davis, J. N., Singh, B., Bhuiyan, M., & Sarkar, F. H. (1998). Genistein‐induced upregulation of
p21WAF1 , downregulation of cyclin B, and induction of apoptosis in prostate cancer cells.
Nutrition and Cancer, 32(3), 123–131. https://doi.org/10.1080/01635589809514730
DeSimone, J., Heller, P., Hall, L., & Zwiers, D. (1982). 5-Azacytidine stimulates fetal
hemoglobin synthesis in anemic baboons. Proceedings of the National Academy of
Sciences of the United States of America, 79(14), 4428–4431.
https://doi.org/10.1073/pnas.79.14.4428
Diepstraten, S. T., & Hart, A. H. (2019). Modelling human haemoglobin switching. Blood
Reviews, 33, 11–23. https://doi.org/10.1016/j.blre.2018.06.001
Dixon, R. A., & Ferreira, D. (2002). Genistein. Phytochemistry, 60(3), 205–211.
https://doi.org/10.1016/s0031-9422(02)00116-4
Dörner, T., & Lipsky, P. E. (2010). Signal transduction in rheumatoid arthritis and systemic
lupus erythematosus. In Handbook of Cell Signaling (Second Edi, Vol. 3, pp. 2919–2932).
Elsevier Inc. https://doi.org/10.1016/B978-0-12-374145-5.00336-3
Dreuzy, E. de, Bhukhai, K., Leboulch, P., & Payen, E. (2016). Current and future alternative
therapies for beta-thalassemia major. Biomedical Journal, 39(1), 24–38.
https://doi.org/10.1016/j.bj.2015.10.001
Dulmovits, B. M., Appiah-Kubi, A. O., Papoin, J., Hale, J., He, M., Al-Abed, Y., … Blanc, L.
(2016). Pomalidomide reverses γ-globin silencing through the transcriptional
reprogramming of adult hematopoietic progenitors. Blood, 127(11), 1481–1492.
https://doi.org/10.1182/blood-2015-09-667923
Fard, A. D., Hosseini, S. A., Shahjahani, M., Salari, F., & Jaseb, K. (2013). Evaluation of novel

Bibliography
85
fetal hemoglobin inducer drugs in treatment of β-hemoglobinopathy disorders.
International Journal of Hematology-Oncology and Stem Cell Research, 7(3), 46–53.
Retrieved from https://www.ncbi.nlm.nih.gov/pmc/articles/PMC3913144/
Fathallah, H., Portnoy, G., & Atweh, G. F. (2008). Epigenetic Analysis of the Human Alpha-
and Beta-Globin Gene Clusters. Blood Cells Mol Dis., 40(2), 166–173.
https://doi.org/10.1097/MPG.0b013e3181a15ae8.Screening
Fathallah, H., Weinberg, R. S., Galperin, Y., Sutton, M., & Atweh, G. F. (2007). Role of
epigenetic modifications in normal globin gene regulation and butyrate-mediated
induction of fetal hemoglobin. Blood, 110(9), 3391–3397. https://doi.org/10.1182/blood-
2007-02-076091
Faustino, P., Osório-Almeida, L., Barbot, J., Espírito-Santo, D., Gonçalves, J., Romão, L., …
Lavinha, J. (1992). Novel promoter and splice junction defects add to the genetic, clinical
or geographic heterogeneity of β-thalassaemia in the Portuguese population. Human
Genetics, 89(5), 573–576. https://doi.org/10.1007/BF00219188
Feriotto, G., Marchetti, N., Costa, V., Torricelli, P., Beninati, S., Tagliati, F., & Mischiati, C.
(2018). Selected terpenes from leaves of Ocimum basilicum L. induce hemoglobin
accumulation in human K562 cells. Fitoterapia, 127, 173–178.
https://doi.org/10.1016/j.fitote.2018.02.016
Field, J. J., & Nathan, D. G. (2014). Advances in Sickle Cell Therapies in the Hydroxyurea Era.
Molecular Medicine, 20(8), 37–42. https://doi.org/10.2119/molmed.2014.00187
Figueiredo, M. S. (2007). Agentes indutores da síntese de hemoglobina fetal. Revista
Brasileira de Hematologia e Hemoterapia, 29(3), 313–315. https://doi.org/10.1590/s1516-
84842007000300024
Finotti, A., Borgatti, M., Bianchi, N., Zuccato, C., Lampronti, I., & Gambari, R. (2016). Orphan
Drugs and Potential Novel Approaches for Therapies of β-Thalassemia: Current Status
and Future Expectations. Expert Opinion on Orphan Drugs, 4(3), 299–315.
https://doi.org/10.1517/21678707.2016.1135793
Fordis, C. M., Anagnou, N. P., Dean, A., Nienhuis, A. W., & Schechter, A. N. (1984). A β-globin
gene, inactive in the K562 leukemic cell, functions normally in a heterologous expression
system. Proceedings of the National Academy of Sciences of the United States of
America, 81(14), 4485–4489. https://doi.org/10.1073/pnas.81.14.4485
Forget, B. G., & Bunn, H. F. (2013). Classification of the Disorders of Hemoglobin. Cold Spring
Harbor Perspectives in Medicine, 3(2), a011684.

Bibliography
86
https://doi.org/10.1101/cshperspect.a011684
Frenette, P. S., & Atweh, G. F. (2007). Sickle cell disease : old discoveries, new concepts, and
future promise. The Journal of Clinical Investigation, 117(4), 850–858.
https://doi.org/10.1172/JCI30920.850
Frey, R. S., & Singletary, K. W. (2003). Genistein Activates p38 Mitogen-Activated Protein
Kinase, Inactivates ERK1/ERK2 and Decreases Cdc25C Expression in Immortalized
Human Mammary Epithelial Cells. The Journal of Nutrition, 133(1), 226–231.
https://doi.org/10.1093/jn/133.1.226
Fu, Z., Zhang, W., Zhen, W., Lum, H., Nadler, J., Bassaganya-Riera, J., … Liu, D. (2010).
Genistein induces pancreatic β-cell proliferation through activation of multiple signaling
pathways and prevents insulin-deficient diabetes in mice. Endocrinology, 151(7), 3026–
3037. https://doi.org/10.1210/en.2009-1294
Fung, K. P., Li, H., Ko, C. H., Tsang, S. Y., Leung, P. C., & Fung, M. C. (2011). The ethanol
extract of Fructus trichosanthis promotes fetal hemoglobin production via p38 MAPK
activation and Erk inactivation in K562 cells. Evidence-Based Complementary and
Alternative Medicine, eCAM, 2011, 657056. https://doi.org/10.1093/ecam/neq022
Galenello, R., & Origa, R. (2010). Beta-thalassemia. Orphanet Journal of Rare Diseases,
5(11). https://doi.org/https://doi.org/10.1186/1750-1172-5-11
Ganai, A. A., & Farooqi, H. (2015). Bioactivity of genistein: A review of in vitro and in vivo
studies. Biomedicine and Pharmacotherapy, 76, 30–38.
https://doi.org/10.1016/j.biopha.2015.10.026
Ginder, G. D. (2015). Epigenetic regulation of fetal globin gene expression in adult erythroid
cells. Translational Research, 165(1), 115–125. https://doi.org/10.1016/j.trsl.2014.05.002
Goonasekera, H. W., Paththinige, C. S., & Dissanayake, V. H. W. (2018). Population
Screening for Hemoglobinopathies. Annual Review of Genomics and Human Genetics,
19, 355–380. https://doi.org/10.1146/annurev-genom-091416-035451
Gordon, J., Brown, M., & Reynolds, M. (2018). Cell-Based Methods for Determination of
Efficacy for Candidate Therapeutics in the Clinical Management of Cancer. Diseases,
6(4), 85. https://doi.org/10.3390/diseases6040085
Grieco, A. J., Billett, H. H., Green, N. S., Driscoll, M. C., & Bouhassira, E. E. (2015). Variation
in gamma-globin expression before and after induction with hydroxyurea associated with
BCL11A, KLF1 and TAL1. PLoS One, 10(6), e0129431.
https://doi.org/10.1371/journal.pone.0129431

Bibliography
87
Hebling, J., Bianchi, L., Basso, F. G., Scheffel, D. L., Soares, D. G., Carrilho, M. R. O., … De
Souza Costa, C. A. (2015). Cytotoxicity of dimethyl sulfoxide (DMSO) in direct contact
with odontoblast-like cells. Dental Materials, 31(4), 399–405.
https://doi.org/10.1016/j.dental.2015.01.007
Higgs, D. R., Engel, J. D., & Stamatoyannopoulos, G. (2012). Thalassaemia. Lancet,
379(9813), 373–383. https://doi.org/10.1016/S0140-6736(11)60283-3
Horváth, S. (1980). Cytotoxicity of drugs and diverse chemical agents to cell cultures.
Toxicology, 16(1), 59–66. https://doi.org/https://doi.org/10.1016/0300-483X(80)90110-9
Hsu, S., Lewis, J. B., Borke, J. L., Singh, B., Dickinson, D. P., Caughman, G. B., … Schuster,
G. S. (2001). Chemopreventive effects of green tea polyphenols correlate with reversible
induction of p57 expression. Anticancer Research, 21(6A), 3743–3748. Retrieved from
https://www.ncbi.nlm.nih.gov/pubmed/11911242
Hussain, S., & Ashafaq, M. (2018). Epigallocatechin-3-Gallate (EGCG): mechanisms,
perspectives and clinical applications in cervical cancer. Journal of Cancer Prevention &
Current Research, 9(4), 178–182. https://doi.org/10.15406/jcpcr.2018.09.00345
Im, H., Grass, J. A., Christensen, H. M., Perkins, A., & Bresnick, E. H. (2002). Histone
deacetylase-dependent establishment and maintenance of broad low-level histone
acetylation within a tissue-specific chromatin domain. Biochemistry, 41(51), 15152–
15160. https://doi.org/10.1021/bi026786q
Inez, F., Sequeira, M., Santos, P., Santos, R., & Nunes, E. (1993). Contribuição do rastreio de
portadores para a prevenção da β-talassémia e da drepanocitose na população
portuguesa: estudo multicêntrico. Arq INSA, 19, 27–31.
Ingram, D., Sanders, K., Kolybaba, M., & Lopez, D. (1997). Case-control study of phyto-
oestrogens and breast cancer. Lancet, 350(9083), 990–994.
https://doi.org/10.1016/S0140-6736(97)01339-1
Kato, G. J., Piel, F. B., Reid, C. D., Gaston, M. H., Ohene-Frempong, K., Krishnamurti, L., …
Vichinsky, E. P. (2018). Sickle cell disease. Nature Reviews. Disease Primers, 4(18010).
https://doi.org/10.1038/nrdp.2018.10
Klein, C. B., & King, A. A. (2007). Genistein genotoxicity: Critical considerations of in vitro
exposure dose. Toxicology and Applied Pharmacology, 224(1), 1–11.
https://doi.org/10.1016/j.taap.2007.06.022
Koeffler, H., & Golde, D. (1980). Human myeloid leukemia cell lines: a review. Blood, 56(3),
344–350. https://doi.org/https://doi.org/10.1182/blood.V56.3.344.bloodjournal563344

Bibliography
88
Kohara, Y., Kuwahara, R., Kawaguchi, S., Jojima, T., & Yamashita, K. (2014). Perinatal
exposure to genistein, a soy phytoestrogen, improves spatial learning and memory but
impairs passive avoidance learning and memory in offspring. Physiology and Behavior,
130, 40–46. https://doi.org/10.1016/j.physbeh.2014.03.006
Kong, A. N. T., Yu, R., Chen, C., Mandlekar, S., & Primiano, T. (2000). Signal Transduction
Events Elicited by Natural Products: Role of MAPK and Caspase Pathways in
Homeostatic Response and Induction of Apoptosis. Archives of Pharmacal Research,
23(1), 1–16. https://doi.org/10.1007/BF02976458
Kukreja, A., Wadhwa, N., & Tiwari, A. (2013). Therapeutic role of natural agents in beta-
thalassemia : A review. Journal of Pharmacy Research, 6(9), 954–959.
https://doi.org/10.1016/j.jopr.2013.10.002
Kurahashi, N., Iwasaki, M., Sasazuki, S., Otani, T., Inoue, M., & Tsugane, S. (2007). Soy
product and isoflavone consumption in relation to prostate cancer in Japanese men.
Cancer Epidemiology Biomarkers and Prevention, 16(3), 538–545.
https://doi.org/10.1158/1055-9965.EPI-06-0517
Lavelle, D., Engel, J. D., & Saunthararajah, Y. (2018). Fetal Hemoglobin Induction by
Epigenetic Drugs. Seminars in Hematology, 55(2), 60–67.
https://doi.org/10.1053/j.seminhematol.2018.04.008
Lee, M. M., Gomez, S. L., Chang, J. S., Wey, M., Wang, R. T., & Hsing, A. W. (2003). Soy and
isoflavone consumption in relation to prostate cancer risk in China. Cancer Epidemiology
Biomarkers and Prevention, 12(7), 665–668.
Lettre, G., & Bauer, D. E. (2016). Fetal haemoglobin in sickle-cell disease: from genetic
epidemiology to new therapeutic strategies. Lancet, 387(10037), 2554–2564.
https://doi.org/10.1016/S0140-6736(15)01341-0
Ley, T. J., DeSimone, J., Noguchi, C. T., Turner, P. H., Schechter, A. N., Heller, P., & Nienhuis,
A. W. (1983). 5-Azacytidine increases gamma-globin synthesis and reduces the
proportion of dense cells in patients with sickle cell anemia. Blood, 62(2), 370–380.
Retrieved from
https://pdfs.semanticscholar.org/09d7/568151553d52b10d71d495799a5d209501ff.pdf
Li, X. F., Wu, X. R., Xue, M., Wang, Y., Wang, J., Li, Y., … Yi, Z. C. (2012). The role of DNA
methylation in catechol-enhanced erythroid differentiation of K562 cells. Toxicology and
Applied Pharmacology, 265(1), 43–50. https://doi.org/10.1016/j.taap.2012.09.018
Li, Y., Wu, X. R., Li, X. F., Suriguga, Yu, C. H., Li, Y. R., & Yi, Z. C. (2013). Changes in DNA

Bibliography
89
methylation of erythroid-specific genes in K562 cells exposed to phenol and
hydroquinone. Toxicology, 312(1), 108–114. https://doi.org/10.1016/j.tox.2013.08.007
Liu, K., Xing, H., Zhang, S., Liu, S., & Fung, M. (2010). Cucurbitacin D induces fetal hemoglobin
synthesis in K562 cells and human hematopoietic progenitors through activation of p38
pathway and stabilization of the γ-globin mRNA. Blood Cells, Molecules, and Diseases,
45(4), 269–275. https://doi.org/10.1016/j.bcmd.2010.09.004
Liu, Y., Beyer, A., & Aebersold, R. (2016). On the Dependency of Cellular Protein Levels on
mRNA Abundance. Cell, 165(3), 535–550. https://doi.org/10.1016/j.cell.2016.03.014
Lobitz, S., Telfer, P., Cela, E., Allaf, B., Angastiniotis, M., Backman Johansson, C., …
Colombatti, R. (2018). Newborn screening for sickle cell disease in Europe :
recommendations from a Pan-European Consensus Conference. British Journal of
Haematology, 183(4), 648–660. https://doi.org/10.1111/bjh.15600
Lv, L., Shao, X., Chen, H., Ho, C. T., & Sang, S. (2011). Genistein inhibits advanced glycation
end product formation by trapping methylglyoxal. Chemical Research in Toxicology,
24(4), 579–586. https://doi.org/10.1021/tx100457h
Mabaera, R., West, R. J., Conine, S. J., Macari, E. R., Boyd, C. D., Engman, C. A., & Lowrey,
C. H. (2008). A cell stress signaling model of fetal hemoglobin induction: what doesn’t kill
red blood cells may make them stronger. Experimental Hematology, 36(9), 1057–1072.
https://doi.org/10.1016/j.exphem.2008.06.014
Mahdavi, M. R., Pourfarzad, F., Kosaryan, M., & Akbari, M. T. (2017). In vitro Hb production in
B-thalassemia patients is not a predictor of clinical responsiveness to hydroxyurea.
Iranian Journal of Public Health, 46(7), 948–956. Retrieved from
https://www.ncbi.nlm.nih.gov/pmc/articles/PMC5563877/
Martin, A., & Thompson, A. A. (2013). Thalassemias. Pediatric Clinics of North America, 60(6),
1383–1391. https://doi.org/10.1016/j.pcl.2013.08.008
Martins, M. C., Olim, G., Melo, J., Magalhaes, H. A., & Rodrigues, M. O. (1993). Hereditary
anaemias in Portugal: epidemiology, public health significance, and control. Journal of
Medical Genetics, 30(3), 235–239. https://doi.org/10.1136/jmg.30.3.235
Matte, A., Zorzi, F., Mazzi, F., Federti, E., Olivieri, O., & De Franceschi, L. (2019). New
therapeutic options for the treatment of sickle cell disease. Mediterranean Journal of
Hematology and Infectious Diseases, 11(1), e2019002.
https://doi.org/10.4084/mjhid.2019.002
Merchant, K., Kumi-Diaka, J., Rathinavelu, A., Esiobu, N., Zoeller, R., & Hormann, V. (2012).

Bibliography
90
Genistein modulation of immune-associated genes in LNCaP prostate cancer cell line.
The Open Prostate Cancer Journal, 5, 1–7.
https://doi.org/10.2174/1876822901205010001
Mereles, D., & Hunstein, W. (2011). Epigallocatechin-3-gallate (EGCG) for Clinical Trials: More
Pitfalls than Promises? International Journal of Molecular Sciences, 12(9), 5592–5603.
https://doi.org/10.3390/ijms12095592
Mirahmadi, S. M., Shahmohammadi, A., Rousta, A. M., Azadi, M. R., Fahanik-Babaei, J.,
Baluchnejadmojarad, T., & Roghani, M. (2017). Soy isoflavone genistein attenuates
lipopolysaccharide-induced cognitive impairments in the rat via exerting anti-oxidative
and anti-inflammatory effects. Cytokine, 104, 151–159.
https://doi.org/10.1016/j.cyto.2017.10.008
Miranda, A., Costa, S., Seuanes, F., Gaspar, G., Picanço, I., & Seixas, T. (2013). Estudo
bioquímico de portadores de hemoglobinopatias. Observações-Boletim Epidemiológico,
6(2), 16–18. Retrieved from
http://www2.insa.pt/sites/INSA/Portugues/PublicacoesRepositorio/Documents/observac
oesN62013_artigo6.pdf
Mirza, S., Sharma, G., Parshad, R., Gupta, S. D., Pandya, P., & Ralhan, R. (2013). Expression
of DNA methyltransferases in breast cancer patients and to analyze the effect of natural
compounds on DNA methyltransferases and associated proteins. Journal of Breast
Cancer, 16(1), 23–31. https://doi.org/10.4048/jbc.2013.16.1.23
Modell, B., & Darlison, M. (2008). Global epidemiology of haemoglobin disorders and derived
service indicators. Bulletin of the World Health Organization, 86(6), 480–487.
https://doi.org/10.2471/BLT.06.036673
Musallam, K. M., Taher, A. T., Cappellini, M. D., & Sankaran, V. G. (2013). Clinical experience
with fetal hemoglobin induction therapy in patients with β-thalassemia. Blood, 121(12),
2199–2212. https://doi.org/10.1182/blood-2012-10-408021
Muzolf-Panek, M., Gliszczynka-Swiglo, A., De Haan, L., Aarts, J. M., Szymusiak, H., Vervoort,
J. M., … Rietjens, I. M. (2008). Role of Catechin Quinones in the Induction of EpRE-
Mediated Gene Expression. Chemical Research in Toxicology, 21(12), 2352–2360.
https://doi.org/10.1021/tx8001498
Naciff, J. M., Khambatta, Z. S., Carr, G. J., Tiesman, J. P., Singleton, D. W., Khan, S. A., &
Daston, G. P. (2016). Dose- and time-dependent transcriptional response of Ishikawa
cells exposed to genistein. Toxicological Sciences, 151(1), 71–87.

Bibliography
91
https://doi.org/10.1093/toxsci/kfw024
Nagaraju, G. P., Zafar, S. F., & El-Rayes, B. F. (2013). Pleiotropic effects of genistein in
metabolic, inflammatory, and malignant diseases. Nutrition Reviews, 71(8), 562–572.
https://doi.org/10.1111/nure.12044
Ngo, D. A., & Steinberg, M. H. (2015). Genomic approaches to identifying targets for treating
β hemoglobinopathies. BMC Medical Genomics, 8(44). https://doi.org/10.1186/s12920-
015-0120-2
Ohnishi, S. T., Ohnishi, T., & Ogunmola, G. B. (2001). Green tea extract and aged garlic extract
inhibit anion transport and sickle cell dehydration in vitro. Blood Cells, Molecules &
Diseases, 27(1), 148–157. https://doi.org/10.1006/bcmd.2000.0368
Olivieri, N. F. (1999). The β-Thalassemias. The New England Journal of Medicine, 341(2), 99–
109. https://doi.org/DOI: 10.1056/NEJM199907083410207
Pace, B. S., Qian, X. H., Sangerman, J., Ofori-Acquah, S. F., Baliga, B. S., Han, J., & Critz, S.
D. (2003). p38 MAP kinase activation mediates γ-globin gene induction in erythroid
progenitors. Experimental Hematology, 31(11), 1089–1096.
https://doi.org/10.1016/S0301-472X(03)00235-2
Pan, M., Han, H., Zhong, C., & Geng, Q. (2012). Effects of genistein and daidzein on
hippocampus neuronal cell proliferation and bdnf expression in H19-7 neural cell line.
Journal of Nutrition, Health & Aging, 16(4), 389–394. https://doi.org/10.1007/s12603-011-
0140-3
Panche, A. N., Diwan, A. D., & Chandra, S. R. (2016). Flavonoids: An overview. Journal of
Nutritional Science, 5(e47). https://doi.org/10.1017/jns.2016.41
Park, O. J., & Surh, Y. J. (2004). Chemopreventive potential of epigallocatechin gallate and
genistein: Evidence from epidemiological and laboratory studies. Toxicology Letters,
150(1), 43–56. https://doi.org/10.1016/j.toxlet.2003.06.001
Penza, M., Montani, C., Romani, A., Vignolini, P., Pampaloni, B., Tanini, A., … Di Lorenzo, D.
(2006). Genistein affects adipose tissue deposition in a dose-dependent and gender-
specific manner. Endocrinology, 147(12), 5740–5751. https://doi.org/10.1210/en.2006-
0365
Philips, B. J., Coyle, C. H., Morrisroe, S. N., Chanchellor, M. B., & Yoshimura, N. (2009).
Induction of apoptosis in human bladder cancer cells by green tea catechins. Biomedical
Research, 30(4), 207–215. https://doi.org/https://doi.org/10.2220/biomedres.30.207

Bibliography
92
Piel, F. B., Patil, A. P., Howes, R. E., Nyangiri, O. A., Gething, P. W., Dewi, M., … Hay, S. I.
(2013). Global epidemiology of sickle haemoglobin in neonates : a contemporary
geostatistical model-based map and population estimates. The Lancet, 381(9861), 142–
151. https://doi.org/10.1016/S0140-6736(12)61229-X
Piel, F. B., Steinberg, M. H., & Rees, D. C. (2017). Sickle Cell Disease. The New England
Journal of Medicine, 376(16), 1561–1573. https://doi.org/10.1002/9781119001256.ch10
Platt, O. S., Orkin, S. H., Dover, G., Beardsley, G. P., Miller, B., & Nathan, D. G. (1984).
Hydroxyurea Enhances Fetal Hemoglobin Production in Sickle Cell Anemia. The Journal
of Clinical Investigation, 74(2), 652–656.
https://doi.org/https://doi.org/10.1172/JCI111464.
Pourfarzad, F., von Lindern, M., Azarkeivan, A., Hou, J., Kia, S. K., Esteghamat, F., …
Grosveld, F. (2013). Hydroxyurea responsiveness in β-thalassemic patients is determined
by the stress response adaptation of erythroid progenitors and their differentiation
propensity. Haematologica, 98(5), 696–704.
https://doi.org/10.3324/haematol.2012.074492
Pule, G. D., Mowla, S., Novitzky, N., & Wonkam, A. (2016). Hydroxyurea down-regulates
BCL11A, KLF-1 and MYB through miRNA-mediated actions to induce γ-globin
expression: implications for new therapeutic approaches of sickle cell disease. Clinical
and Translational Medicine, 5(15). https://doi.org/10.1186/s40169-016-0092-7
Qian, X., Chen, J., Zhao, D., Guo, L., & Qian, X. (2013). Plastrum testudinis induces γ-globin
gene expression through epigenetic histone modifications within the γ-globin gene
promoter via activation of the p38 MAPK signaling pathway. International Journal of
Molecular Medicine, 31(6), 1418–1428. https://doi.org/10.3892/ijmm.2013.1338
Raschke, M., Rowland, I. R., Magee, P. J., & Pool-Zobel, B. L. (2006). Genistein protects
prostate cells against hydrogen peroxide-induced DNA damage and induces expression
of genes involved in the defence against oxidative stress. Carcinogenesis, 27(11), 2322–
2330. https://doi.org/10.1093/carcin/bgl082
Rees, D. C., Williams, T. N., & Gladwin, M. T. (2010). Sickle-cell disease. Lancet, 376(9757),
2018–2031. https://doi.org/10.1016/S0140-6736(10)61029-X
Richard, N. P., Haley, K. M., & Recht, M. (2012). Thalassemia. In Elzouki A.Y., H. H.A., N.
H.M., S. F.B., O. W., & W. R.J. (Eds.), Textbook of Clinical Pediatrics (pp. 3029–3036).
Springer, Berlin, Heidelberg. https://doi.org/10.1007/978-3-642-02202-9
Riss, T. L., & Moravec, R. A. (2004). Use of multiple assay endpoints to investigate the effects

Bibliography
93
of incubation time, dose of toxin, and plating density in cell-based cytotoxicity assays.
Assay and Drug Development Technologies, 2(1), 51–62.
https://doi.org/10.1089/154065804322966315
Russo, M., Russo, G. L., Daglia, M., Kasi, P. D., Ravi, S., Nabavi, S. F., & Nabavi, S. M. (2016).
Understanding genistein in cancer: The “good” and the “bad” effects: A review. Food
Chemistry, 196, 589–600. https://doi.org/10.1016/j.foodchem.2015.09.085
Sankaran, V. G. (2011). Targeted Therapeutic Strategies for Fetal Hemoglobin Induction.
Hematology Am Soc Hematol Educ Program, 2011(1), 459–465.
https://doi.org/10.1182/asheducation-2011.1.459
Sankaran, V. G., & Orkin, S. H. (2013). The Switch from Fetal to Adult Hemoglobin. Cold Spring
Harbor Perspectives in Medicine, 3(1), a011643.
https://doi.org/10.1101/cshperspect.a011643
Sankaran, V. G., Xu, J., & Orkin, S. H. (2010). Advances in the understanding of haemoglobin
switching: Review. British Journal of Haematology, 149(2), 181–194.
https://doi.org/10.1111/j.1365-2141.2010.08105.x
Saunthararajah, Y., Lavelle, D., & DeSimone, J. (2004). DNA hypo-methylating agents and
sickle cell disease. British Journal of Haematology, 126(5), 629–636.
https://doi.org/10.1111/j.1365-2141.2004.05064.x
Schechter, A. N. (2008). Hemoglobin research and the origins of molecular medicine. Blood,
112(10), 3927–3938. https://doi.org/10.1182/blood-2008-04-078188
Schrier, S. L., & Angelucci, E. (2005). New Strategies in the Treatment of the Thalassemias.
Annual Review of Medicine, 56, 157–171.
https://doi.org/10.1146/annurev.med.56.082103.104718
Setchell, K. D., Faughnan, M. S., Avades, T., Zimmer-Nechemias, L., Brown, N. M., Wolfe, B.
E., … Cassidy, A. (2003). Comparing the pharmacokinetics of daidzein and genistein with
the use of13C-labeled tracers in premenopausal women. American Journal of Clinical
Nutrition, 77(2), 411–419. https://doi.org/10.1093/ajcn/77.2.411
Shu, Z. W., Zhang, X., Zheng, L., Zeng, G., Mo, Y., Yu, M., … Tan, X. (2018). Epigallocatechin-
3-gallate regulates mitofusin 2 expression through the peroxisome proliferator-activated
receptor-γ coactivator-1α and estrogen-related receptor-α pathway. Journal of Cellular
Biochemistry, 120(5), 7211–7221. https://doi.org/10.1002/jcb.27995
Shukla, Y. (2007). Tea and cancer chemoprevention: A comprehensive review. Asian Pacific
Journal of Cancer Prevention, 8(2), 155–166. Retrieved from

Bibliography
94
https://www.ncbi.nlm.nih.gov/pubmed/17696725
Singh, A., & Xu, Y. J. (2016). The cell killing mechanisms of hydroxyurea. Genes, 7(11), 99.
https://doi.org/10.3390/genes7110099
Singh, B., Shankar, S., & Srivastava, R. K. (2011). Green tea catechin , epigallocatechin-3-
gallate (EGCG): mechanisms , perspectives and clinical applications. Biochemical
Pharmacology, 82(12), 1807–1821. https://doi.org/10.1016/j.bcp.2011.07.093
Sinhadri, B. C. S. (2009). Effect of valproic acid on transient protein expression in HEK 293E
suspension adapted cells. Master’s Thesis. Uppsala University. Retrieved from
https://www.ibg.uu.se/digitalAssets/169/c_169881-l_3-k_sindhari-balaji-report.pdf
Stamatoyannopoulos, G. (2005). Control of globin gene expression during development and
erythroid differentiation. Experimental Hematology, 33(3), 259–271.
https://doi.org/10.1016/j.exphem.2004.11.007
Stanton, D. (2019). Bluebird’s gene therapy latest to feel ‘inevitable’ teething problems.
Retrieved January 11, 2020, from https://bioprocessintl.com/bioprocess-
insider/therapeutic-class/bluebirds-gene-therapy-latest-to-feel-inevitable-teething-
problems/
Sundaram, M. K., Unni, S., Somvanshi, P., Bhardwaj, T., Mandal, R. K., Hussain, A., & Haque,
S. (2019). Genistein Modulates Signaling Pathways and Targets Several Epigenetic
Markers in HeLa Cells. Genes, 10(12), 955.
https://doi.org/doi.org/10.3390/genes10120955
Taher, A. T., Weatherall, D. J., & Cappellini, M. D. (2018). Thalassaemia. Lancet, 391, 155–
167. https://doi.org/10.1016/S0140-6736(17)31822-6
Telen, M. J., Malik, P., & Vercellotti, G. M. (2019). Therapeutic strategies for sickle cell disease:
towards a multi-agent approach. Nature Reviews Drug Discovery, 18(2), 139–158.
https://doi.org/10.1038/s41573-018-0003-2
Thein, S. L. (2005). Genetic modifiers of beta-thalassemia. The Hematology Journal, 90(5),
649–660. Retrieved from
http://www.haematologica.org/content/haematol/90/5/649.full.pdf%0A
Thein, S. L. (2013). Genetic association studies in β-hemoglobinopathies. Hematology Am Soc
Hematol Educ Program, 2013, 354–361.
https://doi.org/https://doi.org/10.1182/asheducation-2013.1.354
Thein, S. L. (2017). Genetic Basis and Genetic Modifiers of β-Thalassemia and Sickle Cell

Bibliography
95
Disease. In P. Malik & J. Tisdale (Eds.), Gene and Cell Therapies for Beta-Globinopathies
(pp. 27–57). New York: Springer, New York, NY. https://doi.org/10.1007/978-1-4939-
7299-9_2
Theodorou, A., Phylactides, M., Forti, L., Cramarossa, M. R., Spyrou, P., Gambari, R., …
Kleanthous, M. (2016). The investigation of resveratrol and analogs as potential inducers
of fetal hemoglobin. Blood Cells, Molecules & Diseases Diseases, 58, 6–12.
https://doi.org/10.1016/j.bcmd.2015.11.007
Thephinlap, C., Ounjaijean, S., Khansuwan, U., Fucharoen, S., Porter, J. B., &
Srichairatanakool, S. (2007). Epigallocatechin-3-gallate and Epicatechin-3-gallate from
Green Tea Decrease Plasma Non-Transferrin Bound Iron and Erythrocyte Oxidative
Stress. Medicinal Chemistry, 3(3), 289–296.
https://doi.org/10.2174/157340607780620608
Thichanpiang, P., & Wongprasert, K. (2015). Green Tea Polyphenol Epigallocatechin-
Intercellular Adhesion Molecule-1 Expression and Monocyte Adhesion to Retinal Pigment
Epithelial Cells. The American Journal of Chinese Medicine, 43(1), 103–119.
https://doi.org/10.1142/S0192415X1550007X
Ullmann, U., Haller, J., Decourt, J. D., Girault, J., Spitzer, V., & Weber, P. (2004). Plasma-
kinetic characteristics of purified and isolated green tea catechin epigallocatechin gallate
(EGCG) after 10 days repeated dosing in healthy volunteers. International Journal for
Vitamin and Nutrition Research, 74(4), 269–278. https://doi.org/10.1024/0300-
9831.74.4.269
Ullmann, U., Metzner, J., Frank, T., Cohn, W., & Riegger, C. (2005). Safety, Tolerability, and
Pharmacokinetics of Single Ascending Doses of Synthetic Genistein (BonisteinTM) in
Healthy Volunteers. Advances In Natural Therapy, 22, 65–78.
https://doi.org/https://doi.org/10.1007/BF02850186
Vahid, F., Zand, H., Nosrat-Mirshekarlou, E., Najafi, R., & Hekmatdoost, A. (2015). The role
dietary of bioactive compounds on the regulation of histone acetylases and deacetylases:
a review. Gene, 562(1), 8–15. https://doi.org/10.1016/j.gene.2015.02.045
Vandenberg, L. N., Colborn, T., Hayes, T. B., Heindel, J. J., Jacobs, D. R., Lee, D. H., …
Myers, J. P. (2012). Hormones and endocrine-disrupting chemicals: low-dose effects and
nonmonotonic dose responses. Endocrine Reviews, 33(3), 378–455.
https://doi.org/10.1210/er.2011-1050
Verma, H. K., Lakkakula, S., & Lakkakula, B. (2018). Retrospection of the effect of hydroxyurea

Bibliography
96
treatment in patients with sickle cell disease. Acta Haematologica Polonica, 49(1), 1–8.
https://doi.org/10.2478/ahp-2018-0001
Ware, R. E., de Montalembert, M., Tshilolo, L., & Abboud, M. R. (2017). Sickle cell disease.
Lancet, 390(10091), 311–323. https://doi.org/10.1016/S0140-6736(17)30193-9
Wienert, B., Martyn, G. E., Funnell, A. P. W., Quinlan, K. G. R., & Crossley, M. (2018). Wake-
up Sleepy Gene: Reactivating Fetal Globin for β-Hemoglobinopathies. Trends in
Genetics, 34(12), 927–940. https://doi.org/10.1016/j.tig.2018.09.004
Wilber, A., Nienhuis, A. W., & Persons, D. A. (2011). Transcriptional regulation of fetal to adult
hemoglobin switching : new therapeutic opportunities. Blood, 117(15), 3945–3953.
https://doi.org/10.1182/blood-2010-11-316893
Williams, T. N., Mwangi, T. W., Wambua, S., Peto, T. E. A., Weatherall, D. J., Gupta, S., …
Marsh, K. (2005). Negative epistasis between the malaria-protective effects of alpha+-
thalassemia and the sickle cell trait. Nature Genetics, 37(11), 1253–1257.
https://doi.org/10.1038/ng1660
Williams, T. N., & Weatherall, D. J. (2012). World distribution , population genetics , and health
burden of the hemoglobinopathies. Cold Spring Harbor Perspectives in Medicine, 2(9),
a011692. https://doi.org/10.1101/cshperspect.a011692
Wolfram, S. (2007). Effects of green tea and EGCG on cardiovascular and metabolic health.
Journal of the American College of Nutrition, 26(4), 373–388.
https://doi.org/10.1080/07315724.2007.10719626
Wu, D., Shen, J., Yu, A. F., Fu, H., Zhou, H., & Shen, S. (2013). Epigallocatechin-3-gallate and
trichostatin A synergistically inhibit human lymphoma cell proliferation through epigenetic
modification of p16 INK4a. Oncology Reports, 30(6), 2969–2975.
https://doi.org/10.3892/or.2013.2734
Wu, F., Sun, H., Kluz, T., Clancy, H. A., Kiok, K., & Costa, M. (2012). Epigallocatechin-3-gallate
(EGCG) protects against chromate-induced toxicity in vitro. Toxicology and Applied
Pharmacology, 258(2), 166–175. https://doi.org/10.1016/j.taap.2011.10.018
Xu, F., & Guo, Y. (2018). Communicable diseases and the genome revolution. The Lancet
Global Health, 6(7), e720–e721. https://doi.org/10.1016/S2214-109X(18)30261-4
Xu, S., & Xu, X. (2018). Research Advances in the Correlation between Peroxisome
Proliferator-Activated Receptor-γ and Digestive Cancers. PPAR Research, 5289859.
https://doi.org/10.1155/2018/5289859

Bibliography
97
Xu, Z., Liu, J., Wu, X., Huang, B., & Pan, X. (2017). Nonmonotonic responses to low doses of
xenoestrogens: A review. Environmental Research, 155, 199–207.
https://doi.org/10.1016/j.envres.2017.02.018
Yamashita, Y., Wang, L., Wang, L., Tanaka, Y., Zhang, T., & Ashida, H. (2014). Oolong, black
and pu-erh tea suppresses adiposity in mice via activation of AMP-activated protein
kinase. Food & Function, 5(10), 2420–2429. https://doi.org/10.1039/c4fo00095a
Yang, Z., Kulkarni, K., Zhu, W., & Hu, M. (2012). Bioavailability and pharmacokinetics of
genistein: mechanistic studies on its ADME. Anti-Cancer Agents in Medicinal Chemistry,
12(10), 1264–1280. https://doi.org/10.2174/187152012803833107
Ye, L., Wang, J., Tan, Y., Beyer, A. I., Xie, F., Muench, M. O., & Kan, Y. W. (2016). Genome
editing using CRISPR-Cas9 to create the HPFH genotype in HSPCs: An approach for
treating sickle cell disease and β-thalassemia. Proceedings of the National Academy of
Sciences of the United States of America, 113(38), 10661–10665.
https://doi.org/10.1073/pnas.1612075113
Zhang, C., & Zhuo, L. (2006). Epigallocatechin gallate and genistein attenuate glial fibrillary
acidic protein elevation induced by fibrogenic cytokines in hepatic stellate cells.
International Journal of Molecular Medicine, 18(6), 1141–1151.
https://doi.org/10.3892/ijmm.18.6.1141
Zhou, D., Liu, K., Sun, C. W., Pawlik, K. M., & Townes, T. M. (2010). KLF1 regulates BCL11A
expression and gamma- to beta-globin gene switching. Nature Genetics, 42(9), 742–744.
https://doi.org/10.1038/ng.637
Zhou, Q., Chiang, H., Portocarrero, C., Zhu, Y., Hill, S., Heppert, K., … Kissinger, P. (2002).
Investigating the stability of EGCg in aqueous media. Current Separations, 20(3), 83-86.
Retrieved from https://www.basinc.com/assets/library/issues/20-3/20-3c.pdf

98
Appendices

Appendices
99
Appendix 1
• RNA quantification of genistein treatments
• RNA quantification of epigallocatechin-3-gallate treatments
Genistein 72h [mRNA] ƞg/µl
Plate A
GN 100 ƞg/ml 9.68
GN 250 ƞg/ml 37.80 GN 500 ƞg/ml 6.48
HU 25 µg/ml 72.60 DMSO 500 ƞg/ml 5.40
Control 2.60
Plate B
GN 100 ƞg/ml 22.40
GN 250 ƞg/ml 7.64 GN 500 ƞg/ml 9.08 HU 25 µg/ml 44.00
DMSO 500 ƞg/ml 2.74 Control 6.64
Plate C
GN 100 ƞg/ml 8.00 GN 250 ƞg/ml 8.96
GN 500 ƞg/ml 26.40 HU 25 µg/ml 60.20
DMSO 500 ƞg/ml 5.20 Control 11.10
Genistein 96h [mRNA] ƞg/µl
Plate D
GN 100 ƞg/ml 153
GN 250 ƞg/ml 34.4 GN 500 ƞg/ml 16.4
HU 25 µg/ml 26.6 DMSO 500 ƞg/ml 19.9
Control 20.4
Plate E
GN 100 ƞg/ml 36
GN 250 ƞg/ml 11 GN 500 ƞg/ml 14
HU 25 µg/ml 17.9 DMSO 500 ƞg/ml 66
Control 88.8
Plate F
GN 100 ƞg/ml 200 GN 250 ƞg/ml 112
GN 500 ƞg/ml 64.4 HU 25 µg/ml 18.2
DMSO 500 ƞg/ml 112 Control 36
Epigallocatechin- 3-gallate 72h
[mRNA] ƞg/µl
Plate A
EGCG 100 ƞg/ml 43.20
EGCG 250 ƞg/ml 47.60 EGCG 500 ƞg/ml 30.80
HU 25 µg/ml 24.50 Control 28.60
Plate B
EGCG 100 ƞg/ml 37.40 EGCG 250 ƞg/ml 53.20 EGCG 500 ƞg/ml 77.20
HU 25 µg/ml 29.10 Control 91.20
Plate C
EGCG 100 ƞg/ml 44.40 EGCG 250 ƞg/ml 64.00
EGCG 500 ƞg/ml 46.40 HU 25 µg/ml 2.55
Control 57.60
Epigallocatechin- 3-gallate 96h
[mRNA] ƞg/µl
Plate D
EGCG 100 ƞg/ml 162.00 EGCG 250 ƞg/ml 12.80
EGCG 500 ƞg/ml 16.70 HU 25 µg/ml 1.33
Control 121.00
Plate E
EGCG 100 ƞg/ml 56.80
EGCG 250 ƞg/ml 169.00 EGCG 500 ƞg/ml 141.00
HU 25 µg/ml 3.65
Control 134.00
Plate F
EGCG 100 ƞg/ml 32.70
EGCG 250 ƞg/ml 33.70 EGCG 500 ƞg/ml 49.60
HU 25 µg/ml 6.57 Control 59.70

Elisabete Cristina Conceição de Matos
2020


![CANNABINOID-LIKE ANTI-INFLAMMATORY COMPOUNDS …signaling pathway that inhibits pro-inflammatory and increases anti-inflammatory gene expression [18-20]. ... chromatograph with a PDA](https://static.fdocuments.in/doc/165x107/609561177fd04d6d4c1f28b1/cannabinoid-like-anti-inflammatory-compounds-signaling-pathway-that-inhibits-pro-inflammatory.jpg)
![Duo MFA Managing Your Devices - University of MiamiMulti-Factor Authentication (MFA) Documentation: Managing Devices [5] Reactivate Duo Mobile Click the “Reactivate Duo Mobile”](https://static.fdocuments.in/doc/165x107/5f1e89f8efa5f70a91561bbb/duo-mfa-managing-your-devices-university-of-miami-multi-factor-authentication.jpg)