Natural aerosols explain seasonal and spatial patterns of ...
12
CLIMATE SCIENCE 2015 © The Authors, some rights reserved; exclusive licensee American Association for the Advancement of Science. Distributed under a Creative Commons Attribution NonCommercial License 4.0 (CC BY-NC). 10.1126/sciadv.1500157 Natural aerosols explain seasonal and spatial patterns of Southern Ocean cloud albedo Daniel T. McCoy, 1 * † Susannah M. Burrows, 2 * † Robert Wood, 1 Daniel P. Grosvenor, 3 Scott M. Elliott, 4 Po-Lun Ma, 2 Phillip J. Rasch, 2 Dennis L. Hartmann 1 Atmospheric aerosols, suspended solid and liquid particles, act as nucleation sites for cloud drop formation, affecting clouds and cloud properties—ultimately influencing the cloud dynamics, lifetime, water path, and areal extent that determine the reflectivity (albedo) of clouds. The concentration N d of droplets in clouds that influences planetary albedo is sensitive to the availability of aerosol particles on which the droplets form. Natural aerosol concentrations affect not only cloud properties themselves but also modulate the sensitivity of clouds to changes in anthropogenic aerosols. It is shown that modeled natural aerosols, principally marine biogenic primary and secondary aerosol sources, explain more than half of the spatiotemporal variability in satellite-observed N d . Enhanced N d is spatially correlated with regions of high chlorophyll a, and the spatiotemporal variability in N d is found to be driven primarily by high concentrations of sulfate aerosol at lower Southern Ocean latitudes (35 o to 45 o S) and by organic matter in sea spray aerosol at higher latitudes (45 o to 55 o S). Biogenic sources are estimated to increase the summertime mean reflected solar radiation in excess of 10 W m –2 over parts of the Southern Ocean, which is comparable to the annual mean increases expected from anthropogenic aerosols over heavily polluted regions of the Northern Hemisphere. INTRODUCTION The Southern Ocean (SO) is an expansive and dynamic ocean with rich ecosystems remote from most human influences. It is also the cloudiest region on Earth. These clouds influence the atmospheric and oceanic circulation of the entire Southern Hemisphere and beyond (1), and may help determine the Earth’s climate sensitivity (2). Its remoteness from anthropogenic and natural continental aerosol sources makes the SO a unique natural laboratory for our understanding of aerosol- cloud interactions. Aerosols influence clouds by acting as the cloud con- densation nuclei (CCN) on which cloud droplets form, and the resulting concentration N d of cloud droplets influences the amount of sunlight reflected by clouds (3). Aerosol processes remain a poorly understood influence on clouds (4). Processes regulating the concentration of nat- urally occurring aerosols, in particular, remain a major source of uncer- tainty, limiting our ability to quantify the magnitude of the human impact on climate from aerosols (5, 6). The rich biological activity in the SO produces a range of biogenic aerosols and aerosol precursor gases (7). Marine biogenic emissions in- fluence atmospheric aerosols in this region, both through primary emis- sions of organic matter in sea spray aerosol (SSA) (8) and through secondary aerosol formation processes, that is, the condensation of vol- atile sulfurous and organic compounds (7–9). The effect of marine biota on clouds and climate through biogenic sulfate aerosol has been the sub- ject of intense research for several decades (10). In recent years, primary organic aerosol species have received considerable attention as well (8). Chlorophyll a (Chl-a), a proxy for the phytoplankton biomass believed to be a source for aerosol and aerosol precursors, has been found to be negatively correlated with the radius of cloud droplets over the seasonal cycle in selected biologically active regions of the SO, indicating that aerosol originating from marine microbial communities may be asso- ciated with enhanced concentrations of CCN (11, 12). Although previ- ous investigations did much to probe the coupling between biological activity and clouds (8, 10–14), they were limited in three ways. First, previous studies did not correct for seasonal biases in the remote sensing of cloud properties at high latitudes, which were unknown at the time. This conflated true seasonal variations in N d due to CCN number with seasonal retrieval biases due to solar angle. Second, they did not examine the distributions of both primary aerosols and secondary sulfate aero- sols from marine biota and their respective roles as mediators of the Chl-a–N d correlation. Finally, most previous studies examined limited regions within the SO where strong seasonal cycles in Chl-a may cor- relate with underlying seasonal cycles in meteorological variables, confounding the detection of an unambiguous signal of phytoplankton effects on clouds. The Moderate Resolution Imaging Spectroradiometer (MODIS) instrument on the NASA Terra satellite offers remotely sensed esti- mates of N d with global coverage. In this work, we use a new MODIS N d data set that eliminates certain retrieval biases (15), allowing for the first time the comprehensive study of the relationship between N d and modeled marine biogenic aerosols over the entire SO. Biases due to seasonal-latitudinal variations in the solar zenith angle (SZA) affect the visible to near-infrared satellite retrievals of cloud optical thickness and droplet effective radius used by MODIS to estimate N d. These biases are mitigated by removing all retrievals with SZA >65° (15). RESULTS AND DISCUSSION With this new data set, we find that spring-summer-autumn (September to April) mean that N d values are elevated in the regions of the SO with the most active ocean biology as indicated by Chl-a (Fig. 1), demonstrating that ocean biology drives variations in N d across the entire SO. 1 Department of Atmospheric Sciences, University of Washington, Seattle, WA 98195– 1640, USA. 2 Atmospheric Sciences Division, Pacific Northwest National Laboratory, Richland, WA 99352, USA. 3 School of Earth and Environment, University of Leeds, Leeds LS2 9JT, UK. 4 Climate Ocean Sea Ice Modeling team, Computational Physics and Methods group, Los Alamos National Laboratory, Los Alamos, NM 87545, USA. *Corresponding author. E-mail: [email protected] (D.T.M.); susannah.burrows@ pnnl.gov (S.M.B.) †These authors contributed equally to this work. RESEARCH ARTICLE McCoy et al. Sci. Adv. 2015;1:e1500157 17 July 2015 1 of 12
Transcript of Natural aerosols explain seasonal and spatial patterns of ...

R E S EARCH ART I C L E
CL IMATE SC I ENCE
1Department of Atmospheric Sciences, University of Washington, Seattle, WA 98195–1640, USA. 2Atmospheric Sciences Division, Pacific Northwest National Laboratory,Richland, WA 99352, USA. 3School of Earth and Environment, University of Leeds,Leeds LS2 9JT, UK. 4Climate Ocean Sea Ice Modeling team, Computational Physics andMethods group, Los Alamos National Laboratory, Los Alamos, NM 87545, USA.*Corresponding author. E-mail: [email protected] (D.T.M.); [email protected] (S.M.B.)†These authors contributed equally to this work.
McCoy et al. Sci. Adv. 2015;1:e1500157 17 July 2015
2015 © The Authors, some rights reserved;
exclusive licensee American Association for
the Advancement of Science. Distributed
under a Creative Commons Attribution
NonCommercial License 4.0 (CC BY-NC).
10.1126/sciadv.1500157
Natural aerosols explain seasonal and spatialpatterns of Southern Ocean cloud albedo
Daniel T. McCoy,1*† Susannah M. Burrows,2*† Robert Wood,1 Daniel P. Grosvenor,3Scott M. Elliott,4 Po-Lun Ma,2 Phillip J. Rasch,2 Dennis L. Hartmann1
Atmospheric aerosols, suspended solid and liquid particles, act as nucleation sites for cloud drop formation, affectingclouds and cloud properties—ultimately influencing the cloud dynamics, lifetime, water path, and areal extent thatdetermine the reflectivity (albedo) of clouds. The concentration Nd of droplets in clouds that influences planetaryalbedo is sensitive to the availability of aerosol particles on which the droplets form. Natural aerosol concentrationsaffect not only cloud properties themselves but also modulate the sensitivity of clouds to changes in anthropogenicaerosols. It is shown that modeled natural aerosols, principally marine biogenic primary and secondary aerosolsources, explain more than half of the spatiotemporal variability in satellite-observed Nd. Enhanced Nd is spatiallycorrelated with regions of high chlorophyll a, and the spatiotemporal variability in Nd is found to be driven primarilyby high concentrations of sulfate aerosol at lower SouthernOcean latitudes (35o to 45oS) and by organicmatter in seaspray aerosol at higher latitudes (45o to 55oS). Biogenic sources are estimated to increase the summertime meanreflected solar radiation in excess of 10 W m–2 over parts of the Southern Ocean, which is comparable to the annualmean increases expected from anthropogenic aerosols over heavily polluted regions of the Northern Hemisphere.
INTRODUCTION
The SouthernOcean (SO) is an expansive and dynamic ocean with richecosystems remote frommost human influences. It is also the cloudiestregion on Earth. These clouds influence the atmospheric and oceaniccirculation of the entire Southern Hemisphere and beyond (1), andmay help determine the Earth’s climate sensitivity (2). Its remotenessfrom anthropogenic and natural continental aerosol sources makesthe SO a unique natural laboratory for our understanding of aerosol-cloud interactions. Aerosols influence clouds by acting as the cloud con-densationnuclei (CCN) onwhich clouddroplets form, and the resultingconcentration Nd of cloud droplets influences the amount of sunlightreflected by clouds (3). Aerosol processes remain a poorly understoodinfluence on clouds (4). Processes regulating the concentration of nat-urally occurring aerosols, in particular, remain amajor source of uncer-tainty, limiting our ability to quantify the magnitude of the humanimpact on climate from aerosols (5, 6).
The rich biological activity in the SO produces a range of biogenicaerosols and aerosol precursor gases (7). Marine biogenic emissions in-fluence atmospheric aerosols in this region, both through primary emis-sions of organic matter in sea spray aerosol (SSA) (8) and throughsecondary aerosol formation processes, that is, the condensation of vol-atile sulfurous and organic compounds (7–9). The effect ofmarine biotaon clouds and climate throughbiogenic sulfate aerosol has been the sub-ject of intense research for several decades (10). In recent years, primaryorganic aerosol species have received considerable attention as well (8).Chlorophyll a (Chl-a), a proxy for the phytoplankton biomass believedto be a source for aerosol and aerosol precursors, has been found to be
negatively correlated with the radius of cloud droplets over the seasonalcycle in selected biologically active regions of the SO, indicating thataerosol originating from marine microbial communities may be asso-ciated with enhanced concentrations of CCN (11, 12). Although previ-ous investigations did much to probe the coupling between biologicalactivity and clouds (8, 10–14), they were limited in three ways. First,previous studies did not correct for seasonal biases in the remote sensingof cloud properties at high latitudes, which were unknown at the time.This conflated true seasonal variations inNd due to CCN number withseasonal retrieval biases due to solar angle. Second, they did not examinethe distributions of both primary aerosols and secondary sulfate aero-sols from marine biota and their respective roles as mediators of theChl-a–Nd correlation. Finally, most previous studies examined limitedregions within the SO where strong seasonal cycles in Chl-a may cor-relate with underlying seasonal cycles in meteorological variables,confounding the detection of an unambiguous signal of phytoplanktoneffects on clouds.
The Moderate Resolution Imaging Spectroradiometer (MODIS)instrument on the NASA Terra satellite offers remotely sensed esti-mates of Nd with global coverage. In this work, we use a new MODISNd data set that eliminates certain retrieval biases (15), allowing for thefirst time the comprehensive study of the relationship betweenNd andmodeled marine biogenic aerosols over the entire SO. Biases due toseasonal-latitudinal variations in the solar zenith angle (SZA) affectthe visible to near-infrared satellite retrievals of cloud optical thicknessand droplet effective radius used byMODIS to estimateNd. These biasesare mitigated by removing all retrievals with SZA >65° (15).
RESULTS AND DISCUSSION
With thisnewdata set,we find that spring-summer-autumn(September toApril) mean that Nd values are elevated in the regions of the SO with themost active ocean biology as indicated by Chl-a (Fig. 1), demonstratingthat ocean biology drives variations in Nd across the entire SO.
1 of 12
R E S EARCH ART I C L E
Correlations between Nd and candidate aerosolsIt is interesting that a significant correlation is found between regions ofhigh Chl-a and enhanced Nd; however, a more physical understandingof what drives the spatiotemporal variability in the SO necessitates in-vestigation of the SO CCN amount and provenance. Unfortunately,remote sensing alone cannot determine the detailed chemicalcomposition of aerosol. In particular, it cannot distinguish betweensea salt (SS), sulfate, and organic aerosol because they all primarily scat-ter rather than absorb incoming radiation. To determine which aerosolspecies are responsible for driving the observed Chl-a–Nd relationshipover the SO, we combine Nd observations with candidate aerosolproducts derived from global modeling to develop a regression modelto predict Nd over the SO. Sulfate and SS surface concentrations are ta-ken from the multimodel median year 2000 global model simulationsperformed for phase 1 of the AeroCom project (16). Aerosol modelingis extremely complex and subject to a great deal of uncertainty and, con-sequently, intermodel disagreement (17). Because of this diversity, theuse of the AeroCom multimodel median data set is likely to provide amore robust representation of the distribution of an aerosol species thanany single model. The non-SS aerosol candidates selected here, marineorganic matter and SO4, have been chosen on the basis of observationalevidence for their efficacy as CCN. Sulfate aerosol is found to serve ef-ficiently as a CCN (18, 19), and in situmeasurements inmarine air haveidentified a contribution of organic aerosols to CCN (20). In the SOregion, dust may be important as a source of ice nuclei (21, 22) and oce-anic micronutrients such as iron (23, 24). However, dust sources in theSouthern Hemisphere are minimal, and the mean contribution to the
McCoy et al. Sci. Adv. 2015;1:e1500157 17 July 2015
total aerosol number and CCN in the SO is small, particularly whencompared to sea spray and sulfate aerosol. This has been establishedby satellite and in situ observations and is reflected in global chemistry-climate models (17, 25–31). We will now discuss the inclusion of organicenrichment of SSA as a predictor variable.
The mechanisms by which phytoplankton affect organic aerosol inthe atmosphere are a subject of ongoing research and debate, and thereis no consensus yet on the effect of marine phytoplankton and organicmatter on the number, size,mixing state, and detailed organic chemistryof emitted particles.Model simulations of atmospheric transport and re-moval of aerosols, and of aerosol-cloud interactions, are extremely sen-sitive to the details of such assumptions in models, and differing choicesmay result in strong changes of themagnitude or even the sign of effectson CCN and Nd (12). Furthermore, although strong evidence supportsthe existence of a primary sea spray source ofmarine organic aerosol, therelative importance of condensational growth by secondary aerosol for-mation from marine precursor compounds is not well understood.However, a greater role for primary organics is suggested by evidencesuch as (i) the chemical similarity of aerosol generated at sea to ambientmarine aerosol (32–34); (ii) single-particle measurements of marine or-ganic particles, which show that these particles frequently contain solidfragments and agglomerates that cannot be explained by condensation(35–37); (iii) the correlation of wind speed with organic mass fraction(OMF) observed at sea in remote locations (38); and (iv) the obser-vation that until now, most studies of which we are aware are able todemonstrate only a negligible to minor contribution to organic mass(OM) in naturally occurring marine aerosol from condensation of or-ganic precursor gases [for example, oxalate (39, 40) or isoprene (41)] orfrom atmospheric oxidation processes (39, 42). Here, we use the OMFin emitted submicron SSA as a proxy for the effect of marine organicmatter on primary SSA. OMF is calculated using OCEANFILMS, aphysically based framework that models the enrichment of emittedprimary sea spray particles with organic matter as being driven by ad-sorption of surface-active organics at the air-water interfaces of oceanbubbles, using fields from an ocean biogeochemical model to drive theanalysis (43, 44). Observational evaluation of theOCEANFILMSmodelshows skill in predicting OMF (43) despite inherent limitations in ourability to fully represent the complexity of ocean biogeochemistry (45).Although theOMFof emitted particles is not a direct estimate of aerosolnumber concentration, it has the virtue of not requiring additional as-sumptions to be made about the emissions process, for which observa-tional support is not yet available. In particular, the effect on emittednumber is a critical parameter needed bymodels to simulate the impactof marine organics on CCNnumber inmodels (46).We are unaware offirm observational evidence from field or laboratory studies that can in-form models as to whether the total number and mass of SSA emittedincrease, decrease, or remain the same in the presence of marine organ-ics, although limited evidence suggests that total emissionsmay increaseunder some circumstances (47).
The OCEANFILMS parameterization is the first mechanistic modelof the enrichment of organic matter in SSA appropriate for use in aglobal atmospheric model. An important feature of this model that dis-tinguishes it fromprevious parameterizations ofOMF is that it allows fora contribution to organic enrichment of SSA by classes of moleculeswhose spatial distribution is decoupled from that of Chl-a, namely,the polysaccharide- and protein-like classes of semi-labile organicmacromolecules. This is particularly important in the nutrient-poor re-gions of the ocean, where Chl-a and primary productivity are low, but
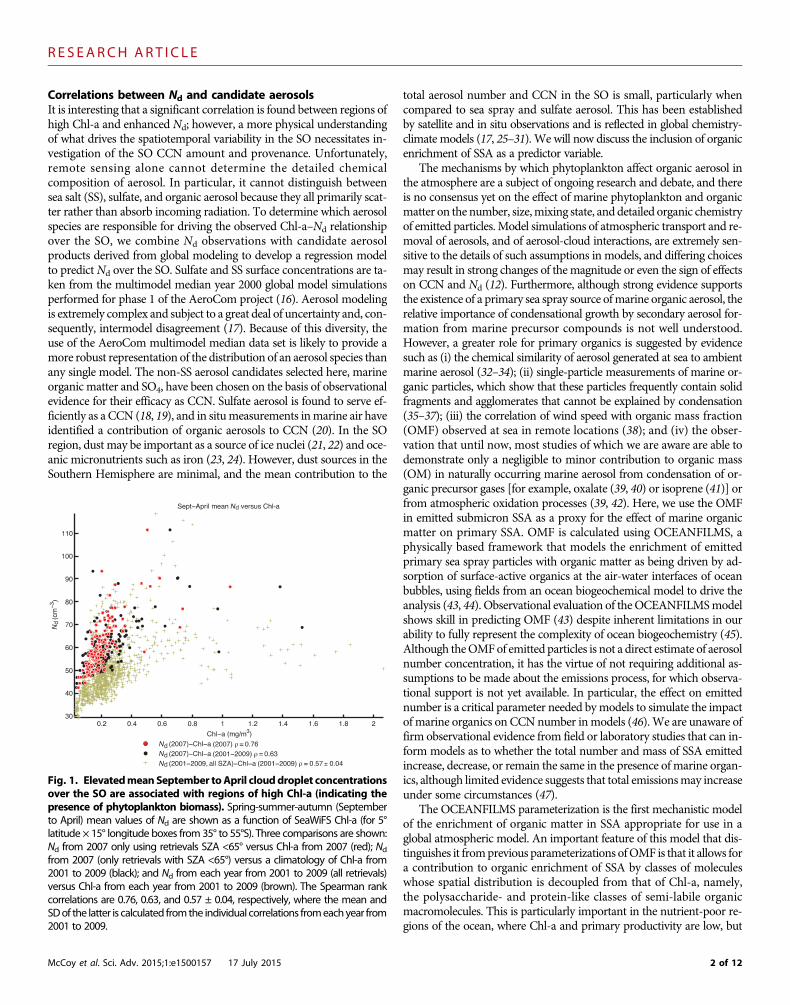
Fig. 1. ElevatedmeanSeptember toApril clouddroplet concentrationsover the SO are associated with regions of high Chl-a (indicating the
presence of phytoplankton biomass). Spring-summer-autumn (Septemberto April) mean values of Nd are shown as a function of SeaWiFS Chl-a (for 5°latitude × 15° longitude boxes from 35° to 55°S). Three comparisons are shown:Nd from 2007 only using retrievals SZA <65° versus Chl-a from 2007 (red); Ndfrom 2007 (only retrievals with SZA <65°) versus a climatology of Chl-a from2001 to 2009 (black); and Nd from each year from 2001 to 2009 (all retrievals)versus Chl-a from each year from 2001 to 2009 (brown). The Spearman rankcorrelations are 0.76, 0.63, and 0.57 ± 0.04, respectively, where the mean andSDof the latter is calculated fromthe individual correlations fromeachyear from2001 to 2009.2 of 12

R E S EARCH ART I C L E
longer-lived marine organic matter is imported by ocean currents fromregions of high primary production. Observations show that for a givenChl-a concentration,marine aerosol organic enrichment in oligotrophicregions is higher than would be suggested by extrapolation from obser-vations inmid-latitude bloom regions such as those in theNorth Atlan-tic (32, 47–49).
The candidate aerosol products used as predictors for Nd are near-surface sulfate (SO4) concentration, near-surface SS concentration, andOMF of emitted SSA. Additional candidate predictors considered arethe surface wind speed, sea surface temperature (SST), ocean dimethylsulfide (DMS) concentration (50), and Chl-a.
The relationships between Nd and the predictor variables were de-termined bymultiple linear regression onmonthly mean data averagedover 15° longitude × 5° latitude bins for those months where Nd re-trievals are available. By using geographically binned monthly meandata, we improve signal-to-noise ratio and mitigate potential samplingbiases related to the greater availability of usable retrievals. The uncer-tainty range in the variability in Nd explained by each set of predictorvariables (R2) was obtained using the 10-fold cross-validation (51)procedure repeated 10 times. The variability explained by eachpredictoris reported in Table 1. Individually, SO4 and OMF are the two variablesthat explain the most seasonal and geographical variability in Nd, ex-plaining 48 ± 7% and 35 ± 10%, respectively. These relationships areshown in Fig. 1. An increase inNdwithOMF (Fig. 1A) is found for high,intermediate, and low SO4. Similarly, for a given concentration of SO4,Nd generally increases with OMF (Fig. 2B). The SO4 concentration andthe OMF are only moderately correlated with each other (R2 = 0.39),indicating the appropriateness of including both as independent pre-dictors here. Only 9 ± 4% of theNd variance is explained by SS, indicat-ing that sea salt mass loading is not an important contributor to thespatial and seasonal variability in Nd over the SO during Septemberthrough April. The variances explained in the spatial structure of the
McCoy et al. Sci. Adv. 2015;1:e1500157 17 July 2015
September to April Nd by SO4 and OMF are 48 ± 24% and 33 ± 22%,respectively.
Themultiple linear fit to both SO4 andOMF explains 53 ± 6% of thevariance in Nd, and the inclusion of additional aerosol-related predic-tors, including sea salt, did not significantly increase the explained var-iance. The total spatial variance in the September to April meanexplained by OMF + SO4 is 53 ± 22%. We find that monthly meanNd as predicted by this regression is within 20% of observed Nd 74%of the time. The regression model of Nd is
Nd ¼ 137 T 3cm−3m3
mg
� �SO4½ � þ 58 T 2 cm−3� ÞOMFþ 36 T 0:2 cm−3
ð1Þwhere Nd has units of cm
−3, the surface SO4 concentration has unitsof mg m−3, and OMF is dimensionless. The constant term can beconsidered as the expected Nd over an ocean devoid of biological activ-ity and is similar to aircraft measurements ofNdmade off the coast ofTasmania (52) during winter, when biogenic aerosol sources areminimal.
Although this analysis cannot explicitly determine the compositionof the CCN that determines background values of Nd (≈36 cm−3), asestimated from the constant term in Eq. 1, it is likely that thisbackground is largely attributable to SS. A detailed model study ofCCN sources over the SO (7) found that SS contributed significantly,but the simulated number ofCCN fromSSwas almost the same in sum-mer and winter. As a result, SS explains little of the variance in Nd, butlikely contributes to the constant term in the multiple linear regression.Under the assumption that the constant term is entirely attributable toSS, the summertime contribution of SS to Nd is about 55% and thewintertime contribution is near 80% in the 35° to 55°S region. As shownin Fig. 3, this is highly consistentwith a previousmodel evaluation of therelative importance of SO4 and SS as CCN in the SO, with a January
Table 1. The variability in Nd explained by each predictor. R2 is given in percent for both unweighted calculations and a robust calculation using bi-square weights, using a bias-corrected Nd data set. Spatial R2 values are calculated by applying the same regression procedure and using bi-squareweights, but using time-averaged values of bias-corrected Nd for the period September through April. Additional notes following asterisks give the R2
values calculated using a 9-yearmonthly climatology ofMODISNd including retrievals at all SZAs. Uncertainties are the SDs of estimates of R2 from 10-foldcross-validation, repeated 10 times.
R2 (%)
R2 (robust, %) Spatial R2OMF
24 ± 5 35 ± 10 *(14 ± 4, 16 ± 4) 33 ± 22SO4
45 ± 7 48 ± 7 *(20 ± 6, 23 ± 7) 48 ± 24OMF + SO4
49 ± 5 53 ± 6 *(22 ± 6, 28 ± 7) 53 ± 22OMF + SO4 + SS + wind
49 ± 6 53 ± 5 57 ± 20OMF + SO4 + SS
49 ± 6 53 ± 7 58 ± 22SS
11 ± 4 9 ± 4 16 ± 17SST
4 ± 3 3 ± 2 13 ± 13Wind
14 ± 4 13 ± 3 18 ± 18SS + wind
14 ± 4 13 ± 4 14 ± 13SST + wind + SS
16 ± 5 17 ± 4 16 ± 13Chl-a
20 ± 7 35 ± 13 55 ± 24DMS
15 ± 6 19 ± 6 12 ± 113 of 12
R E S EARCH ART I C L E
contribution from SS of 48% at 30° to 45°S, 58% at 45° to 60°S, and awintertime contribution of >80% at 30° to 45°S and >90% farthersouth (7).
Because the modeled sulfate concentration, the modeled OMF, andthe satellite data do not represent the same years, our analysis cannotcapture interannual variability in clouds or ocean biota. As seen in theobserved correlation between Chl-a and Nd, the correlation decreases
McCoy et al. Sci. Adv. 2015;1:e1500157 17 July 2015
significantly when a climatology of Chl-a is used instead of the Chl-aobserved in the same year as the Nd data (Fig. 1), suggesting thatmatching of the exact location, timing, and strength of phytoplanktonblooms can improve the correlation between the presence of oceanicphytoplankton and cloud properties. This suggests that the predictive ca-pability of the regression model in Eq. 1 might also be further improvedby better representation of the interannual variability of simulated
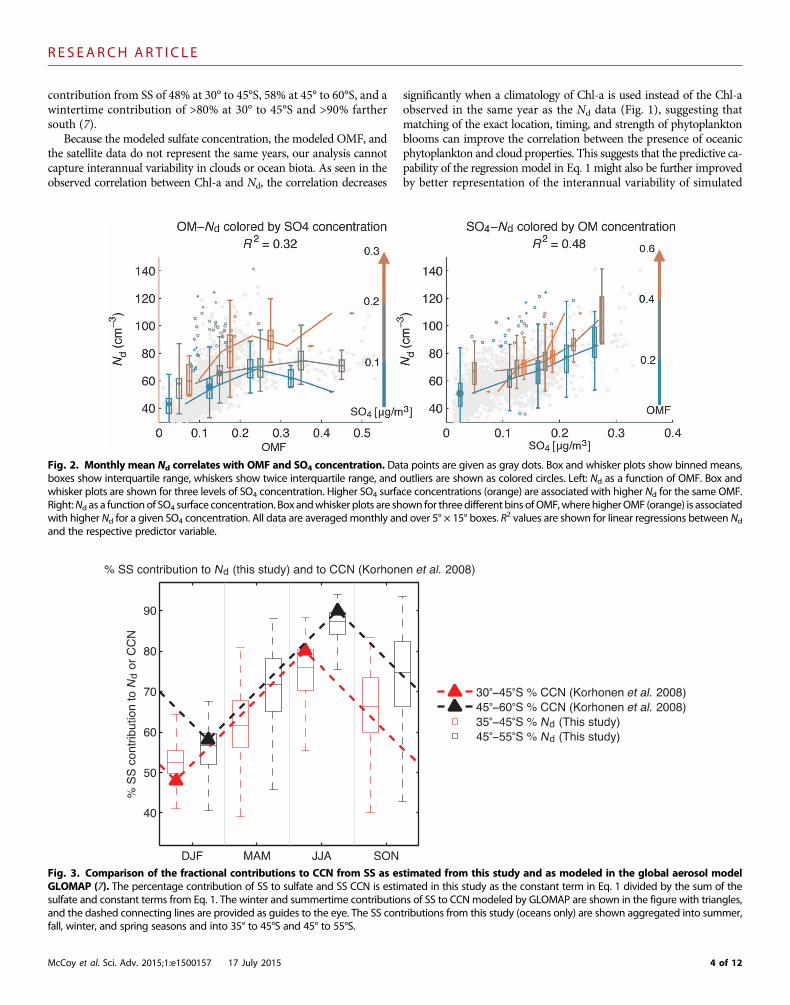
Fig. 2. Monthly mean Nd correlates with OMF and SO4 concentration. Data points are given as gray dots. Box and whisker plots show binned means,boxes show interquartile range, whiskers show twice interquartile range, and outliers are shown as colored circles. Left: N as a function of OMF. Box and
dwhisker plots are shown for three levels of SO4 concentration. Higher SO4 surface concentrations (orange) are associated with higher Nd for the same OMF.Right:Nd as a function of SO4 surface concentration. Box andwhisker plots are shown for threedifferent bins ofOMF,where higherOMF (orange) is associatedwith higher Nd for a given SO4 concentration. All data are averagedmonthly and over 5° × 15° boxes. R2 values are shown for linear regressions between Nd
and the respective predictor variable.
Fig. 3. Comparison of the fractional contributions to CCN from SS as estimated from this study and as modeled in the global aerosol modelGLOMAP (7). The percentage contribution of SS to sulfate and SS CCN is estimated in this study as the constant term in Eq. 1 divided by the sum of the
sulfate and constant terms from Eq. 1. The winter and summertime contributions of SS to CCNmodeled by GLOMAP are shown in the figure with triangles,and the dashed connecting lines are provided as guides to the eye. The SS contributions from this study (oceans only) are shown aggregated into summer,fall, winter, and spring seasons and into 35° to 45°S and 45° to 55°S.4 of 12

R E S EARCH ART I C L E
ocean biological activity and that the estimate of the explained variancedue to OMF and SO4 offered in this work is conservative.
The spatial structures of observed and predicted September to Aprilmean Nd agree well (Fig. 4, A and B). Contributions to Nd from SO4
(Fig. 4C) and OMF (Fig. 4D) determined from the regression modelindicate that the impact of sulfate on summertimeNd is greater at lowerSO latitudes (35o to 45oS), whereas the OMF contribution is more het-erogeneous and spread over a broader range of latitudes with the majorpatches confined to higher latitudes (45° to 55°S). The seasonal cycle ofNd (Fig. 4F) shows a strong summertime peak in agreement with in situmeasurements of CCN in the SO (53). Comparison of observedNd (Fig.4A), which shows a mean modeledNd of 59 cm
−3, with the backgroundfor a biologically inactive oceanNd≈36 cm−3, suggests that oceanbiologyincreasesNd by about 60%on average during September toApril (spring-summer-autumn).
The highest SO4 concentrations occur primarily at lower latitudes,whereas high OMF is found at all latitudes. Sunlight is required to ox-idize DMS, and continental sources of natural sulfate aerosol are alsostronger at lower latitudes (7). The sulfate sources affecting the northernSO (35° to 45°S) potentially have a significant volcanic component (54),in addition to the DMS sources of sulfate which dominate at higherlatitudes (54–56). Anthropogenic emissions contribute less than a thirdof the SO4 concentration on the annual mean over the study region,with a peak contribution to SO4 of 35% at 35°S rapidly declining to10% at 45°S; this is consistent with estimates of the DMS contributedSO4 in this region provided by dedicated aerosol tagging studies (56).The Nd pattern is consistent with attributing much of the variability inNd in the 35° to 45°S latitude band to sulfate (Fig. 4D). Organics in SSAcontribute strongly in regions of highChl-a (such as off the eastern coastof South America).
Increases in reflected shortwave radiationThese results imply that natural aerosols have the potential to signifi-cantly affect cloud droplet concentration over the SO. Observational es-timates have shown that cloudmicrophysical processes can significantlyaffect the strength of the enhancement in cloud albedo with warming inthe SO (57). Thus, accurate representation of natural, non-SS aerosols islikely to be important not only for accurate representation of the SOalbedo in the current climate by global climate models (GCMs), whichis generally too low (2), but also to help determine the strength of theoptical depth feedback as the climate warms. Here, we quantify the ef-fect of sulfate and primary organic aerosols on reflected shortwave(RSW) radiation, estimated in two ways: (i) from observed cloud prop-erties and radiation (11), and (ii) using an offline radiative transfer cal-culation performed in Community Atmosphere Model version 5.3.38(CAM5) using Portable Offline Radiative Transfer (PORT) (58). Thesecalculations consider only the impact of changing Nd on RSW (thecloud albedo effect). Other aerosol effects, such as direct forcing, thecloud lifetime effect, and the semidirect effect, are not considered. Wefind that the increase in RSW from biogenic aerosol effects on Nd (Fig.5A) exceeds 10 Wm−2 during summer. Although the latitude range ofthe observed Nd data is limited by the range of SZAs at which a mea-surement can be made, the OMF and SO4 data are modeled globally,and thus we may use them to extend the geographic range of ourestimate of increased RSW to 70°S. This is especially interesting becauseof the increase in phytoplankton, and consequently OMF and RSW, athigh latitudes during the summer as insolation increases and sea ice re-cedes (Fig. 5B). Although the sulfate contribution to the summertime
McCoy et al. Sci. Adv. 2015;1:e1500157 17 July 2015
increase in RSW is larger than that from OMF over the SO as a whole,both are found to be important. Another interesting finding is thatenhanced RSW fromOMF is often stronger than the contribution fromSO4 at high latitudes (Figs. 4 and 5). This suggests that detailed in situobservations of aerosol physical and chemical properties in combina-tion with measurements of aerosol precursors and cloud propertiesmay be able to distinguish the contributions from these two importantspecies.
Previous studies have estimated the effect on annual mean RSW ofsulfates fromDMS emissions at 16Wm−2 over the SO in summer (59)and the effects of the observed seasonal cycle of effective radius, hy-pothesized to be due to biogenic aerosols, at 6 to 8Wm−2 during sum-mer in the 40° to 60°S region (60). Here, the annual mean contributionto reflected shortwave (SW) is estimated to be between 4 and6Wm−2 at40°Swith decreasing contributions poleward, and the summertime con-tribution is 6 to 10 W m−2 (Fig. 5D). This is comparable to the annualmean radiative forcing from aerosol-cloud interaction downwind ofhighly polluted regions as simulated in GCMs (55, 61). It is alsointeresting to note that the bias in absorbed SW in the SO between30° and 50°S in CMIP3 (2) is similar to the effect of SO4 and OMF onRSW as estimated here. Given the significant enhancement in RSW es-timated here, a detectable signature in cloud albedo should be evidentfrom remote sensing. Recent studies have revealed a pattern of cloud al-bedo enhancement that is strikingly similar to the pattern of enhancedNd described by this study, indicating the robustness of our results (62).
Possible pathways of enriched sea spray influence on Nd
While in situ studies have shown that organic aerosols can affect CCN(20) and our results indicate that organic matter in SSA over regions ofhigh Chl-a affects Nd, there is no broad consensus on the mechanismsthat generate these relationships. Some studies suggest that the presenceof marine surfactants enhances the number of particles emitted in therange of diameters (roughly 50 to 200 nm) that are activated to form themajority of cloud droplets in the marine boundary layer (47, 63). Aero-sol chemistry is likely to be altered by biological activity, both throughprimary aerosol emissions and through condensation of biogenic vola-tile organic compounds, and experimental studies show that increasesin the organic fraction in sea spray particles with diameters less than180 nm correlated with increased biological activity (63, 64). Anotherpossibility is that secondary organic material condenses onto theprimary spray particles, growing the smallest of them into CCN activesizes (11). Other observations suggest that although SSAs containinghigh fractions of organic material exhibit low hygroscopic growth atsubsaturated relative humidities, theymay nevertheless serve effectivelyas CCN under supersaturated conditions, possibly due to the surfaceactivity of the organic matter (65). Surface-active organic material canreduce the aerosol surface tension, leading to a lowering of the criticalactivation radius and enhancing activation. Even comparatively weaklysurface-active organic substances can facilitate droplet activation whentheymake up a large fraction of aerosol mass (66), as has been observeddownwind of strong phytoplankton blooms (67, 68). A fifth possibilityis that the presence of a condensed film kinetically inhibits aerosol wateruptake and growth, thereby delaying droplet formation (69). In the ab-sence of a sufficient concentration of more efficient CCN, high super-saturationsmay be reached, ultimately allowing the activation of a largerproportion of the aerosol population. Finally, the mixing state of theaerosol may also evolve under the influence of biological changes toocean chemistry, affecting CCN number (70).
5 of 12

R E S EARCH ART I C L E
CONCLUSIONS
Here, we present observational data indicating a significant spatial cor-relation between regions of elevated Chl-a and Nd across the SO, andshow that modeled OMF + SO4 explains 53 ± 22% of the spatial vari-ability in observed Nd. Further, a spatial and temporal correlation isshown relating observedNd tomodeled SO4 and SSA organic enrich-ment, where the SO4 is likely to be significantly biogenic. The regressionmodel captures a large fraction, 53 ± 6%, of the spatial and seasonal var-iability in Nd, demonstrating that distributions of natural aerosols simu-lated by present-day climatemodels have sufficient fidelity to be useful inpredicting climatological cloud properties over the SO. Because ofthe complexity of chemical and physical interactions affecting seaspray production and processing in the atmosphere, experimentaland observational studies have been unable to unambiguously deter-mine whether marine organic aerosol derived from phytoplankton is
McCoy et al. Sci. Adv. 2015;1:e1500157 17 July 2015
associated with an increase or with a decrease in CCN andNd in ma-rine clouds. The results of this study will inform future modeling ofthese processes by providing the first top-down estimate of the signandmagnitude of the impact ofmarine biogenic aerosol onNd acrossthe entire SO.
Our results suggest that ocean biology augments the cloud dropletconcentration over the biologically active SO by about 60% in the an-nual mean and likely doubles it during summer when the incident solarradiation is strongest. The enhancement in upwelling SW due to thesechanges in cloud droplet number concentration is between 4 and 6Wm−2
annually averaged and exceeds 10Wm−2 in summer. Accurate represen-tationof the biogenic contribution toCCNandNd over the oceans is there-fore necessary for the accurate representation of climate forcing fromaerosol-cloud interactions. To represent these processes in a changingclimate will require models capable of representing the dynamic re-sponse of ocean biology to the warming and acidification of the oceans
(E) Chl-a − Sept−April
120° W 0° 120° E
35° S 45° S 55° S
Log2(mg/m3)
−4−20
(C) SO4 concentration − Sept−April
120° W 0° 120° E
35° S 45° S 55° S
(D) OMF contribution − Sept−April 35° S 45° S 55° S
(B) Modeled Nd − Sept−April 35° S 45° S 55° S
(A) Observed Nd − Sept−April 35° S 45° S 55° S
cm−3406080
cm−3406080
cm−30102030
cm−30102030
J A S O N D J F M A M J0
20
40
60
80
cm−
3
Predicted NdObserved NdSO4 contributionOM contributionOM + SO4 contributionConstant term
Fig. 4. Themodel captures significant spatial and seasonal structure in the SONd. (A) One year of Nd observations averaged from September throughApril (when observations are available for all months at all latitudes). (B) PredictedNd from the regressionmodel. (C andD) Contributions fromOMF and SO4
(note the different color scale). The means and spatial SDs are shown above each panel. The correlation between modeled and observed September-Aprilmean Nd is r = 0.71, and the correlation between the September-April mean OMF and SO4 contributions to Nd is r = 0.41. (E) Mean ocean Chl-a observed bySeaWiFS. (F) Time series of the observed Nd, modeled Nd, and the contributions of OMF, SO4, their sum, and the constant term to Nd. Time series data aremonthly averages over all locations where Nd is observed.
6 of 12

R E S EARCH ART I C L E
and to the retreat of sea ice and predicting the subsequent effects on nat-ural aerosol sources.
MATERIALS AND METHODS
Calculation of upwelling SW changes due to biogenicaerosol-cloud interactions
Meskhidze and Nenes method. The enhancement in upwellingshortwave radiation (RSW) caused by increases inNd was estimated usingthe following equation, consistent with previous studies (11),
DF ¼ −1
3FinAcRc 1 − Rcð ÞDlnNdb
whereDF is the change in RSW, Fin is the downwelling SWat cloud top,Ac is the monthly MODIS cloud fraction, Rc is the monthly MODIScloud albedo, DlnNdb is the change in Nd versus the background con-
McCoy et al. Sci. Adv. 2015;1:e1500157 17 July 2015
centrationDlnNdb = (Nd−Nb)/Nd, andNd andNb are the perturbed andbackground Nd, respectively.
Monthly, gridded observations of cloud properties, sea ice, and ra-diation from 2007 were used in the calculation of changes in RSW,excluding land surfaces. Cloud albedowas estimated from theMODIScloud optical depth using the cloud albedo approximation of Lacis andHansen (71). Cloud fraction was taken fromMODIS, and downwellingSW at cloud top was approximated by the Clouds and Earth’s RadiantEnergy Systems (CERES) Energy Balanced and Filled (EBAF) 2.8 down-welling clear-sky SW at the surface. Sea ice distributions were takenfrom HADISST (Hadley Centre Sea Ice and Sea Surface Temperature)as included in the NOAA (National Oceanic &Atmospheric Admin-istration) Optimum Interpolation (OI) SST, and the cloudy fractionof each grid box was assumed not to contribute to changes in RSW ifclouds were over sea ice (72). Maximum overlap between sea ice andMODIS cloud fraction was assumed, resulting in a conservative esti-mate of the change in RSW in the presence of ice.
J A S O N D J F M A M J−70
−60
−50
−40
−30
−10
−9
−8
−8
−7
−7 −6
−6
−6
−5
−5
−5
−4
−4
−4
−3−3
−3
−3
−2
−2
−2
−2
−1 −1
−1
−1
−1
0 0 0
0 0 0
10
50
80
Lat
(A) Change in RSW due to SO4 and OM
−15
−10
−5
0
−3−2
−2
−2−1−1
−1
−1
0 0 0
0 0 0
(B) Change in RSW due to OM
Lat
10
50
80
J A S O N D J F M A M J−70
−60
−50
−40
−30
−15
−10
−5
0
−7
−6
−6
−5
−5
−4
−4
−4
−3
−3
−3
−2
−2
−2−2−1
−1
−1
−1−10 0 0
0 0 0
(C) Change in RSW due to SO4
Lat
10
50
80
J A S O N D J F M A M J−70
−60
−50
−40
−30
−15
−10
−5
0
−6−5−4−3−2−1 0−70
−65
−60
−55
−50
−45
−40
−35
−30(D) RSW
SO
4 +
OM
SO
4
OM
W m −2W m −2
W m −2
W m −2
Fig. 5. OMF and SO4 significantly affect SO cloud albedo. (A to C) Contours show the zonal mean change in top-of-atmosphere (TOA) net shortwaveradiation (RSW) due to modification of N by (A) SO and OMF, (B) OMF alone, and (C) SO alone. (D) The annual mean contribution from OMF, SO , and the
d 4 4 4combination ofOMF and SO4. In (A) to (C), filled contours show the analytical estimate of the change in RSWbased on observed cloud properties, and dashedwhite lines show the change in RSWcalculatedby anoffline radiative transfermodel using simulated cloudproperties. Contour intervals are 1Wm−2 for both.Hatchedwhite lines show the observed zonalmean sea ice extent (in percent). (D) Annualmean changes in RSW from the analytical estimate (solid lines) andthe offline radiative transfer model (crosses).
7 of 12

R E S EARCH ART I C L E
The Nd resulting from the presence of natural aerosols was cal-culated using the AeroCom sulfate concentration and B14 OMF datain combination with the regression detailed in the article (Eq. 1).The impacts of SO4 and OMF + SO4 on the TOA SW forcing were es-timated as the change in RSW when Nd was increased from thebackground term in Eq. 1 to include the SO4 term,OMF term, and theircombination.
PORT method. Offline radiative transfer calculations were per-formed using the PORT tool (58) within the stand-alone CAM,which is the atmosphere component of the Community Earth Sys-tem Model (CESM) (73). Details can be found online (www.cesm.ucar.edu/models/cesm1.0/cam/). Model simulations were per-formed using the CAM5 physics package (74). The model wascompiled in an atmosphere-only configuration with prescribedocean and ice boundary conditions with 1.9° × 2.5° grid spacing.CAM5 uses the Rapid Radiative Transfer Model for General circu-lation models (RRTMG) (75) to compute the radiative forcing ofaerosols, clouds, and gases.
To obtain samples of the atmospheric state, instantaneous values ofatmospheric state variables required for calculation of radiative transferwere recorded during a 2-year simulation (beginning 1 January 2000),of which the first year was discarded, allowing ample time for modelspin-up. Atmospheric state variables were sampled every 73model timesteps, which corresponds to 1.5 days + 1 time step. This sampling fre-quency has been found to produce a representative sample of diurnal andseasonal cycles while reducing the computation cost of the calculation (58).
After the time samples were produced, the cloud drop size dis-tribution of the time samples was then modified to correspond to eachof three regression cases: background, background + SO4, andbackground + SO4 + OMF (described in point 3 below) for the subse-quent PORT calculation. All other atmospheric state variables remainedunchanged; therefore, changes in radiative forcing reflect changes in thecloud drop number concentration and related changes in cloud dropsize distribution only, with no feedbacks onto cloud lifetime, atmo-spheric dynamics, or other processes.
The modification of the cloud drop size distribution was performedby the following procedure:
1. Calculate Ndinst_cldtop, the cloud drop number concentration atcloud top (in each column), using the value of the in-cloud dropletnumber concentration that is passed to the radiation code. Cloud topwas defined as occurring in the highest model layer in which thestratus cloud liquid water mixing ratio (icwmrst) was greater than 1 ×10⁻⁶ kg/kg.
Ndinst;cldtop½cm−3� ¼ Ndinst½where
icwmrst > 1� 10−6kg=kg� � r=1� 10−6
where r is the atmospheric density.2. Calculate the climatological monthlymean of the cloud top drop-
let concentration (Ndinst,cldtop) over the entire 5-year time series:
Ndmonth;cldtop ¼ clim month aveðNdinst;cldtopÞ:
3. Calculate Ndreg, the cloud top droplet number concentration aspredicted from the regression model (Eq. 1), for each of three cases: (i)FULL: with all terms; (ii) SO4_BKGD: with coefficient of OMF term setto zero; (iii) BKGD_ONLY: with coefficients of SO4 andOMF terms setto zero (constant term only).
McCoy et al. Sci. Adv. 2015;1:e1500157 17 July 2015
The following steps are performed separately for each regression case.4. Update the cloud drop number concentration in each column by
multiplying by the ratio of the cloud top values of Nd from the regres-sion and from the monthly mean:
Ndnew ¼ Ndinst � Ndcldtop reg=Ndcldtop month:
5. Constrain Ndnew to be in the range [min[Ndinst], max(Ndinst)] ona per-model-level basis:
do lev ¼ 1;30
Ndnew ¼ minðNdnew;maxðNdinstÞÞ
Ndnew ¼ maxðNdnew;minðNdinstÞÞ
end do:
Similarly, constrain Ndnew so that the grid mean value (as opposedto the in-cloud value) of Nd is within the range of values in the originalsimulation (on a per-level basis).
6. Calculate new gamma parameters (radm, radl) using Ndnew andinstantaneous values of air density (RHO) and stratus cloud fraction(AST). This calculation is identical to the calculation in the microphysics(76). Write out the updated values of radm, radl to the PORT input files.
Finally, PORTwas run using themodified CAMhistory files to pro-vide inputs to the offline radiative transfer code. This produces a new setof instantaneous history files that include the TOA radiation terms (up-ward, downward, and net, for SW and longwave radiation).
Estimation of anthropogenic component of SO4 inthe remote SOAlthough the relative contributions of volcanoes and DMS are difficultto quantify, models indicate that near-surface sulfate over the SO is pri-marily from natural sources, with a peak biogenic contribution in thesummer (54–56, 77). Here, SO4 is represented by the present-day sur-face concentration from the AeroCom A phase 1 multimodel medianproduct. This includes SO4 from volcanic, biogenic, and anthropogenicsources. Because simulated aerosols are not routinely tagged accordingto their sources in standard atmospheric model simulations, estimationof the volcanic component of the SO4 would require a dedicatedsimulation (56). The volcanic contribution cannot be determined posthoc for theAeroComproduct; however, previous studies have indicatedthat biogenic sulfate is the source of the majority of SO4 over the SOpoleward of 45°S, with increasing volcanic contributions northwardof this latitude (55, 56).
AeroCom phase 1 included three experiments: A (models are runwith their native, present-day emissions), B (all models use the same,present-day emissions), and PRE (allmodels use the same, preindustrialemissions). Here, AeroCom A has been used to represent the present-day aerosols.Although theDMSemission inventories used in theAeroCommedian are relatively similar, which leads to a lower model diversity inthe case of SO4 emissions (78), it incorporates a wider range of aerosolemissions, and thus, its median is hoped to represent themost diversity.On the other hand, this diversity makes it difficult to estimate anthro-pogenic increases in sulfate because the preindustrial and scenario Aexperiments do not use consistent emissions, so differences betweenthe two may be either anthropogenic or natural (28).
Scenarios B and PRE have identical natural emissions, and their an-thropogenic emissions are scaledwith population size, crop production,
8 of 12

R E S EARCH ART I C L E
and wood consumption (28). Thus, differences between scenario B andPRE are purely anthropogenic and provide an approximation of thetotal present-day anthropogenic aerosol contribution (because pre-industrial anthropogenic sources are small). Changes in SO4 columndensity and surface concentration are shown in figs. S1 and S2, respec-tively. It can be see that in the eightmodelswithin theAeroCommedian(all except MPI-HAM), for which SO4 column density data were avail-able, the anthropogenic contribution to loading is relatively minor andranges between 10 and 20%; however, columndensity is not the variableexamined in this study, and it is expected that near-surface SO4 will besignificantly less affected by anthropogenic emissions (77). The fourmodels considered in the AeroCom phase 1 median data set (LSCE,GISS, LOA, and UIO-GCM) for which near-surface SO4 concentrationwas available in the preindustrial data show that the increase in SO4 frompreindustrial to present day is relatively small over the SO (fig. S3). Themean fractional contribution of industrial-era anthropogenic SO4 is atmost 35% (at 35°S) and is 10% or less at latitudes south of 45°S(fig. S4), indicating that the majority of sulfate in the remote SO is nat-ural, rather than anthropogenic.
Description of OMB14 (OCEANFILMS) parameterization andcontributions of different components ofmarineOM to totalOMThe recently developed OCEANFILMS (43) parameterization is thefirst mechanistic model of the enrichment of organic matter in SSA ap-propriate for use in a global atmosphericmodel. Enrichment ismodeledas competitivephysical adsorptionof several classesofmarineorganicmatteronto bubble surfaces, including a lipid-like class (LIPID) that is strongly as-sociated with fresh primary production, and polysaccharide-like (POLY)and protein-like (PROT) classes that are associated with semi-labile dis-solved organic matter with a modeled chemical lifetime of 100 days.
Marine biota and organic matter concentrations are simulated bythe Biogeochemical Ecosystems Cycling (BEC) model within the Par-allel Ocean Program (POP) (43). The BECmodel has recently been op-timized and evaluated against an extensive set of marine organicmattermeasurements (44). The distributions of macromolecular classes usedin OCEANFILMS are derived by association with biogeochemicalvariables as calculated by BEC, including phytoplankton and zoo-plankton concentrations (LIPID), and semi-labile dissolved organic car-bon (DOC) (POLY and PROT). The chemical properties of theseclasses and their propensity to adsorb to the air-water interface are es-timated from the properties of well-studied proxy molecules. A moredetailed evaluation of the ocean concentrations of the macromolecularclasses is in progress (Ogunro et al., 2015, in revision). In an initial eval-uation, the parameterization has been shown to agree reasonably wellwith observations of theOMFof SSA in cleanmarine air fromboth ship-board and coastal clean-marinemeasurements, aswell aswith spray gen-erated at sea. The OMF distributions used here are based on the 33rdyear of a free-running simulation initialized in the year 2000.
Aunique feature of theOCEANFILMSmodel is its treatment ofma-rine organic matter as a sum of several broad classes of marine macro-molecules. The spatial variability in the model’s total OMF is almostentirely determined by two components: a “lipid-like” labile portionthat is strongly associated with regions of primary productivity andhighly correlated with Chl-a (LIPID), and a semi-labile portion with amodel lifetime of 100 days (“polysaccharide-like”/POLY and “protein-like”/PROT classes). TheR2 values for regressions ofNd against individ-ual classes (LIPID and POLY) are given in table S1. Breaking down thetotal organic fraction into these two components reveals differences in
McCoy et al. Sci. Adv. 2015;1:e1500157 17 July 2015
the spatial patterns of their contribution toNd (fig. S5). The labile LIPIDgroup contributes much more in the immediate vicinity of phyto-plankton blooms (as indicated by Chl-a) than in oligotrophic regions.The total semi-labiles, POLY + PROT, contribute more in the north-ern part of the domain (35° to 45°S), and their contribution is less var-iable in both space (fig. S5) and time (not shown). The inclusion of thePOLY + PROT fraction therefore reduces the overall spatiotemporalvariability of OMF and of its effect on Nd in the regression model. Ad-ditional details about the OMF simulation can be found in the paperdescribing the parameterization (43).
Comparison of OMB14 to observationally derivedparameterizations of OMFThe work of Burrows et al. (43) (B14) is different from previousmethods of parameterizing the submicron SSAOMF in that it is a phys-ically based framework as opposed to an empirical relationship derivedfrom observations of Chl-a and OMF.
To assess whether parameterizations of OMF based on Chl-a canbetter predict Nd, B14 is compared to two such parameterizations(49, 79). The latter study [Gantt et al. (79)] includes empirical fits to datafrom both the Mace Head Atmospheric Research Station (53.33°N,9.9°W) and Point Reyes National Sea Shore (38.12°N, 122.91°W). Toevaluate if B14 significantly improves on empirical parameterizations,OMF consistent with each empirical fit was calculated using the POP/BECocean biogeochemistry-simulated chlorophyll rather than observedchlorophyll, to provide a fair comparison with B14. Because ocean biol-ogywill respond to future changes in ocean temperature, acidity, and seaice extent, it is important to evaluate howwell parameterizations canper-form within the context of simulated ocean biology, which can dynam-ically change in response to ocean conditions. The correlations of Nd
with the OMF calculated using each of these parameterizations or thePOP Chl-a fields is low, with less than 20% of the variance explainedby any of the parameterizations. By contrast, B14 explains 37 ± 10%of the variance in Nd as a single predictor (fig. S6). This is becauseB14 includes components driven by two categories of ocean biologicalvariables with differing spatial and seasonal distributions: a “lipid-like”component that is strongly correlated with Chl-a and a “polysaccharide-like” component that is tied to the longer-lived semi-labile DOC, whosedistribution is simulated by POP/BEC.
The prediction of biogeochemistry is challenging, and the BECocean model predicts a different distribution of Chl-a than is observedby SeaWiFS (Sea-Viewing Wide Field-of-View Sensor) (45). It is likelythat the simulation of OMF by B14 is limited by the oceanic biogeo-chemistry model’s accuracy. To estimate the degree to which the B14OMF might be improved by a more accurate simulation of oceanic bi-ology, a relationship between Chl-a and the B14 lipid mass fractionhas been derived using POP/BEC Chl-a (fig. S7). This relationship isused to calculate a distribution of the lipid-like class that is consistentwith SeaWiFS-observed Chl-a.
The variance explained by OMF is calculated for several commonempirical functions of Chl-a (49, 79). This is compared to the varianceexplained by OMF calculated by B14. Two cases are considered: Chl-aas observed by SeaWiFS and as simulated by the POP/BEC model. Inboth cases, the OMF consistent with the empirical parameterizations iscalculated on the basis of Chl-a. In the former case, the B14 analogousOMF is calculated using the combination of polysaccharide-like OMFcalculated from the POP/BEC model and lipid-like OMF calculatedusing SeaWiFS Chl-a and the function shown in fig. S7. In the latter
9 of 12

R E S EARCH ART I C L E
case, OMF fromB14 using the full simulation of ocean biogeochemistryis used. The variance explained by the OMF consistent with SeaWiFSChl-a is shown in fig. S8, and the variance explained byOMF consistentwith POP/BEC is shown in fig. S4. When observed distributions ofChl-a are used, B14-derived OMF performs as well as the upper endof empirical parameterizations of OMF.When POP/BEC Chl-a is usedin combination with the empirical parameterizations to predict OMF, itexplains significantly less variance than the B14-simulated OMF. OMFconsistentwith B14 explains roughly the same variancewhether observedChl-a is used as an input or the full oceanic biogeochemistry model isused. This suggests that the ability of the physically based framework usedbyB14 to simulate organicmatter in SSAoffers additional insight into theenrichment of SSA and will continue to improve as the ocean biogeo-chemistry model’s ability to accurately simulate Chl-a improves.
Statistical analysisRegression modeling. The relationships between predictor varia-
bles andNd are explored using multivariate linear regressions. Here, wepresent the coefficients for several additional regressions. In addition tothe OMF from B14 (OMF) and the sulfate concentration from theAeroCom median (SO4), we also examine the regression based on theseparation of SSA organic matter into lipid-like organic matter (LIPID)and polysaccharide-like organic matter (POLY), which have distinctseasonal and geographic patterns. Details of this partitioning are ex-plained in section 5 (figs. S4 and S8) and in B14.
Multivariate fits to the Nd from Grosvenor and Wood (15) for theyear 2007 with smoothed spatial interpolation (80, 81) (described ingreater detail below) yield the following coefficients. Uncertainties areSDs of the coefficients obtained from 10-fold cross-validation (51), re-peated 10 times. Model results indicate that the relationship betweenCCN and Nd should be approximately linear in the SO (82), allowingthe use of simple linear regression in this region.
Nd = (115.6971 ± 2.7742 cm−3) OMF + 40.6347 ± 0.4087 cm−3
Nd = (176.6927 ± 2.4004 mg−1 m3 cm−3) SO4 + 40.4987 ± 0.2209 cm−3
Nd = (137.1134 ± 2.5679 mg−1 m3 cm−3) SO4 +(58.2682 ± 1.9953 cm−3) OMF + 35.6441 ± 0.2233 cm−3
Nd = (139.1144 ± 2.9050 mg−1 m3 cm−3) SO4 + (58.0173 ±1.6236 cm−3) LIPID + 35.9051 ± 0.2432 cm−3 + (300.0160 ±27.1975 cm−3) POLY
Several other predictors were investigated to rule out possible con-founding variables. AeroCom SS concentration and NOAA OI SST (72)eachpredict only a small fractionof the variability inNd (fig. S6).A linear fitto monthly mean wind speed predicted about 20 ± 10% of the variabilityin Nd; however, a multivariate fit including wind speed, OMF, and SO4
concentration did not significantly increase the variance predicted byOMF and SO4 concentration alone (fig. S9). A climatology of oceanDMS concentration (50) explained about 25 ± 10% of the variance inNd (fig. S6). Although not negligible, the variance explained by each ofthese variables is relatively slight compared toOMF and SO4, indicatingthat they are not the underlying drivers of the spatial and temporalstructure of Nd in the SO, and none of these variables significantly in-crease predictability in a regression that also includes SO4 and OMF.
Details of data interpolationRegressions were performed using monthly mean Nd data averagedover 5° latitude × 15° longitude bins. Data were interpolated spatially at
McCoy et al. Sci. Adv. 2015;1:e1500157 17 July 2015
its native resolution and then averaged. Nd data were left blank in binswhere reliable retrievals could not bemade for the whole bin. Only datafromoceans not covered by sea ice were used as estimated by theHADISSTsea ice coverage as included in the NOAA OI SST (72) data.
Observations of ocean and cloud properties from space are not al-ways possible, leading to gaps in observational data sets. SeaWiFS re-quires a cloud-free view of the ocean, and robust retrievals of Nd areonly possible at low SZA (15). Resulting data gaps in Nd and observedpredictor variables (Chl-a, wind speed, SST, etc.) were filled using asmoothed interpolation procedure described in (80, 81). The interpo-lated data were then averaged in 5° latitude × 15° longitude bins. Anal-ysis was repeated for 5° latitude × 5° longitude bins, and the varianceexplained was found to be fairly similar (fig. S10).
SUPPLEMENTARY MATERIALSSupplementary material for this article is available at http://advances.sciencemag.org/cgi/content/full/1/6/e1500157/DC1Fig. S1. The AeroCom scenario B and PRE SO4 column density (black) across eight models (MPI-HAM excluded due to unavailability of SO4 column density) and difference in SO4 columndensity (mg/m2) between preindustrial and present day (red).Fig. S2. The AeroCom scenario B and PRE SO4 surface concentration from LSCE, GISS, LOA, andUIO-GCM.Fig. S3. The fractional change in SO4 surface concentration between the present-day andpreindustrial period from AeroCom scenario B and PRE SO4 surface concentration fromLSCE, GISS, LOA, and UIO-GCM.Fig. S4. Tenfold cross-validation performed using only POP/BEC-modeled chlorophyll-consistentquantities.Fig. S5. Contribution of the labile “lipid-like” group and total contribution of the semi-labile“polysaccharide-like” and “protein-like” groups to the total Nd from the regression model.Fig. S6. The 10-fold cross-validation repeated using wind speed from the Multi-Platform OceanSurface Wind Velocity L3.5, SST from the NOAA OI data product, SS aerosol concentration fromAeroCom, and DMS (50).Fig. S7. Scatter plot of lipid-like OMF in SSA as calculated by B14 as a function of POP chlorophyll.Fig. S8. Tenfold cross-validation performed using only SeaWiFS consistent Chl-a.Fig. S9. Tenfold cross-validation repeated using wind and SS concentration in addition toOMB14 and SO4 concentration.Fig. S10. As in fig. S1, but averaged over 5° latitude × 5° longitude bins.Table S1. Correlation coefficients in space and time using labile and semi-labile fields from B14.
REFERENCES AND NOTES1. Y. T. Hwang, D. M. W. Frierson, Link between the double-Intertropical Convergence Zone
problem and cloud biases over the Southern Ocean. Proc. Natl. Acad. Sci. U.S.A. 110, 4935–4940(2013).
2. K. E. Trenberth, J. T. Fasullo, Simulation of present-day and twenty-first-century energybudgets of the Southern Oceans. J. Climate 23, 440–454 (2010).
3. S. Twomey, Pollution and planetary albedo. Atmos. Environ. 8, 1251–1256 (1974).4. I. S. A. Isaksen, C. Granier, G. Myhre, T. K. Berntsen, S. B. Dalsøren, M. Gauss, Z. Klimont, R. Benestad,
P. Bousquet,W. Collins, T. Cox, V. Eyring, D. Fowler, S. Fuzzi, P. Jöckel, P. Laj, U. Lohmann,M.Maione,P. Monks, A. S. H. Prevot, F. Raes, A. Richter, B. Rognerud, M. Schulz, D. Shindell, D. S. Stevenson,T. Storelvmo, W.-C. Wang, M. van Weele, M. Wild, D. Wuebbles, Atmospheric compositionchange: Climate–chemistry interactions. Atmos. Environ. 43, 5138–5192 (2009).
5. S. J. Ghan, S. J. Smith, M. Wang, K. Zhang, K. Pringle, K. Carslaw, J. Pierce, S. Bauer, P. Adams,A simple model of global aerosol indirect effects. J. Geophys. Res. Atmos. 118, 6688–6707(2013).
6. K. S. Carslaw, L. A. Lee, C. L. Reddington, K. J. Pringle, A. Rap, P. M. Forster, G. W. Mann,D. V. Spracklen, M. T. Woodhouse, L. A. Regayre, J. R. Pierce, Large contribution ofnatural aerosols to uncertainty in indirect forcing. Nature 503, 67–71 (2013).
7. H. Korhonen, K. S. Carslaw, D. V. Spracklen, G. W. Mann, M. T. Woodhouse, Influence of oceanicdimethyl sulfide emissions on cloud condensation nuclei concentrations and seasonality overthe remote Southern Hemisphere oceans: A global model study. J. Geophys. Res. Atmos. 113,D15204 (2008).
8. P. K. Quinn, T. S. Bates, The case against climate regulation via oceanic phytoplankton sulphuremissions. Nature 480, 51–56 (2011).
10 of 12

R E S EARCH ART I C L E
9. A. Lana, R. Simo, S. M. Vallina, J. Dachs, Potential for a biogenic influence on cloud micro-physics over the ocean: A correlation study with satellite-derived data. Atmos. Chem. Phys.12, 7977–7993 (2012).
10. R. J. Charlson, J. E. Lovelock, M. O. Andreae, S. G. Warren, Oceanic phytoplankton, atmosphericsulfur, cloud albedo and climate. Nature 326, 655–661 (1987).
11. N. Meskhidze, A. Nenes, Phytoplankton and cloudiness in the Southern Ocean. Science314, 1419–1423 (2006).
12. N. Meskhidze, A. Nenes, Effects of ocean ecosystem on marine aerosol-cloud interaction.Adv. Meteorol. 2010, Article ID 239808 (2010).
13. G. P. Ayers, J. L. Gras, Seasonal relationship between cloud condensation nuclei and aerosolmethanesulphonate in marine air. Nature 353, 834–835 (1991).
14. P. G. Falkowski, Y. Kim, Z. Kolber, C. Wilson, C. Wirick, R. Cess, Natural versus anthropogenicfactors affecting low-level cloud albedo over the North Atlantic. Science 256, 1311–1313(1992).
15. D. P. Grosvenor, R. Wood, The effect of solar zenith angle on MODIS cloud optical and micro-physical retrievals within marine liquid water clouds. Atmos. Chem. Phys. 14, 7291–7321 (2014).
16. M. Schulz, C. Textor, S. Kinne, Y. Balkanski, S. Bauer, T. Berntsen, T. Berglen,O. Boucher, F. Dentener,S. Guibert, I. S. A. Isaksen, T. Iversen, D. Koch, A. Kirkevåg, X. Liu, V. Montanaro, G. Myhre,J. E. Penner, G. Pitari, S. Reddy, Ø. Seland, P. Stier, T. Takemura, Radiative forcing by aerosols asderived from the AeroCom present-day and pre-industrial simulations. Atmos. Chem. Phys. 6,5225–5246 (2006).
17. S. Kinne, M. Schulz, C. Textor, S. Guibert, Y. Balkanski, S. E. Bauer, T. Berntsen, T. F. Berglen,O. Boucher, M. Chin, W. Collins, F. Dentener, T. Diehl, R. Easter, J. Feichter, D. Fillmore, S. Ghan,P. Ginoux, S. Gong, A. Grini, J. Hendricks, M. Herzog, L. Horowitz, I. Isaksen, T. Iversen, A. Kirkevåg,S. Kloster, D. Koch, J. E. Kristjansson, M. Krol, A. Lauer, J. F. Lamarque, G. Lesins, X. Liu, U. Lohmann,V. Montanaro, G. Myhre, J. Penner, G. Pitari, S. Reddy, O. Seland, P. Stier, T. Takemura, X. Tie, AnAeroCom initial assessment—Optical properties in aerosol component modules of global models.Atmos. Chem. Phys. 6, 1815–1834 (2006).
18. O. Boucher, U. Lohmann, The sulfate-CCN-cloud albedo effect. Tellus B 47, 281–300 (1995).19. A. Jones, D. L. Roberts, A. Slingo, A climate model study of indirect radiative forcing by
anthropogenic sulfate aerosols. Nature 370, 450–453 (1994).20. D. A. Hegg, Y. J. Kaufman, Measurements of the relationship between submicron aerosol num-
ber and volume concentration. J. Geophys. Res. Atmos. 103, 5671–5678 (1998).21. D. A. Knopf, P. A. Alpert, B. Wang, J. Y. Aller, Stimulation of ice nucleation by marine dia-
toms. Nat. Geosci. 4, 88–90 (2011).22. S. M. Burrows, C. Hoose, U. Pöschl, M. G. Lawrence, Ice nuclei in marine air: Biogenic par-
ticles or dust? Atmos. Chem. Phys. 13, 245–267 (2013).23. T.D. Jickells, Z. S. An, K. K.Andersen, A. R. Baker, G. Bergametti, N. Brooks, J. J. Cao, P.W.Boyd, R.A.Duce,
K. A. Hunter, H. Kawahata, N. Kubilay, J. laRoche, P. S. Liss, N.Mahowald, J.M. Prospero, A. J. Ridgwell,I. Tegen, R. Torres, Global iron connections between desert dust, ocean biogeochemistry, and cli-mate. Science 308, 67–71 (2005).
24. N. M. Mahowald, S. Engelstaedter, C. Luo, A. Sealy, P. Artaxo, C. Benitez-Nelson, S. Bonnet,Y. Chen, P. Y. Chuang, D. D. Cohen, F. Dulac, B. Herut, A. M. Johansen, N. Kubilay, R. Losno,W. Maenhaut, A. Paytan, J. M. Prospero, L. M. Shank, R. L. Siefert, Atmospheric iron deposi-tion: Global distribution, variability, and human perturbations. Ann. Rev. Mar. Sci. 1, 245–278(2009).
25. R. B. Husar, J. M. Prospero, L. L. Stowe, Characterization of tropospheric aerosols over theoceans with the NOAA advanced very high resolution radiometer optical thickness oper-ational product. J. Geophys. Res. Atmos. 102, 16889–16909 (1997).
26. D. M. Murphy, J. R. Anderson, P. K. Quinn, L. M. McInnes, F. J. Brechtel, S. M. Kreidenweis,A. M. Middlebrook, M. Pósfai, D. S. Thomson, P. R. Buseck, Influence of sea-salt on aerosolradiative properties in the Southern Ocean marine boundary layer. Nature 392, 62–65(1998).
27. J. M. Prospero, P. Ginoux, O. Torres, S. E. Nicholson, T. E. Gill, Environmental characterization ofglobal sources of atmospheric soil dust identified with the nimbus 7 Total Ozone MappingSpectrometer (TOMS) absorbing aerosol product. Rev. Geophys. 40, 1002 (2002).
28. F.Dentener, S. Kinne, T. Bond,O.Boucher, J. Cofala, S.Generoso, P.Ginoux, S.Gong, J. J.Hoelzemann,A. Ito, L. Marelli, J. E. Penner, J.-P. Putaud, C. Textor, M. Schulz, G. R. van derWerf, J. Wilson, Emissionsof primary aerosol and precursor gases in the years 2000 and 1750 prescribed data-sets forAeroCom. Atmos. Chem. Phys. 6, 4321–4344 (2006).
29. S. M. Vallina, R. Simó, S. Gassó, What controls CCN seasonality in the Southern Ocean? A sta-tistical analysis based on satellite-derived chlorophyll and CCN and model-estimated OHradical and rainfall. Global Biogeochem. Cycles 20, GB1014 (2006).
30. N. Huneeus, M. Schulz, Y. Balkanski, J. Griesfeller, J. Prospero, S. Kinne, S. Bauer, O. Boucher,M. Chin, F. Dentener, T. Diehl, R. Easter, D. Fillmore, S. Ghan, P. Ginoux, A. Grini, L. Horowitz,D. Koch, M. C. Krol, W. Landing, X. Liu, N. Mahowald, R. Miller, J.-J. Morcrette, G. Myhre,J. Penner, J. Perlwitz, P. Stier, T. Takemura, C. S. Zender, Global dust model intercomparison inAeroCom phase I. Atmos. Chem. Phys. 11, 7781–7816 (2011).
31. V. A. Karydis, P. Kumar, D. Barahona, I. N. Sokolik, A. Nenes, On the effect of dust particles onglobal cloud condensation nuclei and cloud droplet number. J. Geophys. Res. Atmos. 116,D23204 (2011).
McCoy et al. Sci. Adv. 2015;1:e1500157 17 July 2015
32. P. K. Quinn, T. S. Bates, K. S. Schulz, D. J. Coffman, A. A. Frossard, L. M. Russell, W. C. Keene,D. J. Kieber, Contribution of sea surface carbon pool to organic matter enrichment in seaspray aerosol. Nat. Geosci. 7, 228–232 (2014).
33. A. A. Frossard, L. M. Russell, S. M. Burrows, S. M. Elliott, T. S. Bates, P. K. Quinn, Sources andcomposition of submicron organic mass in marine aerosol particles. J. Geophys. Res. Atmos.119, 12977–13003 (2014).
34. M. C. Facchini, M. Rinaldi, S. Decesari, C. Carbone, E. Finessi, M. Mircea, S. Fuzzi, D. Ceburnis,R. Flanagan, E. D. Nilson, G. de Leeuw, M. Martino, J. Woeltjen, C. D. O’Dowd, Primarysubmicron marine aerosol dominated by insoluble organic colloids and aggregates. Geophys.Res. Lett. 35, L17814 (2008).
35. E. K. Bigg, Sources, nature and influence on climate of marine airborne particles. Environ.Chem. 4, 155–161 (2007).
36. E. K. Bigg, C. Leck, The composition of fragments of bubbles bursting at the ocean surface.J. Geophys. Res. Atmos. 113, D11209 (2008).
37. L. N. Hawkins, L. Russell, Polysaccharides, proteins, and phytoplankton fragments: Fourchemically distinct types of marine primary organic aerosol classified by single particlespectromicroscopy. Adv. Meteorol. 2010, Article ID 612132 (2010).
38. L. M. Russell, L. N. Hawkins, A. A. Frossard, P. K. Quinn, T. S. Bates, Carbohydrate-like compositionof submicron atmospheric particles and their production fromoceanbubble bursting. Proc. Natl.Acad. Sci. U.S.A. 107, 6652–6657 (2010).
39. V. C. Turekian, S. A. Macko, W. C. Keene, Concentrations, isotopic compositions, andsources of size-resolved, particulate organic carbon and oxalate in near-surface marineair at Bermuda during spring. J. Geophys. Res. Atmos. 108, 4157 (2003).
40. M. Rinaldi, S. Decesari, C. Carbone, E. Finessi, S. Fuzzi, D. Ceburnis, C. D. O’Dowd, J. Sciare,J. P. Burrows, M. vrekoussis, B. Ervens, K. Tsigaridis, M. C. Facchini, Evidence of a naturalmarine source of oxalic acid and a possible link to glyoxal. J. Geophys. Res. Atmos. 116,D16204 (2011).
41. S. R. Arnold, D. V. Spracklen, J. Williams, N. Yassaa, J. Sciare, B. Bonsang, V. Gros, I. Peeken,A. C. Lewis, S. Alvain, C. Moulin, Evaluation of the global oceanic isoprene source and itsimpacts on marine organic carbon aerosol. Atmos. Chem. Phys. 9, 1253–1262 (2009).
42. X. Zhou, A. J. Davis, D. J. Kieber, W. C. Keene, J. R. Maben, H. Maring, E. E. Dahl, M. A. Izaguirre,R. Sander, L. Smoydzyn, Photochemical production of hydroxyl radical and hydroperoxidesin water extracts of nascent marine aerosols produced by bursting bubbles from Sargassoseawater. Geophys. Res. Lett. 35, L20803 (2008).
43. S. M. Burrows, O. Ogunro, A. A. Frossard, L. M. Russell, P. J. Rasch, S. M. Elliott, A physicallybased framework for modeling the organic fractionation of sea spray aerosol from bubble filmLangmuir equilibria. Atmos. Chem. Phys. 14, 13601–13629 (2014).
44. R. T. Letscher, J. K. Moore, Y. C. Teng, F. Primeau, Variable C : N : P stoichiometry of dissolvedorganic matter cycling in the Community Earth System Model. Biogeosciences 12, 209–221 (2015).
45. S. C. Doney, I. Lima, J. K. Moore, K. Lindsay, M. J. Behrenfeld, T. K. Westberry, N. Mahowald,D. M. Glover, T. Takahashi, Skill metrics for confronting global upper ocean ecosystem-biogeochemistry models against field and remote sensing data. J. Mar. Syst. 76, 95–112(2009).
46. D. M. Westervelt, R. H. Moore, A. Nenes, P. J. Adams, Effect of primary organic sea sprayemissions on cloud condensation nuclei concentrations. Atmos. Chem. Phys. 12, 89–101(2012).
47. M. S. Long,W. C. Keene, D. J. Kieber, A. A. Frossard, L.M. Russell, J. R.Maben, J. D. Kinsey, P. K. Quinn,T. S. Bates, Light-enhanced primary marine aerosol production from biologically productiveseawater. Geophys. Res. Lett. 41, 2661–2670 (2014).
48. W. C. Keene, H. Maring, J. R. Maben, D. J. Kieber, A. A. P. Pszenny, E. E. Dahl, M. A. Izaguirre,A. J. Davis, M. S. Long, X. Zhou, L. Smoydzin, R. Sander, Chemical and physical characteristics ofnascent aerosols produced by bursting bubbles at a model air-sea interface. J. Geophys.Res. Atmos. 112 (2007).
49. M. S. Long, W. C. Keene, D. J. Kieber, D. J. Erickson, H. Maring, A sea-state based sourcefunction for size- and composition-resolved marine aerosol production. Atmos. Chem.Phys. 11, 1203–1216 (2011).
50. A. Lana, T. G. Bell, R. Simó, S.M. Vallina, J. Ballabrera-Poy, A. J. Kettle, J. Dachs, L. Bopp, E. S. Saltzman,J. Stefels, J. E. Johnson, P. S. Liss, Anupdated climatology of surface dimethlysulfide concentrationsand emission fluxes in the global ocean. Global Biogeochem. Cycles 25, GB1004 (2011).
51. R. Kohavi, paper presented at the Proceedings of the 14th International Joint Conference onArtificial Intelligence—Volume 2, Montreal, Quebec, Canada, 1995.
52. R. Boers, J. B. Jensen, P. B. Krummel, Microphysical and short-wave radiative structure ofstratocumulus clouds over the Southern Ocean: Summer results and seasonal differences.Q. J. R. Meteorol. Soc. 124, 151–168 (1998).
53. J. L. Gras, Cloud condensation nuclei over the SouthernOcean.Geophys. Res. Lett.17, 1565–1567(1990).
54. A. Schmidt, K. S. Carslaw, G.W.Mann, A. Rap, K. J. Pringle, D. V. Spracklen,M.Wilson, P. M. Forster,Importance of tropospheric volcanic aerosol for indirect radiative forcing of climate. Atmos.Chem. Phys. 12, 7321–7339 (2012).
55. A. Rap, C. E. Scott, D. V. Spracklen, N. Bellouin, P. M. Forster, K. S. Carslaw, A. Schmidt, G. Mann,Natural aerosol direct and indirect radiative effects. Geophys. Res. Lett. 40, 3297–3301 (2013).
11 of 12
R E S EARCH ART I C L E
56. S. Kloster, J. Feichter, E. Maier-Reimer, K. D. Six, P. Stier, P. Wetze, DMS cycle in the marineocean-atmosphere system—A global model study. Biogeosciences 3, 29–51 (2006).
57. D. T. McCoy, D. L. Hartmann, D. P. Grosvenor, Observed Southern Ocean cloud properties andshortwave reflection. Part II: Phasechangesand lowcloud feedback. J. Climate27, 8858–8868 (2014).
58. A. J. Conley, J. F. Lamarque, F. Vitt, W. D. Collins, J. Kiehl, PORT, a CESM tool for the diagnosis ofradiative forcing. Geosci. Model Dev. 6, 469–476 (2013).
59. M. A. Thomas, P. Suntharalingam, L. Pozzoli, S. Rast, A. Devasthale, S. Kloster, J. Feichterand T. M. Lenton, Quantification of DMS aerosol-cloud-climate interactions using ECHAM5-HAMMOZ model in current climate scenario. Atmos. Chem. Phys. Discuss. 10, 3087–3127(2010).
60. D. T. McCoy, D. L. Hartmann, D. P. Grosvenor, Observed Southern Ocean cloud properties andshortwave reflection. Part I: Calculation of SW flux from observed cloud properties. J. Clim. 27,8836–8857 (2014).
61. M. D. Zelinka, T. Andrews, P. M. Forster, K. E. Taylor, Quantifying components of aerosol-cloud-radiation interactions in climate models. J. Geophys. Res. Atmos. 119, 7599–7615 (2014).
62. A. Engstrom, F. A. M. Bender, R. J. Charlson, R. Wood, Geographically coherent patterns ofalbedo enhancement and suppression associated with aerosol sources and sinks. Tellus 67,26442 (2015).
63. K. A. Prather, T. H. Bertram, V. H. Grassian, G. B. Deane, M. D. Stokes, P. J. DeMott, L. I. Aluwihare,B. P. Palenik, F. Azam, J. H. Seinfeld, R. C. Moffet, M. J. Molina, C. D. Cappa, F. M. Geiger,G. C. Roberts, L. M. Russell, A. P. Ault, J. Baltrusaitis, D. B. Collins, C. E. Corrigan, L. A. Cuadra-Rodriguez, C. J. Ebben, S. D. Forestieri, T. L. Guasco, S. P. Hersey, M. J. Kim, W. F. Lambert,R. L. Modini, W. Mui, B. E. Pedler, M. J. Ruppel, O. S. Ryder, N. G. Schoepp, R. C. Sullivan,and D. Zhao, Bringing the ocean into the laboratory to probe the chemical complexity ofsea spray aerosol. Proc. Natl. Acad. Sci. U.S.A. 110, 7550–7555 (2013).
64. A. P. Ault, R. C. Moffet, J. Baltrusaitis, D. B. Collins, M. J. Ruppel, L. A. Cuadra-Rodriguez, D. Zhao,T. L. Guasco, C. J. Ebben, F. M. Geiger, T. H. Bertram, K. A. Prather, V. H. Grassian, Size-dependent changes in sea spray aerosol composition and properties with different seawaterconditions. Environ. Sci. Technol. 47, 5603–5612 (2013).
65. J. Ovadnevaite, D. Ceburnis, G. Martucci, J. Bialek, C. Monahan, M. Rinaldi, M. C. Facchini,H. Berresheim, D. R. Worsnop, C. O’Dowd, Primary marine organic aerosol: A dichotomyof low hygroscopicity and high CCN activity. Geophys. Res. Lett. 38, L21806 (2011).
66. H. Kokkola, R. Sorjamaa, A. Peraniemi, T. Raatikainen, A. Laaksonen, Cloud formation of parti-cles containing humic-like substances. Geophys. Res. Lett. 33, L10816 (2006).
67. C. D. O’Dowd, M. C. Facchini, F. Cavalli, D. Ceburnis, M. Mircea, S. Decesari, S. Fuzzi, Y. J. Yoon,J. P. Putaud, Biogenically driven organic contribution to marine aerosol. Nature 431, 676–680(2004).
68. J. Sciare, O. Favez, R. Sarda-Estève, K. Oikonomou, H. Cachier, V. Kazan, Long-term observationsof carbonaceous aerosols in the Austral Ocean atmosphere: Evidence of a biogenic marineorganic source. J. Geophys. Res. Atmos. 114, D15302 (2009).
69. R. L. Modini, G. R. Johnson, C. R. He, Z. D. Ristovski, Observation of the suppression of wateruptake by marine particles. Atmos. Res. 98, 219–228 (2010).
70. D. B. Collins, A. P. Ault, R. C.Moffet,M. J. Ruppel, L. A. Cuadra-Rodriguez, T. L. Guasco, C. E. Corrigan,B. E. Pedler, F. Azam, L. I. Aluwihare, T. H. Bertram, G. C. Roberts, V. H. Grassian, K. A. Prather, Impactofmarinebiogeochemistry on the chemicalmixing state and cloud forming ability of nascent seaspray aerosol. J. Geophys. Res. Atmos. 118, 8553–8565 (2013).
71. A. A. Lacis, J. Hansen, A parameterization for the absorption of solar radiation in the Earth’satmosphere. J. Atmos. Sci. 31, 118–133 (1974).
72. R. W. Reynolds, N. A. Rayner, T. M. Smith, D. C. Stokes, W.Wang, An improved in situ and satelliteSST analysis for climate. J. Climate 15, 1609–1625 (2002).
73. J. W. Hurrell, M. M. Holland, P. R. Gent, S. Ghan, J. E. Kay, P. J. Kushner, J.-F. Lamarque,W. G. Large,D. Lawrence, K. Lindsay, W. H. Lipscomb, M. C. Long, N. Mahowald, D. R. Marsh, R. B. Neale,P. Rasch, S. Vavrus, M. Vertenstein, D. Bader, W. D. Collins, J. J. Hack, J. Kiehl, and S. Marshall,The Community Earth System Model: A framework for collaborative research. Bull. Am.Meteorol. Soc. 94, 1339–1360 (2013).
74. R. B. Neale, Description of the NCAR Community Atmosphere Model (CAM 5.0) (2010).75. E. J. Mlawer, S. J. Taubman, P. D. Brown, M. J. Iacono, S. A. Clough, Radiative transfer for
inhomogeneous atmospheres: RRTM, a validated correlated-k model for the longwave.J. Geophys. Res. Atmos. 102, 16663–16682 (1997).
McCoy et al. Sci. Adv. 2015;1:e1500157 17 July 2015
76. H. Morrison, A. Gettelman, A new two-moment bulk stratiform cloud microphysics scheme inthe Community Atmosphere Model, version 3 (CAM3). Part I: Description and numerical tests.J. Climate 21, 3642–3659 (2008).
77. I. C. Tsai, J. P. Chen, P. Y. Lin, W. C. Wang, I. S. A. Isaksen, Sulfur cycle and sulfate radiativeforcing simulated from a coupled global climate-chemistry model. Atmos. Chem. Phys. 10,3693–3709 (2010).
78. C. Textor, M. Schulz, S. Guibert, S. Kinne, Y. Balkanski, S. Bauer, T. Berntsen, T. Berglen, O. Boucher,M. Chin, F. Dentener, T. Diehl, R. Easter, H. Feichter, D. Fillmore, S. Ghan, P. Ginoux, S. Gong,A. Grini, J. Hendricks, L. Horowitz, P. Huang, I. Isaksen, I. Iversen, S. Kloster, D. Koch, A. Kirkevåg,J. E. Kristjansson, M. Krol, A. Lauer, J. F. Lamarque, X. Liu, V. Montanaro, G. Myhre, J. Penner,G. Pitari, S. Reddy, Ø. Seland, P. Stier, T. Takemura, and X. Tie, Analysis and quantification ofthe diversities of aerosol life cycles within AeroCom. Atmos. Chem. Phys. 6, 1777–1813(2006).
79. B. Gantt, N. Meskhidze, M. C. Facchini, M. Rinaldi, D. Ceburnis, and C. D. O’Dowd, Windspeed dependent size-resolved parameterization for the organic mass fraction of seaspray aerosol. Atmos. Chem. Phys. 11, 8777–8790 (2011).
80. D. Garcia, Robust smoothing of gridded data in one and higher dimensions with missingvalues. Comput. Stat. Data Anal. 54, 1167–1178 (2010).
81. G. J. Wang, D. Garcia, Y. Liu, R. de Jeu, A. J. Dolman, A three-dimensional gap filling methodfor large geophysical datasets: Application to global satellite soil moisture observations.Environ. Model. Software 30, 139–142 (2012).
82. K. J. Pringle, K. S. Carslaw, D. V. Spracklen, G. M. Mann, M. P. Chipperfield, The relationshipbetween aerosol and cloud drop number concentrations in a global aerosol microphysicsmodel. Atmos. Chem. Phys. Discuss. 9, 3207–3241 (2009).
Acknowledgments:We wish to thank the AeroCom intercomparison project for making the sea saltand sulfate model median data used in this study available, and the modeling centers whose modelsconstitute the median data set: UMI, UIO-CTM, LOA, LSCE, MPI-HAM, GISS, UIO-GCM, SPRINTARS, andULAQ. CERES data were obtained from the NASA Langley Research Center CERES ordering tool. MODISdata were obtained from the NASA Goddard Land Processes data archive. We thank A. Conley andF. Vitt for assistance setting up the PORT offline radiative transfer calculations; M. Maltrud for providingthe POP/BEC ocean biogeochemistry simulation data underlying the B14 parameterization; andB. Singh for technical support at PNNL. We also wish to thank the three anonymous reviewers,R. Charlson, C. Gaston, A. McCoy, and J. McCoy, for useful discussion and advice. POP/BEC, PORT,and CAM5 are components of the Community Earth System Model (CESM). The CESM project is sup-ported by the National Science Foundation and the Office of Science of the U.S. Department of Energy.The PORT radiative transfer calculations were performed using EMSL, a DOE Office of Science UserFacility sponsored by the Office of Biological and Environmental Research (BER) and located at PacificNorthwest National Laboratory. Funding:We wish to acknowledge the following funding sources: D.L.H.and D.T.M. were supported under NASA Grant NNX14AG26G, and D.T.M. acknowledges governmentsupport awarded by DoD, Air Force Office of Scientific Research, National Defense Science and Engineer-ing Graduate (NDSEG) Fellowship, 32 CFR 168a. S.M.B., P.-L.M., and P.J.R. were supported by the U.S.Department of Energy, Office of Science, BER as part of the Earth System Modeling program. D.P.G.was supported by the School of Earth and Environment at the University of Leeds. R.W. was supportedby NASA Grant NNX13AQ35G. S.M.E. was supported by several DOE SciDAC and SFA earth systemmodeling projects (Scientific Discovery through Advanced Computing, Science Focus Areas). Authorcontributions: D.T.M. and S.M.B. performed analysis and prepared figures and the manuscript.R.W., D.P.G., S.M.E., P.-L.M., P.J.R., and D.L.H. assisted with the analyses and preparation of themanuscript. All authors proofread and corrected the final version. Competing interests: Theauthors declare that they have no competing interests.
Submitted 4 February 2015Accepted 7 May 2015Published 17 July 201510.1126/sciadv.1500157
Citation: D. T. McCoy, S. M. Burrows, R. Wood, D. P. Grosvenor, S. M. Elliott, P.-L. Ma, P. J. Rasch,D. L. Hartmann, Natural aerosols explain seasonal and spatial patterns of Southern Oceancloud albedo. Sci. Adv. 1, e1500157 (2015).
12 of 12