NATO-Zinc Project in Anatolia
19
09/10/2013 1 A Success Zinc Story in Turkey and HarvestZinc Project Ismail Cakmak Sabanci University-Istanbul NATO-Zinc Project in Anatolia - Zn + Zn Effect of Zinc Fertilization on Wheat Production in Central Anatolia (1993-1998)
Transcript of NATO-Zinc Project in Anatolia

09/10/2013
1
A Success Zinc Story in Turkey and HarvestZinc Project
Ismail Cakmak Sabanci University-Istanbul
NATO-Zinc Project in Anatolia
- Zn + Zn
Effect of Zinc Fertilization on Wheat Production in Central Anatolia
(1993-1998)

09/10/2013
2
Effect of soil applications of micronutrients (5 kg ha-1) on
grain yield of wheat and barley. Experiment was conducted by Mufit Kalayci in Eskisehir (YEAR 1992)
Cereals
Applications Barley Bread Wheat
(tons ha-1)
Control (all micros) 4.73 4.64
All micros -Mn 5.38 4.54
All micros -Cu 4.91 3.93
All micros -B 4.81 4.20
All micros -Fe 4.53 4.36
All micros -Zn 3.07 2.96
Cakmak et al 1998, Field Crops Res.
With Zinc No Zinc
Year 1992: Field tests with and without zinc application
09/10/2013
3
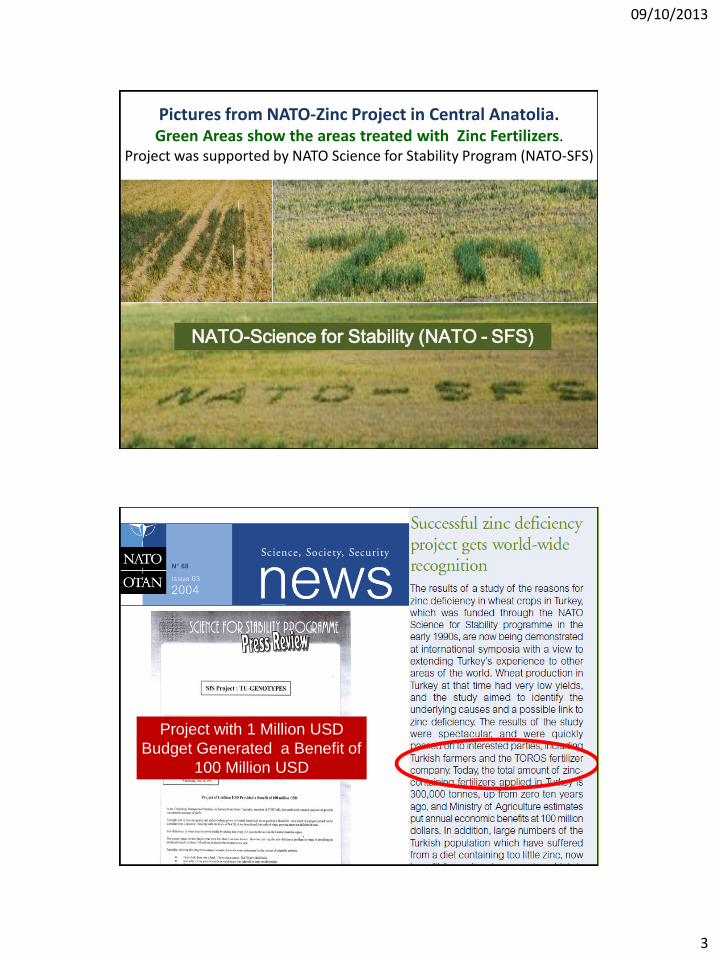
NATO-Science for Stability (NATO - SFS)
Pictures from NATO-Zinc Project in Central Anatolia. Green Areas show the areas treated with Zinc Fertilizers.
Project was supported by NATO Science for Stability Program (NATO-SFS)
Project with 1 Million USD
Budget Generated a Benefit of
100 Million USD

09/10/2013
4
0
100
200
300
400
500
Co
nsu
mp
tio
n (1
00
0 t
on
)
Years
Use of Zinc Containing Compound Fertilizers after NATO-Zinc Fertilizer Project in Turkey
“Success Story”
Source: Ministry of Agriculture and Toros Fertilizer
Statement of IFA -International Fertilizer Industry Association- 12 April 2005:
“The Anatolia initiative is one of the
world's first examples of using
agricultural practices to address public
health problems as well as improved
crop production, and its success
provides a model for countless other
nations”
09/10/2013
5
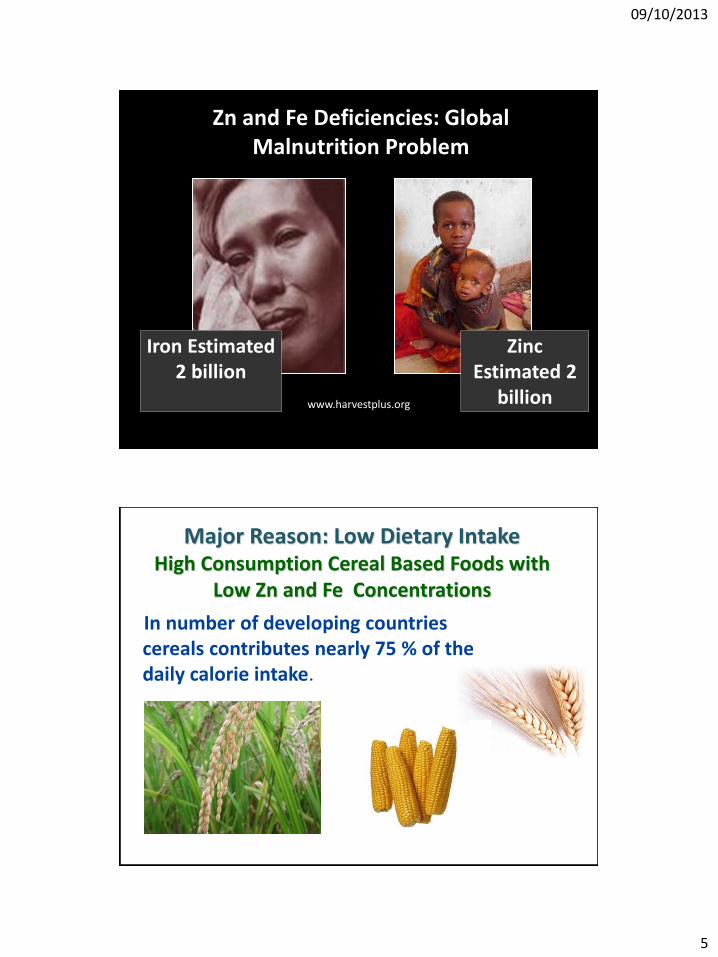
Zinc Estimated 2
billion
Iron Estimated 2 billion
Zn and Fe Deficiencies: Global Malnutrition Problem
www.harvestplus.org
Major Reason: Low Dietary Intake High Consumption Cereal Based Foods with
Low Zn and Fe Concentrations
In number of developing countries cereals contributes nearly 75 % of the daily calorie intake.

09/10/2013
6
For a better Zn nutrition of human beings,
cereal grains should contain around 40-60 mg Zn kg-1
Current Situation: 10-30 mg kg-1
elements must be obtained
(often) from the soil solution by roots
Plants are not able to synthesize mineral nutrients Mineral nutrient must be absorbed by roots (or by leaves)

09/10/2013
7
Zn
Zn
Zn
Zn Zn
high CaCO3 high pH clay soils low organic matter low soil moisture high Fe and Al oxides Zn
Zn Enhanced Zn adsorption and precipitation
SOIL
Limited Zn uptake
There are several soil chemical and physical factors limiting capacity of plants to absorb adequate
amount of zinc from soils
Solutions to Micronutrient Deficiencies
• Supplementation
• Food Fortification
Golden Wheat Fortfied with Zn

09/10/2013
8
Agricultural Solutions (Breeding and Fertilizer Approaches)
•Breeding
•Agronomy/Fertilizers
Complementary approaches
Application of Zinc Fertilizers: (Agronomic Biofortification)
Rapid and Sustainable Solution
Application of Zn-containing fertilizers offers a rapid solution to the problem
09/10/2013
9
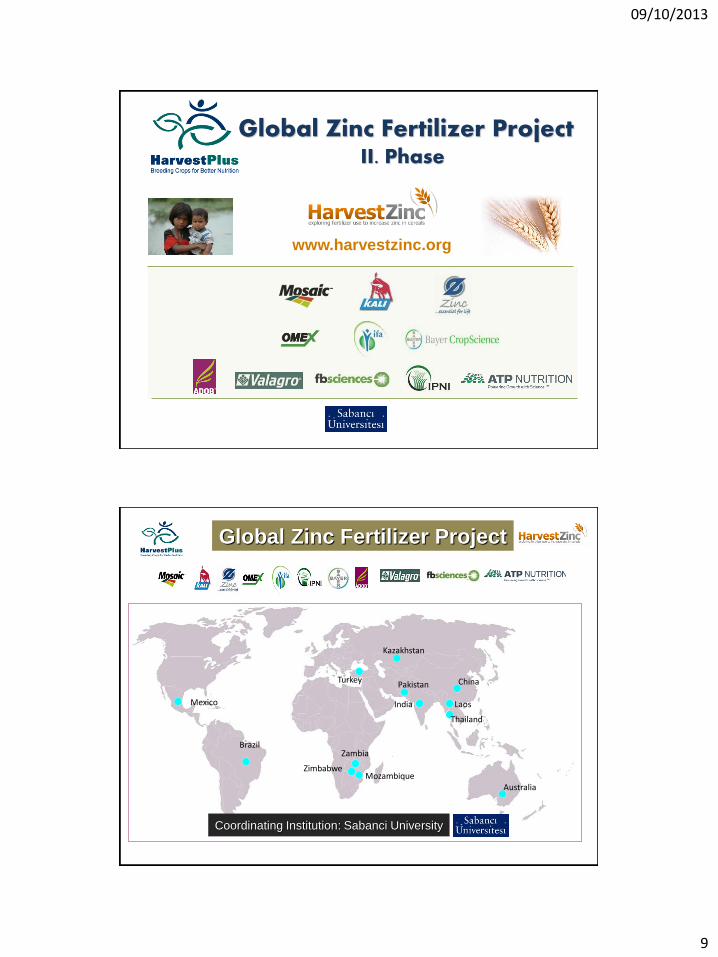
Global Zinc Fertilizer Project II. Phase
www.harvestzinc.org
Brazil
Zimbabwe
Zambia
Mozambique
Pakistan
India
Kazakhstan
Laos
China
Thailand
Australia
Turkey
Coordinating Institution: Sabanci University
Global Zinc Fertilizer Project
Mexico
09/10/2013
10
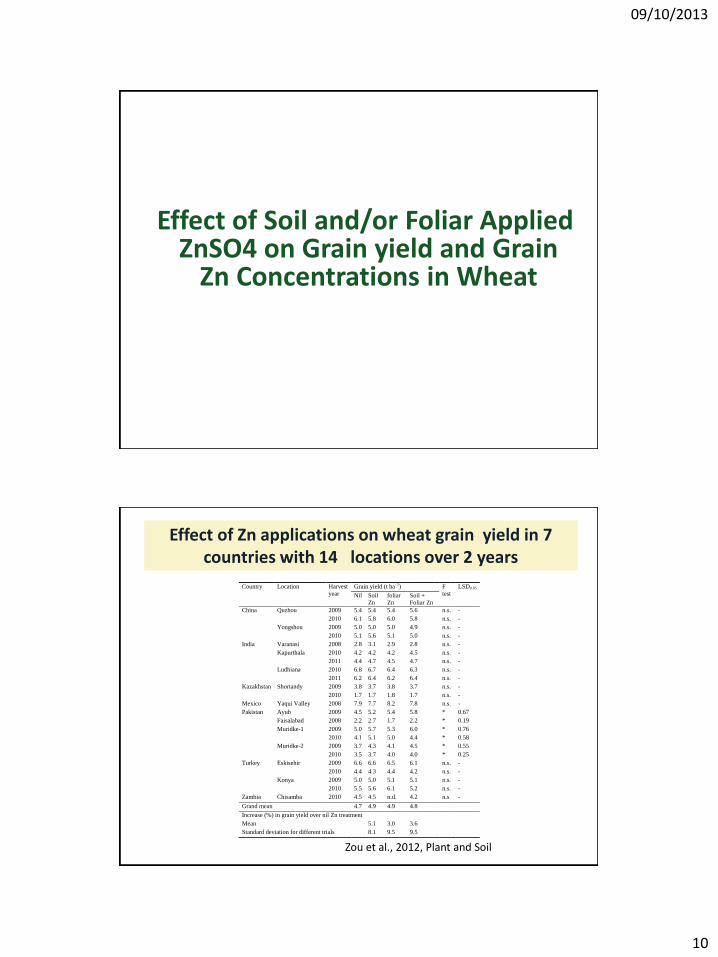
Effect of Soil and/or Foliar Applied ZnSO4 on Grain yield and Grain
Zn Concentrations in Wheat
Effect of Zn applications on wheat grain yield in 7 countries with 14 locations over 2 years
Country Location Harvest
year
Grain yield (t ha–1
) F
test
LSD0.05
Nil Soil
Zn
foliar
Zn
Soil +
Foliar Zn
China Quzhou 2009 5.4 5.4 5.4 5.6 n.s. -
2010 6.1 5.8 6.0 5.8 n.s. -
Yongshou 2009 5.0 5.0 5.0 4.9 n.s. -
2010 5.1 5.6 5.1 5.0 n.s. -
India Varanasi 2008 2.8 3.1 2.9 2.8 n.s. -
Kapurthala 2010 4.2 4.2 4.2 4.5 n.s. -
2011 4.4 4.7 4.5 4.7 n.s. -
Ludhiana 2010 6.8 6.7 6.4 6.3 n.s. -
2011 6.2 6.4 6.2 6.4 n.s. -
Kazakhstan Shortandy 2009 3.8 3.7 3.8 3.7 n.s. -
2010 1.7 1.7 1.8 1.7 n.s. -
Mexico Yaqui Valley 2008 7.9 7.7 8.2 7.8 n.s. -
Pakistan Ayub 2009 4.5 5.2 5.4 5.8 * 0.67
Faisalabad 2008 2.2 2.7 1.7 2.2 * 0.19
Muridke-1 2009 5.0 5.7 5.3 6.0 * 0.76
2010 4.1 5.1 5.0 4.4 * 0.58
Muridke-2 2009 3.7 4.3 4.1 4.5 * 0.55
2010 3.5 3.7 4.0 4.0 * 0.25
Turkey Eskisehir 2009 6.6 6.6 6.5 6.1 n.s. -
2010 4.4 4.3 4.4 4.2 n.s. -
Konya 2009 5.0 5.0 5.1 5.1 n.s. -
2010 5.5 5.6 6.1 5.2 n.s. -
Zambia Chisamba 2010 4.5 4.5 n.d. 4.2 n.s -
Grand mean 4.7 4.9 4.9 4.8
Increase (%) in grain yield over nil Zn treatment
Mean 5.1 3.0 3.6
Standard deviation for different trials 8.1 9.5 9.5
Zou et al., 2012, Plant and Soil

09/10/2013
11
Effect of Zn applications on wheat grain yield in 7 countries with 14 locations over 2 years
Country Location Harvest
year
Grain yield (t ha–1
) F
test
LSD0.05
Nil Soil
Zn
foliar
Zn
Soil +
Foliar Zn
China Quzhou 2009 5.4 5.4 5.4 5.6 n.s. -
2010 6.1 5.8 6.0 5.8 n.s. -
Yongshou 2009 5.0 5.0 5.0 4.9 n.s. -
2010 5.1 5.6 5.1 5.0 n.s. -
India Varanasi 2008 2.8 3.1 2.9 2.8 n.s. -
Kapurthala 2010 4.2 4.2 4.2 4.5 n.s. -
2011 4.4 4.7 4.5 4.7 n.s. -
Ludhiana 2010 6.8 6.7 6.4 6.3 n.s. -
2011 6.2 6.4 6.2 6.4 n.s. -
Kazakhstan Shortandy 2009 3.8 3.7 3.8 3.7 n.s. -
2010 1.7 1.7 1.8 1.7 n.s. -
Mexico Yaqui Valley 2008 7.9 7.7 8.2 7.8 n.s. -
Pakistan Ayub 2009 4.5 5.2 5.4 5.8 * 0.67
Faisalabad 2008 2.2 2.7 1.7 2.2 * 0.19
Muridke-1 2009 5.0 5.7 5.3 6.0 * 0.76
2010 4.1 5.1 5.0 4.4 * 0.58
Muridke-2 2009 3.7 4.3 4.1 4.5 * 0.55
2010 3.5 3.7 4.0 4.0 * 0.25
Turkey Eskisehir 2009 6.6 6.6 6.5 6.1 n.s. -
2010 4.4 4.3 4.4 4.2 n.s. -
Konya 2009 5.0 5.0 5.1 5.1 n.s. -
2010 5.5 5.6 6.1 5.2 n.s. -
Zambia Chisamba 2010 4.5 4.5 n.d. 4.2 n.s -
Grand mean 4.7 4.9 4.9 4.8
Increase (%) in grain yield over nil Zn treatment
Mean 5.1 3.0 3.6
Standard deviation for different trials 8.1 9.5 9.5
Based on the trials in 7 countries with 14
locations over 2 years, Zn application
improved grain yield by 5.1 %
Zou et al., 2012, Plant and Soil
Grain Zn concentration in different countries with and without foliar zinc fertilization
Average of all countries -Zn: 26 +Zn:50
Country/Location -Zn +Zn
IndiaVaranasi 29 47
PAU-I 25 81
PAU-II 28 77
PAU-III 26 61
PAU-IV 49 65
IARI 33 45
KazakhstanLoc-I 19 54
Loc-II 28 73
PakistanLoc-I 27 48
Loc-II 28 44
Loc-III 30 40
Loc-IV 29 60
mg kg-1
Country/Location -Zn +Zn
MexicoYear-I 21 45
Year-II 36 60
TurkeyKonya 12 29
Adana 32 57
Samsun 23 49
Eskisehir 22 43
ChinaLoc-I 28 54
Loc-II 19 26
Australia
Loc-I 18 39
GermanyAverage 20 32
IranAverage 17 28
BrazilAverage 30 52
mg kg-1
www.harvestzinc.org

09/10/2013
12
Country/Location -Zn +Zn
IndiaVaranasi 29 47
PAU-I 25 81
PAU-II 28 77
PAU-III 26 61
PAU-IV 49 65
IARI 33 45
KazakhstanLoc-I 19 54
Loc-II 28 73
PakistanLoc-I 27 48
Loc-II 28 44
Loc-III 30 40
Loc-IV 29 60
mg kg-1
Country/Location -Zn +Zn
MexicoYear-I 21 45
Year-II 36 60
TurkeyKonya 12 29
Adana 32 57
Samsun 23 49
Eskisehir 22 43
ChinaLoc-I 28 54
Loc-II 19 26
Australia
Loc-I 18 39
GermanyAverage 20 32
IranAverage 17 28
BrazilAverage 30 52
mg kg-1
Average Concentrations of Grain Zn
(10 Countries with 32 locations)
-Zn: 26 ppm +Zn: 50 ppm
Grain Zn concentration in different countries with and without zinc fertilization
www.harvestzinc.org
Timing of foliar Zn application Foliar spray of Zn late in growing season results in much greater increases in grain Zn concentration when compared to the earlier applications of Zn.

09/10/2013
13
Staining/Localization of Zinc in Wheat Grain (red color)
EMBRYO
ENDOSPERM
ALEURONE
ALEURONE
Cakmak et al., 2010
Cereal Chemistry, 77: 10-20
0
5
10
15
20
25
0 200 400 600 800 1000 1200 1400 1600
Distance (µm)
Zn
co
ncen
trati
on
(m
g/k
g)
0
5
10
15
20
25
0 500 1000 1500 2000
Distance (µm)
Zn
co
ncen
trati
on
(m
g/k
g)
0
5
10
15
20
25
0 200 400 600 800 1000 1200 1400
Distance (µm)
Zn
co
ncen
trati
on
(m
g/K
g)
No Foliar Zn Application
Foliar Zn Spray at Stem Elongation and Booting
Foliar Zn Spray at Milk and Dough Stages
0
5
10
15
20
25
Distance (mm) 0 0.5 1.0 1.5 2.0
Zin
c, m
g kg
-1
0
5
10
15
20
25
Zin
c, m
g kg
-1
0
5
10
15
20
25
Distance (mm)
0 0.2 0.4 0.6 0.8 1.0 1.2 1.4
Distance (mm)
0 0.2 0.4 0.6 0.8 1.0 1.2 1.4 1.6
Zin
c, m
g kg
-1
Changes in Zinc Concentrations of Endosperm Depending on Timing of Foliar Zinc Spray (Measurements by LA-ICP-MS)
Cakmak et al 2010, J. Agric. Food Chem.

09/10/2013
14
Phytate is belived to impair Zn bioavailability
P : Phosphate group
P
P P
P
P
P
Phytate Cereal grains are rich
in phytate
Phytate forms
insoluble complexes
with Zn2+
Phytate concentration
is very low in endosperm
Change in Nutrient Composition With Milling Affects
Bioavailability & Warrants Consideration in Breeding
% of Total in Unmilled
Grain
Endosperm very low in phytate

09/10/2013
15
Economy Based on the knowledge and information collected from our collaborators from Haryana, Punjab, Varanasi, Orissa and Delhi, the cost of a single spray of ZnSO4 by using power-spray ranges is around 15 USD per ha (including the costs for 4 kg ZnSO4 and the costs associated with power-spray and labor).
A yield increase of only 1.5 % (+45 kg grain) would cover the costs of foliar Zn application assuming that average grain yield is about 3 tons per ha..
Seed Zinc
Planting seeds with high zinc
Seed germination and seedling vigour improved when high Zn-seeds are used

09/10/2013
16
Source: Ekiz et al., 1998, J. Plant Nutr.
12 mg Zn/kg 55 mg Zn/kg 25 mg Zn/kg
Influence of Seed Zn Content on Growth of Bread Wheat in a Zinc-Deficient Soil in Central Anatolia
Impact of Micronutrient Dense Rice Seed in Bangladesh
(data from J. Duxbury, 2002, Cornell Univ.)
Seed Treatment Yield (t/ha)
Complete (Zn, Mn, Cu, Mo, Ni) Mo,MNi)
4.6 a Zn only 4.0 b Complete - Mo 4.1 b Control 3.6 c
1 letters indicate significant difference at p < 0.1
0
20
40
60
80
100
Enriched
seed
Control
seed
Farmer
seed
Seed
lin
g e
merg
en
ce -
%
a b c

09/10/2013
17
Seed Zn: 26 ppm
Seed Zn: 43 ppm
Sabanci University
Thank you…
Thank You…
Sabanci University

09/10/2013
18
Conclusion Foliar Zn application represents a successful, rapid and
cost effective practice in Zn biofortification of cereals
The positive impact of foliar Zn fertilization occurrs
irrespective of the soil and environmental conditions,
management practices and cultivars.
Foliar Zn fertilizer approach can be locally and quickly
adopted for increasing dietary Zn intake in rural areas.
Kutman et al. 2011, Plant and Soil
Shoot Part Low N High N Low N High N
Husks 9 7 10 6
Grains 38 60 59 78
Leaves 48 28 17 8
Stem 5 6 14 7
IRON ZINC
Zinc and Iron Partitioning (%) at Maturity
Nitrogen Dependent

09/10/2013
19
Cakmak et al., 2010 Cereal Chem, 77: 10-20
Localization of Protein, Zinc and Iron in Wheat Grain
Protein Zinc Iron
Cakmak et al., 2010 Cereal Chem, 77: 10-20
Staining of Protein, Zinc and Iron in Wheat Grain
Protein Zinc Iron
High Protein in Seed: a Sink for Zn and Fe