NationalTrackingPoll#2103129 March19-22,2021 ...
300
National Tracking Poll #2103129 March 19-22, 2021 Crosstabulation Results Methodology: is poll was conducted between March 19-March 22, 2021 among a national sample of 1994 Reg- istered Voters. e interviews were conducted online and the data were weighted to approximate a target sample of Registered Voters based on gender, educational attainment, age, race, and region. Results from the full survey have a margin of error of plus or minus 2 percentage points.
Transcript of NationalTrackingPoll#2103129 March19-22,2021 ...

National Tracking Poll #2103129March 19-22, 2021
Crosstabulation Results
Methodology:This poll was conducted between March 19-March 22, 2021 among a national sample of 1994 Reg-istered Voters. The interviews were conducted online and the data were weighted to approximate atarget sample of Registered Voters based on gender, educational attainment, age, race, and region.Results from the full survey have a margin of error of plus or minus 2 percentage points.

Table Index
1 Table P1: Now, generally speaking, would you say that things in the country are going in theright direction, or have they pretty seriously gotten off on the wrong track? . . . . . . . . . . 6
2 Table nr2b: Do you approve or disapprove of the job Joe Biden is doing as President? . . . . 10
3 Table nr2bNET: Do you approve or disapprove of the job Joe Biden is doing as President? . . 14
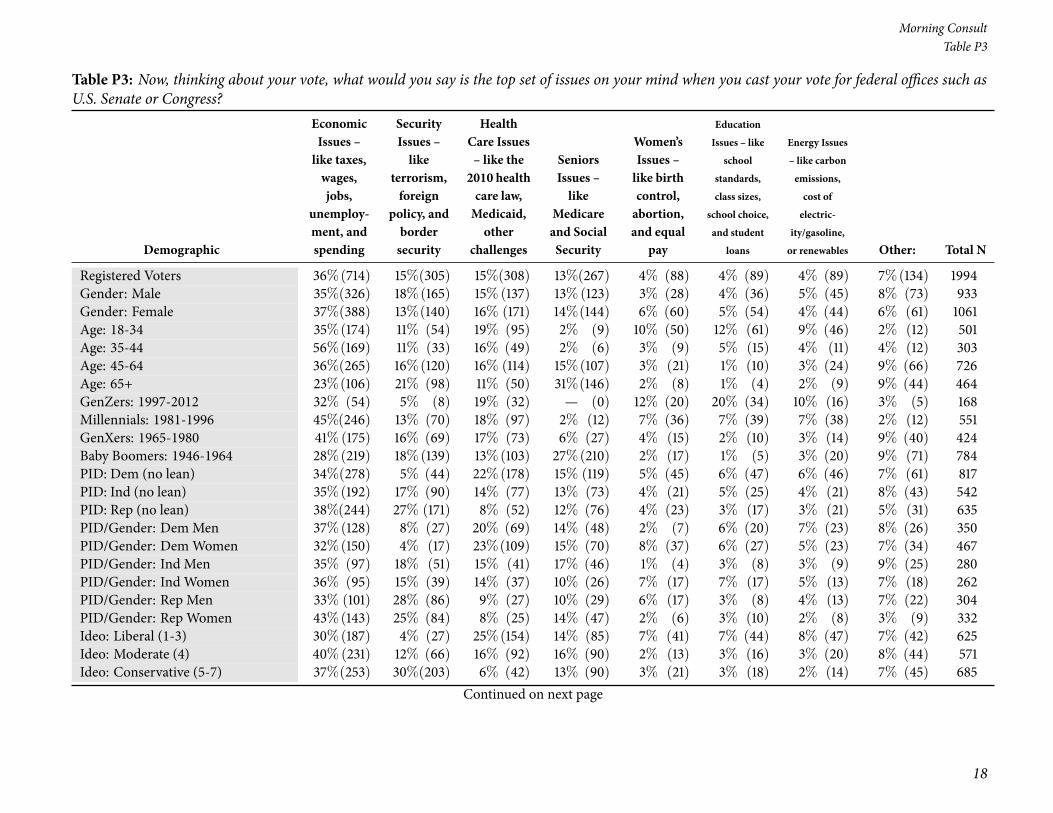
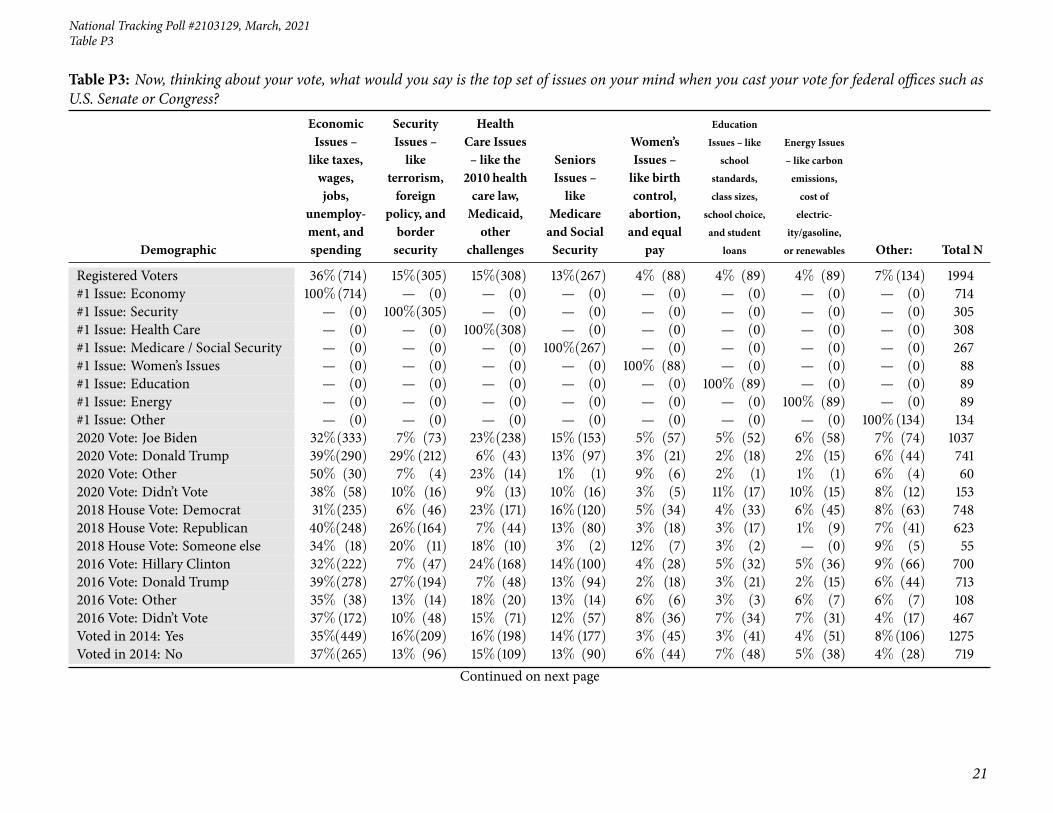
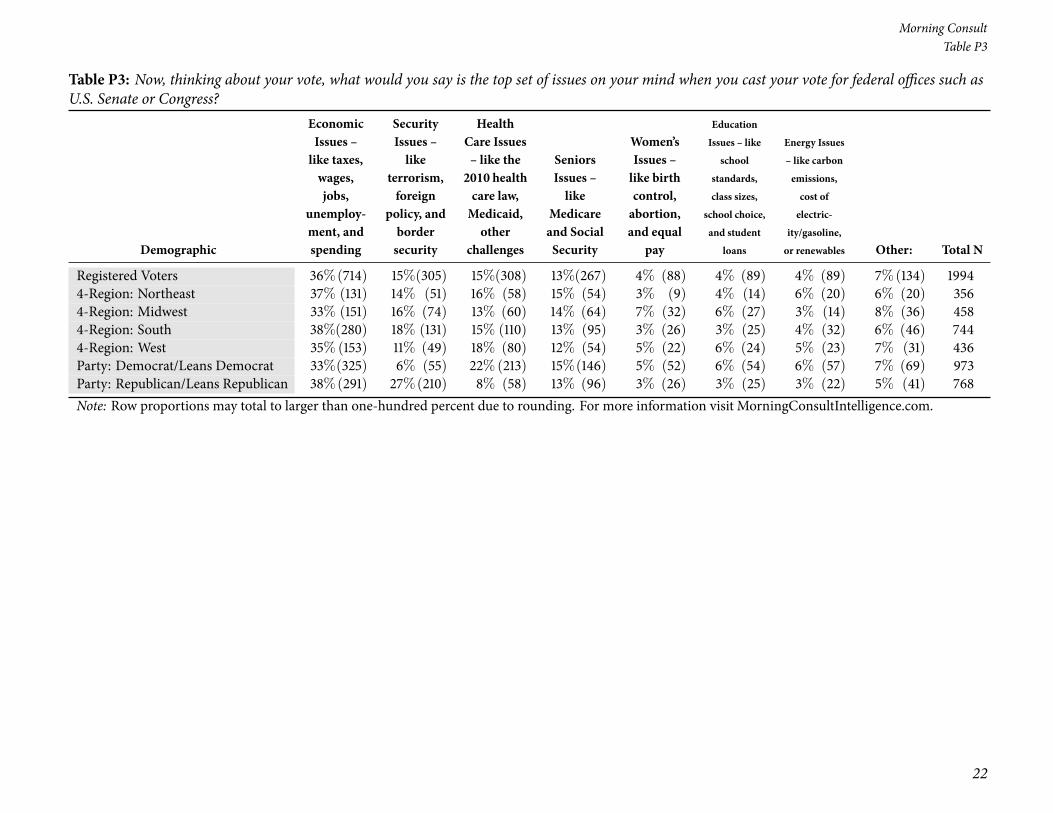
4 Table P3: Now, thinking about your vote, what would you say is the top set of issues on yourmind when you cast your vote for federal offices such as U.S. Senate or Congress? . . . . . . . 18
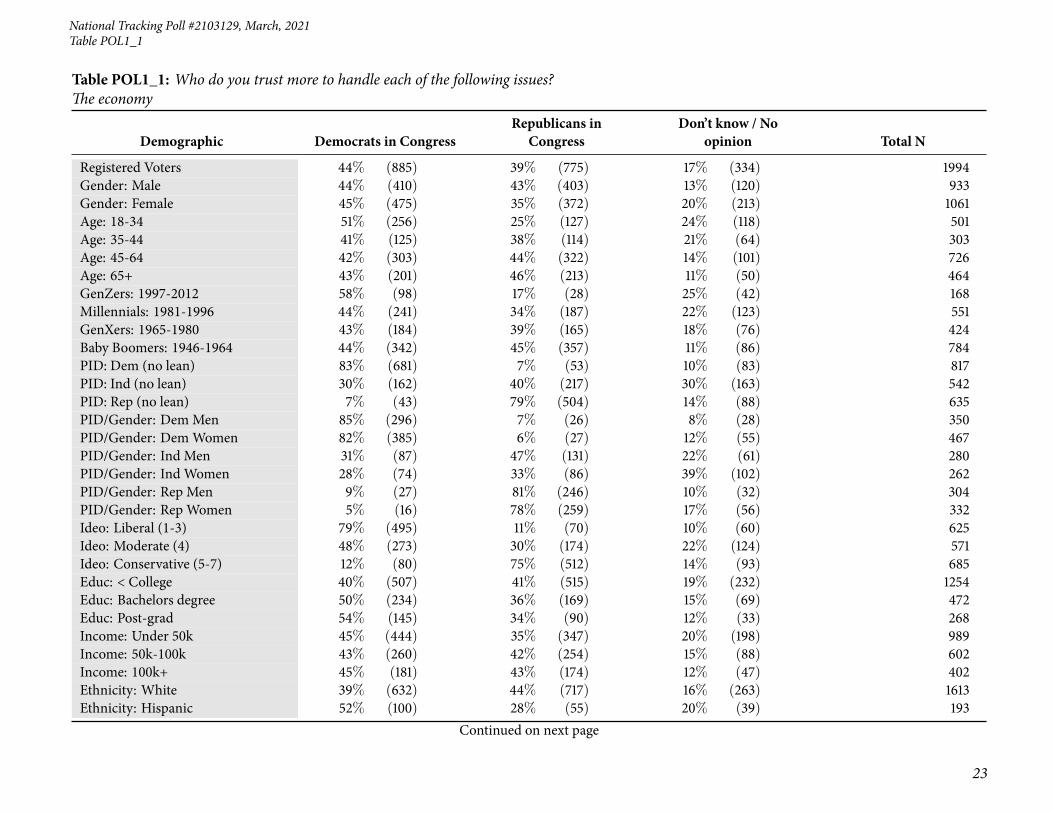
5 Table POL1_1: Who do you trust more to handle each of the following issues? The economy 23
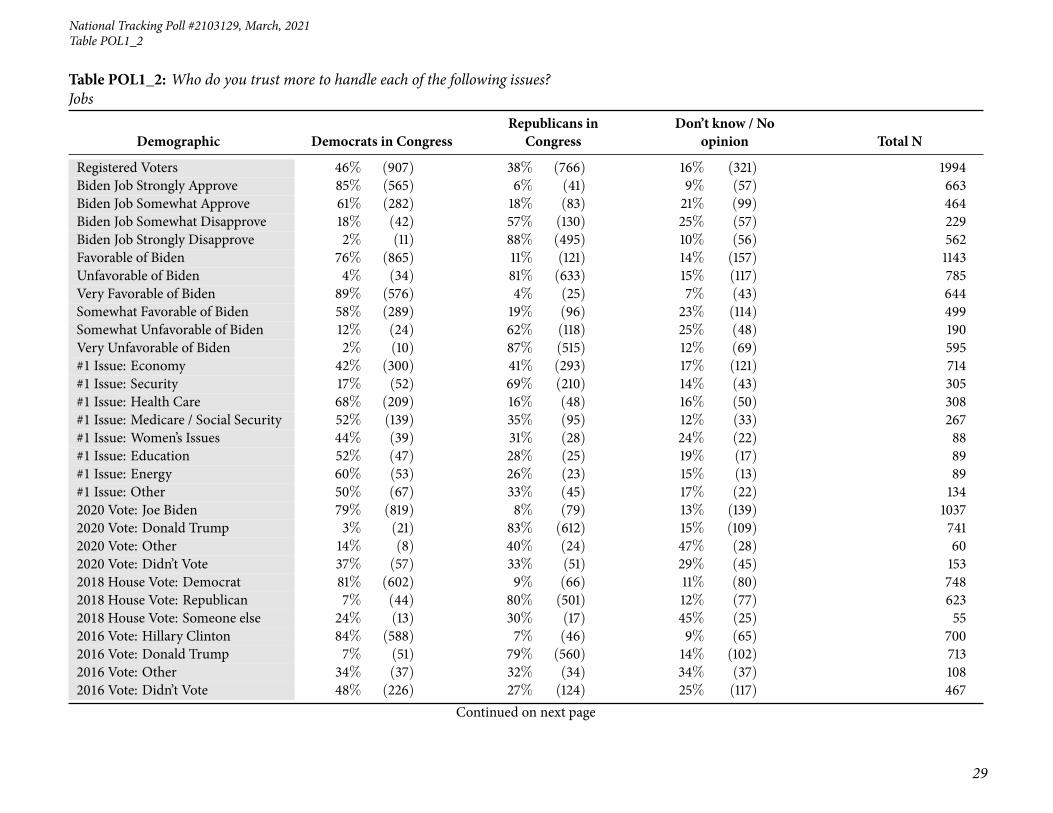
6 Table POL1_2: Who do you trust more to handle each of the following issues? Jobs . . . . . 27
7 Table POL1_3: Who do you trust more to handle each of the following issues? Health care . 31
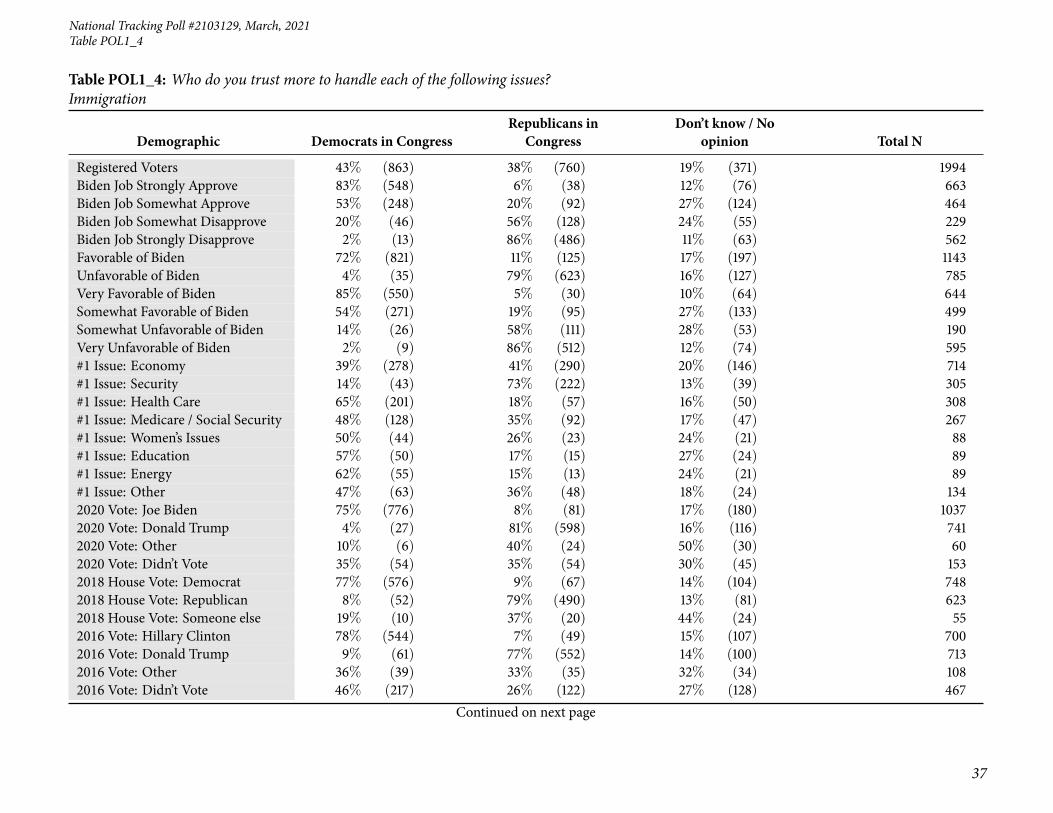
8 Table POL1_4: Who do you trust more to handle each of the following issues? Immigration 35
9 Table POL1_5: Who do you trust more to handle each of the following issues? Climate change 39
10 Table POL1_6: Who do you trust more to handle each of the following issues? The environment 43
11 Table POL1_7: Who do you trust more to handle each of the following issues? Energy . . . 47
12 Table POL1_8: Who do you trust more to handle each of the following issues? Education . . 51
13 Table POL1_9: Who do you trust more to handle each of the following issues? National security 55
14 Table POL1_10: Who do you trust more to handle each of the following issues? Gun policy . 59
15 Table POL1_11: Who do you trust more to handle each of the following issues? ProtectingMedicare and Social Security . . . . . . . . . . . . . . . . . . . . . . . . . . . . . . . . . . 63
16 Table POL1_12: Who do you trust more to handle each of the following issues? Coronavirus 67
17 Table POL1_13: Who do you trust more to handle each of the following issues? Voting rights 71
18 Table POL2_1: How important of a priority should each of the following be for Congress?Passing a healthcare reform bill . . . . . . . . . . . . . . . . . . . . . . . . . . . . . . . . . 75
19 Table POL2_2: How important of a priority should each of the following be for Congress?Passing a bill to address climate change and its effects . . . . . . . . . . . . . . . . . . . . . 79
20 Table POL2_3: How important of a priority should each of the following be for Congress?Passing a bill to reduce inequality . . . . . . . . . . . . . . . . . . . . . . . . . . . . . . . 83
21 Table POL2_4: How important of a priority should each of the following be for Congress?Passing an infrastructure spending bill . . . . . . . . . . . . . . . . . . . . . . . . . . . . . 87
22 Table POL2_5: How important of a priority should each of the following be for Congress?Passing an immigration reform bill . . . . . . . . . . . . . . . . . . . . . . . . . . . . . . . 91
2

National Tracking Poll #2103129, March, 2021
23 Table POL2_6: How important of a priority should each of the following be for Congress?Reducing the federal budget deficit . . . . . . . . . . . . . . . . . . . . . . . . . . . . . . . 95
24 Table POL2_7: How important of a priority should each of the following be for Congress?Passing legislation placing additional restrictions on gun ownership . . . . . . . . . . . . . . 99
25 Table POL2_8: How important of a priority should each of the following be for Congress?Regulating tech companies . . . . . . . . . . . . . . . . . . . . . . . . . . . . . . . . . . . 103
26 Table POL2_9: How important of a priority should each of the following be for Congress?Stimulating the economy to recover from the coronavirus pandemic . . . . . . . . . . . . . . 107
27 Table POL2_10: How important of a priority should each of the following be for Congress?Eliminating the legislative filibuster in the Senate . . . . . . . . . . . . . . . . . . . . . . . 111
28 Table POL2_11: How important of a priority should each of the following be for Congress?Passing a bill to legalize marijuana . . . . . . . . . . . . . . . . . . . . . . . . . . . . . . . 115
29 Table POL2_12: How important of a priority should each of the following be for Congress?Passing a bill to provide relief to Americans with student loan debt . . . . . . . . . . . . . . 119
30 Table POL3_1: How would you rate each of the following on their handling of the coron-avirus? President Joe Biden . . . . . . . . . . . . . . . . . . . . . . . . . . . . . . . . . . . 123
31 Table POL3_2: How would you rate each of the following on their handling of the coron-avirus? Congress . . . . . . . . . . . . . . . . . . . . . . . . . . . . . . . . . . . . . . . . 127
32 Table POL3_3: How would you rate each of the following on their handling of the coron-avirus? Congressional Democrats . . . . . . . . . . . . . . . . . . . . . . . . . . . . . . . 131
33 Table POL3_4: How would you rate each of the following on their handling of the coron-avirus? Congressional Republicans . . . . . . . . . . . . . . . . . . . . . . . . . . . . . . . 135
34 Table POL3_5: How would you rate each of the following on their handling of the coron-avirus? The World Health Organization (WHO) . . . . . . . . . . . . . . . . . . . . . . . . 139
35 Table POL3_6: How would you rate each of the following on their handling of the coron-avirus? The Centers for Disease Control and Prevention (CDC) . . . . . . . . . . . . . . . . 143
36 Table POL3_7: How would you rate each of the following on their handling of the coron-avirus? Your state’s governor . . . . . . . . . . . . . . . . . . . . . . . . . . . . . . . . . . 147
37 Table POL3_8: How would you rate each of the following on their handling of the coron-avirus? Dr. Anthony Fauci, Director of the National Institute of Allergy and Infectious Diseases 151
38 Table POL4: Generally speaking, would you say you are more concerned about... . . . . . . 155
39 Table POL5: Currently, do you believe it’s more important for the government to address the: 159
40 Table POL6: Even if neither is exactly correct, which of the following comes closest to youropinion? . . . . . . . . . . . . . . . . . . . . . . . . . . . . . . . . . . . . . . . . . . . . . 163
3

Morning Consult
41 Table POL7: As you may know, in response to the coronavirus Americans have been en-couraged to ’social distance’ with many states canceling upcoming major events and closingschools, restaurants, and other public spaces. Based on what you know, when do you believeAmericans will be able to stop social distancing and return to public spaces? . . . . . . . . . 167
42 Table POL8: Do you support or oppose aMedicare for All health care system, where all Amer-icans would get their health insurance from the government? . . . . . . . . . . . . . . . . . 171
43 Table POL9: Do you support or oppose a public health insurance option – a system in whichall Americans can choose to purchase coverage either from a government-run health programor private insurers? . . . . . . . . . . . . . . . . . . . . . . . . . . . . . . . . . . . . . . . 175
44 Table POL10: And, would you support or oppose a plan that would automatically enrollAmericans in a public health insurance option and retroactively charge them for this coverageif they choose not to enroll in other health insurance coverage, either from a public or privateinsurer? . . . . . . . . . . . . . . . . . . . . . . . . . . . . . . . . . . . . . . . . . . . . . 179
45 Table POL11: As you may know, Republicans and Democrats in the U.S. House of Repre-sentatives have reinstated earmarks, the previously banned practice of including provisions inbills that direct public funds to specific recipients such as individual Congressional districts.Based on what you know, do you support or oppose reinstating earmarks? . . . . . . . . . . 183
46 Table POL12: Do you believe the president of the United States has a responsibility to con-demn bigotry and discrimination that happens in this country? . . . . . . . . . . . . . . . . 187
47 TablePOL13: WhenDonald Trumpwas President, was theUnited States immigration systembetter or worse than it had been previously, or was there no change? . . . . . . . . . . . . . 191
48 Table POL14: With Joe Biden as President, has the United States immigration system gottenbetter or worse than it had been previously, or has there been no change? . . . . . . . . . . . 195
49 Table POL15: Which of the following statements comes closest to your view, even if none areexactly right? . . . . . . . . . . . . . . . . . . . . . . . . . . . . . . . . . . . . . . . . . . 199
50 Table POL16: Which of the following do you think is the best way to handle immigrantscurrently living in the United States undocumented? . . . . . . . . . . . . . . . . . . . . . . 203
51 Table POL17: As youmay know, ’Dreamers’ are young people whowere brought to the UnitedStates illegally when they were children, often with their parents. Which of the following doyou think is the best way to handle Dreamers? . . . . . . . . . . . . . . . . . . . . . . . . . 207
52 Table POL18_1: How much have you seen, read, or heard about the following? Trump en-couraging Americans to get the COVID-19 vaccine . . . . . . . . . . . . . . . . . . . . . . 212
53 Table POL18_2: How much have you seen, read, or heard about the following? A shootingspree at three spas in the Atlanta area that left 8 people dead, including 6 women of Asian descent216
54 Table POL18_3: How much have you seen, read, or heard about the following? The openingweekend of the NCAAMarch Madness basketball tournaments . . . . . . . . . . . . . . . . 220
4
National Tracking Poll #2103129, March, 2021
55 Table POL18_4: How much have you seen, read, or heard about the following? Rep. DebHaaland (D-N.M.) being confirmed as secretary of the Interior Department, making her thefirst Native American member of the Cabinet in U.S. history . . . . . . . . . . . . . . . . . 224
56 Table POL18_5: How much have you seen, read, or heard about the following? KatherineTai being confirmed as the U.S. Trade Representative, making her the first Asian-American tohold the position in U.S. history . . . . . . . . . . . . . . . . . . . . . . . . . . . . . . . . 228
57 Table POL18_6: Howmuch have you seen, read, or heard about the following? Jury selectionin the trial of Derek Chauvin, the Minneapolis police officer accused of killing George Floyd . 232
58 Table POL18_7: Howmuch have you seen, read, or heard about the following? President JoeBiden’s dog, Major, biting someone at the White House . . . . . . . . . . . . . . . . . . . . 236
59 Table POL18_8: Howmuch have you seen, read, or heard about the following? An increasingnumber of child migrants crossing the U.S.-Mexico border . . . . . . . . . . . . . . . . . . . 240
60 Table POL18_POL18_9: How much have you seen, read, or heard about the following? TheCenters for Disease Control and Prevention relaxing its physical distancing guidelines for stu-dents in school from 6 feet to 3 feet . . . . . . . . . . . . . . . . . . . . . . . . . . . . . . . 244
61 Table POLx_1: Next we will look at a list of names that are active in politics. It is a longlist, please take the time to go through the list carefully and give an individual answer foreach name below. For each person, please indicate if you have a Very Favorable, SomewhatFavorable, Somewhat Unfavorable, or Very Unfavorable opinion of each If you have heard ofthe person, but do not have an opinion, please mark ’Heard Of, No Opinion.’ If you have notheard of the person, please mark ’Never Heard Of.’Mitch McConnell . . . . . . . . . . . . . 248
62 Table POLx_2: Favorability for Nancy Pelosi . . . . . . . . . . . . . . . . . . . . . . . . . 252
63 Table POLx_3: Favorability for Charles Schumer . . . . . . . . . . . . . . . . . . . . . . . 256
64 Table POLx_4: Favorability for Mike Pence . . . . . . . . . . . . . . . . . . . . . . . . . . 260
65 Table POLx_5: Favorability for Donald Trump . . . . . . . . . . . . . . . . . . . . . . . . 264
66 Table POLx_6: Favorability for Republicans in Congress . . . . . . . . . . . . . . . . . . . 268
67 Table POLx_7: Favorability for Democrats in Congress . . . . . . . . . . . . . . . . . . . . 272
68 Table POLx_9: Favorability for Kevin McCarthy . . . . . . . . . . . . . . . . . . . . . . . 276
69 Table POLx_10: Favorability for Joe Biden . . . . . . . . . . . . . . . . . . . . . . . . . . 280
70 Table POLx_11: Favorability for Kamala Harris . . . . . . . . . . . . . . . . . . . . . . . 284
71 Table POLx_12: Favorability for Vladamir Putin . . . . . . . . . . . . . . . . . . . . . . . 288
72 Table POLx_13: Favorability for Xi Jinping . . . . . . . . . . . . . . . . . . . . . . . . . . 292
73 Summary Statistics of Survey Respondent Demographics . . . . . . . . . . . . . . . . . 296
5
6
Morning ConsultTable P1
Crosstabulation Results by Respondent Demographics
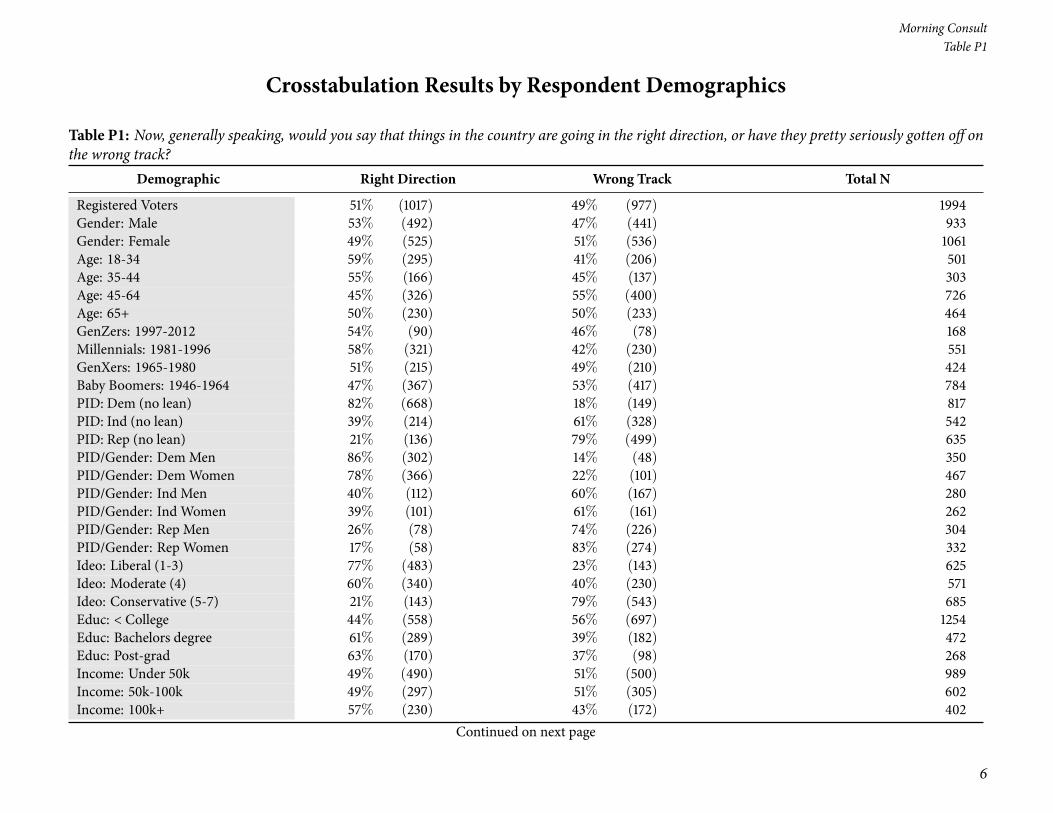
Table P1: Now, generally speaking, would you say that things in the country are going in the right direction, or have they pretty seriously gotten off onthe wrong track?
Demographic Right Direction Wrong Track Total N
Registered Voters 51% (1017) 49% (977) 1994Gender: Male 53% (492) 47% (441) 933Gender: Female 49% (525) 51% (536) 1061Age: 18-34 59% (295) 41% (206) 501Age: 35-44 55% (166) 45% (137) 303Age: 45-64 45% (326) 55% (400) 726Age: 65+ 50% (230) 50% (233) 464GenZers: 1997-2012 54% (90) 46% (78) 168Millennials: 1981-1996 58% (321) 42% (230) 551GenXers: 1965-1980 51% (215) 49% (210) 424Baby Boomers: 1946-1964 47% (367) 53% (417) 784PID: Dem (no lean) 82% (668) 18% (149) 817PID: Ind (no lean) 39% (214) 61% (328) 542PID: Rep (no lean) 21% (136) 79% (499) 635PID/Gender: DemMen 86% (302) 14% (48) 350PID/Gender: DemWomen 78% (366) 22% (101) 467PID/Gender: Ind Men 40% (112) 60% (167) 280PID/Gender: Ind Women 39% (101) 61% (161) 262PID/Gender: Rep Men 26% (78) 74% (226) 304PID/Gender: Rep Women 17% (58) 83% (274) 332Ideo: Liberal (1-3) 77% (483) 23% (143) 625Ideo: Moderate (4) 60% (340) 40% (230) 571Ideo: Conservative (5-7) 21% (143) 79% (543) 685Educ: < College 44% (558) 56% (697) 1254Educ: Bachelors degree 61% (289) 39% (182) 472Educ: Post-grad 63% (170) 37% (98) 268Income: Under 50k 49% (490) 51% (500) 989Income: 50k-100k 49% (297) 51% (305) 602Income: 100k+ 57% (230) 43% (172) 402
Continued on next page

National Tracking Poll #2103129, March, 2021
7
Table P1
Table P1: Now, generally speaking, would you say that things in the country are going in the right direction, or have they pretty seriously gotten off onthe wrong track?
Demographic Right Direction Wrong Track Total N
Registered Voters 51% (1017) 49% (977) 1994Ethnicity: White 48% (766) 52% (846) 1613Ethnicity: Hispanic 52% (101) 48% (92) 193Ethnicity: Black 71% (180) 29% (73) 253Ethnicity: Other 55% (71) 45% (58) 128All Christian 50% (516) 50% (520) 1036All Non-Christian 75% (87) 25% (29) 115Atheist 61% (53) 39% (34) 88Agnostic/Nothing in particular 53% (239) 47% (211) 450Something Else 40% (122) 60% (183) 305Religious Non-Protestant/Catholic 65% (91) 35% (49) 141Evangelical 42% (231) 58% (317) 547Non-Evangelical 52% (383) 48% (359) 742Community: Urban 67% (395) 33% (192) 586Community: Suburban 49% (455) 51% (469) 924Community: Rural 35% (167) 65% (317) 484Employ: Private Sector 56% (372) 44% (291) 663Employ: Government 61% (74) 39% (46) 120Employ: Self-Employed 54% (95) 46% (81) 176Employ: Homemaker 31% (36) 69% (82) 118Employ: Student 46% (42) 54% (49) 91Employ: Retired 50% (267) 50% (268) 534Employ: Unemployed 43% (78) 57% (103) 182Employ: Other 48% (54) 52% (57) 111Military HH: Yes 48% (160) 52% (173) 333Military HH: No 52% (857) 48% (804) 1661RD/WT: Right Direction 100% (1017) — (0) 1017RD/WT: Wrong Track — (0) 100% (977) 977Biden Job Approve 81% (915) 19% (212) 1127Biden Job Disapprove 9% (72) 91% (720) 792
Continued on next page
8
Morning ConsultTable P1
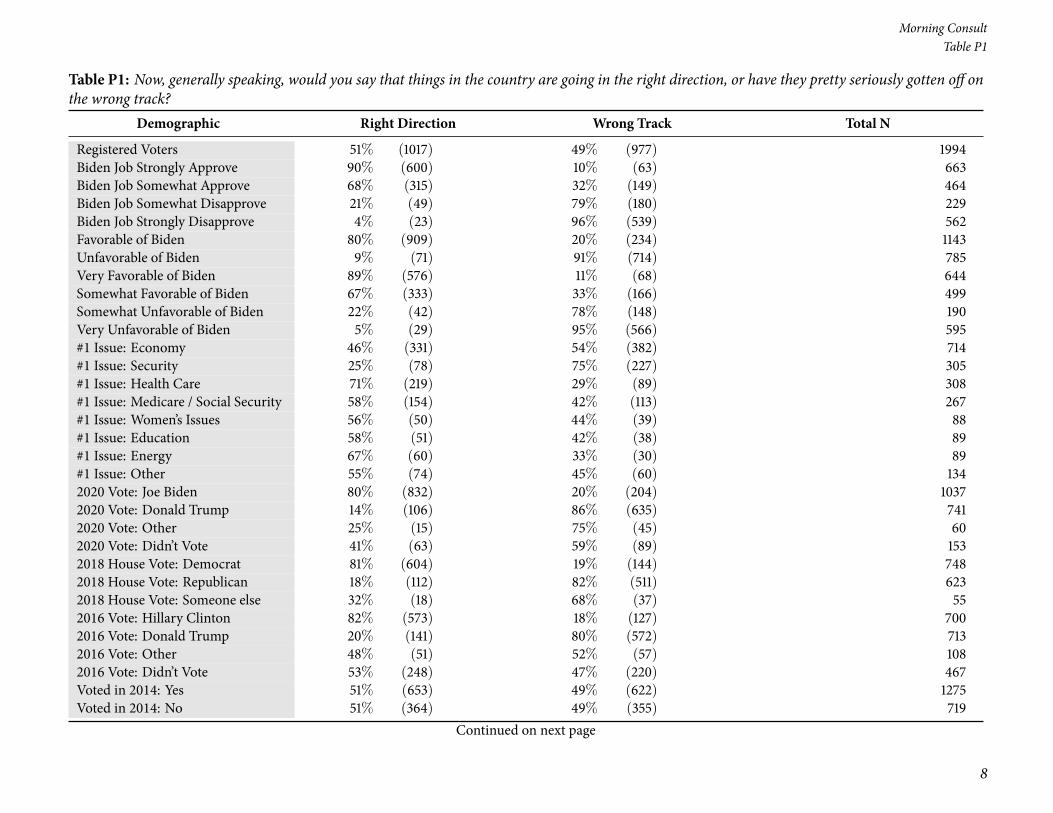
Table P1: Now, generally speaking, would you say that things in the country are going in the right direction, or have they pretty seriously gotten off onthe wrong track?
Demographic Right Direction Wrong Track Total N
Registered Voters 51% (1017) 49% (977) 1994Biden Job Strongly Approve 90% (600) 10% (63) 663Biden Job Somewhat Approve 68% (315) 32% (149) 464Biden Job Somewhat Disapprove 21% (49) 79% (180) 229Biden Job Strongly Disapprove 4% (23) 96% (539) 562Favorable of Biden 80% (909) 20% (234) 1143Unfavorable of Biden 9% (71) 91% (714) 785Very Favorable of Biden 89% (576) 11% (68) 644Somewhat Favorable of Biden 67% (333) 33% (166) 499Somewhat Unfavorable of Biden 22% (42) 78% (148) 190Very Unfavorable of Biden 5% (29) 95% (566) 595#1 Issue: Economy 46% (331) 54% (382) 714#1 Issue: Security 25% (78) 75% (227) 305#1 Issue: Health Care 71% (219) 29% (89) 308#1 Issue: Medicare / Social Security 58% (154) 42% (113) 267#1 Issue: Women’s Issues 56% (50) 44% (39) 88#1 Issue: Education 58% (51) 42% (38) 89#1 Issue: Energy 67% (60) 33% (30) 89#1 Issue: Other 55% (74) 45% (60) 1342020 Vote: Joe Biden 80% (832) 20% (204) 10372020 Vote: Donald Trump 14% (106) 86% (635) 7412020 Vote: Other 25% (15) 75% (45) 602020 Vote: Didn’t Vote 41% (63) 59% (89) 1532018 House Vote: Democrat 81% (604) 19% (144) 7482018 House Vote: Republican 18% (112) 82% (511) 6232018 House Vote: Someone else 32% (18) 68% (37) 552016 Vote: Hillary Clinton 82% (573) 18% (127) 7002016 Vote: Donald Trump 20% (141) 80% (572) 7132016 Vote: Other 48% (51) 52% (57) 1082016 Vote: Didn’t Vote 53% (248) 47% (220) 467Voted in 2014: Yes 51% (653) 49% (622) 1275Voted in 2014: No 51% (364) 49% (355) 719
Continued on next page
National Tracking Poll #2103129, March, 2021
9
Table P1
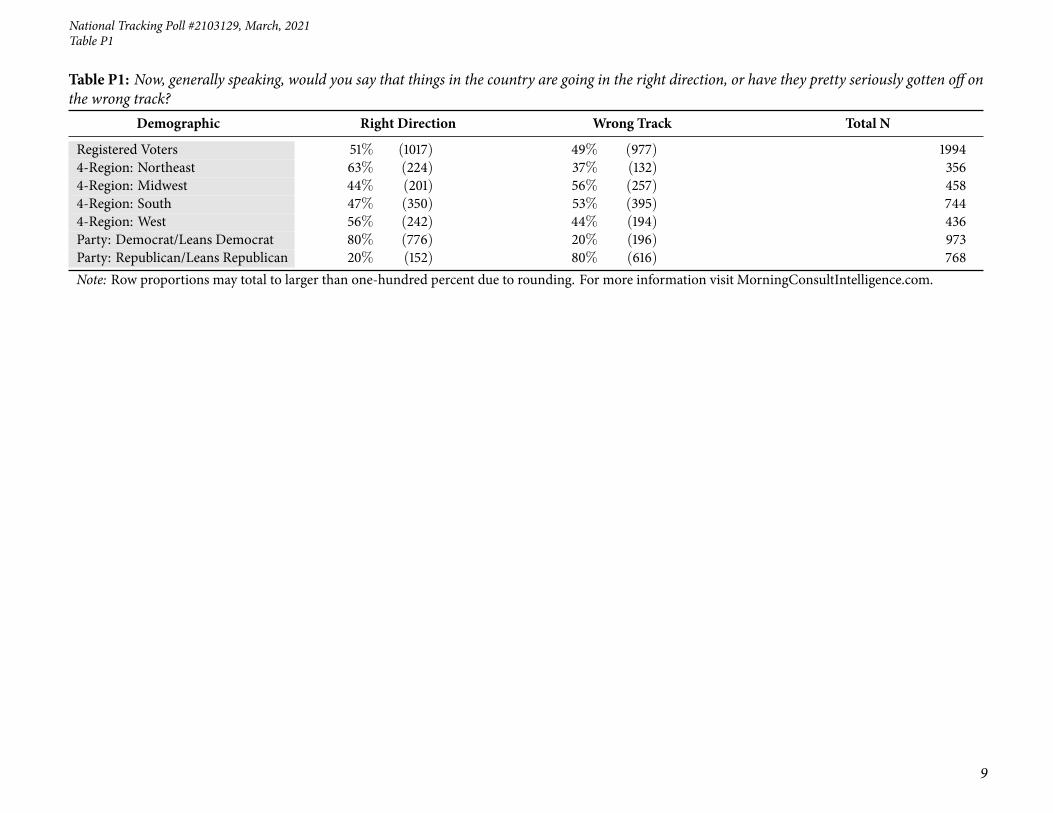
Table P1: Now, generally speaking, would you say that things in the country are going in the right direction, or have they pretty seriously gotten off onthe wrong track?
Demographic Right Direction Wrong Track Total N
Registered Voters 51% (1017) 49% (977) 19944-Region: Northeast 63% (224) 37% (132) 3564-Region: Midwest 44% (201) 56% (257) 4584-Region: South 47% (350) 53% (395) 7444-Region: West 56% (242) 44% (194) 436Party: Democrat/Leans Democrat 80% (776) 20% (196) 973Party: Republican/Leans Republican 20% (152) 80% (616) 768Note: Row proportions may total to larger than one-hundred percent due to rounding. For more information visit MorningConsultIntelligence.com.

10
Morning ConsultTable nr2b
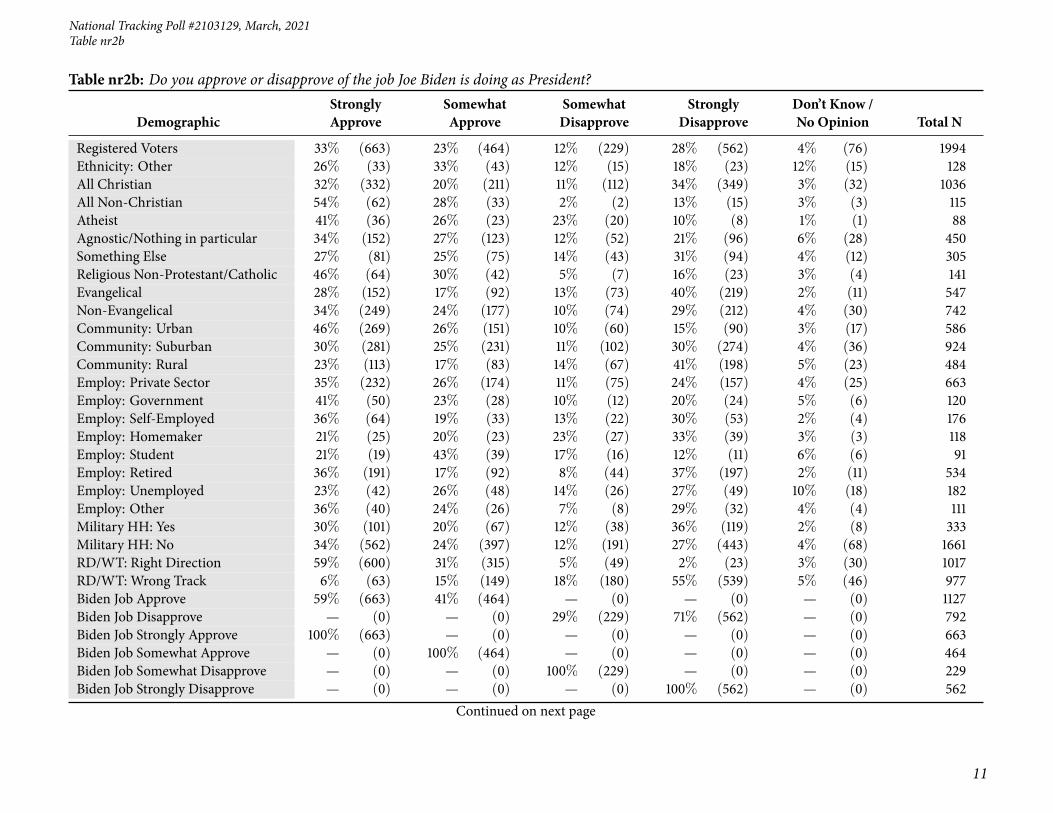
Table nr2b: Do you approve or disapprove of the job Joe Biden is doing as President?
DemographicStronglyApprove
SomewhatApprove
SomewhatDisapprove
StronglyDisapprove
Don’t Know /No Opinion Total N
Registered Voters 33% (663) 23% (464) 12% (229) 28% (562) 4% (76) 1994Gender: Male 34% (314) 23% (216) 10% (94) 31% (286) 3% (24) 933Gender: Female 33% (349) 23% (248) 13% (136) 26% (277) 5% (51) 1061Age: 18-34 30% (150) 33% (165) 15% (76) 16% (83) 5% (27) 501Age: 35-44 34% (102) 25% (77) 12% (36) 22% (65) 8% (23) 303Age: 45-64 34% (243) 21% (150) 11% (80) 32% (233) 3% (20) 726Age: 65+ 36% (167) 16% (73) 8% (37) 39% (181) 1% (5) 464GenZers: 1997-2012 25% (42) 34% (57) 25% (42) 10% (16) 6% (11) 168Millennials: 1981-1996 33% (180) 29% (159) 11% (63) 21% (114) 6% (34) 551GenXers: 1965-1980 33% (140) 25% (107) 10% (42) 28% (118) 4% (17) 424Baby Boomers: 1946-1964 36% (280) 17% (134) 10% (81) 35% (277) 2% (13) 784PID: Dem (no lean) 62% (507) 31% (250) 4% (31) 2% (18) 1% (10) 817PID: Ind (no lean) 19% (104) 26% (144) 16% (84) 29% (157) 10% (53) 542PID: Rep (no lean) 8% (52) 11% (70) 18% (114) 61% (387) 2% (12) 635PID/Gender: DemMen 63% (219) 32% (111) 3% (9) 3% (10) — (2) 350PID/Gender: DemWomen 62% (288) 30% (140) 5% (23) 2% (8) 2% (8) 467PID/Gender: Ind Men 21% (59) 27% (75) 10% (29) 35% (98) 6% (18) 280PID/Gender: Ind Women 17% (44) 26% (68) 21% (55) 22% (59) 14% (36) 262PID/Gender: Rep Men 12% (36) 10% (30) 18% (56) 58% (178) 2% (5) 304PID/Gender: Rep Women 5% (17) 12% (40) 17% (58) 63% (210) 2% (7) 332Ideo: Liberal (1-3) 59% (367) 30% (185) 5% (31) 5% (34) 1% (8) 625Ideo: Moderate (4) 36% (204) 30% (169) 14% (79) 15% (87) 6% (32) 571Ideo: Conservative (5-7) 10% (71) 11% (76) 14% (97) 62% (425) 2% (17) 685Educ: < College 28% (354) 22% (270) 14% (170) 32% (401) 5% (60) 1254Educ: Bachelors degree 39% (182) 28% (131) 9% (40) 23% (107) 2% (11) 472Educ: Post-grad 47% (126) 23% (63) 7% (19) 21% (55) 2% (5) 268Income: Under 50k 33% (328) 24% (233) 12% (118) 27% (266) 5% (45) 989Income: 50k-100k 30% (183) 23% (137) 10% (63) 33% (201) 3% (19) 602Income: 100k+ 38% (152) 23% (94) 12% (49) 24% (95) 3% (12) 402Ethnicity: White 31% (506) 22% (348) 11% (179) 33% (525) 3% (55) 1613Ethnicity: Hispanic 31% (60) 26% (50) 13% (26) 21% (42) 9% (17) 193Ethnicity: Black 49% (124) 29% (73) 14% (35) 6% (15) 2% (6) 253
Continued on next page
National Tracking Poll #2103129, March, 2021
11
Table nr2b
Table nr2b: Do you approve or disapprove of the job Joe Biden is doing as President?
DemographicStronglyApprove
SomewhatApprove
SomewhatDisapprove
StronglyDisapprove
Don’t Know /No Opinion Total N
Registered Voters 33% (663) 23% (464) 12% (229) 28% (562) 4% (76) 1994Ethnicity: Other 26% (33) 33% (43) 12% (15) 18% (23) 12% (15) 128All Christian 32% (332) 20% (211) 11% (112) 34% (349) 3% (32) 1036All Non-Christian 54% (62) 28% (33) 2% (2) 13% (15) 3% (3) 115Atheist 41% (36) 26% (23) 23% (20) 10% (8) 1% (1) 88Agnostic/Nothing in particular 34% (152) 27% (123) 12% (52) 21% (96) 6% (28) 450Something Else 27% (81) 25% (75) 14% (43) 31% (94) 4% (12) 305Religious Non-Protestant/Catholic 46% (64) 30% (42) 5% (7) 16% (23) 3% (4) 141Evangelical 28% (152) 17% (92) 13% (73) 40% (219) 2% (11) 547Non-Evangelical 34% (249) 24% (177) 10% (74) 29% (212) 4% (30) 742Community: Urban 46% (269) 26% (151) 10% (60) 15% (90) 3% (17) 586Community: Suburban 30% (281) 25% (231) 11% (102) 30% (274) 4% (36) 924Community: Rural 23% (113) 17% (83) 14% (67) 41% (198) 5% (23) 484Employ: Private Sector 35% (232) 26% (174) 11% (75) 24% (157) 4% (25) 663Employ: Government 41% (50) 23% (28) 10% (12) 20% (24) 5% (6) 120Employ: Self-Employed 36% (64) 19% (33) 13% (22) 30% (53) 2% (4) 176Employ: Homemaker 21% (25) 20% (23) 23% (27) 33% (39) 3% (3) 118Employ: Student 21% (19) 43% (39) 17% (16) 12% (11) 6% (6) 91Employ: Retired 36% (191) 17% (92) 8% (44) 37% (197) 2% (11) 534Employ: Unemployed 23% (42) 26% (48) 14% (26) 27% (49) 10% (18) 182Employ: Other 36% (40) 24% (26) 7% (8) 29% (32) 4% (4) 111Military HH: Yes 30% (101) 20% (67) 12% (38) 36% (119) 2% (8) 333Military HH: No 34% (562) 24% (397) 12% (191) 27% (443) 4% (68) 1661RD/WT: Right Direction 59% (600) 31% (315) 5% (49) 2% (23) 3% (30) 1017RD/WT: Wrong Track 6% (63) 15% (149) 18% (180) 55% (539) 5% (46) 977Biden Job Approve 59% (663) 41% (464) — (0) — (0) — (0) 1127Biden Job Disapprove — (0) — (0) 29% (229) 71% (562) — (0) 792Biden Job Strongly Approve 100% (663) — (0) — (0) — (0) — (0) 663Biden Job Somewhat Approve — (0) 100% (464) — (0) — (0) — (0) 464Biden Job Somewhat Disapprove — (0) — (0) 100% (229) — (0) — (0) 229Biden Job Strongly Disapprove — (0) — (0) — (0) 100% (562) — (0) 562
Continued on next page
12
Morning ConsultTable nr2b
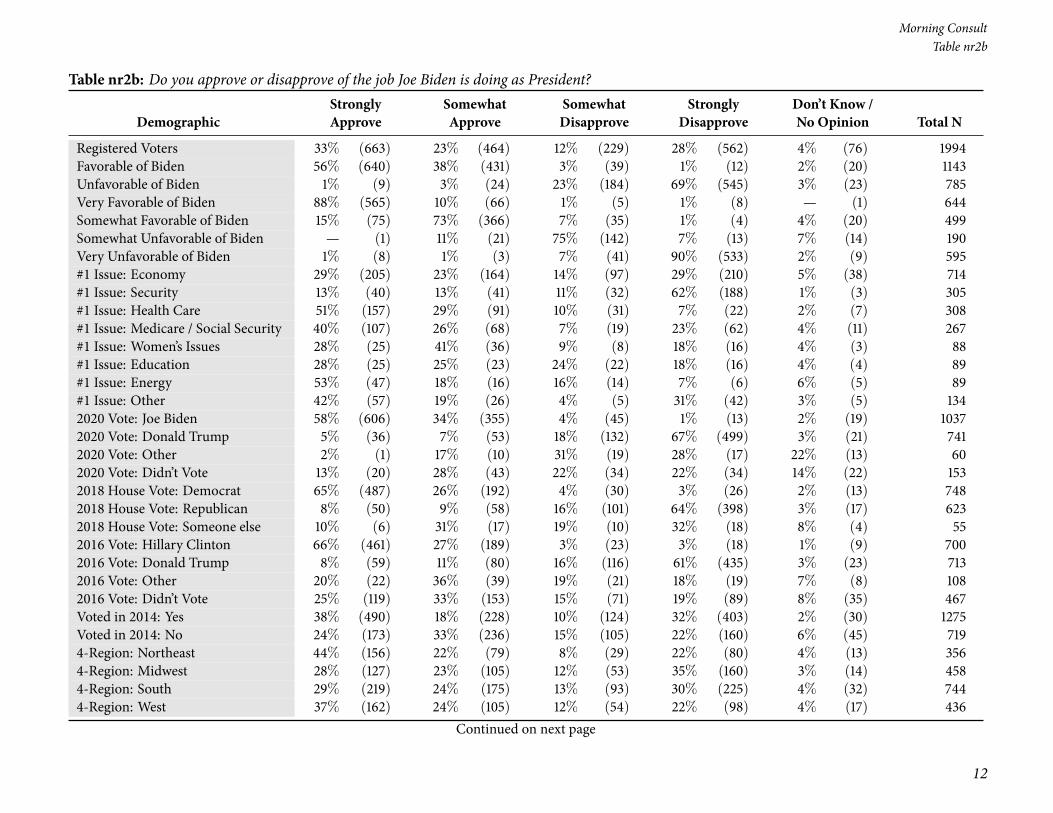
Table nr2b: Do you approve or disapprove of the job Joe Biden is doing as President?
DemographicStronglyApprove
SomewhatApprove
SomewhatDisapprove
StronglyDisapprove
Don’t Know /No Opinion Total N
Registered Voters 33% (663) 23% (464) 12% (229) 28% (562) 4% (76) 1994Favorable of Biden 56% (640) 38% (431) 3% (39) 1% (12) 2% (20) 1143Unfavorable of Biden 1% (9) 3% (24) 23% (184) 69% (545) 3% (23) 785Very Favorable of Biden 88% (565) 10% (66) 1% (5) 1% (8) — (1) 644Somewhat Favorable of Biden 15% (75) 73% (366) 7% (35) 1% (4) 4% (20) 499Somewhat Unfavorable of Biden — (1) 11% (21) 75% (142) 7% (13) 7% (14) 190Very Unfavorable of Biden 1% (8) 1% (3) 7% (41) 90% (533) 2% (9) 595#1 Issue: Economy 29% (205) 23% (164) 14% (97) 29% (210) 5% (38) 714#1 Issue: Security 13% (40) 13% (41) 11% (32) 62% (188) 1% (3) 305#1 Issue: Health Care 51% (157) 29% (91) 10% (31) 7% (22) 2% (7) 308#1 Issue: Medicare / Social Security 40% (107) 26% (68) 7% (19) 23% (62) 4% (11) 267#1 Issue: Women’s Issues 28% (25) 41% (36) 9% (8) 18% (16) 4% (3) 88#1 Issue: Education 28% (25) 25% (23) 24% (22) 18% (16) 4% (4) 89#1 Issue: Energy 53% (47) 18% (16) 16% (14) 7% (6) 6% (5) 89#1 Issue: Other 42% (57) 19% (26) 4% (5) 31% (42) 3% (5) 1342020 Vote: Joe Biden 58% (606) 34% (355) 4% (45) 1% (13) 2% (19) 10372020 Vote: Donald Trump 5% (36) 7% (53) 18% (132) 67% (499) 3% (21) 7412020 Vote: Other 2% (1) 17% (10) 31% (19) 28% (17) 22% (13) 602020 Vote: Didn’t Vote 13% (20) 28% (43) 22% (34) 22% (34) 14% (22) 1532018 House Vote: Democrat 65% (487) 26% (192) 4% (30) 3% (26) 2% (13) 7482018 House Vote: Republican 8% (50) 9% (58) 16% (101) 64% (398) 3% (17) 6232018 House Vote: Someone else 10% (6) 31% (17) 19% (10) 32% (18) 8% (4) 552016 Vote: Hillary Clinton 66% (461) 27% (189) 3% (23) 3% (18) 1% (9) 7002016 Vote: Donald Trump 8% (59) 11% (80) 16% (116) 61% (435) 3% (23) 7132016 Vote: Other 20% (22) 36% (39) 19% (21) 18% (19) 7% (8) 1082016 Vote: Didn’t Vote 25% (119) 33% (153) 15% (71) 19% (89) 8% (35) 467Voted in 2014: Yes 38% (490) 18% (228) 10% (124) 32% (403) 2% (30) 1275Voted in 2014: No 24% (173) 33% (236) 15% (105) 22% (160) 6% (45) 7194-Region: Northeast 44% (156) 22% (79) 8% (29) 22% (80) 4% (13) 3564-Region: Midwest 28% (127) 23% (105) 12% (53) 35% (160) 3% (14) 4584-Region: South 29% (219) 24% (175) 13% (93) 30% (225) 4% (32) 7444-Region: West 37% (162) 24% (105) 12% (54) 22% (98) 4% (17) 436
Continued on next page
National Tracking Poll #2103129, March, 2021
13
Table nr2b
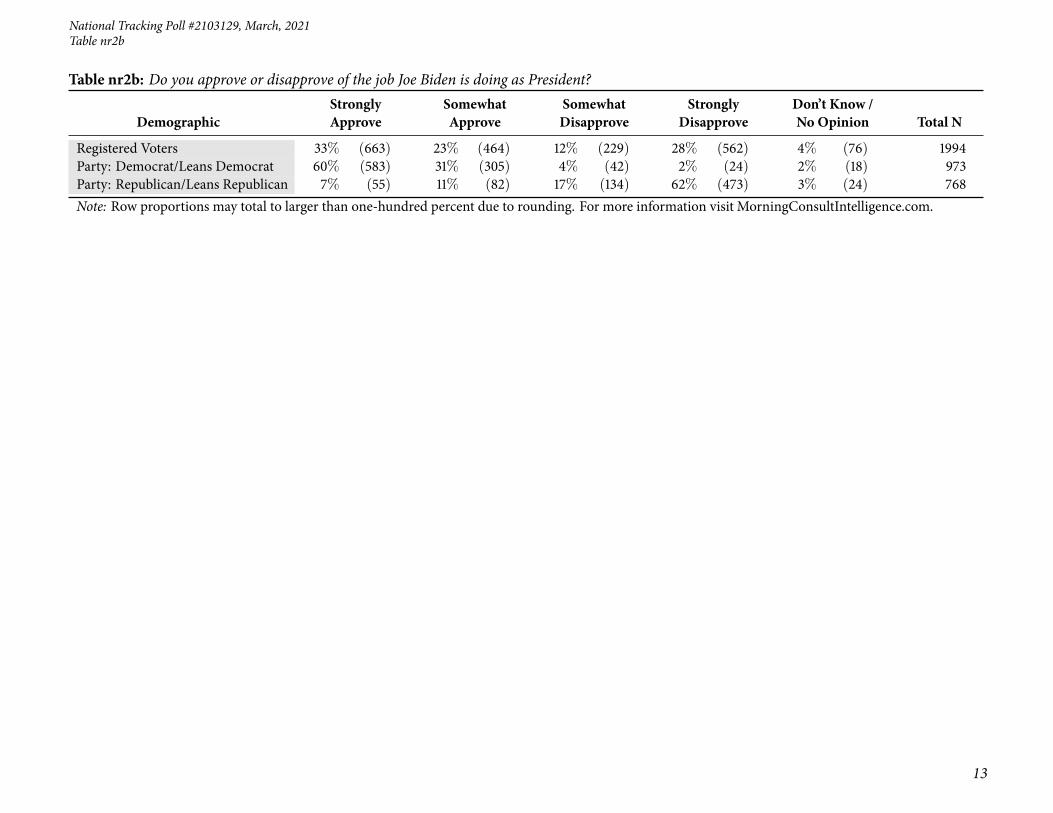
Table nr2b: Do you approve or disapprove of the job Joe Biden is doing as President?
DemographicStronglyApprove
SomewhatApprove
SomewhatDisapprove
StronglyDisapprove
Don’t Know /No Opinion Total N
Registered Voters 33% (663) 23% (464) 12% (229) 28% (562) 4% (76) 1994Party: Democrat/Leans Democrat 60% (583) 31% (305) 4% (42) 2% (24) 2% (18) 973Party: Republican/Leans Republican 7% (55) 11% (82) 17% (134) 62% (473) 3% (24) 768Note: Row proportions may total to larger than one-hundred percent due to rounding. For more information visit MorningConsultIntelligence.com.

14
Morning ConsultTable nr2bNET
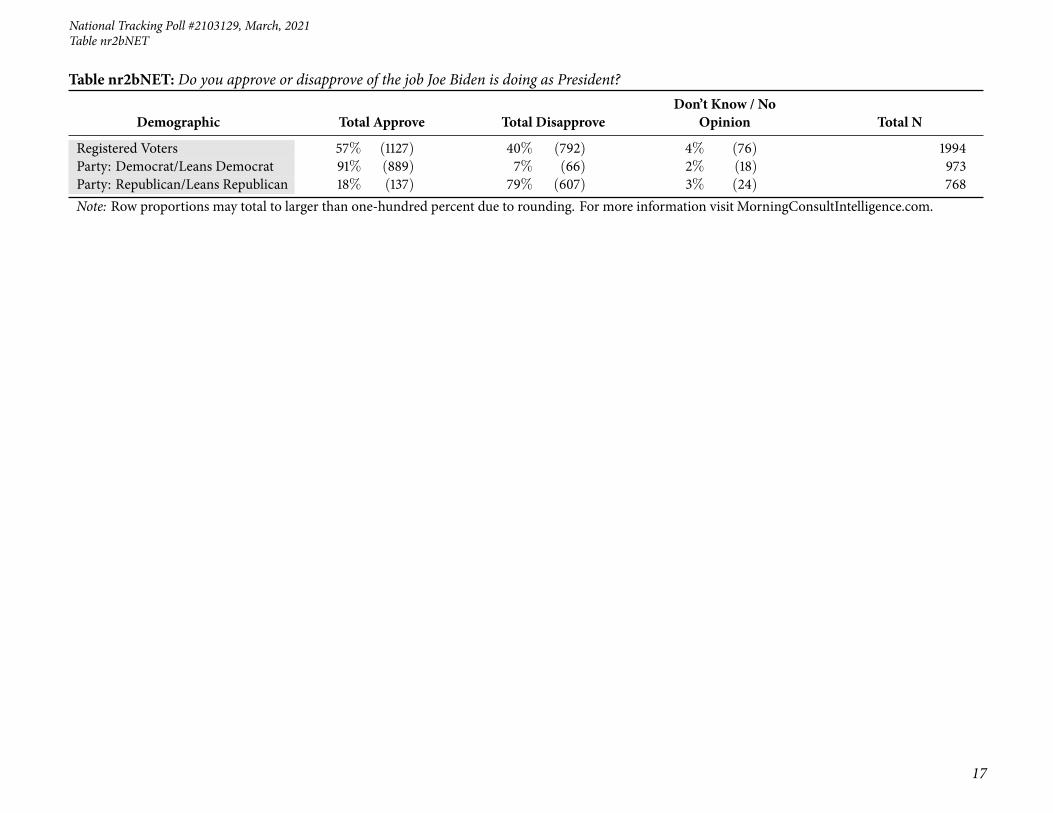
Table nr2bNET: Do you approve or disapprove of the job Joe Biden is doing as President?
Demographic Total Approve Total DisapproveDon’t Know / No
Opinion Total N
Registered Voters 57% (1127) 40% (792) 4% (76) 1994Gender: Male 57% (530) 41% (379) 3% (24) 933Gender: Female 56% (597) 39% (412) 5% (51) 1061Age: 18-34 63% (315) 32% (159) 5% (27) 501Age: 35-44 59% (179) 33% (101) 8% (23) 303Age: 45-64 54% (393) 43% (313) 3% (20) 726Age: 65+ 52% (240) 47% (219) 1% (5) 464GenZers: 1997-2012 59% (99) 35% (58) 6% (11) 168Millennials: 1981-1996 62% (340) 32% (177) 6% (34) 551GenXers: 1965-1980 58% (247) 38% (161) 4% (17) 424Baby Boomers: 1946-1964 53% (414) 46% (358) 2% (13) 784PID: Dem (no lean) 93% (757) 6% (49) 1% (10) 817PID: Ind (no lean) 46% (247) 45% (241) 10% (53) 542PID: Rep (no lean) 19% (122) 79% (501) 2% (12) 635PID/Gender: DemMen 94% (329) 5% (19) — (2) 350PID/Gender: DemWomen 92% (428) 7% (31) 2% (8) 467PID/Gender: Ind Men 48% (135) 46% (127) 6% (18) 280PID/Gender: Ind Women 43% (113) 43% (114) 14% (36) 262PID/Gender: Rep Men 22% (65) 77% (233) 2% (5) 304PID/Gender: Rep Women 17% (56) 81% (268) 2% (7) 332Ideo: Liberal (1-3) 88% (552) 10% (64) 1% (8) 625Ideo: Moderate (4) 65% (373) 29% (166) 6% (32) 571Ideo: Conservative (5-7) 21% (146) 76% (522) 2% (17) 685Educ: < College 50% (624) 45% (571) 5% (60) 1254Educ: Bachelors degree 67% (314) 31% (147) 2% (11) 472Educ: Post-grad 70% (189) 28% (74) 2% (5) 268Income: Under 50k 57% (561) 39% (383) 5% (45) 989Income: 50k-100k 53% (320) 44% (264) 3% (19) 602Income: 100k+ 61% (246) 36% (144) 3% (12) 402Ethnicity: White 53% (854) 44% (704) 3% (55) 1613Ethnicity: Hispanic 57% (109) 35% (67) 9% (17) 193Ethnicity: Black 78% (197) 20% (50) 2% (6) 253
Continued on next page

National Tracking Poll #2103129, March, 2021
15
Table nr2bNET
Table nr2bNET: Do you approve or disapprove of the job Joe Biden is doing as President?
Demographic Total Approve Total DisapproveDon’t Know / No
Opinion Total N
Registered Voters 57% (1127) 40% (792) 4% (76) 1994Ethnicity: Other 59% (76) 29% (38) 12% (15) 128All Christian 52% (543) 44% (461) 3% (32) 1036All Non-Christian 82% (94) 15% (18) 3% (3) 115Atheist 67% (59) 32% (28) 1% (1) 88Agnostic/Nothing in particular 61% (274) 33% (148) 6% (28) 450Something Else 51% (156) 45% (137) 4% (12) 305Religious Non-Protestant/Catholic 76% (106) 21% (30) 3% (4) 141Evangelical 45% (244) 53% (292) 2% (11) 547Non-Evangelical 57% (426) 39% (286) 4% (30) 742Community: Urban 72% (419) 26% (150) 3% (17) 586Community: Suburban 55% (512) 41% (376) 4% (36) 924Community: Rural 40% (195) 55% (266) 5% (23) 484Employ: Private Sector 61% (406) 35% (231) 4% (25) 663Employ: Government 65% (78) 30% (37) 5% (6) 120Employ: Self-Employed 55% (97) 43% (75) 2% (4) 176Employ: Homemaker 41% (49) 56% (66) 3% (3) 118Employ: Student 64% (58) 30% (27) 6% (6) 91Employ: Retired 53% (283) 45% (241) 2% (11) 534Employ: Unemployed 49% (89) 41% (75) 10% (18) 182Employ: Other 60% (67) 36% (40) 4% (4) 111Military HH: Yes 50% (168) 47% (158) 2% (8) 333Military HH: No 58% (959) 38% (634) 4% (68) 1661RD/WT: Right Direction 90% (915) 7% (72) 3% (30) 1017RD/WT: Wrong Track 22% (212) 74% (720) 5% (46) 977Biden Job Approve 100% (1127) — (0) — (0) 1127Biden Job Disapprove — (0) 100% (792) — (0) 792Biden Job Strongly Approve 100% (663) — (0) — (0) 663Biden Job Somewhat Approve 100% (464) — (0) — (0) 464Biden Job Somewhat Disapprove — (0) 100% (229) — (0) 229Biden Job Strongly Disapprove — (0) 100% (562) — (0) 562
Continued on next page

16
Morning ConsultTable nr2bNET
Table nr2bNET: Do you approve or disapprove of the job Joe Biden is doing as President?
Demographic Total Approve Total DisapproveDon’t Know / No
Opinion Total N
Registered Voters 57% (1127) 40% (792) 4% (76) 1994Favorable of Biden 94% (1071) 4% (51) 2% (20) 1143Unfavorable of Biden 4% (33) 93% (729) 3% (23) 785Very Favorable of Biden 98% (631) 2% (13) — (1) 644Somewhat Favorable of Biden 88% (440) 8% (39) 4% (20) 499Somewhat Unfavorable of Biden 11% (21) 82% (155) 7% (14) 190Very Unfavorable of Biden 2% (11) 97% (574) 2% (9) 595#1 Issue: Economy 52% (369) 43% (307) 5% (38) 714#1 Issue: Security 27% (81) 72% (221) 1% (3) 305#1 Issue: Health Care 80% (247) 17% (53) 2% (7) 308#1 Issue: Medicare / Social Security 65% (175) 30% (81) 4% (11) 267#1 Issue: Women’s Issues 69% (61) 27% (24) 4% (3) 88#1 Issue: Education 53% (47) 42% (38) 4% (4) 89#1 Issue: Energy 72% (64) 23% (20) 6% (5) 89#1 Issue: Other 61% (82) 35% (47) 3% (5) 1342020 Vote: Joe Biden 93% (960) 6% (57) 2% (19) 10372020 Vote: Donald Trump 12% (89) 85% (631) 3% (21) 7412020 Vote: Other 19% (11) 59% (36) 22% (13) 602020 Vote: Didn’t Vote 42% (63) 44% (67) 14% (22) 1532018 House Vote: Democrat 91% (679) 7% (56) 2% (13) 7482018 House Vote: Republican 17% (107) 80% (499) 3% (17) 6232018 House Vote: Someone else 41% (22) 51% (28) 8% (4) 552016 Vote: Hillary Clinton 93% (650) 6% (41) 1% (9) 7002016 Vote: Donald Trump 19% (139) 77% (551) 3% (23) 7132016 Vote: Other 56% (61) 37% (40) 7% (8) 1082016 Vote: Didn’t Vote 58% (272) 34% (160) 8% (35) 467Voted in 2014: Yes 56% (718) 41% (527) 2% (30) 1275Voted in 2014: No 57% (409) 37% (265) 6% (45) 7194-Region: Northeast 66% (234) 31% (109) 4% (13) 3564-Region: Midwest 51% (232) 46% (212) 3% (14) 4584-Region: South 53% (394) 43% (319) 4% (32) 7444-Region: West 61% (267) 35% (152) 4% (17) 436
Continued on next page
National Tracking Poll #2103129, March, 2021
17
Table nr2bNET
Table nr2bNET: Do you approve or disapprove of the job Joe Biden is doing as President?
Demographic Total Approve Total DisapproveDon’t Know / No
Opinion Total N
Registered Voters 57% (1127) 40% (792) 4% (76) 1994Party: Democrat/Leans Democrat 91% (889) 7% (66) 2% (18) 973Party: Republican/Leans Republican 18% (137) 79% (607) 3% (24) 768Note: Row proportions may total to larger than one-hundred percent due to rounding. For more information visit MorningConsultIntelligence.com.
18
Morning ConsultTable P3
Table P3: Now, thinking about your vote, what would you say is the top set of issues on your mind when you cast your vote for federal offices such asU.S. Senate or Congress?
Demographic
EconomicIssues –like taxes,wages,jobs,
unemploy-ment, andspending
SecurityIssues –like
terrorism,foreign
policy, andbordersecurity
HealthCare Issues– like the2010 healthcare law,Medicaid,other
challenges
SeniorsIssues –like
Medicareand SocialSecurity
Women’sIssues –like birthcontrol,abortion,and equal
pay
EducationIssues – like
schoolstandards,class sizes,
school choice,and student
loans
Energy Issues– like carbonemissions,cost ofelectric-
ity/gasoline,or renewables Other: Total N
Registered Voters 36%(714) 15%(305) 15%(308) 13%(267) 4% (88) 4% (89) 4% (89) 7%(134) 1994Gender: Male 35%(326) 18%(165) 15%(137) 13%(123) 3% (28) 4% (36) 5% (45) 8% (73) 933Gender: Female 37%(388) 13%(140) 16% (171) 14%(144) 6% (60) 5% (54) 4% (44) 6% (61) 1061Age: 18-34 35%(174) 11% (54) 19% (95) 2% (9) 10% (50) 12% (61) 9% (46) 2% (12) 501Age: 35-44 56%(169) 11% (33) 16% (49) 2% (6) 3% (9) 5% (15) 4% (11) 4% (12) 303Age: 45-64 36%(265) 16%(120) 16% (114) 15%(107) 3% (21) 1% (10) 3% (24) 9% (66) 726Age: 65+ 23%(106) 21% (98) 11% (50) 31%(146) 2% (8) 1% (4) 2% (9) 9% (44) 464GenZers: 1997-2012 32% (54) 5% (8) 19% (32) — (0) 12% (20) 20% (34) 10% (16) 3% (5) 168Millennials: 1981-1996 45%(246) 13% (70) 18% (97) 2% (12) 7% (36) 7% (39) 7% (38) 2% (12) 551GenXers: 1965-1980 41%(175) 16% (69) 17% (73) 6% (27) 4% (15) 2% (10) 3% (14) 9% (40) 424Baby Boomers: 1946-1964 28%(219) 18%(139) 13%(103) 27%(210) 2% (17) 1% (5) 3% (20) 9% (71) 784PID: Dem (no lean) 34%(278) 5% (44) 22%(178) 15% (119) 5% (45) 6% (47) 6% (46) 7% (61) 817PID: Ind (no lean) 35%(192) 17% (90) 14% (77) 13% (73) 4% (21) 5% (25) 4% (21) 8% (43) 542PID: Rep (no lean) 38%(244) 27% (171) 8% (52) 12% (76) 4% (23) 3% (17) 3% (21) 5% (31) 635PID/Gender: DemMen 37%(128) 8% (27) 20% (69) 14% (48) 2% (7) 6% (20) 7% (23) 8% (26) 350PID/Gender: DemWomen 32%(150) 4% (17) 23%(109) 15% (70) 8% (37) 6% (27) 5% (23) 7% (34) 467PID/Gender: Ind Men 35% (97) 18% (51) 15% (41) 17% (46) 1% (4) 3% (8) 3% (9) 9% (25) 280PID/Gender: Ind Women 36% (95) 15% (39) 14% (37) 10% (26) 7% (17) 7% (17) 5% (13) 7% (18) 262PID/Gender: Rep Men 33% (101) 28% (86) 9% (27) 10% (29) 6% (17) 3% (8) 4% (13) 7% (22) 304PID/Gender: Rep Women 43%(143) 25% (84) 8% (25) 14% (47) 2% (6) 3% (10) 2% (8) 3% (9) 332Ideo: Liberal (1-3) 30%(187) 4% (27) 25%(154) 14% (85) 7% (41) 7% (44) 8% (47) 7% (42) 625Ideo: Moderate (4) 40%(231) 12% (66) 16% (92) 16% (90) 2% (13) 3% (16) 3% (20) 8% (44) 571Ideo: Conservative (5-7) 37%(253) 30%(203) 6% (42) 13% (90) 3% (21) 3% (18) 2% (14) 7% (45) 685
Continued on next page

National Tracking Poll #2103129, March, 2021
19
Table P3
Table P3: Now, thinking about your vote, what would you say is the top set of issues on your mind when you cast your vote for federal offices such asU.S. Senate or Congress?
Demographic
EconomicIssues –like taxes,wages,jobs,
unemploy-ment, andspending
SecurityIssues –like
terrorism,foreign
policy, andbordersecurity
HealthCare Issues– like the2010 healthcare law,Medicaid,other
challenges
SeniorsIssues –like
Medicareand SocialSecurity
Women’sIssues –like birthcontrol,abortion,and equal
pay
EducationIssues – like
schoolstandards,class sizes,
school choice,and student
loans
Energy Issues– like carbonemissions,cost ofelectric-
ity/gasoline,or renewables Other: Total N
Registered Voters 36%(714) 15%(305) 15%(308) 13%(267) 4% (88) 4% (89) 4% (89) 7%(134) 1994Educ: < College 35%(444) 16%(197) 13%(166) 16%(198) 4% (54) 4% (50) 4% (56) 7% (91) 1254Educ: Bachelors degree 37%(175) 13% (62) 20% (95) 10% (45) 5% (23) 5% (24) 4% (21) 6% (26) 472Educ: Post-grad 35% (95) 17% (46) 17% (47) 9% (24) 4% (12) 6% (16) 5% (12) 6% (17) 268Income: Under 50k 31%(309) 14%(140) 15%(145) 18% (181) 5% (54) 5% (46) 5% (47) 7% (67) 989Income: 50k-100k 39%(236) 15% (91) 16% (99) 9% (56) 3% (20) 4% (26) 4% (27) 8% (46) 602Income: 100k+ 42%(168) 18% (73) 16% (64) 7% (30) 3% (14) 4% (17) 4% (15) 5% (21) 402Ethnicity: White 34%(553) 18%(285) 15%(236) 14%(229) 4% (69) 4% (59) 5% (80) 6%(102) 1613Ethnicity: Hispanic 41% (78) 7% (14) 18% (36) 9% (17) 10% (19) 7% (14) 5% (9) 3% (6) 193Ethnicity: Black 41%(104) 4% (11) 19% (47) 10% (26) 3% (9) 10% (25) 3% (8) 9% (24) 253Ethnicity: Other 44% (57) 7% (9) 19% (25) 10% (12) 9% (11) 4% (5) 1% (1) 6% (8) 128All Christian 37%(379) 19%(198) 13%(135) 15%(159) 3% (34) 3% (33) 3% (34) 6% (64) 1036All Non-Christian 33% (38) 9% (10) 23% (27) 10% (12) 4% (4) 6% (7) 6% (7) 8% (10) 115Atheist 39% (34) 2% (2) 25% (22) 5% (5) 7% (6) 9% (8) 7% (6) 5% (5) 88Agnostic/Nothing in particular 31%(142) 11% (51) 19% (87) 11% (48) 7% (30) 7% (32) 6% (27) 8% (35) 450Something Else 40% (121) 14% (43) 12% (37) 14% (43) 5% (15) 3% (9) 5% (14) 7% (21) 305Religious Non-Protestant/Catholic 35% (49) 11% (16) 21% (29) 9% (13) 4% (5) 6% (8) 5% (7) 9% (13) 141Evangelical 39%(215) 20% (112) 11% (60) 14% (76) 5% (26) 3% (15) 3% (15) 5% (29) 547Non-Evangelical 36%(266) 16% (117) 14%(108) 17%(124) 3% (22) 3% (25) 4% (28) 7% (53) 742Community: Urban 35%(206) 14% (81) 18%(104) 13% (77) 4% (24) 5% (27) 6% (33) 6% (35) 586Community: Suburban 38%(348) 15%(142) 16%(146) 11%(105) 4% (42) 5% (50) 4% (39) 6% (51) 924Community: Rural 33%(159) 17% (82) 12% (58) 18% (85) 5% (23) 2% (12) 3% (16) 10% (49) 484
Continued on next page

20
Morning ConsultTable P3
Table P3: Now, thinking about your vote, what would you say is the top set of issues on your mind when you cast your vote for federal offices such asU.S. Senate or Congress?
Demographic
EconomicIssues –like taxes,wages,jobs,
unemploy-ment, andspending
SecurityIssues –like
terrorism,foreign
policy, andbordersecurity
HealthCare Issues– like the2010 healthcare law,Medicaid,other
challenges
SeniorsIssues –like
Medicareand SocialSecurity
Women’sIssues –like birthcontrol,abortion,and equal
pay
EducationIssues – like
schoolstandards,class sizes,
school choice,and student
loans
Energy Issues– like carbonemissions,cost ofelectric-
ity/gasoline,or renewables Other: Total N
Registered Voters 36%(714) 15%(305) 15%(308) 13%(267) 4% (88) 4% (89) 4% (89) 7%(134) 1994Employ: Private Sector 46%(307) 12% (78) 16%(109) 7% (46) 6% (38) 5% (32) 4% (30) 3% (22) 663Employ: Government 44% (53) 12% (15) 15% (18) 2% (3) 1% (2) 10% (12) 11% (14) 3% (4) 120Employ: Self-Employed 39% (68) 19% (34) 15% (27) 5% (9) 7% (13) 3% (6) 4% (8) 7% (11) 176Employ: Homemaker 23% (27) 25% (30) 25% (30) 10% (11) 5% (6) 4% (5) 4% (5) 3% (3) 118Employ: Student 26% (23) 4% (4) 15% (14) — (0) 17% (15) 21% (19) 15% (14) 2% (2) 91Employ: Retired 23%(122) 20%(106) 12% (67) 31%(167) 1% (8) 1% (3) 1% (7) 10% (54) 534Employ: Unemployed 42% (77) 13% (23) 15% (27) 9% (16) 1% (2) 3% (5) 6% (11) 11% (20) 182Employ: Other 32% (35) 15% (16) 14% (16) 13% (14) 4% (4) 7% (8) — (0) 16% (18) 111Military HH: Yes 26% (86) 26% (87) 14% (48) 13% (42) 5% (16) 5% (16) 2% (6) 10% (33) 333Military HH: No 38%(627) 13%(218) 16%(260) 14%(225) 4% (72) 4% (73) 5% (83) 6%(102) 1661RD/WT: Right Direction 33%(331) 8% (78) 21%(219) 15%(154) 5% (50) 5% (51) 6% (60) 7% (74) 1017RD/WT: Wrong Track 39%(382) 23%(227) 9% (89) 12% (113) 4% (39) 4% (38) 3% (30) 6% (60) 977Biden Job Approve 33%(369) 7% (81) 22%(247) 16%(175) 5% (61) 4% (47) 6% (64) 7% (82) 1127Biden Job Disapprove 39%(307) 28%(221) 7% (53) 10% (81) 3% (24) 5% (38) 3% (20) 6% (47) 792Biden Job Strongly Approve 31%(205) 6% (40) 24%(157) 16%(107) 4% (25) 4% (25) 7% (47) 9% (57) 663Biden Job Somewhat Approve 35%(164) 9% (41) 20% (91) 15% (68) 8% (36) 5% (23) 4% (16) 6% (26) 464Biden Job Somewhat Disapprove 42% (97) 14% (32) 14% (31) 8% (19) 4% (8) 9% (22) 6% (14) 2% (5) 229Biden Job Strongly Disapprove 37%(210) 33%(188) 4% (22) 11% (62) 3% (16) 3% (16) 1% (6) 7% (42) 562Favorable of Biden 33%(379) 7% (82) 21%(241) 15%(173) 5% (57) 6% (64) 6% (64) 7% (82) 1143Unfavorable of Biden 40%(315) 28%(216) 7% (57) 11% (87) 3% (25) 3% (22) 2% (14) 6% (49) 785Very Favorable of Biden 34%(222) 6% (41) 22%(139) 17% (111) 3% (19) 3% (18) 6% (41) 8% (54) 644Somewhat Favorable of Biden 32%(158) 8% (42) 21%(102) 12% (62) 7% (37) 9% (45) 5% (24) 6% (28) 499Somewhat Unfavorable of Biden 49% (94) 12% (23) 11% (21) 10% (19) 4% (8) 6% (11) 4% (8) 3% (6) 190Very Unfavorable of Biden 37%(221) 32%(193) 6% (36) 12% (69) 3% (17) 2% (11) 1% (6) 7% (43) 595
Continued on next page
National Tracking Poll #2103129, March, 2021
21
Table P3
Table P3: Now, thinking about your vote, what would you say is the top set of issues on your mind when you cast your vote for federal offices such asU.S. Senate or Congress?
Demographic
EconomicIssues –like taxes,wages,jobs,
unemploy-ment, andspending
SecurityIssues –like
terrorism,foreign
policy, andbordersecurity
HealthCare Issues– like the2010 healthcare law,Medicaid,other
challenges
SeniorsIssues –like
Medicareand SocialSecurity
Women’sIssues –like birthcontrol,abortion,and equal
pay
EducationIssues – like
schoolstandards,class sizes,
school choice,and student
loans
Energy Issues– like carbonemissions,cost ofelectric-
ity/gasoline,or renewables Other: Total N
Registered Voters 36%(714) 15%(305) 15%(308) 13%(267) 4% (88) 4% (89) 4% (89) 7%(134) 1994#1 Issue: Economy 100%(714) — (0) — (0) — (0) — (0) — (0) — (0) — (0) 714#1 Issue: Security — (0) 100%(305) — (0) — (0) — (0) — (0) — (0) — (0) 305#1 Issue: Health Care — (0) — (0) 100%(308) — (0) — (0) — (0) — (0) — (0) 308#1 Issue: Medicare / Social Security — (0) — (0) — (0) 100%(267) — (0) — (0) — (0) — (0) 267#1 Issue: Women’s Issues — (0) — (0) — (0) — (0) 100% (88) — (0) — (0) — (0) 88#1 Issue: Education — (0) — (0) — (0) — (0) — (0) 100% (89) — (0) — (0) 89#1 Issue: Energy — (0) — (0) — (0) — (0) — (0) — (0) 100% (89) — (0) 89#1 Issue: Other — (0) — (0) — (0) — (0) — (0) — (0) — (0) 100%(134) 1342020 Vote: Joe Biden 32%(333) 7% (73) 23%(238) 15%(153) 5% (57) 5% (52) 6% (58) 7% (74) 10372020 Vote: Donald Trump 39%(290) 29%(212) 6% (43) 13% (97) 3% (21) 2% (18) 2% (15) 6% (44) 7412020 Vote: Other 50% (30) 7% (4) 23% (14) 1% (1) 9% (6) 2% (1) 1% (1) 6% (4) 602020 Vote: Didn’t Vote 38% (58) 10% (16) 9% (13) 10% (16) 3% (5) 11% (17) 10% (15) 8% (12) 1532018 House Vote: Democrat 31%(235) 6% (46) 23% (171) 16%(120) 5% (34) 4% (33) 6% (45) 8% (63) 7482018 House Vote: Republican 40%(248) 26%(164) 7% (44) 13% (80) 3% (18) 3% (17) 1% (9) 7% (41) 6232018 House Vote: Someone else 34% (18) 20% (11) 18% (10) 3% (2) 12% (7) 3% (2) — (0) 9% (5) 552016 Vote: Hillary Clinton 32%(222) 7% (47) 24%(168) 14%(100) 4% (28) 5% (32) 5% (36) 9% (66) 7002016 Vote: Donald Trump 39%(278) 27%(194) 7% (48) 13% (94) 2% (18) 3% (21) 2% (15) 6% (44) 7132016 Vote: Other 35% (38) 13% (14) 18% (20) 13% (14) 6% (6) 3% (3) 6% (7) 6% (7) 1082016 Vote: Didn’t Vote 37%(172) 10% (48) 15% (71) 12% (57) 8% (36) 7% (34) 7% (31) 4% (17) 467Voted in 2014: Yes 35%(449) 16%(209) 16%(198) 14%(177) 3% (45) 3% (41) 4% (51) 8%(106) 1275Voted in 2014: No 37%(265) 13% (96) 15%(109) 13% (90) 6% (44) 7% (48) 5% (38) 4% (28) 719
Continued on next page
22
Morning ConsultTable P3
Table P3: Now, thinking about your vote, what would you say is the top set of issues on your mind when you cast your vote for federal offices such asU.S. Senate or Congress?
Demographic
EconomicIssues –like taxes,wages,jobs,
unemploy-ment, andspending
SecurityIssues –like
terrorism,foreign
policy, andbordersecurity
HealthCare Issues– like the2010 healthcare law,Medicaid,other
challenges
SeniorsIssues –like
Medicareand SocialSecurity
Women’sIssues –like birthcontrol,abortion,and equal
pay
EducationIssues – like
schoolstandards,class sizes,
school choice,and student
loans
Energy Issues– like carbonemissions,cost ofelectric-
ity/gasoline,or renewables Other: Total N
Registered Voters 36%(714) 15%(305) 15%(308) 13%(267) 4% (88) 4% (89) 4% (89) 7%(134) 19944-Region: Northeast 37% (131) 14% (51) 16% (58) 15% (54) 3% (9) 4% (14) 6% (20) 6% (20) 3564-Region: Midwest 33% (151) 16% (74) 13% (60) 14% (64) 7% (32) 6% (27) 3% (14) 8% (36) 4584-Region: South 38%(280) 18% (131) 15% (110) 13% (95) 3% (26) 3% (25) 4% (32) 6% (46) 7444-Region: West 35%(153) 11% (49) 18% (80) 12% (54) 5% (22) 6% (24) 5% (23) 7% (31) 436Party: Democrat/Leans Democrat 33%(325) 6% (55) 22%(213) 15%(146) 5% (52) 6% (54) 6% (57) 7% (69) 973Party: Republican/Leans Republican 38%(291) 27%(210) 8% (58) 13% (96) 3% (26) 3% (25) 3% (22) 5% (41) 768Note: Row proportions may total to larger than one-hundred percent due to rounding. For more information visit MorningConsultIntelligence.com.
National Tracking Poll #2103129, March, 2021
23
Table POL1_1
Table POL1_1: Who do you trust more to handle each of the following issues?The economy
Demographic Democrats in CongressRepublicans in
CongressDon’t know / No
opinion Total N
Registered Voters 44% (885) 39% (775) 17% (334) 1994Gender: Male 44% (410) 43% (403) 13% (120) 933Gender: Female 45% (475) 35% (372) 20% (213) 1061Age: 18-34 51% (256) 25% (127) 24% (118) 501Age: 35-44 41% (125) 38% (114) 21% (64) 303Age: 45-64 42% (303) 44% (322) 14% (101) 726Age: 65+ 43% (201) 46% (213) 11% (50) 464GenZers: 1997-2012 58% (98) 17% (28) 25% (42) 168Millennials: 1981-1996 44% (241) 34% (187) 22% (123) 551GenXers: 1965-1980 43% (184) 39% (165) 18% (76) 424Baby Boomers: 1946-1964 44% (342) 45% (357) 11% (86) 784PID: Dem (no lean) 83% (681) 7% (53) 10% (83) 817PID: Ind (no lean) 30% (162) 40% (217) 30% (163) 542PID: Rep (no lean) 7% (43) 79% (504) 14% (88) 635PID/Gender: DemMen 85% (296) 7% (26) 8% (28) 350PID/Gender: DemWomen 82% (385) 6% (27) 12% (55) 467PID/Gender: Ind Men 31% (87) 47% (131) 22% (61) 280PID/Gender: Ind Women 28% (74) 33% (86) 39% (102) 262PID/Gender: Rep Men 9% (27) 81% (246) 10% (32) 304PID/Gender: Rep Women 5% (16) 78% (259) 17% (56) 332Ideo: Liberal (1-3) 79% (495) 11% (70) 10% (60) 625Ideo: Moderate (4) 48% (273) 30% (174) 22% (124) 571Ideo: Conservative (5-7) 12% (80) 75% (512) 14% (93) 685Educ: < College 40% (507) 41% (515) 19% (232) 1254Educ: Bachelors degree 50% (234) 36% (169) 15% (69) 472Educ: Post-grad 54% (145) 34% (90) 12% (33) 268Income: Under 50k 45% (444) 35% (347) 20% (198) 989Income: 50k-100k 43% (260) 42% (254) 15% (88) 602Income: 100k+ 45% (181) 43% (174) 12% (47) 402Ethnicity: White 39% (632) 44% (717) 16% (263) 1613Ethnicity: Hispanic 52% (100) 28% (55) 20% (39) 193
Continued on next page

24
Morning ConsultTable POL1_1
Table POL1_1: Who do you trust more to handle each of the following issues?The economy
Demographic Democrats in CongressRepublicans in
CongressDon’t know / No
opinion Total N
Registered Voters 44% (885) 39% (775) 17% (334) 1994Ethnicity: Black 77% (194) 9% (24) 14% (35) 253Ethnicity: Other 46% (60) 26% (34) 27% (35) 128All Christian 40% (414) 46% (479) 14% (143) 1036All Non-Christian 60% (69) 21% (24) 19% (22) 115Atheist 73% (64) 18% (16) 9% (8) 88Agnostic/Nothing in particular 48% (217) 29% (131) 23% (102) 450Something Else 40% (121) 41% (126) 19% (58) 305Religious Non-Protestant/Catholic 54% (76) 27% (39) 19% (26) 141Evangelical 32% (178) 52% (285) 15% (85) 547Non-Evangelical 45% (335) 40% (295) 15% (111) 742Community: Urban 59% (347) 27% (157) 14% (83) 586Community: Suburban 44% (402) 39% (363) 17% (159) 924Community: Rural 28% (136) 53% (256) 19% (92) 484Employ: Private Sector 47% (313) 37% (242) 16% (108) 663Employ: Government 48% (57) 33% (40) 19% (23) 120Employ: Self-Employed 42% (74) 43% (75) 15% (26) 176Employ: Homemaker 34% (40) 50% (59) 16% (19) 118Employ: Student 53% (48) 22% (20) 25% (22) 91Employ: Retired 43% (230) 46% (244) 11% (61) 534Employ: Unemployed 36% (66) 33% (60) 31% (56) 182Employ: Other 51% (57) 31% (34) 17% (19) 111Military HH: Yes 38% (126) 47% (157) 15% (50) 333Military HH: No 46% (759) 37% (618) 17% (284) 1661RD/WT: Right Direction 71% (722) 13% (130) 16% (165) 1017RD/WT: Wrong Track 17% (163) 66% (645) 17% (169) 977Biden Job Approve 74% (829) 12% (136) 14% (161) 1127Biden Job Disapprove 6% (50) 79% (623) 15% (119) 792
Continued on next page

National Tracking Poll #2103129, March, 2021
25
Table POL1_1
Table POL1_1: Who do you trust more to handle each of the following issues?The economy
Demographic Democrats in CongressRepublicans in
CongressDon’t know / No
opinion Total N
Registered Voters 44% (885) 39% (775) 17% (334) 1994Biden Job Strongly Approve 85% (565) 7% (43) 8% (54) 663Biden Job Somewhat Approve 57% (264) 20% (93) 23% (107) 464Biden Job Somewhat Disapprove 14% (33) 59% (136) 26% (60) 229Biden Job Strongly Disapprove 3% (17) 87% (487) 10% (59) 562Favorable of Biden 74% (849) 12% (132) 14% (162) 1143Unfavorable of Biden 4% (29) 81% (635) 15% (121) 785Very Favorable of Biden 88% (568) 6% (37) 6% (39) 644Somewhat Favorable of Biden 56% (281) 19% (95) 25% (123) 499Somewhat Unfavorable of Biden 12% (23) 65% (124) 23% (43) 190Very Unfavorable of Biden 1% (6) 86% (511) 13% (77) 595#1 Issue: Economy 41% (295) 42% (301) 16% (118) 714#1 Issue: Security 16% (49) 70% (213) 14% (43) 305#1 Issue: Health Care 64% (197) 16% (51) 20% (60) 308#1 Issue: Medicare / Social Security 51% (136) 37% (98) 12% (33) 267#1 Issue: Women’s Issues 38% (33) 35% (31) 27% (24) 88#1 Issue: Education 57% (51) 24% (22) 18% (16) 89#1 Issue: Energy 64% (57) 16% (14) 20% (18) 89#1 Issue: Other 50% (68) 33% (45) 16% (22) 1342020 Vote: Joe Biden 77% (800) 9% (92) 14% (144) 10372020 Vote: Donald Trump 3% (22) 82% (610) 15% (109) 7412020 Vote: Other 5% (3) 44% (27) 51% (31) 602020 Vote: Didn’t Vote 38% (58) 29% (45) 32% (50) 1532018 House Vote: Democrat 80% (596) 9% (70) 11% (83) 7482018 House Vote: Republican 6% (38) 82% (510) 12% (74) 6232018 House Vote: Someone else 15% (8) 34% (18) 51% (28) 552016 Vote: Hillary Clinton 83% (578) 7% (50) 10% (72) 7002016 Vote: Donald Trump 7% (50) 79% (564) 14% (100) 7132016 Vote: Other 32% (35) 33% (35) 35% (38) 1082016 Vote: Didn’t Vote 47% (220) 26% (123) 27% (124) 467
Continued on next page

26
Morning ConsultTable POL1_1
Table POL1_1: Who do you trust more to handle each of the following issues?The economy
Demographic Democrats in CongressRepublicans in
CongressDon’t know / No
opinion Total N
Registered Voters 44% (885) 39% (775) 17% (334) 1994Voted in 2014: Yes 45% (572) 43% (546) 12% (158) 1275Voted in 2014: No 44% (314) 32% (229) 24% (176) 7194-Region: Northeast 51% (180) 33% (117) 16% (58) 3564-Region: Midwest 40% (184) 44% (200) 16% (75) 4584-Region: South 42% (312) 42% (313) 16% (119) 7444-Region: West 48% (209) 33% (145) 19% (81) 436Party: Democrat/Leans Democrat 80% (778) 8% (78) 12% (117) 973Party: Republican/Leans Republican 6% (49) 80% (614) 14% (105) 768Note: Row proportions may total to larger than one-hundred percent due to rounding. For more information visit MorningConsultIntelligence.com.

National Tracking Poll #2103129, March, 2021
27
Table POL1_2
Table POL1_2: Who do you trust more to handle each of the following issues?Jobs
Demographic Democrats in CongressRepublicans in
CongressDon’t know / No
opinion Total N
Registered Voters 46% (907) 38% (766) 16% (321) 1994Gender: Male 45% (423) 42% (389) 13% (122) 933Gender: Female 46% (485) 36% (377) 19% (199) 1061Age: 18-34 54% (268) 25% (127) 21% (106) 501Age: 35-44 41% (124) 38% (114) 21% (65) 303Age: 45-64 43% (312) 43% (314) 14% (100) 726Age: 65+ 44% (202) 45% (211) 11% (51) 464GenZers: 1997-2012 60% (100) 18% (31) 22% (37) 168Millennials: 1981-1996 45% (250) 33% (182) 22% (118) 551GenXers: 1965-1980 45% (191) 38% (162) 17% (71) 424Baby Boomers: 1946-1964 44% (346) 45% (351) 11% (87) 784PID: Dem (no lean) 84% (689) 6% (48) 10% (80) 817PID: Ind (no lean) 33% (178) 38% (208) 29% (156) 542PID: Rep (no lean) 6% (41) 80% (510) 13% (85) 635PID/Gender: DemMen 86% (302) 6% (21) 8% (26) 350PID/Gender: DemWomen 83% (387) 6% (27) 11% (53) 467PID/Gender: Ind Men 35% (97) 42% (119) 23% (64) 280PID/Gender: Ind Women 31% (81) 34% (89) 35% (92) 262PID/Gender: Rep Men 8% (23) 82% (249) 10% (31) 304PID/Gender: Rep Women 5% (17) 79% (261) 16% (54) 332Ideo: Liberal (1-3) 80% (501) 11% (70) 9% (54) 625Ideo: Moderate (4) 48% (276) 28% (162) 23% (133) 571Ideo: Conservative (5-7) 13% (89) 75% (515) 12% (81) 685Educ: < College 41% (517) 42% (521) 17% (217) 1254Educ: Bachelors degree 53% (251) 34% (158) 13% (63) 472Educ: Post-grad 52% (140) 32% (87) 15% (41) 268Income: Under 50k 46% (452) 35% (350) 19% (188) 989Income: 50k-100k 44% (268) 42% (255) 13% (80) 602Income: 100k+ 47% (188) 40% (161) 13% (53) 402Ethnicity: White 40% (648) 44% (706) 16% (259) 1613Ethnicity: Hispanic 51% (99) 30% (57) 19% (37) 193
Continued on next page

28
Morning ConsultTable POL1_2
Table POL1_2: Who do you trust more to handle each of the following issues?Jobs
Demographic Democrats in CongressRepublicans in
CongressDon’t know / No
opinion Total N
Registered Voters 46% (907) 38% (766) 16% (321) 1994Ethnicity: Black 79% (199) 10% (24) 12% (30) 253Ethnicity: Other 48% (61) 27% (35) 25% (32) 128All Christian 41% (425) 46% (472) 13% (139) 1036All Non-Christian 62% (72) 19% (22) 19% (21) 115Atheist 74% (65) 19% (17) 7% (6) 88Agnostic/Nothing in particular 49% (220) 28% (124) 23% (106) 450Something Else 41% (125) 43% (130) 16% (49) 305Religious Non-Protestant/Catholic 56% (78) 26% (37) 18% (25) 141Evangelical 33% (178) 52% (284) 16% (85) 547Non-Evangelical 47% (351) 40% (295) 13% (96) 742Community: Urban 60% (353) 24% (140) 16% (94) 586Community: Suburban 45% (417) 40% (366) 15% (141) 924Community: Rural 29% (138) 54% (260) 18% (86) 484Employ: Private Sector 48% (318) 36% (241) 16% (104) 663Employ: Government 51% (61) 30% (36) 19% (23) 120Employ: Self-Employed 48% (84) 38% (67) 14% (25) 176Employ: Homemaker 33% (38) 56% (66) 11% (13) 118Employ: Student 57% (52) 23% (21) 20% (18) 91Employ: Retired 43% (229) 44% (237) 13% (69) 534Employ: Unemployed 37% (67) 35% (64) 28% (51) 182Employ: Other 53% (58) 31% (34) 17% (19) 111Military HH: Yes 37% (125) 46% (152) 17% (56) 333Military HH: No 47% (782) 37% (614) 16% (265) 1661RD/WT: Right Direction 73% (739) 11% (114) 16% (164) 1017RD/WT: Wrong Track 17% (168) 67% (652) 16% (157) 977Biden Job Approve 75% (847) 11% (124) 14% (156) 1127Biden Job Disapprove 7% (52) 79% (626) 14% (113) 792
Continued on next page
National Tracking Poll #2103129, March, 2021
29
Table POL1_2
Table POL1_2: Who do you trust more to handle each of the following issues?Jobs
Demographic Democrats in CongressRepublicans in
CongressDon’t know / No
opinion Total N
Registered Voters 46% (907) 38% (766) 16% (321) 1994Biden Job Strongly Approve 85% (565) 6% (41) 9% (57) 663Biden Job Somewhat Approve 61% (282) 18% (83) 21% (99) 464Biden Job Somewhat Disapprove 18% (42) 57% (130) 25% (57) 229Biden Job Strongly Disapprove 2% (11) 88% (495) 10% (56) 562Favorable of Biden 76% (865) 11% (121) 14% (157) 1143Unfavorable of Biden 4% (34) 81% (633) 15% (117) 785Very Favorable of Biden 89% (576) 4% (25) 7% (43) 644Somewhat Favorable of Biden 58% (289) 19% (96) 23% (114) 499Somewhat Unfavorable of Biden 12% (24) 62% (118) 25% (48) 190Very Unfavorable of Biden 2% (10) 87% (515) 12% (69) 595#1 Issue: Economy 42% (300) 41% (293) 17% (121) 714#1 Issue: Security 17% (52) 69% (210) 14% (43) 305#1 Issue: Health Care 68% (209) 16% (48) 16% (50) 308#1 Issue: Medicare / Social Security 52% (139) 35% (95) 12% (33) 267#1 Issue: Women’s Issues 44% (39) 31% (28) 24% (22) 88#1 Issue: Education 52% (47) 28% (25) 19% (17) 89#1 Issue: Energy 60% (53) 26% (23) 15% (13) 89#1 Issue: Other 50% (67) 33% (45) 17% (22) 1342020 Vote: Joe Biden 79% (819) 8% (79) 13% (139) 10372020 Vote: Donald Trump 3% (21) 83% (612) 15% (109) 7412020 Vote: Other 14% (8) 40% (24) 47% (28) 602020 Vote: Didn’t Vote 37% (57) 33% (51) 29% (45) 1532018 House Vote: Democrat 81% (602) 9% (66) 11% (80) 7482018 House Vote: Republican 7% (44) 80% (501) 12% (77) 6232018 House Vote: Someone else 24% (13) 30% (17) 45% (25) 552016 Vote: Hillary Clinton 84% (588) 7% (46) 9% (65) 7002016 Vote: Donald Trump 7% (51) 79% (560) 14% (102) 7132016 Vote: Other 34% (37) 32% (34) 34% (37) 1082016 Vote: Didn’t Vote 48% (226) 27% (124) 25% (117) 467
Continued on next page

30
Morning ConsultTable POL1_2
Table POL1_2: Who do you trust more to handle each of the following issues?Jobs
Demographic Democrats in CongressRepublicans in
CongressDon’t know / No
opinion Total N
Registered Voters 46% (907) 38% (766) 16% (321) 1994Voted in 2014: Yes 46% (587) 42% (537) 12% (151) 1275Voted in 2014: No 45% (320) 32% (229) 24% (170) 7194-Region: Northeast 51% (180) 33% (118) 16% (57) 3564-Region: Midwest 39% (180) 44% (204) 16% (74) 4584-Region: South 45% (331) 42% (311) 14% (102) 7444-Region: West 49% (215) 30% (133) 20% (88) 436Party: Democrat/Leans Democrat 81% (787) 8% (75) 11% (110) 973Party: Republican/Leans Republican 6% (50) 80% (615) 13% (103) 768Note: Row proportions may total to larger than one-hundred percent due to rounding. For more information visit MorningConsultIntelligence.com.

National Tracking Poll #2103129, March, 2021
31
Table POL1_3
Table POL1_3: Who do you trust more to handle each of the following issues?Health care
Demographic Democrats in CongressRepublicans in
CongressDon’t know / No
opinion Total N
Registered Voters 53% (1051) 31% (626) 16% (317) 1994Gender: Male 52% (484) 34% (319) 14% (130) 933Gender: Female 53% (567) 29% (307) 18% (187) 1061Age: 18-34 60% (303) 19% (97) 20% (101) 501Age: 35-44 51% (154) 32% (97) 17% (52) 303Age: 45-64 50% (361) 35% (254) 15% (111) 726Age: 65+ 50% (233) 38% (178) 11% (53) 464GenZers: 1997-2012 75% (125) 9% (16) 16% (27) 168Millennials: 1981-1996 51% (282) 28% (155) 21% (113) 551GenXers: 1965-1980 53% (225) 31% (130) 16% (70) 424Baby Boomers: 1946-1964 50% (393) 37% (290) 13% (102) 784PID: Dem (no lean) 89% (730) 4% (29) 7% (58) 817PID: Ind (no lean) 46% (251) 27% (145) 27% (146) 542PID: Rep (no lean) 11% (70) 71% (452) 18% (113) 635PID/Gender: DemMen 90% (316) 4% (15) 6% (20) 350PID/Gender: DemWomen 89% (414) 3% (15) 8% (38) 467PID/Gender: Ind Men 46% (129) 31% (86) 23% (66) 280PID/Gender: Ind Women 47% (123) 23% (60) 30% (80) 262PID/Gender: Rep Men 13% (40) 72% (219) 15% (44) 304PID/Gender: Rep Women 9% (30) 70% (233) 21% (69) 332Ideo: Liberal (1-3) 87% (545) 7% (42) 6% (38) 625Ideo: Moderate (4) 60% (343) 21% (122) 19% (106) 571Ideo: Conservative (5-7) 17% (116) 66% (450) 17% (119) 685Educ: < College 47% (595) 34% (432) 18% (227) 1254Educ: Bachelors degree 59% (280) 28% (131) 13% (60) 472Educ: Post-grad 65% (175) 24% (63) 11% (30) 268Income: Under 50k 53% (523) 28% (277) 19% (189) 989Income: 50k-100k 50% (304) 36% (220) 13% (79) 602Income: 100k+ 56% (224) 32% (129) 12% (49) 402Ethnicity: White 48% (778) 36% (582) 16% (253) 1613Ethnicity: Hispanic 57% (109) 24% (47) 19% (37) 193
Continued on next page

32
Morning ConsultTable POL1_3
Table POL1_3: Who do you trust more to handle each of the following issues?Health care
Demographic Democrats in CongressRepublicans in
CongressDon’t know / No
opinion Total N
Registered Voters 53% (1051) 31% (626) 16% (317) 1994Ethnicity: Black 81% (204) 7% (18) 12% (30) 253Ethnicity: Other 54% (69) 20% (26) 26% (33) 128All Christian 48% (496) 39% (401) 13% (139) 1036All Non-Christian 64% (74) 18% (21) 18% (20) 115Atheist 76% (67) 18% (16) 6% (5) 88Agnostic/Nothing in particular 59% (268) 18% (80) 23% (102) 450Something Else 48% (146) 35% (108) 17% (50) 305Religious Non-Protestant/Catholic 61% (86) 24% (33) 15% (22) 141Evangelical 38% (208) 45% (246) 17% (93) 547Non-Evangelical 55% (407) 33% (242) 13% (93) 742Community: Urban 64% (378) 21% (124) 14% (84) 586Community: Suburban 54% (500) 31% (286) 15% (138) 924Community: Rural 36% (173) 45% (216) 20% (95) 484Employ: Private Sector 54% (357) 30% (201) 16% (104) 663Employ: Government 56% (68) 28% (33) 16% (19) 120Employ: Self-Employed 54% (95) 35% (61) 11% (20) 176Employ: Homemaker 38% (45) 41% (48) 21% (25) 118Employ: Student 75% (68) 8% (7) 17% (15) 91Employ: Retired 49% (264) 37% (200) 13% (70) 534Employ: Unemployed 50% (91) 25% (45) 25% (45) 182Employ: Other 57% (63) 27% (30) 16% (18) 111Military HH: Yes 50% (166) 35% (117) 15% (50) 333Military HH: No 53% (885) 31% (510) 16% (267) 1661RD/WT: Right Direction 79% (806) 9% (94) 12% (117) 1017RD/WT: Wrong Track 25% (245) 55% (533) 20% (199) 977Biden Job Approve 83% (937) 8% (87) 9% (103) 1127Biden Job Disapprove 13% (100) 67% (529) 21% (162) 792
Continued on next page

National Tracking Poll #2103129, March, 2021
33
Table POL1_3
Table POL1_3: Who do you trust more to handle each of the following issues?Health care
Demographic Democrats in CongressRepublicans in
CongressDon’t know / No
opinion Total N
Registered Voters 53% (1051) 31% (626) 16% (317) 1994Biden Job Strongly Approve 90% (595) 5% (35) 5% (33) 663Biden Job Somewhat Approve 74% (341) 11% (52) 15% (71) 464Biden Job Somewhat Disapprove 31% (72) 42% (96) 27% (62) 229Biden Job Strongly Disapprove 5% (28) 77% (434) 18% (101) 562Favorable of Biden 84% (962) 7% (77) 9% (103) 1143Unfavorable of Biden 9% (73) 69% (542) 22% (169) 785Very Favorable of Biden 92% (595) 4% (27) 4% (23) 644Somewhat Favorable of Biden 74% (368) 10% (50) 16% (81) 499Somewhat Unfavorable of Biden 27% (52) 44% (84) 28% (54) 190Very Unfavorable of Biden 4% (21) 77% (458) 19% (115) 595#1 Issue: Economy 49% (347) 34% (240) 18% (127) 714#1 Issue: Security 20% (61) 60% (182) 20% (62) 305#1 Issue: Health Care 77% (236) 12% (36) 12% (36) 308#1 Issue: Medicare / Social Security 58% (155) 29% (77) 13% (36) 267#1 Issue: Women’s Issues 52% (46) 27% (24) 21% (19) 88#1 Issue: Education 66% (59) 19% (17) 15% (13) 89#1 Issue: Energy 77% (68) 12% (10) 12% (11) 89#1 Issue: Other 59% (79) 31% (41) 10% (14) 1342020 Vote: Joe Biden 87% (907) 4% (43) 8% (86) 10372020 Vote: Donald Trump 8% (58) 72% (530) 21% (153) 7412020 Vote: Other 19% (12) 31% (19) 49% (30) 602020 Vote: Didn’t Vote 47% (72) 22% (33) 31% (47) 1532018 House Vote: Democrat 87% (650) 6% (42) 7% (55) 7482018 House Vote: Republican 12% (75) 70% (436) 18% (112) 6232018 House Vote: Someone else 30% (16) 25% (14) 45% (25) 552016 Vote: Hillary Clinton 89% (623) 4% (30) 7% (47) 7002016 Vote: Donald Trump 14% (102) 67% (476) 19% (135) 7132016 Vote: Other 49% (53) 20% (22) 31% (33) 1082016 Vote: Didn’t Vote 57% (268) 21% (98) 22% (101) 467
Continued on next page

34
Morning ConsultTable POL1_3
Table POL1_3: Who do you trust more to handle each of the following issues?Health care
Demographic Democrats in CongressRepublicans in
CongressDon’t know / No
opinion Total N
Registered Voters 53% (1051) 31% (626) 16% (317) 1994Voted in 2014: Yes 51% (653) 36% (458) 13% (165) 1275Voted in 2014: No 55% (398) 23% (169) 21% (152) 7194-Region: Northeast 56% (200) 29% (105) 14% (51) 3564-Region: Midwest 49% (226) 34% (158) 16% (74) 4584-Region: South 51% (383) 34% (253) 15% (109) 7444-Region: West 56% (242) 26% (111) 19% (82) 436Party: Democrat/Leans Democrat 89% (867) 4% (35) 7% (71) 973Party: Republican/Leans Republican 11% (86) 70% (541) 18% (140) 768Note: Row proportions may total to larger than one-hundred percent due to rounding. For more information visit MorningConsultIntelligence.com.

National Tracking Poll #2103129, March, 2021
35
Table POL1_4
Table POL1_4: Who do you trust more to handle each of the following issues?Immigration
Demographic Democrats in CongressRepublicans in
CongressDon’t know / No
opinion Total N
Registered Voters 43% (863) 38% (760) 19% (371) 1994Gender: Male 41% (387) 42% (394) 16% (152) 933Gender: Female 45% (476) 34% (366) 21% (219) 1061Age: 18-34 51% (256) 22% (111) 27% (134) 501Age: 35-44 44% (132) 36% (109) 20% (62) 303Age: 45-64 40% (293) 45% (326) 15% (108) 726Age: 65+ 39% (182) 46% (214) 15% (68) 464GenZers: 1997-2012 63% (106) 11% (18) 26% (44) 168Millennials: 1981-1996 44% (240) 32% (174) 25% (137) 551GenXers: 1965-1980 43% (183) 40% (172) 16% (69) 424Baby Boomers: 1946-1964 40% (313) 46% (360) 14% (112) 784PID: Dem (no lean) 78% (635) 7% (54) 16% (128) 817PID: Ind (no lean) 33% (179) 38% (205) 29% (158) 542PID: Rep (no lean) 8% (49) 79% (501) 13% (85) 635PID/Gender: DemMen 77% (271) 8% (27) 15% (52) 350PID/Gender: DemWomen 78% (364) 6% (27) 16% (75) 467PID/Gender: Ind Men 32% (89) 43% (121) 25% (69) 280PID/Gender: Ind Women 34% (89) 32% (84) 34% (89) 262PID/Gender: Rep Men 9% (27) 81% (246) 10% (31) 304PID/Gender: Rep Women 7% (22) 77% (255) 16% (54) 332Ideo: Liberal (1-3) 79% (495) 10% (61) 11% (70) 625Ideo: Moderate (4) 46% (261) 29% (164) 26% (147) 571Ideo: Conservative (5-7) 11% (73) 75% (515) 14% (97) 685Educ: < College 37% (469) 42% (521) 21% (264) 1254Educ: Bachelors degree 52% (246) 33% (157) 15% (69) 472Educ: Post-grad 55% (147) 31% (82) 14% (39) 268Income: Under 50k 42% (414) 36% (359) 22% (216) 989Income: 50k-100k 43% (256) 41% (249) 16% (97) 602Income: 100k+ 48% (193) 38% (151) 14% (58) 402Ethnicity: White 39% (622) 43% (698) 18% (293) 1613Ethnicity: Hispanic 50% (97) 27% (53) 22% (43) 193
Continued on next page

36
Morning ConsultTable POL1_4
Table POL1_4: Who do you trust more to handle each of the following issues?Immigration
Demographic Democrats in CongressRepublicans in
CongressDon’t know / No
opinion Total N
Registered Voters 43% (863) 38% (760) 19% (371) 1994Ethnicity: Black 71% (180) 11% (27) 18% (46) 253Ethnicity: Other 48% (61) 27% (34) 26% (33) 128All Christian 39% (408) 46% (475) 15% (153) 1036All Non-Christian 54% (62) 20% (23) 26% (30) 115Atheist 73% (64) 21% (18) 7% (6) 88Agnostic/Nothing in particular 47% (211) 28% (124) 26% (115) 450Something Else 39% (118) 39% (120) 22% (67) 305Religious Non-Protestant/Catholic 49% (69) 27% (37) 24% (34) 141Evangelical 31% (171) 51% (277) 18% (99) 547Non-Evangelical 45% (332) 40% (295) 15% (115) 742Community: Urban 57% (336) 26% (155) 16% (96) 586Community: Suburban 42% (392) 39% (359) 19% (173) 924Community: Rural 28% (135) 51% (246) 21% (102) 484Employ: Private Sector 46% (308) 34% (227) 19% (128) 663Employ: Government 54% (65) 27% (32) 19% (23) 120Employ: Self-Employed 45% (79) 41% (72) 14% (25) 176Employ: Homemaker 30% (36) 50% (59) 20% (23) 118Employ: Student 64% (58) 14% (13) 22% (20) 91Employ: Retired 40% (213) 46% (244) 14% (77) 534Employ: Unemployed 29% (53) 40% (73) 30% (55) 182Employ: Other 45% (50) 37% (41) 18% (20) 111Military HH: Yes 40% (134) 45% (149) 15% (51) 333Military HH: No 44% (729) 37% (611) 19% (321) 1661RD/WT: Right Direction 69% (698) 12% (118) 20% (200) 1017RD/WT: Wrong Track 17% (165) 66% (641) 18% (171) 977Biden Job Approve 71% (796) 12% (130) 18% (201) 1127Biden Job Disapprove 8% (60) 78% (614) 15% (118) 792
Continued on next page
National Tracking Poll #2103129, March, 2021
37
Table POL1_4
Table POL1_4: Who do you trust more to handle each of the following issues?Immigration
Demographic Democrats in CongressRepublicans in
CongressDon’t know / No
opinion Total N
Registered Voters 43% (863) 38% (760) 19% (371) 1994Biden Job Strongly Approve 83% (548) 6% (38) 12% (76) 663Biden Job Somewhat Approve 53% (248) 20% (92) 27% (124) 464Biden Job Somewhat Disapprove 20% (46) 56% (128) 24% (55) 229Biden Job Strongly Disapprove 2% (13) 86% (486) 11% (63) 562Favorable of Biden 72% (821) 11% (125) 17% (197) 1143Unfavorable of Biden 4% (35) 79% (623) 16% (127) 785Very Favorable of Biden 85% (550) 5% (30) 10% (64) 644Somewhat Favorable of Biden 54% (271) 19% (95) 27% (133) 499Somewhat Unfavorable of Biden 14% (26) 58% (111) 28% (53) 190Very Unfavorable of Biden 2% (9) 86% (512) 12% (74) 595#1 Issue: Economy 39% (278) 41% (290) 20% (146) 714#1 Issue: Security 14% (43) 73% (222) 13% (39) 305#1 Issue: Health Care 65% (201) 18% (57) 16% (50) 308#1 Issue: Medicare / Social Security 48% (128) 35% (92) 17% (47) 267#1 Issue: Women’s Issues 50% (44) 26% (23) 24% (21) 88#1 Issue: Education 57% (50) 17% (15) 27% (24) 89#1 Issue: Energy 62% (55) 15% (13) 24% (21) 89#1 Issue: Other 47% (63) 36% (48) 18% (24) 1342020 Vote: Joe Biden 75% (776) 8% (81) 17% (180) 10372020 Vote: Donald Trump 4% (27) 81% (598) 16% (116) 7412020 Vote: Other 10% (6) 40% (24) 50% (30) 602020 Vote: Didn’t Vote 35% (54) 35% (54) 30% (45) 1532018 House Vote: Democrat 77% (576) 9% (67) 14% (104) 7482018 House Vote: Republican 8% (52) 79% (490) 13% (81) 6232018 House Vote: Someone else 19% (10) 37% (20) 44% (24) 552016 Vote: Hillary Clinton 78% (544) 7% (49) 15% (107) 7002016 Vote: Donald Trump 9% (61) 77% (552) 14% (100) 7132016 Vote: Other 36% (39) 33% (35) 32% (34) 1082016 Vote: Didn’t Vote 46% (217) 26% (122) 27% (128) 467
Continued on next page

38
Morning ConsultTable POL1_4
Table POL1_4: Who do you trust more to handle each of the following issues?Immigration
Demographic Democrats in CongressRepublicans in
CongressDon’t know / No
opinion Total N
Registered Voters 43% (863) 38% (760) 19% (371) 1994Voted in 2014: Yes 44% (559) 42% (533) 14% (183) 1275Voted in 2014: No 42% (304) 32% (227) 26% (188) 7194-Region: Northeast 50% (178) 33% (119) 17% (59) 3564-Region: Midwest 38% (173) 43% (197) 19% (87) 4584-Region: South 41% (308) 41% (307) 17% (130) 7444-Region: West 47% (203) 31% (137) 22% (96) 436Party: Democrat/Leans Democrat 77% (747) 7% (68) 16% (158) 973Party: Republican/Leans Republican 7% (57) 79% (607) 14% (104) 768Note: Row proportions may total to larger than one-hundred percent due to rounding. For more information visit MorningConsultIntelligence.com.

National Tracking Poll #2103129, March, 2021
39
Table POL1_5
Table POL1_5: Who do you trust more to handle each of the following issues?Climate change
Demographic Democrats in CongressRepublicans in
CongressDon’t know / No
opinion Total N
Registered Voters 54% (1075) 24% (482) 22% (437) 1994Gender: Male 55% (513) 27% (250) 18% (170) 933Gender: Female 53% (562) 22% (232) 25% (267) 1061Age: 18-34 63% (316) 14% (70) 23% (114) 501Age: 35-44 52% (159) 24% (71) 24% (73) 303Age: 45-64 49% (358) 29% (207) 22% (161) 726Age: 65+ 52% (243) 29% (133) 19% (88) 464GenZers: 1997-2012 76% (127) 5% (8) 19% (33) 168Millennials: 1981-1996 54% (298) 21% (115) 25% (138) 551GenXers: 1965-1980 51% (218) 26% (112) 22% (95) 424Baby Boomers: 1946-1964 52% (406) 28% (221) 20% (157) 784PID: Dem (no lean) 85% (695) 3% (26) 12% (96) 817PID: Ind (no lean) 50% (269) 20% (111) 30% (162) 542PID: Rep (no lean) 17% (111) 54% (345) 28% (179) 635PID/Gender: DemMen 86% (300) 5% (16) 10% (33) 350PID/Gender: DemWomen 85% (395) 2% (10) 13% (63) 467PID/Gender: Ind Men 52% (146) 24% (68) 24% (66) 280PID/Gender: Ind Women 47% (123) 16% (43) 37% (96) 262PID/Gender: Rep Men 22% (67) 55% (166) 23% (71) 304PID/Gender: Rep Women 13% (44) 54% (179) 33% (108) 332Ideo: Liberal (1-3) 87% (543) 4% (27) 9% (55) 625Ideo: Moderate (4) 60% (344) 17% (95) 23% (133) 571Ideo: Conservative (5-7) 22% (151) 51% (352) 27% (182) 685Educ: < College 48% (605) 27% (338) 25% (311) 1254Educ: Bachelors degree 64% (300) 19% (88) 18% (83) 472Educ: Post-grad 63% (170) 21% (55) 16% (44) 268Income: Under 50k 52% (512) 22% (215) 26% (262) 989Income: 50k-100k 54% (323) 27% (163) 19% (116) 602Income: 100k+ 60% (240) 26% (103) 15% (59) 402Ethnicity: White 50% (803) 28% (452) 22% (358) 1613Ethnicity: Hispanic 58% (111) 16% (30) 27% (51) 193
Continued on next page

40
Morning ConsultTable POL1_5
Table POL1_5: Who do you trust more to handle each of the following issues?Climate change
Demographic Democrats in CongressRepublicans in
CongressDon’t know / No
opinion Total N
Registered Voters 54% (1075) 24% (482) 22% (437) 1994Ethnicity: Black 80% (202) 4% (10) 16% (41) 253Ethnicity: Other 55% (71) 16% (20) 29% (38) 128All Christian 48% (495) 30% (311) 22% (230) 1036All Non-Christian 70% (81) 14% (16) 16% (19) 115Atheist 84% (73) 10% (9) 6% (6) 88Agnostic/Nothing in particular 60% (271) 14% (61) 26% (118) 450Something Else 51% (155) 28% (85) 21% (64) 305Religious Non-Protestant/Catholic 61% (86) 17% (23) 22% (31) 141Evangelical 37% (202) 38% (210) 25% (135) 547Non-Evangelical 57% (424) 23% (174) 19% (144) 742Community: Urban 64% (373) 15% (89) 21% (124) 586Community: Suburban 55% (507) 23% (217) 22% (200) 924Community: Rural 40% (194) 36% (176) 24% (114) 484Employ: Private Sector 55% (364) 23% (151) 22% (148) 663Employ: Government 64% (77) 18% (22) 17% (21) 120Employ: Self-Employed 59% (104) 25% (44) 16% (27) 176Employ: Homemaker 37% (43) 36% (42) 27% (32) 118Employ: Student 77% (70) 6% (5) 17% (15) 91Employ: Retired 52% (278) 28% (152) 20% (104) 534Employ: Unemployed 46% (84) 21% (38) 33% (60) 182Employ: Other 49% (55) 25% (27) 26% (29) 111Military HH: Yes 51% (171) 29% (96) 20% (65) 333Military HH: No 54% (904) 23% (385) 22% (372) 1661RD/WT: Right Direction 77% (787) 6% (66) 16% (164) 1017RD/WT: Wrong Track 30% (288) 43% (416) 28% (273) 977Biden Job Approve 80% (903) 6% (67) 14% (157) 1127Biden Job Disapprove 19% (150) 52% (412) 29% (229) 792
Continued on next page

National Tracking Poll #2103129, March, 2021
41
Table POL1_5
Table POL1_5: Who do you trust more to handle each of the following issues?Climate change
Demographic Democrats in CongressRepublicans in
CongressDon’t know / No
opinion Total N
Registered Voters 54% (1075) 24% (482) 22% (437) 1994Biden Job Strongly Approve 87% (578) 4% (29) 8% (55) 663Biden Job Somewhat Approve 70% (324) 8% (38) 22% (101) 464Biden Job Somewhat Disapprove 42% (96) 26% (58) 33% (75) 229Biden Job Strongly Disapprove 10% (54) 63% (354) 28% (155) 562Favorable of Biden 82% (937) 5% (53) 13% (153) 1143Unfavorable of Biden 16% (125) 54% (424) 30% (236) 785Very Favorable of Biden 91% (586) 3% (22) 6% (36) 644Somewhat Favorable of Biden 70% (351) 6% (31) 23% (117) 499Somewhat Unfavorable of Biden 39% (74) 28% (53) 33% (63) 190Very Unfavorable of Biden 9% (51) 62% (371) 29% (173) 595#1 Issue: Economy 51% (365) 25% (179) 24% (169) 714#1 Issue: Security 23% (70) 48% (146) 29% (88) 305#1 Issue: Health Care 74% (226) 10% (32) 16% (49) 308#1 Issue: Medicare / Social Security 59% (158) 20% (54) 21% (55) 267#1 Issue: Women’s Issues 61% (54) 19% (17) 20% (17) 88#1 Issue: Education 68% (60) 13% (11) 20% (18) 89#1 Issue: Energy 75% (66) 7% (6) 18% (16) 89#1 Issue: Other 56% (75) 26% (36) 18% (24) 1342020 Vote: Joe Biden 85% (884) 3% (34) 11% (119) 10372020 Vote: Donald Trump 14% (104) 56% (414) 30% (223) 7412020 Vote: Other 32% (19) 16% (10) 52% (31) 602020 Vote: Didn’t Vote 43% (66) 15% (23) 42% (63) 1532018 House Vote: Democrat 86% (642) 5% (35) 9% (71) 7482018 House Vote: Republican 19% (116) 55% (342) 26% (164) 6232018 House Vote: Someone else 27% (15) 20% (11) 53% (29) 552016 Vote: Hillary Clinton 87% (607) 4% (31) 9% (62) 7002016 Vote: Donald Trump 20% (141) 52% (374) 28% (198) 7132016 Vote: Other 49% (53) 14% (15) 37% (40) 1082016 Vote: Didn’t Vote 58% (269) 13% (62) 29% (136) 467
Continued on next page

42
Morning ConsultTable POL1_5
Table POL1_5: Who do you trust more to handle each of the following issues?Climate change
Demographic Democrats in CongressRepublicans in
CongressDon’t know / No
opinion Total N
Registered Voters 54% (1075) 24% (482) 22% (437) 1994Voted in 2014: Yes 53% (677) 29% (366) 18% (233) 1275Voted in 2014: No 55% (398) 16% (116) 28% (205) 7194-Region: Northeast 58% (207) 21% (74) 21% (75) 3564-Region: Midwest 49% (225) 29% (134) 22% (99) 4584-Region: South 52% (390) 25% (189) 22% (165) 7444-Region: West 58% (253) 19% (84) 23% (99) 436Party: Democrat/Leans Democrat 86% (836) 3% (27) 11% (109) 973Party: Republican/Leans Republican 17% (132) 54% (416) 29% (220) 768Note: Row proportions may total to larger than one-hundred percent due to rounding. For more information visit MorningConsultIntelligence.com.

National Tracking Poll #2103129, March, 2021
43
Table POL1_6
Table POL1_6: Who do you trust more to handle each of the following issues?The environment
Demographic Democrats in CongressRepublicans in
CongressDon’t know / No
opinion Total N
Registered Voters 54% (1083) 26% (527) 19% (384) 1994Gender: Male 54% (508) 29% (268) 17% (157) 933Gender: Female 54% (575) 24% (259) 21% (227) 1061Age: 18-34 63% (315) 14% (71) 23% (114) 501Age: 35-44 53% (162) 25% (75) 22% (66) 303Age: 45-64 51% (367) 33% (240) 16% (120) 726Age: 65+ 51% (239) 30% (141) 18% (84) 464GenZers: 1997-2012 74% (124) 8% (14) 18% (30) 168Millennials: 1981-1996 55% (300) 21% (115) 25% (136) 551GenXers: 1965-1980 51% (217) 30% (127) 19% (80) 424Baby Boomers: 1946-1964 53% (415) 31% (244) 16% (125) 784PID: Dem (no lean) 87% (708) 3% (28) 10% (80) 817PID: Ind (no lean) 49% (263) 21% (115) 30% (164) 542PID: Rep (no lean) 18% (112) 60% (384) 22% (140) 635PID/Gender: DemMen 85% (298) 6% (22) 8% (30) 350PID/Gender: DemWomen 88% (411) 1% (6) 11% (50) 467PID/Gender: Ind Men 51% (143) 23% (65) 26% (72) 280PID/Gender: Ind Women 46% (120) 19% (50) 35% (92) 262PID/Gender: Rep Men 22% (68) 59% (180) 18% (55) 304PID/Gender: Rep Women 13% (44) 61% (203) 25% (84) 332Ideo: Liberal (1-3) 87% (541) 6% (37) 7% (47) 625Ideo: Moderate (4) 59% (337) 18% (103) 23% (131) 571Ideo: Conservative (5-7) 23% (158) 55% (374) 22% (153) 685Educ: < College 48% (605) 30% (379) 22% (270) 1254Educ: Bachelors degree 65% (306) 20% (95) 15% (70) 472Educ: Post-grad 64% (172) 20% (53) 16% (44) 268Income: Under 50k 53% (525) 25% (244) 22% (221) 989Income: 50k-100k 53% (320) 29% (174) 18% (108) 602Income: 100k+ 59% (238) 27% (109) 14% (55) 402Ethnicity: White 50% (810) 30% (491) 19% (311) 1613Ethnicity: Hispanic 59% (113) 20% (39) 21% (41) 193
Continued on next page

44
Morning ConsultTable POL1_6
Table POL1_6: Who do you trust more to handle each of the following issues?The environment
Demographic Democrats in CongressRepublicans in
CongressDon’t know / No
opinion Total N
Registered Voters 54% (1083) 26% (527) 19% (384) 1994Ethnicity: Black 78% (198) 7% (17) 15% (38) 253Ethnicity: Other 58% (74) 15% (19) 27% (35) 128All Christian 49% (505) 32% (330) 19% (202) 1036All Non-Christian 66% (77) 16% (19) 18% (20) 115Atheist 85% (74) 10% (9) 6% (5) 88Agnostic/Nothing in particular 60% (271) 16% (74) 23% (106) 450Something Else 51% (157) 32% (96) 17% (52) 305Religious Non-Protestant/Catholic 61% (85) 20% (28) 19% (27) 141Evangelical 39% (211) 40% (220) 21% (116) 547Non-Evangelical 57% (422) 26% (191) 17% (130) 742Community: Urban 65% (380) 17% (101) 18% (106) 586Community: Suburban 56% (513) 26% (240) 18% (171) 924Community: Rural 39% (190) 39% (187) 22% (107) 484Employ: Private Sector 56% (370) 24% (161) 20% (132) 663Employ: Government 62% (74) 23% (28) 15% (18) 120Employ: Self-Employed 57% (100) 29% (51) 14% (25) 176Employ: Homemaker 41% (48) 40% (47) 19% (22) 118Employ: Student 77% (70) 6% (5) 17% (16) 91Employ: Retired 53% (282) 30% (159) 18% (94) 534Employ: Unemployed 45% (81) 24% (45) 31% (56) 182Employ: Other 52% (58) 29% (32) 19% (21) 111Military HH: Yes 51% (169) 31% (104) 18% (60) 333Military HH: No 55% (914) 25% (423) 20% (324) 1661RD/WT: Right Direction 77% (788) 7% (72) 15% (157) 1017RD/WT: Wrong Track 30% (295) 47% (455) 23% (228) 977Biden Job Approve 82% (919) 7% (74) 12% (134) 1127Biden Job Disapprove 19% (147) 56% (445) 25% (200) 792
Continued on next page

National Tracking Poll #2103129, March, 2021
45
Table POL1_6
Table POL1_6: Who do you trust more to handle each of the following issues?The environment
Demographic Democrats in CongressRepublicans in
CongressDon’t know / No
opinion Total N
Registered Voters 54% (1083) 26% (527) 19% (384) 1994Biden Job Strongly Approve 88% (582) 4% (29) 8% (52) 663Biden Job Somewhat Approve 73% (338) 10% (45) 18% (81) 464Biden Job Somewhat Disapprove 42% (96) 31% (70) 28% (63) 229Biden Job Strongly Disapprove 9% (51) 67% (374) 24% (137) 562Favorable of Biden 83% (950) 5% (63) 11% (130) 1143Unfavorable of Biden 15% (122) 58% (455) 26% (208) 785Very Favorable of Biden 90% (582) 4% (24) 6% (38) 644Somewhat Favorable of Biden 74% (369) 8% (39) 18% (91) 499Somewhat Unfavorable of Biden 39% (74) 32% (61) 29% (55) 190Very Unfavorable of Biden 8% (47) 66% (395) 26% (153) 595#1 Issue: Economy 52% (370) 28% (202) 20% (142) 714#1 Issue: Security 23% (72) 53% (161) 24% (73) 305#1 Issue: Health Care 76% (234) 10% (31) 14% (43) 308#1 Issue: Medicare / Social Security 58% (156) 21% (56) 21% (55) 267#1 Issue: Women’s Issues 58% (51) 20% (17) 22% (20) 88#1 Issue: Education 63% (56) 14% (13) 23% (20) 89#1 Issue: Energy 74% (66) 14% (13) 12% (11) 89#1 Issue: Other 59% (79) 26% (34) 16% (21) 1342020 Vote: Joe Biden 86% (894) 3% (34) 10% (108) 10372020 Vote: Donald Trump 14% (105) 59% (441) 26% (195) 7412020 Vote: Other 29% (18) 16% (10) 55% (33) 602020 Vote: Didn’t Vote 41% (63) 27% (42) 31% (48) 1532018 House Vote: Democrat 87% (647) 4% (33) 9% (67) 7482018 House Vote: Republican 19% (119) 58% (360) 23% (143) 6232018 House Vote: Someone else 31% (17) 19% (10) 51% (28) 552016 Vote: Hillary Clinton 87% (609) 4% (27) 9% (64) 7002016 Vote: Donald Trump 20% (143) 55% (391) 25% (179) 7132016 Vote: Other 57% (61) 12% (13) 31% (34) 1082016 Vote: Didn’t Vote 57% (265) 20% (95) 23% (107) 467
Continued on next page

46
Morning ConsultTable POL1_6
Table POL1_6: Who do you trust more to handle each of the following issues?The environment
Demographic Democrats in CongressRepublicans in
CongressDon’t know / No
opinion Total N
Registered Voters 54% (1083) 26% (527) 19% (384) 1994Voted in 2014: Yes 54% (683) 30% (383) 16% (209) 1275Voted in 2014: No 56% (400) 20% (144) 24% (175) 7194-Region: Northeast 60% (213) 22% (79) 18% (64) 3564-Region: Midwest 49% (223) 30% (136) 22% (99) 4584-Region: South 52% (387) 30% (223) 18% (135) 7444-Region: West 60% (260) 20% (89) 20% (86) 436Party: Democrat/Leans Democrat 87% (846) 3% (30) 10% (96) 973Party: Republican/Leans Republican 17% (129) 60% (458) 24% (181) 768Note: Row proportions may total to larger than one-hundred percent due to rounding. For more information visit MorningConsultIntelligence.com.

National Tracking Poll #2103129, March, 2021
47
Table POL1_7
Table POL1_7: Who do you trust more to handle each of the following issues?Energy
Demographic Democrats in CongressRepublicans in
CongressDon’t know / No
opinion Total N
Registered Voters 49% (980) 33% (657) 18% (357) 1994Gender: Male 48% (445) 39% (360) 14% (129) 933Gender: Female 50% (535) 28% (297) 22% (228) 1061Age: 18-34 60% (299) 18% (90) 22% (112) 501Age: 35-44 49% (148) 32% (97) 19% (58) 303Age: 45-64 45% (324) 39% (283) 16% (119) 726Age: 65+ 45% (209) 40% (187) 15% (68) 464GenZers: 1997-2012 69% (115) 9% (15) 22% (38) 168Millennials: 1981-1996 51% (282) 27% (148) 22% (121) 551GenXers: 1965-1980 49% (206) 35% (149) 16% (69) 424Baby Boomers: 1946-1964 46% (358) 40% (310) 15% (117) 784PID: Dem (no lean) 84% (687) 5% (37) 11% (93) 817PID: Ind (no lean) 41% (224) 30% (161) 29% (158) 542PID: Rep (no lean) 11% (69) 72% (459) 17% (106) 635PID/Gender: DemMen 84% (295) 7% (25) 8% (30) 350PID/Gender: DemWomen 84% (392) 3% (12) 14% (63) 467PID/Gender: Ind Men 41% (115) 36% (100) 23% (65) 280PID/Gender: Ind Women 41% (109) 23% (61) 35% (93) 262PID/Gender: Rep Men 11% (34) 77% (235) 11% (34) 304PID/Gender: Rep Women 11% (35) 68% (225) 22% (72) 332Ideo: Liberal (1-3) 84% (522) 7% (44) 9% (59) 625Ideo: Moderate (4) 54% (310) 23% (132) 22% (128) 571Ideo: Conservative (5-7) 15% (106) 69% (472) 16% (108) 685Educ: < College 44% (551) 36% (445) 21% (258) 1254Educ: Bachelors degree 57% (270) 29% (139) 13% (63) 472Educ: Post-grad 59% (159) 27% (73) 13% (36) 268Income: Under 50k 48% (474) 29% (289) 23% (227) 989Income: 50k-100k 48% (287) 39% (234) 14% (82) 602Income: 100k+ 55% (220) 33% (135) 12% (48) 402Ethnicity: White 45% (724) 38% (606) 18% (283) 1613Ethnicity: Hispanic 58% (111) 24% (45) 19% (37) 193
Continued on next page
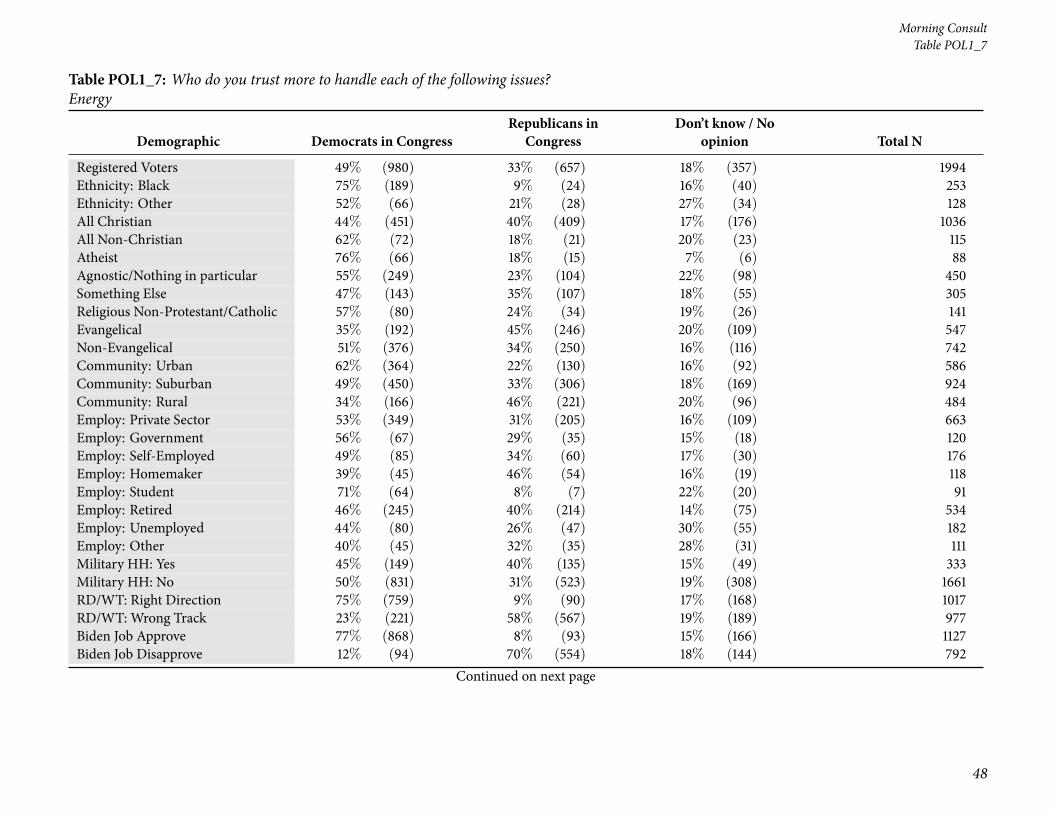
48
Morning ConsultTable POL1_7
Table POL1_7: Who do you trust more to handle each of the following issues?Energy
Demographic Democrats in CongressRepublicans in
CongressDon’t know / No
opinion Total N
Registered Voters 49% (980) 33% (657) 18% (357) 1994Ethnicity: Black 75% (189) 9% (24) 16% (40) 253Ethnicity: Other 52% (66) 21% (28) 27% (34) 128All Christian 44% (451) 40% (409) 17% (176) 1036All Non-Christian 62% (72) 18% (21) 20% (23) 115Atheist 76% (66) 18% (15) 7% (6) 88Agnostic/Nothing in particular 55% (249) 23% (104) 22% (98) 450Something Else 47% (143) 35% (107) 18% (55) 305Religious Non-Protestant/Catholic 57% (80) 24% (34) 19% (26) 141Evangelical 35% (192) 45% (246) 20% (109) 547Non-Evangelical 51% (376) 34% (250) 16% (116) 742Community: Urban 62% (364) 22% (130) 16% (92) 586Community: Suburban 49% (450) 33% (306) 18% (169) 924Community: Rural 34% (166) 46% (221) 20% (96) 484Employ: Private Sector 53% (349) 31% (205) 16% (109) 663Employ: Government 56% (67) 29% (35) 15% (18) 120Employ: Self-Employed 49% (85) 34% (60) 17% (30) 176Employ: Homemaker 39% (45) 46% (54) 16% (19) 118Employ: Student 71% (64) 8% (7) 22% (20) 91Employ: Retired 46% (245) 40% (214) 14% (75) 534Employ: Unemployed 44% (80) 26% (47) 30% (55) 182Employ: Other 40% (45) 32% (35) 28% (31) 111Military HH: Yes 45% (149) 40% (135) 15% (49) 333Military HH: No 50% (831) 31% (523) 19% (308) 1661RD/WT: Right Direction 75% (759) 9% (90) 17% (168) 1017RD/WT: Wrong Track 23% (221) 58% (567) 19% (189) 977Biden Job Approve 77% (868) 8% (93) 15% (166) 1127Biden Job Disapprove 12% (94) 70% (554) 18% (144) 792
Continued on next page
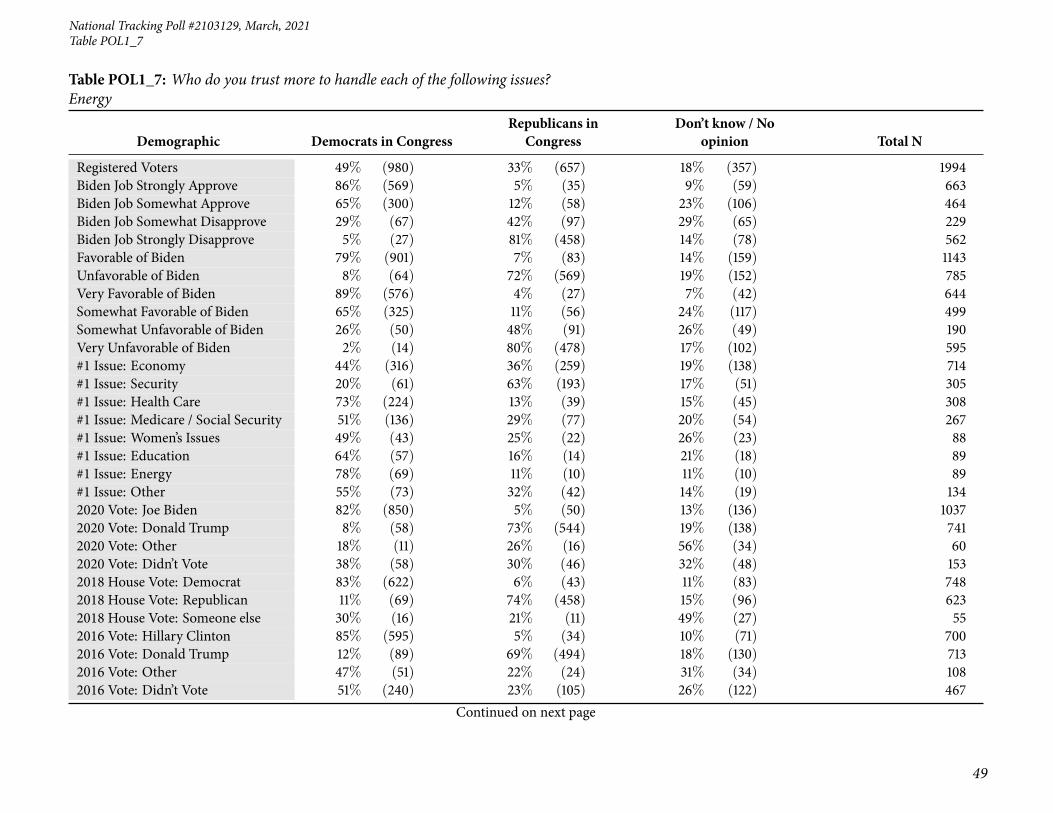
National Tracking Poll #2103129, March, 2021
49
Table POL1_7
Table POL1_7: Who do you trust more to handle each of the following issues?Energy
Demographic Democrats in CongressRepublicans in
CongressDon’t know / No
opinion Total N
Registered Voters 49% (980) 33% (657) 18% (357) 1994Biden Job Strongly Approve 86% (569) 5% (35) 9% (59) 663Biden Job Somewhat Approve 65% (300) 12% (58) 23% (106) 464Biden Job Somewhat Disapprove 29% (67) 42% (97) 29% (65) 229Biden Job Strongly Disapprove 5% (27) 81% (458) 14% (78) 562Favorable of Biden 79% (901) 7% (83) 14% (159) 1143Unfavorable of Biden 8% (64) 72% (569) 19% (152) 785Very Favorable of Biden 89% (576) 4% (27) 7% (42) 644Somewhat Favorable of Biden 65% (325) 11% (56) 24% (117) 499Somewhat Unfavorable of Biden 26% (50) 48% (91) 26% (49) 190Very Unfavorable of Biden 2% (14) 80% (478) 17% (102) 595#1 Issue: Economy 44% (316) 36% (259) 19% (138) 714#1 Issue: Security 20% (61) 63% (193) 17% (51) 305#1 Issue: Health Care 73% (224) 13% (39) 15% (45) 308#1 Issue: Medicare / Social Security 51% (136) 29% (77) 20% (54) 267#1 Issue: Women’s Issues 49% (43) 25% (22) 26% (23) 88#1 Issue: Education 64% (57) 16% (14) 21% (18) 89#1 Issue: Energy 78% (69) 11% (10) 11% (10) 89#1 Issue: Other 55% (73) 32% (42) 14% (19) 1342020 Vote: Joe Biden 82% (850) 5% (50) 13% (136) 10372020 Vote: Donald Trump 8% (58) 73% (544) 19% (138) 7412020 Vote: Other 18% (11) 26% (16) 56% (34) 602020 Vote: Didn’t Vote 38% (58) 30% (46) 32% (48) 1532018 House Vote: Democrat 83% (622) 6% (43) 11% (83) 7482018 House Vote: Republican 11% (69) 74% (458) 15% (96) 6232018 House Vote: Someone else 30% (16) 21% (11) 49% (27) 552016 Vote: Hillary Clinton 85% (595) 5% (34) 10% (71) 7002016 Vote: Donald Trump 12% (89) 69% (494) 18% (130) 7132016 Vote: Other 47% (51) 22% (24) 31% (34) 1082016 Vote: Didn’t Vote 51% (240) 23% (105) 26% (122) 467
Continued on next page
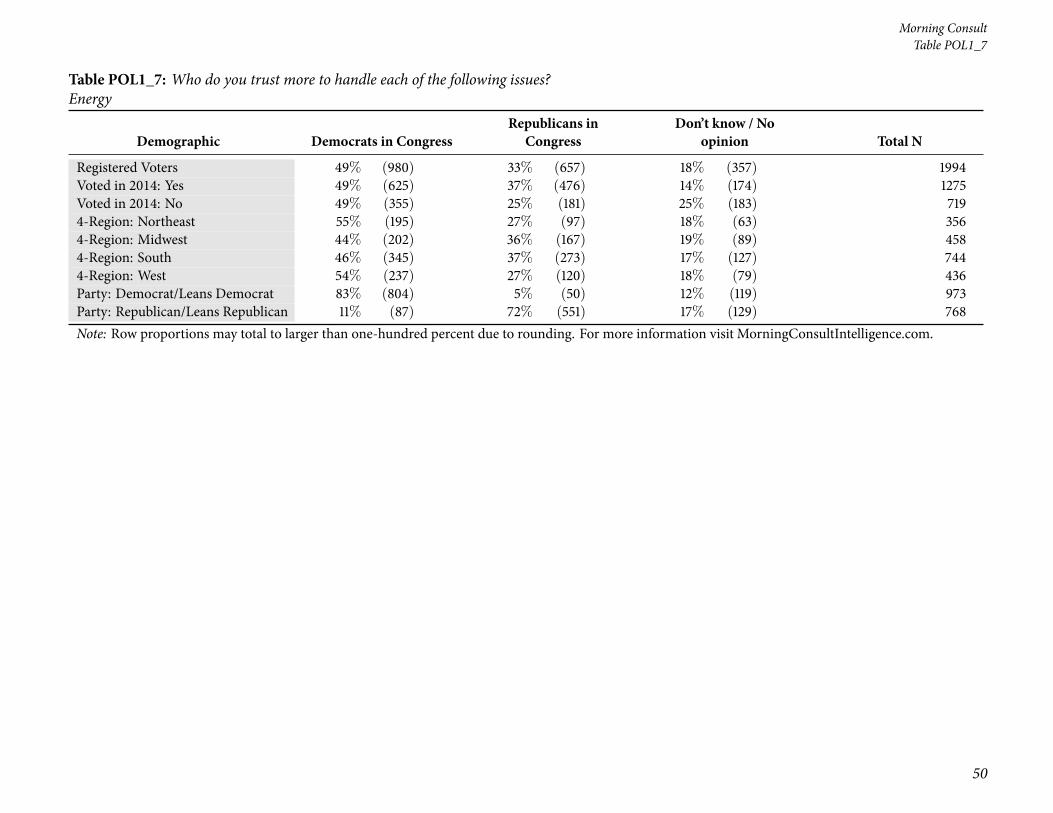
50
Morning ConsultTable POL1_7
Table POL1_7: Who do you trust more to handle each of the following issues?Energy
Demographic Democrats in CongressRepublicans in
CongressDon’t know / No
opinion Total N
Registered Voters 49% (980) 33% (657) 18% (357) 1994Voted in 2014: Yes 49% (625) 37% (476) 14% (174) 1275Voted in 2014: No 49% (355) 25% (181) 25% (183) 7194-Region: Northeast 55% (195) 27% (97) 18% (63) 3564-Region: Midwest 44% (202) 36% (167) 19% (89) 4584-Region: South 46% (345) 37% (273) 17% (127) 7444-Region: West 54% (237) 27% (120) 18% (79) 436Party: Democrat/Leans Democrat 83% (804) 5% (50) 12% (119) 973Party: Republican/Leans Republican 11% (87) 72% (551) 17% (129) 768Note: Row proportions may total to larger than one-hundred percent due to rounding. For more information visit MorningConsultIntelligence.com.

National Tracking Poll #2103129, March, 2021
51
Table POL1_8
Table POL1_8: Who do you trust more to handle each of the following issues?Education
Demographic Democrats in CongressRepublicans in
CongressDon’t know / No
opinion Total N
Registered Voters 51% (1013) 31% (620) 18% (361) 1994Gender: Male 51% (473) 34% (316) 16% (145) 933Gender: Female 51% (540) 29% (305) 20% (216) 1061Age: 18-34 57% (287) 20% (101) 23% (113) 501Age: 35-44 49% (149) 29% (87) 22% (67) 303Age: 45-64 49% (359) 36% (260) 15% (107) 726Age: 65+ 47% (218) 37% (172) 16% (74) 464GenZers: 1997-2012 66% (111) 17% (29) 16% (28) 168Millennials: 1981-1996 50% (278) 25% (137) 25% (136) 551GenXers: 1965-1980 50% (211) 32% (137) 18% (77) 424Baby Boomers: 1946-1964 50% (391) 36% (284) 14% (109) 784PID: Dem (no lean) 87% (714) 4% (33) 9% (70) 817PID: Ind (no lean) 40% (218) 27% (147) 33% (177) 542PID: Rep (no lean) 13% (81) 69% (441) 18% (113) 635PID/Gender: DemMen 87% (305) 4% (16) 8% (29) 350PID/Gender: DemWomen 88% (409) 4% (17) 9% (41) 467PID/Gender: Ind Men 43% (120) 31% (86) 26% (74) 280PID/Gender: Ind Women 37% (97) 24% (62) 39% (103) 262PID/Gender: Rep Men 16% (48) 71% (214) 14% (42) 304PID/Gender: Rep Women 10% (33) 68% (226) 22% (72) 332Ideo: Liberal (1-3) 86% (540) 6% (39) 7% (47) 625Ideo: Moderate (4) 56% (317) 20% (113) 25% (141) 571Ideo: Conservative (5-7) 17% (117) 65% (448) 18% (121) 685Educ: < College 46% (574) 34% (424) 20% (256) 1254Educ: Bachelors degree 58% (275) 26% (124) 15% (72) 472Educ: Post-grad 61% (164) 27% (73) 12% (32) 268Income: Under 50k 50% (495) 28% (279) 22% (216) 989Income: 50k-100k 50% (303) 35% (210) 15% (89) 602Income: 100k+ 54% (215) 33% (132) 14% (55) 402Ethnicity: White 46% (739) 36% (574) 19% (299) 1613Ethnicity: Hispanic 49% (95) 28% (55) 23% (44) 193
Continued on next page

52
Morning ConsultTable POL1_8
Table POL1_8: Who do you trust more to handle each of the following issues?Education
Demographic Democrats in CongressRepublicans in
CongressDon’t know / No
opinion Total N
Registered Voters 51% (1013) 31% (620) 18% (361) 1994Ethnicity: Black 83% (211) 7% (19) 9% (23) 253Ethnicity: Other 49% (63) 21% (28) 30% (38) 128All Christian 45% (469) 39% (401) 16% (166) 1036All Non-Christian 64% (74) 18% (20) 19% (21) 115Atheist 83% (73) 12% (11) 5% (4) 88Agnostic/Nothing in particular 56% (251) 20% (88) 25% (112) 450Something Else 48% (147) 33% (100) 19% (57) 305Religious Non-Protestant/Catholic 59% (83) 23% (32) 18% (26) 141Evangelical 36% (196) 46% (251) 18% (100) 547Non-Evangelical 53% (397) 31% (230) 16% (116) 742Community: Urban 64% (374) 21% (121) 16% (91) 586Community: Suburban 51% (473) 31% (283) 18% (168) 924Community: Rural 34% (166) 45% (216) 21% (101) 484Employ: Private Sector 52% (343) 28% (189) 20% (131) 663Employ: Government 59% (71) 24% (29) 17% (20) 120Employ: Self-Employed 52% (91) 34% (60) 14% (24) 176Employ: Homemaker 39% (46) 44% (52) 17% (19) 118Employ: Student 65% (59) 22% (20) 13% (12) 91Employ: Retired 48% (254) 37% (196) 16% (85) 534Employ: Unemployed 46% (83) 26% (48) 28% (50) 182Employ: Other 59% (65) 24% (27) 17% (19) 111Military HH: Yes 50% (167) 33% (111) 17% (55) 333Military HH: No 51% (846) 31% (510) 18% (306) 1661RD/WT: Right Direction 77% (786) 8% (82) 15% (149) 1017RD/WT: Wrong Track 23% (227) 55% (539) 22% (211) 977Biden Job Approve 81% (913) 7% (78) 12% (135) 1127Biden Job Disapprove 10% (83) 68% (535) 22% (174) 792
Continued on next page
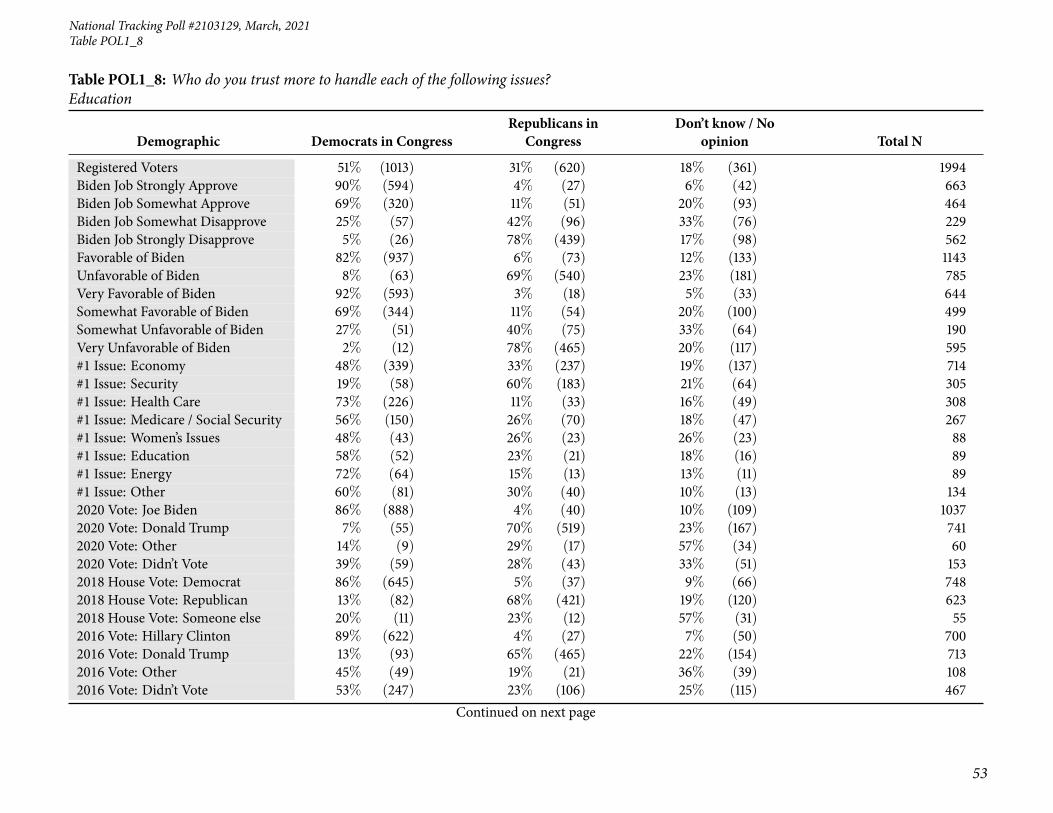
National Tracking Poll #2103129, March, 2021
53
Table POL1_8
Table POL1_8: Who do you trust more to handle each of the following issues?Education
Demographic Democrats in CongressRepublicans in
CongressDon’t know / No
opinion Total N
Registered Voters 51% (1013) 31% (620) 18% (361) 1994Biden Job Strongly Approve 90% (594) 4% (27) 6% (42) 663Biden Job Somewhat Approve 69% (320) 11% (51) 20% (93) 464Biden Job Somewhat Disapprove 25% (57) 42% (96) 33% (76) 229Biden Job Strongly Disapprove 5% (26) 78% (439) 17% (98) 562Favorable of Biden 82% (937) 6% (73) 12% (133) 1143Unfavorable of Biden 8% (63) 69% (540) 23% (181) 785Very Favorable of Biden 92% (593) 3% (18) 5% (33) 644Somewhat Favorable of Biden 69% (344) 11% (54) 20% (100) 499Somewhat Unfavorable of Biden 27% (51) 40% (75) 33% (64) 190Very Unfavorable of Biden 2% (12) 78% (465) 20% (117) 595#1 Issue: Economy 48% (339) 33% (237) 19% (137) 714#1 Issue: Security 19% (58) 60% (183) 21% (64) 305#1 Issue: Health Care 73% (226) 11% (33) 16% (49) 308#1 Issue: Medicare / Social Security 56% (150) 26% (70) 18% (47) 267#1 Issue: Women’s Issues 48% (43) 26% (23) 26% (23) 88#1 Issue: Education 58% (52) 23% (21) 18% (16) 89#1 Issue: Energy 72% (64) 15% (13) 13% (11) 89#1 Issue: Other 60% (81) 30% (40) 10% (13) 1342020 Vote: Joe Biden 86% (888) 4% (40) 10% (109) 10372020 Vote: Donald Trump 7% (55) 70% (519) 23% (167) 7412020 Vote: Other 14% (9) 29% (17) 57% (34) 602020 Vote: Didn’t Vote 39% (59) 28% (43) 33% (51) 1532018 House Vote: Democrat 86% (645) 5% (37) 9% (66) 7482018 House Vote: Republican 13% (82) 68% (421) 19% (120) 6232018 House Vote: Someone else 20% (11) 23% (12) 57% (31) 552016 Vote: Hillary Clinton 89% (622) 4% (27) 7% (50) 7002016 Vote: Donald Trump 13% (93) 65% (465) 22% (154) 7132016 Vote: Other 45% (49) 19% (21) 36% (39) 1082016 Vote: Didn’t Vote 53% (247) 23% (106) 25% (115) 467
Continued on next page

54
Morning ConsultTable POL1_8
Table POL1_8: Who do you trust more to handle each of the following issues?Education
Demographic Democrats in CongressRepublicans in
CongressDon’t know / No
opinion Total N
Registered Voters 51% (1013) 31% (620) 18% (361) 1994Voted in 2014: Yes 52% (662) 35% (443) 13% (170) 1275Voted in 2014: No 49% (351) 25% (178) 27% (191) 7194-Region: Northeast 56% (200) 27% (97) 17% (59) 3564-Region: Midwest 46% (212) 35% (162) 18% (84) 4584-Region: South 49% (363) 33% (249) 18% (133) 7444-Region: West 55% (239) 26% (114) 19% (83) 436Party: Democrat/Leans Democrat 87% (846) 4% (38) 9% (89) 973Party: Republican/Leans Republican 12% (90) 69% (526) 20% (151) 768Note: Row proportions may total to larger than one-hundred percent due to rounding. For more information visit MorningConsultIntelligence.com.
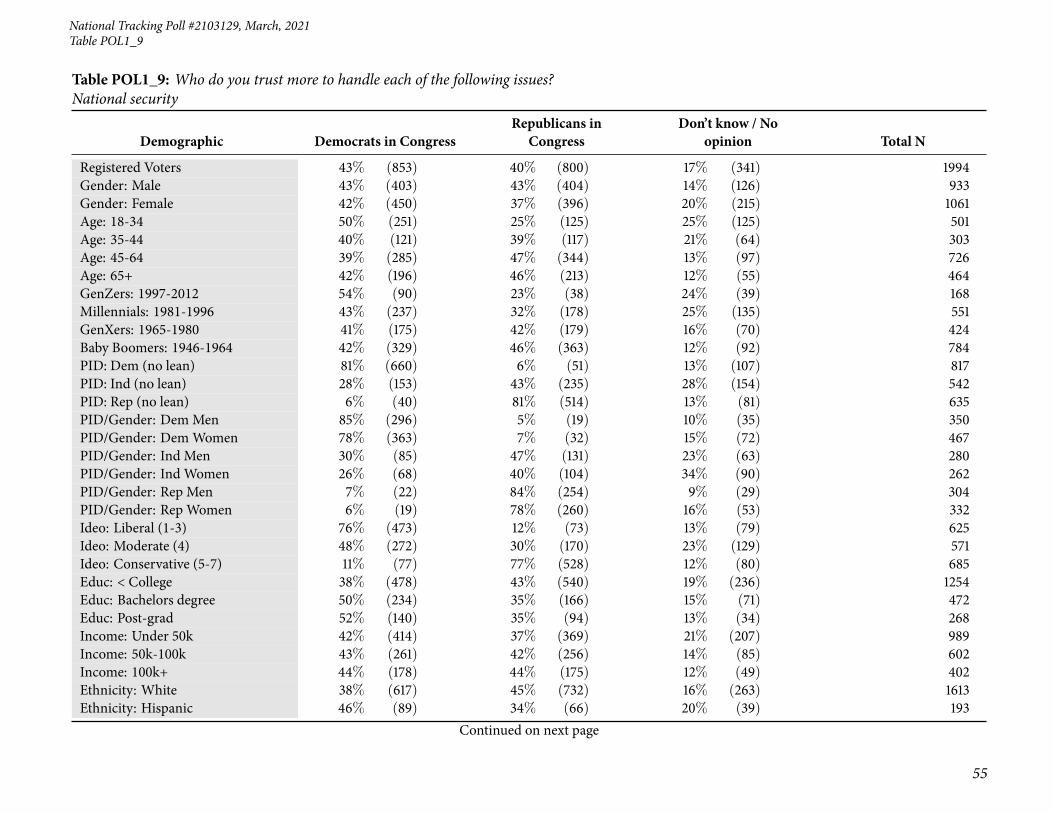
National Tracking Poll #2103129, March, 2021
55
Table POL1_9
Table POL1_9: Who do you trust more to handle each of the following issues?National security
Demographic Democrats in CongressRepublicans in
CongressDon’t know / No
opinion Total N
Registered Voters 43% (853) 40% (800) 17% (341) 1994Gender: Male 43% (403) 43% (404) 14% (126) 933Gender: Female 42% (450) 37% (396) 20% (215) 1061Age: 18-34 50% (251) 25% (125) 25% (125) 501Age: 35-44 40% (121) 39% (117) 21% (64) 303Age: 45-64 39% (285) 47% (344) 13% (97) 726Age: 65+ 42% (196) 46% (213) 12% (55) 464GenZers: 1997-2012 54% (90) 23% (38) 24% (39) 168Millennials: 1981-1996 43% (237) 32% (178) 25% (135) 551GenXers: 1965-1980 41% (175) 42% (179) 16% (70) 424Baby Boomers: 1946-1964 42% (329) 46% (363) 12% (92) 784PID: Dem (no lean) 81% (660) 6% (51) 13% (107) 817PID: Ind (no lean) 28% (153) 43% (235) 28% (154) 542PID: Rep (no lean) 6% (40) 81% (514) 13% (81) 635PID/Gender: DemMen 85% (296) 5% (19) 10% (35) 350PID/Gender: DemWomen 78% (363) 7% (32) 15% (72) 467PID/Gender: Ind Men 30% (85) 47% (131) 23% (63) 280PID/Gender: Ind Women 26% (68) 40% (104) 34% (90) 262PID/Gender: Rep Men 7% (22) 84% (254) 9% (29) 304PID/Gender: Rep Women 6% (19) 78% (260) 16% (53) 332Ideo: Liberal (1-3) 76% (473) 12% (73) 13% (79) 625Ideo: Moderate (4) 48% (272) 30% (170) 23% (129) 571Ideo: Conservative (5-7) 11% (77) 77% (528) 12% (80) 685Educ: < College 38% (478) 43% (540) 19% (236) 1254Educ: Bachelors degree 50% (234) 35% (166) 15% (71) 472Educ: Post-grad 52% (140) 35% (94) 13% (34) 268Income: Under 50k 42% (414) 37% (369) 21% (207) 989Income: 50k-100k 43% (261) 42% (256) 14% (85) 602Income: 100k+ 44% (178) 44% (175) 12% (49) 402Ethnicity: White 38% (617) 45% (732) 16% (263) 1613Ethnicity: Hispanic 46% (89) 34% (66) 20% (39) 193
Continued on next page

56
Morning ConsultTable POL1_9
Table POL1_9: Who do you trust more to handle each of the following issues?National security
Demographic Democrats in CongressRepublicans in
CongressDon’t know / No
opinion Total N
Registered Voters 43% (853) 40% (800) 17% (341) 1994Ethnicity: Black 72% (181) 11% (29) 17% (43) 253Ethnicity: Other 42% (54) 30% (39) 27% (35) 128All Christian 39% (404) 47% (487) 14% (145) 1036All Non-Christian 56% (65) 22% (25) 22% (25) 115Atheist 71% (62) 20% (17) 9% (8) 88Agnostic/Nothing in particular 46% (208) 31% (138) 23% (104) 450Something Else 37% (114) 43% (132) 19% (59) 305Religious Non-Protestant/Catholic 47% (66) 32% (45) 21% (30) 141Evangelical 32% (177) 52% (287) 15% (84) 547Non-Evangelical 44% (326) 41% (307) 15% (110) 742Community: Urban 57% (334) 28% (162) 15% (91) 586Community: Suburban 42% (387) 41% (381) 17% (156) 924Community: Rural 27% (132) 53% (257) 20% (95) 484Employ: Private Sector 45% (299) 37% (243) 18% (120) 663Employ: Government 47% (57) 31% (37) 22% (26) 120Employ: Self-Employed 45% (79) 42% (73) 14% (24) 176Employ: Homemaker 32% (38) 53% (63) 15% (17) 118Employ: Student 45% (41) 29% (26) 26% (24) 91Employ: Retired 43% (231) 46% (245) 11% (59) 534Employ: Unemployed 33% (60) 42% (76) 26% (46) 182Employ: Other 44% (49) 33% (37) 22% (25) 111Military HH: Yes 40% (133) 47% (157) 13% (43) 333Military HH: No 43% (720) 39% (643) 18% (298) 1661RD/WT: Right Direction 69% (704) 13% (133) 18% (180) 1017RD/WT: Wrong Track 15% (149) 68% (667) 16% (161) 977Biden Job Approve 70% (791) 13% (150) 17% (186) 1127Biden Job Disapprove 7% (53) 80% (634) 13% (105) 792
Continued on next page

National Tracking Poll #2103129, March, 2021
57
Table POL1_9
Table POL1_9: Who do you trust more to handle each of the following issues?National security
Demographic Democrats in CongressRepublicans in
CongressDon’t know / No
opinion Total N
Registered Voters 43% (853) 40% (800) 17% (341) 1994Biden Job Strongly Approve 83% (553) 7% (43) 10% (67) 663Biden Job Somewhat Approve 51% (238) 23% (107) 26% (119) 464Biden Job Somewhat Disapprove 16% (36) 60% (139) 24% (55) 229Biden Job Strongly Disapprove 3% (17) 88% (495) 9% (51) 562Favorable of Biden 71% (810) 13% (152) 16% (180) 1143Unfavorable of Biden 4% (35) 82% (640) 14% (110) 785Very Favorable of Biden 87% (563) 5% (30) 8% (51) 644Somewhat Favorable of Biden 50% (247) 24% (122) 26% (130) 499Somewhat Unfavorable of Biden 14% (26) 66% (125) 21% (39) 190Very Unfavorable of Biden 2% (9) 87% (515) 12% (70) 595#1 Issue: Economy 39% (280) 44% (313) 17% (121) 714#1 Issue: Security 16% (48) 73% (222) 11% (35) 305#1 Issue: Health Care 64% (197) 18% (56) 18% (55) 308#1 Issue: Medicare / Social Security 49% (132) 35% (93) 16% (42) 267#1 Issue: Women’s Issues 43% (38) 28% (24) 29% (26) 88#1 Issue: Education 44% (39) 30% (27) 26% (23) 89#1 Issue: Energy 60% (53) 17% (15) 23% (21) 89#1 Issue: Other 48% (65) 37% (50) 15% (20) 1342020 Vote: Joe Biden 76% (785) 9% (97) 15% (155) 10372020 Vote: Donald Trump 3% (19) 83% (615) 14% (107) 7412020 Vote: Other 5% (3) 42% (25) 53% (32) 602020 Vote: Didn’t Vote 29% (44) 40% (62) 31% (47) 1532018 House Vote: Democrat 78% (581) 10% (71) 13% (95) 7482018 House Vote: Republican 6% (40) 82% (512) 11% (70) 6232018 House Vote: Someone else 14% (8) 33% (18) 53% (29) 552016 Vote: Hillary Clinton 79% (556) 7% (51) 13% (92) 7002016 Vote: Donald Trump 6% (45) 80% (572) 13% (96) 7132016 Vote: Other 33% (36) 35% (38) 31% (34) 1082016 Vote: Didn’t Vote 45% (211) 29% (138) 25% (119) 467
Continued on next page
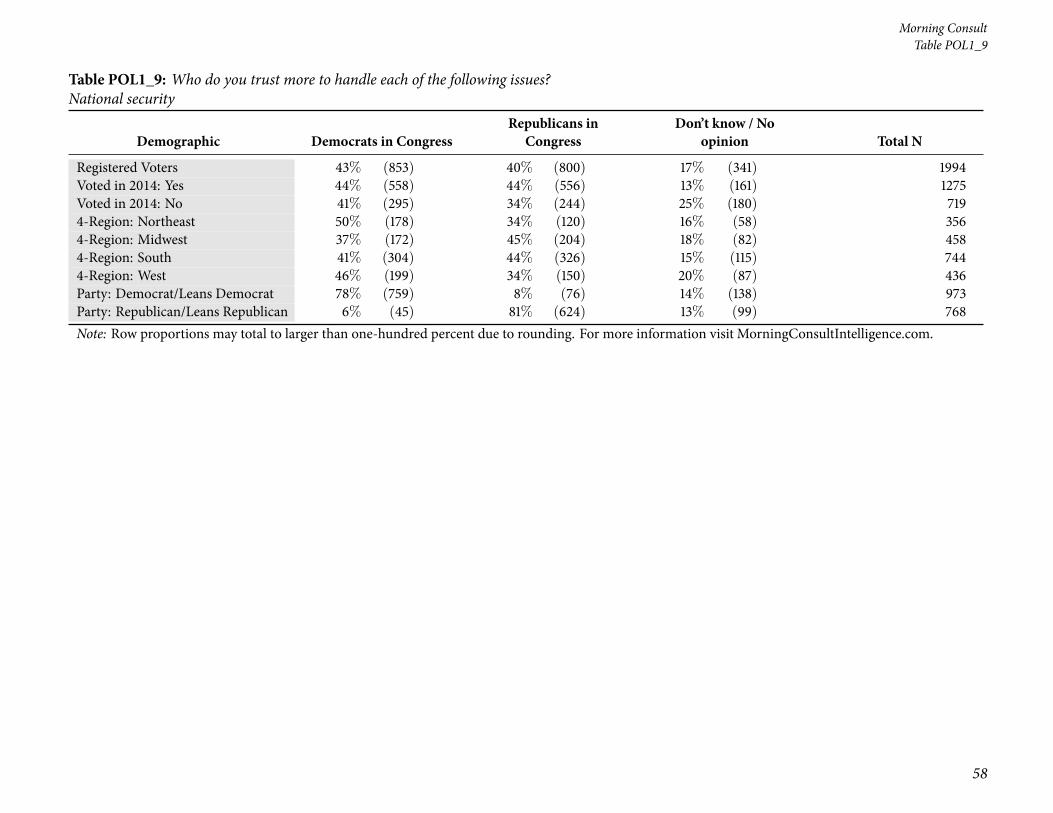
58
Morning ConsultTable POL1_9
Table POL1_9: Who do you trust more to handle each of the following issues?National security
Demographic Democrats in CongressRepublicans in
CongressDon’t know / No
opinion Total N
Registered Voters 43% (853) 40% (800) 17% (341) 1994Voted in 2014: Yes 44% (558) 44% (556) 13% (161) 1275Voted in 2014: No 41% (295) 34% (244) 25% (180) 7194-Region: Northeast 50% (178) 34% (120) 16% (58) 3564-Region: Midwest 37% (172) 45% (204) 18% (82) 4584-Region: South 41% (304) 44% (326) 15% (115) 7444-Region: West 46% (199) 34% (150) 20% (87) 436Party: Democrat/Leans Democrat 78% (759) 8% (76) 14% (138) 973Party: Republican/Leans Republican 6% (45) 81% (624) 13% (99) 768Note: Row proportions may total to larger than one-hundred percent due to rounding. For more information visit MorningConsultIntelligence.com.

National Tracking Poll #2103129, March, 2021
59
Table POL1_10
Table POL1_10: Who do you trust more to handle each of the following issues?Gun policy
Demographic Democrats in CongressRepublicans in
CongressDon’t know / No
opinion Total N
Registered Voters 45% (889) 38% (758) 17% (347) 1994Gender: Male 42% (396) 42% (397) 15% (141) 933Gender: Female 46% (492) 34% (362) 19% (207) 1061Age: 18-34 54% (268) 23% (116) 23% (116) 501Age: 35-44 39% (119) 40% (120) 21% (64) 303Age: 45-64 42% (303) 44% (317) 15% (107) 726Age: 65+ 43% (198) 44% (205) 13% (61) 464GenZers: 1997-2012 63% (105) 14% (24) 23% (38) 168Millennials: 1981-1996 44% (242) 33% (182) 23% (127) 551GenXers: 1965-1980 44% (185) 39% (167) 17% (73) 424Baby Boomers: 1946-1964 43% (336) 44% (345) 13% (103) 784PID: Dem (no lean) 80% (657) 6% (48) 14% (111) 817PID: Ind (no lean) 34% (182) 39% (213) 27% (148) 542PID: Rep (no lean) 8% (50) 78% (497) 14% (88) 635PID/Gender: DemMen 78% (273) 8% (30) 13% (47) 350PID/Gender: DemWomen 82% (384) 4% (19) 14% (65) 467PID/Gender: Ind Men 34% (95) 46% (127) 21% (58) 280PID/Gender: Ind Women 33% (87) 33% (85) 34% (90) 262PID/Gender: Rep Men 9% (28) 79% (239) 12% (36) 304PID/Gender: Rep Women 7% (22) 78% (258) 16% (52) 332Ideo: Liberal (1-3) 81% (504) 10% (62) 10% (60) 625Ideo: Moderate (4) 47% (267) 30% (172) 23% (132) 571Ideo: Conservative (5-7) 12% (81) 74% (506) 14% (98) 685Educ: < College 39% (486) 42% (527) 19% (241) 1254Educ: Bachelors degree 54% (253) 32% (151) 14% (68) 472Educ: Post-grad 56% (150) 30% (80) 14% (38) 268Income: Under 50k 43% (426) 36% (355) 21% (209) 989Income: 50k-100k 44% (263) 42% (254) 14% (86) 602Income: 100k+ 50% (200) 37% (149) 13% (53) 402Ethnicity: White 40% (638) 43% (698) 17% (277) 1613Ethnicity: Hispanic 52% (100) 27% (52) 21% (41) 193
Continued on next page

60
Morning ConsultTable POL1_10
Table POL1_10: Who do you trust more to handle each of the following issues?Gun policy
Demographic Democrats in CongressRepublicans in
CongressDon’t know / No
opinion Total N
Registered Voters 45% (889) 38% (758) 17% (347) 1994Ethnicity: Black 76% (192) 11% (29) 12% (31) 253Ethnicity: Other 45% (58) 24% (31) 30% (39) 128All Christian 39% (407) 46% (472) 15% (157) 1036All Non-Christian 57% (65) 18% (21) 25% (29) 115Atheist 74% (65) 19% (17) 7% (6) 88Agnostic/Nothing in particular 50% (224) 29% (129) 22% (97) 450Something Else 42% (128) 39% (119) 19% (58) 305Religious Non-Protestant/Catholic 51% (72) 27% (38) 22% (30) 141Evangelical 32% (175) 50% (276) 18% (97) 547Non-Evangelical 45% (335) 39% (291) 16% (116) 742Community: Urban 57% (337) 25% (149) 17% (101) 586Community: Suburban 45% (418) 38% (354) 16% (152) 924Community: Rural 28% (134) 53% (256) 20% (94) 484Employ: Private Sector 46% (307) 36% (237) 18% (118) 663Employ: Government 55% (66) 28% (34) 17% (21) 120Employ: Self-Employed 44% (78) 40% (70) 16% (28) 176Employ: Homemaker 32% (37) 50% (59) 18% (21) 118Employ: Student 66% (60) 16% (15) 18% (16) 91Employ: Retired 42% (222) 44% (238) 14% (75) 534Employ: Unemployed 37% (67) 37% (68) 26% (47) 182Employ: Other 47% (52) 33% (37) 20% (22) 111Military HH: Yes 39% (129) 48% (161) 13% (43) 333Military HH: No 46% (760) 36% (597) 18% (304) 1661RD/WT: Right Direction 69% (701) 13% (129) 18% (187) 1017RD/WT: Wrong Track 19% (187) 64% (629) 16% (160) 977Biden Job Approve 72% (812) 12% (134) 16% (181) 1127Biden Job Disapprove 9% (68) 76% (603) 15% (121) 792
Continued on next page

National Tracking Poll #2103129, March, 2021
61
Table POL1_10
Table POL1_10: Who do you trust more to handle each of the following issues?Gun policy
Demographic Democrats in CongressRepublicans in
CongressDon’t know / No
opinion Total N
Registered Voters 45% (889) 38% (758) 17% (347) 1994Biden Job Strongly Approve 81% (538) 8% (52) 11% (73) 663Biden Job Somewhat Approve 59% (275) 18% (82) 23% (107) 464Biden Job Somewhat Disapprove 21% (48) 53% (120) 27% (61) 229Biden Job Strongly Disapprove 4% (20) 86% (483) 11% (59) 562Favorable of Biden 72% (828) 11% (131) 16% (183) 1143Unfavorable of Biden 6% (50) 79% (619) 15% (115) 785Very Favorable of Biden 84% (543) 7% (42) 9% (59) 644Somewhat Favorable of Biden 57% (285) 18% (90) 25% (124) 499Somewhat Unfavorable of Biden 17% (32) 59% (111) 24% (46) 190Very Unfavorable of Biden 3% (18) 85% (508) 12% (69) 595#1 Issue: Economy 41% (293) 42% (301) 17% (119) 714#1 Issue: Security 15% (47) 69% (210) 16% (48) 305#1 Issue: Health Care 66% (203) 18% (54) 16% (50) 308#1 Issue: Medicare / Social Security 47% (126) 35% (93) 18% (49) 267#1 Issue: Women’s Issues 46% (41) 28% (25) 26% (23) 88#1 Issue: Education 55% (49) 18% (16) 27% (24) 89#1 Issue: Energy 67% (60) 16% (14) 17% (15) 89#1 Issue: Other 52% (70) 34% (46) 14% (18) 1342020 Vote: Joe Biden 77% (796) 8% (85) 15% (156) 10372020 Vote: Donald Trump 4% (27) 81% (599) 16% (116) 7412020 Vote: Other 12% (7) 40% (24) 48% (29) 602020 Vote: Didn’t Vote 37% (56) 32% (50) 31% (47) 1532018 House Vote: Democrat 80% (595) 8% (61) 12% (92) 7482018 House Vote: Republican 8% (49) 80% (496) 13% (78) 6232018 House Vote: Someone else 14% (8) 35% (19) 51% (28) 552016 Vote: Hillary Clinton 80% (562) 7% (50) 13% (88) 7002016 Vote: Donald Trump 9% (64) 76% (538) 15% (110) 7132016 Vote: Other 31% (34) 38% (41) 31% (34) 1082016 Vote: Didn’t Vote 48% (224) 27% (128) 25% (115) 467
Continued on next page

62
Morning ConsultTable POL1_10
Table POL1_10: Who do you trust more to handle each of the following issues?Gun policy
Demographic Democrats in CongressRepublicans in
CongressDon’t know / No
opinion Total N
Registered Voters 45% (889) 38% (758) 17% (347) 1994Voted in 2014: Yes 44% (562) 42% (534) 14% (179) 1275Voted in 2014: No 45% (327) 31% (224) 23% (169) 7194-Region: Northeast 52% (185) 29% (104) 19% (67) 3564-Region: Midwest 38% (174) 44% (199) 18% (85) 4584-Region: South 44% (328) 40% (297) 16% (119) 7444-Region: West 46% (202) 36% (158) 17% (76) 436Party: Democrat/Leans Democrat 79% (770) 7% (64) 14% (138) 973Party: Republican/Leans Republican 8% (59) 78% (601) 14% (108) 768Note: Row proportions may total to larger than one-hundred percent due to rounding. For more information visit MorningConsultIntelligence.com.
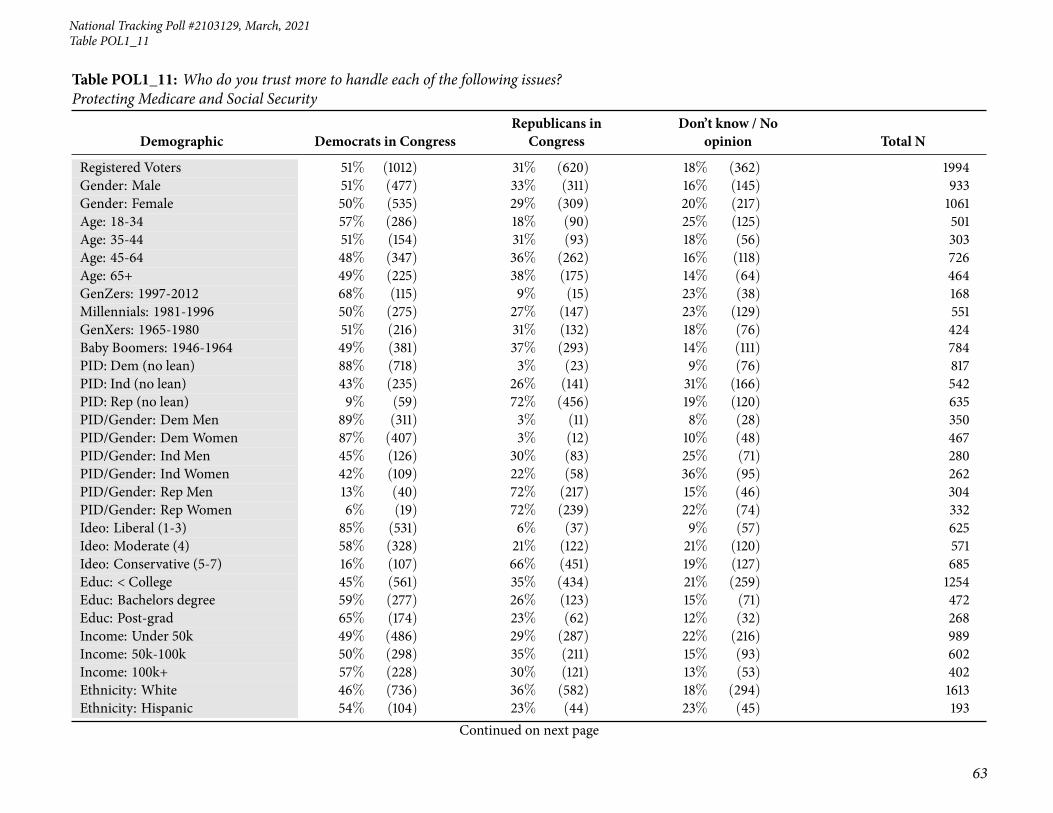
National Tracking Poll #2103129, March, 2021
63
Table POL1_11
Table POL1_11: Who do you trust more to handle each of the following issues?Protecting Medicare and Social Security
Demographic Democrats in CongressRepublicans in
CongressDon’t know / No
opinion Total N
Registered Voters 51% (1012) 31% (620) 18% (362) 1994Gender: Male 51% (477) 33% (311) 16% (145) 933Gender: Female 50% (535) 29% (309) 20% (217) 1061Age: 18-34 57% (286) 18% (90) 25% (125) 501Age: 35-44 51% (154) 31% (93) 18% (56) 303Age: 45-64 48% (347) 36% (262) 16% (118) 726Age: 65+ 49% (225) 38% (175) 14% (64) 464GenZers: 1997-2012 68% (115) 9% (15) 23% (38) 168Millennials: 1981-1996 50% (275) 27% (147) 23% (129) 551GenXers: 1965-1980 51% (216) 31% (132) 18% (76) 424Baby Boomers: 1946-1964 49% (381) 37% (293) 14% (111) 784PID: Dem (no lean) 88% (718) 3% (23) 9% (76) 817PID: Ind (no lean) 43% (235) 26% (141) 31% (166) 542PID: Rep (no lean) 9% (59) 72% (456) 19% (120) 635PID/Gender: DemMen 89% (311) 3% (11) 8% (28) 350PID/Gender: DemWomen 87% (407) 3% (12) 10% (48) 467PID/Gender: Ind Men 45% (126) 30% (83) 25% (71) 280PID/Gender: Ind Women 42% (109) 22% (58) 36% (95) 262PID/Gender: Rep Men 13% (40) 72% (217) 15% (46) 304PID/Gender: Rep Women 6% (19) 72% (239) 22% (74) 332Ideo: Liberal (1-3) 85% (531) 6% (37) 9% (57) 625Ideo: Moderate (4) 58% (328) 21% (122) 21% (120) 571Ideo: Conservative (5-7) 16% (107) 66% (451) 19% (127) 685Educ: < College 45% (561) 35% (434) 21% (259) 1254Educ: Bachelors degree 59% (277) 26% (123) 15% (71) 472Educ: Post-grad 65% (174) 23% (62) 12% (32) 268Income: Under 50k 49% (486) 29% (287) 22% (216) 989Income: 50k-100k 50% (298) 35% (211) 15% (93) 602Income: 100k+ 57% (228) 30% (121) 13% (53) 402Ethnicity: White 46% (736) 36% (582) 18% (294) 1613Ethnicity: Hispanic 54% (104) 23% (44) 23% (45) 193
Continued on next page
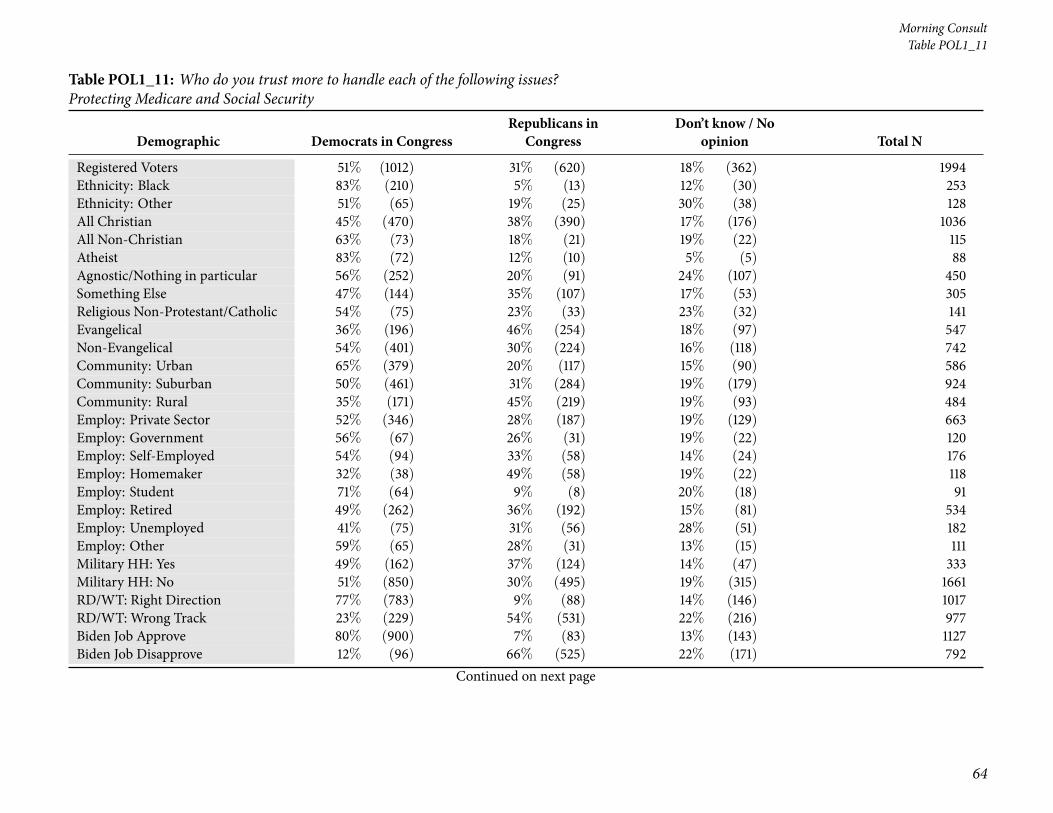
64
Morning ConsultTable POL1_11
Table POL1_11: Who do you trust more to handle each of the following issues?Protecting Medicare and Social Security
Demographic Democrats in CongressRepublicans in
CongressDon’t know / No
opinion Total N
Registered Voters 51% (1012) 31% (620) 18% (362) 1994Ethnicity: Black 83% (210) 5% (13) 12% (30) 253Ethnicity: Other 51% (65) 19% (25) 30% (38) 128All Christian 45% (470) 38% (390) 17% (176) 1036All Non-Christian 63% (73) 18% (21) 19% (22) 115Atheist 83% (72) 12% (10) 5% (5) 88Agnostic/Nothing in particular 56% (252) 20% (91) 24% (107) 450Something Else 47% (144) 35% (107) 17% (53) 305Religious Non-Protestant/Catholic 54% (75) 23% (33) 23% (32) 141Evangelical 36% (196) 46% (254) 18% (97) 547Non-Evangelical 54% (401) 30% (224) 16% (118) 742Community: Urban 65% (379) 20% (117) 15% (90) 586Community: Suburban 50% (461) 31% (284) 19% (179) 924Community: Rural 35% (171) 45% (219) 19% (93) 484Employ: Private Sector 52% (346) 28% (187) 19% (129) 663Employ: Government 56% (67) 26% (31) 19% (22) 120Employ: Self-Employed 54% (94) 33% (58) 14% (24) 176Employ: Homemaker 32% (38) 49% (58) 19% (22) 118Employ: Student 71% (64) 9% (8) 20% (18) 91Employ: Retired 49% (262) 36% (192) 15% (81) 534Employ: Unemployed 41% (75) 31% (56) 28% (51) 182Employ: Other 59% (65) 28% (31) 13% (15) 111Military HH: Yes 49% (162) 37% (124) 14% (47) 333Military HH: No 51% (850) 30% (495) 19% (315) 1661RD/WT: Right Direction 77% (783) 9% (88) 14% (146) 1017RD/WT: Wrong Track 23% (229) 54% (531) 22% (216) 977Biden Job Approve 80% (900) 7% (83) 13% (143) 1127Biden Job Disapprove 12% (96) 66% (525) 22% (171) 792
Continued on next page
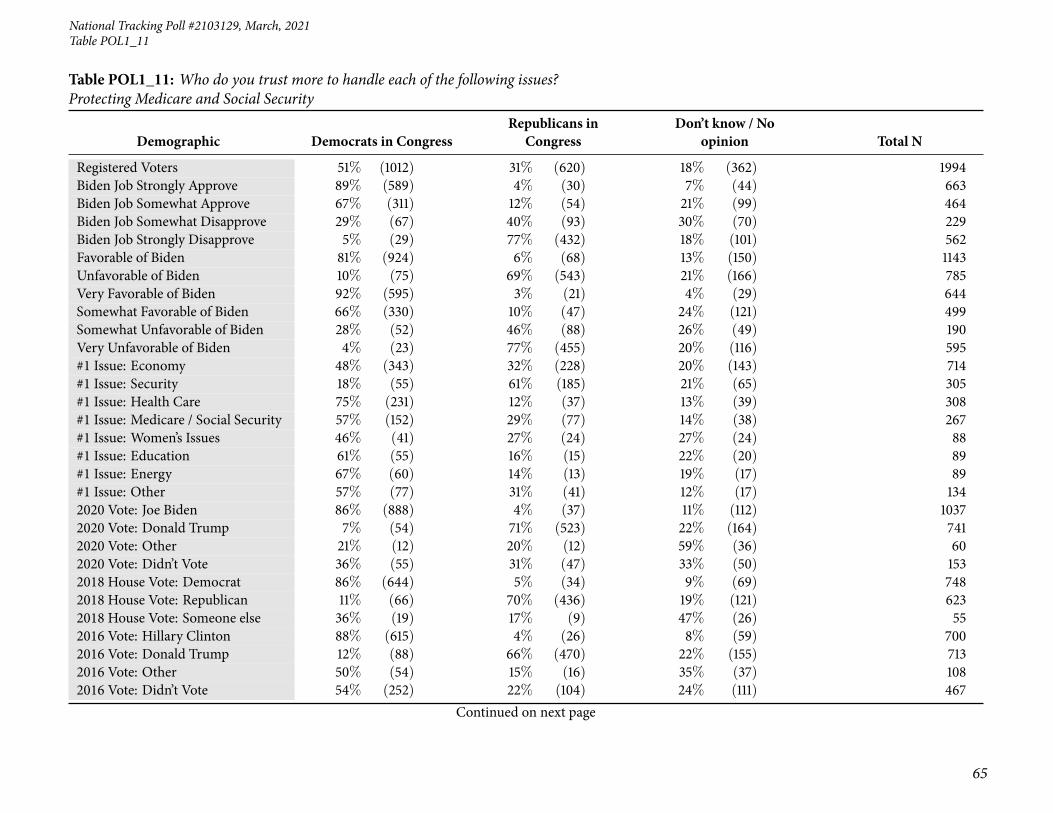
National Tracking Poll #2103129, March, 2021
65
Table POL1_11
Table POL1_11: Who do you trust more to handle each of the following issues?Protecting Medicare and Social Security
Demographic Democrats in CongressRepublicans in
CongressDon’t know / No
opinion Total N
Registered Voters 51% (1012) 31% (620) 18% (362) 1994Biden Job Strongly Approve 89% (589) 4% (30) 7% (44) 663Biden Job Somewhat Approve 67% (311) 12% (54) 21% (99) 464Biden Job Somewhat Disapprove 29% (67) 40% (93) 30% (70) 229Biden Job Strongly Disapprove 5% (29) 77% (432) 18% (101) 562Favorable of Biden 81% (924) 6% (68) 13% (150) 1143Unfavorable of Biden 10% (75) 69% (543) 21% (166) 785Very Favorable of Biden 92% (595) 3% (21) 4% (29) 644Somewhat Favorable of Biden 66% (330) 10% (47) 24% (121) 499Somewhat Unfavorable of Biden 28% (52) 46% (88) 26% (49) 190Very Unfavorable of Biden 4% (23) 77% (455) 20% (116) 595#1 Issue: Economy 48% (343) 32% (228) 20% (143) 714#1 Issue: Security 18% (55) 61% (185) 21% (65) 305#1 Issue: Health Care 75% (231) 12% (37) 13% (39) 308#1 Issue: Medicare / Social Security 57% (152) 29% (77) 14% (38) 267#1 Issue: Women’s Issues 46% (41) 27% (24) 27% (24) 88#1 Issue: Education 61% (55) 16% (15) 22% (20) 89#1 Issue: Energy 67% (60) 14% (13) 19% (17) 89#1 Issue: Other 57% (77) 31% (41) 12% (17) 1342020 Vote: Joe Biden 86% (888) 4% (37) 11% (112) 10372020 Vote: Donald Trump 7% (54) 71% (523) 22% (164) 7412020 Vote: Other 21% (12) 20% (12) 59% (36) 602020 Vote: Didn’t Vote 36% (55) 31% (47) 33% (50) 1532018 House Vote: Democrat 86% (644) 5% (34) 9% (69) 7482018 House Vote: Republican 11% (66) 70% (436) 19% (121) 6232018 House Vote: Someone else 36% (19) 17% (9) 47% (26) 552016 Vote: Hillary Clinton 88% (615) 4% (26) 8% (59) 7002016 Vote: Donald Trump 12% (88) 66% (470) 22% (155) 7132016 Vote: Other 50% (54) 15% (16) 35% (37) 1082016 Vote: Didn’t Vote 54% (252) 22% (104) 24% (111) 467
Continued on next page

66
Morning ConsultTable POL1_11
Table POL1_11: Who do you trust more to handle each of the following issues?Protecting Medicare and Social Security
Demographic Democrats in CongressRepublicans in
CongressDon’t know / No
opinion Total N
Registered Voters 51% (1012) 31% (620) 18% (362) 1994Voted in 2014: Yes 51% (649) 35% (445) 14% (181) 1275Voted in 2014: No 51% (363) 24% (174) 25% (181) 7194-Region: Northeast 56% (199) 28% (98) 17% (59) 3564-Region: Midwest 45% (207) 34% (157) 21% (94) 4584-Region: South 50% (376) 34% (252) 16% (116) 7444-Region: West 53% (230) 26% (113) 21% (93) 436Party: Democrat/Leans Democrat 87% (850) 3% (30) 10% (93) 973Party: Republican/Leans Republican 9% (70) 71% (542) 20% (156) 768Note: Row proportions may total to larger than one-hundred percent due to rounding. For more information visit MorningConsultIntelligence.com.
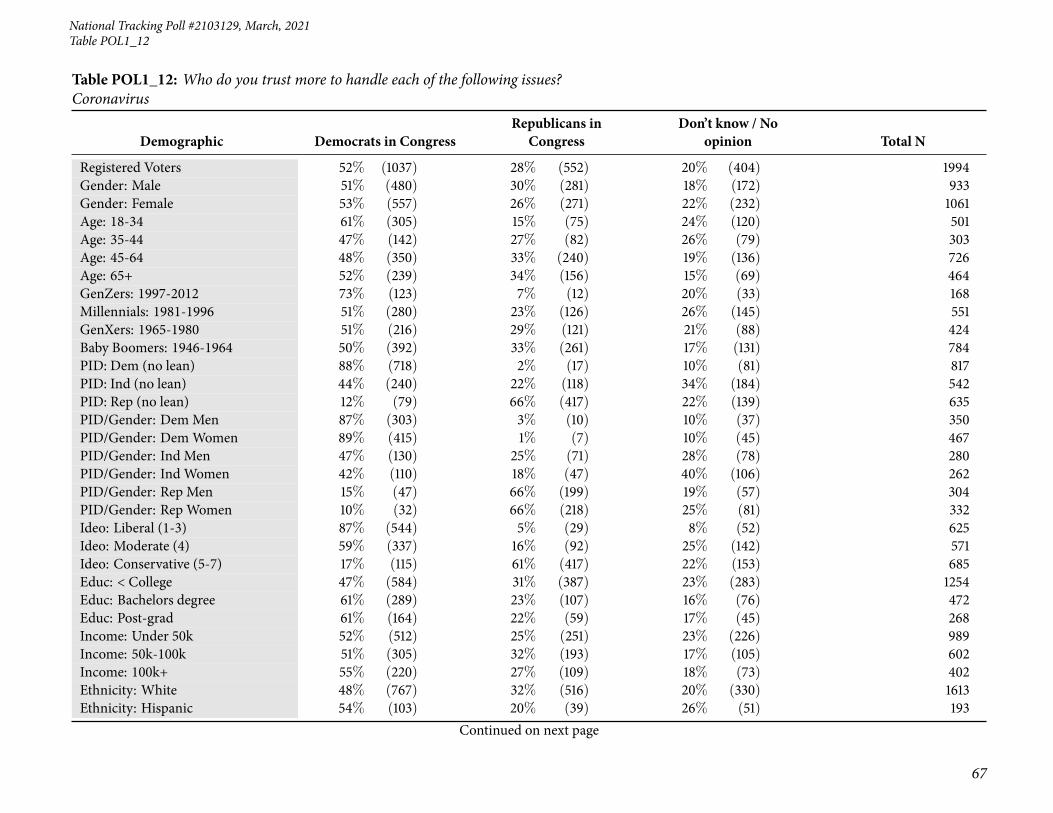
National Tracking Poll #2103129, March, 2021
67
Table POL1_12
Table POL1_12: Who do you trust more to handle each of the following issues?Coronavirus
Demographic Democrats in CongressRepublicans in
CongressDon’t know / No
opinion Total N
Registered Voters 52% (1037) 28% (552) 20% (404) 1994Gender: Male 51% (480) 30% (281) 18% (172) 933Gender: Female 53% (557) 26% (271) 22% (232) 1061Age: 18-34 61% (305) 15% (75) 24% (120) 501Age: 35-44 47% (142) 27% (82) 26% (79) 303Age: 45-64 48% (350) 33% (240) 19% (136) 726Age: 65+ 52% (239) 34% (156) 15% (69) 464GenZers: 1997-2012 73% (123) 7% (12) 20% (33) 168Millennials: 1981-1996 51% (280) 23% (126) 26% (145) 551GenXers: 1965-1980 51% (216) 29% (121) 21% (88) 424Baby Boomers: 1946-1964 50% (392) 33% (261) 17% (131) 784PID: Dem (no lean) 88% (718) 2% (17) 10% (81) 817PID: Ind (no lean) 44% (240) 22% (118) 34% (184) 542PID: Rep (no lean) 12% (79) 66% (417) 22% (139) 635PID/Gender: DemMen 87% (303) 3% (10) 10% (37) 350PID/Gender: DemWomen 89% (415) 1% (7) 10% (45) 467PID/Gender: Ind Men 47% (130) 25% (71) 28% (78) 280PID/Gender: Ind Women 42% (110) 18% (47) 40% (106) 262PID/Gender: Rep Men 15% (47) 66% (199) 19% (57) 304PID/Gender: Rep Women 10% (32) 66% (218) 25% (81) 332Ideo: Liberal (1-3) 87% (544) 5% (29) 8% (52) 625Ideo: Moderate (4) 59% (337) 16% (92) 25% (142) 571Ideo: Conservative (5-7) 17% (115) 61% (417) 22% (153) 685Educ: < College 47% (584) 31% (387) 23% (283) 1254Educ: Bachelors degree 61% (289) 23% (107) 16% (76) 472Educ: Post-grad 61% (164) 22% (59) 17% (45) 268Income: Under 50k 52% (512) 25% (251) 23% (226) 989Income: 50k-100k 51% (305) 32% (193) 17% (105) 602Income: 100k+ 55% (220) 27% (109) 18% (73) 402Ethnicity: White 48% (767) 32% (516) 20% (330) 1613Ethnicity: Hispanic 54% (103) 20% (39) 26% (51) 193
Continued on next page

68
Morning ConsultTable POL1_12
Table POL1_12: Who do you trust more to handle each of the following issues?Coronavirus
Demographic Democrats in CongressRepublicans in
CongressDon’t know / No
opinion Total N
Registered Voters 52% (1037) 28% (552) 20% (404) 1994Ethnicity: Black 81% (204) 5% (12) 15% (37) 253Ethnicity: Other 52% (67) 19% (25) 29% (37) 128All Christian 47% (489) 34% (348) 19% (198) 1036All Non-Christian 64% (74) 16% (18) 20% (23) 115Atheist 77% (67) 15% (13) 8% (7) 88Agnostic/Nothing in particular 57% (257) 18% (80) 25% (113) 450Something Else 49% (148) 31% (93) 21% (63) 305Religious Non-Protestant/Catholic 57% (80) 20% (28) 23% (32) 141Evangelical 36% (198) 41% (223) 23% (126) 547Non-Evangelical 56% (417) 27% (204) 16% (122) 742Community: Urban 64% (373) 18% (106) 18% (107) 586Community: Suburban 53% (494) 27% (252) 19% (178) 924Community: Rural 35% (170) 40% (194) 25% (120) 484Employ: Private Sector 53% (349) 25% (165) 22% (149) 663Employ: Government 54% (65) 24% (29) 22% (26) 120Employ: Self-Employed 55% (97) 27% (48) 18% (31) 176Employ: Homemaker 39% (46) 44% (52) 17% (20) 118Employ: Student 69% (62) 11% (10) 21% (19) 91Employ: Retired 51% (274) 34% (181) 15% (79) 534Employ: Unemployed 47% (86) 22% (40) 31% (56) 182Employ: Other 53% (59) 25% (28) 22% (24) 111Military HH: Yes 52% (172) 31% (104) 17% (56) 333Military HH: No 52% (865) 27% (448) 21% (348) 1661RD/WT: Right Direction 79% (807) 6% (63) 14% (147) 1017RD/WT: Wrong Track 24% (230) 50% (490) 26% (257) 977Biden Job Approve 82% (925) 5% (56) 13% (146) 1127Biden Job Disapprove 12% (95) 62% (490) 26% (206) 792
Continued on next page

National Tracking Poll #2103129, March, 2021
69
Table POL1_12
Table POL1_12: Who do you trust more to handle each of the following issues?Coronavirus
Demographic Democrats in CongressRepublicans in
CongressDon’t know / No
opinion Total N
Registered Voters 52% (1037) 28% (552) 20% (404) 1994Biden Job Strongly Approve 89% (590) 4% (23) 8% (50) 663Biden Job Somewhat Approve 72% (335) 7% (32) 21% (97) 464Biden Job Somewhat Disapprove 32% (73) 32% (73) 36% (83) 229Biden Job Strongly Disapprove 4% (22) 74% (417) 22% (124) 562Favorable of Biden 84% (958) 4% (44) 12% (141) 1143Unfavorable of Biden 9% (70) 64% (503) 27% (212) 785Very Favorable of Biden 91% (589) 2% (14) 6% (41) 644Somewhat Favorable of Biden 74% (369) 6% (30) 20% (100) 499Somewhat Unfavorable of Biden 26% (49) 38% (72) 36% (69) 190Very Unfavorable of Biden 3% (21) 72% (431) 24% (143) 595#1 Issue: Economy 45% (324) 29% (210) 25% (179) 714#1 Issue: Security 19% (59) 58% (177) 22% (68) 305#1 Issue: Health Care 78% (239) 7% (23) 15% (46) 308#1 Issue: Medicare / Social Security 60% (161) 22% (59) 18% (47) 267#1 Issue: Women’s Issues 57% (50) 22% (20) 21% (18) 88#1 Issue: Education 66% (59) 16% (14) 18% (16) 89#1 Issue: Energy 69% (61) 15% (13) 17% (15) 89#1 Issue: Other 61% (83) 27% (37) 11% (15) 1342020 Vote: Joe Biden 87% (902) 2% (22) 11% (112) 10372020 Vote: Donald Trump 8% (56) 66% (492) 26% (193) 7412020 Vote: Other 22% (13) 14% (9) 64% (38) 602020 Vote: Didn’t Vote 41% (63) 19% (30) 39% (60) 1532018 House Vote: Democrat 87% (653) 3% (25) 9% (70) 7482018 House Vote: Republican 12% (75) 65% (403) 23% (144) 6232018 House Vote: Someone else 28% (15) 20% (11) 53% (29) 552016 Vote: Hillary Clinton 90% (629) 3% (22) 7% (49) 7002016 Vote: Donald Trump 13% (95) 62% (441) 25% (177) 7132016 Vote: Other 50% (54) 13% (14) 36% (39) 1082016 Vote: Didn’t Vote 55% (256) 16% (74) 29% (136) 467
Continued on next page

70
Morning ConsultTable POL1_12
Table POL1_12: Who do you trust more to handle each of the following issues?Coronavirus
Demographic Democrats in CongressRepublicans in
CongressDon’t know / No
opinion Total N
Registered Voters 52% (1037) 28% (552) 20% (404) 1994Voted in 2014: Yes 51% (654) 32% (412) 16% (209) 1275Voted in 2014: No 53% (383) 20% (141) 27% (195) 7194-Region: Northeast 55% (196) 24% (85) 21% (74) 3564-Region: Midwest 50% (227) 32% (147) 18% (84) 4584-Region: South 51% (378) 30% (222) 19% (145) 7444-Region: West 54% (236) 22% (98) 23% (102) 436Party: Democrat/Leans Democrat 88% (852) 2% (22) 10% (99) 973Party: Republican/Leans Republican 12% (92) 65% (497) 23% (180) 768Note: Row proportions may total to larger than one-hundred percent due to rounding. For more information visit MorningConsultIntelligence.com.

National Tracking Poll #2103129, March, 2021
71
Table POL1_13
Table POL1_13: Who do you trust more to handle each of the following issues?Voting rights
Demographic Democrats in CongressRepublicans in
CongressDon’t know / No
opinion Total N
Registered Voters 49% (980) 33% (656) 18% (358) 1994Gender: Male 50% (464) 36% (332) 15% (138) 933Gender: Female 49% (516) 31% (325) 21% (220) 1061Age: 18-34 56% (282) 20% (102) 23% (117) 501Age: 35-44 45% (135) 32% (96) 24% (71) 303Age: 45-64 48% (349) 37% (266) 15% (111) 726Age: 65+ 46% (214) 41% (192) 13% (59) 464GenZers: 1997-2012 66% (110) 11% (19) 23% (39) 168Millennials: 1981-1996 48% (262) 28% (156) 24% (132) 551GenXers: 1965-1980 49% (207) 32% (134) 20% (83) 424Baby Boomers: 1946-1964 48% (376) 40% (311) 12% (98) 784PID: Dem (no lean) 87% (711) 4% (31) 9% (75) 817PID: Ind (no lean) 40% (214) 29% (155) 32% (173) 542PID: Rep (no lean) 9% (54) 74% (470) 17% (110) 635PID/Gender: DemMen 88% (307) 5% (17) 7% (26) 350PID/Gender: DemWomen 87% (404) 3% (13) 11% (49) 467PID/Gender: Ind Men 42% (116) 32% (91) 26% (73) 280PID/Gender: Ind Women 37% (98) 25% (64) 38% (100) 262PID/Gender: Rep Men 13% (41) 74% (224) 13% (39) 304PID/Gender: Rep Women 4% (14) 74% (247) 21% (71) 332Ideo: Liberal (1-3) 85% (532) 7% (41) 8% (52) 625Ideo: Moderate (4) 54% (311) 22% (128) 23% (132) 571Ideo: Conservative (5-7) 15% (100) 70% (482) 15% (104) 685Educ: < College 44% (546) 36% (446) 21% (262) 1254Educ: Bachelors degree 57% (269) 30% (141) 13% (62) 472Educ: Post-grad 61% (165) 26% (69) 13% (34) 268Income: Under 50k 48% (476) 29% (290) 23% (224) 989Income: 50k-100k 48% (291) 39% (236) 13% (76) 602Income: 100k+ 53% (212) 33% (131) 15% (59) 402Ethnicity: White 44% (709) 38% (616) 18% (287) 1613Ethnicity: Hispanic 50% (96) 24% (47) 26% (49) 193
Continued on next page
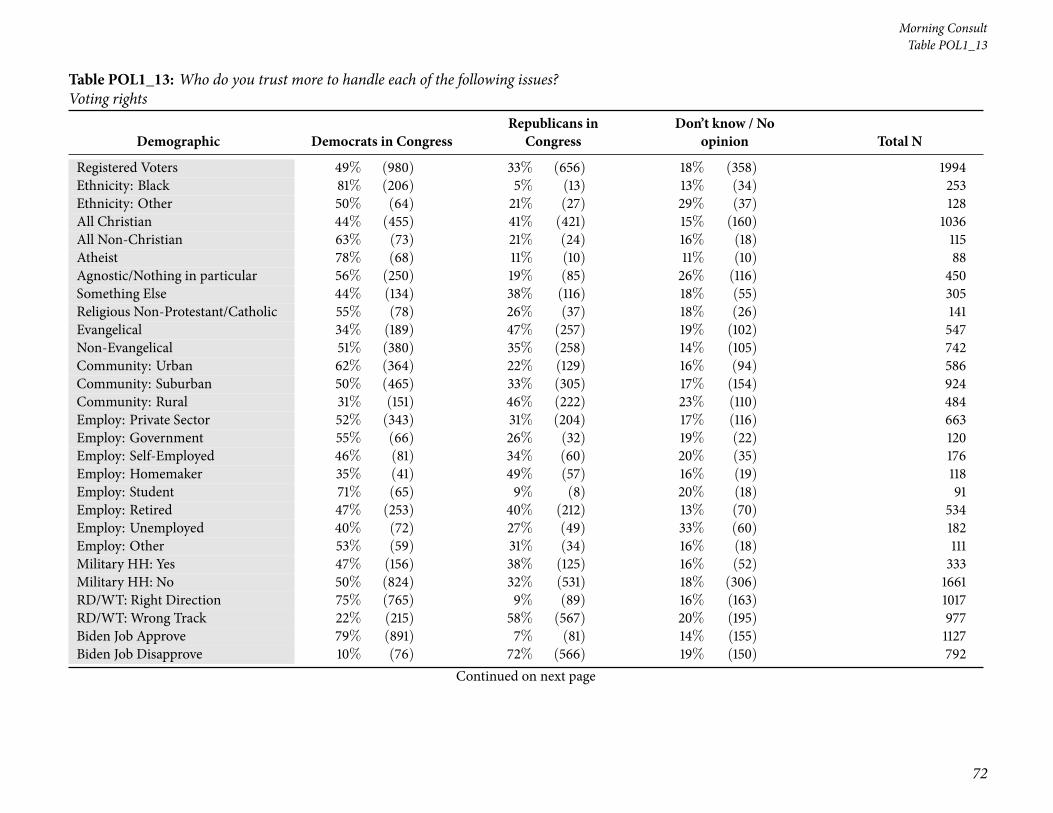
72
Morning ConsultTable POL1_13
Table POL1_13: Who do you trust more to handle each of the following issues?Voting rights
Demographic Democrats in CongressRepublicans in
CongressDon’t know / No
opinion Total N
Registered Voters 49% (980) 33% (656) 18% (358) 1994Ethnicity: Black 81% (206) 5% (13) 13% (34) 253Ethnicity: Other 50% (64) 21% (27) 29% (37) 128All Christian 44% (455) 41% (421) 15% (160) 1036All Non-Christian 63% (73) 21% (24) 16% (18) 115Atheist 78% (68) 11% (10) 11% (10) 88Agnostic/Nothing in particular 56% (250) 19% (85) 26% (116) 450Something Else 44% (134) 38% (116) 18% (55) 305Religious Non-Protestant/Catholic 55% (78) 26% (37) 18% (26) 141Evangelical 34% (189) 47% (257) 19% (102) 547Non-Evangelical 51% (380) 35% (258) 14% (105) 742Community: Urban 62% (364) 22% (129) 16% (94) 586Community: Suburban 50% (465) 33% (305) 17% (154) 924Community: Rural 31% (151) 46% (222) 23% (110) 484Employ: Private Sector 52% (343) 31% (204) 17% (116) 663Employ: Government 55% (66) 26% (32) 19% (22) 120Employ: Self-Employed 46% (81) 34% (60) 20% (35) 176Employ: Homemaker 35% (41) 49% (57) 16% (19) 118Employ: Student 71% (65) 9% (8) 20% (18) 91Employ: Retired 47% (253) 40% (212) 13% (70) 534Employ: Unemployed 40% (72) 27% (49) 33% (60) 182Employ: Other 53% (59) 31% (34) 16% (18) 111Military HH: Yes 47% (156) 38% (125) 16% (52) 333Military HH: No 50% (824) 32% (531) 18% (306) 1661RD/WT: Right Direction 75% (765) 9% (89) 16% (163) 1017RD/WT: Wrong Track 22% (215) 58% (567) 20% (195) 977Biden Job Approve 79% (891) 7% (81) 14% (155) 1127Biden Job Disapprove 10% (76) 72% (566) 19% (150) 792
Continued on next page

National Tracking Poll #2103129, March, 2021
73
Table POL1_13
Table POL1_13: Who do you trust more to handle each of the following issues?Voting rights
Demographic Democrats in CongressRepublicans in
CongressDon’t know / No
opinion Total N
Registered Voters 49% (980) 33% (656) 18% (358) 1994Biden Job Strongly Approve 88% (586) 5% (31) 7% (46) 663Biden Job Somewhat Approve 66% (305) 11% (50) 23% (109) 464Biden Job Somewhat Disapprove 25% (57) 43% (98) 33% (75) 229Biden Job Strongly Disapprove 3% (19) 83% (468) 13% (75) 562Favorable of Biden 80% (916) 6% (72) 14% (155) 1143Unfavorable of Biden 6% (50) 74% (582) 19% (153) 785Very Favorable of Biden 92% (592) 3% (19) 5% (34) 644Somewhat Favorable of Biden 65% (324) 11% (53) 24% (121) 499Somewhat Unfavorable of Biden 20% (39) 47% (88) 33% (63) 190Very Unfavorable of Biden 2% (11) 83% (493) 15% (90) 595#1 Issue: Economy 43% (307) 35% (252) 22% (155) 714#1 Issue: Security 20% (62) 63% (192) 17% (51) 305#1 Issue: Health Care 70% (216) 14% (43) 16% (49) 308#1 Issue: Medicare / Social Security 56% (150) 31% (82) 13% (35) 267#1 Issue: Women’s Issues 55% (49) 22% (20) 23% (20) 88#1 Issue: Education 68% (61) 17% (15) 15% (13) 89#1 Issue: Energy 69% (61) 10% (9) 21% (19) 89#1 Issue: Other 55% (74) 32% (44) 13% (17) 1342020 Vote: Joe Biden 85% (876) 3% (36) 12% (125) 10372020 Vote: Donald Trump 5% (39) 77% (570) 18% (132) 7412020 Vote: Other 13% (8) 24% (14) 64% (38) 602020 Vote: Didn’t Vote 35% (54) 23% (35) 41% (63) 1532018 House Vote: Democrat 86% (643) 6% (46) 8% (59) 7482018 House Vote: Republican 10% (62) 74% (463) 16% (98) 6232018 House Vote: Someone else 18% (10) 22% (12) 60% (33) 552016 Vote: Hillary Clinton 88% (613) 4% (29) 8% (58) 7002016 Vote: Donald Trump 12% (84) 71% (505) 17% (124) 7132016 Vote: Other 39% (42) 22% (23) 39% (42) 1082016 Vote: Didn’t Vote 51% (238) 20% (95) 29% (134) 467
Continued on next page
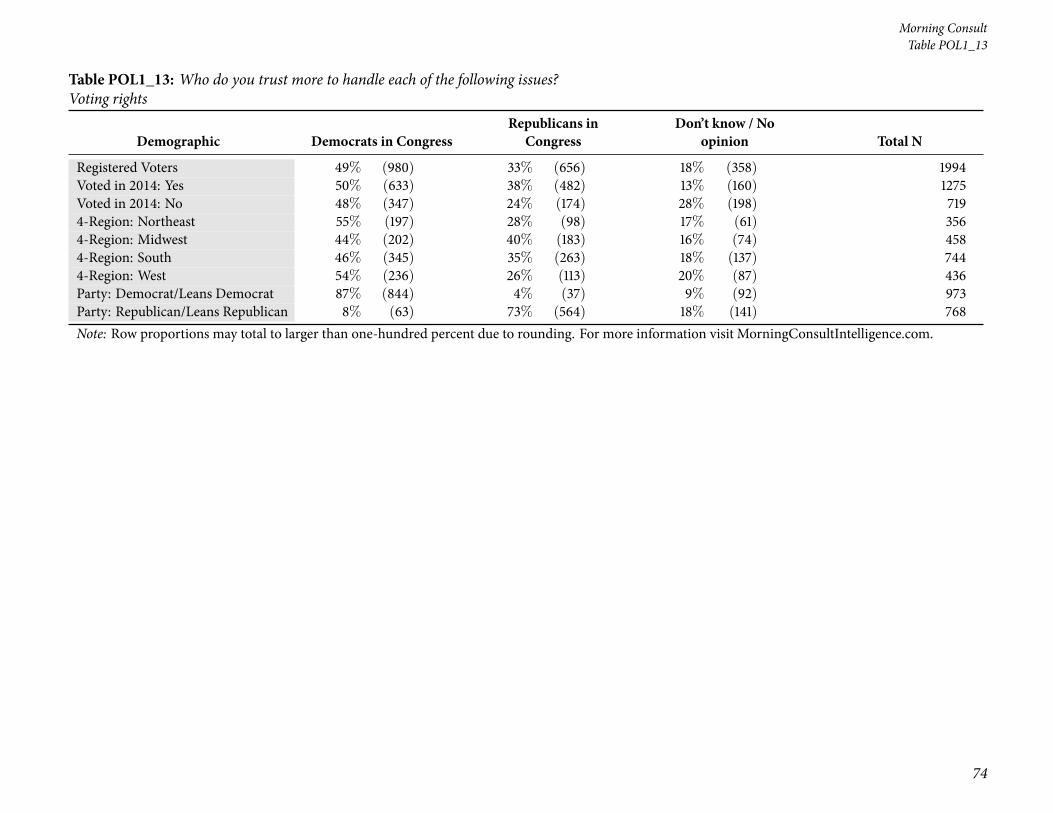
74
Morning ConsultTable POL1_13
Table POL1_13: Who do you trust more to handle each of the following issues?Voting rights
Demographic Democrats in CongressRepublicans in
CongressDon’t know / No
opinion Total N
Registered Voters 49% (980) 33% (656) 18% (358) 1994Voted in 2014: Yes 50% (633) 38% (482) 13% (160) 1275Voted in 2014: No 48% (347) 24% (174) 28% (198) 7194-Region: Northeast 55% (197) 28% (98) 17% (61) 3564-Region: Midwest 44% (202) 40% (183) 16% (74) 4584-Region: South 46% (345) 35% (263) 18% (137) 7444-Region: West 54% (236) 26% (113) 20% (87) 436Party: Democrat/Leans Democrat 87% (844) 4% (37) 9% (92) 973Party: Republican/Leans Republican 8% (63) 73% (564) 18% (141) 768Note: Row proportions may total to larger than one-hundred percent due to rounding. For more information visit MorningConsultIntelligence.com.
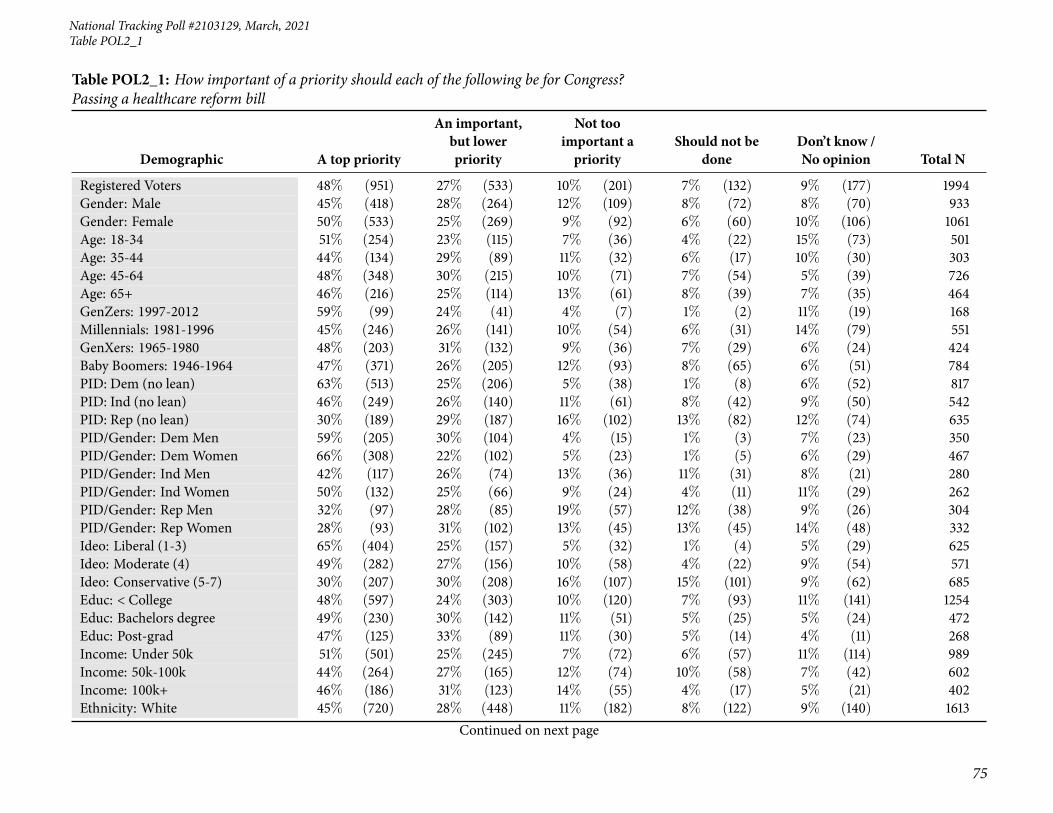
National Tracking Poll #2103129, March, 2021
75
Table POL2_1
Table POL2_1: How important of a priority should each of the following be for Congress?Passing a healthcare reform bill
Demographic A top priority
An important,but lowerpriority
Not tooimportant apriority
Should not bedone
Don’t know /No opinion Total N
Registered Voters 48% (951) 27% (533) 10% (201) 7% (132) 9% (177) 1994Gender: Male 45% (418) 28% (264) 12% (109) 8% (72) 8% (70) 933Gender: Female 50% (533) 25% (269) 9% (92) 6% (60) 10% (106) 1061Age: 18-34 51% (254) 23% (115) 7% (36) 4% (22) 15% (73) 501Age: 35-44 44% (134) 29% (89) 11% (32) 6% (17) 10% (30) 303Age: 45-64 48% (348) 30% (215) 10% (71) 7% (54) 5% (39) 726Age: 65+ 46% (216) 25% (114) 13% (61) 8% (39) 7% (35) 464GenZers: 1997-2012 59% (99) 24% (41) 4% (7) 1% (2) 11% (19) 168Millennials: 1981-1996 45% (246) 26% (141) 10% (54) 6% (31) 14% (79) 551GenXers: 1965-1980 48% (203) 31% (132) 9% (36) 7% (29) 6% (24) 424Baby Boomers: 1946-1964 47% (371) 26% (205) 12% (93) 8% (65) 6% (51) 784PID: Dem (no lean) 63% (513) 25% (206) 5% (38) 1% (8) 6% (52) 817PID: Ind (no lean) 46% (249) 26% (140) 11% (61) 8% (42) 9% (50) 542PID: Rep (no lean) 30% (189) 29% (187) 16% (102) 13% (82) 12% (74) 635PID/Gender: DemMen 59% (205) 30% (104) 4% (15) 1% (3) 7% (23) 350PID/Gender: DemWomen 66% (308) 22% (102) 5% (23) 1% (5) 6% (29) 467PID/Gender: Ind Men 42% (117) 26% (74) 13% (36) 11% (31) 8% (21) 280PID/Gender: Ind Women 50% (132) 25% (66) 9% (24) 4% (11) 11% (29) 262PID/Gender: Rep Men 32% (97) 28% (85) 19% (57) 12% (38) 9% (26) 304PID/Gender: Rep Women 28% (93) 31% (102) 13% (45) 13% (45) 14% (48) 332Ideo: Liberal (1-3) 65% (404) 25% (157) 5% (32) 1% (4) 5% (29) 625Ideo: Moderate (4) 49% (282) 27% (156) 10% (58) 4% (22) 9% (54) 571Ideo: Conservative (5-7) 30% (207) 30% (208) 16% (107) 15% (101) 9% (62) 685Educ: < College 48% (597) 24% (303) 10% (120) 7% (93) 11% (141) 1254Educ: Bachelors degree 49% (230) 30% (142) 11% (51) 5% (25) 5% (24) 472Educ: Post-grad 47% (125) 33% (89) 11% (30) 5% (14) 4% (11) 268Income: Under 50k 51% (501) 25% (245) 7% (72) 6% (57) 11% (114) 989Income: 50k-100k 44% (264) 27% (165) 12% (74) 10% (58) 7% (42) 602Income: 100k+ 46% (186) 31% (123) 14% (55) 4% (17) 5% (21) 402Ethnicity: White 45% (720) 28% (448) 11% (182) 8% (122) 9% (140) 1613
Continued on next page
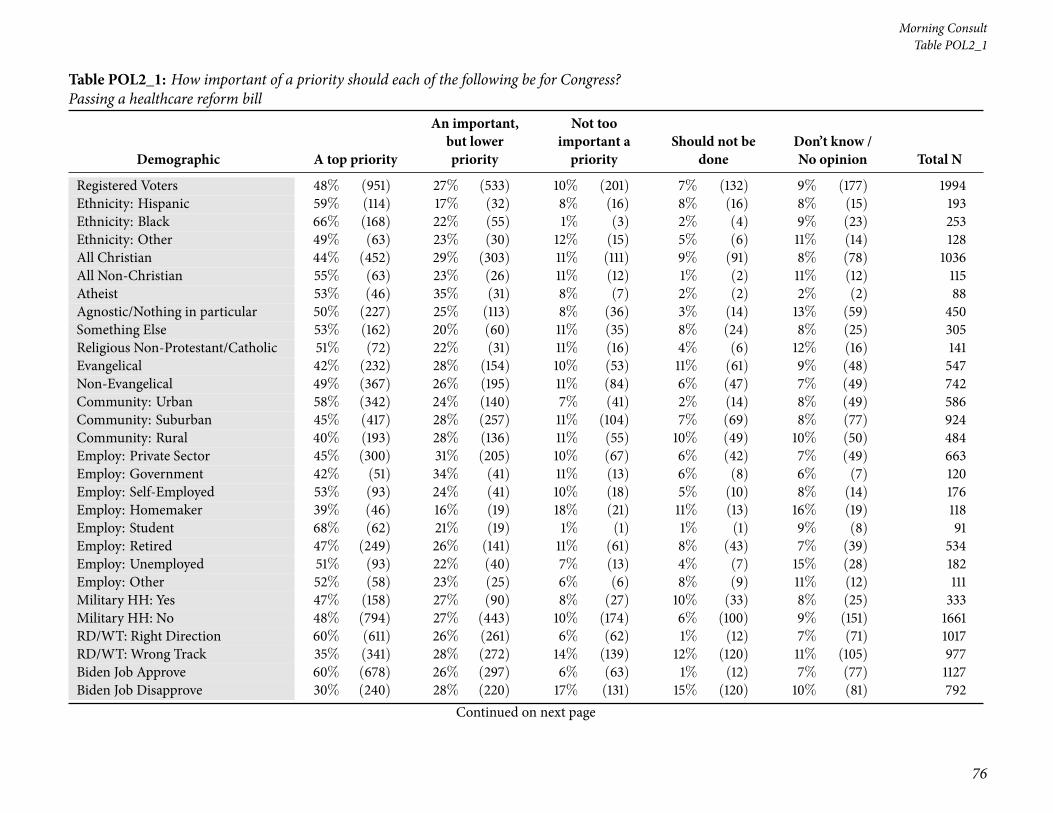
76
Morning ConsultTable POL2_1
Table POL2_1: How important of a priority should each of the following be for Congress?Passing a healthcare reform bill
Demographic A top priority
An important,but lowerpriority
Not tooimportant apriority
Should not bedone
Don’t know /No opinion Total N
Registered Voters 48% (951) 27% (533) 10% (201) 7% (132) 9% (177) 1994Ethnicity: Hispanic 59% (114) 17% (32) 8% (16) 8% (16) 8% (15) 193Ethnicity: Black 66% (168) 22% (55) 1% (3) 2% (4) 9% (23) 253Ethnicity: Other 49% (63) 23% (30) 12% (15) 5% (6) 11% (14) 128All Christian 44% (452) 29% (303) 11% (111) 9% (91) 8% (78) 1036All Non-Christian 55% (63) 23% (26) 11% (12) 1% (2) 11% (12) 115Atheist 53% (46) 35% (31) 8% (7) 2% (2) 2% (2) 88Agnostic/Nothing in particular 50% (227) 25% (113) 8% (36) 3% (14) 13% (59) 450Something Else 53% (162) 20% (60) 11% (35) 8% (24) 8% (25) 305Religious Non-Protestant/Catholic 51% (72) 22% (31) 11% (16) 4% (6) 12% (16) 141Evangelical 42% (232) 28% (154) 10% (53) 11% (61) 9% (48) 547Non-Evangelical 49% (367) 26% (195) 11% (84) 6% (47) 7% (49) 742Community: Urban 58% (342) 24% (140) 7% (41) 2% (14) 8% (49) 586Community: Suburban 45% (417) 28% (257) 11% (104) 7% (69) 8% (77) 924Community: Rural 40% (193) 28% (136) 11% (55) 10% (49) 10% (50) 484Employ: Private Sector 45% (300) 31% (205) 10% (67) 6% (42) 7% (49) 663Employ: Government 42% (51) 34% (41) 11% (13) 6% (8) 6% (7) 120Employ: Self-Employed 53% (93) 24% (41) 10% (18) 5% (10) 8% (14) 176Employ: Homemaker 39% (46) 16% (19) 18% (21) 11% (13) 16% (19) 118Employ: Student 68% (62) 21% (19) 1% (1) 1% (1) 9% (8) 91Employ: Retired 47% (249) 26% (141) 11% (61) 8% (43) 7% (39) 534Employ: Unemployed 51% (93) 22% (40) 7% (13) 4% (7) 15% (28) 182Employ: Other 52% (58) 23% (25) 6% (6) 8% (9) 11% (12) 111Military HH: Yes 47% (158) 27% (90) 8% (27) 10% (33) 8% (25) 333Military HH: No 48% (794) 27% (443) 10% (174) 6% (100) 9% (151) 1661RD/WT: Right Direction 60% (611) 26% (261) 6% (62) 1% (12) 7% (71) 1017RD/WT: Wrong Track 35% (341) 28% (272) 14% (139) 12% (120) 11% (105) 977Biden Job Approve 60% (678) 26% (297) 6% (63) 1% (12) 7% (77) 1127Biden Job Disapprove 30% (240) 28% (220) 17% (131) 15% (120) 10% (81) 792
Continued on next page

National Tracking Poll #2103129, March, 2021
77
Table POL2_1
Table POL2_1: How important of a priority should each of the following be for Congress?Passing a healthcare reform bill
Demographic A top priority
An important,but lowerpriority
Not tooimportant apriority
Should not bedone
Don’t know /No opinion Total N
Registered Voters 48% (951) 27% (533) 10% (201) 7% (132) 9% (177) 1994Biden Job Strongly Approve 66% (436) 24% (157) 5% (31) — (3) 5% (36) 663Biden Job Somewhat Approve 52% (242) 30% (140) 7% (32) 2% (9) 9% (41) 464Biden Job Somewhat Disapprove 38% (86) 29% (67) 16% (36) 3% (8) 14% (33) 229Biden Job Strongly Disapprove 27% (154) 27% (153) 17% (95) 20% (112) 9% (48) 562Favorable of Biden 61% (700) 26% (302) 5% (63) 1% (8) 6% (69) 1143Unfavorable of Biden 28% (222) 28% (221) 17% (134) 16% (123) 11% (84) 785Very Favorable of Biden 67% (431) 24% (152) 5% (35) 1% (4) 4% (23) 644Somewhat Favorable of Biden 54% (269) 30% (151) 6% (28) 1% (5) 9% (46) 499Somewhat Unfavorable of Biden 31% (60) 33% (63) 16% (31) 6% (11) 13% (24) 190Very Unfavorable of Biden 27% (163) 27% (158) 17% (103) 19% (112) 10% (59) 595#1 Issue: Economy 42% (300) 30% (214) 12% (87) 7% (48) 9% (66) 714#1 Issue: Security 30% (91) 30% (93) 12% (37) 17% (50) 11% (33) 305#1 Issue: Health Care 68% (209) 18% (56) 6% (19) 1% (3) 7% (20) 308#1 Issue: Medicare / Social Security 53% (143) 26% (69) 11% (30) 3% (8) 7% (18) 267#1 Issue: Women’s Issues 51% (45) 28% (25) 2% (2) 11% (9) 8% (7) 88#1 Issue: Education 54% (48) 24% (22) 5% (4) 2% (1) 16% (14) 89#1 Issue: Energy 53% (47) 27% (24) 6% (6) 3% (3) 11% (10) 89#1 Issue: Other 51% (68) 23% (31) 12% (16) 7% (10) 7% (9) 1342020 Vote: Joe Biden 63% (649) 25% (259) 6% (64) 1% (12) 5% (53) 10372020 Vote: Donald Trump 29% (212) 30% (226) 15% (114) 15% (110) 11% (79) 7412020 Vote: Other 37% (22) 31% (19) 10% (6) 9% (5) 13% (8) 602020 Vote: Didn’t Vote 44% (68) 19% (30) 11% (17) 3% (5) 22% (33) 1532018 House Vote: Democrat 62% (464) 26% (192) 6% (43) 1% (9) 5% (39) 7482018 House Vote: Republican 31% (192) 30% (186) 15% (94) 16% (97) 9% (53) 6232018 House Vote: Someone else 45% (24) 32% (18) 8% (5) 4% (2) 10% (6) 552016 Vote: Hillary Clinton 64% (445) 25% (174) 6% (43) 1% (5) 5% (33) 7002016 Vote: Donald Trump 30% (216) 31% (218) 15% (105) 14% (103) 10% (70) 7132016 Vote: Other 39% (42) 30% (33) 12% (13) 10% (11) 8% (8) 1082016 Vote: Didn’t Vote 53% (247) 22% (104) 8% (38) 3% (12) 14% (65) 467
Continued on next page
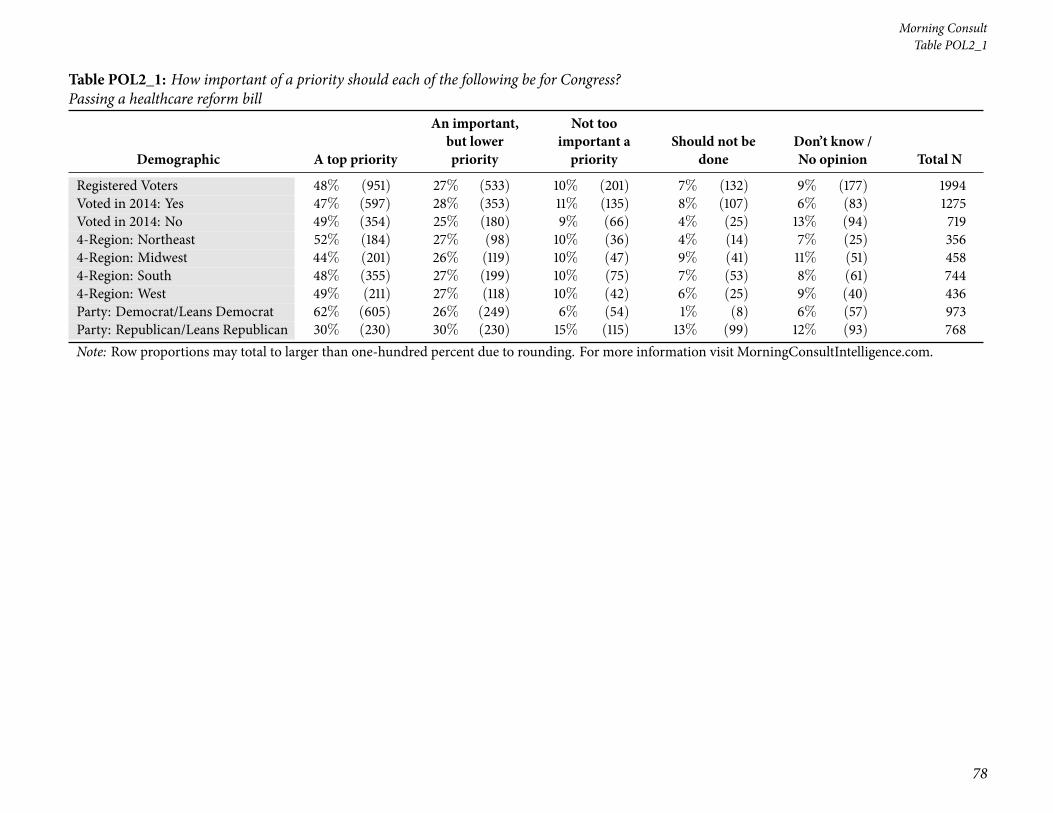
78
Morning ConsultTable POL2_1
Table POL2_1: How important of a priority should each of the following be for Congress?Passing a healthcare reform bill
Demographic A top priority
An important,but lowerpriority
Not tooimportant apriority
Should not bedone
Don’t know /No opinion Total N
Registered Voters 48% (951) 27% (533) 10% (201) 7% (132) 9% (177) 1994Voted in 2014: Yes 47% (597) 28% (353) 11% (135) 8% (107) 6% (83) 1275Voted in 2014: No 49% (354) 25% (180) 9% (66) 4% (25) 13% (94) 7194-Region: Northeast 52% (184) 27% (98) 10% (36) 4% (14) 7% (25) 3564-Region: Midwest 44% (201) 26% (119) 10% (47) 9% (41) 11% (51) 4584-Region: South 48% (355) 27% (199) 10% (75) 7% (53) 8% (61) 7444-Region: West 49% (211) 27% (118) 10% (42) 6% (25) 9% (40) 436Party: Democrat/Leans Democrat 62% (605) 26% (249) 6% (54) 1% (8) 6% (57) 973Party: Republican/Leans Republican 30% (230) 30% (230) 15% (115) 13% (99) 12% (93) 768Note: Row proportions may total to larger than one-hundred percent due to rounding. For more information visit MorningConsultIntelligence.com.
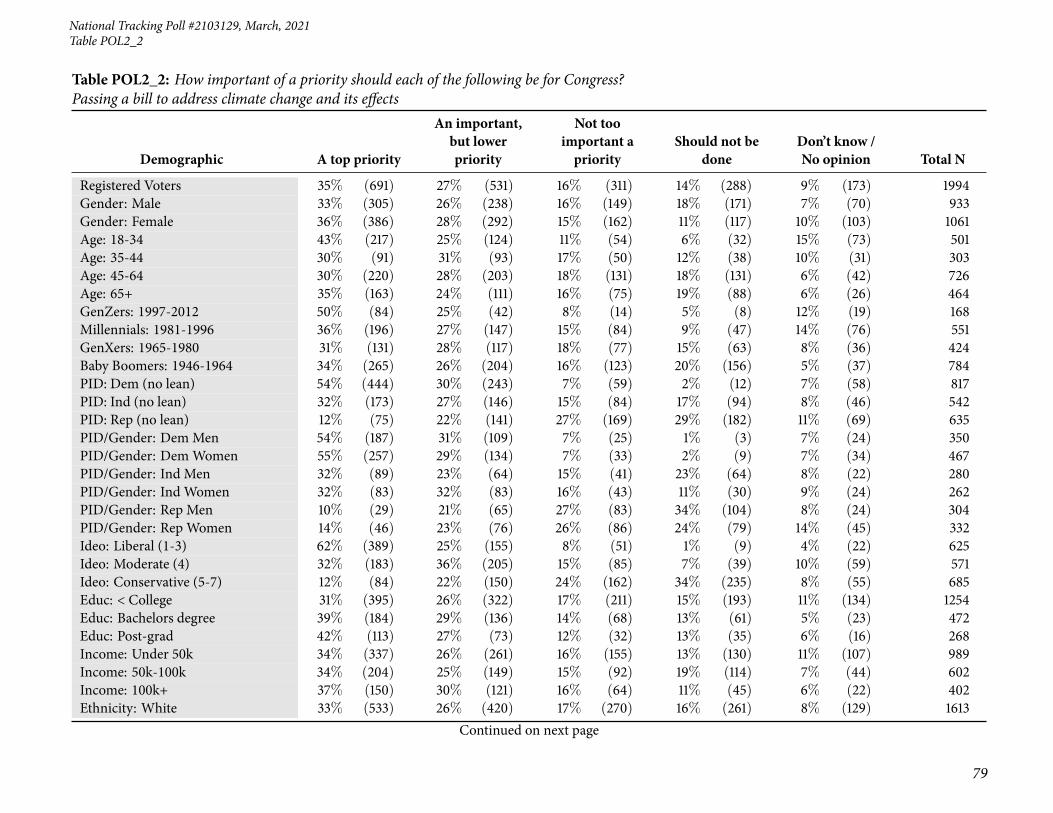
National Tracking Poll #2103129, March, 2021
79
Table POL2_2
Table POL2_2: How important of a priority should each of the following be for Congress?Passing a bill to address climate change and its effects
Demographic A top priority
An important,but lowerpriority
Not tooimportant apriority
Should not bedone
Don’t know /No opinion Total N
Registered Voters 35% (691) 27% (531) 16% (311) 14% (288) 9% (173) 1994Gender: Male 33% (305) 26% (238) 16% (149) 18% (171) 7% (70) 933Gender: Female 36% (386) 28% (292) 15% (162) 11% (117) 10% (103) 1061Age: 18-34 43% (217) 25% (124) 11% (54) 6% (32) 15% (73) 501Age: 35-44 30% (91) 31% (93) 17% (50) 12% (38) 10% (31) 303Age: 45-64 30% (220) 28% (203) 18% (131) 18% (131) 6% (42) 726Age: 65+ 35% (163) 24% (111) 16% (75) 19% (88) 6% (26) 464GenZers: 1997-2012 50% (84) 25% (42) 8% (14) 5% (8) 12% (19) 168Millennials: 1981-1996 36% (196) 27% (147) 15% (84) 9% (47) 14% (76) 551GenXers: 1965-1980 31% (131) 28% (117) 18% (77) 15% (63) 8% (36) 424Baby Boomers: 1946-1964 34% (265) 26% (204) 16% (123) 20% (156) 5% (37) 784PID: Dem (no lean) 54% (444) 30% (243) 7% (59) 2% (12) 7% (58) 817PID: Ind (no lean) 32% (173) 27% (146) 15% (84) 17% (94) 8% (46) 542PID: Rep (no lean) 12% (75) 22% (141) 27% (169) 29% (182) 11% (69) 635PID/Gender: DemMen 54% (187) 31% (109) 7% (25) 1% (3) 7% (24) 350PID/Gender: DemWomen 55% (257) 29% (134) 7% (33) 2% (9) 7% (34) 467PID/Gender: Ind Men 32% (89) 23% (64) 15% (41) 23% (64) 8% (22) 280PID/Gender: Ind Women 32% (83) 32% (83) 16% (43) 11% (30) 9% (24) 262PID/Gender: Rep Men 10% (29) 21% (65) 27% (83) 34% (104) 8% (24) 304PID/Gender: Rep Women 14% (46) 23% (76) 26% (86) 24% (79) 14% (45) 332Ideo: Liberal (1-3) 62% (389) 25% (155) 8% (51) 1% (9) 4% (22) 625Ideo: Moderate (4) 32% (183) 36% (205) 15% (85) 7% (39) 10% (59) 571Ideo: Conservative (5-7) 12% (84) 22% (150) 24% (162) 34% (235) 8% (55) 685Educ: < College 31% (395) 26% (322) 17% (211) 15% (193) 11% (134) 1254Educ: Bachelors degree 39% (184) 29% (136) 14% (68) 13% (61) 5% (23) 472Educ: Post-grad 42% (113) 27% (73) 12% (32) 13% (35) 6% (16) 268Income: Under 50k 34% (337) 26% (261) 16% (155) 13% (130) 11% (107) 989Income: 50k-100k 34% (204) 25% (149) 15% (92) 19% (114) 7% (44) 602Income: 100k+ 37% (150) 30% (121) 16% (64) 11% (45) 6% (22) 402Ethnicity: White 33% (533) 26% (420) 17% (270) 16% (261) 8% (129) 1613
Continued on next page
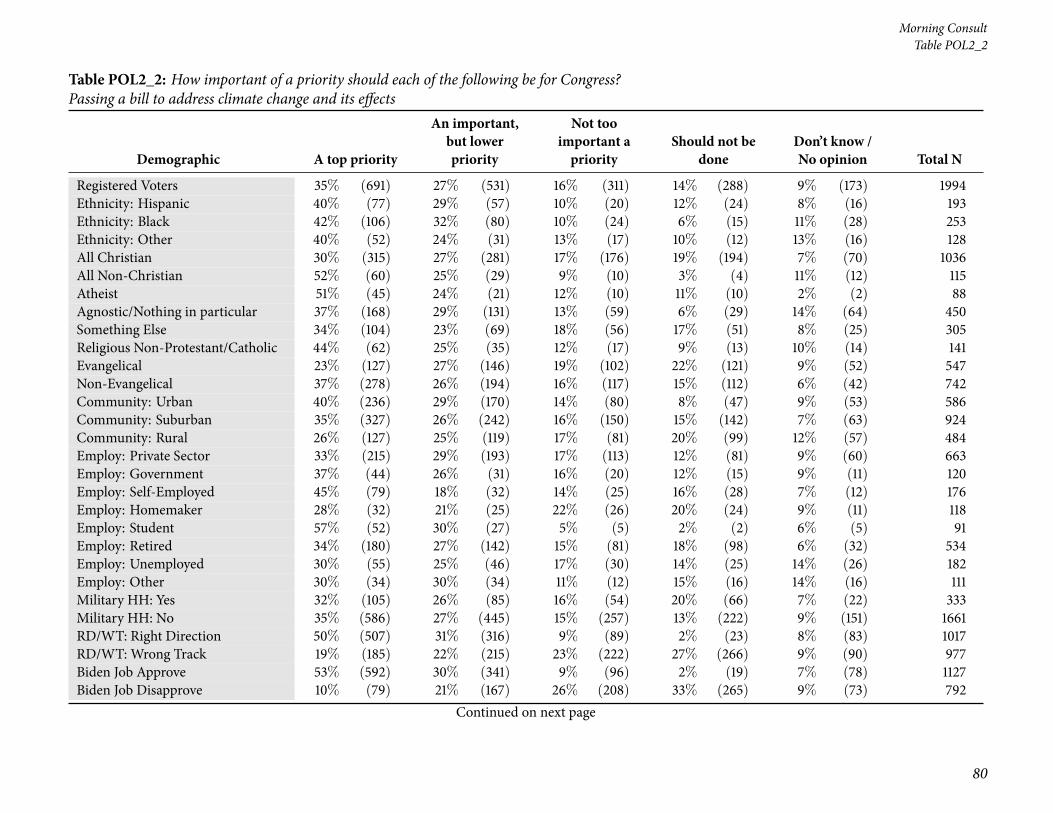
80
Morning ConsultTable POL2_2
Table POL2_2: How important of a priority should each of the following be for Congress?Passing a bill to address climate change and its effects
Demographic A top priority
An important,but lowerpriority
Not tooimportant apriority
Should not bedone
Don’t know /No opinion Total N
Registered Voters 35% (691) 27% (531) 16% (311) 14% (288) 9% (173) 1994Ethnicity: Hispanic 40% (77) 29% (57) 10% (20) 12% (24) 8% (16) 193Ethnicity: Black 42% (106) 32% (80) 10% (24) 6% (15) 11% (28) 253Ethnicity: Other 40% (52) 24% (31) 13% (17) 10% (12) 13% (16) 128All Christian 30% (315) 27% (281) 17% (176) 19% (194) 7% (70) 1036All Non-Christian 52% (60) 25% (29) 9% (10) 3% (4) 11% (12) 115Atheist 51% (45) 24% (21) 12% (10) 11% (10) 2% (2) 88Agnostic/Nothing in particular 37% (168) 29% (131) 13% (59) 6% (29) 14% (64) 450Something Else 34% (104) 23% (69) 18% (56) 17% (51) 8% (25) 305Religious Non-Protestant/Catholic 44% (62) 25% (35) 12% (17) 9% (13) 10% (14) 141Evangelical 23% (127) 27% (146) 19% (102) 22% (121) 9% (52) 547Non-Evangelical 37% (278) 26% (194) 16% (117) 15% (112) 6% (42) 742Community: Urban 40% (236) 29% (170) 14% (80) 8% (47) 9% (53) 586Community: Suburban 35% (327) 26% (242) 16% (150) 15% (142) 7% (63) 924Community: Rural 26% (127) 25% (119) 17% (81) 20% (99) 12% (57) 484Employ: Private Sector 33% (215) 29% (193) 17% (113) 12% (81) 9% (60) 663Employ: Government 37% (44) 26% (31) 16% (20) 12% (15) 9% (11) 120Employ: Self-Employed 45% (79) 18% (32) 14% (25) 16% (28) 7% (12) 176Employ: Homemaker 28% (32) 21% (25) 22% (26) 20% (24) 9% (11) 118Employ: Student 57% (52) 30% (27) 5% (5) 2% (2) 6% (5) 91Employ: Retired 34% (180) 27% (142) 15% (81) 18% (98) 6% (32) 534Employ: Unemployed 30% (55) 25% (46) 17% (30) 14% (25) 14% (26) 182Employ: Other 30% (34) 30% (34) 11% (12) 15% (16) 14% (16) 111Military HH: Yes 32% (105) 26% (85) 16% (54) 20% (66) 7% (22) 333Military HH: No 35% (586) 27% (445) 15% (257) 13% (222) 9% (151) 1661RD/WT: Right Direction 50% (507) 31% (316) 9% (89) 2% (23) 8% (83) 1017RD/WT: Wrong Track 19% (185) 22% (215) 23% (222) 27% (266) 9% (90) 977Biden Job Approve 53% (592) 30% (341) 9% (96) 2% (19) 7% (78) 1127Biden Job Disapprove 10% (79) 21% (167) 26% (208) 33% (265) 9% (73) 792
Continued on next page

National Tracking Poll #2103129, March, 2021
81
Table POL2_2
Table POL2_2: How important of a priority should each of the following be for Congress?Passing a bill to address climate change and its effects
Demographic A top priority
An important,but lowerpriority
Not tooimportant apriority
Should not bedone
Don’t know /No opinion Total N
Registered Voters 35% (691) 27% (531) 16% (311) 14% (288) 9% (173) 1994Biden Job Strongly Approve 60% (401) 27% (181) 6% (38) 1% (7) 5% (36) 663Biden Job Somewhat Approve 41% (192) 34% (159) 13% (59) 3% (12) 9% (42) 464Biden Job Somewhat Disapprove 20% (45) 30% (68) 27% (62) 14% (32) 10% (22) 229Biden Job Strongly Disapprove 6% (34) 18% (99) 26% (146) 41% (232) 9% (51) 562Favorable of Biden 53% (604) 31% (358) 9% (97) 1% (17) 6% (67) 1143Unfavorable of Biden 9% (71) 21% (161) 26% (207) 34% (269) 10% (77) 785Very Favorable of Biden 59% (383) 28% (180) 7% (45) 2% (10) 4% (27) 644Somewhat Favorable of Biden 44% (221) 36% (178) 10% (52) 1% (7) 8% (40) 499Somewhat Unfavorable of Biden 20% (38) 32% (61) 24% (45) 15% (28) 10% (18) 190Very Unfavorable of Biden 5% (33) 17% (100) 27% (162) 41% (242) 10% (58) 595#1 Issue: Economy 28% (200) 29% (210) 18% (128) 16% (113) 9% (63) 714#1 Issue: Security 16% (50) 21% (63) 19% (58) 34% (102) 10% (32) 305#1 Issue: Health Care 52% (158) 29% (90) 10% (31) 2% (5) 7% (22) 308#1 Issue: Medicare / Social Security 38% (101) 30% (81) 18% (47) 10% (26) 4% (12) 267#1 Issue: Women’s Issues 32% (28) 26% (23) 10% (8) 18% (16) 15% (13) 88#1 Issue: Education 37% (33) 35% (31) 9% (8) 5% (4) 15% (13) 89#1 Issue: Energy 74% (66) 7% (6) 12% (11) 3% (2) 4% (4) 89#1 Issue: Other 41% (55) 20% (27) 14% (19) 15% (20) 11% (14) 1342020 Vote: Joe Biden 55% (575) 30% (315) 7% (75) 2% (17) 5% (55) 10372020 Vote: Donald Trump 9% (67) 22% (164) 26% (195) 33% (243) 10% (71) 7412020 Vote: Other 19% (12) 17% (10) 19% (11) 20% (12) 25% (15) 602020 Vote: Didn’t Vote 25% (38) 27% (42) 19% (29) 10% (16) 19% (28) 1532018 House Vote: Democrat 58% (431) 27% (200) 8% (62) 1% (11) 6% (43) 7482018 House Vote: Republican 11% (70) 22% (137) 25% (153) 34% (214) 8% (48) 6232018 House Vote: Someone else 22% (12) 28% (15) 12% (6) 19% (10) 19% (10) 552016 Vote: Hillary Clinton 58% (403) 29% (200) 7% (52) 2% (11) 5% (34) 7002016 Vote: Donald Trump 13% (91) 22% (155) 25% (181) 31% (221) 9% (65) 7132016 Vote: Other 34% (37) 27% (29) 14% (15) 16% (18) 9% (9) 1082016 Vote: Didn’t Vote 34% (159) 31% (147) 13% (59) 8% (38) 14% (64) 467
Continued on next page

82
Morning ConsultTable POL2_2
Table POL2_2: How important of a priority should each of the following be for Congress?Passing a bill to address climate change and its effects
Demographic A top priority
An important,but lowerpriority
Not tooimportant apriority
Should not bedone
Don’t know /No opinion Total N
Registered Voters 35% (691) 27% (531) 16% (311) 14% (288) 9% (173) 1994Voted in 2014: Yes 35% (443) 25% (318) 16% (206) 18% (224) 7% (84) 1275Voted in 2014: No 34% (248) 30% (212) 15% (105) 9% (64) 12% (89) 7194-Region: Northeast 40% (142) 28% (99) 15% (52) 10% (37) 7% (25) 3564-Region: Midwest 27% (125) 26% (117) 20% (93) 16% (75) 10% (47) 4584-Region: South 34% (251) 29% (217) 13% (96) 16% (123) 8% (58) 7444-Region: West 40% (173) 22% (97) 16% (70) 12% (53) 10% (42) 436Party: Democrat/Leans Democrat 55% (532) 31% (297) 7% (70) 1% (13) 6% (60) 973Party: Republican/Leans Republican 11% (86) 22% (170) 26% (203) 30% (229) 11% (81) 768Note: Row proportions may total to larger than one-hundred percent due to rounding. For more information visit MorningConsultIntelligence.com.
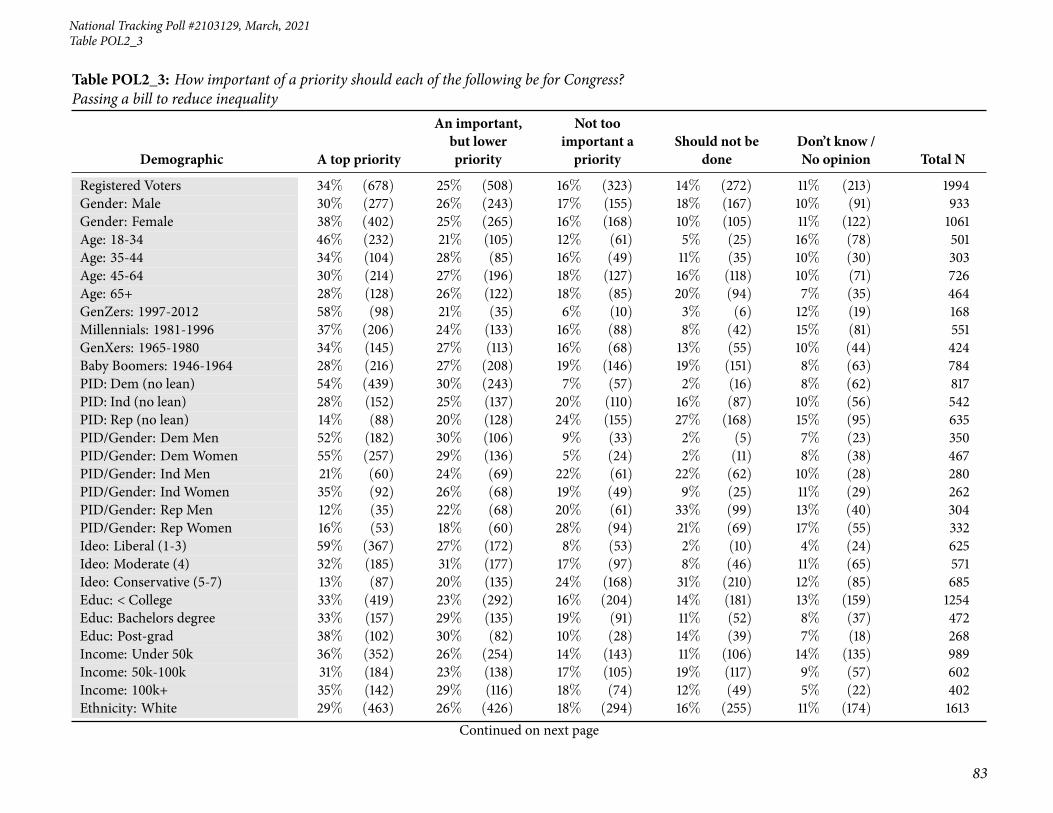
National Tracking Poll #2103129, March, 2021
83
Table POL2_3
Table POL2_3: How important of a priority should each of the following be for Congress?Passing a bill to reduce inequality
Demographic A top priority
An important,but lowerpriority
Not tooimportant apriority
Should not bedone
Don’t know /No opinion Total N
Registered Voters 34% (678) 25% (508) 16% (323) 14% (272) 11% (213) 1994Gender: Male 30% (277) 26% (243) 17% (155) 18% (167) 10% (91) 933Gender: Female 38% (402) 25% (265) 16% (168) 10% (105) 11% (122) 1061Age: 18-34 46% (232) 21% (105) 12% (61) 5% (25) 16% (78) 501Age: 35-44 34% (104) 28% (85) 16% (49) 11% (35) 10% (30) 303Age: 45-64 30% (214) 27% (196) 18% (127) 16% (118) 10% (71) 726Age: 65+ 28% (128) 26% (122) 18% (85) 20% (94) 7% (35) 464GenZers: 1997-2012 58% (98) 21% (35) 6% (10) 3% (6) 12% (19) 168Millennials: 1981-1996 37% (206) 24% (133) 16% (88) 8% (42) 15% (81) 551GenXers: 1965-1980 34% (145) 27% (113) 16% (68) 13% (55) 10% (44) 424Baby Boomers: 1946-1964 28% (216) 27% (208) 19% (146) 19% (151) 8% (63) 784PID: Dem (no lean) 54% (439) 30% (243) 7% (57) 2% (16) 8% (62) 817PID: Ind (no lean) 28% (152) 25% (137) 20% (110) 16% (87) 10% (56) 542PID: Rep (no lean) 14% (88) 20% (128) 24% (155) 27% (168) 15% (95) 635PID/Gender: DemMen 52% (182) 30% (106) 9% (33) 2% (5) 7% (23) 350PID/Gender: DemWomen 55% (257) 29% (136) 5% (24) 2% (11) 8% (38) 467PID/Gender: Ind Men 21% (60) 24% (69) 22% (61) 22% (62) 10% (28) 280PID/Gender: Ind Women 35% (92) 26% (68) 19% (49) 9% (25) 11% (29) 262PID/Gender: Rep Men 12% (35) 22% (68) 20% (61) 33% (99) 13% (40) 304PID/Gender: Rep Women 16% (53) 18% (60) 28% (94) 21% (69) 17% (55) 332Ideo: Liberal (1-3) 59% (367) 27% (172) 8% (53) 2% (10) 4% (24) 625Ideo: Moderate (4) 32% (185) 31% (177) 17% (97) 8% (46) 11% (65) 571Ideo: Conservative (5-7) 13% (87) 20% (135) 24% (168) 31% (210) 12% (85) 685Educ: < College 33% (419) 23% (292) 16% (204) 14% (181) 13% (159) 1254Educ: Bachelors degree 33% (157) 29% (135) 19% (91) 11% (52) 8% (37) 472Educ: Post-grad 38% (102) 30% (82) 10% (28) 14% (39) 7% (18) 268Income: Under 50k 36% (352) 26% (254) 14% (143) 11% (106) 14% (135) 989Income: 50k-100k 31% (184) 23% (138) 17% (105) 19% (117) 9% (57) 602Income: 100k+ 35% (142) 29% (116) 18% (74) 12% (49) 5% (22) 402Ethnicity: White 29% (463) 26% (426) 18% (294) 16% (255) 11% (174) 1613
Continued on next page

84
Morning ConsultTable POL2_3
Table POL2_3: How important of a priority should each of the following be for Congress?Passing a bill to reduce inequality
Demographic A top priority
An important,but lowerpriority
Not tooimportant apriority
Should not bedone
Don’t know /No opinion Total N
Registered Voters 34% (678) 25% (508) 16% (323) 14% (272) 11% (213) 1994Ethnicity: Hispanic 44% (85) 15% (29) 18% (35) 12% (23) 11% (21) 193Ethnicity: Black 65% (165) 18% (46) 4% (9) 4% (10) 9% (23) 253Ethnicity: Other 40% (51) 28% (36) 15% (19) 5% (7) 12% (16) 128All Christian 30% (306) 26% (271) 18% (186) 18% (186) 8% (88) 1036All Non-Christian 38% (44) 30% (35) 15% (17) 4% (5) 12% (14) 115Atheist 52% (45) 19% (17) 17% (15) 9% (8) 3% (3) 88Agnostic/Nothing in particular 39% (177) 26% (115) 12% (53) 8% (38) 15% (68) 450Something Else 35% (105) 23% (70) 17% (52) 12% (36) 14% (41) 305Religious Non-Protestant/Catholic 33% (47) 32% (45) 15% (21) 9% (13) 11% (15) 141Evangelical 27% (148) 23% (126) 19% (103) 19% (104) 12% (66) 547Non-Evangelical 34% (255) 27% (200) 16% (121) 14% (106) 8% (60) 742Community: Urban 47% (274) 24% (139) 12% (72) 7% (40) 11% (62) 586Community: Suburban 31% (287) 26% (242) 17% (157) 16% (148) 10% (90) 924Community: Rural 24% (117) 26% (128) 19% (93) 17% (83) 13% (62) 484Employ: Private Sector 34% (228) 27% (177) 17% (110) 12% (79) 10% (68) 663Employ: Government 38% (46) 25% (30) 12% (14) 14% (17) 12% (14) 120Employ: Self-Employed 41% (72) 20% (36) 14% (25) 15% (26) 10% (17) 176Employ: Homemaker 26% (31) 18% (21) 25% (29) 18% (22) 13% (15) 118Employ: Student 59% (53) 25% (23) 8% (7) 2% (2) 6% (6) 91Employ: Retired 27% (145) 26% (141) 18% (96) 19% (100) 10% (53) 534Employ: Unemployed 36% (66) 26% (47) 16% (29) 8% (15) 13% (24) 182Employ: Other 35% (38) 30% (33) 10% (11) 10% (12) 15% (17) 111Military HH: Yes 30% (99) 25% (82) 17% (56) 21% (68) 8% (28) 333Military HH: No 35% (580) 26% (425) 16% (267) 12% (203) 11% (186) 1661RD/WT: Right Direction 49% (494) 29% (296) 11% (114) 2% (23) 9% (89) 1017RD/WT: Wrong Track 19% (184) 22% (211) 21% (209) 25% (249) 13% (124) 977Biden Job Approve 49% (553) 31% (344) 11% (120) 2% (21) 8% (90) 1127Biden Job Disapprove 13% (104) 18% (139) 25% (195) 31% (249) 13% (104) 792
Continued on next page
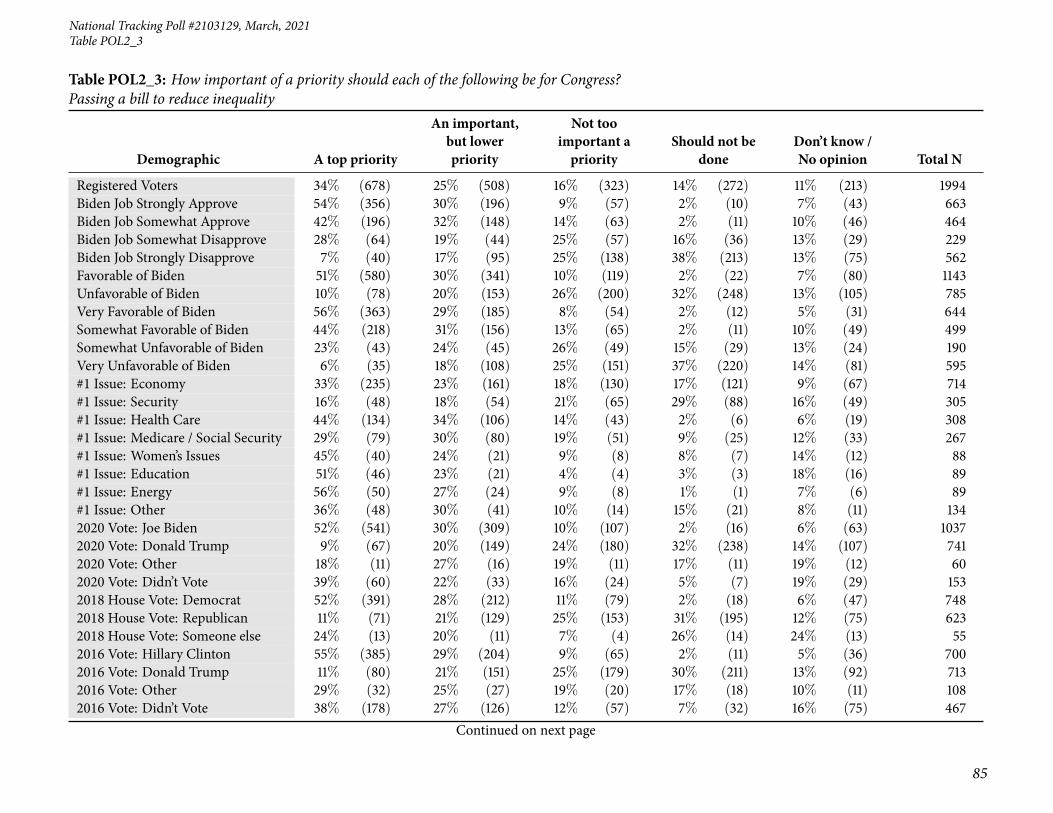
National Tracking Poll #2103129, March, 2021
85
Table POL2_3
Table POL2_3: How important of a priority should each of the following be for Congress?Passing a bill to reduce inequality
Demographic A top priority
An important,but lowerpriority
Not tooimportant apriority
Should not bedone
Don’t know /No opinion Total N
Registered Voters 34% (678) 25% (508) 16% (323) 14% (272) 11% (213) 1994Biden Job Strongly Approve 54% (356) 30% (196) 9% (57) 2% (10) 7% (43) 663Biden Job Somewhat Approve 42% (196) 32% (148) 14% (63) 2% (11) 10% (46) 464Biden Job Somewhat Disapprove 28% (64) 19% (44) 25% (57) 16% (36) 13% (29) 229Biden Job Strongly Disapprove 7% (40) 17% (95) 25% (138) 38% (213) 13% (75) 562Favorable of Biden 51% (580) 30% (341) 10% (119) 2% (22) 7% (80) 1143Unfavorable of Biden 10% (78) 20% (153) 26% (200) 32% (248) 13% (105) 785Very Favorable of Biden 56% (363) 29% (185) 8% (54) 2% (12) 5% (31) 644Somewhat Favorable of Biden 44% (218) 31% (156) 13% (65) 2% (11) 10% (49) 499Somewhat Unfavorable of Biden 23% (43) 24% (45) 26% (49) 15% (29) 13% (24) 190Very Unfavorable of Biden 6% (35) 18% (108) 25% (151) 37% (220) 14% (81) 595#1 Issue: Economy 33% (235) 23% (161) 18% (130) 17% (121) 9% (67) 714#1 Issue: Security 16% (48) 18% (54) 21% (65) 29% (88) 16% (49) 305#1 Issue: Health Care 44% (134) 34% (106) 14% (43) 2% (6) 6% (19) 308#1 Issue: Medicare / Social Security 29% (79) 30% (80) 19% (51) 9% (25) 12% (33) 267#1 Issue: Women’s Issues 45% (40) 24% (21) 9% (8) 8% (7) 14% (12) 88#1 Issue: Education 51% (46) 23% (21) 4% (4) 3% (3) 18% (16) 89#1 Issue: Energy 56% (50) 27% (24) 9% (8) 1% (1) 7% (6) 89#1 Issue: Other 36% (48) 30% (41) 10% (14) 15% (21) 8% (11) 1342020 Vote: Joe Biden 52% (541) 30% (309) 10% (107) 2% (16) 6% (63) 10372020 Vote: Donald Trump 9% (67) 20% (149) 24% (180) 32% (238) 14% (107) 7412020 Vote: Other 18% (11) 27% (16) 19% (11) 17% (11) 19% (12) 602020 Vote: Didn’t Vote 39% (60) 22% (33) 16% (24) 5% (7) 19% (29) 1532018 House Vote: Democrat 52% (391) 28% (212) 11% (79) 2% (18) 6% (47) 7482018 House Vote: Republican 11% (71) 21% (129) 25% (153) 31% (195) 12% (75) 6232018 House Vote: Someone else 24% (13) 20% (11) 7% (4) 26% (14) 24% (13) 552016 Vote: Hillary Clinton 55% (385) 29% (204) 9% (65) 2% (11) 5% (36) 7002016 Vote: Donald Trump 11% (80) 21% (151) 25% (179) 30% (211) 13% (92) 7132016 Vote: Other 29% (32) 25% (27) 19% (20) 17% (18) 10% (11) 1082016 Vote: Didn’t Vote 38% (178) 27% (126) 12% (57) 7% (32) 16% (75) 467
Continued on next page

86
Morning ConsultTable POL2_3
Table POL2_3: How important of a priority should each of the following be for Congress?Passing a bill to reduce inequality
Demographic A top priority
An important,but lowerpriority
Not tooimportant apriority
Should not bedone
Don’t know /No opinion Total N
Registered Voters 34% (678) 25% (508) 16% (323) 14% (272) 11% (213) 1994Voted in 2014: Yes 33% (420) 25% (313) 17% (220) 16% (208) 9% (115) 1275Voted in 2014: No 36% (259) 27% (195) 14% (103) 9% (64) 14% (99) 7194-Region: Northeast 38% (137) 26% (91) 15% (54) 10% (36) 11% (38) 3564-Region: Midwest 28% (126) 26% (120) 18% (83) 15% (68) 13% (60) 4584-Region: South 36% (270) 24% (178) 16% (117) 15% (113) 9% (67) 7444-Region: West 33% (145) 27% (119) 16% (69) 12% (54) 11% (48) 436Party: Democrat/Leans Democrat 52% (510) 29% (286) 9% (90) 2% (18) 7% (69) 973Party: Republican/Leans Republican 13% (96) 22% (166) 24% (181) 28% (214) 14% (110) 768Note: Row proportions may total to larger than one-hundred percent due to rounding. For more information visit MorningConsultIntelligence.com.

National Tracking Poll #2103129, March, 2021
87
Table POL2_4
Table POL2_4: How important of a priority should each of the following be for Congress?Passing an infrastructure spending bill
Demographic A top priority
An important,but lowerpriority
Not tooimportant apriority
Should not bedone
Don’t know /No opinion Total N
Registered Voters 33% (661) 38% (759) 11% (226) 3% (61) 14% (287) 1994Gender: Male 40% (374) 37% (350) 11% (102) 3% (25) 9% (82) 933Gender: Female 27% (287) 39% (409) 12% (124) 3% (36) 19% (205) 1061Age: 18-34 23% (117) 35% (174) 16% (78) 2% (8) 25% (123) 501Age: 35-44 30% (92) 38% (114) 14% (41) 3% (8) 16% (47) 303Age: 45-64 35% (258) 39% (282) 10% (73) 5% (33) 11% (81) 726Age: 65+ 42% (194) 41% (188) 7% (34) 3% (12) 8% (35) 464GenZers: 1997-2012 24% (40) 35% (59) 15% (26) 3% (5) 23% (38) 168Millennials: 1981-1996 26% (145) 35% (191) 15% (84) 2% (11) 22% (121) 551GenXers: 1965-1980 31% (129) 42% (179) 11% (48) 3% (13) 13% (54) 424Baby Boomers: 1946-1964 41% (321) 39% (309) 8% (61) 4% (31) 8% (63) 784PID: Dem (no lean) 40% (324) 39% (321) 8% (64) 1% (5) 13% (103) 817PID: Ind (no lean) 33% (177) 35% (191) 14% (74) 3% (16) 16% (84) 542PID: Rep (no lean) 25% (161) 39% (247) 14% (88) 6% (40) 16% (99) 635PID/Gender: DemMen 49% (170) 38% (135) 5% (19) — (0) 7% (26) 350PID/Gender: DemWomen 33% (153) 40% (186) 10% (45) 1% (5) 17% (77) 467PID/Gender: Ind Men 38% (105) 37% (102) 13% (35) 3% (8) 10% (29) 280PID/Gender: Ind Women 27% (72) 34% (88) 15% (39) 3% (8) 21% (56) 262PID/Gender: Rep Men 32% (98) 37% (113) 16% (47) 6% (17) 9% (28) 304PID/Gender: Rep Women 19% (62) 41% (134) 12% (40) 7% (23) 22% (72) 332Ideo: Liberal (1-3) 44% (274) 37% (232) 9% (54) 1% (6) 9% (59) 625Ideo: Moderate (4) 30% (174) 38% (218) 14% (77) 1% (8) 16% (94) 571Ideo: Conservative (5-7) 28% (191) 41% (279) 12% (84) 7% (45) 13% (87) 685Educ: < College 32% (397) 37% (461) 11% (136) 4% (44) 17% (216) 1254Educ: Bachelors degree 34% (162) 40% (190) 14% (64) 2% (10) 10% (46) 472Educ: Post-grad 38% (102) 40% (108) 10% (27) 3% (7) 9% (25) 268Income: Under 50k 32% (319) 36% (356) 11% (107) 4% (35) 17% (172) 989Income: 50k-100k 35% (209) 36% (219) 13% (77) 4% (22) 12% (75) 602Income: 100k+ 33% (133) 46% (183) 11% (43) 1% (4) 10% (39) 402Ethnicity: White 32% (524) 39% (624) 12% (190) 4% (57) 14% (218) 1613
Continued on next page

88
Morning ConsultTable POL2_4
Table POL2_4: How important of a priority should each of the following be for Congress?Passing an infrastructure spending bill
Demographic A top priority
An important,but lowerpriority
Not tooimportant apriority
Should not bedone
Don’t know /No opinion Total N
Registered Voters 33% (661) 38% (759) 11% (226) 3% (61) 14% (287) 1994Ethnicity: Hispanic 30% (58) 43% (84) 12% (23) — (1) 14% (27) 193Ethnicity: Black 41% (103) 34% (85) 8% (21) 1% (2) 16% (41) 253Ethnicity: Other 27% (34) 39% (50) 12% (15) 2% (2) 21% (27) 128All Christian 36% (370) 39% (408) 11% (114) 3% (36) 10% (108) 1036All Non-Christian 43% (49) 35% (40) 10% (11) 1% (1) 12% (13) 115Atheist 40% (35) 38% (33) 16% (14) 2% (2) 4% (3) 88Agnostic/Nothing in particular 32% (145) 35% (159) 11% (50) 2% (11) 19% (86) 450Something Else 21% (63) 39% (118) 12% (37) 4% (11) 25% (76) 305Religious Non-Protestant/Catholic 38% (54) 40% (57) 10% (14) 1% (2) 10% (14) 141Evangelical 29% (156) 39% (211) 12% (68) 4% (22) 16% (90) 547Non-Evangelical 36% (264) 39% (290) 10% (74) 3% (24) 12% (91) 742Community: Urban 37% (216) 37% (214) 13% (75) 1% (7) 13% (74) 586Community: Suburban 34% (312) 38% (351) 11% (99) 3% (28) 14% (134) 924Community: Rural 28% (133) 40% (193) 11% (52) 5% (26) 16% (79) 484Employ: Private Sector 30% (199) 42% (281) 13% (86) 2% (14) 12% (82) 663Employ: Government 26% (32) 40% (48) 12% (14) 4% (5) 17% (21) 120Employ: Self-Employed 43% (75) 31% (54) 9% (16) 5% (8) 13% (23) 176Employ: Homemaker 25% (30) 27% (32) 16% (19) 3% (4) 28% (33) 118Employ: Student 26% (23) 36% (33) 18% (16) 3% (3) 17% (16) 91Employ: Retired 41% (220) 38% (205) 8% (42) 3% (16) 10% (52) 534Employ: Unemployed 30% (55) 39% (70) 8% (14) 6% (10) 18% (32) 182Employ: Other 25% (28) 32% (35) 18% (20) 1% (2) 24% (27) 111Military HH: Yes 39% (130) 33% (110) 13% (42) 4% (14) 11% (37) 333Military HH: No 32% (531) 39% (649) 11% (184) 3% (47) 15% (250) 1661RD/WT: Right Direction 39% (400) 38% (389) 8% (85) 1% (11) 13% (132) 1017RD/WT: Wrong Track 27% (262) 38% (369) 14% (141) 5% (50) 16% (155) 977Biden Job Approve 40% (446) 39% (441) 8% (94) 1% (11) 12% (133) 1127Biden Job Disapprove 26% (204) 37% (297) 15% (120) 6% (50) 15% (121) 792
Continued on next page

National Tracking Poll #2103129, March, 2021
89
Table POL2_4
Table POL2_4: How important of a priority should each of the following be for Congress?Passing an infrastructure spending bill
Demographic A top priority
An important,but lowerpriority
Not tooimportant apriority
Should not bedone
Don’t know /No opinion Total N
Registered Voters 33% (661) 38% (759) 11% (226) 3% (61) 14% (287) 1994Biden Job Strongly Approve 47% (311) 35% (234) 7% (44) 1% (4) 11% (71) 663Biden Job Somewhat Approve 29% (135) 45% (208) 11% (51) 2% (8) 13% (63) 464Biden Job Somewhat Disapprove 27% (61) 32% (73) 18% (41) 1% (2) 23% (52) 229Biden Job Strongly Disapprove 25% (143) 40% (224) 14% (79) 8% (48) 12% (69) 562Favorable of Biden 40% (455) 39% (444) 9% (105) 1% (9) 11% (130) 1143Unfavorable of Biden 24% (192) 39% (305) 15% (116) 7% (52) 15% (119) 785Very Favorable of Biden 47% (306) 36% (233) 7% (43) 1% (4) 9% (58) 644Somewhat Favorable of Biden 30% (149) 42% (211) 12% (62) 1% (5) 14% (72) 499Somewhat Unfavorable of Biden 23% (43) 34% (65) 19% (36) 1% (3) 23% (43) 190Very Unfavorable of Biden 25% (149) 40% (240) 14% (80) 8% (50) 13% (76) 595#1 Issue: Economy 30% (216) 42% (299) 11% (76) 3% (20) 14% (103) 714#1 Issue: Security 27% (83) 38% (115) 14% (43) 5% (17) 15% (47) 305#1 Issue: Health Care 38% (116) 39% (120) 11% (35) 1% (4) 11% (34) 308#1 Issue: Medicare / Social Security 41% (109) 37% (98) 7% (19) 3% (8) 12% (32) 267#1 Issue: Women’s Issues 16% (14) 38% (34) 19% (16) 5% (5) 22% (19) 88#1 Issue: Education 31% (27) 27% (24) 17% (15) 2% (2) 24% (21) 89#1 Issue: Energy 46% (41) 24% (21) 12% (11) — (0) 18% (16) 89#1 Issue: Other 41% (55) 36% (48) 8% (11) 5% (7) 10% (14) 1342020 Vote: Joe Biden 39% (409) 40% (414) 10% (99) 1% (9) 10% (105) 10372020 Vote: Donald Trump 25% (189) 38% (283) 14% (107) 6% (47) 16% (117) 7412020 Vote: Other 37% (22) 20% (12) 9% (5) 3% (2) 32% (19) 602020 Vote: Didn’t Vote 27% (41) 33% (50) 10% (16) 2% (4) 27% (42) 1532018 House Vote: Democrat 42% (317) 39% (293) 7% (51) 1% (7) 11% (80) 7482018 House Vote: Republican 28% (177) 41% (253) 13% (82) 6% (36) 12% (75) 6232018 House Vote: Someone else 43% (24) 25% (14) 8% (5) 2% (1) 21% (12) 552016 Vote: Hillary Clinton 43% (299) 41% (290) 7% (49) 1% (5) 8% (57) 7002016 Vote: Donald Trump 29% (206) 38% (268) 13% (95) 6% (42) 14% (102) 7132016 Vote: Other 38% (41) 32% (35) 17% (18) 4% (4) 10% (11) 1082016 Vote: Didn’t Vote 24% (114) 35% (162) 14% (65) 2% (10) 25% (117) 467
Continued on next page

90
Morning ConsultTable POL2_4
Table POL2_4: How important of a priority should each of the following be for Congress?Passing an infrastructure spending bill
Demographic A top priority
An important,but lowerpriority
Not tooimportant apriority
Should not bedone
Don’t know /No opinion Total N
Registered Voters 33% (661) 38% (759) 11% (226) 3% (61) 14% (287) 1994Voted in 2014: Yes 37% (470) 40% (507) 9% (121) 3% (44) 10% (134) 1275Voted in 2014: No 27% (191) 35% (252) 15% (105) 2% (18) 21% (153) 7194-Region: Northeast 37% (132) 38% (135) 11% (39) 2% (7) 12% (43) 3564-Region: Midwest 30% (136) 36% (165) 12% (53) 5% (21) 18% (83) 4584-Region: South 34% (254) 39% (287) 11% (80) 3% (22) 14% (101) 7444-Region: West 32% (140) 40% (172) 12% (54) 2% (11) 14% (59) 436Party: Democrat/Leans Democrat 40% (388) 39% (375) 8% (79) 1% (10) 12% (121) 973Party: Republican/Leans Republican 25% (195) 39% (302) 13% (103) 6% (45) 16% (124) 768Note: Row proportions may total to larger than one-hundred percent due to rounding. For more information visit MorningConsultIntelligence.com.

National Tracking Poll #2103129, March, 2021
91
Table POL2_5
Table POL2_5: How important of a priority should each of the following be for Congress?Passing an immigration reform bill
Demographic A top priority
An important,but lowerpriority
Not tooimportant apriority
Should not bedone
Don’t know /No opinion Total N
Registered Voters 39% (769) 32% (637) 11% (220) 9% (175) 10% (194) 1994Gender: Male 38% (353) 32% (298) 12% (112) 9% (89) 9% (82) 933Gender: Female 39% (417) 32% (339) 10% (107) 8% (86) 11% (112) 1061Age: 18-34 32% (159) 33% (164) 12% (62) 6% (31) 17% (85) 501Age: 35-44 30% (92) 36% (109) 11% (34) 9% (29) 13% (40) 303Age: 45-64 42% (302) 30% (221) 12% (86) 9% (67) 7% (50) 726Age: 65+ 47% (217) 31% (143) 8% (37) 10% (47) 4% (19) 464GenZers: 1997-2012 41% (69) 27% (45) 11% (18) 5% (9) 16% (27) 168Millennials: 1981-1996 27% (150) 36% (200) 13% (72) 7% (41) 16% (88) 551GenXers: 1965-1980 39% (165) 32% (137) 10% (41) 10% (42) 10% (40) 424Baby Boomers: 1946-1964 45% (351) 31% (241) 10% (82) 10% (78) 4% (32) 784PID: Dem (no lean) 42% (344) 38% (308) 10% (83) 2% (17) 8% (64) 817PID: Ind (no lean) 35% (189) 34% (186) 11% (61) 10% (52) 10% (55) 542PID: Rep (no lean) 37% (236) 22% (143) 12% (76) 17% (105) 12% (75) 635PID/Gender: DemMen 42% (146) 41% (143) 9% (32) 2% (5) 7% (23) 350PID/Gender: DemWomen 43% (199) 35% (165) 11% (51) 3% (12) 9% (41) 467PID/Gender: Ind Men 33% (93) 31% (88) 15% (42) 11% (32) 9% (26) 280PID/Gender: Ind Women 37% (96) 37% (98) 7% (19) 8% (20) 11% (29) 262PID/Gender: Rep Men 38% (114) 22% (66) 13% (39) 17% (52) 11% (33) 304PID/Gender: Rep Women 37% (122) 23% (77) 11% (37) 16% (54) 13% (43) 332Ideo: Liberal (1-3) 45% (281) 39% (243) 10% (60) 1% (8) 5% (33) 625Ideo: Moderate (4) 32% (184) 36% (208) 12% (66) 9% (52) 11% (60) 571Ideo: Conservative (5-7) 41% (281) 23% (156) 12% (81) 16% (107) 9% (60) 685Educ: < College 37% (470) 30% (377) 10% (131) 11% (136) 11% (141) 1254Educ: Bachelors degree 39% (184) 36% (169) 12% (56) 6% (27) 8% (36) 472Educ: Post-grad 43% (116) 34% (91) 12% (33) 4% (12) 6% (17) 268Income: Under 50k 38% (373) 31% (311) 10% (103) 8% (82) 12% (120) 989Income: 50k-100k 38% (231) 30% (179) 13% (76) 11% (68) 8% (48) 602Income: 100k+ 41% (165) 36% (147) 10% (40) 6% (25) 6% (26) 402Ethnicity: White 38% (613) 31% (499) 11% (181) 10% (162) 10% (158) 1613
Continued on next page
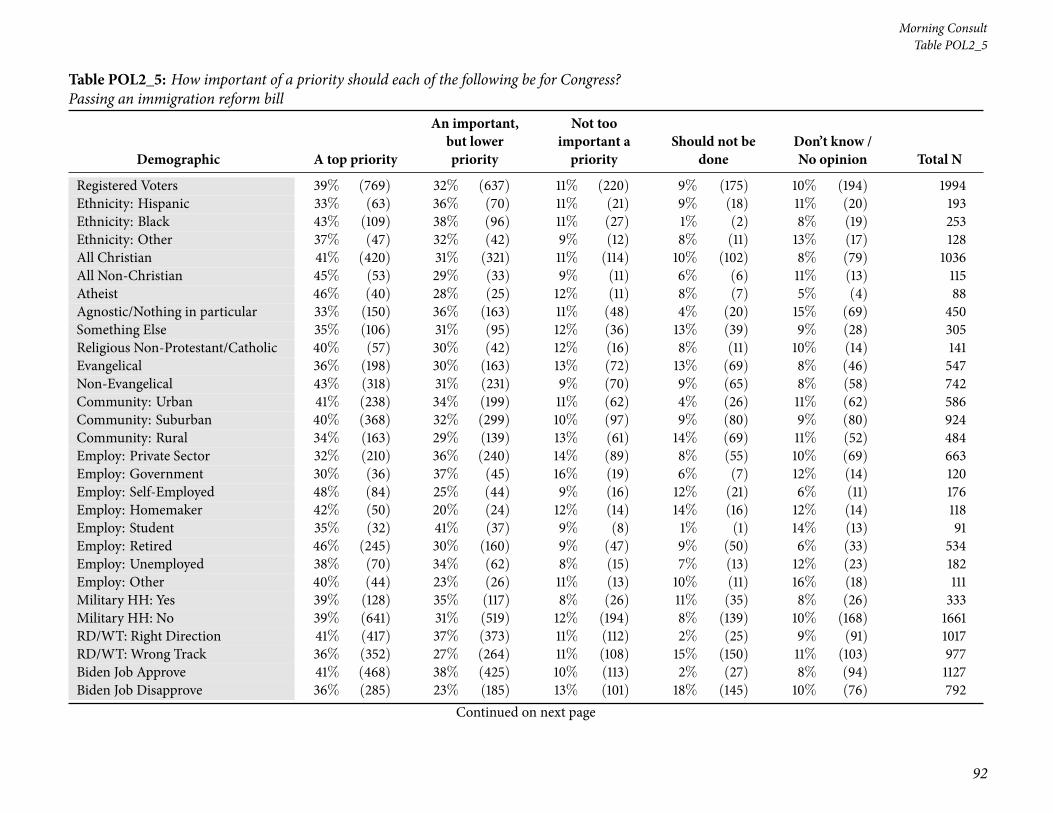
92
Morning ConsultTable POL2_5
Table POL2_5: How important of a priority should each of the following be for Congress?Passing an immigration reform bill
Demographic A top priority
An important,but lowerpriority
Not tooimportant apriority
Should not bedone
Don’t know /No opinion Total N
Registered Voters 39% (769) 32% (637) 11% (220) 9% (175) 10% (194) 1994Ethnicity: Hispanic 33% (63) 36% (70) 11% (21) 9% (18) 11% (20) 193Ethnicity: Black 43% (109) 38% (96) 11% (27) 1% (2) 8% (19) 253Ethnicity: Other 37% (47) 32% (42) 9% (12) 8% (11) 13% (17) 128All Christian 41% (420) 31% (321) 11% (114) 10% (102) 8% (79) 1036All Non-Christian 45% (53) 29% (33) 9% (11) 6% (6) 11% (13) 115Atheist 46% (40) 28% (25) 12% (11) 8% (7) 5% (4) 88Agnostic/Nothing in particular 33% (150) 36% (163) 11% (48) 4% (20) 15% (69) 450Something Else 35% (106) 31% (95) 12% (36) 13% (39) 9% (28) 305Religious Non-Protestant/Catholic 40% (57) 30% (42) 12% (16) 8% (11) 10% (14) 141Evangelical 36% (198) 30% (163) 13% (72) 13% (69) 8% (46) 547Non-Evangelical 43% (318) 31% (231) 9% (70) 9% (65) 8% (58) 742Community: Urban 41% (238) 34% (199) 11% (62) 4% (26) 11% (62) 586Community: Suburban 40% (368) 32% (299) 10% (97) 9% (80) 9% (80) 924Community: Rural 34% (163) 29% (139) 13% (61) 14% (69) 11% (52) 484Employ: Private Sector 32% (210) 36% (240) 14% (89) 8% (55) 10% (69) 663Employ: Government 30% (36) 37% (45) 16% (19) 6% (7) 12% (14) 120Employ: Self-Employed 48% (84) 25% (44) 9% (16) 12% (21) 6% (11) 176Employ: Homemaker 42% (50) 20% (24) 12% (14) 14% (16) 12% (14) 118Employ: Student 35% (32) 41% (37) 9% (8) 1% (1) 14% (13) 91Employ: Retired 46% (245) 30% (160) 9% (47) 9% (50) 6% (33) 534Employ: Unemployed 38% (70) 34% (62) 8% (15) 7% (13) 12% (23) 182Employ: Other 40% (44) 23% (26) 11% (13) 10% (11) 16% (18) 111Military HH: Yes 39% (128) 35% (117) 8% (26) 11% (35) 8% (26) 333Military HH: No 39% (641) 31% (519) 12% (194) 8% (139) 10% (168) 1661RD/WT: Right Direction 41% (417) 37% (373) 11% (112) 2% (25) 9% (91) 1017RD/WT: Wrong Track 36% (352) 27% (264) 11% (108) 15% (150) 11% (103) 977Biden Job Approve 41% (468) 38% (425) 10% (113) 2% (27) 8% (94) 1127Biden Job Disapprove 36% (285) 23% (185) 13% (101) 18% (145) 10% (76) 792
Continued on next page

National Tracking Poll #2103129, March, 2021
93
Table POL2_5
Table POL2_5: How important of a priority should each of the following be for Congress?Passing an immigration reform bill
Demographic A top priority
An important,but lowerpriority
Not tooimportant apriority
Should not bedone
Don’t know /No opinion Total N
Registered Voters 39% (769) 32% (637) 11% (220) 9% (175) 10% (194) 1994Biden Job Strongly Approve 48% (317) 34% (226) 10% (64) 1% (8) 7% (48) 663Biden Job Somewhat Approve 33% (151) 43% (199) 11% (49) 4% (19) 10% (46) 464Biden Job Somewhat Disapprove 28% (64) 32% (74) 17% (40) 12% (27) 10% (24) 229Biden Job Strongly Disapprove 39% (220) 20% (111) 11% (61) 21% (117) 9% (52) 562Favorable of Biden 41% (471) 39% (444) 10% (117) 2% (25) 7% (85) 1143Unfavorable of Biden 36% (285) 22% (176) 12% (97) 19% (148) 10% (78) 785Very Favorable of Biden 47% (300) 36% (229) 11% (73) 1% (8) 5% (34) 644Somewhat Favorable of Biden 34% (171) 43% (215) 9% (44) 3% (17) 10% (51) 499Somewhat Unfavorable of Biden 28% (54) 33% (63) 18% (35) 12% (22) 9% (17) 190Very Unfavorable of Biden 39% (232) 19% (113) 10% (62) 21% (126) 10% (62) 595#1 Issue: Economy 36% (258) 33% (239) 12% (85) 9% (62) 10% (69) 714#1 Issue: Security 44% (133) 21% (65) 7% (23) 17% (53) 10% (31) 305#1 Issue: Health Care 40% (124) 38% (118) 10% (30) 3% (10) 8% (25) 308#1 Issue: Medicare / Social Security 38% (102) 33% (88) 14% (36) 9% (23) 6% (17) 267#1 Issue: Women’s Issues 33% (29) 26% (23) 13% (12) 7% (7) 21% (18) 88#1 Issue: Education 32% (28) 37% (33) 12% (10) 4% (4) 16% (14) 89#1 Issue: Energy 37% (33) 34% (30) 14% (13) 5% (4) 10% (9) 89#1 Issue: Other 45% (61) 30% (40) 8% (10) 9% (12) 8% (10) 1342020 Vote: Joe Biden 42% (435) 39% (400) 10% (108) 2% (24) 7% (69) 10372020 Vote: Donald Trump 38% (280) 22% (161) 12% (86) 18% (131) 11% (83) 7412020 Vote: Other 20% (12) 38% (23) 11% (6) 14% (8) 18% (11) 602020 Vote: Didn’t Vote 28% (42) 35% (53) 13% (19) 7% (10) 18% (28) 1532018 House Vote: Democrat 42% (314) 38% (285) 11% (83) 2% (17) 7% (49) 7482018 House Vote: Republican 40% (248) 22% (137) 12% (72) 18% (111) 9% (56) 6232018 House Vote: Someone else 38% (21) 35% (19) 7% (4) 7% (4) 13% (7) 552016 Vote: Hillary Clinton 44% (305) 38% (269) 10% (73) 2% (17) 5% (35) 7002016 Vote: Donald Trump 39% (275) 22% (155) 12% (88) 17% (122) 10% (73) 7132016 Vote: Other 29% (31) 52% (56) 6% (7) 5% (6) 8% (8) 1082016 Vote: Didn’t Vote 34% (158) 33% (154) 10% (48) 6% (29) 17% (78) 467
Continued on next page

94
Morning ConsultTable POL2_5
Table POL2_5: How important of a priority should each of the following be for Congress?Passing an immigration reform bill
Demographic A top priority
An important,but lowerpriority
Not tooimportant apriority
Should not bedone
Don’t know /No opinion Total N
Registered Voters 39% (769) 32% (637) 11% (220) 9% (175) 10% (194) 1994Voted in 2014: Yes 41% (522) 31% (395) 12% (153) 9% (121) 7% (85) 1275Voted in 2014: No 34% (247) 34% (242) 9% (67) 7% (54) 15% (109) 7194-Region: Northeast 44% (157) 32% (112) 11% (40) 6% (20) 7% (26) 3564-Region: Midwest 32% (147) 34% (156) 10% (46) 10% (46) 14% (64) 4584-Region: South 41% (303) 32% (235) 11% (80) 10% (73) 7% (54) 7444-Region: West 37% (163) 31% (133) 12% (54) 8% (36) 12% (50) 436Party: Democrat/Leans Democrat 41% (404) 38% (368) 11% (103) 2% (22) 8% (76) 973Party: Republican/Leans Republican 37% (288) 23% (176) 12% (89) 16% (124) 12% (91) 768Note: Row proportions may total to larger than one-hundred percent due to rounding. For more information visit MorningConsultIntelligence.com.

National Tracking Poll #2103129, March, 2021
95
Table POL2_6
Table POL2_6: How important of a priority should each of the following be for Congress?Reducing the federal budget deficit
Demographic A top priority
An important,but lowerpriority
Not tooimportant apriority
Should not bedone
Don’t know /No opinion Total N
Registered Voters 43% (854) 34% (681) 12% (231) 2% (31) 10% (197) 1994Gender: Male 45% (417) 34% (317) 12% (108) 1% (13) 8% (78) 933Gender: Female 41% (437) 34% (364) 12% (123) 2% (18) 11% (119) 1061Age: 18-34 35% (173) 32% (162) 11% (53) 3% (14) 20% (98) 501Age: 35-44 39% (117) 38% (114) 11% (32) 1% (4) 12% (36) 303Age: 45-64 45% (329) 36% (261) 12% (88) 1% (6) 6% (43) 726Age: 65+ 51% (235) 31% (144) 13% (58) 1% (7) 4% (20) 464GenZers: 1997-2012 35% (59) 35% (59) 11% (18) 2% (4) 17% (28) 168Millennials: 1981-1996 35% (192) 34% (187) 11% (59) 2% (14) 18% (100) 551GenXers: 1965-1980 44% (187) 37% (158) 10% (44) 1% (6) 7% (29) 424Baby Boomers: 1946-1964 48% (380) 33% (257) 13% (104) 1% (8) 4% (35) 784PID: Dem (no lean) 35% (283) 39% (319) 16% (131) 2% (13) 9% (70) 817PID: Ind (no lean) 44% (241) 32% (173) 10% (55) 2% (11) 11% (62) 542PID: Rep (no lean) 52% (330) 30% (189) 7% (45) 1% (7) 10% (64) 635PID/Gender: DemMen 35% (122) 41% (143) 16% (56) 1% (3) 8% (27) 350PID/Gender: DemWomen 35% (161) 38% (177) 16% (75) 2% (10) 9% (44) 467PID/Gender: Ind Men 50% (139) 27% (75) 11% (31) 2% (6) 10% (29) 280PID/Gender: Ind Women 39% (102) 37% (98) 9% (24) 2% (5) 13% (34) 262PID/Gender: Rep Men 51% (156) 33% (99) 7% (22) 1% (4) 8% (23) 304PID/Gender: Rep Women 52% (174) 27% (90) 7% (24) 1% (3) 12% (41) 332Ideo: Liberal (1-3) 33% (206) 38% (235) 19% (119) 3% (18) 8% (48) 625Ideo: Moderate (4) 38% (217) 40% (229) 10% (55) 1% (8) 11% (61) 571Ideo: Conservative (5-7) 58% (396) 28% (192) 7% (47) 1% (4) 7% (47) 685Educ: < College 45% (563) 32% (403) 10% (121) 1% (18) 12% (150) 1254Educ: Bachelors degree 38% (177) 39% (183) 15% (70) 2% (10) 7% (32) 472Educ: Post-grad 42% (114) 35% (95) 15% (40) 2% (4) 6% (15) 268Income: Under 50k 41% (402) 34% (332) 12% (114) 2% (16) 13% (126) 989Income: 50k-100k 43% (262) 36% (217) 12% (72) 2% (10) 7% (41) 602Income: 100k+ 47% (190) 33% (132) 11% (45) 1% (6) 7% (29) 402Ethnicity: White 43% (699) 35% (560) 11% (177) 2% (27) 9% (150) 1613
Continued on next page

96
Morning ConsultTable POL2_6
Table POL2_6: How important of a priority should each of the following be for Congress?Reducing the federal budget deficit
Demographic A top priority
An important,but lowerpriority
Not tooimportant apriority
Should not bedone
Don’t know /No opinion Total N
Registered Voters 43% (854) 34% (681) 12% (231) 2% (31) 10% (197) 1994Ethnicity: Hispanic 43% (84) 32% (62) 9% (17) 4% (7) 12% (23) 193Ethnicity: Black 46% (116) 28% (70) 14% (36) 1% (3) 11% (27) 253Ethnicity: Other 30% (39) 40% (51) 14% (18) 1% (1) 15% (20) 128All Christian 48% (493) 34% (354) 10% (107) 1% (12) 7% (71) 1036All Non-Christian 39% (45) 35% (41) 13% (16) 2% (2) 10% (12) 115Atheist 28% (24) 39% (34) 26% (23) 3% (3) 4% (3) 88Agnostic/Nothing in particular 37% (165) 34% (153) 11% (50) 2% (9) 16% (73) 450Something Else 42% (127) 33% (99) 12% (35) 2% (6) 12% (37) 305Religious Non-Protestant/Catholic 42% (60) 33% (47) 12% (16) 2% (2) 11% (15) 141Evangelical 48% (265) 30% (164) 10% (56) 1% (5) 10% (57) 547Non-Evangelical 45% (331) 37% (273) 11% (80) 2% (12) 6% (46) 742Community: Urban 41% (240) 33% (196) 14% (80) 1% (6) 11% (64) 586Community: Suburban 42% (392) 36% (331) 11% (98) 2% (19) 9% (84) 924Community: Rural 46% (221) 32% (154) 11% (53) 1% (7) 10% (49) 484Employ: Private Sector 40% (264) 39% (256) 11% (71) 2% (12) 9% (60) 663Employ: Government 35% (42) 31% (37) 21% (25) 3% (4) 10% (12) 120Employ: Self-Employed 53% (94) 29% (51) 10% (17) 1% (2) 7% (12) 176Employ: Homemaker 46% (54) 28% (33) 12% (14) 1% (1) 13% (15) 118Employ: Student 38% (34) 39% (35) 8% (7) 2% (1) 14% (13) 91Employ: Retired 47% (250) 33% (175) 13% (69) 1% (7) 6% (33) 534Employ: Unemployed 46% (84) 27% (49) 9% (16) 2% (4) 16% (29) 182Employ: Other 28% (31) 41% (45) 11% (12) — (0) 21% (23) 111Military HH: Yes 46% (154) 34% (115) 11% (36) 1% (3) 7% (25) 333Military HH: No 42% (700) 34% (566) 12% (195) 2% (28) 10% (172) 1661RD/WT: Right Direction 37% (380) 36% (363) 15% (154) 2% (23) 10% (98) 1017RD/WT: Wrong Track 49% (474) 33% (318) 8% (77) 1% (9) 10% (99) 977Biden Job Approve 35% (391) 39% (443) 15% (171) 2% (24) 9% (98) 1127Biden Job Disapprove 55% (435) 28% (218) 7% (58) 1% (7) 9% (74) 792
Continued on next page
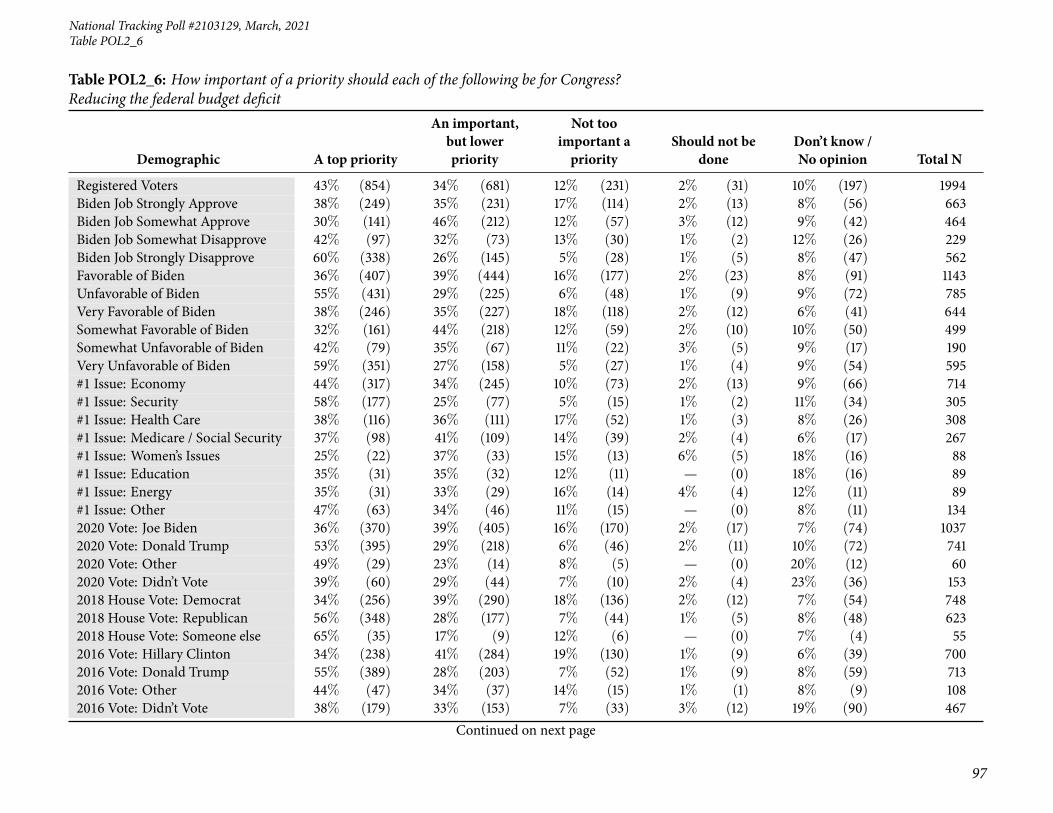
National Tracking Poll #2103129, March, 2021
97
Table POL2_6
Table POL2_6: How important of a priority should each of the following be for Congress?Reducing the federal budget deficit
Demographic A top priority
An important,but lowerpriority
Not tooimportant apriority
Should not bedone
Don’t know /No opinion Total N
Registered Voters 43% (854) 34% (681) 12% (231) 2% (31) 10% (197) 1994Biden Job Strongly Approve 38% (249) 35% (231) 17% (114) 2% (13) 8% (56) 663Biden Job Somewhat Approve 30% (141) 46% (212) 12% (57) 3% (12) 9% (42) 464Biden Job Somewhat Disapprove 42% (97) 32% (73) 13% (30) 1% (2) 12% (26) 229Biden Job Strongly Disapprove 60% (338) 26% (145) 5% (28) 1% (5) 8% (47) 562Favorable of Biden 36% (407) 39% (444) 16% (177) 2% (23) 8% (91) 1143Unfavorable of Biden 55% (431) 29% (225) 6% (48) 1% (9) 9% (72) 785Very Favorable of Biden 38% (246) 35% (227) 18% (118) 2% (12) 6% (41) 644Somewhat Favorable of Biden 32% (161) 44% (218) 12% (59) 2% (10) 10% (50) 499Somewhat Unfavorable of Biden 42% (79) 35% (67) 11% (22) 3% (5) 9% (17) 190Very Unfavorable of Biden 59% (351) 27% (158) 5% (27) 1% (4) 9% (54) 595#1 Issue: Economy 44% (317) 34% (245) 10% (73) 2% (13) 9% (66) 714#1 Issue: Security 58% (177) 25% (77) 5% (15) 1% (2) 11% (34) 305#1 Issue: Health Care 38% (116) 36% (111) 17% (52) 1% (3) 8% (26) 308#1 Issue: Medicare / Social Security 37% (98) 41% (109) 14% (39) 2% (4) 6% (17) 267#1 Issue: Women’s Issues 25% (22) 37% (33) 15% (13) 6% (5) 18% (16) 88#1 Issue: Education 35% (31) 35% (32) 12% (11) — (0) 18% (16) 89#1 Issue: Energy 35% (31) 33% (29) 16% (14) 4% (4) 12% (11) 89#1 Issue: Other 47% (63) 34% (46) 11% (15) — (0) 8% (11) 1342020 Vote: Joe Biden 36% (370) 39% (405) 16% (170) 2% (17) 7% (74) 10372020 Vote: Donald Trump 53% (395) 29% (218) 6% (46) 2% (11) 10% (72) 7412020 Vote: Other 49% (29) 23% (14) 8% (5) — (0) 20% (12) 602020 Vote: Didn’t Vote 39% (60) 29% (44) 7% (10) 2% (4) 23% (36) 1532018 House Vote: Democrat 34% (256) 39% (290) 18% (136) 2% (12) 7% (54) 7482018 House Vote: Republican 56% (348) 28% (177) 7% (44) 1% (5) 8% (48) 6232018 House Vote: Someone else 65% (35) 17% (9) 12% (6) — (0) 7% (4) 552016 Vote: Hillary Clinton 34% (238) 41% (284) 19% (130) 1% (9) 6% (39) 7002016 Vote: Donald Trump 55% (389) 28% (203) 7% (52) 1% (9) 8% (59) 7132016 Vote: Other 44% (47) 34% (37) 14% (15) 1% (1) 8% (9) 1082016 Vote: Didn’t Vote 38% (179) 33% (153) 7% (33) 3% (12) 19% (90) 467
Continued on next page

98
Morning ConsultTable POL2_6
Table POL2_6: How important of a priority should each of the following be for Congress?Reducing the federal budget deficit
Demographic A top priority
An important,but lowerpriority
Not tooimportant apriority
Should not bedone
Don’t know /No opinion Total N
Registered Voters 43% (854) 34% (681) 12% (231) 2% (31) 10% (197) 1994Voted in 2014: Yes 46% (586) 33% (423) 13% (165) 2% (20) 6% (81) 1275Voted in 2014: No 37% (268) 36% (258) 9% (66) 2% (11) 16% (116) 7194-Region: Northeast 41% (145) 36% (129) 11% (40) 2% (7) 10% (35) 3564-Region: Midwest 39% (178) 38% (174) 11% (49) 2% (8) 11% (50) 4584-Region: South 49% (362) 32% (235) 11% (84) 1% (6) 8% (57) 7444-Region: West 39% (169) 33% (143) 13% (57) 2% (11) 13% (56) 436Party: Democrat/Leans Democrat 34% (326) 40% (388) 16% (158) 2% (17) 9% (84) 973Party: Republican/Leans Republican 52% (402) 28% (219) 7% (55) 1% (9) 11% (84) 768Note: Row proportions may total to larger than one-hundred percent due to rounding. For more information visit MorningConsultIntelligence.com.

National Tracking Poll #2103129, March, 2021
99
Table POL2_7
Table POL2_7: How important of a priority should each of the following be for Congress?Passing legislation placing additional restrictions on gun ownership
Demographic A top priority
An important,but lowerpriority
Not tooimportant apriority
Should not bedone
Don’t know /No opinion Total N
Registered Voters 31% (621) 23% (461) 13% (261) 25% (491) 8% (160) 1994Gender: Male 29% (267) 22% (209) 13% (124) 29% (269) 7% (64) 933Gender: Female 33% (353) 24% (252) 13% (137) 21% (222) 9% (96) 1061Age: 18-34 34% (169) 27% (137) 12% (60) 12% (60) 15% (75) 501Age: 35-44 27% (83) 25% (76) 15% (45) 23% (69) 10% (30) 303Age: 45-64 32% (229) 20% (149) 11% (82) 31% (228) 5% (38) 726Age: 65+ 30% (140) 21% (99) 16% (74) 29% (134) 4% (17) 464GenZers: 1997-2012 34% (58) 30% (51) 11% (18) 10% (17) 14% (24) 168Millennials: 1981-1996 31% (170) 26% (141) 14% (78) 16% (90) 13% (73) 551GenXers: 1965-1980 30% (128) 23% (97) 11% (46) 28% (120) 8% (34) 424Baby Boomers: 1946-1964 31% (244) 21% (161) 14% (108) 31% (243) 4% (28) 784PID: Dem (no lean) 50% (407) 31% (253) 7% (59) 4% (32) 8% (65) 817PID: Ind (no lean) 22% (119) 22% (121) 18% (96) 30% (164) 8% (42) 542PID: Rep (no lean) 15% (95) 14% (86) 17% (106) 46% (295) 8% (52) 635PID/Gender: DemMen 48% (167) 34% (119) 7% (25) 5% (16) 7% (23) 350PID/Gender: DemWomen 51% (240) 29% (134) 7% (35) 3% (16) 9% (42) 467PID/Gender: Ind Men 20% (57) 19% (55) 15% (43) 38% (105) 7% (20) 280PID/Gender: Ind Women 23% (62) 25% (67) 20% (53) 22% (59) 8% (22) 262PID/Gender: Rep Men 14% (43) 12% (35) 19% (56) 49% (148) 7% (21) 304PID/Gender: Rep Women 16% (52) 15% (51) 15% (50) 45% (148) 9% (31) 332Ideo: Liberal (1-3) 50% (316) 31% (195) 9% (55) 6% (35) 4% (25) 625Ideo: Moderate (4) 29% (167) 28% (159) 16% (90) 17% (96) 10% (58) 571Ideo: Conservative (5-7) 16% (109) 13% (89) 15% (100) 51% (351) 5% (37) 685Educ: < College 29% (359) 20% (255) 14% (172) 27% (344) 10% (124) 1254Educ: Bachelors degree 34% (160) 27% (128) 13% (62) 21% (98) 5% (24) 472Educ: Post-grad 38% (101) 29% (78) 10% (27) 18% (49) 5% (13) 268Income: Under 50k 31% (306) 22% (217) 14% (137) 23% (229) 10% (102) 989Income: 50k-100k 30% (178) 21% (126) 14% (86) 29% (175) 6% (37) 602Income: 100k+ 34% (137) 29% (118) 10% (39) 22% (87) 5% (21) 402Ethnicity: White 29% (465) 22% (359) 13% (218) 28% (452) 7% (119) 1613
Continued on next page

100
Morning ConsultTable POL2_7
Table POL2_7: How important of a priority should each of the following be for Congress?Passing legislation placing additional restrictions on gun ownership
Demographic A top priority
An important,but lowerpriority
Not tooimportant apriority
Should not bedone
Don’t know /No opinion Total N
Registered Voters 31% (621) 23% (461) 13% (261) 25% (491) 8% (160) 1994Ethnicity: Hispanic 33% (64) 22% (43) 14% (27) 22% (43) 9% (18) 193Ethnicity: Black 47% (119) 26% (65) 11% (27) 6% (15) 11% (27) 253Ethnicity: Other 29% (37) 29% (37) 13% (17) 18% (23) 11% (14) 128All Christian 30% (312) 22% (232) 13% (135) 29% (296) 6% (62) 1036All Non-Christian 46% (53) 26% (29) 9% (10) 9% (11) 10% (12) 115Atheist 42% (37) 30% (26) 16% (14) 9% (8) 3% (2) 88Agnostic/Nothing in particular 29% (131) 26% (115) 14% (61) 19% (86) 13% (57) 450Something Else 29% (88) 19% (58) 13% (40) 30% (90) 9% (28) 305Religious Non-Protestant/Catholic 42% (59) 23% (33) 10% (15) 16% (22) 9% (12) 141Evangelical 26% (144) 19% (103) 13% (71) 34% (186) 8% (44) 547Non-Evangelical 33% (244) 24% (176) 13% (96) 25% (184) 6% (43) 742Community: Urban 40% (236) 27% (156) 12% (68) 13% (77) 8% (49) 586Community: Suburban 32% (297) 24% (218) 12% (114) 25% (230) 7% (65) 924Community: Rural 18% (88) 18% (87) 16% (80) 38% (184) 9% (45) 484Employ: Private Sector 30% (198) 25% (168) 15% (97) 23% (150) 7% (49) 663Employ: Government 36% (43) 26% (32) 7% (9) 22% (27) 9% (10) 120Employ: Self-Employed 41% (73) 19% (34) 10% (18) 22% (39) 7% (12) 176Employ: Homemaker 28% (33) 15% (18) 10% (12) 36% (43) 10% (12) 118Employ: Student 29% (26) 36% (33) 16% (14) 6% (6) 13% (12) 91Employ: Retired 29% (156) 20% (108) 16% (86) 29% (155) 5% (29) 534Employ: Unemployed 32% (57) 19% (35) 11% (21) 27% (48) 11% (20) 182Employ: Other 31% (34) 30% (33) 4% (4) 21% (23) 15% (17) 111Military HH: Yes 27% (91) 24% (81) 11% (36) 31% (103) 7% (22) 333Military HH: No 32% (530) 23% (380) 14% (225) 23% (388) 8% (138) 1661RD/WT: Right Direction 46% (469) 30% (309) 10% (104) 6% (57) 8% (79) 1017RD/WT: Wrong Track 16% (152) 16% (152) 16% (158) 44% (434) 8% (81) 977Biden Job Approve 46% (513) 32% (356) 10% (110) 5% (59) 8% (88) 1127Biden Job Disapprove 12% (95) 11% (83) 17% (137) 53% (422) 7% (54) 792
Continued on next page
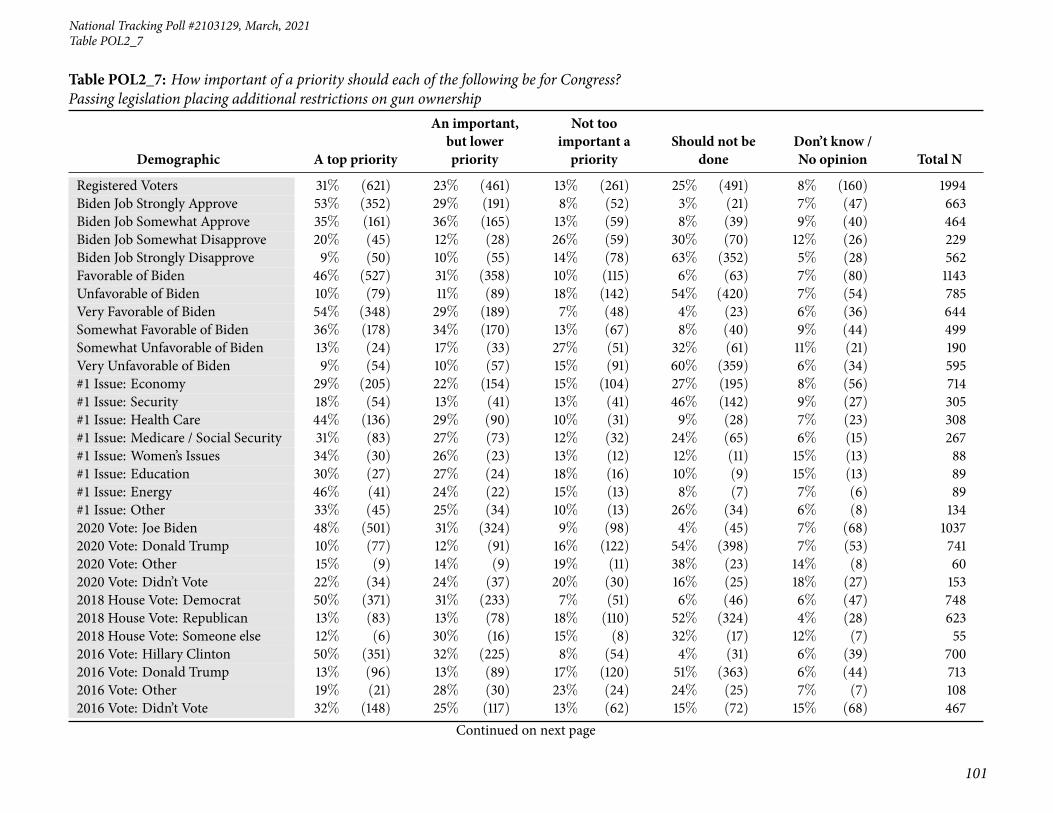
National Tracking Poll #2103129, March, 2021
101
Table POL2_7
Table POL2_7: How important of a priority should each of the following be for Congress?Passing legislation placing additional restrictions on gun ownership
Demographic A top priority
An important,but lowerpriority
Not tooimportant apriority
Should not bedone
Don’t know /No opinion Total N
Registered Voters 31% (621) 23% (461) 13% (261) 25% (491) 8% (160) 1994Biden Job Strongly Approve 53% (352) 29% (191) 8% (52) 3% (21) 7% (47) 663Biden Job Somewhat Approve 35% (161) 36% (165) 13% (59) 8% (39) 9% (40) 464Biden Job Somewhat Disapprove 20% (45) 12% (28) 26% (59) 30% (70) 12% (26) 229Biden Job Strongly Disapprove 9% (50) 10% (55) 14% (78) 63% (352) 5% (28) 562Favorable of Biden 46% (527) 31% (358) 10% (115) 6% (63) 7% (80) 1143Unfavorable of Biden 10% (79) 11% (89) 18% (142) 54% (420) 7% (54) 785Very Favorable of Biden 54% (348) 29% (189) 7% (48) 4% (23) 6% (36) 644Somewhat Favorable of Biden 36% (178) 34% (170) 13% (67) 8% (40) 9% (44) 499Somewhat Unfavorable of Biden 13% (24) 17% (33) 27% (51) 32% (61) 11% (21) 190Very Unfavorable of Biden 9% (54) 10% (57) 15% (91) 60% (359) 6% (34) 595#1 Issue: Economy 29% (205) 22% (154) 15% (104) 27% (195) 8% (56) 714#1 Issue: Security 18% (54) 13% (41) 13% (41) 46% (142) 9% (27) 305#1 Issue: Health Care 44% (136) 29% (90) 10% (31) 9% (28) 7% (23) 308#1 Issue: Medicare / Social Security 31% (83) 27% (73) 12% (32) 24% (65) 6% (15) 267#1 Issue: Women’s Issues 34% (30) 26% (23) 13% (12) 12% (11) 15% (13) 88#1 Issue: Education 30% (27) 27% (24) 18% (16) 10% (9) 15% (13) 89#1 Issue: Energy 46% (41) 24% (22) 15% (13) 8% (7) 7% (6) 89#1 Issue: Other 33% (45) 25% (34) 10% (13) 26% (34) 6% (8) 1342020 Vote: Joe Biden 48% (501) 31% (324) 9% (98) 4% (45) 7% (68) 10372020 Vote: Donald Trump 10% (77) 12% (91) 16% (122) 54% (398) 7% (53) 7412020 Vote: Other 15% (9) 14% (9) 19% (11) 38% (23) 14% (8) 602020 Vote: Didn’t Vote 22% (34) 24% (37) 20% (30) 16% (25) 18% (27) 1532018 House Vote: Democrat 50% (371) 31% (233) 7% (51) 6% (46) 6% (47) 7482018 House Vote: Republican 13% (83) 13% (78) 18% (110) 52% (324) 4% (28) 6232018 House Vote: Someone else 12% (6) 30% (16) 15% (8) 32% (17) 12% (7) 552016 Vote: Hillary Clinton 50% (351) 32% (225) 8% (54) 4% (31) 6% (39) 7002016 Vote: Donald Trump 13% (96) 13% (89) 17% (120) 51% (363) 6% (44) 7132016 Vote: Other 19% (21) 28% (30) 23% (24) 24% (25) 7% (7) 1082016 Vote: Didn’t Vote 32% (148) 25% (117) 13% (62) 15% (72) 15% (68) 467
Continued on next page

102
Morning ConsultTable POL2_7
Table POL2_7: How important of a priority should each of the following be for Congress?Passing legislation placing additional restrictions on gun ownership
Demographic A top priority
An important,but lowerpriority
Not tooimportant apriority
Should not bedone
Don’t know /No opinion Total N
Registered Voters 31% (621) 23% (461) 13% (261) 25% (491) 8% (160) 1994Voted in 2014: Yes 31% (396) 21% (273) 13% (163) 29% (373) 5% (70) 1275Voted in 2014: No 31% (225) 26% (188) 14% (98) 16% (118) 13% (91) 7194-Region: Northeast 37% (131) 26% (91) 12% (41) 17% (62) 9% (31) 3564-Region: Midwest 23% (106) 26% (118) 15% (70) 27% (125) 9% (39) 4584-Region: South 32% (238) 20% (152) 13% (94) 28% (206) 7% (54) 7444-Region: West 33% (145) 23% (99) 13% (56) 23% (99) 8% (36) 436Party: Democrat/Leans Democrat 48% (466) 32% (308) 8% (81) 4% (43) 8% (75) 973Party: Republican/Leans Republican 14% (110) 13% (98) 17% (131) 48% (366) 8% (63) 768Note: Row proportions may total to larger than one-hundred percent due to rounding. For more information visit MorningConsultIntelligence.com.

National Tracking Poll #2103129, March, 2021
103
Table POL2_8
Table POL2_8: How important of a priority should each of the following be for Congress?Regulating tech companies
Demographic A top priority
An important,but lowerpriority
Not tooimportant apriority
Should not bedone
Don’t know /No opinion Total N
Registered Voters 23% (461) 37% (732) 23% (456) 5% (96) 12% (249) 1994Gender: Male 29% (266) 37% (347) 20% (186) 6% (55) 8% (79) 933Gender: Female 18% (194) 36% (385) 25% (270) 4% (42) 16% (170) 1061Age: 18-34 20% (101) 33% (166) 24% (122) 4% (18) 19% (93) 501Age: 35-44 25% (77) 37% (112) 18% (54) 7% (22) 12% (38) 303Age: 45-64 24% (177) 37% (270) 23% (169) 5% (36) 10% (75) 726Age: 65+ 23% (106) 40% (184) 24% (111) 4% (20) 9% (43) 464GenZers: 1997-2012 9% (15) 39% (65) 32% (54) 4% (6) 17% (28) 168Millennials: 1981-1996 26% (143) 33% (182) 19% (105) 5% (27) 17% (94) 551GenXers: 1965-1980 24% (103) 38% (161) 22% (92) 5% (21) 11% (48) 424Baby Boomers: 1946-1964 23% (182) 38% (301) 24% (189) 5% (41) 9% (72) 784PID: Dem (no lean) 20% (163) 43% (354) 22% (182) 3% (26) 11% (91) 817PID: Ind (no lean) 21% (114) 35% (190) 25% (136) 5% (28) 14% (73) 542PID: Rep (no lean) 29% (183) 30% (188) 22% (137) 7% (42) 13% (85) 635PID/Gender: DemMen 26% (89) 43% (151) 21% (72) 4% (15) 6% (22) 350PID/Gender: DemWomen 16% (74) 44% (203) 24% (110) 2% (11) 15% (69) 467PID/Gender: Ind Men 27% (75) 37% (103) 20% (56) 6% (17) 10% (29) 280PID/Gender: Ind Women 15% (39) 33% (87) 31% (80) 4% (11) 17% (45) 262PID/Gender: Rep Men 34% (102) 31% (93) 19% (58) 7% (22) 9% (28) 304PID/Gender: Rep Women 24% (81) 29% (95) 24% (80) 6% (20) 17% (57) 332Ideo: Liberal (1-3) 21% (130) 41% (257) 26% (161) 3% (18) 9% (58) 625Ideo: Moderate (4) 18% (104) 39% (221) 25% (143) 4% (23) 14% (80) 571Ideo: Conservative (5-7) 30% (208) 33% (229) 20% (135) 7% (50) 9% (64) 685Educ: < College 22% (279) 36% (454) 23% (284) 4% (51) 15% (186) 1254Educ: Bachelors degree 22% (104) 38% (178) 23% (110) 7% (32) 10% (48) 472Educ: Post-grad 29% (78) 37% (100) 23% (62) 5% (13) 6% (15) 268Income: Under 50k 22% (219) 37% (364) 22% (220) 3% (33) 16% (153) 989Income: 50k-100k 22% (135) 36% (216) 25% (148) 6% (37) 11% (66) 602Income: 100k+ 27% (107) 38% (152) 22% (88) 7% (26) 7% (29) 402Ethnicity: White 24% (390) 35% (561) 24% (384) 5% (83) 12% (195) 1613
Continued on next page

104
Morning ConsultTable POL2_8
Table POL2_8: How important of a priority should each of the following be for Congress?Regulating tech companies
Demographic A top priority
An important,but lowerpriority
Not tooimportant apriority
Should not bedone
Don’t know /No opinion Total N
Registered Voters 23% (461) 37% (732) 23% (456) 5% (96) 12% (249) 1994Ethnicity: Hispanic 23% (45) 39% (75) 24% (46) 4% (8) 10% (19) 193Ethnicity: Black 19% (48) 48% (120) 15% (37) 4% (9) 15% (38) 253Ethnicity: Other 18% (23) 39% (50) 27% (35) 3% (4) 13% (16) 128All Christian 24% (253) 39% (403) 21% (221) 5% (50) 11% (109) 1036All Non-Christian 32% (36) 33% (38) 17% (20) 8% (9) 11% (13) 115Atheist 22% (19) 36% (32) 32% (28) 2% (2) 7% (6) 88Agnostic/Nothing in particular 20% (89) 34% (155) 24% (109) 5% (23) 16% (74) 450Something Else 21% (63) 34% (105) 25% (77) 4% (13) 15% (46) 305Religious Non-Protestant/Catholic 28% (39) 29% (40) 20% (28) 12% (16) 12% (17) 141Evangelical 26% (141) 36% (198) 19% (104) 5% (29) 14% (75) 547Non-Evangelical 22% (166) 40% (296) 24% (182) 3% (24) 10% (74) 742Community: Urban 26% (151) 39% (226) 20% (115) 3% (20) 13% (74) 586Community: Suburban 22% (200) 37% (340) 24% (226) 6% (56) 11% (103) 924Community: Rural 23% (109) 34% (166) 24% (115) 4% (21) 15% (72) 484Employ: Private Sector 21% (137) 40% (262) 22% (147) 6% (39) 11% (76) 663Employ: Government 21% (25) 33% (39) 28% (34) 3% (3) 16% (19) 120Employ: Self-Employed 37% (65) 31% (54) 16% (28) 8% (14) 8% (14) 176Employ: Homemaker 23% (27) 21% (25) 31% (36) 4% (5) 21% (25) 118Employ: Student 6% (5) 49% (45) 32% (29) 2% (2) 11% (10) 91Employ: Retired 24% (129) 37% (197) 24% (130) 4% (20) 11% (58) 534Employ: Unemployed 26% (48) 37% (67) 17% (31) 6% (10) 14% (25) 182Employ: Other 21% (23) 38% (42) 18% (20) 2% (3) 20% (22) 111Military HH: Yes 26% (86) 33% (110) 26% (87) 5% (15) 10% (34) 333Military HH: No 23% (375) 37% (621) 22% (369) 5% (81) 13% (215) 1661RD/WT: Right Direction 20% (203) 40% (410) 23% (238) 4% (36) 13% (130) 1017RD/WT: Wrong Track 26% (258) 33% (322) 22% (218) 6% (60) 12% (119) 977Biden Job Approve 19% (219) 42% (470) 24% (269) 4% (43) 11% (125) 1127Biden Job Disapprove 29% (229) 31% (244) 22% (172) 7% (52) 12% (95) 792
Continued on next page

National Tracking Poll #2103129, March, 2021
105
Table POL2_8
Table POL2_8: How important of a priority should each of the following be for Congress?Regulating tech companies
Demographic A top priority
An important,but lowerpriority
Not tooimportant apriority
Should not bedone
Don’t know /No opinion Total N
Registered Voters 23% (461) 37% (732) 23% (456) 5% (96) 12% (249) 1994Biden Job Strongly Approve 24% (157) 40% (268) 23% (150) 3% (20) 10% (68) 663Biden Job Somewhat Approve 13% (62) 44% (202) 26% (119) 5% (23) 12% (57) 464Biden Job Somewhat Disapprove 11% (26) 33% (76) 29% (68) 7% (16) 19% (44) 229Biden Job Strongly Disapprove 36% (203) 30% (168) 19% (104) 6% (36) 9% (51) 562Favorable of Biden 18% (211) 42% (484) 24% (273) 4% (42) 12% (132) 1143Unfavorable of Biden 30% (235) 30% (233) 23% (179) 7% (52) 11% (86) 785Very Favorable of Biden 22% (142) 42% (274) 22% (144) 3% (22) 10% (62) 644Somewhat Favorable of Biden 14% (69) 42% (210) 26% (129) 4% (20) 14% (70) 499Somewhat Unfavorable of Biden 14% (27) 30% (57) 34% (64) 7% (14) 15% (28) 190Very Unfavorable of Biden 35% (208) 30% (176) 19% (115) 6% (38) 10% (59) 595#1 Issue: Economy 22% (157) 38% (273) 22% (154) 6% (40) 13% (91) 714#1 Issue: Security 30% (92) 34% (104) 19% (57) 6% (18) 11% (33) 305#1 Issue: Health Care 19% (59) 41% (125) 27% (83) 4% (11) 9% (29) 308#1 Issue: Medicare / Social Security 22% (58) 37% (98) 25% (66) 4% (10) 13% (35) 267#1 Issue: Women’s Issues 23% (21) 25% (22) 25% (22) 6% (5) 21% (19) 88#1 Issue: Education 15% (13) 37% (33) 32% (29) 1% (1) 15% (13) 89#1 Issue: Energy 17% (15) 42% (38) 22% (20) 4% (3) 15% (13) 89#1 Issue: Other 33% (45) 29% (39) 20% (27) 6% (8) 12% (16) 1342020 Vote: Joe Biden 19% (195) 43% (444) 25% (254) 4% (39) 10% (104) 10372020 Vote: Donald Trump 30% (221) 31% (233) 21% (153) 6% (41) 13% (94) 7412020 Vote: Other 20% (12) 30% (18) 16% (10) 15% (9) 18% (11) 602020 Vote: Didn’t Vote 21% (32) 24% (37) 26% (39) 5% (7) 24% (37) 1532018 House Vote: Democrat 22% (165) 42% (318) 22% (166) 3% (25) 10% (74) 7482018 House Vote: Republican 31% (191) 29% (183) 22% (139) 7% (46) 10% (64) 6232018 House Vote: Someone else 20% (11) 36% (19) 12% (7) 8% (4) 24% (13) 552016 Vote: Hillary Clinton 21% (150) 41% (286) 24% (170) 4% (28) 9% (65) 7002016 Vote: Donald Trump 30% (213) 30% (216) 22% (156) 6% (44) 12% (83) 7132016 Vote: Other 11% (12) 42% (45) 27% (29) 9% (10) 11% (12) 1082016 Vote: Didn’t Vote 18% (83) 39% (182) 21% (100) 3% (14) 19% (89) 467
Continued on next page

106
Morning ConsultTable POL2_8
Table POL2_8: How important of a priority should each of the following be for Congress?Regulating tech companies
Demographic A top priority
An important,but lowerpriority
Not tooimportant apriority
Should not bedone
Don’t know /No opinion Total N
Registered Voters 23% (461) 37% (732) 23% (456) 5% (96) 12% (249) 1994Voted in 2014: Yes 25% (322) 37% (471) 23% (291) 5% (67) 10% (124) 1275Voted in 2014: No 19% (138) 36% (261) 23% (166) 4% (29) 17% (125) 7194-Region: Northeast 23% (83) 38% (135) 21% (76) 5% (18) 13% (45) 3564-Region: Midwest 22% (101) 32% (146) 27% (122) 5% (24) 14% (65) 4584-Region: South 21% (157) 42% (312) 22% (162) 4% (29) 11% (84) 7444-Region: West 27% (119) 32% (139) 22% (96) 6% (26) 13% (55) 436Party: Democrat/Leans Democrat 19% (185) 43% (414) 24% (231) 3% (31) 12% (112) 973Party: Republican/Leans Republican 29% (222) 31% (235) 21% (162) 6% (46) 13% (103) 768Note: Row proportions may total to larger than one-hundred percent due to rounding. For more information visit MorningConsultIntelligence.com.
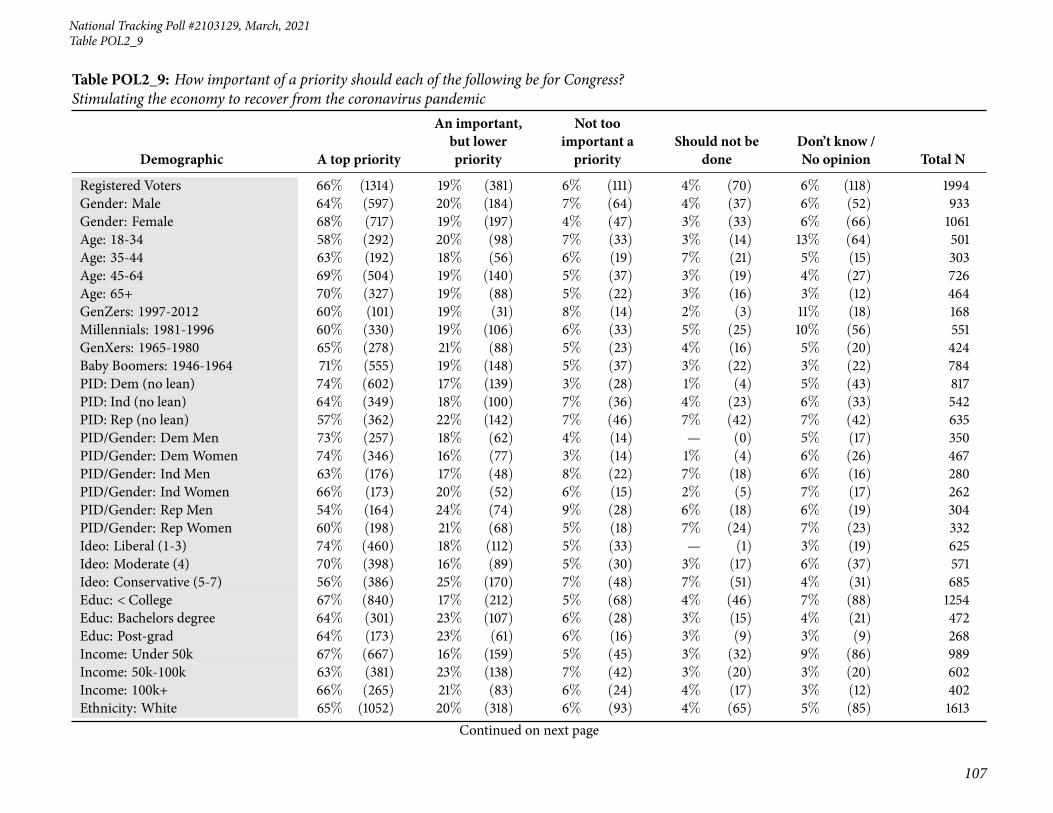
National Tracking Poll #2103129, March, 2021
107
Table POL2_9
Table POL2_9: How important of a priority should each of the following be for Congress?Stimulating the economy to recover from the coronavirus pandemic
Demographic A top priority
An important,but lowerpriority
Not tooimportant apriority
Should not bedone
Don’t know /No opinion Total N
Registered Voters 66% (1314) 19% (381) 6% (111) 4% (70) 6% (118) 1994Gender: Male 64% (597) 20% (184) 7% (64) 4% (37) 6% (52) 933Gender: Female 68% (717) 19% (197) 4% (47) 3% (33) 6% (66) 1061Age: 18-34 58% (292) 20% (98) 7% (33) 3% (14) 13% (64) 501Age: 35-44 63% (192) 18% (56) 6% (19) 7% (21) 5% (15) 303Age: 45-64 69% (504) 19% (140) 5% (37) 3% (19) 4% (27) 726Age: 65+ 70% (327) 19% (88) 5% (22) 3% (16) 3% (12) 464GenZers: 1997-2012 60% (101) 19% (31) 8% (14) 2% (3) 11% (18) 168Millennials: 1981-1996 60% (330) 19% (106) 6% (33) 5% (25) 10% (56) 551GenXers: 1965-1980 65% (278) 21% (88) 5% (23) 4% (16) 5% (20) 424Baby Boomers: 1946-1964 71% (555) 19% (148) 5% (37) 3% (22) 3% (22) 784PID: Dem (no lean) 74% (602) 17% (139) 3% (28) 1% (4) 5% (43) 817PID: Ind (no lean) 64% (349) 18% (100) 7% (36) 4% (23) 6% (33) 542PID: Rep (no lean) 57% (362) 22% (142) 7% (46) 7% (42) 7% (42) 635PID/Gender: DemMen 73% (257) 18% (62) 4% (14) — (0) 5% (17) 350PID/Gender: DemWomen 74% (346) 16% (77) 3% (14) 1% (4) 6% (26) 467PID/Gender: Ind Men 63% (176) 17% (48) 8% (22) 7% (18) 6% (16) 280PID/Gender: Ind Women 66% (173) 20% (52) 6% (15) 2% (5) 7% (17) 262PID/Gender: Rep Men 54% (164) 24% (74) 9% (28) 6% (18) 6% (19) 304PID/Gender: Rep Women 60% (198) 21% (68) 5% (18) 7% (24) 7% (23) 332Ideo: Liberal (1-3) 74% (460) 18% (112) 5% (33) — (1) 3% (19) 625Ideo: Moderate (4) 70% (398) 16% (89) 5% (30) 3% (17) 6% (37) 571Ideo: Conservative (5-7) 56% (386) 25% (170) 7% (48) 7% (51) 4% (31) 685Educ: < College 67% (840) 17% (212) 5% (68) 4% (46) 7% (88) 1254Educ: Bachelors degree 64% (301) 23% (107) 6% (28) 3% (15) 4% (21) 472Educ: Post-grad 64% (173) 23% (61) 6% (16) 3% (9) 3% (9) 268Income: Under 50k 67% (667) 16% (159) 5% (45) 3% (32) 9% (86) 989Income: 50k-100k 63% (381) 23% (138) 7% (42) 3% (20) 3% (20) 602Income: 100k+ 66% (265) 21% (83) 6% (24) 4% (17) 3% (12) 402Ethnicity: White 65% (1052) 20% (318) 6% (93) 4% (65) 5% (85) 1613
Continued on next page

108
Morning ConsultTable POL2_9
Table POL2_9: How important of a priority should each of the following be for Congress?Stimulating the economy to recover from the coronavirus pandemic
Demographic A top priority
An important,but lowerpriority
Not tooimportant apriority
Should not bedone
Don’t know /No opinion Total N
Registered Voters 66% (1314) 19% (381) 6% (111) 4% (70) 6% (118) 1994Ethnicity: Hispanic 66% (127) 16% (31) 6% (12) 4% (9) 8% (15) 193Ethnicity: Black 71% (180) 16% (41) 6% (14) — (0) 7% (18) 253Ethnicity: Other 64% (82) 17% (22) 3% (4) 4% (5) 12% (16) 128All Christian 65% (671) 20% (210) 7% (69) 4% (44) 4% (42) 1036All Non-Christian 68% (78) 17% (20) 3% (4) 1% (1) 11% (13) 115Atheist 73% (64) 19% (17) 4% (4) 2% (1) 2% (2) 88Agnostic/Nothing in particular 64% (290) 17% (79) 5% (21) 3% (12) 11% (49) 450Something Else 69% (211) 18% (55) 5% (14) 4% (12) 4% (13) 305Religious Non-Protestant/Catholic 71% (99) 16% (23) 3% (4) 1% (2) 9% (13) 141Evangelical 60% (328) 23% (124) 8% (41) 5% (26) 5% (29) 547Non-Evangelical 69% (514) 18% (137) 5% (39) 3% (26) 4% (27) 742Community: Urban 68% (397) 18% (103) 6% (36) 1% (8) 7% (42) 586Community: Suburban 66% (613) 21% (195) 5% (42) 4% (35) 4% (40) 924Community: Rural 63% (304) 17% (83) 7% (33) 6% (27) 8% (36) 484Employ: Private Sector 61% (407) 22% (148) 6% (42) 3% (22) 7% (43) 663Employ: Government 65% (78) 12% (14) 12% (15) 4% (5) 7% (8) 120Employ: Self-Employed 70% (122) 15% (26) 4% (8) 5% (9) 6% (10) 176Employ: Homemaker 65% (77) 18% (22) 4% (5) 6% (7) 7% (8) 118Employ: Student 68% (62) 19% (17) 6% (5) — (0) 7% (6) 91Employ: Retired 69% (369) 19% (103) 5% (26) 3% (18) 3% (18) 534Employ: Unemployed 70% (127) 16% (29) 4% (7) 2% (4) 9% (16) 182Employ: Other 65% (72) 19% (21) 3% (3) 5% (5) 8% (9) 111Military HH: Yes 63% (211) 18% (58) 9% (29) 6% (20) 4% (14) 333Military HH: No 66% (1103) 19% (322) 5% (82) 3% (49) 6% (104) 1661RD/WT: Right Direction 71% (725) 17% (171) 5% (47) 1% (10) 6% (64) 1017RD/WT: Wrong Track 60% (589) 21% (209) 7% (64) 6% (60) 6% (54) 977Biden Job Approve 73% (825) 17% (197) 3% (38) 1% (7) 5% (60) 1127Biden Job Disapprove 56% (442) 22% (176) 9% (69) 8% (62) 5% (43) 792
Continued on next page
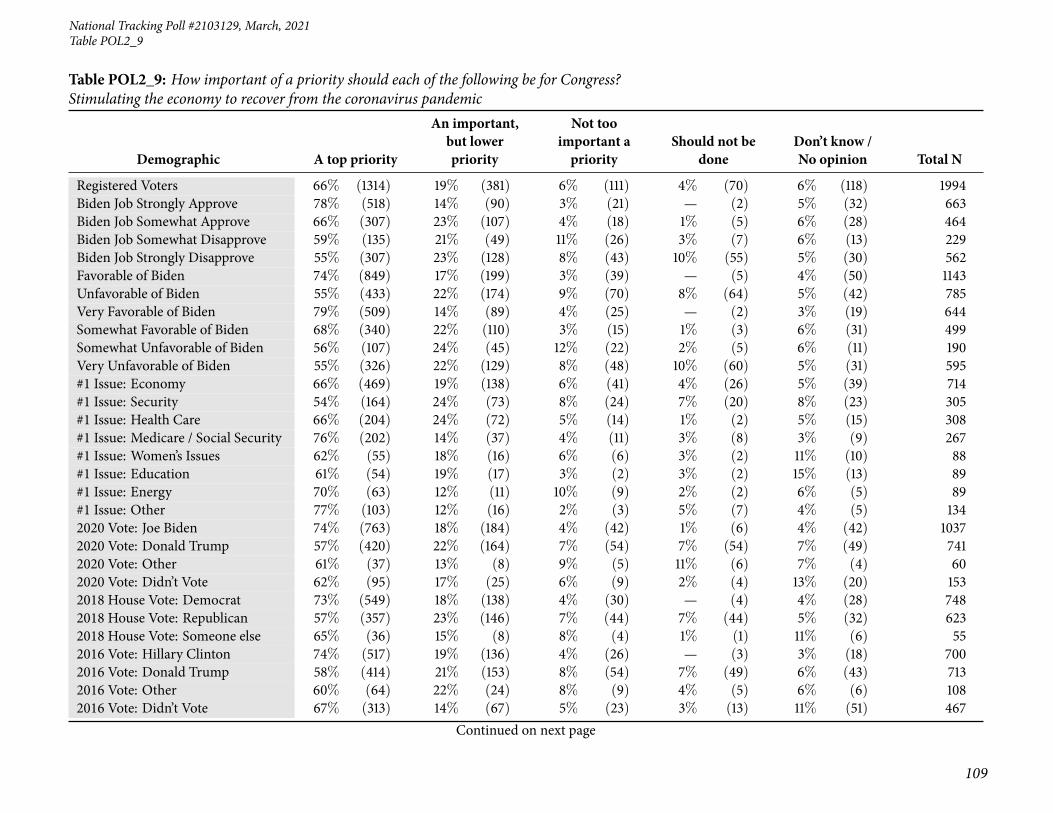
National Tracking Poll #2103129, March, 2021
109
Table POL2_9
Table POL2_9: How important of a priority should each of the following be for Congress?Stimulating the economy to recover from the coronavirus pandemic
Demographic A top priority
An important,but lowerpriority
Not tooimportant apriority
Should not bedone
Don’t know /No opinion Total N
Registered Voters 66% (1314) 19% (381) 6% (111) 4% (70) 6% (118) 1994Biden Job Strongly Approve 78% (518) 14% (90) 3% (21) — (2) 5% (32) 663Biden Job Somewhat Approve 66% (307) 23% (107) 4% (18) 1% (5) 6% (28) 464Biden Job Somewhat Disapprove 59% (135) 21% (49) 11% (26) 3% (7) 6% (13) 229Biden Job Strongly Disapprove 55% (307) 23% (128) 8% (43) 10% (55) 5% (30) 562Favorable of Biden 74% (849) 17% (199) 3% (39) — (5) 4% (50) 1143Unfavorable of Biden 55% (433) 22% (174) 9% (70) 8% (64) 5% (42) 785Very Favorable of Biden 79% (509) 14% (89) 4% (25) — (2) 3% (19) 644Somewhat Favorable of Biden 68% (340) 22% (110) 3% (15) 1% (3) 6% (31) 499Somewhat Unfavorable of Biden 56% (107) 24% (45) 12% (22) 2% (5) 6% (11) 190Very Unfavorable of Biden 55% (326) 22% (129) 8% (48) 10% (60) 5% (31) 595#1 Issue: Economy 66% (469) 19% (138) 6% (41) 4% (26) 5% (39) 714#1 Issue: Security 54% (164) 24% (73) 8% (24) 7% (20) 8% (23) 305#1 Issue: Health Care 66% (204) 24% (72) 5% (14) 1% (2) 5% (15) 308#1 Issue: Medicare / Social Security 76% (202) 14% (37) 4% (11) 3% (8) 3% (9) 267#1 Issue: Women’s Issues 62% (55) 18% (16) 6% (6) 3% (2) 11% (10) 88#1 Issue: Education 61% (54) 19% (17) 3% (2) 3% (2) 15% (13) 89#1 Issue: Energy 70% (63) 12% (11) 10% (9) 2% (2) 6% (5) 89#1 Issue: Other 77% (103) 12% (16) 2% (3) 5% (7) 4% (5) 1342020 Vote: Joe Biden 74% (763) 18% (184) 4% (42) 1% (6) 4% (42) 10372020 Vote: Donald Trump 57% (420) 22% (164) 7% (54) 7% (54) 7% (49) 7412020 Vote: Other 61% (37) 13% (8) 9% (5) 11% (6) 7% (4) 602020 Vote: Didn’t Vote 62% (95) 17% (25) 6% (9) 2% (4) 13% (20) 1532018 House Vote: Democrat 73% (549) 18% (138) 4% (30) — (4) 4% (28) 7482018 House Vote: Republican 57% (357) 23% (146) 7% (44) 7% (44) 5% (32) 6232018 House Vote: Someone else 65% (36) 15% (8) 8% (4) 1% (1) 11% (6) 552016 Vote: Hillary Clinton 74% (517) 19% (136) 4% (26) — (3) 3% (18) 7002016 Vote: Donald Trump 58% (414) 21% (153) 8% (54) 7% (49) 6% (43) 7132016 Vote: Other 60% (64) 22% (24) 8% (9) 4% (5) 6% (6) 1082016 Vote: Didn’t Vote 67% (313) 14% (67) 5% (23) 3% (13) 11% (51) 467
Continued on next page
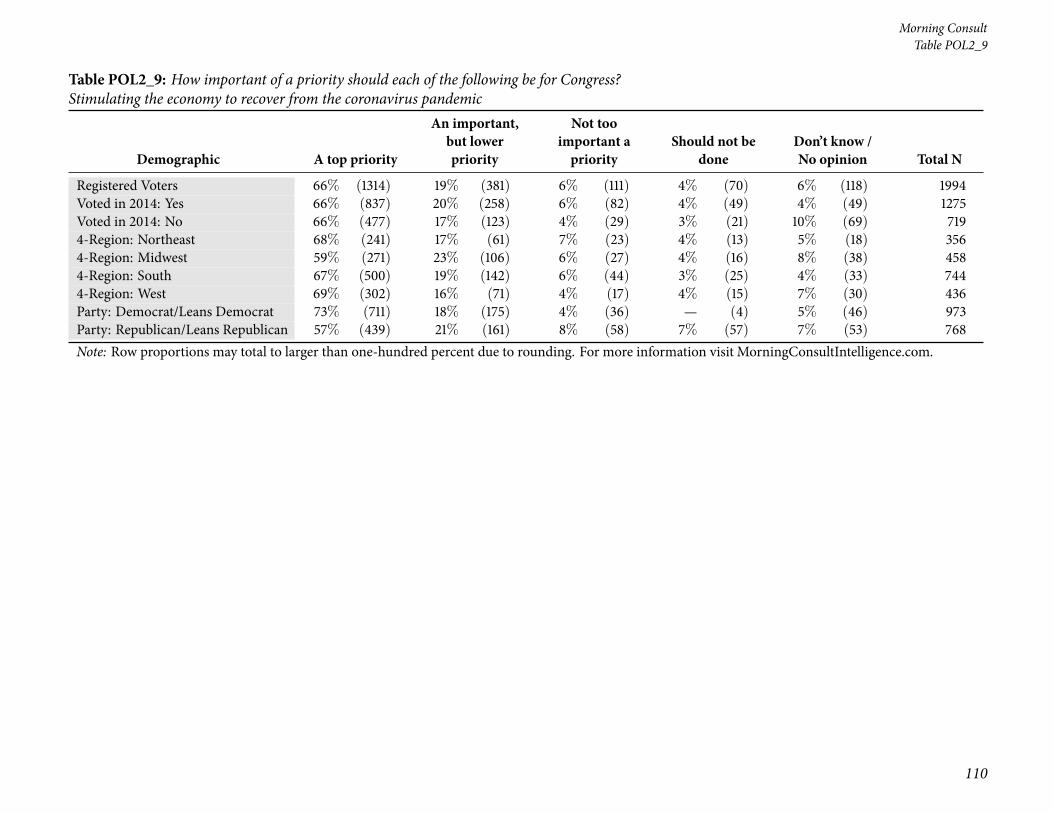
110
Morning ConsultTable POL2_9
Table POL2_9: How important of a priority should each of the following be for Congress?Stimulating the economy to recover from the coronavirus pandemic
Demographic A top priority
An important,but lowerpriority
Not tooimportant apriority
Should not bedone
Don’t know /No opinion Total N
Registered Voters 66% (1314) 19% (381) 6% (111) 4% (70) 6% (118) 1994Voted in 2014: Yes 66% (837) 20% (258) 6% (82) 4% (49) 4% (49) 1275Voted in 2014: No 66% (477) 17% (123) 4% (29) 3% (21) 10% (69) 7194-Region: Northeast 68% (241) 17% (61) 7% (23) 4% (13) 5% (18) 3564-Region: Midwest 59% (271) 23% (106) 6% (27) 4% (16) 8% (38) 4584-Region: South 67% (500) 19% (142) 6% (44) 3% (25) 4% (33) 7444-Region: West 69% (302) 16% (71) 4% (17) 4% (15) 7% (30) 436Party: Democrat/Leans Democrat 73% (711) 18% (175) 4% (36) — (4) 5% (46) 973Party: Republican/Leans Republican 57% (439) 21% (161) 8% (58) 7% (57) 7% (53) 768Note: Row proportions may total to larger than one-hundred percent due to rounding. For more information visit MorningConsultIntelligence.com.

National Tracking Poll #2103129, March, 2021
111
Table POL2_10
Table POL2_10: How important of a priority should each of the following be for Congress?Eliminating the legislative filibuster in the Senate
Demographic A top priority
An important,but lowerpriority
Not tooimportant apriority
Should not bedone
Don’t know /No opinion Total N
Registered Voters 22% (433) 24% (480) 14% (288) 18% (368) 21% (425) 1994Gender: Male 23% (213) 23% (215) 14% (135) 25% (232) 15% (138) 933Gender: Female 21% (221) 25% (265) 14% (153) 13% (136) 27% (287) 1061Age: 18-34 20% (100) 28% (139) 14% (69) 7% (35) 32% (158) 501Age: 35-44 17% (52) 29% (88) 18% (53) 13% (40) 23% (69) 303Age: 45-64 23% (168) 23% (170) 12% (90) 23% (170) 18% (128) 726Age: 65+ 24% (112) 18% (83) 16% (76) 27% (123) 15% (69) 464GenZers: 1997-2012 18% (30) 36% (60) 11% (18) 5% (8) 30% (51) 168Millennials: 1981-1996 20% (110) 25% (140) 16% (88) 9% (50) 30% (163) 551GenXers: 1965-1980 22% (93) 27% (115) 14% (57) 20% (86) 17% (74) 424Baby Boomers: 1946-1964 24% (189) 20% (158) 14% (112) 26% (203) 16% (122) 784PID: Dem (no lean) 32% (265) 31% (252) 13% (107) 5% (39) 19% (153) 817PID: Ind (no lean) 18% (97) 19% (104) 15% (79) 22% (120) 26% (143) 542PID: Rep (no lean) 11% (71) 20% (124) 16% (102) 33% (209) 20% (129) 635PID/Gender: DemMen 35% (121) 35% (122) 12% (42) 6% (20) 13% (45) 350PID/Gender: DemWomen 31% (144) 28% (130) 14% (65) 4% (19) 23% (108) 467PID/Gender: Ind Men 18% (51) 14% (40) 17% (48) 31% (86) 20% (55) 280PID/Gender: Ind Women 18% (46) 24% (63) 12% (31) 13% (34) 33% (88) 262PID/Gender: Rep Men 14% (41) 18% (53) 15% (44) 42% (127) 12% (38) 304PID/Gender: Rep Women 9% (30) 21% (71) 17% (57) 25% (82) 27% (91) 332Ideo: Liberal (1-3) 36% (226) 30% (190) 13% (83) 5% (31) 15% (96) 625Ideo: Moderate (4) 20% (116) 24% (138) 18% (103) 12% (66) 26% (148) 571Ideo: Conservative (5-7) 10% (72) 19% (132) 14% (98) 38% (262) 18% (122) 685Educ: < College 21% (259) 23% (286) 13% (169) 18% (232) 25% (308) 1254Educ: Bachelors degree 22% (105) 25% (116) 17% (80) 18% (87) 18% (84) 472Educ: Post-grad 26% (69) 29% (78) 15% (39) 18% (50) 12% (33) 268Income: Under 50k 20% (198) 23% (231) 15% (145) 16% (154) 26% (260) 989Income: 50k-100k 24% (143) 22% (132) 15% (87) 23% (139) 17% (101) 602Income: 100k+ 23% (92) 29% (116) 14% (55) 19% (75) 16% (63) 402Ethnicity: White 20% (328) 23% (369) 15% (238) 21% (339) 21% (338) 1613
Continued on next page

112
Morning ConsultTable POL2_10
Table POL2_10: How important of a priority should each of the following be for Congress?Eliminating the legislative filibuster in the Senate
Demographic A top priority
An important,but lowerpriority
Not tooimportant apriority
Should not bedone
Don’t know /No opinion Total N
Registered Voters 22% (433) 24% (480) 14% (288) 18% (368) 21% (425) 1994Ethnicity: Hispanic 27% (53) 23% (45) 11% (21) 15% (30) 23% (45) 193Ethnicity: Black 30% (77) 33% (84) 11% (28) 6% (14) 20% (50) 253Ethnicity: Other 22% (28) 21% (27) 16% (21) 12% (15) 29% (37) 128All Christian 21% (215) 23% (242) 15% (159) 24% (249) 16% (171) 1036All Non-Christian 36% (41) 27% (31) 8% (9) 13% (16) 16% (19) 115Atheist 35% (31) 30% (26) 16% (14) 8% (7) 11% (10) 88Agnostic/Nothing in particular 22% (99) 24% (107) 14% (62) 11% (48) 30% (134) 450Something Else 16% (47) 24% (74) 14% (44) 16% (48) 30% (92) 305Religious Non-Protestant/Catholic 30% (42) 26% (37) 7% (10) 19% (26) 18% (26) 141Evangelical 18% (97) 24% (130) 12% (68) 23% (126) 23% (126) 547Non-Evangelical 21% (158) 23% (173) 17% (128) 22% (161) 17% (123) 742Community: Urban 28% (167) 29% (172) 14% (81) 10% (56) 19% (110) 586Community: Suburban 21% (192) 24% (219) 15% (139) 20% (187) 20% (187) 924Community: Rural 16% (75) 18% (89) 14% (67) 26% (125) 26% (128) 484Employ: Private Sector 21% (140) 27% (178) 16% (105) 17% (112) 19% (127) 663Employ: Government 22% (26) 27% (33) 15% (19) 18% (21) 18% (21) 120Employ: Self-Employed 31% (54) 20% (35) 13% (22) 21% (37) 16% (28) 176Employ: Homemaker 18% (21) 22% (26) 11% (13) 16% (18) 34% (39) 118Employ: Student 19% (17) 37% (34) 9% (8) 5% (5) 31% (28) 91Employ: Retired 24% (126) 19% (99) 17% (89) 25% (131) 17% (90) 534Employ: Unemployed 14% (25) 26% (47) 12% (22) 16% (28) 33% (60) 182Employ: Other 22% (24) 25% (28) 10% (11) 14% (16) 28% (32) 111Military HH: Yes 23% (77) 18% (59) 15% (51) 25% (83) 19% (63) 333Military HH: No 21% (357) 25% (421) 14% (236) 17% (285) 22% (362) 1661RD/WT: Right Direction 30% (308) 30% (308) 15% (155) 5% (54) 19% (192) 1017RD/WT: Wrong Track 13% (126) 18% (172) 14% (133) 32% (314) 24% (233) 977Biden Job Approve 32% (357) 28% (315) 15% (170) 6% (65) 20% (220) 1127Biden Job Disapprove 9% (71) 19% (151) 14% (113) 37% (293) 21% (164) 792
Continued on next page
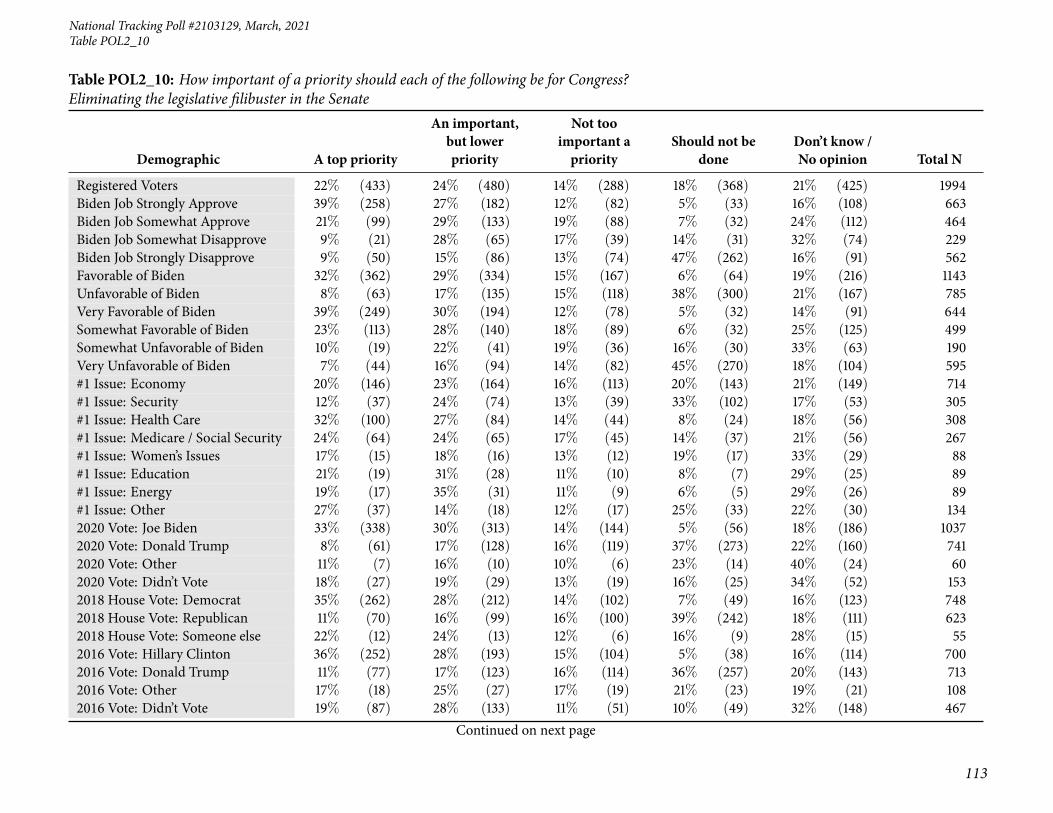
National Tracking Poll #2103129, March, 2021
113
Table POL2_10
Table POL2_10: How important of a priority should each of the following be for Congress?Eliminating the legislative filibuster in the Senate
Demographic A top priority
An important,but lowerpriority
Not tooimportant apriority
Should not bedone
Don’t know /No opinion Total N
Registered Voters 22% (433) 24% (480) 14% (288) 18% (368) 21% (425) 1994Biden Job Strongly Approve 39% (258) 27% (182) 12% (82) 5% (33) 16% (108) 663Biden Job Somewhat Approve 21% (99) 29% (133) 19% (88) 7% (32) 24% (112) 464Biden Job Somewhat Disapprove 9% (21) 28% (65) 17% (39) 14% (31) 32% (74) 229Biden Job Strongly Disapprove 9% (50) 15% (86) 13% (74) 47% (262) 16% (91) 562Favorable of Biden 32% (362) 29% (334) 15% (167) 6% (64) 19% (216) 1143Unfavorable of Biden 8% (63) 17% (135) 15% (118) 38% (300) 21% (167) 785Very Favorable of Biden 39% (249) 30% (194) 12% (78) 5% (32) 14% (91) 644Somewhat Favorable of Biden 23% (113) 28% (140) 18% (89) 6% (32) 25% (125) 499Somewhat Unfavorable of Biden 10% (19) 22% (41) 19% (36) 16% (30) 33% (63) 190Very Unfavorable of Biden 7% (44) 16% (94) 14% (82) 45% (270) 18% (104) 595#1 Issue: Economy 20% (146) 23% (164) 16% (113) 20% (143) 21% (149) 714#1 Issue: Security 12% (37) 24% (74) 13% (39) 33% (102) 17% (53) 305#1 Issue: Health Care 32% (100) 27% (84) 14% (44) 8% (24) 18% (56) 308#1 Issue: Medicare / Social Security 24% (64) 24% (65) 17% (45) 14% (37) 21% (56) 267#1 Issue: Women’s Issues 17% (15) 18% (16) 13% (12) 19% (17) 33% (29) 88#1 Issue: Education 21% (19) 31% (28) 11% (10) 8% (7) 29% (25) 89#1 Issue: Energy 19% (17) 35% (31) 11% (9) 6% (5) 29% (26) 89#1 Issue: Other 27% (37) 14% (18) 12% (17) 25% (33) 22% (30) 1342020 Vote: Joe Biden 33% (338) 30% (313) 14% (144) 5% (56) 18% (186) 10372020 Vote: Donald Trump 8% (61) 17% (128) 16% (119) 37% (273) 22% (160) 7412020 Vote: Other 11% (7) 16% (10) 10% (6) 23% (14) 40% (24) 602020 Vote: Didn’t Vote 18% (27) 19% (29) 13% (19) 16% (25) 34% (52) 1532018 House Vote: Democrat 35% (262) 28% (212) 14% (102) 7% (49) 16% (123) 7482018 House Vote: Republican 11% (70) 16% (99) 16% (100) 39% (242) 18% (111) 6232018 House Vote: Someone else 22% (12) 24% (13) 12% (6) 16% (9) 28% (15) 552016 Vote: Hillary Clinton 36% (252) 28% (193) 15% (104) 5% (38) 16% (114) 7002016 Vote: Donald Trump 11% (77) 17% (123) 16% (114) 36% (257) 20% (143) 7132016 Vote: Other 17% (18) 25% (27) 17% (19) 21% (23) 19% (21) 1082016 Vote: Didn’t Vote 19% (87) 28% (133) 11% (51) 10% (49) 32% (148) 467
Continued on next page
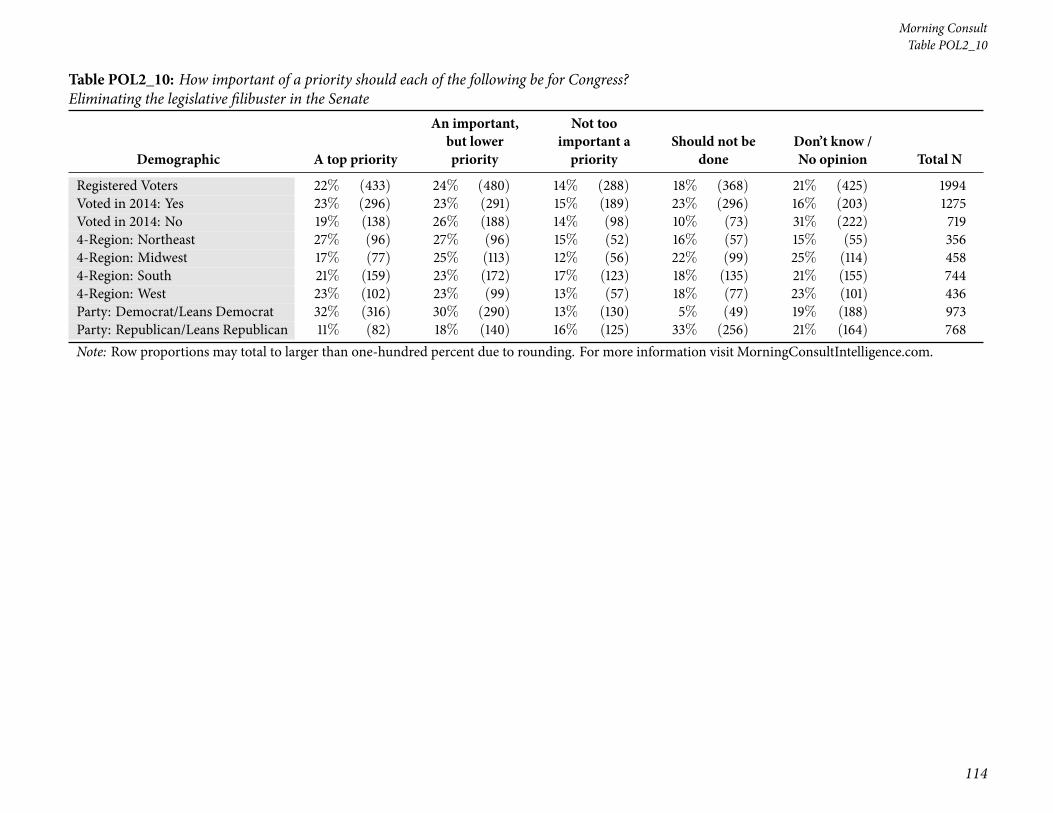
114
Morning ConsultTable POL2_10
Table POL2_10: How important of a priority should each of the following be for Congress?Eliminating the legislative filibuster in the Senate
Demographic A top priority
An important,but lowerpriority
Not tooimportant apriority
Should not bedone
Don’t know /No opinion Total N
Registered Voters 22% (433) 24% (480) 14% (288) 18% (368) 21% (425) 1994Voted in 2014: Yes 23% (296) 23% (291) 15% (189) 23% (296) 16% (203) 1275Voted in 2014: No 19% (138) 26% (188) 14% (98) 10% (73) 31% (222) 7194-Region: Northeast 27% (96) 27% (96) 15% (52) 16% (57) 15% (55) 3564-Region: Midwest 17% (77) 25% (113) 12% (56) 22% (99) 25% (114) 4584-Region: South 21% (159) 23% (172) 17% (123) 18% (135) 21% (155) 7444-Region: West 23% (102) 23% (99) 13% (57) 18% (77) 23% (101) 436Party: Democrat/Leans Democrat 32% (316) 30% (290) 13% (130) 5% (49) 19% (188) 973Party: Republican/Leans Republican 11% (82) 18% (140) 16% (125) 33% (256) 21% (164) 768Note: Row proportions may total to larger than one-hundred percent due to rounding. For more information visit MorningConsultIntelligence.com.

National Tracking Poll #2103129, March, 2021
115
Table POL2_11
Table POL2_11: How important of a priority should each of the following be for Congress?Passing a bill to legalize marijuana
Demographic A top priority
An important,but lowerpriority
Not tooimportant apriority
Should not bedone
Don’t know /No opinion Total N
Registered Voters 16% (320) 24% (485) 31% (609) 22% (435) 7% (146) 1994Gender: Male 17% (158) 25% (231) 29% (268) 22% (204) 8% (73) 933Gender: Female 15% (162) 24% (254) 32% (341) 22% (231) 7% (73) 1061Age: 18-34 24% (122) 27% (136) 24% (121) 12% (58) 13% (64) 501Age: 35-44 21% (65) 28% (84) 25% (76) 17% (51) 9% (27) 303Age: 45-64 15% (111) 24% (175) 32% (234) 24% (172) 5% (35) 726Age: 65+ 5% (22) 20% (90) 38% (178) 33% (153) 4% (20) 464GenZers: 1997-2012 27% (45) 32% (53) 23% (39) 10% (16) 9% (15) 168Millennials: 1981-1996 21% (118) 27% (149) 25% (139) 14% (76) 13% (69) 551GenXers: 1965-1980 18% (78) 24% (102) 31% (131) 21% (90) 5% (23) 424Baby Boomers: 1946-1964 10% (78) 22% (174) 35% (274) 29% (226) 4% (33) 784PID: Dem (no lean) 20% (162) 32% (265) 31% (257) 9% (73) 7% (60) 817PID: Ind (no lean) 16% (86) 22% (118) 32% (174) 23% (126) 7% (39) 542PID: Rep (no lean) 11% (72) 16% (102) 28% (178) 37% (236) 7% (46) 635PID/Gender: DemMen 23% (81) 34% (118) 29% (103) 6% (21) 8% (27) 350PID/Gender: DemWomen 17% (81) 32% (147) 33% (154) 11% (52) 7% (33) 467PID/Gender: Ind Men 15% (41) 23% (65) 31% (86) 24% (66) 8% (22) 280PID/Gender: Ind Women 17% (45) 20% (53) 34% (88) 23% (59) 7% (17) 262PID/Gender: Rep Men 12% (36) 16% (49) 26% (80) 38% (116) 8% (24) 304PID/Gender: Rep Women 11% (36) 16% (54) 30% (99) 36% (120) 7% (23) 332Ideo: Liberal (1-3) 21% (133) 35% (216) 32% (202) 7% (44) 5% (30) 625Ideo: Moderate (4) 15% (87) 24% (137) 35% (198) 18% (103) 8% (45) 571Ideo: Conservative (5-7) 10% (70) 16% (112) 28% (188) 41% (280) 5% (35) 685Educ: < College 17% (213) 24% (297) 30% (372) 22% (274) 8% (98) 1254Educ: Bachelors degree 14% (68) 25% (118) 34% (163) 19% (89) 7% (33) 472Educ: Post-grad 14% (38) 26% (70) 28% (74) 26% (71) 6% (15) 268Income: Under 50k 16% (161) 25% (252) 29% (290) 20% (201) 9% (85) 989Income: 50k-100k 16% (96) 22% (130) 32% (194) 25% (148) 6% (35) 602Income: 100k+ 16% (63) 26% (103) 31% (125) 21% (85) 6% (26) 402Ethnicity: White 16% (250) 24% (380) 30% (484) 24% (387) 7% (111) 1613
Continued on next page

116
Morning ConsultTable POL2_11
Table POL2_11: How important of a priority should each of the following be for Congress?Passing a bill to legalize marijuana
Demographic A top priority
An important,but lowerpriority
Not tooimportant apriority
Should not bedone
Don’t know /No opinion Total N
Registered Voters 16% (320) 24% (485) 31% (609) 22% (435) 7% (146) 1994Ethnicity: Hispanic 24% (46) 27% (52) 19% (37) 22% (43) 8% (16) 193Ethnicity: Black 17% (44) 30% (77) 35% (87) 9% (24) 8% (21) 253Ethnicity: Other 20% (25) 22% (29) 29% (37) 18% (24) 11% (14) 128All Christian 11% (115) 22% (230) 32% (332) 29% (302) 6% (57) 1036All Non-Christian 30% (34) 20% (23) 23% (26) 14% (17) 13% (15) 115Atheist 12% (11) 34% (30) 42% (37) 10% (8) 2% (2) 88Agnostic/Nothing in particular 22% (99) 28% (126) 29% (131) 9% (40) 12% (53) 450Something Else 20% (60) 25% (76) 27% (83) 22% (68) 6% (18) 305Religious Non-Protestant/Catholic 26% (36) 17% (24) 20% (29) 23% (33) 13% (19) 141Evangelical 14% (77) 20% (109) 27% (148) 32% (174) 7% (40) 547Non-Evangelical 13% (95) 25% (188) 35% (258) 24% (175) 4% (27) 742Community: Urban 21% (120) 30% (178) 30% (174) 12% (68) 8% (46) 586Community: Suburban 14% (125) 22% (204) 34% (318) 23% (216) 7% (61) 924Community: Rural 15% (74) 21% (103) 24% (117) 31% (151) 8% (39) 484Employ: Private Sector 16% (107) 28% (183) 30% (197) 18% (122) 8% (54) 663Employ: Government 20% (24) 22% (26) 27% (33) 21% (25) 10% (12) 120Employ: Self-Employed 27% (47) 24% (42) 23% (41) 17% (30) 9% (15) 176Employ: Homemaker 10% (12) 19% (22) 35% (41) 29% (34) 7% (9) 118Employ: Student 22% (20) 34% (31) 26% (23) 14% (13) 4% (4) 91Employ: Retired 9% (48) 19% (101) 37% (198) 30% (160) 5% (26) 534Employ: Unemployed 24% (44) 23% (42) 22% (40) 22% (40) 9% (16) 182Employ: Other 15% (16) 34% (38) 32% (35) 10% (11) 10% (11) 111Military HH: Yes 13% (45) 18% (61) 36% (119) 27% (91) 5% (17) 333Military HH: No 17% (275) 26% (425) 29% (489) 21% (343) 8% (129) 1661RD/WT: Right Direction 19% (189) 30% (303) 32% (329) 11% (111) 8% (84) 1017RD/WT: Wrong Track 13% (131) 19% (182) 29% (280) 33% (323) 6% (61) 977Biden Job Approve 19% (214) 30% (340) 33% (368) 11% (119) 8% (86) 1127Biden Job Disapprove 12% (96) 17% (133) 28% (220) 38% (299) 5% (43) 792
Continued on next page

National Tracking Poll #2103129, March, 2021
117
Table POL2_11
Table POL2_11: How important of a priority should each of the following be for Congress?Passing a bill to legalize marijuana
Demographic A top priority
An important,but lowerpriority
Not tooimportant apriority
Should not bedone
Don’t know /No opinion Total N
Registered Voters 16% (320) 24% (485) 31% (609) 22% (435) 7% (146) 1994Biden Job Strongly Approve 20% (134) 32% (214) 32% (210) 9% (59) 7% (46) 663Biden Job Somewhat Approve 17% (80) 27% (126) 34% (158) 13% (60) 9% (40) 464Biden Job Somewhat Disapprove 14% (33) 19% (44) 35% (81) 26% (58) 6% (13) 229Biden Job Strongly Disapprove 11% (63) 16% (89) 25% (140) 43% (240) 5% (31) 562Favorable of Biden 19% (220) 30% (346) 33% (380) 11% (122) 7% (75) 1143Unfavorable of Biden 11% (85) 16% (128) 28% (218) 39% (306) 6% (46) 785Very Favorable of Biden 20% (131) 34% (216) 32% (205) 9% (57) 6% (36) 644Somewhat Favorable of Biden 18% (89) 26% (130) 35% (175) 13% (66) 8% (39) 499Somewhat Unfavorable of Biden 10% (20) 20% (38) 34% (64) 30% (57) 7% (12) 190Very Unfavorable of Biden 11% (66) 15% (91) 26% (154) 42% (250) 6% (34) 595#1 Issue: Economy 16% (115) 25% (175) 33% (235) 19% (135) 8% (54) 714#1 Issue: Security 11% (35) 19% (59) 24% (74) 39% (118) 6% (19) 305#1 Issue: Health Care 19% (57) 30% (91) 31% (95) 14% (42) 7% (22) 308#1 Issue: Medicare / Social Security 13% (34) 19% (52) 36% (96) 26% (69) 6% (15) 267#1 Issue: Women’s Issues 16% (14) 21% (18) 24% (21) 27% (24) 13% (11) 88#1 Issue: Education 28% (25) 18% (16) 31% (28) 9% (8) 14% (12) 89#1 Issue: Energy 27% (24) 40% (36) 17% (15) 7% (6) 9% (8) 89#1 Issue: Other 11% (14) 28% (38) 33% (45) 24% (33) 4% (5) 1342020 Vote: Joe Biden 20% (209) 30% (313) 34% (348) 11% (111) 5% (56) 10372020 Vote: Donald Trump 10% (74) 16% (120) 29% (216) 38% (282) 7% (49) 7412020 Vote: Other 24% (14) 20% (12) 17% (10) 28% (17) 11% (6) 602020 Vote: Didn’t Vote 14% (22) 26% (40) 23% (35) 16% (25) 20% (30) 1532018 House Vote: Democrat 20% (146) 31% (235) 33% (246) 10% (77) 6% (43) 7482018 House Vote: Republican 10% (64) 14% (87) 30% (187) 40% (248) 6% (37) 6232018 House Vote: Someone else 8% (4) 30% (16) 26% (14) 26% (14) 10% (6) 552016 Vote: Hillary Clinton 20% (137) 31% (220) 35% (243) 10% (70) 4% (31) 7002016 Vote: Donald Trump 10% (70) 16% (116) 28% (201) 38% (273) 7% (52) 7132016 Vote: Other 12% (13) 23% (25) 36% (39) 23% (24) 6% (6) 1082016 Vote: Didn’t Vote 21% (99) 26% (122) 27% (124) 14% (68) 12% (54) 467
Continued on next page

118
Morning ConsultTable POL2_11
Table POL2_11: How important of a priority should each of the following be for Congress?Passing a bill to legalize marijuana
Demographic A top priority
An important,but lowerpriority
Not tooimportant apriority
Should not bedone
Don’t know /No opinion Total N
Registered Voters 16% (320) 24% (485) 31% (609) 22% (435) 7% (146) 1994Voted in 2014: Yes 14% (182) 23% (297) 32% (411) 25% (322) 5% (63) 1275Voted in 2014: No 19% (137) 26% (189) 27% (198) 16% (112) 12% (83) 7194-Region: Northeast 21% (75) 28% (100) 26% (93) 20% (71) 5% (17) 3564-Region: Midwest 13% (61) 23% (106) 31% (141) 25% (112) 8% (37) 4584-Region: South 17% (124) 22% (166) 32% (236) 23% (170) 7% (48) 7444-Region: West 14% (60) 26% (112) 32% (138) 19% (82) 10% (43) 436Party: Democrat/Leans Democrat 19% (182) 32% (313) 33% (324) 9% (89) 7% (65) 973Party: Republican/Leans Republican 12% (90) 16% (122) 29% (222) 36% (277) 7% (57) 768Note: Row proportions may total to larger than one-hundred percent due to rounding. For more information visit MorningConsultIntelligence.com.

National Tracking Poll #2103129, March, 2021
119
Table POL2_12
Table POL2_12: How important of a priority should each of the following be for Congress?Passing a bill to provide relief to Americans with student loan debt
Demographic A top priority
An important,but lowerpriority
Not tooimportant apriority
Should not bedone
Don’t know /No opinion Total N
Registered Voters 25% (489) 30% (606) 17% (330) 21% (419) 7% (149) 1994Gender: Male 20% (183) 31% (286) 18% (165) 25% (233) 7% (67) 933Gender: Female 29% (307) 30% (320) 16% (165) 18% (186) 8% (83) 1061Age: 18-34 38% (191) 32% (161) 10% (48) 7% (33) 14% (69) 501Age: 35-44 31% (95) 30% (92) 16% (47) 16% (50) 6% (19) 303Age: 45-64 20% (147) 30% (218) 18% (132) 26% (190) 5% (40) 726Age: 65+ 12% (57) 29% (136) 22% (103) 32% (147) 5% (21) 464GenZers: 1997-2012 49% (82) 32% (53) 7% (12) 3% (5) 10% (16) 168Millennials: 1981-1996 32% (176) 32% (175) 13% (73) 11% (59) 12% (68) 551GenXers: 1965-1980 23% (100) 29% (123) 16% (69) 24% (103) 7% (30) 424Baby Boomers: 1946-1964 16% (125) 30% (235) 21% (161) 30% (233) 4% (30) 784PID: Dem (no lean) 35% (286) 41% (338) 12% (102) 4% (37) 7% (54) 817PID: Ind (no lean) 23% (126) 25% (137) 20% (107) 24% (133) 7% (39) 542PID: Rep (no lean) 12% (77) 21% (132) 19% (121) 39% (249) 9% (56) 635PID/Gender: DemMen 31% (107) 44% (155) 14% (51) 5% (16) 6% (21) 350PID/Gender: DemWomen 38% (179) 39% (183) 11% (51) 4% (20) 7% (33) 467PID/Gender: Ind Men 17% (48) 25% (70) 21% (57) 30% (83) 8% (21) 280PID/Gender: Ind Women 30% (78) 25% (67) 19% (50) 19% (50) 7% (18) 262PID/Gender: Rep Men 9% (28) 20% (61) 19% (57) 44% (134) 8% (24) 304PID/Gender: Rep Women 15% (49) 21% (71) 19% (64) 35% (116) 10% (32) 332Ideo: Liberal (1-3) 40% (249) 41% (258) 12% (74) 3% (19) 4% (25) 625Ideo: Moderate (4) 22% (123) 33% (190) 22% (125) 16% (88) 8% (44) 571Ideo: Conservative (5-7) 12% (82) 20% (135) 17% (117) 45% (307) 7% (45) 685Educ: < College 24% (297) 30% (374) 16% (207) 21% (269) 9% (108) 1254Educ: Bachelors degree 25% (118) 31% (144) 18% (83) 21% (97) 6% (30) 472Educ: Post-grad 28% (75) 33% (88) 15% (40) 20% (53) 4% (12) 268Income: Under 50k 26% (253) 32% (319) 15% (152) 17% (166) 10% (98) 989Income: 50k-100k 23% (140) 27% (163) 18% (107) 26% (157) 6% (35) 602Income: 100k+ 24% (96) 31% (124) 18% (71) 24% (95) 4% (16) 402Ethnicity: White 21% (345) 29% (468) 18% (298) 24% (391) 7% (111) 1613
Continued on next page

120
Morning ConsultTable POL2_12
Table POL2_12: How important of a priority should each of the following be for Congress?Passing a bill to provide relief to Americans with student loan debt
Demographic A top priority
An important,but lowerpriority
Not tooimportant apriority
Should not bedone
Don’t know /No opinion Total N
Registered Voters 25% (489) 30% (606) 17% (330) 21% (419) 7% (149) 1994Ethnicity: Hispanic 34% (65) 35% (68) 9% (17) 13% (26) 9% (17) 193Ethnicity: Black 40% (102) 38% (96) 8% (20) 5% (12) 9% (23) 253Ethnicity: Other 33% (42) 33% (42) 9% (12) 13% (17) 12% (16) 128All Christian 20% (211) 30% (316) 18% (188) 25% (263) 6% (58) 1036All Non-Christian 33% (38) 36% (42) 9% (11) 11% (13) 11% (12) 115Atheist 32% (28) 36% (32) 18% (15) 12% (11) 2% (2) 88Agnostic/Nothing in particular 26% (116) 30% (135) 16% (74) 16% (70) 12% (54) 450Something Else 32% (96) 27% (82) 14% (42) 20% (62) 7% (22) 305Religious Non-Protestant/Catholic 32% (45) 32% (45) 10% (14) 17% (24) 9% (12) 141Evangelical 24% (130) 28% (153) 17% (93) 24% (133) 7% (38) 547Non-Evangelical 22% (164) 31% (229) 18% (130) 24% (176) 6% (42) 742Community: Urban 33% (195) 36% (211) 13% (74) 10% (60) 8% (46) 586Community: Suburban 22% (202) 29% (263) 19% (172) 24% (221) 7% (66) 924Community: Rural 19% (93) 27% (132) 17% (84) 29% (138) 8% (37) 484Employ: Private Sector 25% (168) 31% (208) 17% (112) 20% (133) 6% (41) 663Employ: Government 34% (41) 28% (33) 11% (13) 14% (16) 14% (16) 120Employ: Self-Employed 38% (66) 19% (33) 12% (20) 23% (41) 8% (15) 176Employ: Homemaker 17% (20) 24% (28) 21% (25) 29% (34) 9% (10) 118Employ: Student 59% (53) 33% (30) 1% (1) 2% (2) 6% (5) 91Employ: Retired 14% (75) 32% (170) 21% (112) 27% (146) 6% (31) 534Employ: Unemployed 25% (46) 34% (63) 16% (29) 14% (26) 10% (19) 182Employ: Other 18% (20) 38% (42) 16% (18) 18% (20) 10% (12) 111Military HH: Yes 23% (76) 24% (78) 19% (63) 29% (95) 6% (20) 333Military HH: No 25% (413) 32% (528) 16% (267) 19% (324) 8% (129) 1661RD/WT: Right Direction 33% (333) 40% (402) 14% (145) 6% (57) 8% (79) 1017RD/WT: Wrong Track 16% (156) 21% (204) 19% (185) 37% (362) 7% (70) 977Biden Job Approve 34% (382) 39% (436) 15% (165) 6% (68) 7% (77) 1127Biden Job Disapprove 11% (90) 18% (145) 20% (155) 44% (345) 7% (56) 792
Continued on next page
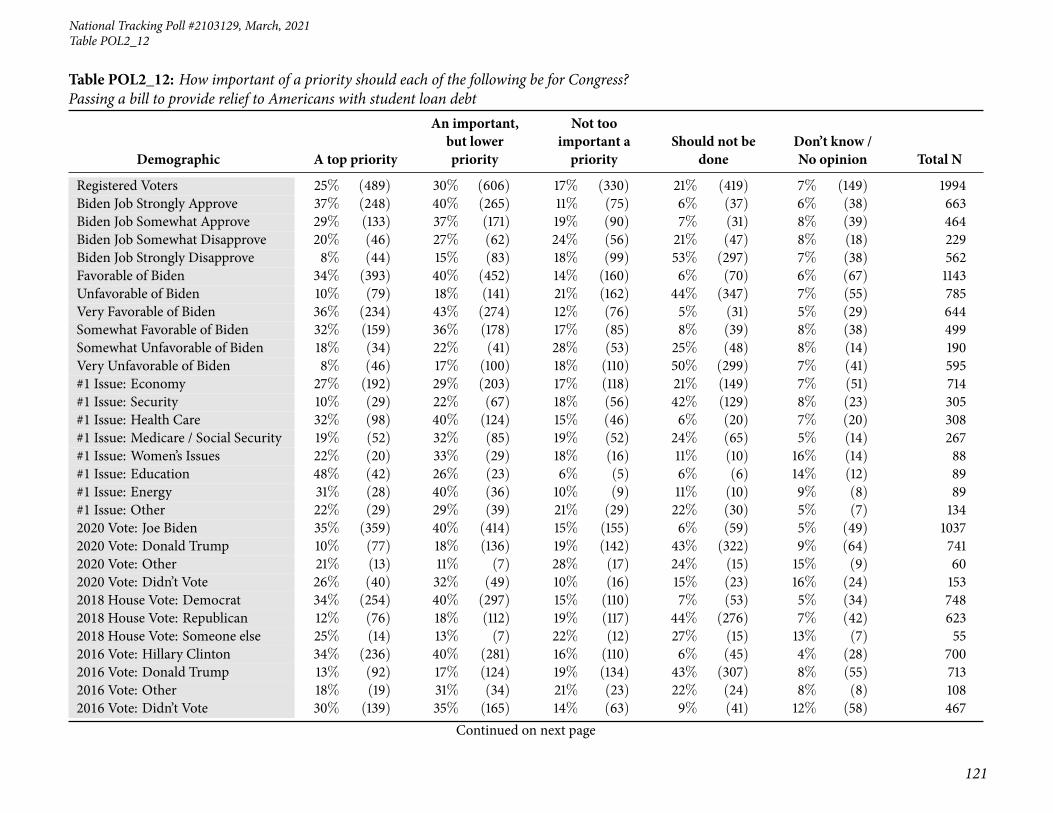
National Tracking Poll #2103129, March, 2021
121
Table POL2_12
Table POL2_12: How important of a priority should each of the following be for Congress?Passing a bill to provide relief to Americans with student loan debt
Demographic A top priority
An important,but lowerpriority
Not tooimportant apriority
Should not bedone
Don’t know /No opinion Total N
Registered Voters 25% (489) 30% (606) 17% (330) 21% (419) 7% (149) 1994Biden Job Strongly Approve 37% (248) 40% (265) 11% (75) 6% (37) 6% (38) 663Biden Job Somewhat Approve 29% (133) 37% (171) 19% (90) 7% (31) 8% (39) 464Biden Job Somewhat Disapprove 20% (46) 27% (62) 24% (56) 21% (47) 8% (18) 229Biden Job Strongly Disapprove 8% (44) 15% (83) 18% (99) 53% (297) 7% (38) 562Favorable of Biden 34% (393) 40% (452) 14% (160) 6% (70) 6% (67) 1143Unfavorable of Biden 10% (79) 18% (141) 21% (162) 44% (347) 7% (55) 785Very Favorable of Biden 36% (234) 43% (274) 12% (76) 5% (31) 5% (29) 644Somewhat Favorable of Biden 32% (159) 36% (178) 17% (85) 8% (39) 8% (38) 499Somewhat Unfavorable of Biden 18% (34) 22% (41) 28% (53) 25% (48) 8% (14) 190Very Unfavorable of Biden 8% (46) 17% (100) 18% (110) 50% (299) 7% (41) 595#1 Issue: Economy 27% (192) 29% (203) 17% (118) 21% (149) 7% (51) 714#1 Issue: Security 10% (29) 22% (67) 18% (56) 42% (129) 8% (23) 305#1 Issue: Health Care 32% (98) 40% (124) 15% (46) 6% (20) 7% (20) 308#1 Issue: Medicare / Social Security 19% (52) 32% (85) 19% (52) 24% (65) 5% (14) 267#1 Issue: Women’s Issues 22% (20) 33% (29) 18% (16) 11% (10) 16% (14) 88#1 Issue: Education 48% (42) 26% (23) 6% (5) 6% (6) 14% (12) 89#1 Issue: Energy 31% (28) 40% (36) 10% (9) 11% (10) 9% (8) 89#1 Issue: Other 22% (29) 29% (39) 21% (29) 22% (30) 5% (7) 1342020 Vote: Joe Biden 35% (359) 40% (414) 15% (155) 6% (59) 5% (49) 10372020 Vote: Donald Trump 10% (77) 18% (136) 19% (142) 43% (322) 9% (64) 7412020 Vote: Other 21% (13) 11% (7) 28% (17) 24% (15) 15% (9) 602020 Vote: Didn’t Vote 26% (40) 32% (49) 10% (16) 15% (23) 16% (24) 1532018 House Vote: Democrat 34% (254) 40% (297) 15% (110) 7% (53) 5% (34) 7482018 House Vote: Republican 12% (76) 18% (112) 19% (117) 44% (276) 7% (42) 6232018 House Vote: Someone else 25% (14) 13% (7) 22% (12) 27% (15) 13% (7) 552016 Vote: Hillary Clinton 34% (236) 40% (281) 16% (110) 6% (45) 4% (28) 7002016 Vote: Donald Trump 13% (92) 17% (124) 19% (134) 43% (307) 8% (55) 7132016 Vote: Other 18% (19) 31% (34) 21% (23) 22% (24) 8% (8) 1082016 Vote: Didn’t Vote 30% (139) 35% (165) 14% (63) 9% (41) 12% (58) 467
Continued on next page

122
Morning ConsultTable POL2_12
Table POL2_12: How important of a priority should each of the following be for Congress?Passing a bill to provide relief to Americans with student loan debt
Demographic A top priority
An important,but lowerpriority
Not tooimportant apriority
Should not bedone
Don’t know /No opinion Total N
Registered Voters 25% (489) 30% (606) 17% (330) 21% (419) 7% (149) 1994Voted in 2014: Yes 22% (287) 29% (373) 17% (215) 26% (331) 5% (69) 1275Voted in 2014: No 28% (203) 33% (234) 16% (115) 12% (88) 11% (80) 7194-Region: Northeast 30% (108) 30% (108) 16% (58) 17% (59) 7% (24) 3564-Region: Midwest 21% (94) 28% (127) 16% (74) 26% (120) 9% (43) 4584-Region: South 25% (184) 30% (227) 18% (132) 21% (159) 6% (42) 7444-Region: West 24% (103) 33% (145) 15% (66) 19% (81) 9% (40) 436Party: Democrat/Leans Democrat 34% (328) 41% (402) 14% (137) 5% (50) 6% (57) 973Party: Republican/Leans Republican 13% (98) 19% (148) 18% (141) 41% (312) 9% (69) 768Note: Row proportions may total to larger than one-hundred percent due to rounding. For more information visit MorningConsultIntelligence.com.
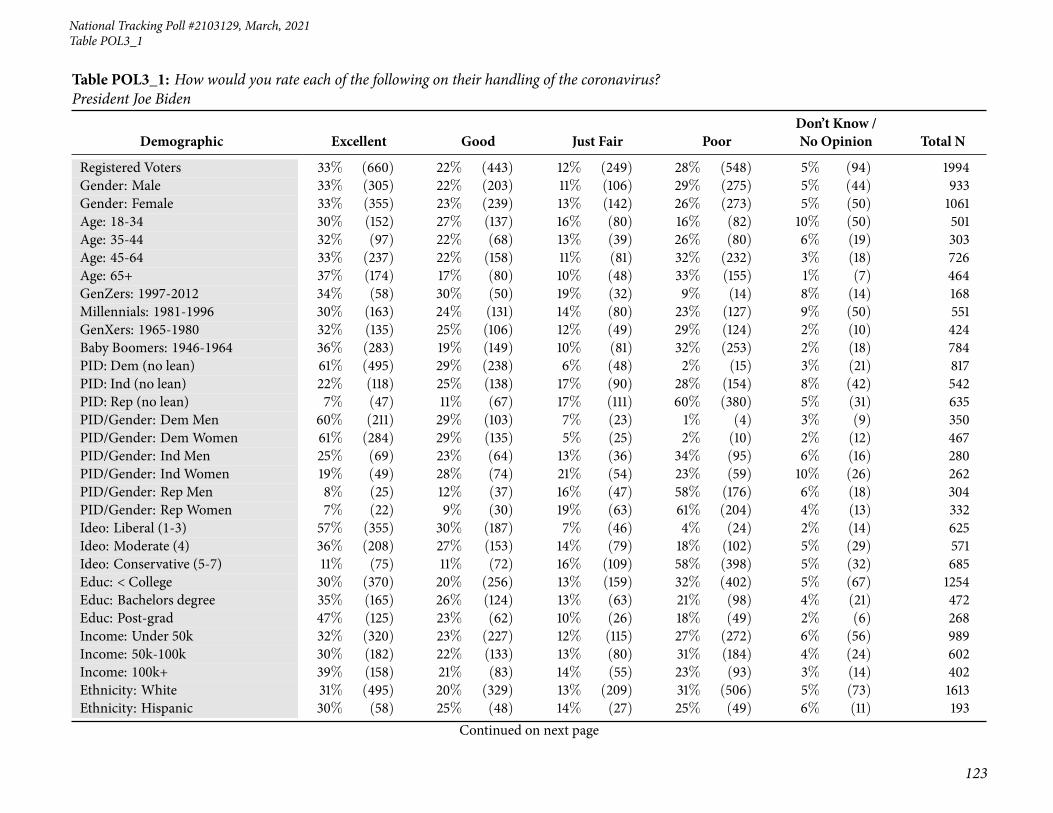
National Tracking Poll #2103129, March, 2021
123
Table POL3_1
Table POL3_1: How would you rate each of the following on their handling of the coronavirus?President Joe Biden
Demographic Excellent Good Just Fair PoorDon’t Know /No Opinion Total N
Registered Voters 33% (660) 22% (443) 12% (249) 28% (548) 5% (94) 1994Gender: Male 33% (305) 22% (203) 11% (106) 29% (275) 5% (44) 933Gender: Female 33% (355) 23% (239) 13% (142) 26% (273) 5% (50) 1061Age: 18-34 30% (152) 27% (137) 16% (80) 16% (82) 10% (50) 501Age: 35-44 32% (97) 22% (68) 13% (39) 26% (80) 6% (19) 303Age: 45-64 33% (237) 22% (158) 11% (81) 32% (232) 3% (18) 726Age: 65+ 37% (174) 17% (80) 10% (48) 33% (155) 1% (7) 464GenZers: 1997-2012 34% (58) 30% (50) 19% (32) 9% (14) 8% (14) 168Millennials: 1981-1996 30% (163) 24% (131) 14% (80) 23% (127) 9% (50) 551GenXers: 1965-1980 32% (135) 25% (106) 12% (49) 29% (124) 2% (10) 424Baby Boomers: 1946-1964 36% (283) 19% (149) 10% (81) 32% (253) 2% (18) 784PID: Dem (no lean) 61% (495) 29% (238) 6% (48) 2% (15) 3% (21) 817PID: Ind (no lean) 22% (118) 25% (138) 17% (90) 28% (154) 8% (42) 542PID: Rep (no lean) 7% (47) 11% (67) 17% (111) 60% (380) 5% (31) 635PID/Gender: DemMen 60% (211) 29% (103) 7% (23) 1% (4) 3% (9) 350PID/Gender: DemWomen 61% (284) 29% (135) 5% (25) 2% (10) 2% (12) 467PID/Gender: Ind Men 25% (69) 23% (64) 13% (36) 34% (95) 6% (16) 280PID/Gender: Ind Women 19% (49) 28% (74) 21% (54) 23% (59) 10% (26) 262PID/Gender: Rep Men 8% (25) 12% (37) 16% (47) 58% (176) 6% (18) 304PID/Gender: Rep Women 7% (22) 9% (30) 19% (63) 61% (204) 4% (13) 332Ideo: Liberal (1-3) 57% (355) 30% (187) 7% (46) 4% (24) 2% (14) 625Ideo: Moderate (4) 36% (208) 27% (153) 14% (79) 18% (102) 5% (29) 571Ideo: Conservative (5-7) 11% (75) 11% (72) 16% (109) 58% (398) 5% (32) 685Educ: < College 30% (370) 20% (256) 13% (159) 32% (402) 5% (67) 1254Educ: Bachelors degree 35% (165) 26% (124) 13% (63) 21% (98) 4% (21) 472Educ: Post-grad 47% (125) 23% (62) 10% (26) 18% (49) 2% (6) 268Income: Under 50k 32% (320) 23% (227) 12% (115) 27% (272) 6% (56) 989Income: 50k-100k 30% (182) 22% (133) 13% (80) 31% (184) 4% (24) 602Income: 100k+ 39% (158) 21% (83) 14% (55) 23% (93) 3% (14) 402Ethnicity: White 31% (495) 20% (329) 13% (209) 31% (506) 5% (73) 1613Ethnicity: Hispanic 30% (58) 25% (48) 14% (27) 25% (49) 6% (11) 193
Continued on next page
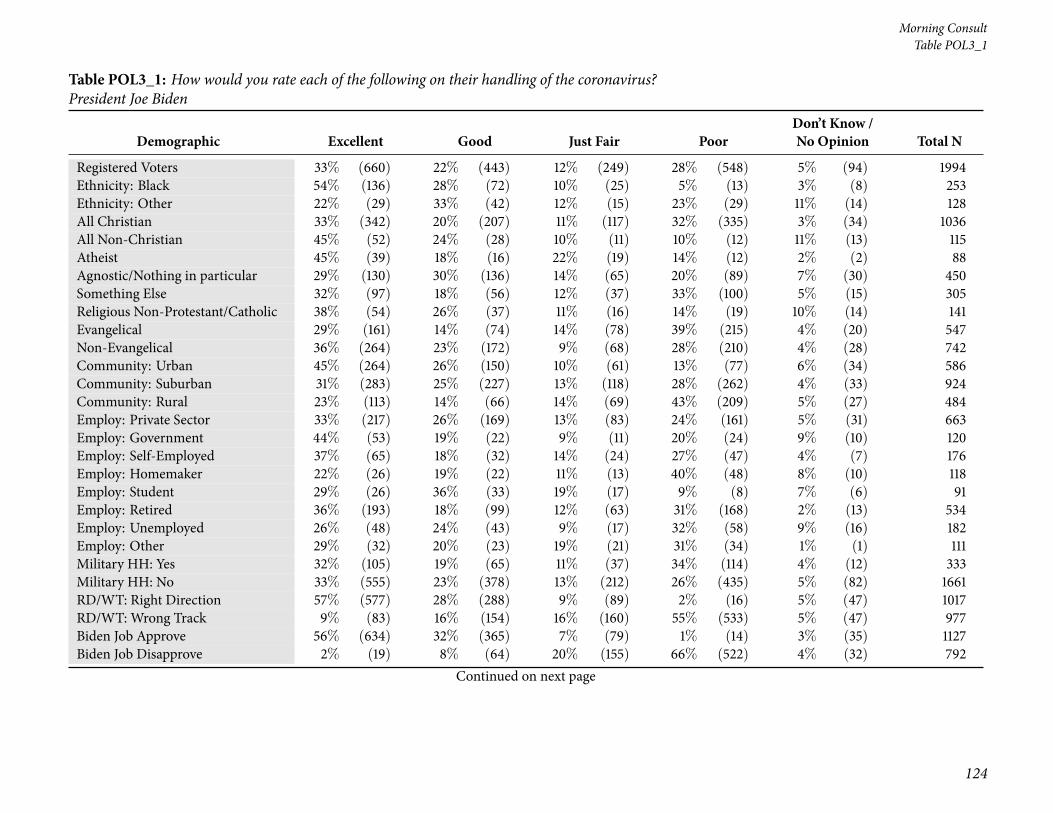
124
Morning ConsultTable POL3_1
Table POL3_1: How would you rate each of the following on their handling of the coronavirus?President Joe Biden
Demographic Excellent Good Just Fair PoorDon’t Know /No Opinion Total N
Registered Voters 33% (660) 22% (443) 12% (249) 28% (548) 5% (94) 1994Ethnicity: Black 54% (136) 28% (72) 10% (25) 5% (13) 3% (8) 253Ethnicity: Other 22% (29) 33% (42) 12% (15) 23% (29) 11% (14) 128All Christian 33% (342) 20% (207) 11% (117) 32% (335) 3% (34) 1036All Non-Christian 45% (52) 24% (28) 10% (11) 10% (12) 11% (13) 115Atheist 45% (39) 18% (16) 22% (19) 14% (12) 2% (2) 88Agnostic/Nothing in particular 29% (130) 30% (136) 14% (65) 20% (89) 7% (30) 450Something Else 32% (97) 18% (56) 12% (37) 33% (100) 5% (15) 305Religious Non-Protestant/Catholic 38% (54) 26% (37) 11% (16) 14% (19) 10% (14) 141Evangelical 29% (161) 14% (74) 14% (78) 39% (215) 4% (20) 547Non-Evangelical 36% (264) 23% (172) 9% (68) 28% (210) 4% (28) 742Community: Urban 45% (264) 26% (150) 10% (61) 13% (77) 6% (34) 586Community: Suburban 31% (283) 25% (227) 13% (118) 28% (262) 4% (33) 924Community: Rural 23% (113) 14% (66) 14% (69) 43% (209) 5% (27) 484Employ: Private Sector 33% (217) 26% (169) 13% (83) 24% (161) 5% (31) 663Employ: Government 44% (53) 19% (22) 9% (11) 20% (24) 9% (10) 120Employ: Self-Employed 37% (65) 18% (32) 14% (24) 27% (47) 4% (7) 176Employ: Homemaker 22% (26) 19% (22) 11% (13) 40% (48) 8% (10) 118Employ: Student 29% (26) 36% (33) 19% (17) 9% (8) 7% (6) 91Employ: Retired 36% (193) 18% (99) 12% (63) 31% (168) 2% (13) 534Employ: Unemployed 26% (48) 24% (43) 9% (17) 32% (58) 9% (16) 182Employ: Other 29% (32) 20% (23) 19% (21) 31% (34) 1% (1) 111Military HH: Yes 32% (105) 19% (65) 11% (37) 34% (114) 4% (12) 333Military HH: No 33% (555) 23% (378) 13% (212) 26% (435) 5% (82) 1661RD/WT: Right Direction 57% (577) 28% (288) 9% (89) 2% (16) 5% (47) 1017RD/WT: Wrong Track 9% (83) 16% (154) 16% (160) 55% (533) 5% (47) 977Biden Job Approve 56% (634) 32% (365) 7% (79) 1% (14) 3% (35) 1127Biden Job Disapprove 2% (19) 8% (64) 20% (155) 66% (522) 4% (32) 792
Continued on next page

National Tracking Poll #2103129, March, 2021
125
Table POL3_1
Table POL3_1: How would you rate each of the following on their handling of the coronavirus?President Joe Biden
Demographic Excellent Good Just Fair PoorDon’t Know /No Opinion Total N
Registered Voters 33% (660) 22% (443) 12% (249) 28% (548) 5% (94) 1994Biden Job Strongly Approve 81% (538) 14% (94) 1% (7) 1% (7) 3% (17) 663Biden Job Somewhat Approve 21% (96) 58% (271) 16% (72) 2% (7) 4% (18) 464Biden Job Somewhat Disapprove 7% (16) 21% (48) 41% (93) 25% (57) 6% (15) 229Biden Job Strongly Disapprove — (3) 3% (16) 11% (62) 83% (465) 3% (17) 562Favorable of Biden 56% (640) 34% (390) 7% (81) 1% (9) 2% (23) 1143Unfavorable of Biden 2% (14) 5% (42) 21% (163) 68% (530) 5% (35) 785Very Favorable of Biden 84% (540) 13% (86) 2% (10) — (1) 1% (7) 644Somewhat Favorable of Biden 20% (100) 61% (304) 14% (71) 2% (8) 3% (16) 499Somewhat Unfavorable of Biden 6% (11) 16% (30) 44% (83) 24% (46) 10% (19) 190Very Unfavorable of Biden — (3) 2% (12) 13% (80) 81% (484) 3% (16) 595#1 Issue: Economy 31% (224) 20% (140) 15% (110) 30% (211) 4% (27) 714#1 Issue: Security 14% (44) 14% (44) 10% (32) 56% (172) 4% (13) 305#1 Issue: Health Care 44% (134) 31% (96) 13% (39) 9% (28) 3% (11) 308#1 Issue: Medicare / Social Security 42% (113) 23% (61) 9% (24) 22% (59) 4% (10) 267#1 Issue: Women’s Issues 24% (21) 31% (27) 14% (12) 21% (19) 11% (10) 88#1 Issue: Education 26% (23) 37% (33) 15% (13) 14% (13) 8% (7) 89#1 Issue: Energy 51% (46) 16% (14) 14% (12) 8% (7) 11% (10) 89#1 Issue: Other 41% (55) 21% (28) 5% (6) 29% (40) 4% (6) 1342020 Vote: Joe Biden 59% (611) 31% (320) 7% (69) 1% (13) 2% (25) 10372020 Vote: Donald Trump 3% (24) 8% (61) 19% (138) 64% (478) 5% (40) 7412020 Vote: Other 4% (2) 24% (14) 19% (12) 32% (19) 21% (13) 602020 Vote: Didn’t Vote 15% (22) 30% (46) 20% (31) 25% (38) 11% (17) 1532018 House Vote: Democrat 62% (462) 27% (200) 7% (51) 3% (23) 2% (12) 7482018 House Vote: Republican 7% (46) 11% (66) 17% (109) 61% (378) 4% (23) 6232018 House Vote: Someone else 12% (6) 26% (14) 19% (10) 33% (18) 10% (5) 552016 Vote: Hillary Clinton 65% (457) 27% (188) 5% (33) 2% (14) 1% (9) 7002016 Vote: Donald Trump 7% (52) 12% (85) 18% (127) 58% (413) 5% (36) 7132016 Vote: Other 16% (18) 38% (41) 18% (19) 21% (23) 7% (7) 1082016 Vote: Didn’t Vote 28% (131) 27% (125) 15% (70) 21% (99) 9% (43) 467
Continued on next page

126
Morning ConsultTable POL3_1
Table POL3_1: How would you rate each of the following on their handling of the coronavirus?President Joe Biden
Demographic Excellent Good Just Fair PoorDon’t Know /No Opinion Total N
Registered Voters 33% (660) 22% (443) 12% (249) 28% (548) 5% (94) 1994Voted in 2014: Yes 37% (469) 19% (240) 11% (143) 30% (386) 3% (36) 1275Voted in 2014: No 27% (191) 28% (202) 15% (105) 23% (163) 8% (58) 7194-Region: Northeast 41% (147) 20% (73) 12% (44) 20% (73) 5% (19) 3564-Region: Midwest 25% (114) 24% (108) 15% (67) 32% (147) 5% (22) 4584-Region: South 33% (242) 21% (159) 12% (87) 30% (225) 4% (31) 7444-Region: West 36% (157) 24% (103) 12% (51) 24% (104) 5% (21) 436Party: Democrat/Leans Democrat 59% (573) 30% (292) 6% (62) 2% (19) 3% (27) 973Party: Republican/Leans Republican 7% (52) 10% (80) 18% (136) 60% (457) 6% (43) 768Note: Row proportions may total to larger than one-hundred percent due to rounding. For more information visit MorningConsultIntelligence.com.

National Tracking Poll #2103129, March, 2021
127
Table POL3_2
Table POL3_2: How would you rate each of the following on their handling of the coronavirus?Congress
Demographic Excellent Good Just Fair PoorDon’t Know /No Opinion Total N
Registered Voters 9% (178) 22% (445) 35% (703) 25% (495) 9% (173) 1994Gender: Male 10% (98) 21% (196) 35% (322) 28% (263) 6% (54) 933Gender: Female 8% (80) 23% (249) 36% (381) 22% (231) 11% (118) 1061Age: 18-34 13% (66) 23% (116) 28% (140) 18% (90) 18% (89) 501Age: 35-44 11% (34) 23% (70) 28% (86) 25% (76) 12% (36) 303Age: 45-64 7% (50) 21% (154) 40% (291) 28% (201) 4% (30) 726Age: 65+ 6% (27) 23% (105) 40% (186) 28% (128) 4% (18) 464GenZers: 1997-2012 7% (12) 26% (43) 35% (58) 13% (22) 19% (32) 168Millennials: 1981-1996 15% (82) 22% (123) 26% (143) 22% (121) 15% (83) 551GenXers: 1965-1980 7% (28) 24% (102) 38% (163) 25% (106) 6% (25) 424Baby Boomers: 1946-1964 7% (54) 20% (160) 40% (316) 29% (225) 4% (30) 784PID: Dem (no lean) 16% (128) 33% (268) 35% (286) 10% (84) 6% (51) 817PID: Ind (no lean) 4% (22) 15% (83) 34% (187) 33% (181) 13% (69) 542PID: Rep (no lean) 4% (28) 15% (95) 36% (231) 36% (229) 8% (52) 635PID/Gender: DemMen 19% (67) 30% (104) 36% (125) 11% (40) 4% (14) 350PID/Gender: DemWomen 13% (61) 35% (164) 34% (161) 9% (44) 8% (37) 467PID/Gender: Ind Men 5% (15) 15% (41) 32% (91) 40% (111) 8% (22) 280PID/Gender: Ind Women 3% (7) 16% (41) 37% (96) 27% (71) 18% (48) 262PID/Gender: Rep Men 5% (16) 17% (50) 35% (107) 37% (113) 6% (19) 304PID/Gender: Rep Women 4% (12) 13% (44) 38% (125) 35% (117) 10% (33) 332Ideo: Liberal (1-3) 15% (91) 30% (187) 38% (235) 14% (85) 4% (26) 625Ideo: Moderate (4) 8% (44) 30% (168) 34% (191) 20% (113) 9% (54) 571Ideo: Conservative (5-7) 5% (36) 11% (76) 36% (245) 41% (281) 7% (47) 685Educ: < College 7% (89) 22% (270) 34% (425) 27% (342) 10% (129) 1254Educ: Bachelors degree 11% (50) 23% (107) 39% (184) 22% (102) 6% (28) 472Educ: Post-grad 15% (39) 25% (68) 35% (95) 19% (50) 6% (16) 268Income: Under 50k 8% (80) 22% (214) 34% (338) 25% (243) 12% (114) 989Income: 50k-100k 7% (43) 20% (123) 40% (243) 26% (159) 6% (34) 602Income: 100k+ 14% (54) 27% (108) 30% (122) 23% (93) 6% (25) 402Ethnicity: White 9% (142) 21% (337) 36% (575) 27% (430) 8% (130) 1613Ethnicity: Hispanic 10% (19) 23% (45) 32% (62) 25% (49) 9% (18) 193
Continued on next page
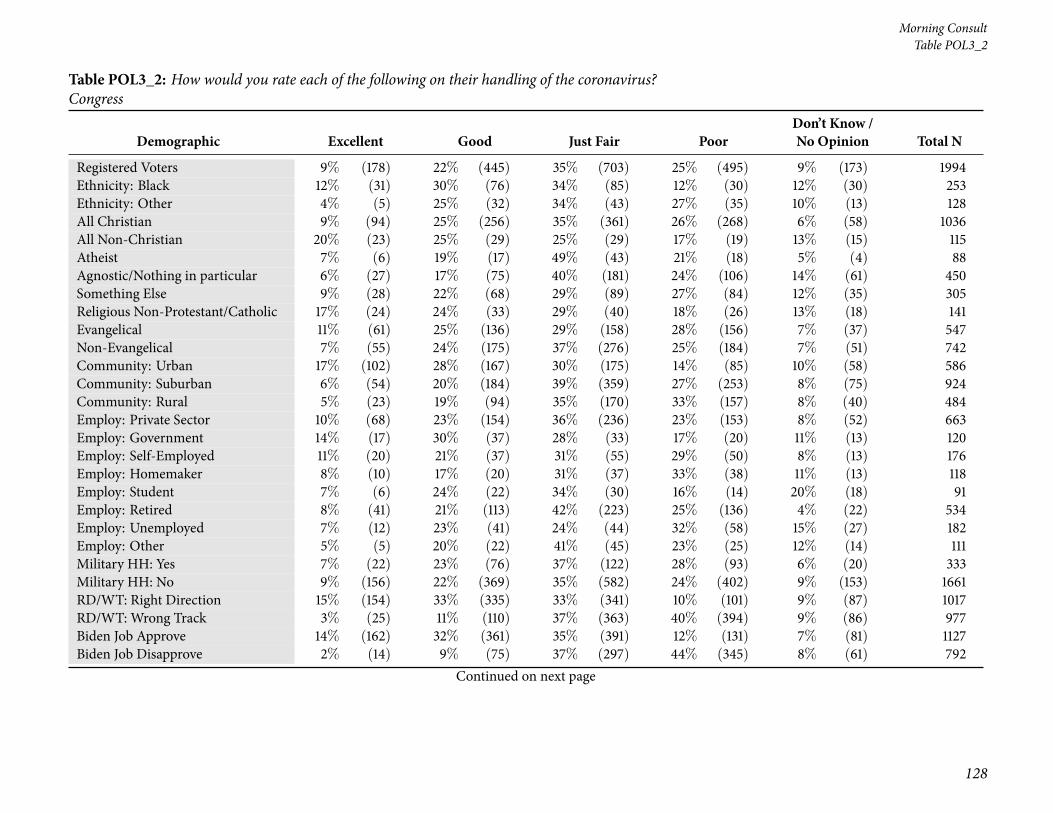
128
Morning ConsultTable POL3_2
Table POL3_2: How would you rate each of the following on their handling of the coronavirus?Congress
Demographic Excellent Good Just Fair PoorDon’t Know /No Opinion Total N
Registered Voters 9% (178) 22% (445) 35% (703) 25% (495) 9% (173) 1994Ethnicity: Black 12% (31) 30% (76) 34% (85) 12% (30) 12% (30) 253Ethnicity: Other 4% (5) 25% (32) 34% (43) 27% (35) 10% (13) 128All Christian 9% (94) 25% (256) 35% (361) 26% (268) 6% (58) 1036All Non-Christian 20% (23) 25% (29) 25% (29) 17% (19) 13% (15) 115Atheist 7% (6) 19% (17) 49% (43) 21% (18) 5% (4) 88Agnostic/Nothing in particular 6% (27) 17% (75) 40% (181) 24% (106) 14% (61) 450Something Else 9% (28) 22% (68) 29% (89) 27% (84) 12% (35) 305Religious Non-Protestant/Catholic 17% (24) 24% (33) 29% (40) 18% (26) 13% (18) 141Evangelical 11% (61) 25% (136) 29% (158) 28% (156) 7% (37) 547Non-Evangelical 7% (55) 24% (175) 37% (276) 25% (184) 7% (51) 742Community: Urban 17% (102) 28% (167) 30% (175) 14% (85) 10% (58) 586Community: Suburban 6% (54) 20% (184) 39% (359) 27% (253) 8% (75) 924Community: Rural 5% (23) 19% (94) 35% (170) 33% (157) 8% (40) 484Employ: Private Sector 10% (68) 23% (154) 36% (236) 23% (153) 8% (52) 663Employ: Government 14% (17) 30% (37) 28% (33) 17% (20) 11% (13) 120Employ: Self-Employed 11% (20) 21% (37) 31% (55) 29% (50) 8% (13) 176Employ: Homemaker 8% (10) 17% (20) 31% (37) 33% (38) 11% (13) 118Employ: Student 7% (6) 24% (22) 34% (30) 16% (14) 20% (18) 91Employ: Retired 8% (41) 21% (113) 42% (223) 25% (136) 4% (22) 534Employ: Unemployed 7% (12) 23% (41) 24% (44) 32% (58) 15% (27) 182Employ: Other 5% (5) 20% (22) 41% (45) 23% (25) 12% (14) 111Military HH: Yes 7% (22) 23% (76) 37% (122) 28% (93) 6% (20) 333Military HH: No 9% (156) 22% (369) 35% (582) 24% (402) 9% (153) 1661RD/WT: Right Direction 15% (154) 33% (335) 33% (341) 10% (101) 9% (87) 1017RD/WT: Wrong Track 3% (25) 11% (110) 37% (363) 40% (394) 9% (86) 977Biden Job Approve 14% (162) 32% (361) 35% (391) 12% (131) 7% (81) 1127Biden Job Disapprove 2% (14) 9% (75) 37% (297) 44% (345) 8% (61) 792
Continued on next page
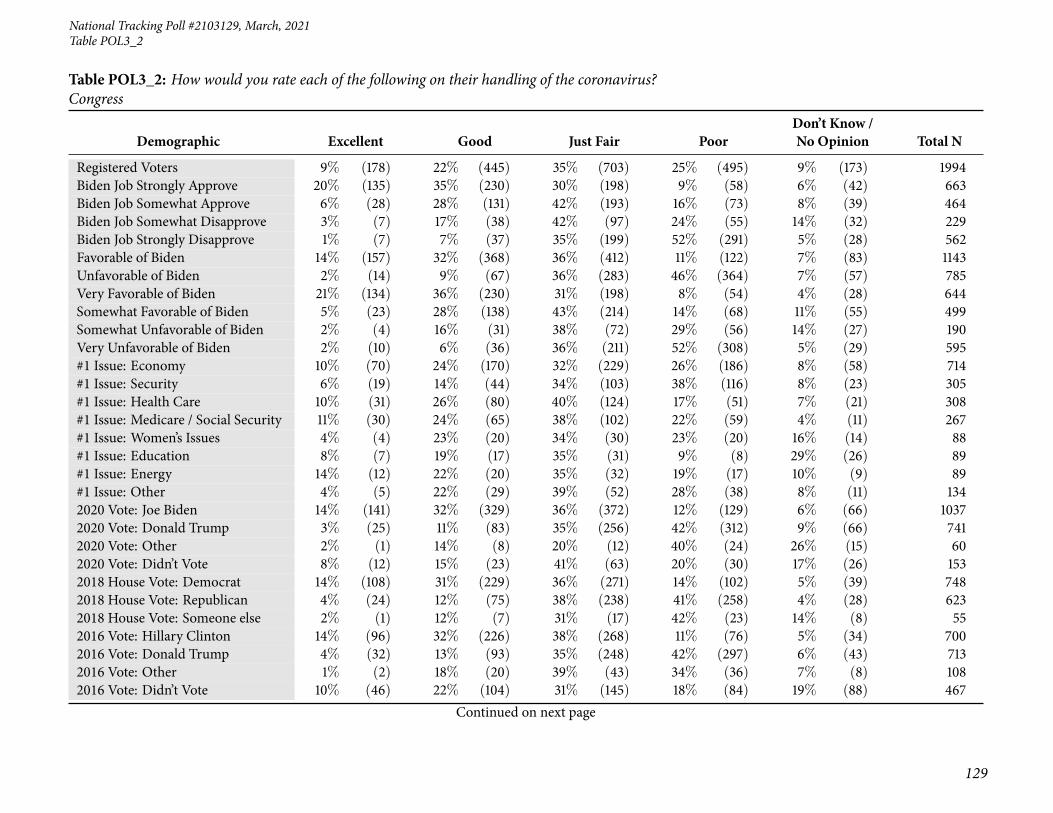
National Tracking Poll #2103129, March, 2021
129
Table POL3_2
Table POL3_2: How would you rate each of the following on their handling of the coronavirus?Congress
Demographic Excellent Good Just Fair PoorDon’t Know /No Opinion Total N
Registered Voters 9% (178) 22% (445) 35% (703) 25% (495) 9% (173) 1994Biden Job Strongly Approve 20% (135) 35% (230) 30% (198) 9% (58) 6% (42) 663Biden Job Somewhat Approve 6% (28) 28% (131) 42% (193) 16% (73) 8% (39) 464Biden Job Somewhat Disapprove 3% (7) 17% (38) 42% (97) 24% (55) 14% (32) 229Biden Job Strongly Disapprove 1% (7) 7% (37) 35% (199) 52% (291) 5% (28) 562Favorable of Biden 14% (157) 32% (368) 36% (412) 11% (122) 7% (83) 1143Unfavorable of Biden 2% (14) 9% (67) 36% (283) 46% (364) 7% (57) 785Very Favorable of Biden 21% (134) 36% (230) 31% (198) 8% (54) 4% (28) 644Somewhat Favorable of Biden 5% (23) 28% (138) 43% (214) 14% (68) 11% (55) 499Somewhat Unfavorable of Biden 2% (4) 16% (31) 38% (72) 29% (56) 14% (27) 190Very Unfavorable of Biden 2% (10) 6% (36) 36% (211) 52% (308) 5% (29) 595#1 Issue: Economy 10% (70) 24% (170) 32% (229) 26% (186) 8% (58) 714#1 Issue: Security 6% (19) 14% (44) 34% (103) 38% (116) 8% (23) 305#1 Issue: Health Care 10% (31) 26% (80) 40% (124) 17% (51) 7% (21) 308#1 Issue: Medicare / Social Security 11% (30) 24% (65) 38% (102) 22% (59) 4% (11) 267#1 Issue: Women’s Issues 4% (4) 23% (20) 34% (30) 23% (20) 16% (14) 88#1 Issue: Education 8% (7) 19% (17) 35% (31) 9% (8) 29% (26) 89#1 Issue: Energy 14% (12) 22% (20) 35% (32) 19% (17) 10% (9) 89#1 Issue: Other 4% (5) 22% (29) 39% (52) 28% (38) 8% (11) 1342020 Vote: Joe Biden 14% (141) 32% (329) 36% (372) 12% (129) 6% (66) 10372020 Vote: Donald Trump 3% (25) 11% (83) 35% (256) 42% (312) 9% (66) 7412020 Vote: Other 2% (1) 14% (8) 20% (12) 40% (24) 26% (15) 602020 Vote: Didn’t Vote 8% (12) 15% (23) 41% (63) 20% (30) 17% (26) 1532018 House Vote: Democrat 14% (108) 31% (229) 36% (271) 14% (102) 5% (39) 7482018 House Vote: Republican 4% (24) 12% (75) 38% (238) 41% (258) 4% (28) 6232018 House Vote: Someone else 2% (1) 12% (7) 31% (17) 42% (23) 14% (8) 552016 Vote: Hillary Clinton 14% (96) 32% (226) 38% (268) 11% (76) 5% (34) 7002016 Vote: Donald Trump 4% (32) 13% (93) 35% (248) 42% (297) 6% (43) 7132016 Vote: Other 1% (2) 18% (20) 39% (43) 34% (36) 7% (8) 1082016 Vote: Didn’t Vote 10% (46) 22% (104) 31% (145) 18% (84) 19% (88) 467
Continued on next page

130
Morning ConsultTable POL3_2
Table POL3_2: How would you rate each of the following on their handling of the coronavirus?Congress
Demographic Excellent Good Just Fair PoorDon’t Know /No Opinion Total N
Registered Voters 9% (178) 22% (445) 35% (703) 25% (495) 9% (173) 1994Voted in 2014: Yes 9% (121) 21% (269) 37% (475) 27% (345) 5% (64) 1275Voted in 2014: No 8% (58) 24% (176) 32% (228) 21% (150) 15% (108) 7194-Region: Northeast 15% (53) 22% (80) 33% (118) 20% (72) 9% (33) 3564-Region: Midwest 5% (21) 19% (88) 38% (173) 29% (135) 9% (41) 4584-Region: South 9% (64) 24% (177) 35% (257) 25% (184) 8% (63) 7444-Region: West 9% (41) 23% (100) 36% (155) 24% (103) 8% (36) 436Party: Democrat/Leans Democrat 14% (139) 33% (317) 36% (349) 11% (109) 6% (60) 973Party: Republican/Leans Republican 4% (30) 14% (105) 36% (277) 37% (286) 9% (70) 768Note: Row proportions may total to larger than one-hundred percent due to rounding. For more information visit MorningConsultIntelligence.com.
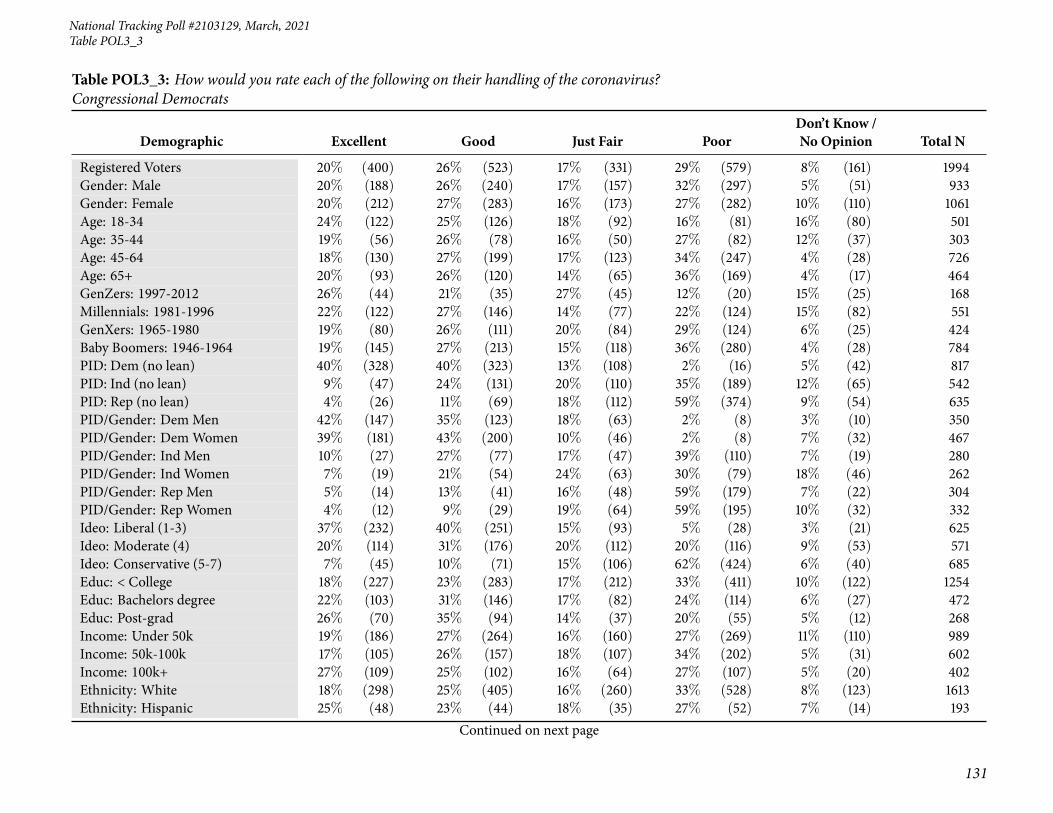
National Tracking Poll #2103129, March, 2021
131
Table POL3_3
Table POL3_3: How would you rate each of the following on their handling of the coronavirus?Congressional Democrats
Demographic Excellent Good Just Fair PoorDon’t Know /No Opinion Total N
Registered Voters 20% (400) 26% (523) 17% (331) 29% (579) 8% (161) 1994Gender: Male 20% (188) 26% (240) 17% (157) 32% (297) 5% (51) 933Gender: Female 20% (212) 27% (283) 16% (173) 27% (282) 10% (110) 1061Age: 18-34 24% (122) 25% (126) 18% (92) 16% (81) 16% (80) 501Age: 35-44 19% (56) 26% (78) 16% (50) 27% (82) 12% (37) 303Age: 45-64 18% (130) 27% (199) 17% (123) 34% (247) 4% (28) 726Age: 65+ 20% (93) 26% (120) 14% (65) 36% (169) 4% (17) 464GenZers: 1997-2012 26% (44) 21% (35) 27% (45) 12% (20) 15% (25) 168Millennials: 1981-1996 22% (122) 27% (146) 14% (77) 22% (124) 15% (82) 551GenXers: 1965-1980 19% (80) 26% (111) 20% (84) 29% (124) 6% (25) 424Baby Boomers: 1946-1964 19% (145) 27% (213) 15% (118) 36% (280) 4% (28) 784PID: Dem (no lean) 40% (328) 40% (323) 13% (108) 2% (16) 5% (42) 817PID: Ind (no lean) 9% (47) 24% (131) 20% (110) 35% (189) 12% (65) 542PID: Rep (no lean) 4% (26) 11% (69) 18% (112) 59% (374) 9% (54) 635PID/Gender: DemMen 42% (147) 35% (123) 18% (63) 2% (8) 3% (10) 350PID/Gender: DemWomen 39% (181) 43% (200) 10% (46) 2% (8) 7% (32) 467PID/Gender: Ind Men 10% (27) 27% (77) 17% (47) 39% (110) 7% (19) 280PID/Gender: Ind Women 7% (19) 21% (54) 24% (63) 30% (79) 18% (46) 262PID/Gender: Rep Men 5% (14) 13% (41) 16% (48) 59% (179) 7% (22) 304PID/Gender: Rep Women 4% (12) 9% (29) 19% (64) 59% (195) 10% (32) 332Ideo: Liberal (1-3) 37% (232) 40% (251) 15% (93) 5% (28) 3% (21) 625Ideo: Moderate (4) 20% (114) 31% (176) 20% (112) 20% (116) 9% (53) 571Ideo: Conservative (5-7) 7% (45) 10% (71) 15% (106) 62% (424) 6% (40) 685Educ: < College 18% (227) 23% (283) 17% (212) 33% (411) 10% (122) 1254Educ: Bachelors degree 22% (103) 31% (146) 17% (82) 24% (114) 6% (27) 472Educ: Post-grad 26% (70) 35% (94) 14% (37) 20% (55) 5% (12) 268Income: Under 50k 19% (186) 27% (264) 16% (160) 27% (269) 11% (110) 989Income: 50k-100k 17% (105) 26% (157) 18% (107) 34% (202) 5% (31) 602Income: 100k+ 27% (109) 25% (102) 16% (64) 27% (107) 5% (20) 402Ethnicity: White 18% (298) 25% (405) 16% (260) 33% (528) 8% (123) 1613Ethnicity: Hispanic 25% (48) 23% (44) 18% (35) 27% (52) 7% (14) 193
Continued on next page

132
Morning ConsultTable POL3_3
Table POL3_3: How would you rate each of the following on their handling of the coronavirus?Congressional Democrats
Demographic Excellent Good Just Fair PoorDon’t Know /No Opinion Total N
Registered Voters 20% (400) 26% (523) 17% (331) 29% (579) 8% (161) 1994Ethnicity: Black 32% (81) 34% (87) 18% (45) 7% (18) 8% (21) 253Ethnicity: Other 17% (22) 25% (31) 20% (26) 25% (32) 14% (18) 128All Christian 20% (209) 25% (257) 15% (157) 34% (354) 6% (59) 1036All Non-Christian 37% (43) 25% (29) 14% (16) 13% (15) 11% (12) 115Atheist 17% (15) 41% (36) 26% (22) 12% (11) 4% (4) 88Agnostic/Nothing in particular 17% (75) 31% (138) 18% (82) 24% (107) 11% (48) 450Something Else 19% (59) 21% (63) 17% (53) 30% (92) 12% (37) 305Religious Non-Protestant/Catholic 31% (44) 24% (33) 17% (25) 16% (23) 11% (16) 141Evangelical 21% (114) 16% (90) 15% (84) 40% (217) 8% (43) 547Non-Evangelical 20% (145) 29% (218) 15% (113) 29% (218) 7% (49) 742Community: Urban 32% (189) 29% (170) 16% (94) 15% (89) 8% (45) 586Community: Suburban 16% (152) 28% (258) 18% (164) 30% (273) 8% (76) 924Community: Rural 12% (59) 20% (95) 15% (72) 45% (217) 8% (41) 484Employ: Private Sector 22% (143) 28% (184) 16% (106) 27% (179) 8% (50) 663Employ: Government 34% (41) 25% (30) 12% (14) 20% (24) 9% (11) 120Employ: Self-Employed 26% (45) 22% (39) 16% (29) 30% (53) 5% (10) 176Employ: Homemaker 15% (18) 18% (22) 16% (18) 38% (44) 13% (16) 118Employ: Student 14% (13) 26% (24) 31% (28) 14% (13) 14% (13) 91Employ: Retired 19% (101) 27% (143) 16% (88) 34% (180) 4% (23) 534Employ: Unemployed 13% (23) 28% (52) 16% (29) 29% (52) 14% (26) 182Employ: Other 16% (18) 27% (30) 16% (18) 29% (32) 12% (13) 111Military HH: Yes 19% (62) 23% (78) 17% (55) 36% (121) 5% (17) 333Military HH: No 20% (338) 27% (445) 17% (275) 28% (458) 9% (145) 1661RD/WT: Right Direction 34% (350) 39% (401) 15% (153) 3% (31) 8% (83) 1017RD/WT: Wrong Track 5% (50) 13% (122) 18% (178) 56% (548) 8% (79) 977Biden Job Approve 34% (383) 42% (468) 15% (169) 3% (35) 6% (72) 1127Biden Job Disapprove 2% (16) 6% (44) 19% (148) 67% (528) 7% (57) 792
Continued on next page

National Tracking Poll #2103129, March, 2021
133
Table POL3_3
Table POL3_3: How would you rate each of the following on their handling of the coronavirus?Congressional Democrats
Demographic Excellent Good Just Fair PoorDon’t Know /No Opinion Total N
Registered Voters 20% (400) 26% (523) 17% (331) 29% (579) 8% (161) 1994Biden Job Strongly Approve 48% (318) 39% (262) 6% (38) 2% (10) 5% (34) 663Biden Job Somewhat Approve 14% (65) 44% (206) 28% (130) 5% (24) 8% (38) 464Biden Job Somewhat Disapprove 4% (10) 14% (33) 39% (90) 29% (67) 13% (30) 229Biden Job Strongly Disapprove 1% (6) 2% (11) 10% (58) 82% (461) 5% (27) 562Favorable of Biden 33% (383) 42% (477) 16% (181) 3% (33) 6% (68) 1143Unfavorable of Biden 1% (10) 4% (35) 18% (140) 68% (537) 8% (62) 785Very Favorable of Biden 51% (328) 39% (249) 6% (39) 1% (4) 4% (23) 644Somewhat Favorable of Biden 11% (54) 46% (228) 28% (142) 6% (29) 9% (45) 499Somewhat Unfavorable of Biden 3% (5) 13% (24) 32% (61) 34% (65) 18% (34) 190Very Unfavorable of Biden 1% (5) 2% (11) 13% (79) 79% (472) 5% (28) 595#1 Issue: Economy 20% (139) 23% (163) 18% (126) 32% (227) 8% (58) 714#1 Issue: Security 10% (30) 13% (39) 13% (40) 58% (178) 6% (18) 305#1 Issue: Health Care 29% (89) 38% (116) 17% (54) 10% (31) 6% (19) 308#1 Issue: Medicare / Social Security 20% (53) 33% (87) 17% (46) 24% (65) 6% (16) 267#1 Issue: Women’s Issues 17% (15) 32% (28) 17% (15) 19% (17) 15% (13) 88#1 Issue: Education 17% (15) 22% (20) 24% (21) 16% (14) 21% (19) 89#1 Issue: Energy 29% (25) 40% (35) 9% (8) 9% (8) 14% (12) 89#1 Issue: Other 25% (34) 26% (35) 15% (21) 28% (38) 6% (7) 1342020 Vote: Joe Biden 35% (362) 41% (427) 16% (162) 3% (30) 5% (55) 10372020 Vote: Donald Trump 3% (20) 6% (48) 16% (122) 66% (488) 9% (63) 7412020 Vote: Other 4% (2) 16% (10) 23% (14) 33% (20) 24% (15) 602020 Vote: Didn’t Vote 10% (16) 23% (36) 21% (33) 26% (40) 19% (28) 1532018 House Vote: Democrat 37% (280) 42% (310) 12% (89) 5% (36) 4% (33) 7482018 House Vote: Republican 4% (26) 8% (49) 21% (128) 63% (395) 4% (25) 6232018 House Vote: Someone else 3% (2) 25% (14) 21% (12) 36% (20) 13% (7) 552016 Vote: Hillary Clinton 39% (274) 42% (293) 12% (85) 3% (19) 4% (28) 7002016 Vote: Donald Trump 5% (35) 10% (74) 17% (123) 61% (438) 6% (43) 7132016 Vote: Other 3% (3) 35% (38) 32% (35) 23% (25) 7% (8) 1082016 Vote: Didn’t Vote 18% (85) 25% (116) 19% (87) 20% (95) 18% (83) 467
Continued on next page
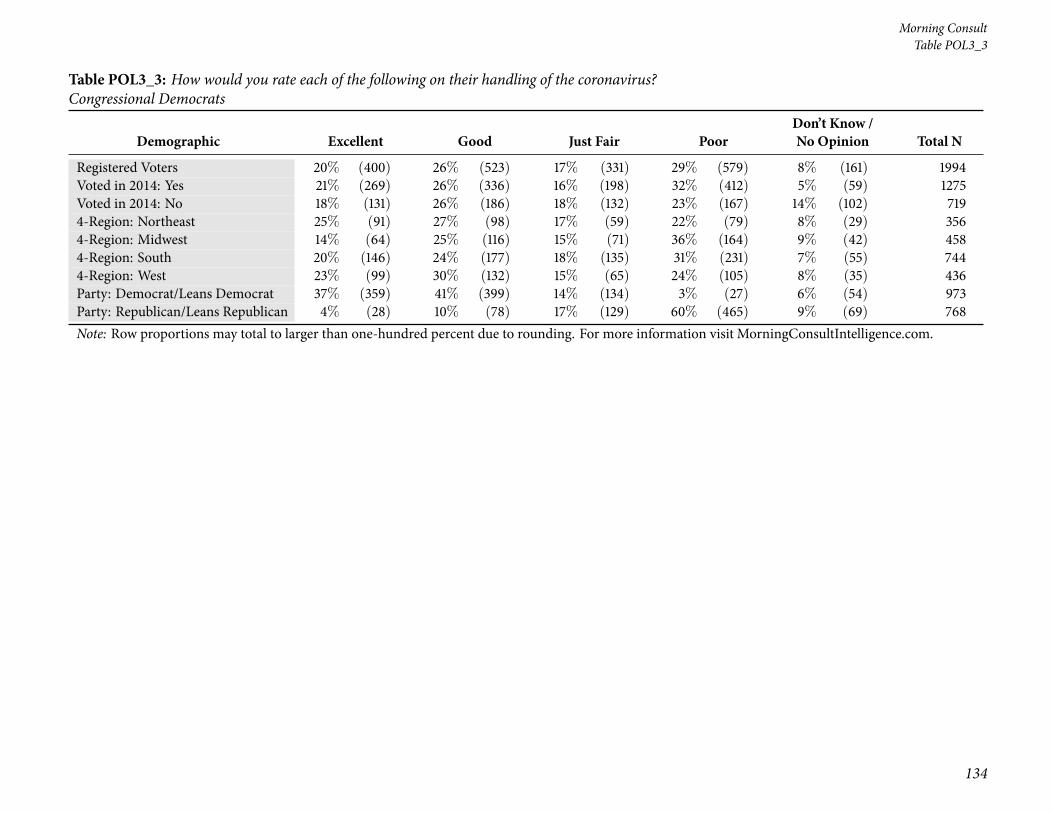
134
Morning ConsultTable POL3_3
Table POL3_3: How would you rate each of the following on their handling of the coronavirus?Congressional Democrats
Demographic Excellent Good Just Fair PoorDon’t Know /No Opinion Total N
Registered Voters 20% (400) 26% (523) 17% (331) 29% (579) 8% (161) 1994Voted in 2014: Yes 21% (269) 26% (336) 16% (198) 32% (412) 5% (59) 1275Voted in 2014: No 18% (131) 26% (186) 18% (132) 23% (167) 14% (102) 7194-Region: Northeast 25% (91) 27% (98) 17% (59) 22% (79) 8% (29) 3564-Region: Midwest 14% (64) 25% (116) 15% (71) 36% (164) 9% (42) 4584-Region: South 20% (146) 24% (177) 18% (135) 31% (231) 7% (55) 7444-Region: West 23% (99) 30% (132) 15% (65) 24% (105) 8% (35) 436Party: Democrat/Leans Democrat 37% (359) 41% (399) 14% (134) 3% (27) 6% (54) 973Party: Republican/Leans Republican 4% (28) 10% (78) 17% (129) 60% (465) 9% (69) 768Note: Row proportions may total to larger than one-hundred percent due to rounding. For more information visit MorningConsultIntelligence.com.

National Tracking Poll #2103129, March, 2021
135
Table POL3_4
Table POL3_4: How would you rate each of the following on their handling of the coronavirus?Congressional Republicans
Demographic Excellent Good Just Fair PoorDon’t Know /No Opinion Total N
Registered Voters 8% (169) 21% (415) 22% (445) 39% (786) 9% (178) 1994Gender: Male 10% (96) 21% (192) 23% (215) 40% (371) 6% (60) 933Gender: Female 7% (74) 21% (224) 22% (230) 39% (416) 11% (118) 1061Age: 18-34 10% (52) 16% (80) 20% (101) 36% (179) 18% (89) 501Age: 35-44 11% (34) 20% (59) 22% (67) 36% (108) 12% (36) 303Age: 45-64 7% (51) 23% (165) 26% (186) 40% (291) 5% (33) 726Age: 65+ 7% (33) 24% (110) 20% (91) 45% (209) 4% (20) 464GenZers: 1997-2012 5% (9) 12% (20) 28% (47) 42% (71) 13% (22) 168Millennials: 1981-1996 13% (73) 20% (108) 18% (100) 32% (178) 17% (93) 551GenXers: 1965-1980 6% (27) 21% (88) 29% (123) 36% (155) 7% (31) 424Baby Boomers: 1946-1964 7% (57) 22% (176) 21% (164) 46% (360) 4% (28) 784PID: Dem (no lean) 5% (44) 10% (79) 17% (140) 61% (501) 6% (53) 817PID: Ind (no lean) 3% (15) 17% (93) 28% (150) 39% (212) 13% (72) 542PID: Rep (no lean) 17% (111) 38% (244) 24% (155) 11% (73) 8% (52) 635PID/Gender: DemMen 7% (26) 11% (38) 18% (64) 57% (201) 6% (20) 350PID/Gender: DemWomen 4% (18) 9% (40) 16% (76) 64% (300) 7% (33) 467PID/Gender: Ind Men 4% (12) 17% (48) 25% (71) 45% (126) 8% (22) 280PID/Gender: Ind Women 1% (3) 17% (45) 30% (79) 33% (86) 19% (50) 262PID/Gender: Rep Men 19% (57) 35% (105) 26% (80) 14% (43) 6% (18) 304PID/Gender: Rep Women 16% (53) 42% (139) 23% (75) 9% (29) 10% (35) 332Ideo: Liberal (1-3) 7% (45) 10% (62) 15% (91) 65% (404) 4% (23) 625Ideo: Moderate (4) 5% (26) 18% (104) 24% (139) 42% (242) 10% (60) 571Ideo: Conservative (5-7) 14% (96) 33% (229) 28% (192) 17% (119) 7% (49) 685Educ: < College 8% (96) 23% (293) 22% (279) 37% (469) 9% (117) 1254Educ: Bachelors degree 10% (46) 16% (74) 24% (113) 43% (201) 8% (37) 472Educ: Post-grad 10% (27) 18% (48) 20% (53) 43% (116) 9% (24) 268Income: Under 50k 6% (61) 21% (208) 23% (224) 39% (381) 12% (116) 989Income: 50k-100k 10% (63) 20% (123) 23% (137) 41% (249) 5% (31) 602Income: 100k+ 11% (45) 21% (85) 21% (85) 39% (157) 8% (31) 402Ethnicity: White 10% (155) 23% (365) 22% (358) 37% (598) 9% (137) 1613Ethnicity: Hispanic 6% (11) 10% (19) 28% (54) 49% (94) 8% (15) 193
Continued on next page
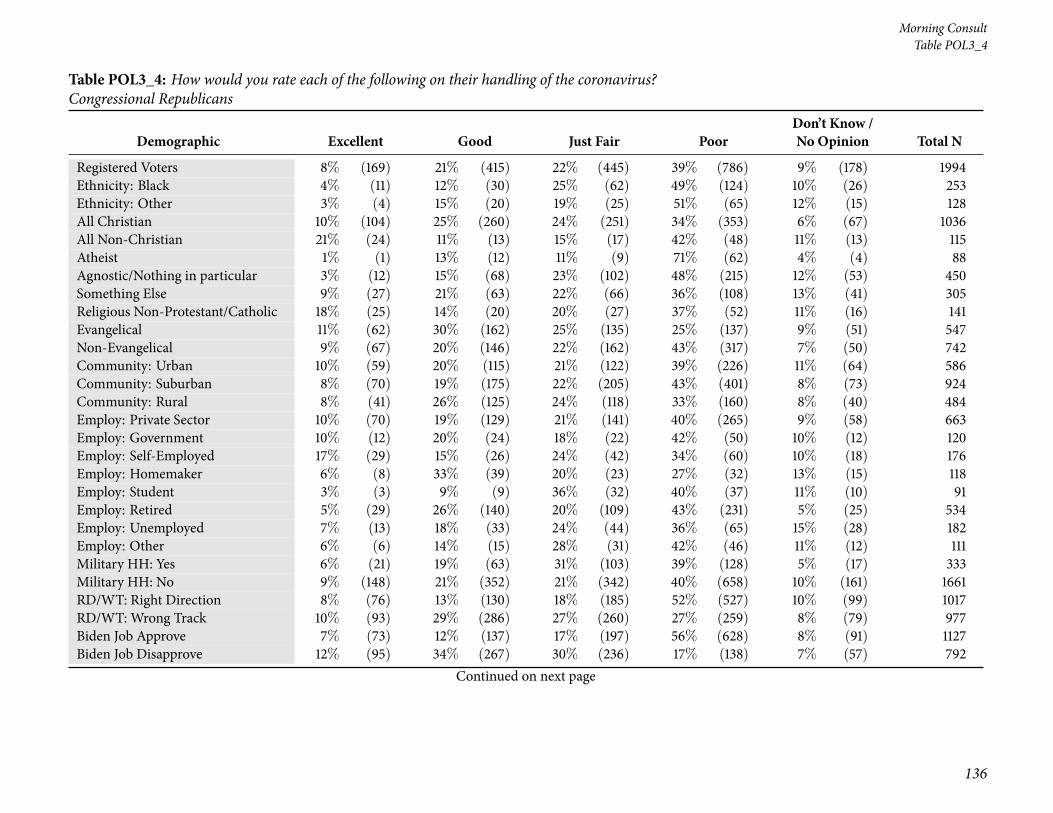
136
Morning ConsultTable POL3_4
Table POL3_4: How would you rate each of the following on their handling of the coronavirus?Congressional Republicans
Demographic Excellent Good Just Fair PoorDon’t Know /No Opinion Total N
Registered Voters 8% (169) 21% (415) 22% (445) 39% (786) 9% (178) 1994Ethnicity: Black 4% (11) 12% (30) 25% (62) 49% (124) 10% (26) 253Ethnicity: Other 3% (4) 15% (20) 19% (25) 51% (65) 12% (15) 128All Christian 10% (104) 25% (260) 24% (251) 34% (353) 6% (67) 1036All Non-Christian 21% (24) 11% (13) 15% (17) 42% (48) 11% (13) 115Atheist 1% (1) 13% (12) 11% (9) 71% (62) 4% (4) 88Agnostic/Nothing in particular 3% (12) 15% (68) 23% (102) 48% (215) 12% (53) 450Something Else 9% (27) 21% (63) 22% (66) 36% (108) 13% (41) 305Religious Non-Protestant/Catholic 18% (25) 14% (20) 20% (27) 37% (52) 11% (16) 141Evangelical 11% (62) 30% (162) 25% (135) 25% (137) 9% (51) 547Non-Evangelical 9% (67) 20% (146) 22% (162) 43% (317) 7% (50) 742Community: Urban 10% (59) 20% (115) 21% (122) 39% (226) 11% (64) 586Community: Suburban 8% (70) 19% (175) 22% (205) 43% (401) 8% (73) 924Community: Rural 8% (41) 26% (125) 24% (118) 33% (160) 8% (40) 484Employ: Private Sector 10% (70) 19% (129) 21% (141) 40% (265) 9% (58) 663Employ: Government 10% (12) 20% (24) 18% (22) 42% (50) 10% (12) 120Employ: Self-Employed 17% (29) 15% (26) 24% (42) 34% (60) 10% (18) 176Employ: Homemaker 6% (8) 33% (39) 20% (23) 27% (32) 13% (15) 118Employ: Student 3% (3) 9% (9) 36% (32) 40% (37) 11% (10) 91Employ: Retired 5% (29) 26% (140) 20% (109) 43% (231) 5% (25) 534Employ: Unemployed 7% (13) 18% (33) 24% (44) 36% (65) 15% (28) 182Employ: Other 6% (6) 14% (15) 28% (31) 42% (46) 11% (12) 111Military HH: Yes 6% (21) 19% (63) 31% (103) 39% (128) 5% (17) 333Military HH: No 9% (148) 21% (352) 21% (342) 40% (658) 10% (161) 1661RD/WT: Right Direction 8% (76) 13% (130) 18% (185) 52% (527) 10% (99) 1017RD/WT: Wrong Track 10% (93) 29% (286) 27% (260) 27% (259) 8% (79) 977Biden Job Approve 7% (73) 12% (137) 17% (197) 56% (628) 8% (91) 1127Biden Job Disapprove 12% (95) 34% (267) 30% (236) 17% (138) 7% (57) 792
Continued on next page

National Tracking Poll #2103129, March, 2021
137
Table POL3_4
Table POL3_4: How would you rate each of the following on their handling of the coronavirus?Congressional Republicans
Demographic Excellent Good Just Fair PoorDon’t Know /No Opinion Total N
Registered Voters 8% (169) 21% (415) 22% (445) 39% (786) 9% (178) 1994Biden Job Strongly Approve 8% (53) 10% (70) 13% (86) 62% (414) 6% (41) 663Biden Job Somewhat Approve 5% (21) 15% (68) 24% (111) 46% (214) 11% (50) 464Biden Job Somewhat Disapprove 7% (16) 25% (56) 34% (78) 22% (50) 13% (29) 229Biden Job Strongly Disapprove 14% (79) 37% (211) 28% (158) 16% (88) 5% (27) 562Favorable of Biden 5% (62) 12% (133) 20% (226) 55% (634) 8% (88) 1143Unfavorable of Biden 13% (100) 35% (272) 28% (217) 17% (137) 7% (59) 785Very Favorable of Biden 7% (42) 9% (61) 15% (95) 64% (411) 5% (35) 644Somewhat Favorable of Biden 4% (20) 14% (72) 26% (131) 45% (223) 11% (53) 499Somewhat Unfavorable of Biden 5% (10) 27% (52) 28% (52) 23% (43) 17% (33) 190Very Unfavorable of Biden 15% (91) 37% (220) 28% (165) 16% (94) 4% (25) 595#1 Issue: Economy 9% (67) 22% (155) 26% (187) 34% (244) 8% (60) 714#1 Issue: Security 12% (36) 38% (115) 30% (91) 13% (41) 7% (21) 305#1 Issue: Health Care 5% (15) 15% (46) 17% (52) 56% (172) 7% (23) 308#1 Issue: Medicare / Social Security 9% (24) 16% (42) 15% (40) 54% (144) 6% (17) 267#1 Issue: Women’s Issues 7% (6) 15% (13) 17% (15) 42% (37) 19% (17) 88#1 Issue: Education 11% (10) 11% (9) 35% (32) 26% (23) 17% (15) 89#1 Issue: Energy 10% (9) 12% (10) 11% (9) 54% (48) 14% (12) 89#1 Issue: Other 2% (2) 18% (24) 14% (19) 58% (78) 9% (12) 1342020 Vote: Joe Biden 5% (52) 9% (95) 18% (188) 61% (632) 7% (70) 10372020 Vote: Donald Trump 14% (106) 36% (269) 27% (200) 13% (99) 9% (67) 7412020 Vote: Other 4% (2) 21% (12) 17% (10) 29% (17) 30% (18) 602020 Vote: Didn’t Vote 6% (9) 26% (39) 31% (48) 23% (35) 14% (22) 1532018 House Vote: Democrat 4% (33) 9% (66) 16% (118) 66% (490) 5% (40) 7482018 House Vote: Republican 14% (90) 36% (223) 28% (172) 16% (100) 6% (38) 6232018 House Vote: Someone else 3% (1) 12% (6) 31% (17) 41% (22) 13% (7) 552016 Vote: Hillary Clinton 4% (29) 9% (64) 15% (105) 66% (465) 5% (37) 7002016 Vote: Donald Trump 15% (106) 34% (244) 27% (191) 17% (122) 7% (50) 7132016 Vote: Other — (0) 15% (17) 28% (30) 46% (50) 10% (11) 1082016 Vote: Didn’t Vote 7% (34) 19% (89) 25% (117) 32% (148) 17% (80) 467
Continued on next page

138
Morning ConsultTable POL3_4
Table POL3_4: How would you rate each of the following on their handling of the coronavirus?Congressional Republicans
Demographic Excellent Good Just Fair PoorDon’t Know /No Opinion Total N
Registered Voters 8% (169) 21% (415) 22% (445) 39% (786) 9% (178) 1994Voted in 2014: Yes 9% (120) 21% (274) 21% (266) 43% (543) 6% (72) 1275Voted in 2014: No 7% (49) 20% (142) 25% (179) 34% (243) 15% (106) 7194-Region: Northeast 12% (42) 21% (73) 21% (75) 37% (131) 9% (34) 3564-Region: Midwest 7% (32) 24% (108) 23% (106) 37% (171) 9% (41) 4584-Region: South 8% (58) 22% (161) 25% (184) 38% (279) 8% (63) 7444-Region: West 8% (37) 17% (73) 19% (81) 47% (204) 9% (41) 436Party: Democrat/Leans Democrat 5% (48) 10% (95) 18% (173) 61% (592) 7% (66) 973Party: Republican/Leans Republican 15% (117) 38% (292) 26% (201) 11% (88) 9% (70) 768Note: Row proportions may total to larger than one-hundred percent due to rounding. For more information visit MorningConsultIntelligence.com.
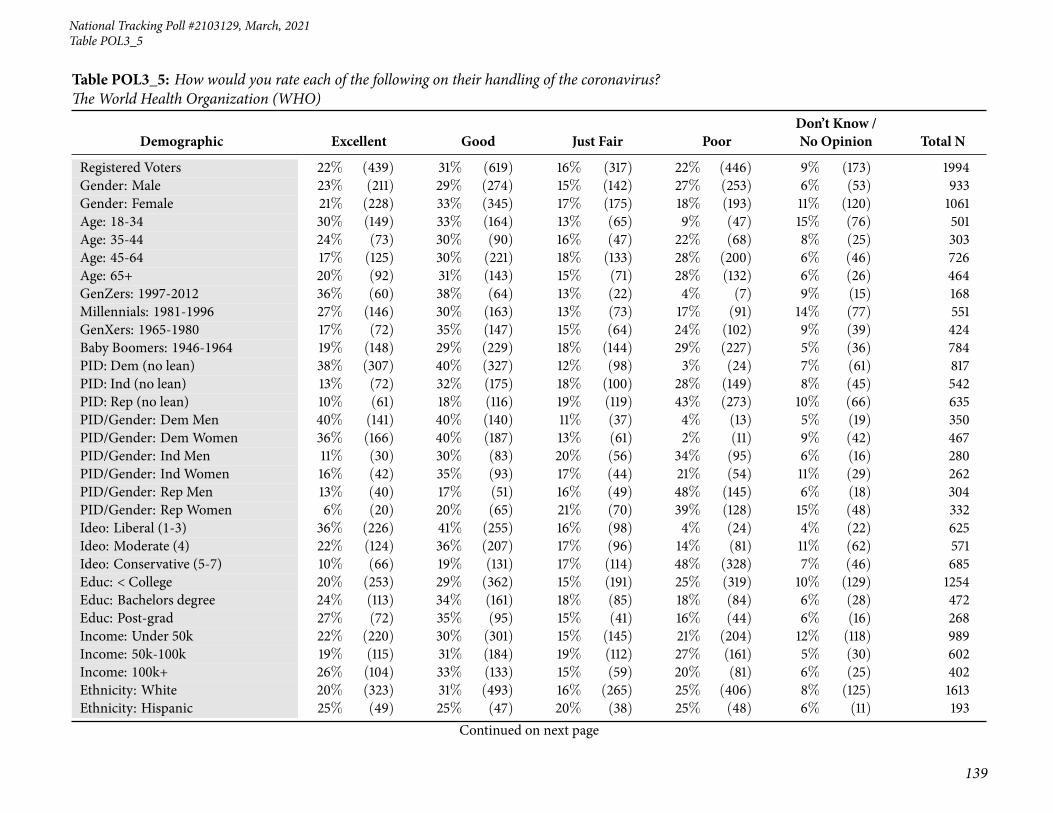
National Tracking Poll #2103129, March, 2021
139
Table POL3_5
Table POL3_5: How would you rate each of the following on their handling of the coronavirus?The World Health Organization (WHO)
Demographic Excellent Good Just Fair PoorDon’t Know /No Opinion Total N
Registered Voters 22% (439) 31% (619) 16% (317) 22% (446) 9% (173) 1994Gender: Male 23% (211) 29% (274) 15% (142) 27% (253) 6% (53) 933Gender: Female 21% (228) 33% (345) 17% (175) 18% (193) 11% (120) 1061Age: 18-34 30% (149) 33% (164) 13% (65) 9% (47) 15% (76) 501Age: 35-44 24% (73) 30% (90) 16% (47) 22% (68) 8% (25) 303Age: 45-64 17% (125) 30% (221) 18% (133) 28% (200) 6% (46) 726Age: 65+ 20% (92) 31% (143) 15% (71) 28% (132) 6% (26) 464GenZers: 1997-2012 36% (60) 38% (64) 13% (22) 4% (7) 9% (15) 168Millennials: 1981-1996 27% (146) 30% (163) 13% (73) 17% (91) 14% (77) 551GenXers: 1965-1980 17% (72) 35% (147) 15% (64) 24% (102) 9% (39) 424Baby Boomers: 1946-1964 19% (148) 29% (229) 18% (144) 29% (227) 5% (36) 784PID: Dem (no lean) 38% (307) 40% (327) 12% (98) 3% (24) 7% (61) 817PID: Ind (no lean) 13% (72) 32% (175) 18% (100) 28% (149) 8% (45) 542PID: Rep (no lean) 10% (61) 18% (116) 19% (119) 43% (273) 10% (66) 635PID/Gender: DemMen 40% (141) 40% (140) 11% (37) 4% (13) 5% (19) 350PID/Gender: DemWomen 36% (166) 40% (187) 13% (61) 2% (11) 9% (42) 467PID/Gender: Ind Men 11% (30) 30% (83) 20% (56) 34% (95) 6% (16) 280PID/Gender: Ind Women 16% (42) 35% (93) 17% (44) 21% (54) 11% (29) 262PID/Gender: Rep Men 13% (40) 17% (51) 16% (49) 48% (145) 6% (18) 304PID/Gender: Rep Women 6% (20) 20% (65) 21% (70) 39% (128) 15% (48) 332Ideo: Liberal (1-3) 36% (226) 41% (255) 16% (98) 4% (24) 4% (22) 625Ideo: Moderate (4) 22% (124) 36% (207) 17% (96) 14% (81) 11% (62) 571Ideo: Conservative (5-7) 10% (66) 19% (131) 17% (114) 48% (328) 7% (46) 685Educ: < College 20% (253) 29% (362) 15% (191) 25% (319) 10% (129) 1254Educ: Bachelors degree 24% (113) 34% (161) 18% (85) 18% (84) 6% (28) 472Educ: Post-grad 27% (72) 35% (95) 15% (41) 16% (44) 6% (16) 268Income: Under 50k 22% (220) 30% (301) 15% (145) 21% (204) 12% (118) 989Income: 50k-100k 19% (115) 31% (184) 19% (112) 27% (161) 5% (30) 602Income: 100k+ 26% (104) 33% (133) 15% (59) 20% (81) 6% (25) 402Ethnicity: White 20% (323) 31% (493) 16% (265) 25% (406) 8% (125) 1613Ethnicity: Hispanic 25% (49) 25% (47) 20% (38) 25% (48) 6% (11) 193
Continued on next page

140
Morning ConsultTable POL3_5
Table POL3_5: How would you rate each of the following on their handling of the coronavirus?The World Health Organization (WHO)
Demographic Excellent Good Just Fair PoorDon’t Know /No Opinion Total N
Registered Voters 22% (439) 31% (619) 16% (317) 22% (446) 9% (173) 1994Ethnicity: Black 37% (93) 34% (87) 10% (24) 6% (16) 13% (32) 253Ethnicity: Other 18% (23) 30% (38) 22% (28) 19% (24) 12% (15) 128All Christian 21% (221) 30% (310) 16% (165) 27% (280) 6% (60) 1036All Non-Christian 33% (38) 33% (38) 13% (15) 12% (14) 10% (12) 115Atheist 31% (27) 37% (32) 13% (11) 13% (11) 6% (5) 88Agnostic/Nothing in particular 23% (106) 33% (149) 17% (76) 15% (68) 12% (52) 450Something Else 15% (47) 30% (90) 17% (51) 24% (73) 14% (44) 305Religious Non-Protestant/Catholic 29% (41) 30% (43) 18% (25) 14% (19) 9% (13) 141Evangelical 22% (121) 23% (125) 15% (80) 31% (171) 9% (50) 547Non-Evangelical 18% (137) 35% (259) 16% (121) 23% (173) 7% (52) 742Community: Urban 35% (208) 32% (190) 9% (54) 13% (77) 10% (57) 586Community: Suburban 19% (173) 32% (295) 19% (174) 23% (210) 8% (72) 924Community: Rural 12% (59) 28% (133) 18% (89) 33% (159) 9% (44) 484Employ: Private Sector 25% (163) 30% (202) 17% (114) 21% (141) 6% (42) 663Employ: Government 28% (34) 35% (42) 11% (13) 16% (19) 9% (11) 120Employ: Self-Employed 25% (43) 25% (43) 15% (27) 28% (49) 8% (14) 176Employ: Homemaker 14% (16) 27% (32) 16% (19) 27% (32) 16% (19) 118Employ: Student 35% (32) 43% (39) 13% (12) 3% (2) 6% (6) 91Employ: Retired 18% (98) 33% (177) 17% (89) 25% (135) 7% (35) 534Employ: Unemployed 18% (32) 27% (49) 15% (28) 24% (44) 16% (29) 182Employ: Other 19% (21) 31% (34) 14% (15) 22% (25) 15% (17) 111Military HH: Yes 20% (67) 33% (111) 15% (50) 25% (83) 6% (21) 333Military HH: No 22% (372) 31% (507) 16% (267) 22% (363) 9% (152) 1661RD/WT: Right Direction 36% (364) 40% (409) 12% (120) 4% (38) 9% (87) 1017RD/WT: Wrong Track 8% (75) 21% (210) 20% (197) 42% (409) 9% (86) 977Biden Job Approve 34% (385) 41% (459) 14% (158) 4% (40) 8% (85) 1127Biden Job Disapprove 6% (49) 17% (138) 19% (147) 50% (394) 8% (63) 792
Continued on next page
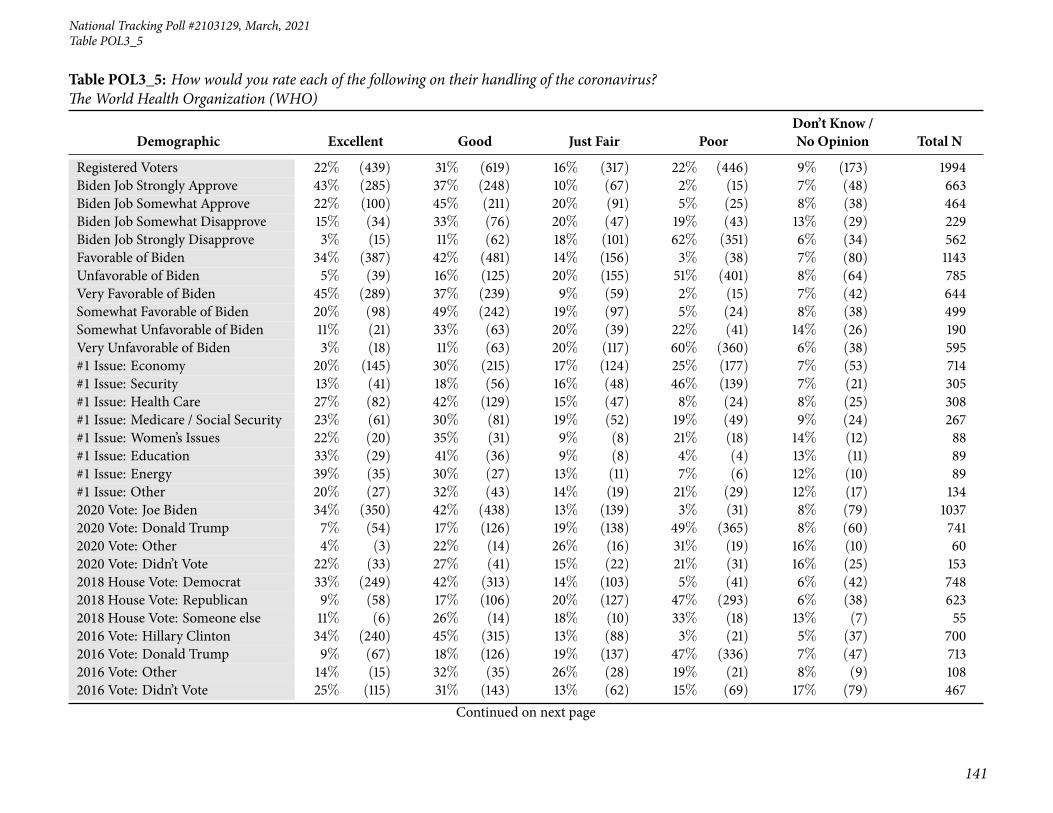
National Tracking Poll #2103129, March, 2021
141
Table POL3_5
Table POL3_5: How would you rate each of the following on their handling of the coronavirus?The World Health Organization (WHO)
Demographic Excellent Good Just Fair PoorDon’t Know /No Opinion Total N
Registered Voters 22% (439) 31% (619) 16% (317) 22% (446) 9% (173) 1994Biden Job Strongly Approve 43% (285) 37% (248) 10% (67) 2% (15) 7% (48) 663Biden Job Somewhat Approve 22% (100) 45% (211) 20% (91) 5% (25) 8% (38) 464Biden Job Somewhat Disapprove 15% (34) 33% (76) 20% (47) 19% (43) 13% (29) 229Biden Job Strongly Disapprove 3% (15) 11% (62) 18% (101) 62% (351) 6% (34) 562Favorable of Biden 34% (387) 42% (481) 14% (156) 3% (38) 7% (80) 1143Unfavorable of Biden 5% (39) 16% (125) 20% (155) 51% (401) 8% (64) 785Very Favorable of Biden 45% (289) 37% (239) 9% (59) 2% (15) 7% (42) 644Somewhat Favorable of Biden 20% (98) 49% (242) 19% (97) 5% (24) 8% (38) 499Somewhat Unfavorable of Biden 11% (21) 33% (63) 20% (39) 22% (41) 14% (26) 190Very Unfavorable of Biden 3% (18) 11% (63) 20% (117) 60% (360) 6% (38) 595#1 Issue: Economy 20% (145) 30% (215) 17% (124) 25% (177) 7% (53) 714#1 Issue: Security 13% (41) 18% (56) 16% (48) 46% (139) 7% (21) 305#1 Issue: Health Care 27% (82) 42% (129) 15% (47) 8% (24) 8% (25) 308#1 Issue: Medicare / Social Security 23% (61) 30% (81) 19% (52) 19% (49) 9% (24) 267#1 Issue: Women’s Issues 22% (20) 35% (31) 9% (8) 21% (18) 14% (12) 88#1 Issue: Education 33% (29) 41% (36) 9% (8) 4% (4) 13% (11) 89#1 Issue: Energy 39% (35) 30% (27) 13% (11) 7% (6) 12% (10) 89#1 Issue: Other 20% (27) 32% (43) 14% (19) 21% (29) 12% (17) 1342020 Vote: Joe Biden 34% (350) 42% (438) 13% (139) 3% (31) 8% (79) 10372020 Vote: Donald Trump 7% (54) 17% (126) 19% (138) 49% (365) 8% (60) 7412020 Vote: Other 4% (3) 22% (14) 26% (16) 31% (19) 16% (10) 602020 Vote: Didn’t Vote 22% (33) 27% (41) 15% (22) 21% (31) 16% (25) 1532018 House Vote: Democrat 33% (249) 42% (313) 14% (103) 5% (41) 6% (42) 7482018 House Vote: Republican 9% (58) 17% (106) 20% (127) 47% (293) 6% (38) 6232018 House Vote: Someone else 11% (6) 26% (14) 18% (10) 33% (18) 13% (7) 552016 Vote: Hillary Clinton 34% (240) 45% (315) 13% (88) 3% (21) 5% (37) 7002016 Vote: Donald Trump 9% (67) 18% (126) 19% (137) 47% (336) 7% (47) 7132016 Vote: Other 14% (15) 32% (35) 26% (28) 19% (21) 8% (9) 1082016 Vote: Didn’t Vote 25% (115) 31% (143) 13% (62) 15% (69) 17% (79) 467
Continued on next page

142
Morning ConsultTable POL3_5
Table POL3_5: How would you rate each of the following on their handling of the coronavirus?The World Health Organization (WHO)
Demographic Excellent Good Just Fair PoorDon’t Know /No Opinion Total N
Registered Voters 22% (439) 31% (619) 16% (317) 22% (446) 9% (173) 1994Voted in 2014: Yes 22% (275) 30% (381) 17% (217) 26% (326) 6% (76) 1275Voted in 2014: No 23% (164) 33% (238) 14% (100) 17% (120) 13% (97) 7194-Region: Northeast 27% (97) 33% (117) 14% (49) 17% (59) 9% (33) 3564-Region: Midwest 15% (70) 33% (150) 17% (78) 27% (124) 8% (35) 4584-Region: South 21% (156) 30% (220) 18% (132) 22% (161) 10% (75) 7444-Region: West 26% (115) 30% (131) 13% (57) 24% (103) 7% (30) 436Party: Democrat/Leans Democrat 35% (342) 42% (408) 13% (125) 3% (31) 7% (67) 973Party: Republican/Leans Republican 9% (66) 18% (140) 19% (147) 44% (338) 10% (77) 768Note: Row proportions may total to larger than one-hundred percent due to rounding. For more information visit MorningConsultIntelligence.com.

National Tracking Poll #2103129, March, 2021
143
Table POL3_6
Table POL3_6: How would you rate each of the following on their handling of the coronavirus?The Centers for Disease Control and Prevention (CDC)
Demographic Excellent Good Just Fair PoorDon’t Know /No Opinion Total N
Registered Voters 27% (529) 37% (732) 17% (341) 14% (283) 5% (109) 1994Gender: Male 26% (247) 36% (337) 17% (155) 16% (153) 4% (41) 933Gender: Female 27% (282) 37% (394) 18% (186) 12% (130) 6% (68) 1061Age: 18-34 31% (155) 31% (153) 16% (78) 10% (51) 13% (64) 501Age: 35-44 23% (69) 37% (113) 18% (56) 15% (46) 7% (20) 303Age: 45-64 25% (184) 38% (272) 18% (128) 18% (128) 2% (13) 726Age: 65+ 26% (122) 42% (193) 17% (79) 12% (58) 3% (12) 464GenZers: 1997-2012 37% (63) 29% (49) 20% (34) 6% (10) 7% (12) 168Millennials: 1981-1996 26% (140) 35% (190) 15% (82) 13% (74) 12% (64) 551GenXers: 1965-1980 25% (105) 35% (148) 21% (88) 16% (70) 3% (13) 424Baby Boomers: 1946-1964 26% (204) 40% (316) 16% (124) 16% (123) 2% (18) 784PID: Dem (no lean) 41% (338) 42% (341) 10% (82) 3% (21) 4% (35) 817PID: Ind (no lean) 17% (93) 37% (203) 23% (124) 17% (90) 6% (32) 542PID: Rep (no lean) 15% (98) 30% (189) 21% (135) 27% (172) 7% (42) 635PID/Gender: DemMen 41% (144) 42% (148) 11% (38) 2% (5) 4% (14) 350PID/Gender: DemWomen 42% (194) 41% (192) 9% (44) 3% (15) 5% (21) 467PID/Gender: Ind Men 16% (46) 40% (112) 19% (53) 21% (59) 4% (11) 280PID/Gender: Ind Women 18% (47) 35% (91) 27% (71) 12% (31) 8% (21) 262PID/Gender: Rep Men 19% (57) 25% (77) 21% (64) 29% (89) 5% (16) 304PID/Gender: Rep Women 12% (41) 34% (111) 21% (71) 25% (83) 8% (26) 332Ideo: Liberal (1-3) 42% (265) 40% (251) 11% (69) 4% (25) 2% (15) 625Ideo: Moderate (4) 25% (145) 42% (242) 18% (101) 9% (51) 6% (32) 571Ideo: Conservative (5-7) 15% (103) 30% (205) 22% (148) 29% (200) 4% (29) 685Educ: < College 26% (326) 34% (428) 17% (217) 16% (206) 6% (78) 1254Educ: Bachelors degree 26% (125) 40% (189) 18% (83) 11% (50) 5% (24) 472Educ: Post-grad 29% (79) 43% (114) 15% (41) 10% (27) 3% (7) 268Income: Under 50k 27% (270) 35% (350) 18% (178) 12% (118) 7% (73) 989Income: 50k-100k 25% (148) 36% (218) 18% (111) 17% (104) 4% (21) 602Income: 100k+ 28% (112) 41% (164) 13% (52) 15% (60) 4% (15) 402Ethnicity: White 25% (405) 38% (607) 17% (269) 15% (248) 5% (83) 1613Ethnicity: Hispanic 21% (40) 33% (63) 22% (42) 22% (42) 3% (5) 193
Continued on next page

144
Morning ConsultTable POL3_6
Table POL3_6: How would you rate each of the following on their handling of the coronavirus?The Centers for Disease Control and Prevention (CDC)
Demographic Excellent Good Just Fair PoorDon’t Know /No Opinion Total N
Registered Voters 27% (529) 37% (732) 17% (341) 14% (283) 5% (109) 1994Ethnicity: Black 41% (105) 28% (72) 17% (42) 6% (16) 7% (18) 253Ethnicity: Other 15% (20) 41% (53) 23% (30) 14% (18) 6% (8) 128All Christian 26% (267) 38% (398) 16% (167) 17% (171) 3% (33) 1036All Non-Christian 38% (44) 35% (40) 11% (13) 5% (5) 11% (13) 115Atheist 39% (34) 37% (32) 13% (11) 8% (7) 3% (3) 88Agnostic/Nothing in particular 26% (115) 38% (170) 18% (80) 11% (48) 8% (37) 450Something Else 23% (69) 30% (92) 23% (71) 17% (51) 8% (23) 305Religious Non-Protestant/Catholic 36% (51) 33% (46) 16% (23) 5% (7) 10% (14) 141Evangelical 26% (141) 31% (169) 16% (89) 22% (119) 6% (30) 547Non-Evangelical 24% (180) 41% (303) 18% (137) 13% (98) 3% (24) 742Community: Urban 37% (216) 33% (195) 13% (78) 9% (50) 8% (46) 586Community: Suburban 24% (226) 39% (359) 18% (162) 15% (136) 4% (41) 924Community: Rural 18% (87) 37% (178) 21% (101) 20% (96) 4% (21) 484Employ: Private Sector 25% (166) 37% (248) 17% (113) 15% (101) 5% (35) 663Employ: Government 27% (32) 40% (48) 12% (15) 12% (15) 8% (10) 120Employ: Self-Employed 32% (56) 28% (49) 14% (25) 18% (31) 8% (14) 176Employ: Homemaker 20% (23) 33% (39) 17% (21) 21% (24) 9% (11) 118Employ: Student 33% (30) 37% (33) 22% (20) 3% (2) 6% (6) 91Employ: Retired 28% (149) 42% (222) 16% (83) 13% (68) 2% (12) 534Employ: Unemployed 25% (45) 31% (56) 20% (36) 16% (29) 9% (16) 182Employ: Other 24% (27) 31% (35) 27% (29) 12% (13) 6% (7) 111Military HH: Yes 28% (95) 35% (116) 14% (48) 18% (60) 5% (15) 333Military HH: No 26% (435) 37% (616) 18% (294) 13% (223) 6% (94) 1661RD/WT: Right Direction 41% (412) 40% (408) 10% (104) 2% (25) 7% (69) 1017RD/WT: Wrong Track 12% (117) 33% (324) 24% (238) 26% (257) 4% (41) 977Biden Job Approve 39% (444) 42% (477) 11% (119) 2% (25) 5% (61) 1127Biden Job Disapprove 10% (78) 28% (225) 26% (208) 31% (249) 4% (31) 792
Continued on next page

National Tracking Poll #2103129, March, 2021
145
Table POL3_6
Table POL3_6: How would you rate each of the following on their handling of the coronavirus?The Centers for Disease Control and Prevention (CDC)
Demographic Excellent Good Just Fair PoorDon’t Know /No Opinion Total N
Registered Voters 27% (529) 37% (732) 17% (341) 14% (283) 5% (109) 1994Biden Job Strongly Approve 49% (324) 37% (243) 8% (52) 2% (14) 4% (29) 663Biden Job Somewhat Approve 26% (120) 50% (234) 15% (67) 2% (10) 7% (32) 464Biden Job Somewhat Disapprove 18% (40) 38% (87) 27% (62) 13% (29) 5% (11) 229Biden Job Strongly Disapprove 7% (38) 25% (139) 26% (147) 39% (220) 3% (19) 562Favorable of Biden 39% (448) 43% (491) 11% (125) 3% (30) 4% (49) 1143Unfavorable of Biden 9% (68) 29% (226) 27% (210) 31% (246) 4% (34) 785Very Favorable of Biden 50% (324) 36% (229) 8% (49) 3% (20) 4% (23) 644Somewhat Favorable of Biden 25% (124) 53% (262) 15% (76) 2% (11) 5% (26) 499Somewhat Unfavorable of Biden 18% (35) 40% (77) 21% (41) 13% (24) 7% (14) 190Very Unfavorable of Biden 6% (33) 25% (149) 28% (169) 37% (222) 3% (21) 595#1 Issue: Economy 24% (173) 37% (264) 20% (144) 15% (104) 4% (30) 714#1 Issue: Security 15% (46) 29% (87) 25% (76) 26% (78) 6% (17) 305#1 Issue: Health Care 34% (104) 41% (128) 13% (41) 6% (20) 5% (15) 308#1 Issue: Medicare / Social Security 32% (85) 43% (116) 11% (29) 12% (31) 2% (6) 267#1 Issue: Women’s Issues 25% (22) 43% (38) 8% (7) 11% (9) 13% (12) 88#1 Issue: Education 30% (27) 33% (29) 20% (17) 4% (4) 13% (12) 89#1 Issue: Energy 39% (35) 29% (26) 9% (8) 14% (12) 9% (8) 89#1 Issue: Other 28% (37) 33% (45) 14% (19) 18% (24) 7% (9) 1342020 Vote: Joe Biden 40% (419) 42% (436) 10% (106) 3% (28) 5% (48) 10372020 Vote: Donald Trump 11% (81) 29% (218) 25% (185) 29% (216) 6% (41) 7412020 Vote: Other 6% (4) 37% (22) 19% (11) 25% (15) 14% (8) 602020 Vote: Didn’t Vote 16% (25) 35% (53) 26% (39) 15% (24) 8% (12) 1532018 House Vote: Democrat 38% (287) 44% (326) 11% (79) 4% (32) 3% (25) 7482018 House Vote: Republican 14% (88) 30% (184) 23% (146) 29% (178) 4% (27) 6232018 House Vote: Someone else 12% (7) 32% (18) 22% (12) 23% (13) 9% (5) 552016 Vote: Hillary Clinton 40% (277) 44% (311) 10% (67) 3% (22) 3% (23) 7002016 Vote: Donald Trump 14% (100) 32% (228) 22% (159) 28% (198) 4% (29) 7132016 Vote: Other 20% (22) 36% (39) 18% (20) 18% (20) 6% (7) 1082016 Vote: Didn’t Vote 27% (128) 33% (152) 20% (95) 9% (43) 11% (50) 467
Continued on next page
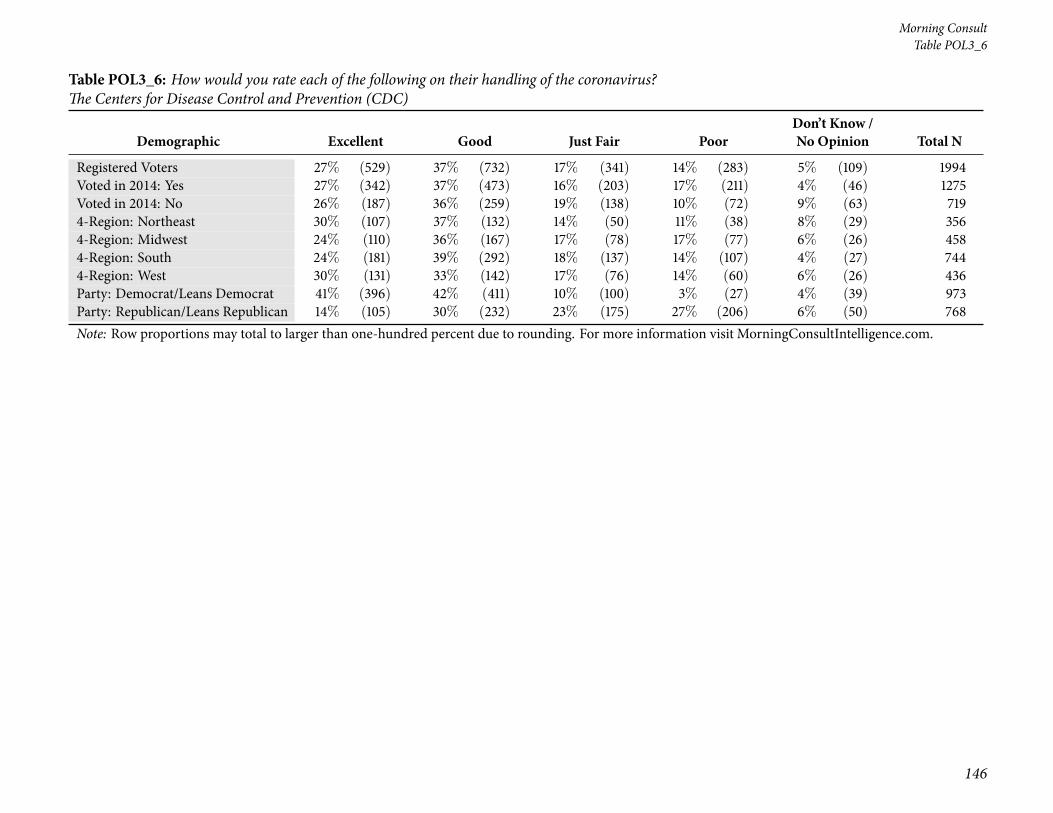
146
Morning ConsultTable POL3_6
Table POL3_6: How would you rate each of the following on their handling of the coronavirus?The Centers for Disease Control and Prevention (CDC)
Demographic Excellent Good Just Fair PoorDon’t Know /No Opinion Total N
Registered Voters 27% (529) 37% (732) 17% (341) 14% (283) 5% (109) 1994Voted in 2014: Yes 27% (342) 37% (473) 16% (203) 17% (211) 4% (46) 1275Voted in 2014: No 26% (187) 36% (259) 19% (138) 10% (72) 9% (63) 7194-Region: Northeast 30% (107) 37% (132) 14% (50) 11% (38) 8% (29) 3564-Region: Midwest 24% (110) 36% (167) 17% (78) 17% (77) 6% (26) 4584-Region: South 24% (181) 39% (292) 18% (137) 14% (107) 4% (27) 7444-Region: West 30% (131) 33% (142) 17% (76) 14% (60) 6% (26) 436Party: Democrat/Leans Democrat 41% (396) 42% (411) 10% (100) 3% (27) 4% (39) 973Party: Republican/Leans Republican 14% (105) 30% (232) 23% (175) 27% (206) 6% (50) 768Note: Row proportions may total to larger than one-hundred percent due to rounding. For more information visit MorningConsultIntelligence.com.
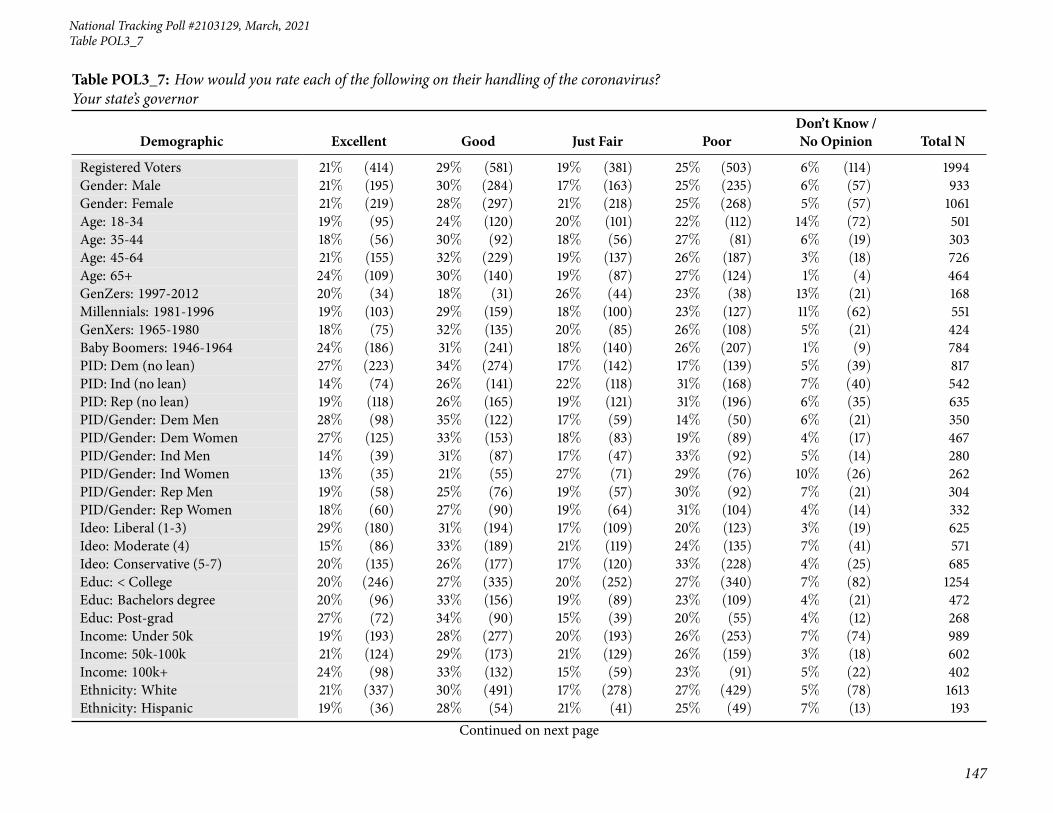
National Tracking Poll #2103129, March, 2021
147
Table POL3_7
Table POL3_7: How would you rate each of the following on their handling of the coronavirus?Your state’s governor
Demographic Excellent Good Just Fair PoorDon’t Know /No Opinion Total N
Registered Voters 21% (414) 29% (581) 19% (381) 25% (503) 6% (114) 1994Gender: Male 21% (195) 30% (284) 17% (163) 25% (235) 6% (57) 933Gender: Female 21% (219) 28% (297) 21% (218) 25% (268) 5% (57) 1061Age: 18-34 19% (95) 24% (120) 20% (101) 22% (112) 14% (72) 501Age: 35-44 18% (56) 30% (92) 18% (56) 27% (81) 6% (19) 303Age: 45-64 21% (155) 32% (229) 19% (137) 26% (187) 3% (18) 726Age: 65+ 24% (109) 30% (140) 19% (87) 27% (124) 1% (4) 464GenZers: 1997-2012 20% (34) 18% (31) 26% (44) 23% (38) 13% (21) 168Millennials: 1981-1996 19% (103) 29% (159) 18% (100) 23% (127) 11% (62) 551GenXers: 1965-1980 18% (75) 32% (135) 20% (85) 26% (108) 5% (21) 424Baby Boomers: 1946-1964 24% (186) 31% (241) 18% (140) 26% (207) 1% (9) 784PID: Dem (no lean) 27% (223) 34% (274) 17% (142) 17% (139) 5% (39) 817PID: Ind (no lean) 14% (74) 26% (141) 22% (118) 31% (168) 7% (40) 542PID: Rep (no lean) 19% (118) 26% (165) 19% (121) 31% (196) 6% (35) 635PID/Gender: DemMen 28% (98) 35% (122) 17% (59) 14% (50) 6% (21) 350PID/Gender: DemWomen 27% (125) 33% (153) 18% (83) 19% (89) 4% (17) 467PID/Gender: Ind Men 14% (39) 31% (87) 17% (47) 33% (92) 5% (14) 280PID/Gender: Ind Women 13% (35) 21% (55) 27% (71) 29% (76) 10% (26) 262PID/Gender: Rep Men 19% (58) 25% (76) 19% (57) 30% (92) 7% (21) 304PID/Gender: Rep Women 18% (60) 27% (90) 19% (64) 31% (104) 4% (14) 332Ideo: Liberal (1-3) 29% (180) 31% (194) 17% (109) 20% (123) 3% (19) 625Ideo: Moderate (4) 15% (86) 33% (189) 21% (119) 24% (135) 7% (41) 571Ideo: Conservative (5-7) 20% (135) 26% (177) 17% (120) 33% (228) 4% (25) 685Educ: < College 20% (246) 27% (335) 20% (252) 27% (340) 7% (82) 1254Educ: Bachelors degree 20% (96) 33% (156) 19% (89) 23% (109) 4% (21) 472Educ: Post-grad 27% (72) 34% (90) 15% (39) 20% (55) 4% (12) 268Income: Under 50k 19% (193) 28% (277) 20% (193) 26% (253) 7% (74) 989Income: 50k-100k 21% (124) 29% (173) 21% (129) 26% (159) 3% (18) 602Income: 100k+ 24% (98) 33% (132) 15% (59) 23% (91) 5% (22) 402Ethnicity: White 21% (337) 30% (491) 17% (278) 27% (429) 5% (78) 1613Ethnicity: Hispanic 19% (36) 28% (54) 21% (41) 25% (49) 7% (13) 193
Continued on next page

148
Morning ConsultTable POL3_7
Table POL3_7: How would you rate each of the following on their handling of the coronavirus?Your state’s governor
Demographic Excellent Good Just Fair PoorDon’t Know /No Opinion Total N
Registered Voters 21% (414) 29% (581) 19% (381) 25% (503) 6% (114) 1994Ethnicity: Black 23% (59) 22% (54) 25% (64) 21% (52) 9% (23) 253Ethnicity: Other 14% (19) 28% (36) 30% (39) 17% (22) 10% (13) 128All Christian 23% (235) 34% (354) 16% (164) 24% (252) 3% (31) 1036All Non-Christian 33% (38) 27% (31) 13% (15) 15% (17) 12% (13) 115Atheist 20% (17) 19% (16) 30% (26) 27% (24) 5% (4) 88Agnostic/Nothing in particular 17% (75) 27% (120) 22% (100) 26% (118) 8% (36) 450Something Else 16% (49) 19% (59) 25% (76) 30% (92) 9% (29) 305Religious Non-Protestant/Catholic 29% (41) 32% (44) 15% (21) 15% (21) 10% (13) 141Evangelical 19% (105) 32% (174) 18% (99) 25% (137) 6% (32) 547Non-Evangelical 23% (168) 29% (216) 18% (132) 27% (199) 4% (27) 742Community: Urban 26% (154) 31% (180) 17% (102) 17% (102) 8% (48) 586Community: Suburban 19% (178) 28% (263) 20% (182) 28% (261) 4% (40) 924Community: Rural 17% (82) 29% (138) 20% (97) 29% (140) 5% (26) 484Employ: Private Sector 20% (134) 34% (224) 16% (107) 24% (158) 6% (40) 663Employ: Government 23% (28) 31% (38) 16% (19) 23% (28) 7% (9) 120Employ: Self-Employed 27% (47) 25% (44) 17% (29) 24% (42) 8% (13) 176Employ: Homemaker 14% (16) 30% (36) 19% (22) 30% (35) 8% (9) 118Employ: Student 17% (15) 13% (12) 35% (31) 25% (22) 11% (10) 91Employ: Retired 24% (130) 28% (149) 20% (109) 26% (140) 1% (7) 534Employ: Unemployed 17% (32) 29% (53) 16% (30) 25% (45) 12% (23) 182Employ: Other 11% (13) 24% (26) 32% (35) 30% (33) 4% (4) 111Military HH: Yes 21% (68) 27% (89) 19% (64) 28% (94) 5% (17) 333Military HH: No 21% (346) 30% (492) 19% (317) 25% (409) 6% (97) 1661RD/WT: Right Direction 27% (272) 34% (343) 17% (175) 16% (160) 7% (66) 1017RD/WT: Wrong Track 15% (142) 24% (238) 21% (206) 35% (343) 5% (48) 977Biden Job Approve 26% (297) 34% (379) 18% (200) 17% (195) 5% (56) 1127Biden Job Disapprove 14% (110) 24% (190) 21% (164) 37% (292) 5% (36) 792
Continued on next page
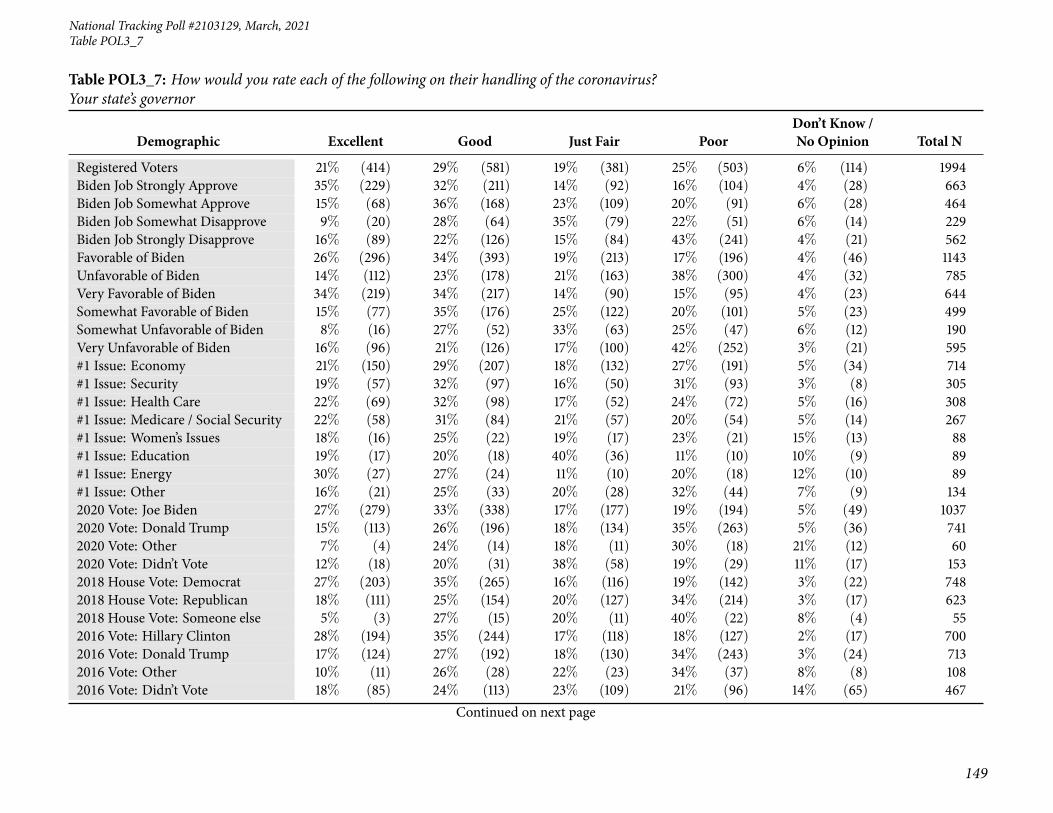
National Tracking Poll #2103129, March, 2021
149
Table POL3_7
Table POL3_7: How would you rate each of the following on their handling of the coronavirus?Your state’s governor
Demographic Excellent Good Just Fair PoorDon’t Know /No Opinion Total N
Registered Voters 21% (414) 29% (581) 19% (381) 25% (503) 6% (114) 1994Biden Job Strongly Approve 35% (229) 32% (211) 14% (92) 16% (104) 4% (28) 663Biden Job Somewhat Approve 15% (68) 36% (168) 23% (109) 20% (91) 6% (28) 464Biden Job Somewhat Disapprove 9% (20) 28% (64) 35% (79) 22% (51) 6% (14) 229Biden Job Strongly Disapprove 16% (89) 22% (126) 15% (84) 43% (241) 4% (21) 562Favorable of Biden 26% (296) 34% (393) 19% (213) 17% (196) 4% (46) 1143Unfavorable of Biden 14% (112) 23% (178) 21% (163) 38% (300) 4% (32) 785Very Favorable of Biden 34% (219) 34% (217) 14% (90) 15% (95) 4% (23) 644Somewhat Favorable of Biden 15% (77) 35% (176) 25% (122) 20% (101) 5% (23) 499Somewhat Unfavorable of Biden 8% (16) 27% (52) 33% (63) 25% (47) 6% (12) 190Very Unfavorable of Biden 16% (96) 21% (126) 17% (100) 42% (252) 3% (21) 595#1 Issue: Economy 21% (150) 29% (207) 18% (132) 27% (191) 5% (34) 714#1 Issue: Security 19% (57) 32% (97) 16% (50) 31% (93) 3% (8) 305#1 Issue: Health Care 22% (69) 32% (98) 17% (52) 24% (72) 5% (16) 308#1 Issue: Medicare / Social Security 22% (58) 31% (84) 21% (57) 20% (54) 5% (14) 267#1 Issue: Women’s Issues 18% (16) 25% (22) 19% (17) 23% (21) 15% (13) 88#1 Issue: Education 19% (17) 20% (18) 40% (36) 11% (10) 10% (9) 89#1 Issue: Energy 30% (27) 27% (24) 11% (10) 20% (18) 12% (10) 89#1 Issue: Other 16% (21) 25% (33) 20% (28) 32% (44) 7% (9) 1342020 Vote: Joe Biden 27% (279) 33% (338) 17% (177) 19% (194) 5% (49) 10372020 Vote: Donald Trump 15% (113) 26% (196) 18% (134) 35% (263) 5% (36) 7412020 Vote: Other 7% (4) 24% (14) 18% (11) 30% (18) 21% (12) 602020 Vote: Didn’t Vote 12% (18) 20% (31) 38% (58) 19% (29) 11% (17) 1532018 House Vote: Democrat 27% (203) 35% (265) 16% (116) 19% (142) 3% (22) 7482018 House Vote: Republican 18% (111) 25% (154) 20% (127) 34% (214) 3% (17) 6232018 House Vote: Someone else 5% (3) 27% (15) 20% (11) 40% (22) 8% (4) 552016 Vote: Hillary Clinton 28% (194) 35% (244) 17% (118) 18% (127) 2% (17) 7002016 Vote: Donald Trump 17% (124) 27% (192) 18% (130) 34% (243) 3% (24) 7132016 Vote: Other 10% (11) 26% (28) 22% (23) 34% (37) 8% (8) 1082016 Vote: Didn’t Vote 18% (85) 24% (113) 23% (109) 21% (96) 14% (65) 467
Continued on next page

150
Morning ConsultTable POL3_7
Table POL3_7: How would you rate each of the following on their handling of the coronavirus?Your state’s governor
Demographic Excellent Good Just Fair PoorDon’t Know /No Opinion Total N
Registered Voters 21% (414) 29% (581) 19% (381) 25% (503) 6% (114) 1994Voted in 2014: Yes 22% (282) 31% (393) 18% (229) 26% (335) 3% (36) 1275Voted in 2014: No 18% (133) 26% (189) 21% (152) 23% (168) 11% (78) 7194-Region: Northeast 25% (90) 32% (112) 14% (52) 23% (81) 6% (21) 3564-Region: Midwest 21% (98) 26% (121) 21% (97) 26% (119) 5% (23) 4584-Region: South 20% (149) 27% (202) 21% (156) 27% (199) 5% (39) 7444-Region: West 18% (78) 33% (146) 18% (77) 24% (104) 7% (31) 436Party: Democrat/Leans Democrat 27% (258) 33% (325) 18% (177) 17% (169) 4% (44) 973Party: Republican/Leans Republican 17% (130) 26% (197) 20% (153) 32% (245) 6% (43) 768Note: Row proportions may total to larger than one-hundred percent due to rounding. For more information visit MorningConsultIntelligence.com.
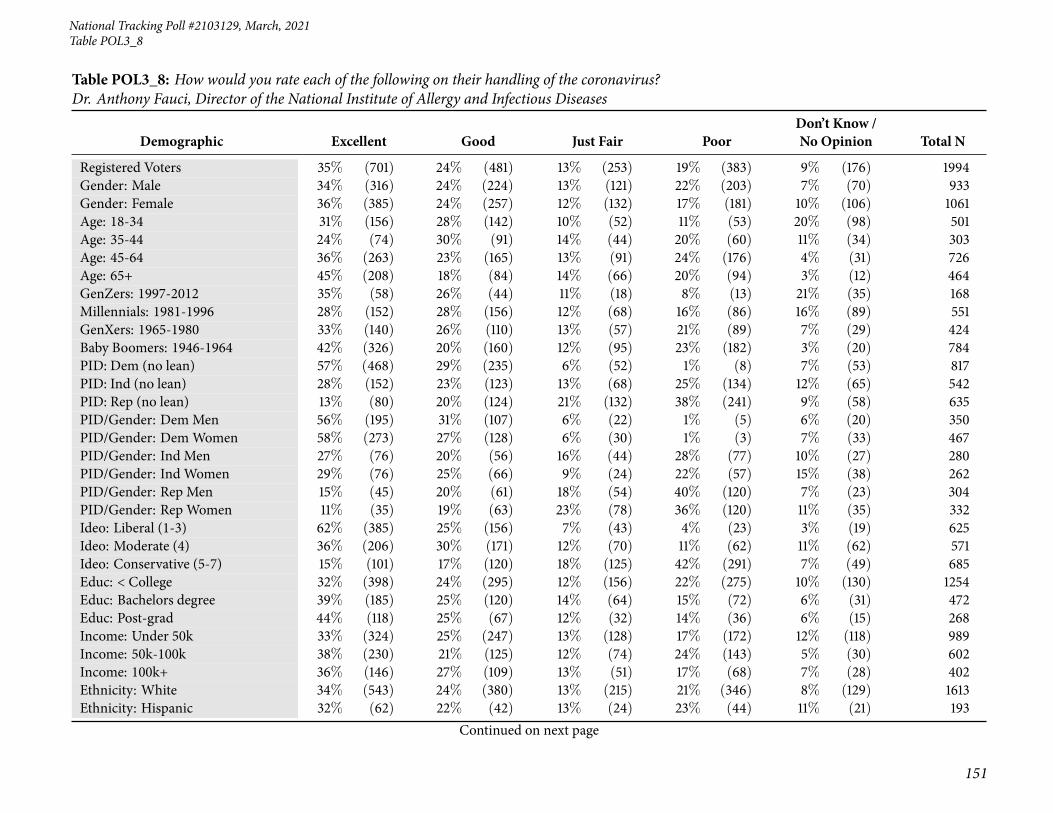
National Tracking Poll #2103129, March, 2021
151
Table POL3_8
Table POL3_8: How would you rate each of the following on their handling of the coronavirus?Dr. Anthony Fauci, Director of the National Institute of Allergy and Infectious Diseases
Demographic Excellent Good Just Fair PoorDon’t Know /No Opinion Total N
Registered Voters 35% (701) 24% (481) 13% (253) 19% (383) 9% (176) 1994Gender: Male 34% (316) 24% (224) 13% (121) 22% (203) 7% (70) 933Gender: Female 36% (385) 24% (257) 12% (132) 17% (181) 10% (106) 1061Age: 18-34 31% (156) 28% (142) 10% (52) 11% (53) 20% (98) 501Age: 35-44 24% (74) 30% (91) 14% (44) 20% (60) 11% (34) 303Age: 45-64 36% (263) 23% (165) 13% (91) 24% (176) 4% (31) 726Age: 65+ 45% (208) 18% (84) 14% (66) 20% (94) 3% (12) 464GenZers: 1997-2012 35% (58) 26% (44) 11% (18) 8% (13) 21% (35) 168Millennials: 1981-1996 28% (152) 28% (156) 12% (68) 16% (86) 16% (89) 551GenXers: 1965-1980 33% (140) 26% (110) 13% (57) 21% (89) 7% (29) 424Baby Boomers: 1946-1964 42% (326) 20% (160) 12% (95) 23% (182) 3% (20) 784PID: Dem (no lean) 57% (468) 29% (235) 6% (52) 1% (8) 7% (53) 817PID: Ind (no lean) 28% (152) 23% (123) 13% (68) 25% (134) 12% (65) 542PID: Rep (no lean) 13% (80) 20% (124) 21% (132) 38% (241) 9% (58) 635PID/Gender: DemMen 56% (195) 31% (107) 6% (22) 1% (5) 6% (20) 350PID/Gender: DemWomen 58% (273) 27% (128) 6% (30) 1% (3) 7% (33) 467PID/Gender: Ind Men 27% (76) 20% (56) 16% (44) 28% (77) 10% (27) 280PID/Gender: Ind Women 29% (76) 25% (66) 9% (24) 22% (57) 15% (38) 262PID/Gender: Rep Men 15% (45) 20% (61) 18% (54) 40% (120) 7% (23) 304PID/Gender: Rep Women 11% (35) 19% (63) 23% (78) 36% (120) 11% (35) 332Ideo: Liberal (1-3) 62% (385) 25% (156) 7% (43) 4% (23) 3% (19) 625Ideo: Moderate (4) 36% (206) 30% (171) 12% (70) 11% (62) 11% (62) 571Ideo: Conservative (5-7) 15% (101) 17% (120) 18% (125) 42% (291) 7% (49) 685Educ: < College 32% (398) 24% (295) 12% (156) 22% (275) 10% (130) 1254Educ: Bachelors degree 39% (185) 25% (120) 14% (64) 15% (72) 6% (31) 472Educ: Post-grad 44% (118) 25% (67) 12% (32) 14% (36) 6% (15) 268Income: Under 50k 33% (324) 25% (247) 13% (128) 17% (172) 12% (118) 989Income: 50k-100k 38% (230) 21% (125) 12% (74) 24% (143) 5% (30) 602Income: 100k+ 36% (146) 27% (109) 13% (51) 17% (68) 7% (28) 402Ethnicity: White 34% (543) 24% (380) 13% (215) 21% (346) 8% (129) 1613Ethnicity: Hispanic 32% (62) 22% (42) 13% (24) 23% (44) 11% (21) 193
Continued on next page

152
Morning ConsultTable POL3_8
Table POL3_8: How would you rate each of the following on their handling of the coronavirus?Dr. Anthony Fauci, Director of the National Institute of Allergy and Infectious Diseases
Demographic Excellent Good Just Fair PoorDon’t Know /No Opinion Total N
Registered Voters 35% (701) 24% (481) 13% (253) 19% (383) 9% (176) 1994Ethnicity: Black 47% (120) 24% (61) 9% (23) 7% (18) 13% (32) 253Ethnicity: Other 30% (38) 32% (41) 11% (15) 15% (20) 12% (15) 128All Christian 35% (367) 23% (239) 13% (140) 22% (233) 6% (58) 1036All Non-Christian 48% (55) 23% (27) 8% (10) 8% (9) 13% (15) 115Atheist 49% (43) 23% (20) 15% (13) 11% (10) 2% (2) 88Agnostic/Nothing in particular 34% (155) 29% (129) 12% (54) 13% (58) 12% (55) 450Something Else 27% (81) 22% (66) 12% (36) 24% (74) 15% (47) 305Religious Non-Protestant/Catholic 44% (61) 21% (30) 13% (19) 11% (15) 11% (16) 141Evangelical 25% (140) 22% (123) 13% (73) 30% (163) 9% (48) 547Non-Evangelical 40% (295) 23% (173) 12% (90) 18% (135) 7% (49) 742Community: Urban 42% (244) 28% (161) 9% (54) 11% (62) 11% (65) 586Community: Suburban 36% (337) 24% (219) 14% (128) 20% (181) 6% (59) 924Community: Rural 25% (120) 21% (101) 15% (71) 29% (140) 11% (52) 484Employ: Private Sector 32% (214) 27% (180) 14% (92) 18% (121) 8% (55) 663Employ: Government 41% (49) 20% (24) 12% (15) 13% (16) 13% (16) 120Employ: Self-Employed 35% (62) 20% (35) 12% (21) 27% (47) 6% (10) 176Employ: Homemaker 27% (31) 21% (25) 18% (21) 27% (31) 8% (9) 118Employ: Student 37% (33) 32% (29) 7% (7) 3% (3) 21% (19) 91Employ: Retired 42% (223) 22% (117) 13% (67) 21% (110) 3% (17) 534Employ: Unemployed 30% (54) 22% (40) 9% (15) 20% (37) 19% (35) 182Employ: Other 30% (34) 28% (31) 13% (14) 17% (18) 12% (14) 111Military HH: Yes 36% (121) 25% (83) 11% (37) 23% (75) 5% (18) 333Military HH: No 35% (580) 24% (399) 13% (216) 19% (308) 10% (158) 1661RD/WT: Right Direction 54% (549) 29% (293) 8% (79) 1% (12) 8% (85) 1017RD/WT: Wrong Track 16% (151) 19% (188) 18% (174) 38% (372) 9% (91) 977Biden Job Approve 55% (625) 29% (323) 6% (72) 2% (20) 8% (87) 1127Biden Job Disapprove 8% (66) 18% (139) 22% (172) 44% (352) 8% (63) 792
Continued on next page
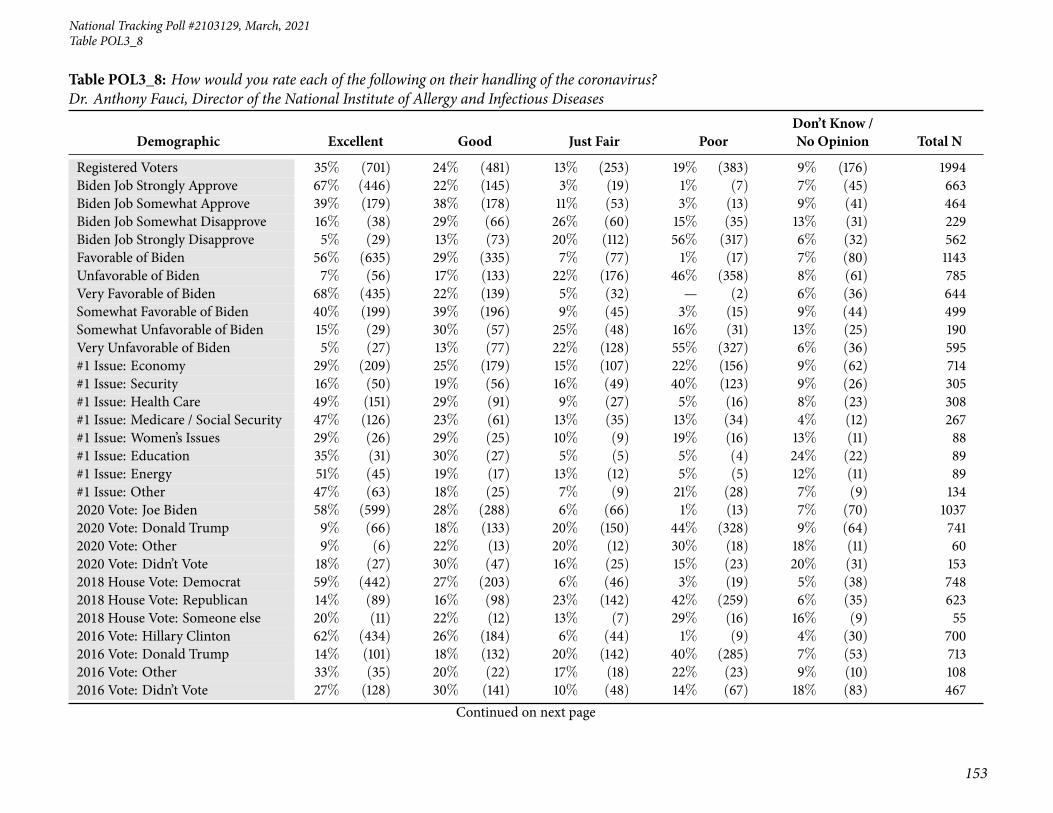
National Tracking Poll #2103129, March, 2021
153
Table POL3_8
Table POL3_8: How would you rate each of the following on their handling of the coronavirus?Dr. Anthony Fauci, Director of the National Institute of Allergy and Infectious Diseases
Demographic Excellent Good Just Fair PoorDon’t Know /No Opinion Total N
Registered Voters 35% (701) 24% (481) 13% (253) 19% (383) 9% (176) 1994Biden Job Strongly Approve 67% (446) 22% (145) 3% (19) 1% (7) 7% (45) 663Biden Job Somewhat Approve 39% (179) 38% (178) 11% (53) 3% (13) 9% (41) 464Biden Job Somewhat Disapprove 16% (38) 29% (66) 26% (60) 15% (35) 13% (31) 229Biden Job Strongly Disapprove 5% (29) 13% (73) 20% (112) 56% (317) 6% (32) 562Favorable of Biden 56% (635) 29% (335) 7% (77) 1% (17) 7% (80) 1143Unfavorable of Biden 7% (56) 17% (133) 22% (176) 46% (358) 8% (61) 785Very Favorable of Biden 68% (435) 22% (139) 5% (32) — (2) 6% (36) 644Somewhat Favorable of Biden 40% (199) 39% (196) 9% (45) 3% (15) 9% (44) 499Somewhat Unfavorable of Biden 15% (29) 30% (57) 25% (48) 16% (31) 13% (25) 190Very Unfavorable of Biden 5% (27) 13% (77) 22% (128) 55% (327) 6% (36) 595#1 Issue: Economy 29% (209) 25% (179) 15% (107) 22% (156) 9% (62) 714#1 Issue: Security 16% (50) 19% (56) 16% (49) 40% (123) 9% (26) 305#1 Issue: Health Care 49% (151) 29% (91) 9% (27) 5% (16) 8% (23) 308#1 Issue: Medicare / Social Security 47% (126) 23% (61) 13% (35) 13% (34) 4% (12) 267#1 Issue: Women’s Issues 29% (26) 29% (25) 10% (9) 19% (16) 13% (11) 88#1 Issue: Education 35% (31) 30% (27) 5% (5) 5% (4) 24% (22) 89#1 Issue: Energy 51% (45) 19% (17) 13% (12) 5% (5) 12% (11) 89#1 Issue: Other 47% (63) 18% (25) 7% (9) 21% (28) 7% (9) 1342020 Vote: Joe Biden 58% (599) 28% (288) 6% (66) 1% (13) 7% (70) 10372020 Vote: Donald Trump 9% (66) 18% (133) 20% (150) 44% (328) 9% (64) 7412020 Vote: Other 9% (6) 22% (13) 20% (12) 30% (18) 18% (11) 602020 Vote: Didn’t Vote 18% (27) 30% (47) 16% (25) 15% (23) 20% (31) 1532018 House Vote: Democrat 59% (442) 27% (203) 6% (46) 3% (19) 5% (38) 7482018 House Vote: Republican 14% (89) 16% (98) 23% (142) 42% (259) 6% (35) 6232018 House Vote: Someone else 20% (11) 22% (12) 13% (7) 29% (16) 16% (9) 552016 Vote: Hillary Clinton 62% (434) 26% (184) 6% (44) 1% (9) 4% (30) 7002016 Vote: Donald Trump 14% (101) 18% (132) 20% (142) 40% (285) 7% (53) 7132016 Vote: Other 33% (35) 20% (22) 17% (18) 22% (23) 9% (10) 1082016 Vote: Didn’t Vote 27% (128) 30% (141) 10% (48) 14% (67) 18% (83) 467
Continued on next page

154
Morning ConsultTable POL3_8
Table POL3_8: How would you rate each of the following on their handling of the coronavirus?Dr. Anthony Fauci, Director of the National Institute of Allergy and Infectious Diseases
Demographic Excellent Good Just Fair PoorDon’t Know /No Opinion Total N
Registered Voters 35% (701) 24% (481) 13% (253) 19% (383) 9% (176) 1994Voted in 2014: Yes 38% (485) 22% (274) 14% (179) 21% (267) 5% (70) 1275Voted in 2014: No 30% (216) 29% (207) 10% (74) 16% (116) 15% (106) 7194-Region: Northeast 40% (142) 26% (93) 11% (39) 13% (45) 10% (36) 3564-Region: Midwest 32% (146) 21% (96) 14% (65) 24% (110) 9% (42) 4584-Region: South 32% (241) 25% (190) 13% (96) 21% (155) 9% (64) 7444-Region: West 39% (171) 24% (103) 12% (53) 17% (74) 8% (34) 436Party: Democrat/Leans Democrat 57% (552) 29% (281) 7% (65) 2% (15) 6% (60) 973Party: Republican/Leans Republican 13% (97) 18% (141) 20% (157) 40% (306) 9% (68) 768Note: Row proportions may total to larger than one-hundred percent due to rounding. For more information visit MorningConsultIntelligence.com.

National Tracking Poll #2103129, March, 2021
155
Table POL4
Table POL4: Generally speaking, would you say you are more concerned about...
Demographic
The economic impact ofcoronavirus including theeffect on the stock market
and increasedunemployment
The public health impactof coronavirus includingthe spread of the diseasewhich would cause more
deathsDon’t know / No
opinion Total N
Registered Voters 34% (677) 59% (1168) 7% (149) 1994Gender: Male 37% (342) 57% (531) 6% (60) 933Gender: Female 32% (335) 60% (637) 8% (89) 1061Age: 18-34 32% (162) 56% (280) 12% (59) 501Age: 35-44 40% (120) 53% (160) 8% (23) 303Age: 45-64 36% (260) 58% (422) 6% (45) 726Age: 65+ 29% (135) 66% (307) 5% (22) 464GenZers: 1997-2012 29% (49) 62% (105) 9% (14) 168Millennials: 1981-1996 35% (192) 54% (296) 11% (62) 551GenXers: 1965-1980 38% (161) 54% (229) 8% (34) 424Baby Boomers: 1946-1964 33% (259) 63% (493) 4% (32) 784PID: Dem (no lean) 16% (131) 78% (634) 6% (51) 817PID: Ind (no lean) 36% (196) 55% (296) 9% (50) 542PID: Rep (no lean) 55% (350) 37% (238) 7% (47) 635PID/Gender: DemMen 20% (71) 74% (258) 6% (21) 350PID/Gender: DemWomen 13% (60) 81% (376) 7% (31) 467PID/Gender: Ind Men 37% (103) 55% (154) 8% (22) 280PID/Gender: Ind Women 35% (92) 54% (142) 11% (28) 262PID/Gender: Rep Men 55% (168) 39% (119) 6% (17) 304PID/Gender: Rep Women 55% (182) 36% (119) 9% (30) 332Ideo: Liberal (1-3) 15% (93) 82% (511) 3% (20) 625Ideo: Moderate (4) 29% (167) 60% (341) 11% (63) 571Ideo: Conservative (5-7) 56% (387) 39% (270) 4% (29) 685Educ: < College 34% (425) 57% (710) 10% (120) 1254Educ: Bachelors degree 35% (167) 61% (287) 4% (18) 472Educ: Post-grad 32% (86) 64% (171) 4% (11) 268Income: Under 50k 30% (292) 60% (598) 10% (99) 989Income: 50k-100k 37% (221) 58% (350) 5% (32) 602Income: 100k+ 41% (165) 55% (220) 4% (18) 402
Continued on next page

156
Morning ConsultTable POL4
Table POL4: Generally speaking, would you say you are more concerned about...
Demographic
The economic impact ofcoronavirus including theeffect on the stock market
and increasedunemployment
The public health impactof coronavirus includingthe spread of the diseasewhich would cause more
deathsDon’t know / No
opinion Total N
Registered Voters 34% (677) 59% (1168) 7% (149) 1994Ethnicity: White 37% (589) 57% (925) 6% (99) 1613Ethnicity: Hispanic 38% (73) 54% (104) 8% (16) 193Ethnicity: Black 20% (51) 67% (170) 13% (32) 253Ethnicity: Other 29% (37) 57% (74) 14% (18) 128All Christian 37% (383) 58% (598) 5% (55) 1036All Non-Christian 36% (41) 60% (70) 4% (4) 115Atheist 16% (14) 80% (70) 4% (4) 88Agnostic/Nothing in particular 27% (123) 60% (268) 13% (59) 450Something Else 38% (116) 53% (162) 9% (27) 305Religious Non-Protestant/Catholic 37% (52) 60% (85) 3% (4) 141Evangelical 43% (237) 50% (273) 7% (38) 547Non-Evangelical 33% (246) 61% (453) 6% (44) 742Community: Urban 29% (167) 64% (376) 7% (43) 586Community: Suburban 34% (318) 59% (545) 7% (61) 924Community: Rural 40% (191) 51% (247) 9% (45) 484Employ: Private Sector 39% (256) 56% (370) 5% (36) 663Employ: Government 32% (39) 60% (72) 8% (9) 120Employ: Self-Employed 41% (72) 51% (90) 8% (15) 176Employ: Homemaker 40% (47) 53% (62) 8% (9) 118Employ: Student 21% (19) 72% (66) 7% (6) 91Employ: Retired 28% (148) 67% (355) 6% (31) 534Employ: Unemployed 39% (71) 46% (84) 15% (27) 182Employ: Other 24% (26) 63% (69) 14% (15) 111Military HH: Yes 35% (117) 60% (201) 4% (14) 333Military HH: No 34% (560) 58% (966) 8% (135) 1661RD/WT: Right Direction 18% (185) 75% (767) 6% (65) 1017RD/WT: Wrong Track 50% (492) 41% (401) 9% (84) 977
Continued on next page

National Tracking Poll #2103129, March, 2021
157
Table POL4
Table POL4: Generally speaking, would you say you are more concerned about...
Demographic
The economic impact ofcoronavirus including theeffect on the stock market
and increasedunemployment
The public health impactof coronavirus includingthe spread of the diseasewhich would cause more
deathsDon’t know / No
opinion Total N
Registered Voters 34% (677) 59% (1168) 7% (149) 1994Biden Job Approve 18% (206) 76% (855) 6% (66) 1127Biden Job Disapprove 57% (451) 35% (276) 8% (64) 792Biden Job Strongly Approve 16% (109) 80% (529) 4% (25) 663Biden Job Somewhat Approve 21% (97) 70% (326) 9% (41) 464Biden Job Somewhat Disapprove 43% (99) 49% (113) 8% (17) 229Biden Job Strongly Disapprove 63% (352) 29% (163) 8% (47) 562Favorable of Biden 18% (206) 76% (874) 6% (63) 1143Unfavorable of Biden 58% (453) 34% (266) 8% (66) 785Very Favorable of Biden 15% (99) 79% (507) 6% (38) 644Somewhat Favorable of Biden 21% (107) 74% (367) 5% (25) 499Somewhat Unfavorable of Biden 41% (77) 52% (100) 7% (13) 190Very Unfavorable of Biden 63% (376) 28% (166) 9% (53) 595#1 Issue: Economy 44% (312) 48% (343) 8% (60) 714#1 Issue: Security 50% (154) 43% (130) 7% (21) 305#1 Issue: Health Care 15% (46) 78% (239) 7% (23) 308#1 Issue: Medicare / Social Security 21% (55) 73% (194) 7% (18) 267#1 Issue: Women’s Issues 28% (25) 61% (54) 11% (10) 88#1 Issue: Education 29% (26) 64% (57) 7% (6) 89#1 Issue: Energy 23% (20) 76% (68) 1% (1) 89#1 Issue: Other 30% (40) 63% (84) 8% (10) 1342020 Vote: Joe Biden 17% (179) 77% (801) 6% (57) 10372020 Vote: Donald Trump 58% (431) 35% (262) 7% (48) 7412020 Vote: Other 39% (23) 41% (25) 20% (12) 602020 Vote: Didn’t Vote 29% (44) 52% (80) 19% (29) 1532018 House Vote: Democrat 17% (127) 79% (590) 4% (30) 7482018 House Vote: Republican 58% (364) 36% (224) 6% (35) 6232018 House Vote: Someone else 41% (22) 45% (24) 15% (8) 55
Continued on next page
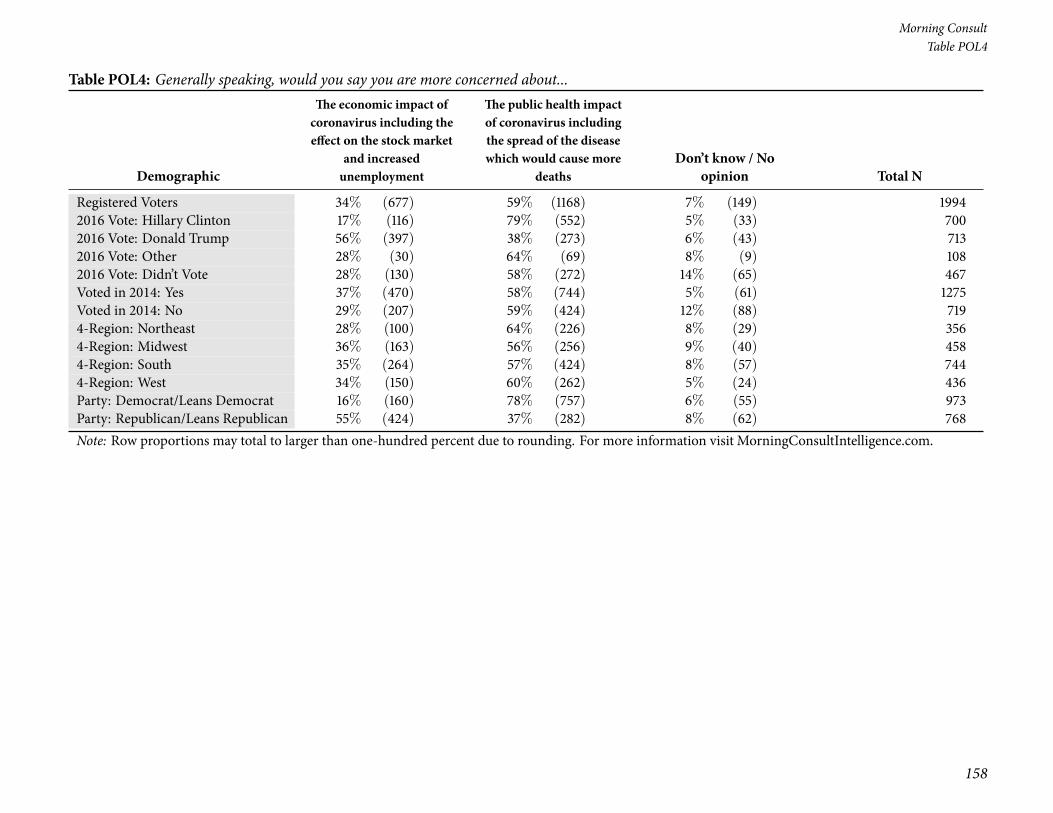
158
Morning ConsultTable POL4
Table POL4: Generally speaking, would you say you are more concerned about...
Demographic
The economic impact ofcoronavirus including theeffect on the stock market
and increasedunemployment
The public health impactof coronavirus includingthe spread of the diseasewhich would cause more
deathsDon’t know / No
opinion Total N
Registered Voters 34% (677) 59% (1168) 7% (149) 19942016 Vote: Hillary Clinton 17% (116) 79% (552) 5% (33) 7002016 Vote: Donald Trump 56% (397) 38% (273) 6% (43) 7132016 Vote: Other 28% (30) 64% (69) 8% (9) 1082016 Vote: Didn’t Vote 28% (130) 58% (272) 14% (65) 467Voted in 2014: Yes 37% (470) 58% (744) 5% (61) 1275Voted in 2014: No 29% (207) 59% (424) 12% (88) 7194-Region: Northeast 28% (100) 64% (226) 8% (29) 3564-Region: Midwest 36% (163) 56% (256) 9% (40) 4584-Region: South 35% (264) 57% (424) 8% (57) 7444-Region: West 34% (150) 60% (262) 5% (24) 436Party: Democrat/Leans Democrat 16% (160) 78% (757) 6% (55) 973Party: Republican/Leans Republican 55% (424) 37% (282) 8% (62) 768Note: Row proportions may total to larger than one-hundred percent due to rounding. For more information visit MorningConsultIntelligence.com.

National Tracking Poll #2103129, March, 2021
159
Table POL5
Table POL5: Currently, do you believe it’s more important for the government to address the:
DemographicThe spread ofcoronavirus The economy
Don’t know / Noopinion Total N
Registered Voters 54% (1086) 38% (761) 7% (146) 1994Gender: Male 54% (506) 39% (367) 6% (60) 933Gender: Female 55% (580) 37% (394) 8% (86) 1061Age: 18-34 57% (284) 34% (171) 9% (46) 501Age: 35-44 48% (146) 42% (126) 10% (30) 303Age: 45-64 53% (384) 41% (299) 6% (43) 726Age: 65+ 59% (273) 35% (165) 6% (27) 464GenZers: 1997-2012 61% (103) 29% (49) 10% (16) 168Millennials: 1981-1996 52% (286) 39% (214) 9% (51) 551GenXers: 1965-1980 51% (218) 39% (166) 10% (40) 424Baby Boomers: 1946-1964 57% (444) 39% (309) 4% (32) 784PID: Dem (no lean) 76% (620) 19% (153) 5% (44) 817PID: Ind (no lean) 50% (271) 41% (223) 9% (48) 542PID: Rep (no lean) 31% (196) 61% (385) 8% (54) 635PID/Gender: DemMen 74% (258) 21% (72) 6% (20) 350PID/Gender: DemWomen 77% (361) 17% (81) 5% (25) 467PID/Gender: Ind Men 49% (138) 42% (119) 8% (23) 280PID/Gender: Ind Women 51% (133) 40% (104) 9% (25) 262PID/Gender: Rep Men 36% (110) 58% (176) 6% (17) 304PID/Gender: Rep Women 26% (86) 63% (209) 11% (37) 332Ideo: Liberal (1-3) 78% (486) 19% (120) 3% (19) 625Ideo: Moderate (4) 57% (325) 32% (185) 11% (61) 571Ideo: Conservative (5-7) 33% (228) 61% (421) 5% (36) 685Educ: < College 51% (634) 40% (507) 9% (113) 1254Educ: Bachelors degree 61% (288) 35% (165) 4% (18) 472Educ: Post-grad 61% (164) 33% (88) 6% (16) 268Income: Under 50k 54% (535) 36% (356) 10% (98) 989Income: 50k-100k 55% (330) 41% (246) 4% (26) 602Income: 100k+ 55% (222) 39% (159) 5% (22) 402Ethnicity: White 53% (854) 41% (656) 6% (103) 1613Ethnicity: Hispanic 48% (94) 43% (84) 8% (16) 193Ethnicity: Black 62% (156) 28% (70) 11% (27) 253
Continued on next page
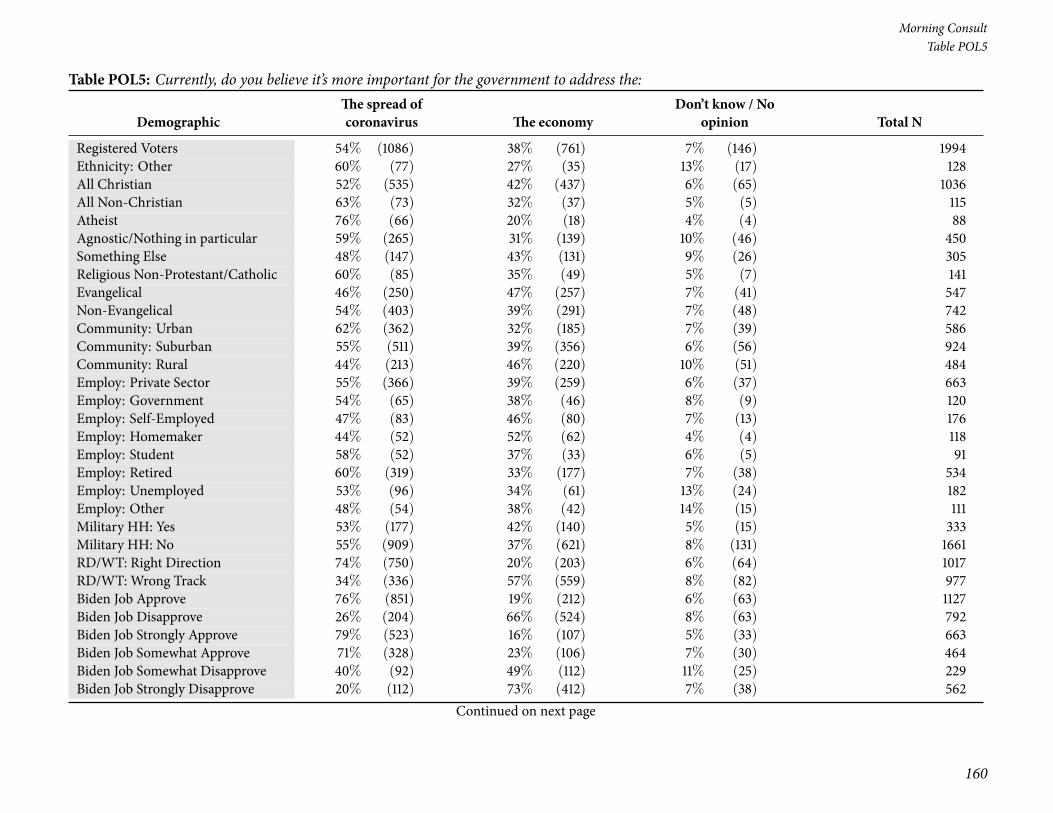
160
Morning ConsultTable POL5
Table POL5: Currently, do you believe it’s more important for the government to address the:
DemographicThe spread ofcoronavirus The economy
Don’t know / Noopinion Total N
Registered Voters 54% (1086) 38% (761) 7% (146) 1994Ethnicity: Other 60% (77) 27% (35) 13% (17) 128All Christian 52% (535) 42% (437) 6% (65) 1036All Non-Christian 63% (73) 32% (37) 5% (5) 115Atheist 76% (66) 20% (18) 4% (4) 88Agnostic/Nothing in particular 59% (265) 31% (139) 10% (46) 450Something Else 48% (147) 43% (131) 9% (26) 305Religious Non-Protestant/Catholic 60% (85) 35% (49) 5% (7) 141Evangelical 46% (250) 47% (257) 7% (41) 547Non-Evangelical 54% (403) 39% (291) 7% (48) 742Community: Urban 62% (362) 32% (185) 7% (39) 586Community: Suburban 55% (511) 39% (356) 6% (56) 924Community: Rural 44% (213) 46% (220) 10% (51) 484Employ: Private Sector 55% (366) 39% (259) 6% (37) 663Employ: Government 54% (65) 38% (46) 8% (9) 120Employ: Self-Employed 47% (83) 46% (80) 7% (13) 176Employ: Homemaker 44% (52) 52% (62) 4% (4) 118Employ: Student 58% (52) 37% (33) 6% (5) 91Employ: Retired 60% (319) 33% (177) 7% (38) 534Employ: Unemployed 53% (96) 34% (61) 13% (24) 182Employ: Other 48% (54) 38% (42) 14% (15) 111Military HH: Yes 53% (177) 42% (140) 5% (15) 333Military HH: No 55% (909) 37% (621) 8% (131) 1661RD/WT: Right Direction 74% (750) 20% (203) 6% (64) 1017RD/WT: Wrong Track 34% (336) 57% (559) 8% (82) 977Biden Job Approve 76% (851) 19% (212) 6% (63) 1127Biden Job Disapprove 26% (204) 66% (524) 8% (63) 792Biden Job Strongly Approve 79% (523) 16% (107) 5% (33) 663Biden Job Somewhat Approve 71% (328) 23% (106) 7% (30) 464Biden Job Somewhat Disapprove 40% (92) 49% (112) 11% (25) 229Biden Job Strongly Disapprove 20% (112) 73% (412) 7% (38) 562
Continued on next page

National Tracking Poll #2103129, March, 2021
161
Table POL5
Table POL5: Currently, do you believe it’s more important for the government to address the:
DemographicThe spread ofcoronavirus The economy
Don’t know / Noopinion Total N
Registered Voters 54% (1086) 38% (761) 7% (146) 1994Favorable of Biden 75% (861) 19% (221) 5% (61) 1143Unfavorable of Biden 25% (193) 67% (525) 9% (68) 785Very Favorable of Biden 77% (499) 16% (105) 6% (40) 644Somewhat Favorable of Biden 73% (362) 23% (116) 4% (20) 499Somewhat Unfavorable of Biden 37% (71) 49% (94) 13% (25) 190Very Unfavorable of Biden 20% (122) 72% (431) 7% (42) 595#1 Issue: Economy 43% (307) 50% (356) 7% (51) 714#1 Issue: Security 38% (116) 57% (172) 5% (16) 305#1 Issue: Health Care 75% (231) 18% (55) 7% (22) 308#1 Issue: Medicare / Social Security 65% (174) 24% (65) 10% (28) 267#1 Issue: Women’s Issues 65% (58) 26% (23) 8% (7) 88#1 Issue: Education 58% (52) 33% (30) 8% (7) 89#1 Issue: Energy 72% (64) 25% (23) 2% (2) 89#1 Issue: Other 63% (84) 27% (37) 10% (13) 1342020 Vote: Joe Biden 76% (789) 19% (195) 5% (53) 10372020 Vote: Donald Trump 29% (218) 65% (478) 6% (45) 7412020 Vote: Other 26% (16) 44% (27) 30% (18) 602020 Vote: Didn’t Vote 41% (62) 40% (61) 20% (30) 1532018 House Vote: Democrat 76% (572) 18% (136) 5% (40) 7482018 House Vote: Republican 31% (192) 64% (396) 6% (35) 6232018 House Vote: Someone else 43% (23) 42% (23) 15% (8) 552016 Vote: Hillary Clinton 77% (536) 18% (128) 5% (36) 7002016 Vote: Donald Trump 34% (239) 61% (437) 5% (37) 7132016 Vote: Other 57% (61) 31% (34) 12% (13) 1082016 Vote: Didn’t Vote 52% (245) 34% (161) 13% (61) 467Voted in 2014: Yes 53% (679) 41% (523) 6% (73) 1275Voted in 2014: No 57% (408) 33% (238) 10% (73) 7194-Region: Northeast 61% (219) 32% (112) 7% (25) 3564-Region: Midwest 49% (225) 44% (200) 7% (32) 4584-Region: South 52% (386) 40% (297) 8% (61) 7444-Region: West 59% (256) 35% (152) 6% (28) 436
Continued on next page

162
Morning ConsultTable POL5
Table POL5: Currently, do you believe it’s more important for the government to address the:
DemographicThe spread ofcoronavirus The economy
Don’t know / Noopinion Total N
Registered Voters 54% (1086) 38% (761) 7% (146) 1994Party: Democrat/Leans Democrat 75% (730) 19% (185) 6% (57) 973Party: Republican/Leans Republican 30% (227) 63% (481) 8% (61) 768Note: Row proportions may total to larger than one-hundred percent due to rounding. For more information visit MorningConsultIntelligence.com.

National Tracking Poll #2103129, March, 2021
163
Table POL6
Table POL6: Even if neither is exactly correct, which of the following comes closest to your opinion?
Demographic
Americans shouldcontinue to social
distance for as long as isneeded to curb the spreadof coronavirus even if itmeans continued damage
to the economy
Americans should stopsocial distancing to
stimulate the economyeven if it means
increasing the spread ofcoronavirus
Don’t know / Noopinion Total N
Registered Voters 67% (1344) 23% (467) 9% (183) 1994Gender: Male 66% (615) 26% (245) 8% (73) 933Gender: Female 69% (729) 21% (222) 10% (110) 1061Age: 18-34 67% (334) 24% (118) 10% (48) 501Age: 35-44 62% (188) 27% (82) 11% (33) 303Age: 45-64 66% (482) 24% (174) 10% (69) 726Age: 65+ 73% (339) 20% (93) 7% (32) 464GenZers: 1997-2012 72% (122) 18% (29) 10% (17) 168Millennials: 1981-1996 63% (347) 27% (148) 10% (56) 551GenXers: 1965-1980 62% (264) 26% (109) 12% (52) 424Baby Boomers: 1946-1964 72% (569) 21% (165) 7% (51) 784PID: Dem (no lean) 87% (709) 7% (54) 7% (54) 817PID: Ind (no lean) 63% (341) 25% (137) 12% (64) 542PID: Rep (no lean) 46% (294) 43% (276) 10% (65) 635PID/Gender: DemMen 84% (295) 8% (29) 7% (26) 350PID/Gender: DemWomen 89% (414) 5% (25) 6% (28) 467PID/Gender: Ind Men 62% (174) 28% (78) 10% (27) 280PID/Gender: Ind Women 64% (167) 22% (59) 14% (37) 262PID/Gender: Rep Men 48% (146) 45% (138) 7% (20) 304PID/Gender: Rep Women 45% (148) 42% (138) 14% (45) 332Ideo: Liberal (1-3) 88% (552) 9% (54) 3% (19) 625Ideo: Moderate (4) 72% (411) 16% (91) 12% (68) 571Ideo: Conservative (5-7) 48% (327) 44% (301) 8% (57) 685Educ: < College 65% (815) 24% (303) 11% (137) 1254Educ: Bachelors degree 71% (333) 23% (110) 6% (28) 472Educ: Post-grad 73% (196) 20% (54) 7% (18) 268
Continued on next page
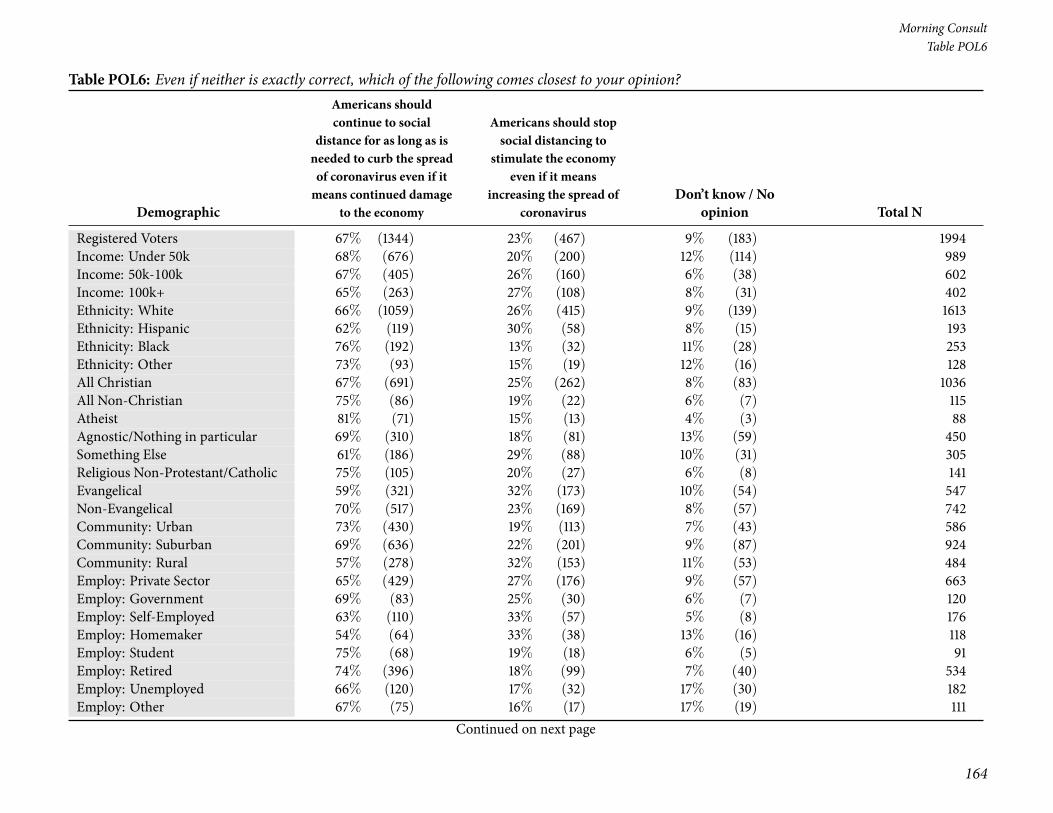
164
Morning ConsultTable POL6
Table POL6: Even if neither is exactly correct, which of the following comes closest to your opinion?
Demographic
Americans shouldcontinue to social
distance for as long as isneeded to curb the spreadof coronavirus even if itmeans continued damage
to the economy
Americans should stopsocial distancing to
stimulate the economyeven if it means
increasing the spread ofcoronavirus
Don’t know / Noopinion Total N
Registered Voters 67% (1344) 23% (467) 9% (183) 1994Income: Under 50k 68% (676) 20% (200) 12% (114) 989Income: 50k-100k 67% (405) 26% (160) 6% (38) 602Income: 100k+ 65% (263) 27% (108) 8% (31) 402Ethnicity: White 66% (1059) 26% (415) 9% (139) 1613Ethnicity: Hispanic 62% (119) 30% (58) 8% (15) 193Ethnicity: Black 76% (192) 13% (32) 11% (28) 253Ethnicity: Other 73% (93) 15% (19) 12% (16) 128All Christian 67% (691) 25% (262) 8% (83) 1036All Non-Christian 75% (86) 19% (22) 6% (7) 115Atheist 81% (71) 15% (13) 4% (3) 88Agnostic/Nothing in particular 69% (310) 18% (81) 13% (59) 450Something Else 61% (186) 29% (88) 10% (31) 305Religious Non-Protestant/Catholic 75% (105) 20% (27) 6% (8) 141Evangelical 59% (321) 32% (173) 10% (54) 547Non-Evangelical 70% (517) 23% (169) 8% (57) 742Community: Urban 73% (430) 19% (113) 7% (43) 586Community: Suburban 69% (636) 22% (201) 9% (87) 924Community: Rural 57% (278) 32% (153) 11% (53) 484Employ: Private Sector 65% (429) 27% (176) 9% (57) 663Employ: Government 69% (83) 25% (30) 6% (7) 120Employ: Self-Employed 63% (110) 33% (57) 5% (8) 176Employ: Homemaker 54% (64) 33% (38) 13% (16) 118Employ: Student 75% (68) 19% (18) 6% (5) 91Employ: Retired 74% (396) 18% (99) 7% (40) 534Employ: Unemployed 66% (120) 17% (32) 17% (30) 182Employ: Other 67% (75) 16% (17) 17% (19) 111
Continued on next page
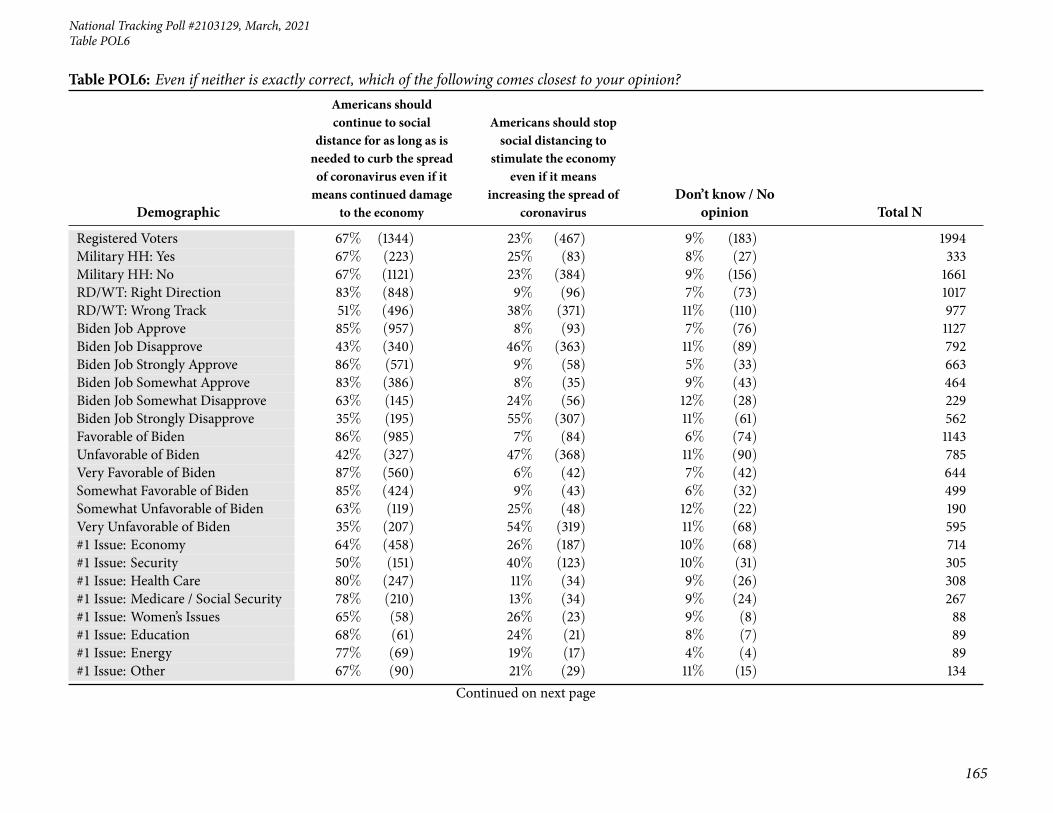
National Tracking Poll #2103129, March, 2021
165
Table POL6
Table POL6: Even if neither is exactly correct, which of the following comes closest to your opinion?
Demographic
Americans shouldcontinue to social
distance for as long as isneeded to curb the spreadof coronavirus even if itmeans continued damage
to the economy
Americans should stopsocial distancing to
stimulate the economyeven if it means
increasing the spread ofcoronavirus
Don’t know / Noopinion Total N
Registered Voters 67% (1344) 23% (467) 9% (183) 1994Military HH: Yes 67% (223) 25% (83) 8% (27) 333Military HH: No 67% (1121) 23% (384) 9% (156) 1661RD/WT: Right Direction 83% (848) 9% (96) 7% (73) 1017RD/WT: Wrong Track 51% (496) 38% (371) 11% (110) 977Biden Job Approve 85% (957) 8% (93) 7% (76) 1127Biden Job Disapprove 43% (340) 46% (363) 11% (89) 792Biden Job Strongly Approve 86% (571) 9% (58) 5% (33) 663Biden Job Somewhat Approve 83% (386) 8% (35) 9% (43) 464Biden Job Somewhat Disapprove 63% (145) 24% (56) 12% (28) 229Biden Job Strongly Disapprove 35% (195) 55% (307) 11% (61) 562Favorable of Biden 86% (985) 7% (84) 6% (74) 1143Unfavorable of Biden 42% (327) 47% (368) 11% (90) 785Very Favorable of Biden 87% (560) 6% (42) 7% (42) 644Somewhat Favorable of Biden 85% (424) 9% (43) 6% (32) 499Somewhat Unfavorable of Biden 63% (119) 25% (48) 12% (22) 190Very Unfavorable of Biden 35% (207) 54% (319) 11% (68) 595#1 Issue: Economy 64% (458) 26% (187) 10% (68) 714#1 Issue: Security 50% (151) 40% (123) 10% (31) 305#1 Issue: Health Care 80% (247) 11% (34) 9% (26) 308#1 Issue: Medicare / Social Security 78% (210) 13% (34) 9% (24) 267#1 Issue: Women’s Issues 65% (58) 26% (23) 9% (8) 88#1 Issue: Education 68% (61) 24% (21) 8% (7) 89#1 Issue: Energy 77% (69) 19% (17) 4% (4) 89#1 Issue: Other 67% (90) 21% (29) 11% (15) 134
Continued on next page

166
Morning ConsultTable POL6
Table POL6: Even if neither is exactly correct, which of the following comes closest to your opinion?
Demographic
Americans shouldcontinue to social
distance for as long as isneeded to curb the spreadof coronavirus even if itmeans continued damage
to the economy
Americans should stopsocial distancing to
stimulate the economyeven if it means
increasing the spread ofcoronavirus
Don’t know / Noopinion Total N
Registered Voters 67% (1344) 23% (467) 9% (183) 19942020 Vote: Joe Biden 87% (897) 7% (73) 6% (67) 10372020 Vote: Donald Trump 43% (322) 47% (345) 10% (74) 7412020 Vote: Other 57% (34) 27% (16) 16% (10) 602020 Vote: Didn’t Vote 58% (89) 21% (32) 21% (32) 1532018 House Vote: Democrat 86% (640) 8% (62) 6% (46) 7482018 House Vote: Republican 46% (288) 46% (289) 7% (46) 6232018 House Vote: Someone else 58% (32) 22% (12) 20% (11) 552016 Vote: Hillary Clinton 85% (595) 9% (62) 6% (43) 7002016 Vote: Donald Trump 48% (339) 43% (308) 9% (66) 7132016 Vote: Other 75% (81) 16% (18) 9% (10) 1082016 Vote: Didn’t Vote 69% (324) 17% (78) 14% (64) 467Voted in 2014: Yes 67% (849) 26% (335) 7% (91) 1275Voted in 2014: No 69% (495) 18% (132) 13% (92) 7194-Region: Northeast 71% (254) 20% (72) 9% (30) 3564-Region: Midwest 60% (275) 29% (131) 11% (52) 4584-Region: South 68% (508) 23% (168) 9% (69) 7444-Region: West 71% (308) 22% (96) 7% (32) 436Party: Democrat/Leans Democrat 86% (836) 7% (69) 7% (68) 973Party: Republican/Leans Republican 45% (347) 45% (345) 10% (76) 768Note: Row proportions may total to larger than one-hundred percent due to rounding. For more information visit MorningConsultIntelligence.com.

National Tracking Poll #2103129, March, 2021
167
Table POL7
Table POL7: As you may know, in response to the coronavirus Americans have been encouraged to ’social distance’ with many states cancelingupcoming major events and closing schools, restaurants, and other public spaces. Based on what you know, when do you believe Americans will beable to stop social distancing and return to public spaces?
DemographicIn the nexttwo weeks
In the nextmonth
In the nexttwo months
In the nextthreemonths
In the nextsix months
More thansix monthsfrom now
Don’t know /No opinion Total N
Registered Voters 10% (194) 5% (97) 7% (139) 10% (208) 21% (414) 34% (671) 14% (271) 1994Gender: Male 12% (113) 6% (56) 7% (63) 14% (126) 23% (210) 28% (259) 11% (106) 933Gender: Female 8% (81) 4% (41) 7% (76) 8% (82) 19% (204) 39% (412) 16% (165) 1061Age: 18-34 11% (53) 6% (30) 11% (53) 9% (43) 22% (111) 26% (132) 16% (78) 501Age: 35-44 10% (30) 8% (23) 6% (19) 9% (28) 18% (55) 34% (102) 15% (46) 303Age: 45-64 10% (70) 4% (29) 5% (37) 13% (97) 18% (134) 37% (266) 13% (94) 726Age: 65+ 9% (40) 3% (15) 6% (30) 9% (40) 25% (115) 37% (171) 11% (53) 464GenZers: 1997-2012 5% (9) 4% (7) 13% (21) 8% (14) 29% (48) 28% (46) 13% (22) 168Millennials: 1981-1996 12% (66) 8% (44) 8% (46) 9% (51) 17% (96) 28% (155) 17% (92) 551GenXers: 1965-1980 10% (44) 4% (18) 5% (20) 10% (42) 20% (87) 36% (153) 14% (61) 424Baby Boomers: 1946-1964 9% (72) 3% (22) 6% (44) 12% (95) 21% (162) 38% (300) 11% (89) 784PID: Dem (no lean) 4% (29) 3% (28) 6% (46) 9% (76) 24% (194) 42% (339) 13% (104) 817PID: Ind (no lean) 9% (51) 5% (25) 8% (44) 10% (54) 24% (128) 29% (159) 15% (81) 542PID: Rep (no lean) 18% (114) 7% (44) 8% (49) 12% (79) 14% (92) 27% (172) 14% (86) 635PID/Gender: DemMen 5% (16) 5% (17) 8% (28) 13% (45) 25% (88) 34% (120) 11% (37) 350PID/Gender: DemWomen 3% (13) 3% (12) 4% (18) 7% (31) 23% (106) 47% (220) 14% (68) 467PID/Gender: Ind Men 10% (29) 7% (19) 8% (21) 10% (27) 24% (68) 27% (77) 14% (39) 280PID/Gender: Ind Women 8% (22) 2% (6) 9% (23) 10% (27) 23% (60) 31% (82) 16% (41) 262PID/Gender: Rep Men 22% (68) 7% (20) 4% (13) 18% (55) 18% (54) 21% (63) 10% (30) 304PID/Gender: Rep Women 14% (46) 7% (23) 11% (35) 7% (24) 11% (37) 33% (110) 17% (56) 332Ideo: Liberal (1-3) 5% (31) 6% (35) 6% (36) 10% (65) 26% (160) 41% (257) 7% (41) 625Ideo: Moderate (4) 4% (21) 3% (19) 7% (39) 9% (49) 24% (136) 34% (197) 19% (109) 571Ideo: Conservative (5-7) 19% (131) 6% (41) 8% (54) 13% (91) 16% (111) 26% (179) 12% (79) 685Educ: < College 10% (131) 4% (54) 6% (81) 9% (118) 17% (218) 35% (442) 17% (211) 1254Educ: Bachelors degree 8% (38) 6% (28) 9% (43) 12% (59) 26% (121) 30% (140) 9% (43) 472Educ: Post-grad 10% (26) 6% (15) 5% (14) 12% (32) 28% (75) 33% (88) 7% (18) 268Income: Under 50k 9% (92) 3% (32) 6% (62) 10% (96) 18% (174) 37% (364) 17% (168) 989Income: 50k-100k 10% (60) 6% (38) 7% (44) 9% (57) 23% (137) 32% (191) 12% (75) 602Income: 100k+ 10% (41) 7% (27) 8% (32) 14% (55) 26% (103) 29% (115) 7% (28) 402
Continued on next page

168
Morning ConsultTable POL7
Table POL7: As you may know, in response to the coronavirus Americans have been encouraged to ’social distance’ with many states cancelingupcoming major events and closing schools, restaurants, and other public spaces. Based on what you know, when do you believe Americans will beable to stop social distancing and return to public spaces?
DemographicIn the nexttwo weeks
In the nextmonth
In the nexttwo months
In the nextthreemonths
In the nextsix months
More thansix monthsfrom now
Don’t know /No opinion Total N
Registered Voters 10% (194) 5% (97) 7% (139) 10% (208) 21% (414) 34% (671) 14% (271) 1994Ethnicity: White 11% (170) 5% (84) 7% (107) 11% (180) 22% (356) 32% (509) 13% (207) 1613Ethnicity: Hispanic 10% (20) 8% (15) 7% (14) 10% (19) 19% (36) 35% (68) 10% (20) 193Ethnicity: Black 4% (11) 2% (4) 10% (26) 9% (23) 15% (38) 41% (104) 18% (46) 253Ethnicity: Other 11% (14) 7% (8) 5% (6) 4% (5) 16% (20) 45% (58) 14% (18) 128All Christian 11% (116) 5% (55) 8% (81) 12% (123) 21% (218) 32% (336) 10% (107) 1036All Non-Christian 17% (20) 7% (8) 9% (10) 11% (12) 18% (20) 30% (34) 8% (10) 115Atheist 5% (4) 4% (3) 2% (2) 10% (9) 25% (22) 44% (38) 11% (10) 88Agnostic/Nothing in particular 6% (26) 3% (13) 8% (36) 9% (39) 20% (92) 35% (160) 19% (85) 450Something Else 9% (27) 6% (18) 3% (10) 8% (25) 20% (62) 34% (103) 20% (60) 305Religious Non-Protestant/Catholic 17% (24) 6% (9) 8% (11) 14% (19) 17% (25) 29% (41) 8% (12) 141Evangelical 14% (75) 7% (39) 7% (40) 13% (74) 16% (87) 27% (146) 16% (87) 547Non-Evangelical 9% (65) 4% (32) 6% (42) 9% (67) 24% (182) 38% (281) 10% (74) 742Community: Urban 10% (58) 4% (25) 9% (53) 11% (67) 21% (125) 32% (187) 12% (70) 586Community: Suburban 8% (72) 5% (50) 6% (56) 11% (98) 23% (209) 34% (313) 14% (127) 924Community: Rural 13% (64) 4% (21) 6% (29) 9% (43) 16% (80) 35% (171) 15% (75) 484Employ: Private Sector 11% (73) 6% (37) 9% (57) 10% (69) 22% (146) 31% (205) 11% (76) 663Employ: Government 12% (14) 11% (13) 7% (8) 8% (10) 18% (22) 35% (43) 8% (10) 120Employ: Self-Employed 21% (36) 5% (9) 7% (12) 12% (22) 16% (28) 28% (50) 11% (19) 176Employ: Homemaker 10% (12) 2% (3) 5% (6) 7% (8) 13% (15) 46% (55) 17% (20) 118Employ: Student 5% (5) 4% (3) 15% (14) 10% (9) 28% (25) 28% (25) 11% (10) 91Employ: Retired 6% (32) 4% (21) 7% (36) 12% (62) 23% (124) 36% (194) 12% (64) 534Employ: Unemployed 8% (15) 2% (3) 2% (4) 11% (20) 16% (29) 37% (68) 23% (42) 182Employ: Other 7% (7) 6% (7) 2% (2) 7% (8) 22% (24) 29% (32) 27% (30) 111Military HH: Yes 11% (36) 5% (16) 9% (30) 7% (23) 26% (87) 32% (108) 10% (33) 333Military HH: No 10% (158) 5% (81) 7% (108) 11% (185) 20% (327) 34% (563) 14% (238) 1661RD/WT: Right Direction 6% (57) 4% (45) 6% (60) 10% (99) 26% (259) 38% (384) 11% (113) 1017RD/WT: Wrong Track 14% (137) 5% (52) 8% (79) 11% (109) 16% (154) 29% (287) 16% (159) 977
Continued on next page
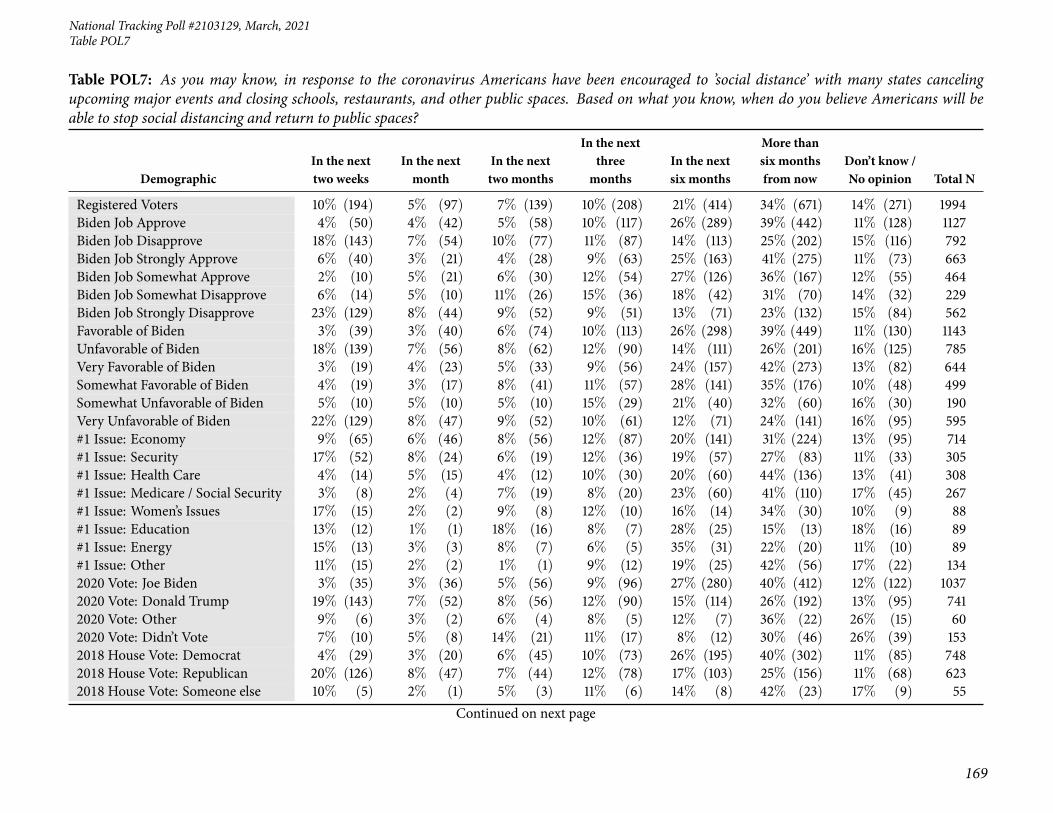
National Tracking Poll #2103129, March, 2021
169
Table POL7
Table POL7: As you may know, in response to the coronavirus Americans have been encouraged to ’social distance’ with many states cancelingupcoming major events and closing schools, restaurants, and other public spaces. Based on what you know, when do you believe Americans will beable to stop social distancing and return to public spaces?
DemographicIn the nexttwo weeks
In the nextmonth
In the nexttwo months
In the nextthreemonths
In the nextsix months
More thansix monthsfrom now
Don’t know /No opinion Total N
Registered Voters 10% (194) 5% (97) 7% (139) 10% (208) 21% (414) 34% (671) 14% (271) 1994Biden Job Approve 4% (50) 4% (42) 5% (58) 10% (117) 26% (289) 39% (442) 11% (128) 1127Biden Job Disapprove 18% (143) 7% (54) 10% (77) 11% (87) 14% (113) 25% (202) 15% (116) 792Biden Job Strongly Approve 6% (40) 3% (21) 4% (28) 9% (63) 25% (163) 41% (275) 11% (73) 663Biden Job Somewhat Approve 2% (10) 5% (21) 6% (30) 12% (54) 27% (126) 36% (167) 12% (55) 464Biden Job Somewhat Disapprove 6% (14) 5% (10) 11% (26) 15% (36) 18% (42) 31% (70) 14% (32) 229Biden Job Strongly Disapprove 23% (129) 8% (44) 9% (52) 9% (51) 13% (71) 23% (132) 15% (84) 562Favorable of Biden 3% (39) 3% (40) 6% (74) 10% (113) 26% (298) 39% (449) 11% (130) 1143Unfavorable of Biden 18% (139) 7% (56) 8% (62) 12% (90) 14% (111) 26% (201) 16% (125) 785Very Favorable of Biden 3% (19) 4% (23) 5% (33) 9% (56) 24% (157) 42% (273) 13% (82) 644Somewhat Favorable of Biden 4% (19) 3% (17) 8% (41) 11% (57) 28% (141) 35% (176) 10% (48) 499Somewhat Unfavorable of Biden 5% (10) 5% (10) 5% (10) 15% (29) 21% (40) 32% (60) 16% (30) 190Very Unfavorable of Biden 22% (129) 8% (47) 9% (52) 10% (61) 12% (71) 24% (141) 16% (95) 595#1 Issue: Economy 9% (65) 6% (46) 8% (56) 12% (87) 20% (141) 31% (224) 13% (95) 714#1 Issue: Security 17% (52) 8% (24) 6% (19) 12% (36) 19% (57) 27% (83) 11% (33) 305#1 Issue: Health Care 4% (14) 5% (15) 4% (12) 10% (30) 20% (60) 44% (136) 13% (41) 308#1 Issue: Medicare / Social Security 3% (8) 2% (4) 7% (19) 8% (20) 23% (60) 41% (110) 17% (45) 267#1 Issue: Women’s Issues 17% (15) 2% (2) 9% (8) 12% (10) 16% (14) 34% (30) 10% (9) 88#1 Issue: Education 13% (12) 1% (1) 18% (16) 8% (7) 28% (25) 15% (13) 18% (16) 89#1 Issue: Energy 15% (13) 3% (3) 8% (7) 6% (5) 35% (31) 22% (20) 11% (10) 89#1 Issue: Other 11% (15) 2% (2) 1% (1) 9% (12) 19% (25) 42% (56) 17% (22) 1342020 Vote: Joe Biden 3% (35) 3% (36) 5% (56) 9% (96) 27% (280) 40% (412) 12% (122) 10372020 Vote: Donald Trump 19% (143) 7% (52) 8% (56) 12% (90) 15% (114) 26% (192) 13% (95) 7412020 Vote: Other 9% (6) 3% (2) 6% (4) 8% (5) 12% (7) 36% (22) 26% (15) 602020 Vote: Didn’t Vote 7% (10) 5% (8) 14% (21) 11% (17) 8% (12) 30% (46) 26% (39) 1532018 House Vote: Democrat 4% (29) 3% (20) 6% (45) 10% (73) 26% (195) 40% (302) 11% (85) 7482018 House Vote: Republican 20% (126) 8% (47) 7% (44) 12% (78) 17% (103) 25% (156) 11% (68) 6232018 House Vote: Someone else 10% (5) 2% (1) 5% (3) 11% (6) 14% (8) 42% (23) 17% (9) 55
Continued on next page

170
Morning ConsultTable POL7
Table POL7: As you may know, in response to the coronavirus Americans have been encouraged to ’social distance’ with many states cancelingupcoming major events and closing schools, restaurants, and other public spaces. Based on what you know, when do you believe Americans will beable to stop social distancing and return to public spaces?
DemographicIn the nexttwo weeks
In the nextmonth
In the nexttwo months
In the nextthreemonths
In the nextsix months
More thansix monthsfrom now
Don’t know /No opinion Total N
Registered Voters 10% (194) 5% (97) 7% (139) 10% (208) 21% (414) 34% (671) 14% (271) 19942016 Vote: Hillary Clinton 4% (26) 3% (19) 5% (34) 10% (67) 25% (178) 42% (296) 11% (80) 7002016 Vote: Donald Trump 19% (134) 7% (50) 7% (52) 12% (87) 18% (126) 26% (188) 11% (77) 7132016 Vote: Other 8% (8) 1% (1) 8% (9) 14% (15) 24% (26) 35% (38) 10% (11) 1082016 Vote: Didn’t Vote 6% (26) 6% (27) 9% (42) 8% (36) 18% (82) 32% (149) 22% (104) 467Voted in 2014: Yes 12% (153) 5% (62) 7% (88) 10% (127) 22% (284) 33% (424) 11% (137) 1275Voted in 2014: No 6% (41) 5% (36) 7% (50) 11% (81) 18% (130) 34% (247) 19% (134) 7194-Region: Northeast 9% (31) 7% (23) 7% (25) 11% (39) 21% (76) 34% (120) 12% (42) 3564-Region: Midwest 13% (58) 4% (18) 9% (42) 10% (45) 21% (97) 30% (139) 13% (59) 4584-Region: South 8% (62) 5% (37) 6% (41) 9% (70) 22% (161) 35% (260) 15% (113) 7444-Region: West 10% (43) 4% (19) 7% (31) 12% (53) 18% (79) 35% (152) 13% (58) 436Party: Democrat/Leans Democrat 3% (33) 3% (33) 6% (57) 10% (98) 26% (250) 40% (385) 12% (118) 973Party: Republican/Leans Republican 19% (144) 6% (50) 8% (60) 12% (90) 15% (117) 26% (202) 14% (107) 768Note: Row proportions may total to larger than one-hundred percent due to rounding. For more information visit MorningConsultIntelligence.com.

National Tracking Poll #2103129, March, 2021
171
Table POL8
Table POL8: Do you support or oppose a Medicare for All health care system, where all Americans would get their health insurance from the govern-ment?
DemographicStronglysupport
Somewhatsupport
Somewhatoppose
Stronglyoppose
Don’t know /No opinion Total N
Registered Voters 29% (580) 26% (517) 10% (197) 22% (442) 13% (258) 1994Gender: Male 28% (263) 27% (253) 10% (97) 25% (231) 10% (90) 933Gender: Female 30% (317) 25% (264) 9% (100) 20% (211) 16% (168) 1061Age: 18-34 42% (212) 30% (151) 6% (30) 8% (41) 13% (66) 501Age: 35-44 32% (96) 31% (95) 8% (25) 16% (49) 12% (37) 303Age: 45-64 27% (193) 23% (164) 13% (91) 25% (179) 14% (100) 726Age: 65+ 17% (79) 23% (106) 11% (50) 37% (173) 12% (55) 464GenZers: 1997-2012 47% (79) 32% (53) 9% (15) 3% (5) 9% (15) 168Millennials: 1981-1996 35% (193) 31% (172) 6% (35) 13% (69) 15% (82) 551GenXers: 1965-1980 31% (133) 24% (104) 10% (41) 21% (89) 14% (59) 424Baby Boomers: 1946-1964 21% (167) 23% (179) 13% (99) 32% (247) 12% (92) 784PID: Dem (no lean) 45% (365) 34% (281) 5% (42) 3% (21) 13% (108) 817PID: Ind (no lean) 25% (136) 25% (134) 11% (61) 23% (123) 16% (88) 542PID: Rep (no lean) 12% (78) 16% (102) 15% (94) 47% (298) 10% (63) 635PID/Gender: DemMen 43% (151) 39% (138) 5% (16) 2% (8) 10% (37) 350PID/Gender: DemWomen 46% (214) 31% (143) 6% (26) 3% (13) 15% (71) 467PID/Gender: Ind Men 23% (65) 24% (68) 11% (30) 29% (80) 13% (37) 280PID/Gender: Ind Women 27% (72) 25% (65) 12% (31) 16% (43) 19% (51) 262PID/Gender: Rep Men 15% (47) 15% (47) 17% (51) 47% (143) 5% (16) 304PID/Gender: Rep Women 9% (31) 17% (56) 13% (43) 47% (155) 14% (46) 332Ideo: Liberal (1-3) 53% (330) 33% (207) 6% (35) 2% (12) 7% (41) 625Ideo: Moderate (4) 24% (138) 34% (195) 11% (63) 11% (64) 19% (110) 571Ideo: Conservative (5-7) 11% (74) 14% (97) 13% (92) 52% (358) 9% (64) 685Educ: < College 25% (319) 24% (296) 11% (134) 23% (287) 17% (219) 1254Educ: Bachelors degree 35% (166) 29% (138) 10% (48) 20% (95) 5% (24) 472Educ: Post-grad 35% (94) 31% (82) 6% (15) 23% (61) 6% (15) 268Income: Under 50k 31% (309) 24% (239) 10% (96) 18% (181) 17% (165) 989Income: 50k-100k 25% (152) 26% (159) 11% (64) 28% (168) 10% (60) 602Income: 100k+ 30% (119) 30% (119) 9% (37) 23% (93) 8% (33) 402Ethnicity: White 27% (434) 25% (410) 11% (172) 25% (406) 12% (191) 1613Ethnicity: Hispanic 38% (74) 28% (55) 8% (16) 14% (27) 11% (21) 193
Continued on next page

172
Morning ConsultTable POL8
Table POL8: Do you support or oppose a Medicare for All health care system, where all Americans would get their health insurance from the govern-ment?
DemographicStronglysupport
Somewhatsupport
Somewhatoppose
Stronglyoppose
Don’t know /No opinion Total N
Registered Voters 29% (580) 26% (517) 10% (197) 22% (442) 13% (258) 1994Ethnicity: Black 38% (97) 29% (73) 6% (15) 7% (18) 20% (49) 253Ethnicity: Other 38% (48) 26% (34) 8% (10) 14% (18) 14% (18) 128All Christian 21% (218) 27% (277) 12% (124) 29% (300) 11% (117) 1036All Non-Christian 47% (54) 31% (36) 6% (6) 6% (7) 10% (12) 115Atheist 58% (51) 20% (17) 9% (8) 7% (6) 6% (5) 88Agnostic/Nothing in particular 38% (169) 25% (111) 5% (22) 15% (68) 18% (79) 450Something Else 29% (88) 25% (75) 12% (37) 20% (61) 15% (44) 305Religious Non-Protestant/Catholic 41% (58) 32% (45) 7% (10) 10% (14) 10% (14) 141Evangelical 23% (126) 22% (122) 11% (60) 31% (170) 13% (69) 547Non-Evangelical 23% (170) 28% (211) 13% (95) 24% (181) 12% (86) 742Community: Urban 42% (246) 28% (165) 9% (51) 10% (61) 11% (64) 586Community: Suburban 25% (234) 28% (256) 10% (88) 25% (231) 13% (116) 924Community: Rural 21% (100) 20% (97) 12% (58) 31% (150) 16% (79) 484Employ: Private Sector 34% (224) 29% (191) 7% (49) 19% (127) 11% (72) 663Employ: Government 35% (42) 25% (30) 9% (11) 19% (22) 12% (14) 120Employ: Self-Employed 33% (57) 23% (41) 9% (16) 27% (48) 8% (13) 176Employ: Homemaker 18% (22) 28% (33) 13% (15) 22% (26) 18% (22) 118Employ: Student 53% (48) 27% (24) 9% (9) 2% (2) 9% (8) 91Employ: Retired 18% (98) 24% (128) 13% (68) 33% (174) 12% (66) 534Employ: Unemployed 30% (55) 25% (46) 10% (18) 12% (22) 23% (41) 182Employ: Other 30% (34) 21% (24) 11% (12) 19% (21) 19% (21) 111Military HH: Yes 27% (90) 20% (66) 11% (38) 29% (96) 13% (43) 333Military HH: No 29% (490) 27% (451) 10% (159) 21% (347) 13% (215) 1661RD/WT: Right Direction 43% (435) 33% (336) 7% (76) 4% (45) 12% (125) 1017RD/WT: Wrong Track 15% (145) 18% (181) 12% (121) 41% (397) 14% (133) 977Biden Job Approve 43% (489) 34% (382) 7% (76) 4% (46) 12% (134) 1127Biden Job Disapprove 10% (80) 15% (118) 14% (111) 49% (392) 11% (91) 792
Continued on next page

National Tracking Poll #2103129, March, 2021
173
Table POL8
Table POL8: Do you support or oppose a Medicare for All health care system, where all Americans would get their health insurance from the govern-ment?
DemographicStronglysupport
Somewhatsupport
Somewhatoppose
Stronglyoppose
Don’t know /No opinion Total N
Registered Voters 29% (580) 26% (517) 10% (197) 22% (442) 13% (258) 1994Biden Job Strongly Approve 51% (341) 29% (189) 5% (36) 2% (15) 12% (81) 663Biden Job Somewhat Approve 32% (147) 41% (192) 9% (40) 7% (31) 12% (53) 464Biden Job Somewhat Disapprove 21% (47) 27% (62) 20% (46) 18% (41) 15% (34) 229Biden Job Strongly Disapprove 6% (33) 10% (56) 12% (66) 62% (351) 10% (57) 562Favorable of Biden 42% (484) 34% (394) 7% (78) 4% (49) 12% (138) 1143Unfavorable of Biden 8% (66) 14% (111) 15% (116) 50% (393) 13% (99) 785Very Favorable of Biden 49% (314) 30% (196) 5% (34) 2% (14) 13% (86) 644Somewhat Favorable of Biden 34% (170) 40% (198) 9% (44) 7% (35) 10% (52) 499Somewhat Unfavorable of Biden 15% (29) 24% (46) 24% (46) 17% (33) 19% (36) 190Very Unfavorable of Biden 6% (37) 11% (64) 12% (70) 61% (360) 11% (64) 595#1 Issue: Economy 27% (190) 27% (195) 10% (70) 23% (166) 13% (91) 714#1 Issue: Security 13% (39) 18% (54) 11% (35) 47% (143) 11% (33) 305#1 Issue: Health Care 44% (137) 29% (90) 7% (21) 9% (29) 10% (30) 308#1 Issue: Medicare / Social Security 27% (71) 22% (60) 14% (36) 20% (53) 18% (47) 267#1 Issue: Women’s Issues 39% (35) 27% (24) 4% (3) 16% (14) 14% (13) 88#1 Issue: Education 45% (40) 30% (27) 8% (7) 6% (5) 10% (9) 89#1 Issue: Energy 42% (38) 38% (34) 6% (6) 2% (1) 12% (11) 89#1 Issue: Other 21% (29) 25% (33) 14% (18) 22% (30) 18% (24) 1342020 Vote: Joe Biden 43% (446) 34% (350) 7% (73) 4% (40) 12% (128) 10372020 Vote: Donald Trump 11% (78) 14% (107) 15% (108) 50% (371) 10% (77) 7412020 Vote: Other 22% (13) 26% (16) 5% (3) 27% (16) 20% (12) 602020 Vote: Didn’t Vote 28% (42) 28% (43) 8% (13) 9% (14) 27% (41) 1532018 House Vote: Democrat 44% (330) 33% (243) 8% (57) 4% (31) 12% (87) 7482018 House Vote: Republican 11% (68) 14% (89) 13% (83) 53% (330) 8% (52) 6232018 House Vote: Someone else 35% (19) 19% (10) 1% (1) 30% (16) 15% (8) 552016 Vote: Hillary Clinton 45% (317) 34% (235) 6% (44) 4% (30) 11% (75) 7002016 Vote: Donald Trump 13% (90) 15% (109) 13% (93) 50% (358) 9% (63) 7132016 Vote: Other 20% (22) 26% (28) 13% (14) 22% (24) 19% (21) 1082016 Vote: Didn’t Vote 32% (147) 31% (144) 10% (45) 7% (31) 21% (100) 467
Continued on next page
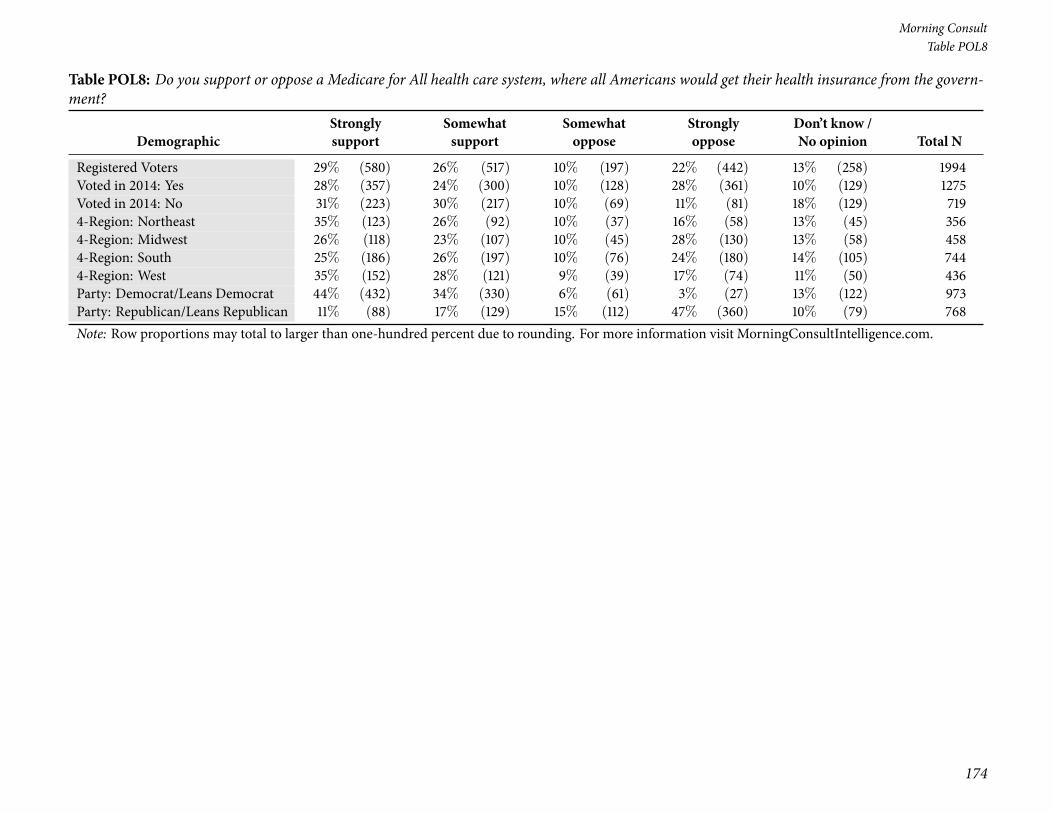
174
Morning ConsultTable POL8
Table POL8: Do you support or oppose a Medicare for All health care system, where all Americans would get their health insurance from the govern-ment?
DemographicStronglysupport
Somewhatsupport
Somewhatoppose
Stronglyoppose
Don’t know /No opinion Total N
Registered Voters 29% (580) 26% (517) 10% (197) 22% (442) 13% (258) 1994Voted in 2014: Yes 28% (357) 24% (300) 10% (128) 28% (361) 10% (129) 1275Voted in 2014: No 31% (223) 30% (217) 10% (69) 11% (81) 18% (129) 7194-Region: Northeast 35% (123) 26% (92) 10% (37) 16% (58) 13% (45) 3564-Region: Midwest 26% (118) 23% (107) 10% (45) 28% (130) 13% (58) 4584-Region: South 25% (186) 26% (197) 10% (76) 24% (180) 14% (105) 7444-Region: West 35% (152) 28% (121) 9% (39) 17% (74) 11% (50) 436Party: Democrat/Leans Democrat 44% (432) 34% (330) 6% (61) 3% (27) 13% (122) 973Party: Republican/Leans Republican 11% (88) 17% (129) 15% (112) 47% (360) 10% (79) 768Note: Row proportions may total to larger than one-hundred percent due to rounding. For more information visit MorningConsultIntelligence.com.
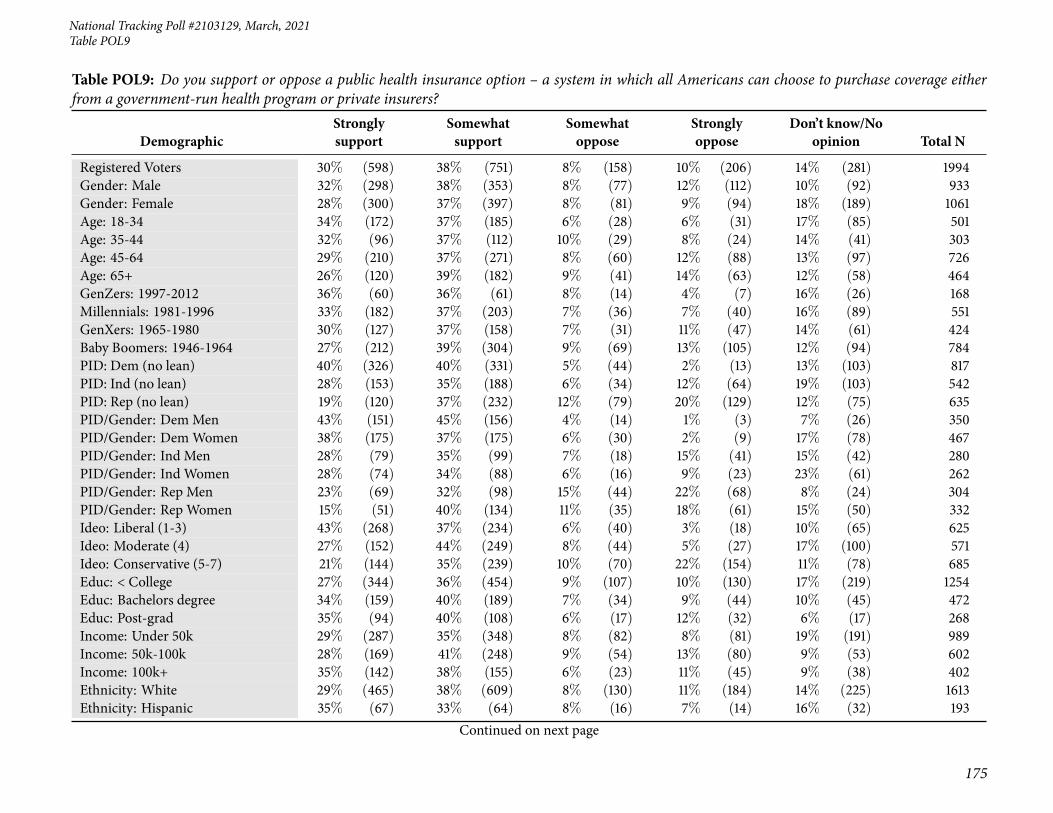
National Tracking Poll #2103129, March, 2021
175
Table POL9
Table POL9: Do you support or oppose a public health insurance option – a system in which all Americans can choose to purchase coverage eitherfrom a government-run health program or private insurers?
DemographicStronglysupport
Somewhatsupport
Somewhatoppose
Stronglyoppose
Don’t know/Noopinion Total N
Registered Voters 30% (598) 38% (751) 8% (158) 10% (206) 14% (281) 1994Gender: Male 32% (298) 38% (353) 8% (77) 12% (112) 10% (92) 933Gender: Female 28% (300) 37% (397) 8% (81) 9% (94) 18% (189) 1061Age: 18-34 34% (172) 37% (185) 6% (28) 6% (31) 17% (85) 501Age: 35-44 32% (96) 37% (112) 10% (29) 8% (24) 14% (41) 303Age: 45-64 29% (210) 37% (271) 8% (60) 12% (88) 13% (97) 726Age: 65+ 26% (120) 39% (182) 9% (41) 14% (63) 12% (58) 464GenZers: 1997-2012 36% (60) 36% (61) 8% (14) 4% (7) 16% (26) 168Millennials: 1981-1996 33% (182) 37% (203) 7% (36) 7% (40) 16% (89) 551GenXers: 1965-1980 30% (127) 37% (158) 7% (31) 11% (47) 14% (61) 424Baby Boomers: 1946-1964 27% (212) 39% (304) 9% (69) 13% (105) 12% (94) 784PID: Dem (no lean) 40% (326) 40% (331) 5% (44) 2% (13) 13% (103) 817PID: Ind (no lean) 28% (153) 35% (188) 6% (34) 12% (64) 19% (103) 542PID: Rep (no lean) 19% (120) 37% (232) 12% (79) 20% (129) 12% (75) 635PID/Gender: DemMen 43% (151) 45% (156) 4% (14) 1% (3) 7% (26) 350PID/Gender: DemWomen 38% (175) 37% (175) 6% (30) 2% (9) 17% (78) 467PID/Gender: Ind Men 28% (79) 35% (99) 7% (18) 15% (41) 15% (42) 280PID/Gender: Ind Women 28% (74) 34% (88) 6% (16) 9% (23) 23% (61) 262PID/Gender: Rep Men 23% (69) 32% (98) 15% (44) 22% (68) 8% (24) 304PID/Gender: Rep Women 15% (51) 40% (134) 11% (35) 18% (61) 15% (50) 332Ideo: Liberal (1-3) 43% (268) 37% (234) 6% (40) 3% (18) 10% (65) 625Ideo: Moderate (4) 27% (152) 44% (249) 8% (44) 5% (27) 17% (100) 571Ideo: Conservative (5-7) 21% (144) 35% (239) 10% (70) 22% (154) 11% (78) 685Educ: < College 27% (344) 36% (454) 9% (107) 10% (130) 17% (219) 1254Educ: Bachelors degree 34% (159) 40% (189) 7% (34) 9% (44) 10% (45) 472Educ: Post-grad 35% (94) 40% (108) 6% (17) 12% (32) 6% (17) 268Income: Under 50k 29% (287) 35% (348) 8% (82) 8% (81) 19% (191) 989Income: 50k-100k 28% (169) 41% (248) 9% (54) 13% (80) 9% (53) 602Income: 100k+ 35% (142) 38% (155) 6% (23) 11% (45) 9% (38) 402Ethnicity: White 29% (465) 38% (609) 8% (130) 11% (184) 14% (225) 1613Ethnicity: Hispanic 35% (67) 33% (64) 8% (16) 7% (14) 16% (32) 193
Continued on next page
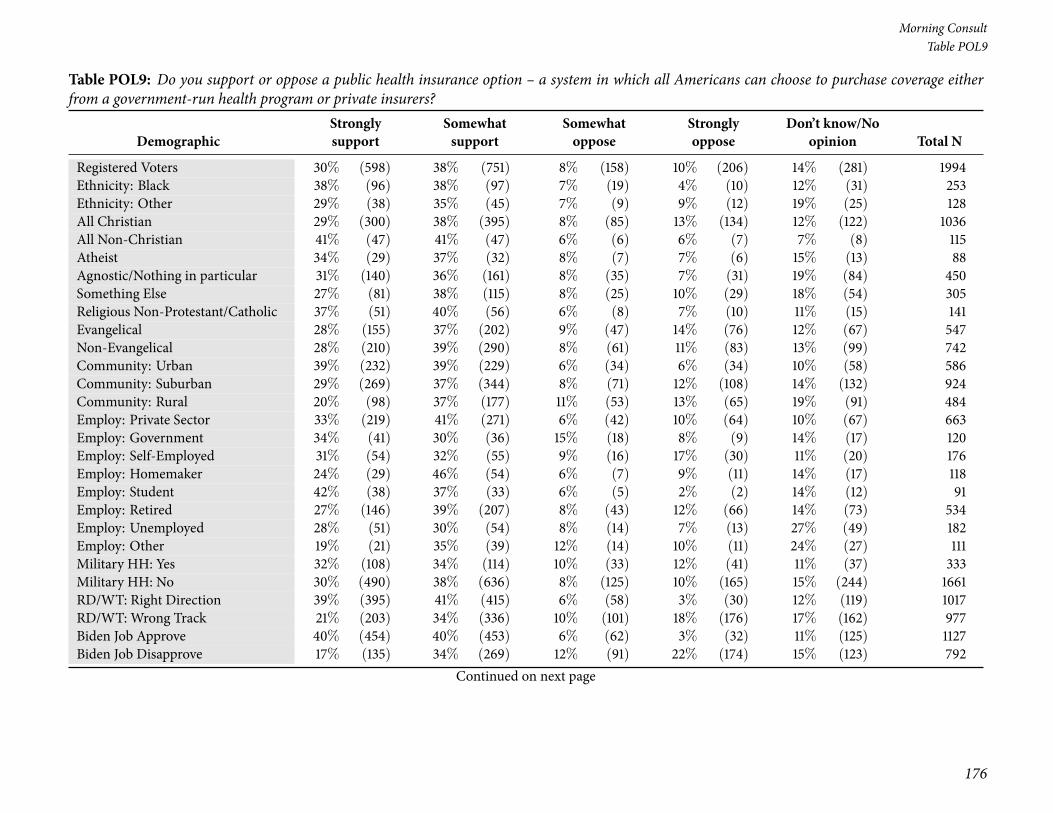
176
Morning ConsultTable POL9
Table POL9: Do you support or oppose a public health insurance option – a system in which all Americans can choose to purchase coverage eitherfrom a government-run health program or private insurers?
DemographicStronglysupport
Somewhatsupport
Somewhatoppose
Stronglyoppose
Don’t know/Noopinion Total N
Registered Voters 30% (598) 38% (751) 8% (158) 10% (206) 14% (281) 1994Ethnicity: Black 38% (96) 38% (97) 7% (19) 4% (10) 12% (31) 253Ethnicity: Other 29% (38) 35% (45) 7% (9) 9% (12) 19% (25) 128All Christian 29% (300) 38% (395) 8% (85) 13% (134) 12% (122) 1036All Non-Christian 41% (47) 41% (47) 6% (6) 6% (7) 7% (8) 115Atheist 34% (29) 37% (32) 8% (7) 7% (6) 15% (13) 88Agnostic/Nothing in particular 31% (140) 36% (161) 8% (35) 7% (31) 19% (84) 450Something Else 27% (81) 38% (115) 8% (25) 10% (29) 18% (54) 305Religious Non-Protestant/Catholic 37% (51) 40% (56) 6% (8) 7% (10) 11% (15) 141Evangelical 28% (155) 37% (202) 9% (47) 14% (76) 12% (67) 547Non-Evangelical 28% (210) 39% (290) 8% (61) 11% (83) 13% (99) 742Community: Urban 39% (232) 39% (229) 6% (34) 6% (34) 10% (58) 586Community: Suburban 29% (269) 37% (344) 8% (71) 12% (108) 14% (132) 924Community: Rural 20% (98) 37% (177) 11% (53) 13% (65) 19% (91) 484Employ: Private Sector 33% (219) 41% (271) 6% (42) 10% (64) 10% (67) 663Employ: Government 34% (41) 30% (36) 15% (18) 8% (9) 14% (17) 120Employ: Self-Employed 31% (54) 32% (55) 9% (16) 17% (30) 11% (20) 176Employ: Homemaker 24% (29) 46% (54) 6% (7) 9% (11) 14% (17) 118Employ: Student 42% (38) 37% (33) 6% (5) 2% (2) 14% (12) 91Employ: Retired 27% (146) 39% (207) 8% (43) 12% (66) 14% (73) 534Employ: Unemployed 28% (51) 30% (54) 8% (14) 7% (13) 27% (49) 182Employ: Other 19% (21) 35% (39) 12% (14) 10% (11) 24% (27) 111Military HH: Yes 32% (108) 34% (114) 10% (33) 12% (41) 11% (37) 333Military HH: No 30% (490) 38% (636) 8% (125) 10% (165) 15% (244) 1661RD/WT: Right Direction 39% (395) 41% (415) 6% (58) 3% (30) 12% (119) 1017RD/WT: Wrong Track 21% (203) 34% (336) 10% (101) 18% (176) 17% (162) 977Biden Job Approve 40% (454) 40% (453) 6% (62) 3% (32) 11% (125) 1127Biden Job Disapprove 17% (135) 34% (269) 12% (91) 22% (174) 15% (123) 792
Continued on next page

National Tracking Poll #2103129, March, 2021
177
Table POL9
Table POL9: Do you support or oppose a public health insurance option – a system in which all Americans can choose to purchase coverage eitherfrom a government-run health program or private insurers?
DemographicStronglysupport
Somewhatsupport
Somewhatoppose
Stronglyoppose
Don’t know/Noopinion Total N
Registered Voters 30% (598) 38% (751) 8% (158) 10% (206) 14% (281) 1994Biden Job Strongly Approve 49% (322) 35% (229) 5% (32) 3% (17) 9% (63) 663Biden Job Somewhat Approve 28% (132) 48% (224) 7% (30) 3% (15) 13% (62) 464Biden Job Somewhat Disapprove 18% (41) 45% (104) 12% (28) 6% (15) 18% (42) 229Biden Job Strongly Disapprove 17% (94) 29% (165) 11% (64) 28% (159) 14% (81) 562Favorable of Biden 39% (451) 41% (466) 5% (62) 3% (31) 12% (132) 1143Unfavorable of Biden 15% (115) 35% (276) 12% (94) 22% (175) 16% (125) 785Very Favorable of Biden 47% (305) 35% (226) 5% (30) 2% (13) 11% (70) 644Somewhat Favorable of Biden 29% (147) 48% (240) 6% (32) 4% (18) 12% (62) 499Somewhat Unfavorable of Biden 14% (26) 50% (95) 7% (14) 7% (13) 22% (42) 190Very Unfavorable of Biden 15% (89) 30% (181) 13% (80) 27% (163) 14% (83) 595#1 Issue: Economy 27% (193) 41% (291) 7% (51) 11% (80) 14% (98) 714#1 Issue: Security 23% (70) 33% (100) 11% (32) 20% (61) 14% (41) 305#1 Issue: Health Care 41% (126) 37% (114) 6% (19) 6% (18) 10% (31) 308#1 Issue: Medicare / Social Security 28% (74) 36% (96) 9% (25) 8% (22) 19% (51) 267#1 Issue: Women’s Issues 34% (30) 35% (31) 7% (6) 11% (9) 14% (12) 88#1 Issue: Education 37% (33) 43% (39) 2% (2) 2% (2) 15% (13) 89#1 Issue: Energy 41% (37) 38% (34) 7% (6) 1% (1) 13% (11) 89#1 Issue: Other 26% (34) 35% (46) 13% (18) 10% (13) 17% (23) 1342020 Vote: Joe Biden 40% (411) 40% (417) 5% (56) 3% (33) 12% (120) 10372020 Vote: Donald Trump 18% (131) 35% (263) 11% (81) 22% (165) 14% (101) 7412020 Vote: Other 30% (18) 38% (23) 6% (3) 7% (4) 19% (12) 602020 Vote: Didn’t Vote 25% (38) 30% (46) 11% (17) 2% (3) 32% (48) 1532018 House Vote: Democrat 41% (306) 39% (295) 6% (45) 2% (18) 11% (84) 7482018 House Vote: Republican 18% (111) 37% (230) 11% (68) 24% (150) 10% (64) 6232018 House Vote: Someone else 25% (14) 35% (19) 4% (2) 19% (10) 17% (9) 552016 Vote: Hillary Clinton 41% (284) 40% (281) 6% (39) 3% (21) 11% (76) 7002016 Vote: Donald Trump 20% (142) 35% (252) 12% (83) 22% (156) 11% (80) 7132016 Vote: Other 34% (37) 41% (44) 5% (6) 5% (6) 15% (16) 1082016 Vote: Didn’t Vote 29% (135) 37% (171) 7% (31) 5% (23) 23% (107) 467
Continued on next page
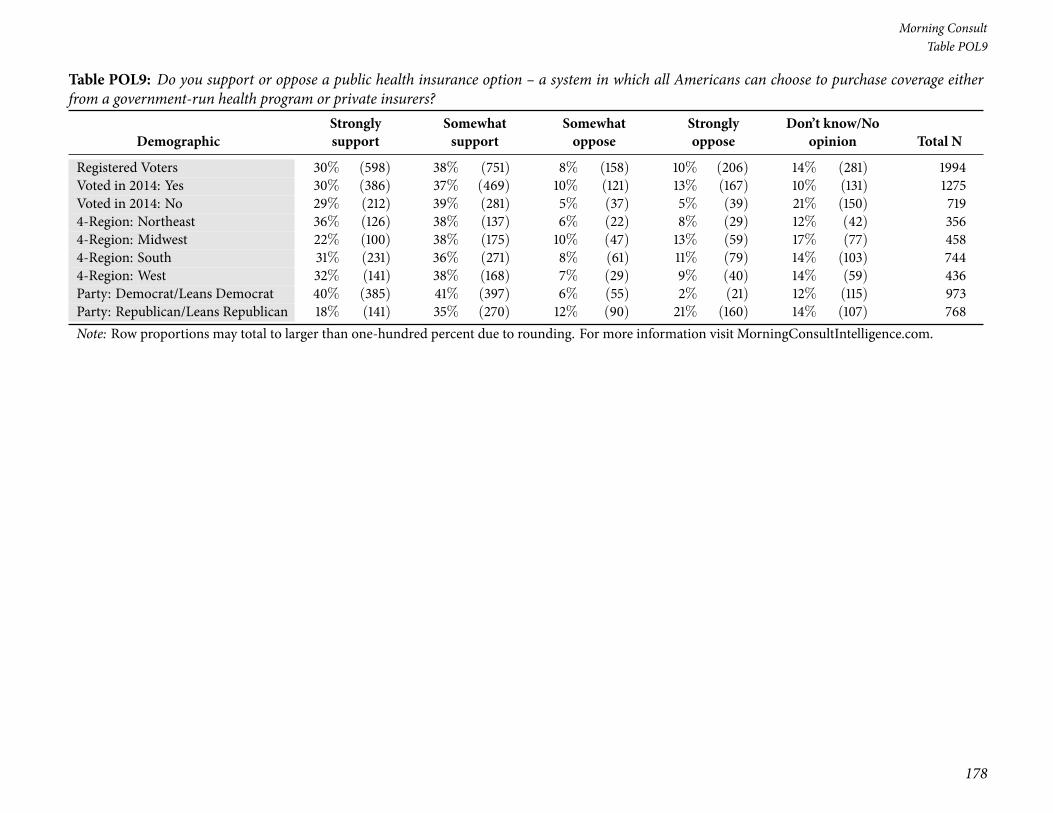
178
Morning ConsultTable POL9
Table POL9: Do you support or oppose a public health insurance option – a system in which all Americans can choose to purchase coverage eitherfrom a government-run health program or private insurers?
DemographicStronglysupport
Somewhatsupport
Somewhatoppose
Stronglyoppose
Don’t know/Noopinion Total N
Registered Voters 30% (598) 38% (751) 8% (158) 10% (206) 14% (281) 1994Voted in 2014: Yes 30% (386) 37% (469) 10% (121) 13% (167) 10% (131) 1275Voted in 2014: No 29% (212) 39% (281) 5% (37) 5% (39) 21% (150) 7194-Region: Northeast 36% (126) 38% (137) 6% (22) 8% (29) 12% (42) 3564-Region: Midwest 22% (100) 38% (175) 10% (47) 13% (59) 17% (77) 4584-Region: South 31% (231) 36% (271) 8% (61) 11% (79) 14% (103) 7444-Region: West 32% (141) 38% (168) 7% (29) 9% (40) 14% (59) 436Party: Democrat/Leans Democrat 40% (385) 41% (397) 6% (55) 2% (21) 12% (115) 973Party: Republican/Leans Republican 18% (141) 35% (270) 12% (90) 21% (160) 14% (107) 768Note: Row proportions may total to larger than one-hundred percent due to rounding. For more information visit MorningConsultIntelligence.com.

National Tracking Poll #2103129, March, 2021
179
Table POL10
Table POL10: And, would you support or oppose a plan that would automatically enroll Americans in a public health insurance option and retroac-tively charge them for this coverage if they choose not to enroll in other health insurance coverage, either from a public or private insurer?
DemographicStronglysupport
Somewhatsupport
Somewhatoppose
Stronglyoppose
Don’t know/Noopinion Total N
Registered Voters 11% (217) 22% (432) 17% (334) 32% (634) 19% (378) 1994Gender: Male 14% (130) 25% (234) 16% (146) 31% (294) 14% (130) 933Gender: Female 8% (87) 19% (198) 18% (188) 32% (340) 23% (247) 1061Age: 18-34 20% (98) 31% (154) 14% (71) 16% (79) 20% (100) 501Age: 35-44 14% (43) 25% (77) 15% (45) 30% (92) 15% (45) 303Age: 45-64 8% (55) 17% (125) 18% (128) 38% (279) 19% (139) 726Age: 65+ 5% (21) 16% (76) 19% (90) 40% (184) 20% (94) 464GenZers: 1997-2012 16% (27) 32% (54) 18% (31) 13% (22) 20% (34) 168Millennials: 1981-1996 19% (104) 29% (160) 12% (68) 22% (120) 18% (99) 551GenXers: 1965-1980 9% (39) 17% (74) 18% (76) 36% (153) 20% (84) 424Baby Boomers: 1946-1964 6% (45) 17% (134) 18% (144) 40% (314) 19% (147) 784PID: Dem (no lean) 16% (129) 32% (258) 18% (147) 14% (114) 21% (168) 817PID: Ind (no lean) 8% (45) 18% (99) 16% (88) 33% (178) 24% (132) 542PID: Rep (no lean) 7% (43) 12% (74) 16% (98) 54% (342) 12% (78) 635PID/Gender: DemMen 20% (71) 38% (132) 18% (63) 9% (33) 14% (51) 350PID/Gender: DemWomen 12% (58) 27% (126) 18% (84) 17% (81) 25% (118) 467PID/Gender: Ind Men 11% (29) 21% (60) 14% (40) 33% (91) 21% (60) 280PID/Gender: Ind Women 6% (16) 15% (39) 19% (49) 33% (87) 27% (72) 262PID/Gender: Rep Men 10% (29) 14% (42) 14% (43) 56% (169) 7% (20) 304PID/Gender: Rep Women 4% (13) 10% (32) 17% (55) 52% (173) 17% (58) 332Ideo: Liberal (1-3) 18% (111) 30% (189) 18% (115) 15% (94) 19% (116) 625Ideo: Moderate (4) 8% (47) 25% (140) 21% (121) 23% (133) 23% (130) 571Ideo: Conservative (5-7) 7% (47) 12% (81) 12% (82) 57% (391) 12% (84) 685Educ: < College 7% (92) 18% (232) 17% (215) 36% (451) 21% (263) 1254Educ: Bachelors degree 16% (74) 27% (128) 17% (81) 23% (109) 17% (79) 472Educ: Post-grad 19% (50) 27% (71) 14% (38) 27% (73) 13% (35) 268Income: Under 50k 9% (94) 18% (182) 18% (178) 31% (307) 23% (229) 989Income: 50k-100k 9% (56) 24% (144) 15% (92) 36% (219) 15% (92) 602Income: 100k+ 17% (67) 26% (106) 16% (64) 27% (108) 14% (57) 402Ethnicity: White 11% (174) 21% (338) 16% (250) 34% (549) 19% (302) 1613Ethnicity: Hispanic 13% (26) 24% (47) 21% (40) 23% (44) 19% (36) 193
Continued on next page

180
Morning ConsultTable POL10
Table POL10: And, would you support or oppose a plan that would automatically enroll Americans in a public health insurance option and retroac-tively charge them for this coverage if they choose not to enroll in other health insurance coverage, either from a public or private insurer?
DemographicStronglysupport
Somewhatsupport
Somewhatoppose
Stronglyoppose
Don’t know/Noopinion Total N
Registered Voters 11% (217) 22% (432) 17% (334) 32% (634) 19% (378) 1994Ethnicity: Black 12% (30) 23% (58) 24% (60) 24% (60) 18% (45) 253Ethnicity: Other 10% (13) 28% (36) 18% (24) 19% (24) 24% (31) 128All Christian 11% (109) 21% (214) 18% (187) 35% (358) 16% (168) 1036All Non-Christian 34% (39) 29% (33) 11% (12) 12% (14) 15% (17) 115Atheist 5% (4) 35% (31) 20% (17) 18% (16) 23% (20) 88Agnostic/Nothing in particular 9% (41) 21% (96) 17% (76) 28% (128) 25% (110) 450Something Else 8% (23) 19% (58) 14% (42) 39% (119) 20% (62) 305Religious Non-Protestant/Catholic 29% (40) 26% (37) 13% (18) 16% (22) 17% (24) 141Evangelical 13% (73) 18% (99) 14% (74) 41% (223) 14% (79) 547Non-Evangelical 7% (55) 22% (162) 19% (143) 32% (239) 19% (142) 742Community: Urban 21% (120) 25% (147) 16% (92) 21% (124) 18% (103) 586Community: Suburban 8% (72) 23% (211) 18% (165) 33% (304) 19% (171) 924Community: Rural 5% (24) 15% (74) 16% (76) 43% (206) 21% (104) 484Employ: Private Sector 14% (95) 25% (165) 17% (111) 28% (187) 16% (105) 663Employ: Government 21% (26) 28% (34) 11% (13) 21% (25) 19% (23) 120Employ: Self-Employed 17% (30) 20% (35) 14% (24) 35% (62) 14% (24) 176Employ: Homemaker 5% (6) 21% (25) 12% (14) 37% (44) 25% (29) 118Employ: Student 11% (10) 29% (26) 29% (26) 17% (15) 14% (13) 91Employ: Retired 6% (30) 18% (97) 17% (93) 39% (207) 20% (108) 534Employ: Unemployed 9% (16) 16% (30) 18% (33) 30% (55) 27% (49) 182Employ: Other 4% (5) 18% (21) 18% (20) 35% (39) 25% (28) 111Military HH: Yes 11% (37) 19% (64) 13% (42) 41% (136) 16% (53) 333Military HH: No 11% (179) 22% (368) 18% (292) 30% (498) 20% (324) 1661RD/WT: Right Direction 17% (176) 30% (307) 18% (185) 14% (143) 20% (206) 1017RD/WT: Wrong Track 4% (41) 13% (124) 15% (149) 50% (491) 18% (172) 977Biden Job Approve 17% (196) 29% (326) 19% (210) 15% (169) 20% (226) 1127Biden Job Disapprove 2% (18) 11% (90) 15% (116) 57% (448) 15% (120) 792
Continued on next page

National Tracking Poll #2103129, March, 2021
181
Table POL10
Table POL10: And, would you support or oppose a plan that would automatically enroll Americans in a public health insurance option and retroac-tively charge them for this coverage if they choose not to enroll in other health insurance coverage, either from a public or private insurer?
DemographicStronglysupport
Somewhatsupport
Somewhatoppose
Stronglyoppose
Don’t know/Noopinion Total N
Registered Voters 11% (217) 22% (432) 17% (334) 32% (634) 19% (378) 1994Biden Job Strongly Approve 23% (154) 26% (174) 18% (118) 13% (89) 19% (127) 663Biden Job Somewhat Approve 9% (42) 33% (152) 20% (92) 17% (80) 21% (99) 464Biden Job Somewhat Disapprove 3% (6) 21% (48) 27% (62) 30% (68) 20% (46) 229Biden Job Strongly Disapprove 2% (12) 8% (42) 10% (54) 68% (380) 13% (74) 562Favorable of Biden 15% (176) 29% (336) 20% (224) 16% (181) 20% (226) 1143Unfavorable of Biden 3% (21) 11% (85) 13% (104) 57% (450) 16% (125) 785Very Favorable of Biden 20% (128) 29% (186) 18% (116) 13% (84) 20% (130) 644Somewhat Favorable of Biden 10% (48) 30% (150) 22% (108) 19% (97) 19% (96) 499Somewhat Unfavorable of Biden 4% (9) 18% (33) 22% (42) 32% (61) 24% (45) 190Very Unfavorable of Biden 2% (12) 9% (52) 10% (62) 65% (389) 13% (79) 595#1 Issue: Economy 11% (82) 23% (166) 17% (118) 33% (236) 16% (113) 714#1 Issue: Security 7% (22) 14% (42) 10% (31) 53% (162) 16% (48) 305#1 Issue: Health Care 15% (47) 28% (87) 16% (50) 19% (58) 21% (64) 308#1 Issue: Medicare / Social Security 6% (15) 18% (47) 22% (58) 28% (76) 26% (71) 267#1 Issue: Women’s Issues 12% (10) 28% (25) 17% (15) 23% (21) 20% (18) 88#1 Issue: Education 15% (14) 31% (27) 15% (13) 20% (18) 19% (17) 89#1 Issue: Energy 21% (19) 27% (24) 15% (13) 17% (15) 21% (19) 89#1 Issue: Other 6% (8) 10% (14) 26% (36) 36% (48) 21% (28) 1342020 Vote: Joe Biden 16% (170) 30% (309) 18% (190) 15% (154) 21% (213) 10372020 Vote: Donald Trump 5% (36) 10% (77) 14% (104) 57% (419) 14% (105) 7412020 Vote: Other 5% (3) 20% (12) 14% (9) 41% (25) 19% (12) 602020 Vote: Didn’t Vote 6% (8) 20% (30) 21% (31) 23% (35) 31% (48) 1532018 House Vote: Democrat 16% (121) 29% (219) 20% (152) 15% (110) 20% (146) 7482018 House Vote: Republican 6% (36) 10% (65) 14% (86) 58% (364) 12% (72) 6232018 House Vote: Someone else 12% (7) 16% (9) 10% (5) 31% (17) 31% (17) 552016 Vote: Hillary Clinton 15% (108) 29% (205) 20% (141) 15% (104) 20% (142) 7002016 Vote: Donald Trump 7% (49) 11% (79) 15% (104) 55% (394) 12% (87) 7132016 Vote: Other 6% (7) 20% (22) 21% (22) 30% (32) 23% (25) 1082016 Vote: Didn’t Vote 11% (53) 26% (123) 14% (67) 22% (102) 26% (122) 467
Continued on next page

182
Morning ConsultTable POL10
Table POL10: And, would you support or oppose a plan that would automatically enroll Americans in a public health insurance option and retroac-tively charge them for this coverage if they choose not to enroll in other health insurance coverage, either from a public or private insurer?
DemographicStronglysupport
Somewhatsupport
Somewhatoppose
Stronglyoppose
Don’t know/Noopinion Total N
Registered Voters 11% (217) 22% (432) 17% (334) 32% (634) 19% (378) 1994Voted in 2014: Yes 11% (143) 20% (255) 17% (215) 36% (464) 16% (198) 1275Voted in 2014: No 10% (74) 25% (177) 17% (119) 24% (170) 25% (179) 7194-Region: Northeast 22% (77) 23% (80) 15% (53) 22% (78) 19% (69) 3564-Region: Midwest 6% (28) 19% (85) 16% (72) 39% (178) 21% (95) 4584-Region: South 9% (64) 19% (145) 20% (149) 35% (261) 17% (127) 7444-Region: West 11% (48) 28% (121) 14% (61) 27% (118) 20% (87) 436Party: Democrat/Leans Democrat 16% (152) 30% (294) 19% (185) 15% (141) 21% (201) 973Party: Republican/Leans Republican 6% (48) 12% (93) 13% (103) 54% (417) 14% (107) 768Note: Row proportions may total to larger than one-hundred percent due to rounding. For more information visit MorningConsultIntelligence.com.

National Tracking Poll #2103129, March, 2021
183
Table POL11
Table POL11: As you may know, Republicans and Democrats in the U.S. House of Representatives have reinstated earmarks, the previously bannedpractice of including provisions in bills that direct public funds to specific recipients such as individual Congressional districts. Based on what youknow, do you support or oppose reinstating earmarks?
DemographicStronglysupport
Somewhatsupport
Somewhatoppose
Stronglyoppose
Don’t know /No opinion Total N
Registered Voters 6% (126) 13% (266) 16% (328) 27% (535) 37% (739) 1994Gender: Male 8% (73) 16% (146) 17% (160) 34% (322) 25% (232) 933Gender: Female 5% (53) 11% (119) 16% (169) 20% (213) 48% (507) 1061Age: 18-34 14% (71) 17% (86) 13% (64) 10% (49) 46% (231) 501Age: 35-44 7% (20) 20% (60) 16% (47) 20% (62) 38% (114) 303Age: 45-64 3% (21) 12% (84) 17% (121) 33% (240) 36% (259) 726Age: 65+ 3% (14) 8% (36) 21% (96) 40% (184) 29% (134) 464GenZers: 1997-2012 10% (16) 22% (37) 13% (22) 6% (10) 49% (82) 168Millennials: 1981-1996 13% (71) 18% (101) 13% (72) 15% (82) 41% (225) 551GenXers: 1965-1980 4% (17) 12% (49) 17% (71) 27% (114) 41% (174) 424Baby Boomers: 1946-1964 3% (21) 9% (72) 20% (158) 38% (297) 30% (236) 784PID: Dem (no lean) 8% (69) 19% (159) 17% (139) 14% (112) 41% (337) 817PID: Ind (no lean) 3% (16) 9% (49) 16% (87) 31% (166) 41% (223) 542PID: Rep (no lean) 6% (40) 9% (57) 16% (102) 40% (257) 28% (178) 635PID/Gender: DemMen 12% (41) 25% (87) 19% (66) 17% (60) 27% (96) 350PID/Gender: DemWomen 6% (29) 15% (72) 16% (73) 11% (52) 52% (241) 467PID/Gender: Ind Men 3% (9) 8% (23) 16% (46) 43% (120) 30% (83) 280PID/Gender: Ind Women 3% (8) 10% (26) 16% (41) 18% (47) 53% (140) 262PID/Gender: Rep Men 8% (24) 12% (36) 16% (48) 47% (142) 17% (53) 304PID/Gender: Rep Women 5% (16) 6% (21) 16% (54) 35% (115) 38% (125) 332Ideo: Liberal (1-3) 10% (62) 20% (124) 21% (134) 14% (88) 35% (218) 625Ideo: Moderate (4) 4% (24) 13% (76) 18% (103) 20% (114) 44% (254) 571Ideo: Conservative (5-7) 4% (29) 8% (58) 12% (84) 48% (330) 27% (184) 685Educ: < College 5% (60) 12% (153) 14% (176) 27% (339) 42% (527) 1254Educ: Bachelors degree 8% (40) 13% (61) 22% (104) 25% (119) 32% (149) 472Educ: Post-grad 10% (27) 19% (52) 18% (49) 29% (77) 24% (63) 268Income: Under 50k 5% (47) 11% (110) 15% (151) 23% (230) 46% (451) 989Income: 50k-100k 7% (39) 13% (77) 18% (107) 33% (201) 30% (178) 602Income: 100k+ 10% (40) 20% (78) 18% (70) 26% (104) 27% (110) 402Ethnicity: White 6% (93) 13% (205) 17% (280) 29% (467) 35% (569) 1613
Continued on next page

184
Morning ConsultTable POL11
Table POL11: As you may know, Republicans and Democrats in the U.S. House of Representatives have reinstated earmarks, the previously bannedpractice of including provisions in bills that direct public funds to specific recipients such as individual Congressional districts. Based on what youknow, do you support or oppose reinstating earmarks?
DemographicStronglysupport
Somewhatsupport
Somewhatoppose
Stronglyoppose
Don’t know /No opinion Total N
Registered Voters 6% (126) 13% (266) 16% (328) 27% (535) 37% (739) 1994Ethnicity: Hispanic 9% (17) 17% (32) 14% (27) 14% (27) 47% (90) 193Ethnicity: Black 10% (24) 18% (46) 14% (35) 15% (39) 43% (108) 253Ethnicity: Other 7% (9) 11% (15) 10% (13) 23% (29) 48% (62) 128All Christian 6% (66) 12% (129) 18% (186) 32% (331) 31% (324) 1036All Non-Christian 20% (23) 14% (16) 19% (22) 22% (26) 24% (28) 115Atheist 2% (1) 28% (24) 30% (26) 18% (16) 22% (20) 88Agnostic/Nothing in particular 4% (18) 13% (60) 13% (60) 22% (98) 48% (215) 450Something Else 5% (16) 12% (37) 11% (35) 21% (65) 50% (152) 305Religious Non-Protestant/Catholic 17% (23) 12% (17) 19% (26) 28% (39) 25% (35) 141Evangelical 9% (52) 13% (72) 13% (71) 31% (170) 33% (183) 547Non-Evangelical 4% (28) 11% (84) 19% (144) 28% (209) 37% (278) 742Community: Urban 15% (86) 17% (98) 17% (99) 18% (107) 33% (196) 586Community: Suburban 3% (30) 13% (121) 17% (156) 29% (263) 38% (353) 924Community: Rural 2% (10) 10% (47) 15% (73) 34% (164) 39% (190) 484Employ: Private Sector 8% (54) 19% (124) 16% (106) 22% (147) 35% (231) 663Employ: Government 10% (12) 13% (16) 23% (28) 22% (26) 32% (38) 120Employ: Self-Employed 13% (23) 19% (34) 14% (25) 29% (50) 25% (44) 176Employ: Homemaker 2% (2) 6% (8) 12% (14) 24% (28) 56% (66) 118Employ: Student 9% (8) 21% (19) 12% (11) 6% (5) 52% (48) 91Employ: Retired 2% (13) 9% (50) 19% (102) 39% (208) 30% (162) 534Employ: Unemployed 6% (11) 3% (6) 14% (26) 23% (41) 54% (98) 182Employ: Other 2% (3) 8% (9) 16% (17) 26% (29) 48% (53) 111Military HH: Yes 8% (26) 9% (30) 14% (48) 41% (136) 28% (93) 333Military HH: No 6% (100) 14% (236) 17% (280) 24% (399) 39% (646) 1661RD/WT: Right Direction 10% (101) 20% (202) 18% (184) 16% (163) 36% (367) 1017RD/WT: Wrong Track 3% (25) 7% (64) 15% (145) 38% (372) 38% (372) 977Biden Job Approve 9% (106) 18% (204) 18% (203) 16% (178) 39% (436) 1127Biden Job Disapprove 2% (18) 8% (61) 15% (118) 44% (348) 31% (247) 792
Continued on next page
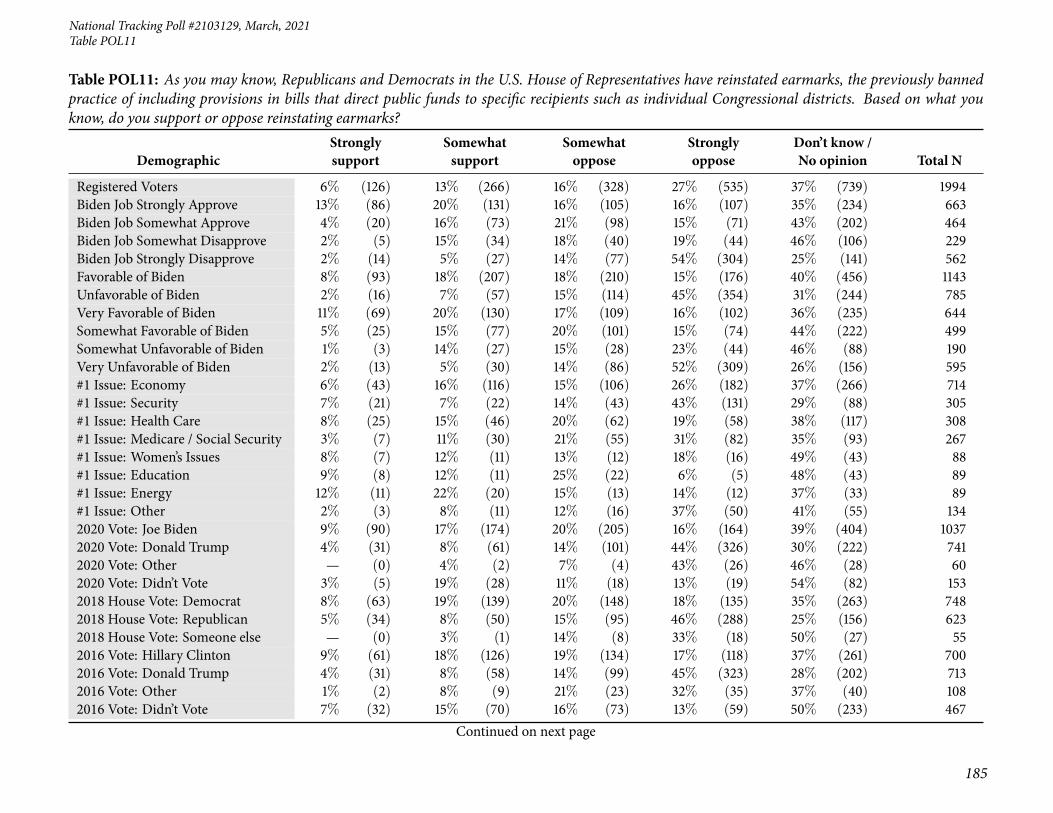
National Tracking Poll #2103129, March, 2021
185
Table POL11
Table POL11: As you may know, Republicans and Democrats in the U.S. House of Representatives have reinstated earmarks, the previously bannedpractice of including provisions in bills that direct public funds to specific recipients such as individual Congressional districts. Based on what youknow, do you support or oppose reinstating earmarks?
DemographicStronglysupport
Somewhatsupport
Somewhatoppose
Stronglyoppose
Don’t know /No opinion Total N
Registered Voters 6% (126) 13% (266) 16% (328) 27% (535) 37% (739) 1994Biden Job Strongly Approve 13% (86) 20% (131) 16% (105) 16% (107) 35% (234) 663Biden Job Somewhat Approve 4% (20) 16% (73) 21% (98) 15% (71) 43% (202) 464Biden Job Somewhat Disapprove 2% (5) 15% (34) 18% (40) 19% (44) 46% (106) 229Biden Job Strongly Disapprove 2% (14) 5% (27) 14% (77) 54% (304) 25% (141) 562Favorable of Biden 8% (93) 18% (207) 18% (210) 15% (176) 40% (456) 1143Unfavorable of Biden 2% (16) 7% (57) 15% (114) 45% (354) 31% (244) 785Very Favorable of Biden 11% (69) 20% (130) 17% (109) 16% (102) 36% (235) 644Somewhat Favorable of Biden 5% (25) 15% (77) 20% (101) 15% (74) 44% (222) 499Somewhat Unfavorable of Biden 1% (3) 14% (27) 15% (28) 23% (44) 46% (88) 190Very Unfavorable of Biden 2% (13) 5% (30) 14% (86) 52% (309) 26% (156) 595#1 Issue: Economy 6% (43) 16% (116) 15% (106) 26% (182) 37% (266) 714#1 Issue: Security 7% (21) 7% (22) 14% (43) 43% (131) 29% (88) 305#1 Issue: Health Care 8% (25) 15% (46) 20% (62) 19% (58) 38% (117) 308#1 Issue: Medicare / Social Security 3% (7) 11% (30) 21% (55) 31% (82) 35% (93) 267#1 Issue: Women’s Issues 8% (7) 12% (11) 13% (12) 18% (16) 49% (43) 88#1 Issue: Education 9% (8) 12% (11) 25% (22) 6% (5) 48% (43) 89#1 Issue: Energy 12% (11) 22% (20) 15% (13) 14% (12) 37% (33) 89#1 Issue: Other 2% (3) 8% (11) 12% (16) 37% (50) 41% (55) 1342020 Vote: Joe Biden 9% (90) 17% (174) 20% (205) 16% (164) 39% (404) 10372020 Vote: Donald Trump 4% (31) 8% (61) 14% (101) 44% (326) 30% (222) 7412020 Vote: Other — (0) 4% (2) 7% (4) 43% (26) 46% (28) 602020 Vote: Didn’t Vote 3% (5) 19% (28) 11% (18) 13% (19) 54% (82) 1532018 House Vote: Democrat 8% (63) 19% (139) 20% (148) 18% (135) 35% (263) 7482018 House Vote: Republican 5% (34) 8% (50) 15% (95) 46% (288) 25% (156) 6232018 House Vote: Someone else — (0) 3% (1) 14% (8) 33% (18) 50% (27) 552016 Vote: Hillary Clinton 9% (61) 18% (126) 19% (134) 17% (118) 37% (261) 7002016 Vote: Donald Trump 4% (31) 8% (58) 14% (99) 45% (323) 28% (202) 7132016 Vote: Other 1% (2) 8% (9) 21% (23) 32% (35) 37% (40) 1082016 Vote: Didn’t Vote 7% (32) 15% (70) 16% (73) 13% (59) 50% (233) 467
Continued on next page

186
Morning ConsultTable POL11
Table POL11: As you may know, Republicans and Democrats in the U.S. House of Representatives have reinstated earmarks, the previously bannedpractice of including provisions in bills that direct public funds to specific recipients such as individual Congressional districts. Based on what youknow, do you support or oppose reinstating earmarks?
DemographicStronglysupport
Somewhatsupport
Somewhatoppose
Stronglyoppose
Don’t know /No opinion Total N
Registered Voters 6% (126) 13% (266) 16% (328) 27% (535) 37% (739) 1994Voted in 2014: Yes 7% (85) 12% (159) 18% (228) 33% (426) 30% (376) 1275Voted in 2014: No 6% (41) 15% (106) 14% (100) 15% (109) 50% (363) 7194-Region: Northeast 11% (38) 14% (52) 16% (55) 26% (92) 33% (118) 3564-Region: Midwest 3% (15) 14% (64) 17% (77) 27% (125) 39% (178) 4584-Region: South 5% (40) 11% (85) 16% (120) 29% (216) 38% (283) 7444-Region: West 8% (33) 15% (65) 17% (76) 23% (102) 37% (160) 436Party: Democrat/Leans Democrat 8% (77) 19% (185) 18% (176) 15% (141) 40% (393) 973Party: Republican/Leans Republican 5% (42) 9% (67) 15% (116) 41% (312) 30% (231) 768Note: Row proportions may total to larger than one-hundred percent due to rounding. For more information visit MorningConsultIntelligence.com.

National Tracking Poll #2103129, March, 2021
187
Table POL12
Table POL12: Do you believe the president of the United States has a responsibility to condemn bigotry and discrimination that happens in thiscountry?
Demographic Yes, definitely Yes, probablyNo, probably
notNo, definitely
notDon’t know /No opinion Total N
Registered Voters 52% (1047) 23% (460) 9% (170) 6% (121) 10% (196) 1994Gender: Male 52% (482) 25% (232) 9% (80) 7% (62) 8% (78) 933Gender: Female 53% (565) 22% (229) 8% (90) 6% (58) 11% (119) 1061Age: 18-34 51% (258) 23% (114) 8% (39) 5% (25) 13% (64) 501Age: 35-44 43% (132) 26% (77) 10% (30) 9% (27) 12% (37) 303Age: 45-64 54% (392) 20% (148) 9% (68) 6% (46) 10% (72) 726Age: 65+ 57% (265) 26% (121) 7% (33) 5% (22) 5% (23) 464GenZers: 1997-2012 53% (89) 28% (47) 6% (11) 2% (3) 11% (18) 168Millennials: 1981-1996 47% (257) 23% (127) 9% (52) 7% (40) 14% (75) 551GenXers: 1965-1980 52% (222) 20% (85) 8% (32) 8% (34) 12% (51) 424Baby Boomers: 1946-1964 56% (438) 24% (186) 9% (70) 5% (43) 6% (48) 784PID: Dem (no lean) 67% (551) 17% (141) 5% (42) 2% (14) 8% (68) 817PID: Ind (no lean) 48% (260) 26% (140) 9% (51) 6% (35) 10% (56) 542PID: Rep (no lean) 37% (236) 28% (179) 12% (77) 11% (72) 11% (72) 635PID/Gender: DemMen 67% (235) 18% (62) 5% (16) 2% (7) 9% (30) 350PID/Gender: DemWomen 68% (316) 17% (79) 6% (26) 1% (7) 8% (38) 467PID/Gender: Ind Men 46% (128) 28% (78) 8% (22) 8% (22) 10% (28) 280PID/Gender: Ind Women 50% (132) 23% (62) 11% (28) 5% (13) 11% (28) 262PID/Gender: Rep Men 39% (118) 30% (91) 14% (42) 11% (33) 6% (19) 304PID/Gender: Rep Women 35% (117) 26% (88) 11% (35) 12% (39) 16% (53) 332Ideo: Liberal (1-3) 75% (469) 17% (105) 5% (29) 1% (9) 2% (14) 625Ideo: Moderate (4) 50% (285) 26% (148) 8% (48) 5% (29) 11% (61) 571Ideo: Conservative (5-7) 38% (257) 28% (195) 13% (87) 11% (78) 10% (68) 685Educ: < College 49% (609) 24% (298) 9% (119) 6% (80) 12% (149) 1254Educ: Bachelors degree 57% (269) 23% (111) 8% (37) 5% (23) 7% (31) 472Educ: Post-grad 63% (169) 19% (52) 5% (14) 7% (18) 6% (16) 268Income: Under 50k 52% (516) 21% (211) 9% (90) 5% (51) 12% (122) 989Income: 50k-100k 54% (325) 24% (144) 8% (49) 8% (46) 6% (39) 602Income: 100k+ 51% (206) 26% (105) 8% (31) 6% (24) 9% (35) 402Ethnicity: White 51% (818) 24% (392) 9% (153) 7% (109) 9% (141) 1613Ethnicity: Hispanic 52% (101) 19% (36) 11% (22) 8% (16) 9% (18) 193
Continued on next page

188
Morning ConsultTable POL12
Table POL12: Do you believe the president of the United States has a responsibility to condemn bigotry and discrimination that happens in thiscountry?
Demographic Yes, definitely Yes, probablyNo, probably
notNo, definitely
notDon’t know /No opinion Total N
Registered Voters 52% (1047) 23% (460) 9% (170) 6% (121) 10% (196) 1994Ethnicity: Black 61% (155) 18% (45) 5% (11) 3% (7) 14% (35) 253Ethnicity: Other 57% (73) 19% (24) 4% (5) 4% (5) 16% (20) 128All Christian 50% (514) 27% (275) 10% (103) 7% (77) 6% (67) 1036All Non-Christian 68% (78) 19% (22) 3% (4) 1% (1) 8% (10) 115Atheist 69% (60) 12% (11) 12% (11) 2% (2) 5% (4) 88Agnostic/Nothing in particular 55% (248) 18% (83) 5% (22) 4% (16) 18% (80) 450Something Else 48% (146) 23% (69) 10% (30) 8% (25) 11% (34) 305Religious Non-Protestant/Catholic 65% (92) 21% (29) 5% (7) 2% (2) 7% (10) 141Evangelical 43% (237) 28% (152) 12% (64) 8% (42) 10% (53) 547Non-Evangelical 55% (407) 23% (174) 8% (57) 8% (57) 6% (47) 742Community: Urban 61% (360) 19% (113) 7% (40) 4% (21) 9% (52) 586Community: Suburban 51% (474) 25% (229) 9% (85) 6% (51) 9% (85) 924Community: Rural 44% (213) 24% (118) 9% (45) 10% (49) 12% (59) 484Employ: Private Sector 50% (334) 23% (150) 11% (72) 6% (42) 10% (64) 663Employ: Government 55% (66) 24% (29) 9% (10) 5% (7) 7% (8) 120Employ: Self-Employed 52% (91) 23% (41) 11% (18) 10% (17) 5% (9) 176Employ: Homemaker 37% (43) 23% (27) 12% (14) 10% (11) 19% (22) 118Employ: Student 59% (54) 26% (24) 6% (6) 1% (1) 8% (7) 91Employ: Retired 58% (311) 23% (126) 7% (38) 4% (23) 7% (37) 534Employ: Unemployed 50% (91) 24% (44) 4% (7) 8% (15) 13% (24) 182Employ: Other 51% (57) 18% (20) 4% (5) 5% (6) 22% (24) 111Military HH: Yes 54% (181) 22% (72) 9% (30) 7% (22) 9% (29) 333Military HH: No 52% (866) 23% (389) 8% (140) 6% (99) 10% (168) 1661RD/WT: Right Direction 64% (652) 19% (198) 6% (58) 2% (22) 9% (87) 1017RD/WT: Wrong Track 40% (395) 27% (262) 11% (112) 10% (99) 11% (109) 977Biden Job Approve 68% (764) 17% (196) 5% (61) 2% (19) 8% (88) 1127Biden Job Disapprove 33% (263) 31% (242) 13% (102) 13% (101) 11% (84) 792
Continued on next page
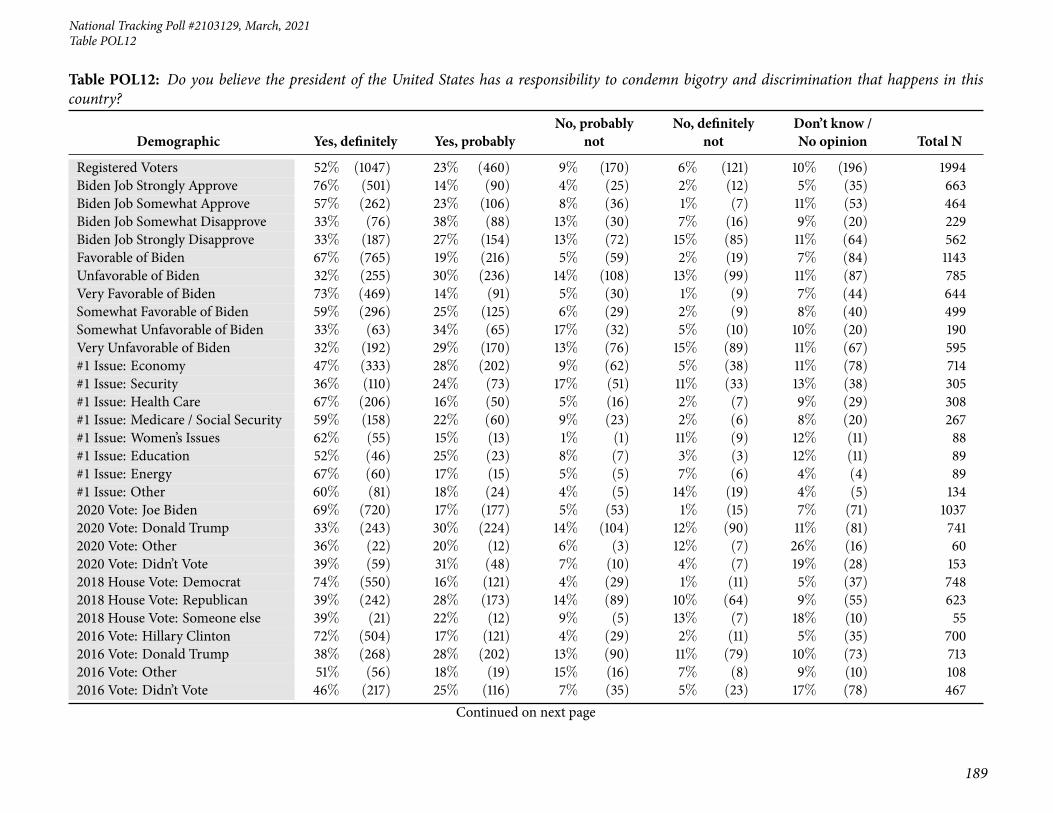
National Tracking Poll #2103129, March, 2021
189
Table POL12
Table POL12: Do you believe the president of the United States has a responsibility to condemn bigotry and discrimination that happens in thiscountry?
Demographic Yes, definitely Yes, probablyNo, probably
notNo, definitely
notDon’t know /No opinion Total N
Registered Voters 52% (1047) 23% (460) 9% (170) 6% (121) 10% (196) 1994Biden Job Strongly Approve 76% (501) 14% (90) 4% (25) 2% (12) 5% (35) 663Biden Job Somewhat Approve 57% (262) 23% (106) 8% (36) 1% (7) 11% (53) 464Biden Job Somewhat Disapprove 33% (76) 38% (88) 13% (30) 7% (16) 9% (20) 229Biden Job Strongly Disapprove 33% (187) 27% (154) 13% (72) 15% (85) 11% (64) 562Favorable of Biden 67% (765) 19% (216) 5% (59) 2% (19) 7% (84) 1143Unfavorable of Biden 32% (255) 30% (236) 14% (108) 13% (99) 11% (87) 785Very Favorable of Biden 73% (469) 14% (91) 5% (30) 1% (9) 7% (44) 644Somewhat Favorable of Biden 59% (296) 25% (125) 6% (29) 2% (9) 8% (40) 499Somewhat Unfavorable of Biden 33% (63) 34% (65) 17% (32) 5% (10) 10% (20) 190Very Unfavorable of Biden 32% (192) 29% (170) 13% (76) 15% (89) 11% (67) 595#1 Issue: Economy 47% (333) 28% (202) 9% (62) 5% (38) 11% (78) 714#1 Issue: Security 36% (110) 24% (73) 17% (51) 11% (33) 13% (38) 305#1 Issue: Health Care 67% (206) 16% (50) 5% (16) 2% (7) 9% (29) 308#1 Issue: Medicare / Social Security 59% (158) 22% (60) 9% (23) 2% (6) 8% (20) 267#1 Issue: Women’s Issues 62% (55) 15% (13) 1% (1) 11% (9) 12% (11) 88#1 Issue: Education 52% (46) 25% (23) 8% (7) 3% (3) 12% (11) 89#1 Issue: Energy 67% (60) 17% (15) 5% (5) 7% (6) 4% (4) 89#1 Issue: Other 60% (81) 18% (24) 4% (5) 14% (19) 4% (5) 1342020 Vote: Joe Biden 69% (720) 17% (177) 5% (53) 1% (15) 7% (71) 10372020 Vote: Donald Trump 33% (243) 30% (224) 14% (104) 12% (90) 11% (81) 7412020 Vote: Other 36% (22) 20% (12) 6% (3) 12% (7) 26% (16) 602020 Vote: Didn’t Vote 39% (59) 31% (48) 7% (10) 4% (7) 19% (28) 1532018 House Vote: Democrat 74% (550) 16% (121) 4% (29) 1% (11) 5% (37) 7482018 House Vote: Republican 39% (242) 28% (173) 14% (89) 10% (64) 9% (55) 6232018 House Vote: Someone else 39% (21) 22% (12) 9% (5) 13% (7) 18% (10) 552016 Vote: Hillary Clinton 72% (504) 17% (121) 4% (29) 2% (11) 5% (35) 7002016 Vote: Donald Trump 38% (268) 28% (202) 13% (90) 11% (79) 10% (73) 7132016 Vote: Other 51% (56) 18% (19) 15% (16) 7% (8) 9% (10) 1082016 Vote: Didn’t Vote 46% (217) 25% (116) 7% (35) 5% (23) 17% (78) 467
Continued on next page

190
Morning ConsultTable POL12
Table POL12: Do you believe the president of the United States has a responsibility to condemn bigotry and discrimination that happens in thiscountry?
Demographic Yes, definitely Yes, probablyNo, probably
notNo, definitely
notDon’t know /No opinion Total N
Registered Voters 52% (1047) 23% (460) 9% (170) 6% (121) 10% (196) 1994Voted in 2014: Yes 57% (722) 22% (276) 9% (120) 6% (75) 6% (82) 1275Voted in 2014: No 45% (325) 26% (184) 7% (50) 6% (46) 16% (114) 7194-Region: Northeast 58% (205) 20% (72) 8% (30) 5% (17) 9% (31) 3564-Region: Midwest 45% (206) 28% (128) 8% (39) 9% (39) 10% (45) 4584-Region: South 51% (381) 23% (173) 10% (75) 7% (49) 9% (67) 7444-Region: West 58% (254) 20% (87) 6% (26) 4% (16) 12% (52) 436Party: Democrat/Leans Democrat 68% (664) 17% (169) 5% (50) 2% (17) 8% (73) 973Party: Republican/Leans Republican 36% (273) 29% (223) 13% (103) 11% (84) 11% (85) 768Note: Row proportions may total to larger than one-hundred percent due to rounding. For more information visit MorningConsultIntelligence.com.
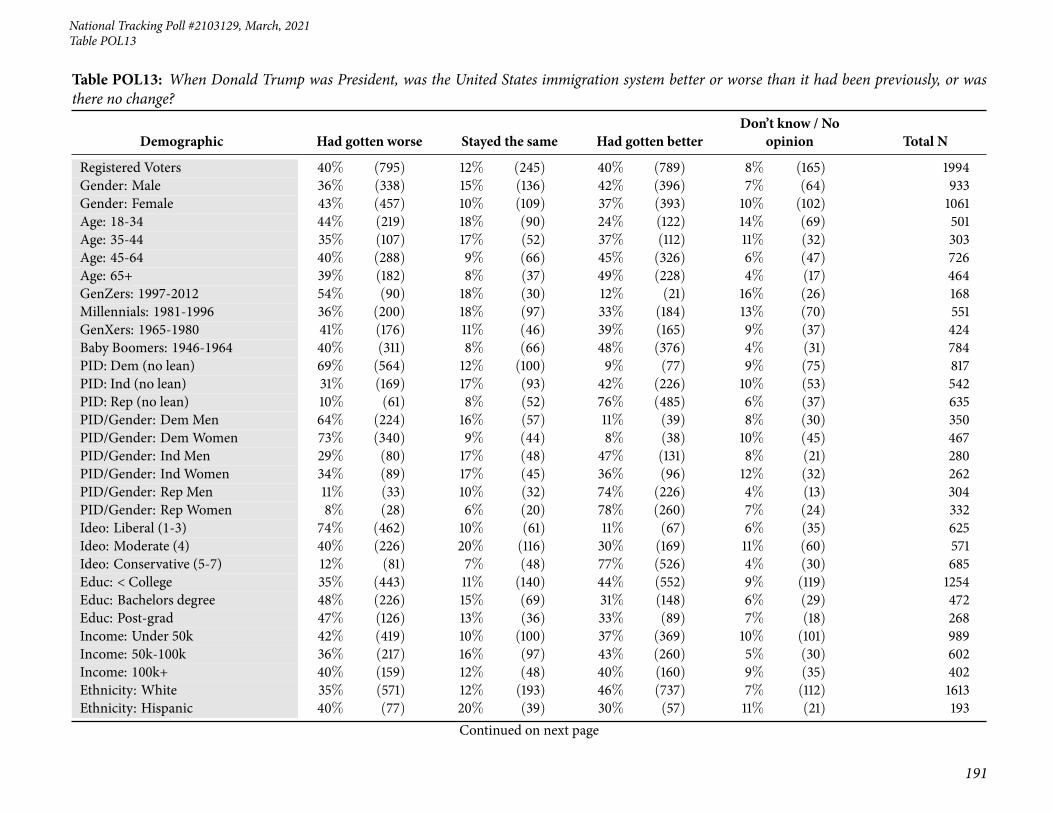
National Tracking Poll #2103129, March, 2021
191
Table POL13
Table POL13: When Donald Trump was President, was the United States immigration system better or worse than it had been previously, or wasthere no change?
Demographic Had gotten worse Stayed the same Had gotten betterDon’t know / No
opinion Total N
Registered Voters 40% (795) 12% (245) 40% (789) 8% (165) 1994Gender: Male 36% (338) 15% (136) 42% (396) 7% (64) 933Gender: Female 43% (457) 10% (109) 37% (393) 10% (102) 1061Age: 18-34 44% (219) 18% (90) 24% (122) 14% (69) 501Age: 35-44 35% (107) 17% (52) 37% (112) 11% (32) 303Age: 45-64 40% (288) 9% (66) 45% (326) 6% (47) 726Age: 65+ 39% (182) 8% (37) 49% (228) 4% (17) 464GenZers: 1997-2012 54% (90) 18% (30) 12% (21) 16% (26) 168Millennials: 1981-1996 36% (200) 18% (97) 33% (184) 13% (70) 551GenXers: 1965-1980 41% (176) 11% (46) 39% (165) 9% (37) 424Baby Boomers: 1946-1964 40% (311) 8% (66) 48% (376) 4% (31) 784PID: Dem (no lean) 69% (564) 12% (100) 9% (77) 9% (75) 817PID: Ind (no lean) 31% (169) 17% (93) 42% (226) 10% (53) 542PID: Rep (no lean) 10% (61) 8% (52) 76% (485) 6% (37) 635PID/Gender: DemMen 64% (224) 16% (57) 11% (39) 8% (30) 350PID/Gender: DemWomen 73% (340) 9% (44) 8% (38) 10% (45) 467PID/Gender: Ind Men 29% (80) 17% (48) 47% (131) 8% (21) 280PID/Gender: Ind Women 34% (89) 17% (45) 36% (96) 12% (32) 262PID/Gender: Rep Men 11% (33) 10% (32) 74% (226) 4% (13) 304PID/Gender: Rep Women 8% (28) 6% (20) 78% (260) 7% (24) 332Ideo: Liberal (1-3) 74% (462) 10% (61) 11% (67) 6% (35) 625Ideo: Moderate (4) 40% (226) 20% (116) 30% (169) 11% (60) 571Ideo: Conservative (5-7) 12% (81) 7% (48) 77% (526) 4% (30) 685Educ: < College 35% (443) 11% (140) 44% (552) 9% (119) 1254Educ: Bachelors degree 48% (226) 15% (69) 31% (148) 6% (29) 472Educ: Post-grad 47% (126) 13% (36) 33% (89) 7% (18) 268Income: Under 50k 42% (419) 10% (100) 37% (369) 10% (101) 989Income: 50k-100k 36% (217) 16% (97) 43% (260) 5% (30) 602Income: 100k+ 40% (159) 12% (48) 40% (160) 9% (35) 402Ethnicity: White 35% (571) 12% (193) 46% (737) 7% (112) 1613Ethnicity: Hispanic 40% (77) 20% (39) 30% (57) 11% (21) 193
Continued on next page
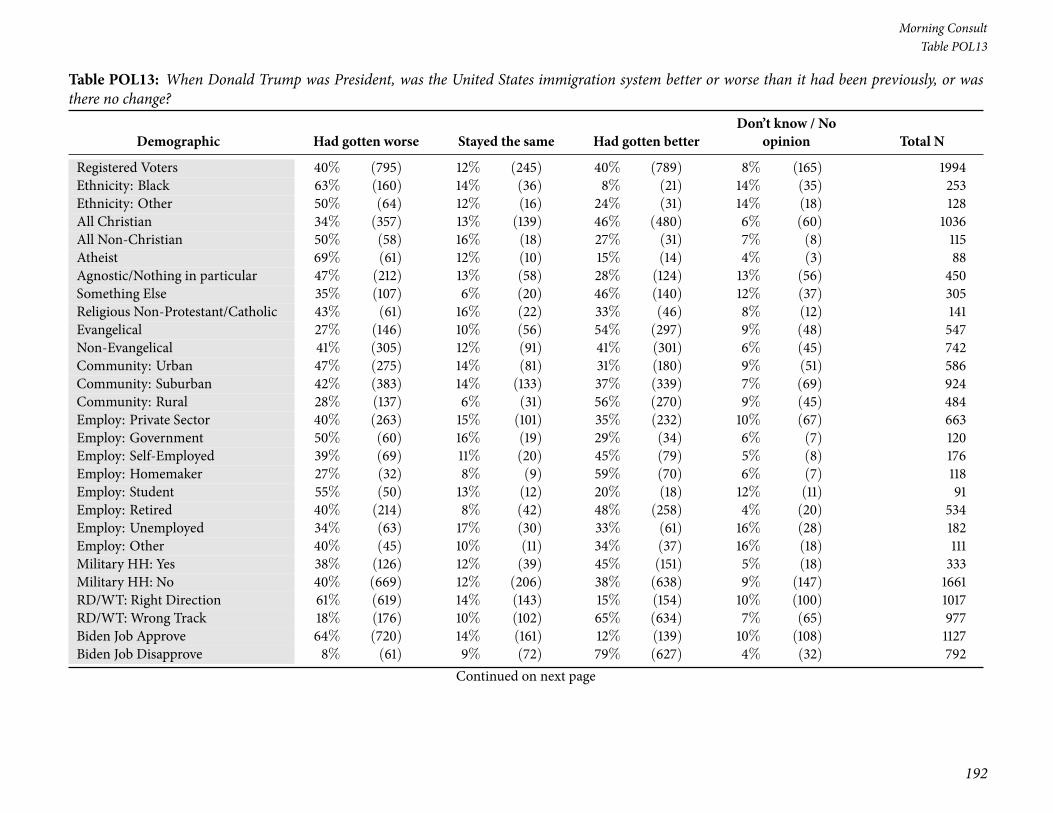
192
Morning ConsultTable POL13
Table POL13: When Donald Trump was President, was the United States immigration system better or worse than it had been previously, or wasthere no change?
Demographic Had gotten worse Stayed the same Had gotten betterDon’t know / No
opinion Total N
Registered Voters 40% (795) 12% (245) 40% (789) 8% (165) 1994Ethnicity: Black 63% (160) 14% (36) 8% (21) 14% (35) 253Ethnicity: Other 50% (64) 12% (16) 24% (31) 14% (18) 128All Christian 34% (357) 13% (139) 46% (480) 6% (60) 1036All Non-Christian 50% (58) 16% (18) 27% (31) 7% (8) 115Atheist 69% (61) 12% (10) 15% (14) 4% (3) 88Agnostic/Nothing in particular 47% (212) 13% (58) 28% (124) 13% (56) 450Something Else 35% (107) 6% (20) 46% (140) 12% (37) 305Religious Non-Protestant/Catholic 43% (61) 16% (22) 33% (46) 8% (12) 141Evangelical 27% (146) 10% (56) 54% (297) 9% (48) 547Non-Evangelical 41% (305) 12% (91) 41% (301) 6% (45) 742Community: Urban 47% (275) 14% (81) 31% (180) 9% (51) 586Community: Suburban 42% (383) 14% (133) 37% (339) 7% (69) 924Community: Rural 28% (137) 6% (31) 56% (270) 9% (45) 484Employ: Private Sector 40% (263) 15% (101) 35% (232) 10% (67) 663Employ: Government 50% (60) 16% (19) 29% (34) 6% (7) 120Employ: Self-Employed 39% (69) 11% (20) 45% (79) 5% (8) 176Employ: Homemaker 27% (32) 8% (9) 59% (70) 6% (7) 118Employ: Student 55% (50) 13% (12) 20% (18) 12% (11) 91Employ: Retired 40% (214) 8% (42) 48% (258) 4% (20) 534Employ: Unemployed 34% (63) 17% (30) 33% (61) 16% (28) 182Employ: Other 40% (45) 10% (11) 34% (37) 16% (18) 111Military HH: Yes 38% (126) 12% (39) 45% (151) 5% (18) 333Military HH: No 40% (669) 12% (206) 38% (638) 9% (147) 1661RD/WT: Right Direction 61% (619) 14% (143) 15% (154) 10% (100) 1017RD/WT: Wrong Track 18% (176) 10% (102) 65% (634) 7% (65) 977Biden Job Approve 64% (720) 14% (161) 12% (139) 10% (108) 1127Biden Job Disapprove 8% (61) 9% (72) 79% (627) 4% (32) 792
Continued on next page

National Tracking Poll #2103129, March, 2021
193
Table POL13
Table POL13: When Donald Trump was President, was the United States immigration system better or worse than it had been previously, or wasthere no change?
Demographic Had gotten worse Stayed the same Had gotten betterDon’t know / No
opinion Total N
Registered Voters 40% (795) 12% (245) 40% (789) 8% (165) 1994Biden Job Strongly Approve 72% (477) 10% (63) 12% (78) 7% (45) 663Biden Job Somewhat Approve 52% (243) 21% (98) 13% (60) 14% (63) 464Biden Job Somewhat Disapprove 17% (38) 21% (48) 55% (125) 8% (17) 229Biden Job Strongly Disapprove 4% (23) 4% (24) 89% (501) 3% (14) 562Favorable of Biden 64% (729) 15% (169) 12% (143) 9% (102) 1143Unfavorable of Biden 6% (45) 9% (72) 81% (633) 4% (34) 785Very Favorable of Biden 73% (471) 10% (66) 9% (60) 7% (48) 644Somewhat Favorable of Biden 52% (258) 21% (103) 17% (83) 11% (54) 499Somewhat Unfavorable of Biden 14% (27) 17% (33) 57% (108) 12% (22) 190Very Unfavorable of Biden 3% (18) 7% (40) 88% (525) 2% (12) 595#1 Issue: Economy 33% (235) 15% (109) 43% (304) 9% (65) 714#1 Issue: Security 14% (44) 8% (24) 75% (230) 2% (7) 305#1 Issue: Health Care 61% (186) 15% (47) 17% (52) 7% (22) 308#1 Issue: Medicare / Social Security 46% (124) 8% (20) 40% (106) 6% (17) 267#1 Issue: Women’s Issues 52% (46) 12% (10) 22% (19) 15% (13) 88#1 Issue: Education 42% (38) 23% (20) 13% (12) 22% (20) 89#1 Issue: Energy 61% (55) 11% (10) 20% (18) 8% (7) 89#1 Issue: Other 50% (67) 3% (4) 37% (49) 10% (14) 1342020 Vote: Joe Biden 68% (710) 14% (142) 9% (98) 8% (87) 10372020 Vote: Donald Trump 4% (32) 7% (53) 84% (624) 4% (32) 7412020 Vote: Other 11% (7) 26% (16) 36% (22) 26% (16) 602020 Vote: Didn’t Vote 29% (44) 23% (35) 29% (44) 20% (30) 1532018 House Vote: Democrat 71% (532) 11% (86) 11% (82) 6% (48) 7482018 House Vote: Republican 9% (54) 7% (44) 81% (502) 4% (23) 6232018 House Vote: Someone else 20% (11) 15% (8) 46% (25) 18% (10) 552016 Vote: Hillary Clinton 74% (517) 10% (72) 10% (67) 6% (43) 7002016 Vote: Donald Trump 8% (56) 9% (62) 79% (560) 5% (34) 7132016 Vote: Other 36% (39) 18% (20) 37% (40) 9% (9) 1082016 Vote: Didn’t Vote 39% (180) 19% (88) 26% (121) 17% (78) 467
Continued on next page

194
Morning ConsultTable POL13
Table POL13: When Donald Trump was President, was the United States immigration system better or worse than it had been previously, or wasthere no change?
Demographic Had gotten worse Stayed the same Had gotten betterDon’t know / No
opinion Total N
Registered Voters 40% (795) 12% (245) 40% (789) 8% (165) 1994Voted in 2014: Yes 42% (531) 9% (115) 44% (556) 6% (73) 1275Voted in 2014: No 37% (264) 18% (130) 32% (233) 13% (92) 7194-Region: Northeast 46% (163) 12% (42) 35% (125) 7% (26) 3564-Region: Midwest 35% (161) 14% (63) 44% (203) 7% (31) 4584-Region: South 37% (277) 13% (96) 41% (303) 9% (69) 7444-Region: West 44% (193) 10% (45) 36% (159) 9% (39) 436Party: Democrat/Leans Democrat 69% (668) 12% (121) 10% (101) 8% (82) 973Party: Republican/Leans Republican 9% (66) 8% (60) 77% (595) 6% (47) 768Note: Row proportions may total to larger than one-hundred percent due to rounding. For more information visit MorningConsultIntelligence.com.

National Tracking Poll #2103129, March, 2021
195
Table POL14
Table POL14: With Joe Biden as President, has the United States immigration system gotten better or worse than it had been previously, or has therebeen no change?
Demographic Has gotten worse Stayed the same Has gotten betterDon’t know / No
opinion Total N
Registered Voters 40% (807) 24% (476) 23% (453) 13% (259) 1994Gender: Male 43% (403) 23% (211) 23% (213) 11% (106) 933Gender: Female 38% (404) 25% (264) 23% (240) 14% (153) 1061Age: 18-34 21% (103) 31% (155) 28% (142) 20% (102) 501Age: 35-44 33% (100) 25% (76) 29% (88) 13% (39) 303Age: 45-64 49% (353) 22% (162) 18% (131) 11% (80) 726Age: 65+ 54% (251) 18% (83) 20% (92) 8% (38) 464GenZers: 1997-2012 12% (20) 39% (66) 24% (40) 25% (42) 168Millennials: 1981-1996 28% (152) 26% (145) 30% (165) 16% (88) 551GenXers: 1965-1980 42% (177) 24% (100) 21% (89) 14% (58) 424Baby Boomers: 1946-1964 52% (411) 20% (157) 19% (152) 8% (63) 784PID: Dem (no lean) 9% (70) 31% (252) 43% (354) 17% (142) 817PID: Ind (no lean) 44% (238) 29% (158) 12% (65) 15% (81) 542PID: Rep (no lean) 79% (499) 10% (66) 5% (34) 6% (37) 635PID/Gender: DemMen 9% (30) 30% (103) 45% (158) 17% (59) 350PID/Gender: DemWomen 9% (40) 32% (148) 42% (196) 18% (83) 467PID/Gender: Ind Men 49% (136) 26% (74) 13% (37) 12% (34) 280PID/Gender: Ind Women 39% (102) 32% (84) 11% (29) 18% (47) 262PID/Gender: Rep Men 78% (237) 11% (34) 6% (18) 5% (14) 304PID/Gender: Rep Women 79% (262) 10% (32) 5% (15) 7% (23) 332Ideo: Liberal (1-3) 10% (64) 35% (217) 42% (261) 13% (83) 625Ideo: Moderate (4) 33% (190) 28% (162) 21% (120) 17% (99) 571Ideo: Conservative (5-7) 77% (526) 9% (64) 8% (57) 6% (38) 685Educ: < College 46% (578) 22% (276) 18% (222) 14% (177) 1254Educ: Bachelors degree 32% (151) 29% (139) 28% (131) 11% (51) 472Educ: Post-grad 29% (77) 23% (60) 37% (100) 12% (31) 268Income: Under 50k 40% (391) 24% (238) 22% (215) 15% (146) 989Income: 50k-100k 46% (276) 22% (135) 20% (123) 11% (68) 602Income: 100k+ 35% (139) 26% (103) 28% (115) 11% (45) 402Ethnicity: White 46% (747) 23% (364) 20% (327) 11% (174) 1613Ethnicity: Hispanic 29% (57) 34% (66) 25% (48) 12% (23) 193
Continued on next page

196
Morning ConsultTable POL14
Table POL14: With Joe Biden as President, has the United States immigration system gotten better or worse than it had been previously, or has therebeen no change?
Demographic Has gotten worse Stayed the same Has gotten betterDon’t know / No
opinion Total N
Registered Voters 40% (807) 24% (476) 23% (453) 13% (259) 1994Ethnicity: Black 7% (19) 29% (73) 39% (100) 24% (61) 253Ethnicity: Other 31% (40) 30% (38) 20% (26) 18% (24) 128All Christian 48% (495) 22% (230) 22% (225) 8% (86) 1036All Non-Christian 21% (24) 30% (34) 36% (42) 13% (15) 115Atheist 22% (19) 29% (25) 36% (31) 14% (12) 88Agnostic/Nothing in particular 30% (134) 29% (129) 21% (93) 21% (95) 450Something Else 44% (135) 19% (57) 20% (61) 17% (51) 305Religious Non-Protestant/Catholic 27% (37) 32% (45) 30% (43) 11% (16) 141Evangelical 51% (280) 17% (91) 22% (118) 11% (58) 547Non-Evangelical 44% (330) 24% (179) 21% (156) 10% (77) 742Community: Urban 25% (149) 25% (145) 36% (210) 14% (83) 586Community: Suburban 42% (388) 25% (230) 20% (181) 14% (125) 924Community: Rural 56% (270) 21% (101) 13% (61) 11% (51) 484Employ: Private Sector 34% (224) 26% (170) 27% (181) 13% (87) 663Employ: Government 27% (33) 28% (34) 33% (40) 11% (13) 120Employ: Self-Employed 44% (77) 24% (42) 24% (42) 8% (15) 176Employ: Homemaker 54% (63) 19% (22) 17% (20) 11% (13) 118Employ: Student 11% (10) 49% (44) 20% (19) 20% (18) 91Employ: Retired 53% (282) 19% (103) 19% (100) 9% (49) 534Employ: Unemployed 42% (76) 20% (36) 15% (27) 23% (42) 182Employ: Other 37% (41) 22% (24) 21% (23) 20% (22) 111Military HH: Yes 47% (156) 19% (65) 20% (67) 14% (45) 333Military HH: No 39% (651) 25% (411) 23% (385) 13% (214) 1661RD/WT: Right Direction 13% (128) 31% (312) 40% (408) 17% (169) 1017RD/WT: Wrong Track 69% (679) 17% (163) 5% (45) 9% (90) 977Biden Job Approve 12% (131) 34% (386) 38% (427) 16% (182) 1127Biden Job Disapprove 83% (660) 9% (73) 3% (24) 4% (35) 792
Continued on next page

National Tracking Poll #2103129, March, 2021
197
Table POL14
Table POL14: With Joe Biden as President, has the United States immigration system gotten better or worse than it had been previously, or has therebeen no change?
Demographic Has gotten worse Stayed the same Has gotten betterDon’t know / No
opinion Total N
Registered Voters 40% (807) 24% (476) 23% (453) 13% (259) 1994Biden Job Strongly Approve 9% (58) 28% (184) 51% (341) 12% (81) 663Biden Job Somewhat Approve 16% (73) 44% (203) 19% (86) 22% (101) 464Biden Job Somewhat Disapprove 61% (139) 26% (60) 4% (9) 9% (22) 229Biden Job Strongly Disapprove 93% (521) 2% (14) 3% (15) 2% (13) 562Favorable of Biden 11% (127) 35% (396) 38% (432) 16% (187) 1143Unfavorable of Biden 84% (661) 9% (71) 1% (11) 5% (41) 785Very Favorable of Biden 6% (42) 26% (166) 55% (355) 13% (82) 644Somewhat Favorable of Biden 17% (85) 46% (231) 16% (78) 21% (105) 499Somewhat Unfavorable of Biden 57% (108) 25% (48) 2% (4) 16% (31) 190Very Unfavorable of Biden 93% (553) 4% (24) 1% (8) 2% (10) 595#1 Issue: Economy 43% (308) 24% (173) 22% (154) 11% (79) 714#1 Issue: Security 75% (229) 9% (27) 12% (37) 4% (12) 305#1 Issue: Health Care 20% (62) 37% (115) 29% (88) 14% (42) 308#1 Issue: Medicare / Social Security 39% (104) 21% (57) 23% (60) 17% (45) 267#1 Issue: Women’s Issues 27% (24) 31% (27) 25% (22) 17% (15) 88#1 Issue: Education 14% (12) 29% (26) 27% (24) 30% (27) 89#1 Issue: Energy 14% (13) 32% (28) 41% (37) 13% (11) 89#1 Issue: Other 40% (54) 16% (22) 23% (31) 20% (27) 1342020 Vote: Joe Biden 10% (100) 34% (352) 39% (407) 17% (178) 10372020 Vote: Donald Trump 84% (622) 8% (63) 2% (18) 5% (39) 7412020 Vote: Other 55% (33) 18% (11) 5% (3) 23% (14) 602020 Vote: Didn’t Vote 34% (51) 31% (48) 17% (25) 19% (28) 1532018 House Vote: Democrat 13% (94) 31% (228) 42% (317) 14% (108) 7482018 House Vote: Republican 81% (503) 9% (57) 5% (31) 5% (31) 6232018 House Vote: Someone else 52% (28) 27% (15) 7% (4) 14% (8) 552016 Vote: Hillary Clinton 9% (65) 31% (216) 44% (306) 16% (113) 7002016 Vote: Donald Trump 80% (568) 9% (67) 5% (38) 6% (39) 7132016 Vote: Other 43% (47) 37% (40) 10% (11) 10% (10) 1082016 Vote: Didn’t Vote 27% (126) 32% (151) 20% (94) 21% (96) 467
Continued on next page
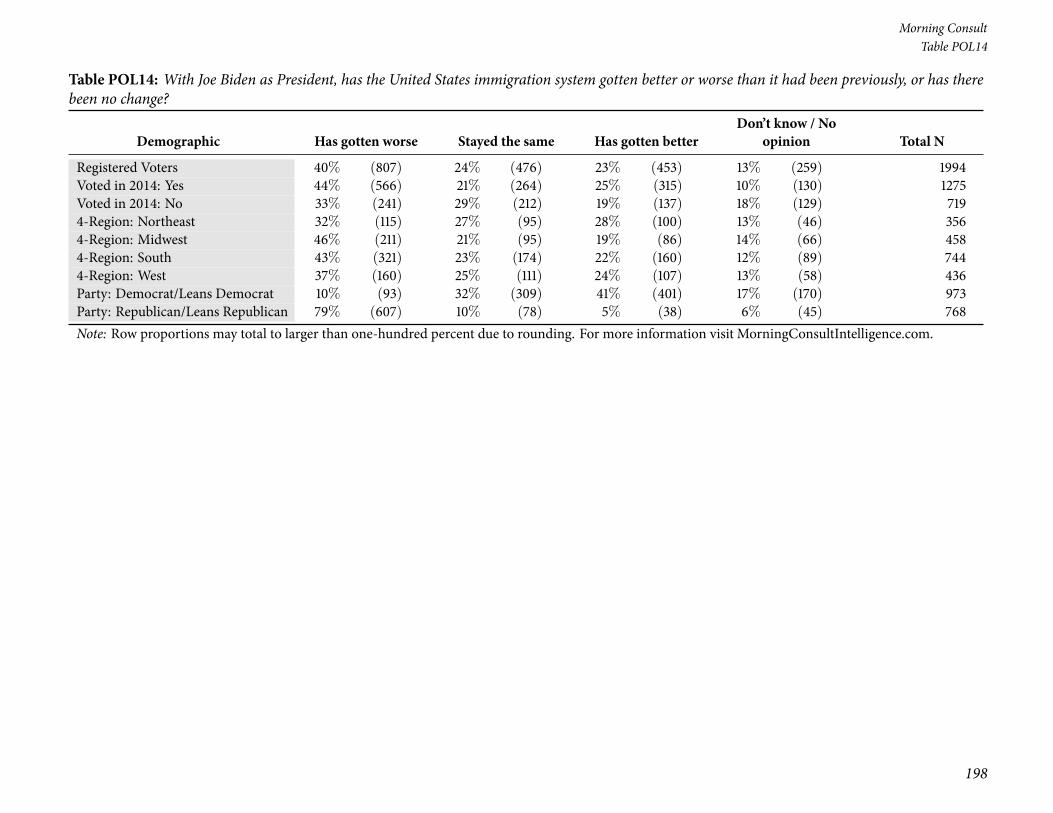
198
Morning ConsultTable POL14
Table POL14: With Joe Biden as President, has the United States immigration system gotten better or worse than it had been previously, or has therebeen no change?
Demographic Has gotten worse Stayed the same Has gotten betterDon’t know / No
opinion Total N
Registered Voters 40% (807) 24% (476) 23% (453) 13% (259) 1994Voted in 2014: Yes 44% (566) 21% (264) 25% (315) 10% (130) 1275Voted in 2014: No 33% (241) 29% (212) 19% (137) 18% (129) 7194-Region: Northeast 32% (115) 27% (95) 28% (100) 13% (46) 3564-Region: Midwest 46% (211) 21% (95) 19% (86) 14% (66) 4584-Region: South 43% (321) 23% (174) 22% (160) 12% (89) 7444-Region: West 37% (160) 25% (111) 24% (107) 13% (58) 436Party: Democrat/Leans Democrat 10% (93) 32% (309) 41% (401) 17% (170) 973Party: Republican/Leans Republican 79% (607) 10% (78) 5% (38) 6% (45) 768Note: Row proportions may total to larger than one-hundred percent due to rounding. For more information visit MorningConsultIntelligence.com.
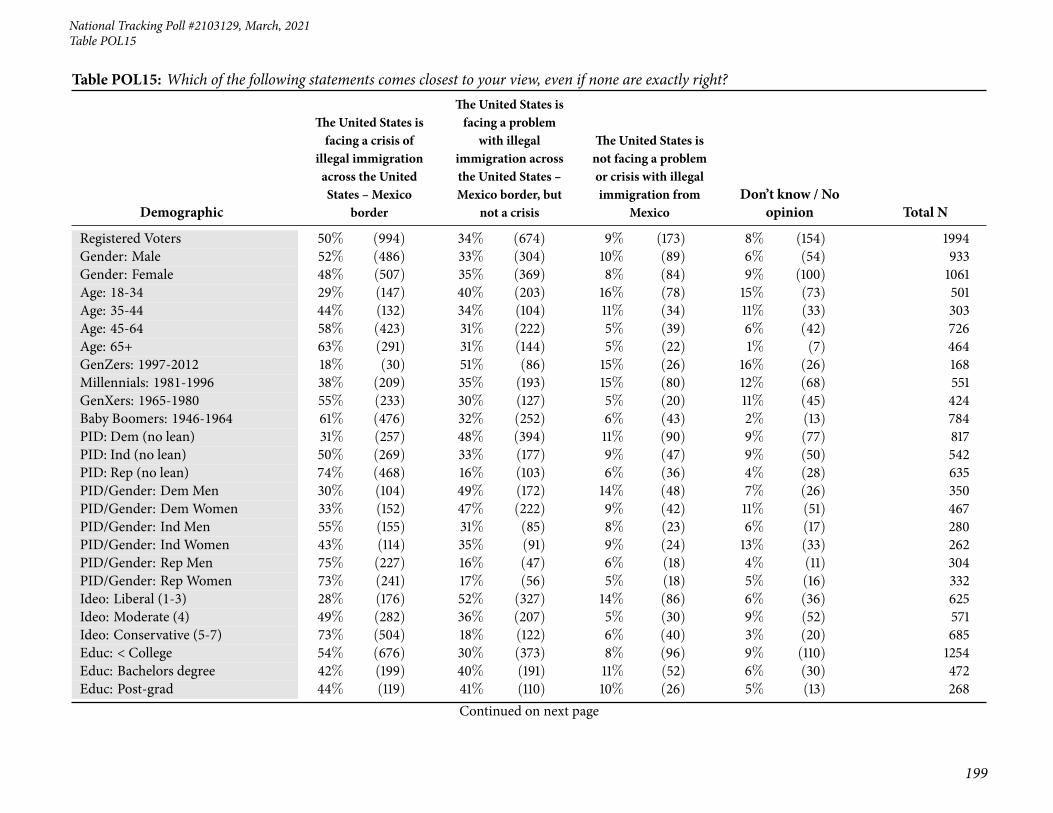
National Tracking Poll #2103129, March, 2021
199
Table POL15
Table POL15: Which of the following statements comes closest to your view, even if none are exactly right?
Demographic
TheUnited States isfacing a crisis of
illegal immigrationacross the UnitedStates – Mexico
border
The United States isfacing a problem
with illegalimmigration acrossthe United States –Mexico border, but
not a crisis
The United States isnot facing a problemor crisis with illegalimmigration from
MexicoDon’t know / No
opinion Total N
Registered Voters 50% (994) 34% (674) 9% (173) 8% (154) 1994Gender: Male 52% (486) 33% (304) 10% (89) 6% (54) 933Gender: Female 48% (507) 35% (369) 8% (84) 9% (100) 1061Age: 18-34 29% (147) 40% (203) 16% (78) 15% (73) 501Age: 35-44 44% (132) 34% (104) 11% (34) 11% (33) 303Age: 45-64 58% (423) 31% (222) 5% (39) 6% (42) 726Age: 65+ 63% (291) 31% (144) 5% (22) 1% (7) 464GenZers: 1997-2012 18% (30) 51% (86) 15% (26) 16% (26) 168Millennials: 1981-1996 38% (209) 35% (193) 15% (80) 12% (68) 551GenXers: 1965-1980 55% (233) 30% (127) 5% (20) 11% (45) 424Baby Boomers: 1946-1964 61% (476) 32% (252) 6% (43) 2% (13) 784PID: Dem (no lean) 31% (257) 48% (394) 11% (90) 9% (77) 817PID: Ind (no lean) 50% (269) 33% (177) 9% (47) 9% (50) 542PID: Rep (no lean) 74% (468) 16% (103) 6% (36) 4% (28) 635PID/Gender: DemMen 30% (104) 49% (172) 14% (48) 7% (26) 350PID/Gender: DemWomen 33% (152) 47% (222) 9% (42) 11% (51) 467PID/Gender: Ind Men 55% (155) 31% (85) 8% (23) 6% (17) 280PID/Gender: Ind Women 43% (114) 35% (91) 9% (24) 13% (33) 262PID/Gender: Rep Men 75% (227) 16% (47) 6% (18) 4% (11) 304PID/Gender: Rep Women 73% (241) 17% (56) 5% (18) 5% (16) 332Ideo: Liberal (1-3) 28% (176) 52% (327) 14% (86) 6% (36) 625Ideo: Moderate (4) 49% (282) 36% (207) 5% (30) 9% (52) 571Ideo: Conservative (5-7) 73% (504) 18% (122) 6% (40) 3% (20) 685Educ: < College 54% (676) 30% (373) 8% (96) 9% (110) 1254Educ: Bachelors degree 42% (199) 40% (191) 11% (52) 6% (30) 472Educ: Post-grad 44% (119) 41% (110) 10% (26) 5% (13) 268
Continued on next page
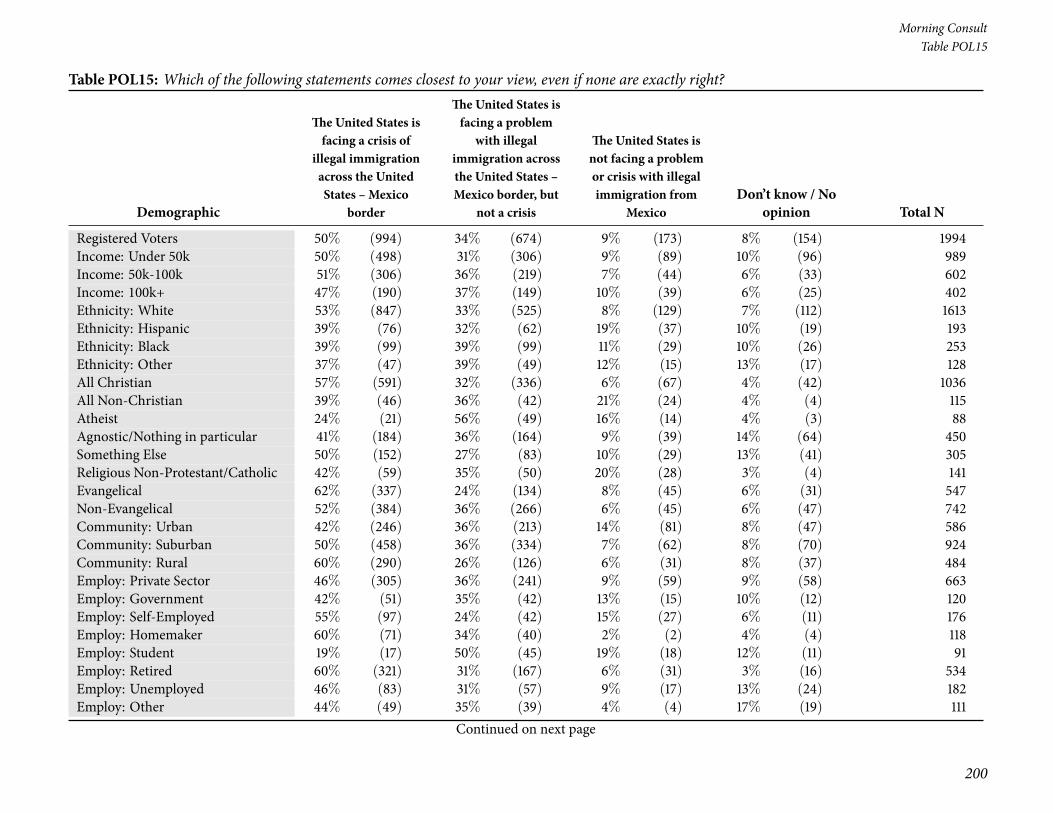
200
Morning ConsultTable POL15
Table POL15: Which of the following statements comes closest to your view, even if none are exactly right?
Demographic
TheUnited States isfacing a crisis of
illegal immigrationacross the UnitedStates – Mexico
border
The United States isfacing a problem
with illegalimmigration acrossthe United States –Mexico border, but
not a crisis
The United States isnot facing a problemor crisis with illegalimmigration from
MexicoDon’t know / No
opinion Total N
Registered Voters 50% (994) 34% (674) 9% (173) 8% (154) 1994Income: Under 50k 50% (498) 31% (306) 9% (89) 10% (96) 989Income: 50k-100k 51% (306) 36% (219) 7% (44) 6% (33) 602Income: 100k+ 47% (190) 37% (149) 10% (39) 6% (25) 402Ethnicity: White 53% (847) 33% (525) 8% (129) 7% (112) 1613Ethnicity: Hispanic 39% (76) 32% (62) 19% (37) 10% (19) 193Ethnicity: Black 39% (99) 39% (99) 11% (29) 10% (26) 253Ethnicity: Other 37% (47) 39% (49) 12% (15) 13% (17) 128All Christian 57% (591) 32% (336) 6% (67) 4% (42) 1036All Non-Christian 39% (46) 36% (42) 21% (24) 4% (4) 115Atheist 24% (21) 56% (49) 16% (14) 4% (3) 88Agnostic/Nothing in particular 41% (184) 36% (164) 9% (39) 14% (64) 450Something Else 50% (152) 27% (83) 10% (29) 13% (41) 305Religious Non-Protestant/Catholic 42% (59) 35% (50) 20% (28) 3% (4) 141Evangelical 62% (337) 24% (134) 8% (45) 6% (31) 547Non-Evangelical 52% (384) 36% (266) 6% (45) 6% (47) 742Community: Urban 42% (246) 36% (213) 14% (81) 8% (47) 586Community: Suburban 50% (458) 36% (334) 7% (62) 8% (70) 924Community: Rural 60% (290) 26% (126) 6% (31) 8% (37) 484Employ: Private Sector 46% (305) 36% (241) 9% (59) 9% (58) 663Employ: Government 42% (51) 35% (42) 13% (15) 10% (12) 120Employ: Self-Employed 55% (97) 24% (42) 15% (27) 6% (11) 176Employ: Homemaker 60% (71) 34% (40) 2% (2) 4% (4) 118Employ: Student 19% (17) 50% (45) 19% (18) 12% (11) 91Employ: Retired 60% (321) 31% (167) 6% (31) 3% (16) 534Employ: Unemployed 46% (83) 31% (57) 9% (17) 13% (24) 182Employ: Other 44% (49) 35% (39) 4% (4) 17% (19) 111
Continued on next page
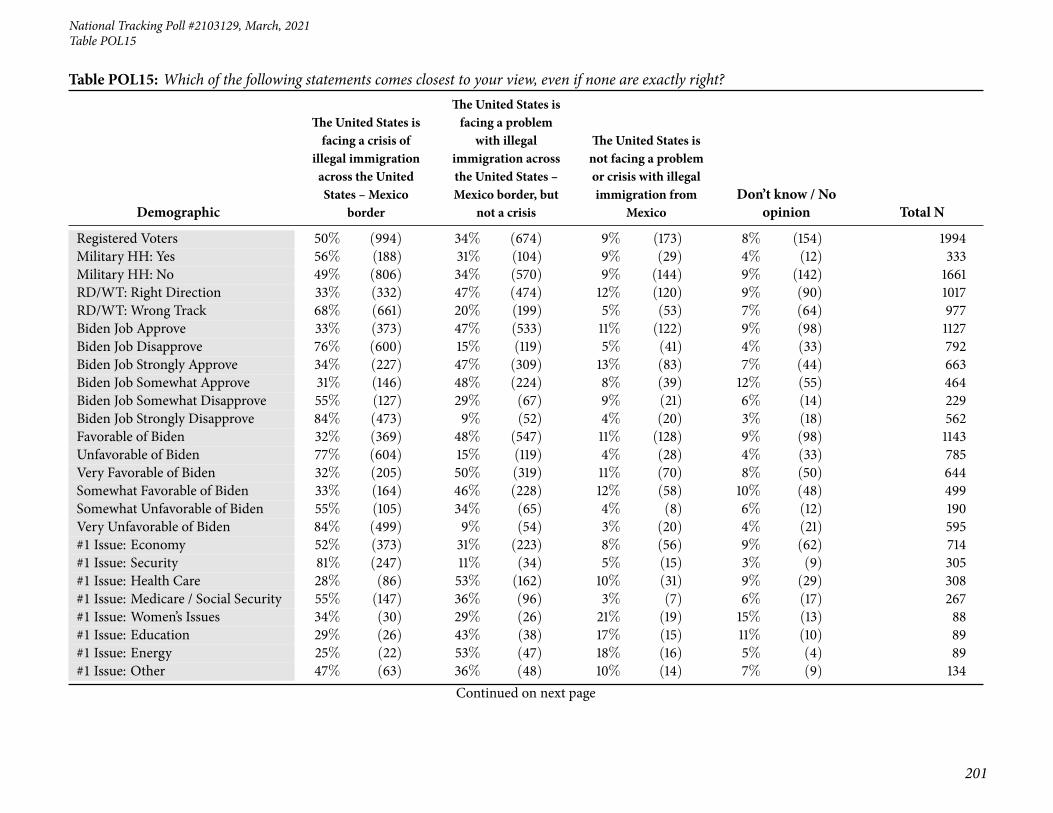
National Tracking Poll #2103129, March, 2021
201
Table POL15
Table POL15: Which of the following statements comes closest to your view, even if none are exactly right?
Demographic
TheUnited States isfacing a crisis of
illegal immigrationacross the UnitedStates – Mexico
border
The United States isfacing a problem
with illegalimmigration acrossthe United States –Mexico border, but
not a crisis
The United States isnot facing a problemor crisis with illegalimmigration from
MexicoDon’t know / No
opinion Total N
Registered Voters 50% (994) 34% (674) 9% (173) 8% (154) 1994Military HH: Yes 56% (188) 31% (104) 9% (29) 4% (12) 333Military HH: No 49% (806) 34% (570) 9% (144) 9% (142) 1661RD/WT: Right Direction 33% (332) 47% (474) 12% (120) 9% (90) 1017RD/WT: Wrong Track 68% (661) 20% (199) 5% (53) 7% (64) 977Biden Job Approve 33% (373) 47% (533) 11% (122) 9% (98) 1127Biden Job Disapprove 76% (600) 15% (119) 5% (41) 4% (33) 792Biden Job Strongly Approve 34% (227) 47% (309) 13% (83) 7% (44) 663Biden Job Somewhat Approve 31% (146) 48% (224) 8% (39) 12% (55) 464Biden Job Somewhat Disapprove 55% (127) 29% (67) 9% (21) 6% (14) 229Biden Job Strongly Disapprove 84% (473) 9% (52) 4% (20) 3% (18) 562Favorable of Biden 32% (369) 48% (547) 11% (128) 9% (98) 1143Unfavorable of Biden 77% (604) 15% (119) 4% (28) 4% (33) 785Very Favorable of Biden 32% (205) 50% (319) 11% (70) 8% (50) 644Somewhat Favorable of Biden 33% (164) 46% (228) 12% (58) 10% (48) 499Somewhat Unfavorable of Biden 55% (105) 34% (65) 4% (8) 6% (12) 190Very Unfavorable of Biden 84% (499) 9% (54) 3% (20) 4% (21) 595#1 Issue: Economy 52% (373) 31% (223) 8% (56) 9% (62) 714#1 Issue: Security 81% (247) 11% (34) 5% (15) 3% (9) 305#1 Issue: Health Care 28% (86) 53% (162) 10% (31) 9% (29) 308#1 Issue: Medicare / Social Security 55% (147) 36% (96) 3% (7) 6% (17) 267#1 Issue: Women’s Issues 34% (30) 29% (26) 21% (19) 15% (13) 88#1 Issue: Education 29% (26) 43% (38) 17% (15) 11% (10) 89#1 Issue: Energy 25% (22) 53% (47) 18% (16) 5% (4) 89#1 Issue: Other 47% (63) 36% (48) 10% (14) 7% (9) 134
Continued on next page
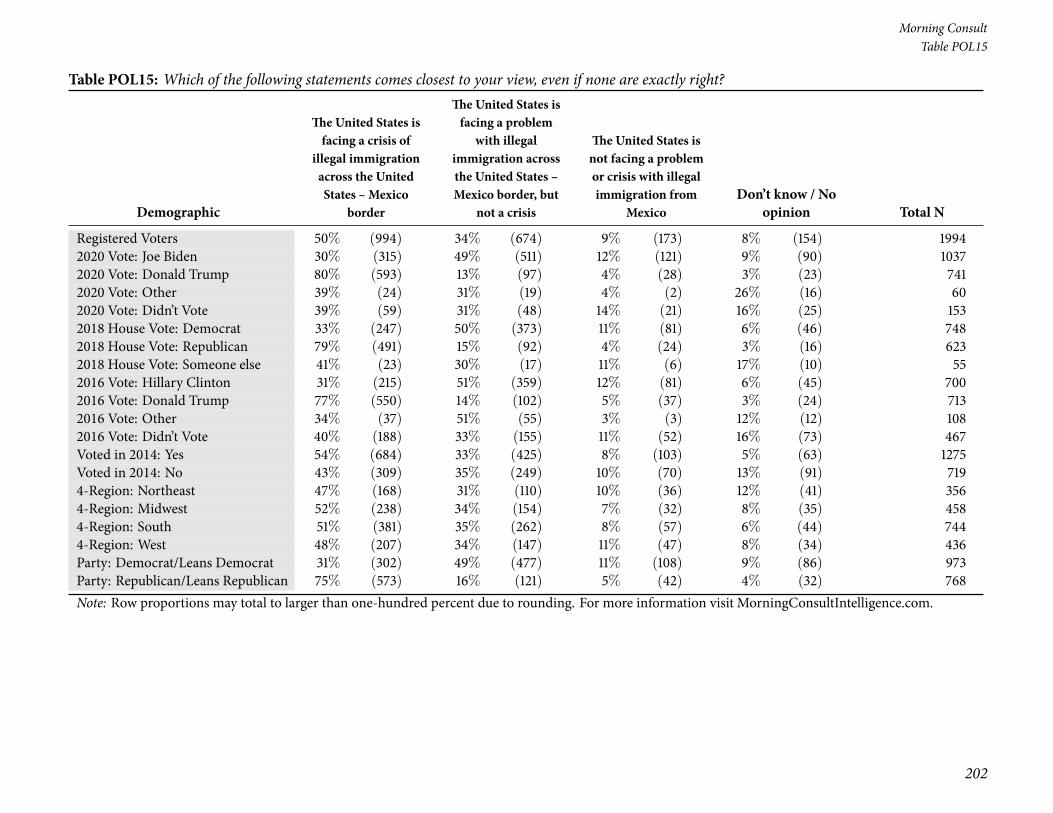
202
Morning ConsultTable POL15
Table POL15: Which of the following statements comes closest to your view, even if none are exactly right?
Demographic
TheUnited States isfacing a crisis of
illegal immigrationacross the UnitedStates – Mexico
border
The United States isfacing a problem
with illegalimmigration acrossthe United States –Mexico border, but
not a crisis
The United States isnot facing a problemor crisis with illegalimmigration from
MexicoDon’t know / No
opinion Total N
Registered Voters 50% (994) 34% (674) 9% (173) 8% (154) 19942020 Vote: Joe Biden 30% (315) 49% (511) 12% (121) 9% (90) 10372020 Vote: Donald Trump 80% (593) 13% (97) 4% (28) 3% (23) 7412020 Vote: Other 39% (24) 31% (19) 4% (2) 26% (16) 602020 Vote: Didn’t Vote 39% (59) 31% (48) 14% (21) 16% (25) 1532018 House Vote: Democrat 33% (247) 50% (373) 11% (81) 6% (46) 7482018 House Vote: Republican 79% (491) 15% (92) 4% (24) 3% (16) 6232018 House Vote: Someone else 41% (23) 30% (17) 11% (6) 17% (10) 552016 Vote: Hillary Clinton 31% (215) 51% (359) 12% (81) 6% (45) 7002016 Vote: Donald Trump 77% (550) 14% (102) 5% (37) 3% (24) 7132016 Vote: Other 34% (37) 51% (55) 3% (3) 12% (12) 1082016 Vote: Didn’t Vote 40% (188) 33% (155) 11% (52) 16% (73) 467Voted in 2014: Yes 54% (684) 33% (425) 8% (103) 5% (63) 1275Voted in 2014: No 43% (309) 35% (249) 10% (70) 13% (91) 7194-Region: Northeast 47% (168) 31% (110) 10% (36) 12% (41) 3564-Region: Midwest 52% (238) 34% (154) 7% (32) 8% (35) 4584-Region: South 51% (381) 35% (262) 8% (57) 6% (44) 7444-Region: West 48% (207) 34% (147) 11% (47) 8% (34) 436Party: Democrat/Leans Democrat 31% (302) 49% (477) 11% (108) 9% (86) 973Party: Republican/Leans Republican 75% (573) 16% (121) 5% (42) 4% (32) 768Note: Row proportions may total to larger than one-hundred percent due to rounding. For more information visit MorningConsultIntelligence.com.

National Tracking Poll #2103129, March, 2021
203
Table POL16
Table POL16: Which of the following do you think is the best way to handle immigrants currently living in the United States undocumented?
Demographic
They should beallowed to stay andbecome citizens ifthey meet certainrequirements
They should beallowed to stay and
become legalresidents, but NOTcitizens if they meet
certainrequirements
They should beremoved or
deported from theUnited States
Don’t know / Noopinion Total N
Registered Voters 43% (858) 19% (379) 27% (547) 11% (210) 1994Gender: Male 41% (384) 19% (178) 31% (286) 9% (85) 933Gender: Female 45% (474) 19% (201) 25% (260) 12% (125) 1061Age: 18-34 50% (248) 23% (117) 14% (70) 13% (65) 501Age: 35-44 40% (120) 22% (67) 26% (79) 12% (37) 303Age: 45-64 39% (284) 16% (119) 33% (238) 12% (87) 726Age: 65+ 44% (206) 16% (76) 34% (160) 5% (22) 464GenZers: 1997-2012 63% (106) 23% (39) 2% (4) 11% (19) 168Millennials: 1981-1996 41% (227) 23% (125) 23% (124) 13% (74) 551GenXers: 1965-1980 39% (166) 16% (70) 30% (127) 15% (62) 424Baby Boomers: 1946-1964 42% (330) 18% (139) 34% (266) 6% (50) 784PID: Dem (no lean) 57% (464) 21% (168) 10% (82) 13% (103) 817PID: Ind (no lean) 42% (226) 21% (112) 26% (142) 11% (62) 542PID: Rep (no lean) 26% (168) 16% (99) 51% (323) 7% (45) 635PID/Gender: DemMen 54% (191) 22% (76) 12% (43) 12% (41) 350PID/Gender: DemWomen 59% (273) 20% (92) 8% (39) 13% (62) 467PID/Gender: Ind Men 39% (110) 18% (49) 31% (88) 12% (33) 280PID/Gender: Ind Women 44% (116) 24% (63) 21% (55) 11% (29) 262PID/Gender: Rep Men 27% (83) 17% (53) 52% (156) 4% (11) 304PID/Gender: Rep Women 25% (84) 14% (47) 50% (166) 10% (34) 332Ideo: Liberal (1-3) 65% (406) 20% (123) 8% (52) 7% (45) 625Ideo: Moderate (4) 41% (234) 22% (124) 24% (135) 14% (78) 571Ideo: Conservative (5-7) 28% (191) 16% (108) 50% (340) 7% (45) 685Educ: < College 40% (507) 16% (204) 31% (393) 12% (151) 1254Educ: Bachelors degree 47% (221) 23% (108) 22% (102) 9% (41) 472Educ: Post-grad 49% (131) 25% (67) 19% (52) 7% (18) 268
Continued on next page

204
Morning ConsultTable POL16
Table POL16: Which of the following do you think is the best way to handle immigrants currently living in the United States undocumented?
Demographic
They should beallowed to stay andbecome citizens ifthey meet certainrequirements
They should beallowed to stay and
become legalresidents, but NOTcitizens if they meet
certainrequirements
They should beremoved or
deported from theUnited States
Don’t know / Noopinion Total N
Registered Voters 43% (858) 19% (379) 27% (547) 11% (210) 1994Income: Under 50k 43% (421) 16% (162) 27% (270) 14% (136) 989Income: 50k-100k 44% (267) 19% (114) 30% (178) 7% (44) 602Income: 100k+ 42% (170) 26% (103) 25% (99) 7% (30) 402Ethnicity: White 43% (687) 18% (294) 31% (497) 8% (136) 1613Ethnicity: Hispanic 44% (85) 22% (43) 24% (47) 9% (18) 193Ethnicity: Black 42% (106) 26% (65) 10% (24) 23% (58) 253Ethnicity: Other 51% (66) 17% (21) 20% (25) 12% (16) 128All Christian 42% (432) 19% (196) 33% (339) 7% (69) 1036All Non-Christian 52% (60) 26% (30) 19% (22) 4% (4) 115Atheist 61% (53) 19% (17) 9% (8) 11% (9) 88Agnostic/Nothing in particular 44% (200) 18% (82) 20% (90) 18% (79) 450Something Else 37% (113) 18% (54) 29% (89) 16% (49) 305Religious Non-Protestant/Catholic 52% (72) 24% (34) 20% (28) 5% (7) 141Evangelical 34% (186) 18% (98) 38% (210) 10% (53) 547Non-Evangelical 45% (334) 19% (141) 28% (208) 8% (60) 742Community: Urban 47% (275) 21% (123) 19% (114) 13% (74) 586Community: Suburban 42% (386) 21% (192) 27% (253) 10% (94) 924Community: Rural 41% (198) 13% (64) 37% (180) 9% (42) 484Employ: Private Sector 41% (274) 23% (150) 26% (169) 10% (69) 663Employ: Government 46% (55) 18% (22) 24% (28) 12% (14) 120Employ: Self-Employed 47% (83) 20% (36) 26% (46) 6% (11) 176Employ: Homemaker 34% (40) 11% (14) 44% (52) 11% (13) 118Employ: Student 58% (53) 30% (27) 1% (1) 11% (10) 91Employ: Retired 43% (230) 16% (85) 33% (179) 8% (41) 534Employ: Unemployed 44% (79) 15% (27) 26% (48) 16% (28) 182Employ: Other 39% (43) 18% (20) 22% (24) 22% (24) 111
Continued on next page

National Tracking Poll #2103129, March, 2021
205
Table POL16
Table POL16: Which of the following do you think is the best way to handle immigrants currently living in the United States undocumented?
Demographic
They should beallowed to stay andbecome citizens ifthey meet certainrequirements
They should beallowed to stay and
become legalresidents, but NOTcitizens if they meet
certainrequirements
They should beremoved or
deported from theUnited States
Don’t know / Noopinion Total N
Registered Voters 43% (858) 19% (379) 27% (547) 11% (210) 1994Military HH: Yes 42% (139) 21% (69) 32% (106) 6% (19) 333Military HH: No 43% (720) 19% (310) 27% (440) 11% (191) 1661RD/WT: Right Direction 54% (545) 22% (221) 13% (134) 11% (117) 1017RD/WT: Wrong Track 32% (314) 16% (158) 42% (412) 10% (93) 977Biden Job Approve 55% (617) 22% (247) 12% (131) 12% (133) 1127Biden Job Disapprove 27% (213) 15% (120) 52% (408) 6% (51) 792Biden Job Strongly Approve 60% (398) 21% (140) 10% (65) 9% (60) 663Biden Job Somewhat Approve 47% (220) 23% (106) 14% (65) 16% (73) 464Biden Job Somewhat Disapprove 43% (99) 21% (49) 29% (67) 7% (15) 229Biden Job Strongly Disapprove 20% (114) 13% (71) 61% (342) 6% (35) 562Favorable of Biden 56% (635) 23% (257) 11% (124) 11% (126) 1143Unfavorable of Biden 25% (200) 14% (112) 52% (412) 8% (61) 785Very Favorable of Biden 60% (386) 20% (132) 9% (56) 11% (70) 644Somewhat Favorable of Biden 50% (250) 25% (125) 14% (68) 11% (55) 499Somewhat Unfavorable of Biden 41% (78) 17% (33) 31% (58) 11% (21) 190Very Unfavorable of Biden 20% (122) 13% (80) 59% (354) 7% (40) 595#1 Issue: Economy 40% (282) 22% (155) 28% (198) 11% (79) 714#1 Issue: Security 23% (70) 14% (44) 56% (171) 7% (20) 305#1 Issue: Health Care 53% (164) 20% (62) 15% (47) 11% (34) 308#1 Issue: Medicare / Social Security 42% (113) 17% (46) 26% (71) 14% (38) 267#1 Issue: Women’s Issues 51% (46) 20% (18) 17% (15) 12% (10) 88#1 Issue: Education 50% (45) 30% (27) 11% (9) 9% (8) 89#1 Issue: Energy 70% (63) 13% (11) 8% (7) 9% (8) 89#1 Issue: Other 56% (76) 13% (18) 21% (28) 10% (13) 134
Continued on next page

206
Morning ConsultTable POL16
Table POL16: Which of the following do you think is the best way to handle immigrants currently living in the United States undocumented?
Demographic
They should beallowed to stay andbecome citizens ifthey meet certainrequirements
They should beallowed to stay and
become legalresidents, but NOTcitizens if they meet
certainrequirements
They should beremoved or
deported from theUnited States
Don’t know / Noopinion Total N
Registered Voters 43% (858) 19% (379) 27% (547) 11% (210) 19942020 Vote: Joe Biden 58% (596) 21% (221) 10% (108) 11% (112) 10372020 Vote: Donald Trump 25% (188) 15% (112) 53% (393) 6% (47) 7412020 Vote: Other 25% (15) 32% (19) 14% (9) 29% (18) 602020 Vote: Didn’t Vote 38% (59) 18% (28) 24% (36) 20% (31) 1532018 House Vote: Democrat 60% (449) 21% (157) 10% (77) 9% (65) 7482018 House Vote: Republican 27% (166) 16% (99) 52% (327) 5% (31) 6232018 House Vote: Someone else 31% (17) 19% (11) 30% (16) 20% (11) 552016 Vote: Hillary Clinton 59% (413) 23% (159) 10% (68) 9% (61) 7002016 Vote: Donald Trump 26% (188) 15% (110) 52% (370) 6% (45) 7132016 Vote: Other 45% (48) 24% (26) 19% (21) 12% (13) 1082016 Vote: Didn’t Vote 44% (204) 18% (83) 19% (88) 20% (92) 467Voted in 2014: Yes 43% (550) 19% (240) 30% (382) 8% (103) 1275Voted in 2014: No 43% (308) 19% (139) 23% (165) 15% (107) 7194-Region: Northeast 45% (161) 23% (82) 23% (83) 9% (30) 3564-Region: Midwest 36% (164) 19% (88) 33% (152) 12% (54) 4584-Region: South 44% (331) 18% (135) 27% (201) 11% (78) 7444-Region: West 47% (203) 17% (75) 25% (111) 11% (47) 436Party: Democrat/Leans Democrat 57% (554) 21% (204) 10% (96) 12% (119) 973Party: Republican/Leans Republican 26% (203) 17% (128) 50% (384) 7% (54) 768Note: Row proportions may total to larger than one-hundred percent due to rounding. For more information visit MorningConsultIntelligence.com.

National Tracking Poll #2103129, March, 2021
207
Table POL17
Table POL17: As you may know, ’Dreamers’ are young people who were brought to the United States illegally when they were children, often withtheir parents. Which of the following do you think is the best way to handle Dreamers?
Demographic
They should beallowed to stay andbecome citizens ifthey meet certainrequirements
They should beallowed to stay and
become legalresidents, but NOTcitizens, if they meet
certainrequirements
They should beremoved or
deported from theUnited States
Don’t Know / NoOpinion Total N
Registered Voters 62% (1227) 16% (321) 14% (286) 8% (161) 1994Gender: Male 56% (523) 19% (173) 18% (166) 8% (71) 933Gender: Female 66% (704) 14% (147) 11% (120) 8% (90) 1061Age: 18-34 61% (305) 18% (91) 9% (46) 12% (58) 501Age: 35-44 55% (167) 18% (54) 17% (50) 10% (31) 303Age: 45-64 60% (437) 14% (102) 18% (132) 8% (55) 726Age: 65+ 68% (317) 16% (73) 12% (57) 4% (17) 464GenZers: 1997-2012 76% (128) 9% (16) 4% (6) 11% (18) 168Millennials: 1981-1996 54% (295) 21% (115) 14% (77) 11% (63) 551GenXers: 1965-1980 56% (236) 14% (59) 19% (81) 11% (49) 424Baby Boomers: 1946-1964 67% (522) 15% (120) 14% (112) 4% (30) 784PID: Dem (no lean) 75% (615) 11% (92) 6% (47) 8% (62) 817PID: Ind (no lean) 59% (319) 19% (105) 12% (67) 9% (51) 542PID: Rep (no lean) 46% (293) 19% (123) 27% (171) 8% (48) 635PID/Gender: DemMen 68% (236) 17% (59) 8% (26) 8% (28) 350PID/Gender: DemWomen 81% (379) 7% (33) 5% (21) 7% (34) 467PID/Gender: Ind Men 57% (160) 18% (52) 15% (42) 9% (26) 280PID/Gender: Ind Women 61% (159) 20% (53) 10% (25) 9% (24) 262PID/Gender: Rep Men 42% (127) 20% (62) 32% (98) 6% (17) 304PID/Gender: Rep Women 50% (166) 18% (61) 22% (73) 9% (31) 332Ideo: Liberal (1-3) 81% (510) 9% (58) 6% (37) 3% (20) 625Ideo: Moderate (4) 60% (345) 20% (115) 10% (60) 9% (51) 571Ideo: Conservative (5-7) 48% (326) 19% (132) 27% (183) 7% (45) 685Educ: < College 59% (745) 15% (184) 17% (208) 9% (117) 1254Educ: Bachelors degree 65% (307) 19% (88) 10% (48) 6% (28) 472Educ: Post-grad 65% (175) 18% (48) 11% (30) 6% (15) 268
Continued on next page
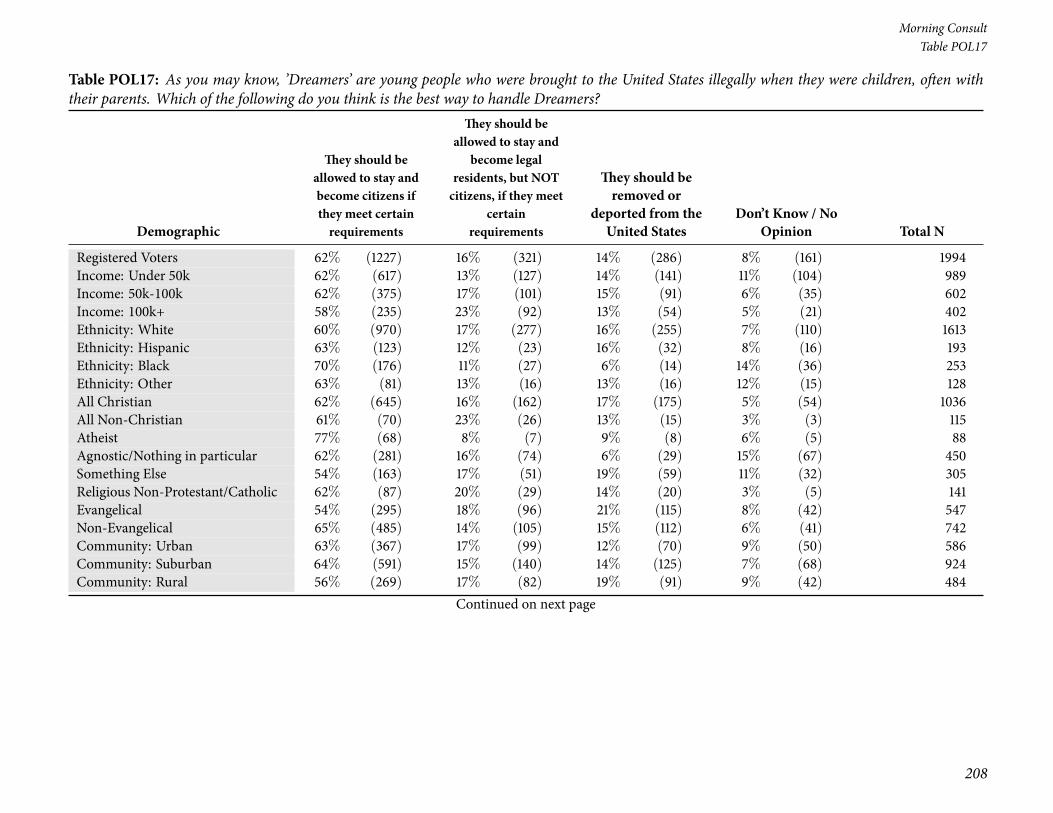
208
Morning ConsultTable POL17
Table POL17: As you may know, ’Dreamers’ are young people who were brought to the United States illegally when they were children, often withtheir parents. Which of the following do you think is the best way to handle Dreamers?
Demographic
They should beallowed to stay andbecome citizens ifthey meet certainrequirements
They should beallowed to stay and
become legalresidents, but NOTcitizens, if they meet
certainrequirements
They should beremoved or
deported from theUnited States
Don’t Know / NoOpinion Total N
Registered Voters 62% (1227) 16% (321) 14% (286) 8% (161) 1994Income: Under 50k 62% (617) 13% (127) 14% (141) 11% (104) 989Income: 50k-100k 62% (375) 17% (101) 15% (91) 6% (35) 602Income: 100k+ 58% (235) 23% (92) 13% (54) 5% (21) 402Ethnicity: White 60% (970) 17% (277) 16% (255) 7% (110) 1613Ethnicity: Hispanic 63% (123) 12% (23) 16% (32) 8% (16) 193Ethnicity: Black 70% (176) 11% (27) 6% (14) 14% (36) 253Ethnicity: Other 63% (81) 13% (16) 13% (16) 12% (15) 128All Christian 62% (645) 16% (162) 17% (175) 5% (54) 1036All Non-Christian 61% (70) 23% (26) 13% (15) 3% (3) 115Atheist 77% (68) 8% (7) 9% (8) 6% (5) 88Agnostic/Nothing in particular 62% (281) 16% (74) 6% (29) 15% (67) 450Something Else 54% (163) 17% (51) 19% (59) 11% (32) 305Religious Non-Protestant/Catholic 62% (87) 20% (29) 14% (20) 3% (5) 141Evangelical 54% (295) 18% (96) 21% (115) 8% (42) 547Non-Evangelical 65% (485) 14% (105) 15% (112) 6% (41) 742Community: Urban 63% (367) 17% (99) 12% (70) 9% (50) 586Community: Suburban 64% (591) 15% (140) 14% (125) 7% (68) 924Community: Rural 56% (269) 17% (82) 19% (91) 9% (42) 484
Continued on next page

National Tracking Poll #2103129, March, 2021
209
Table POL17
Table POL17: As you may know, ’Dreamers’ are young people who were brought to the United States illegally when they were children, often withtheir parents. Which of the following do you think is the best way to handle Dreamers?
Demographic
They should beallowed to stay andbecome citizens ifthey meet certainrequirements
They should beallowed to stay and
become legalresidents, but NOTcitizens, if they meet
certainrequirements
They should beremoved or
deported from theUnited States
Don’t Know / NoOpinion Total N
Registered Voters 62% (1227) 16% (321) 14% (286) 8% (161) 1994Employ: Private Sector 58% (381) 18% (121) 16% (107) 8% (54) 663Employ: Government 66% (80) 12% (14) 14% (17) 8% (9) 120Employ: Self-Employed 57% (100) 18% (32) 16% (28) 9% (16) 176Employ: Homemaker 49% (58) 15% (18) 28% (32) 8% (9) 118Employ: Student 81% (73) 9% (8) 3% (2) 8% (7) 91Employ: Retired 66% (355) 16% (88) 12% (63) 5% (29) 534Employ: Unemployed 59% (107) 15% (27) 13% (23) 14% (25) 182Employ: Other 66% (73) 11% (12) 12% (14) 11% (12) 111Military HH: Yes 62% (206) 17% (57) 17% (55) 5% (15) 333Military HH: No 61% (1021) 16% (264) 14% (231) 9% (146) 1661RD/WT: Right Direction 70% (716) 13% (137) 8% (79) 8% (85) 1017RD/WT: Wrong Track 52% (511) 19% (184) 21% (206) 8% (76) 977Biden Job Approve 73% (817) 13% (146) 7% (76) 8% (87) 1127Biden Job Disapprove 47% (373) 21% (164) 26% (206) 6% (48) 792Biden Job Strongly Approve 77% (511) 11% (74) 7% (45) 5% (34) 663Biden Job Somewhat Approve 66% (306) 16% (72) 7% (32) 11% (53) 464Biden Job Somewhat Disapprove 61% (139) 21% (48) 14% (31) 5% (11) 229Biden Job Strongly Disapprove 42% (234) 21% (116) 31% (175) 7% (37) 562Favorable of Biden 75% (852) 12% (143) 6% (70) 7% (78) 1143Unfavorable of Biden 45% (351) 21% (167) 26% (207) 8% (59) 785Very Favorable of Biden 78% (501) 11% (73) 5% (33) 6% (37) 644Somewhat Favorable of Biden 70% (351) 14% (70) 7% (37) 8% (41) 499Somewhat Unfavorable of Biden 56% (106) 23% (44) 12% (23) 9% (17) 190Very Unfavorable of Biden 41% (245) 21% (124) 31% (183) 7% (42) 595
Continued on next page
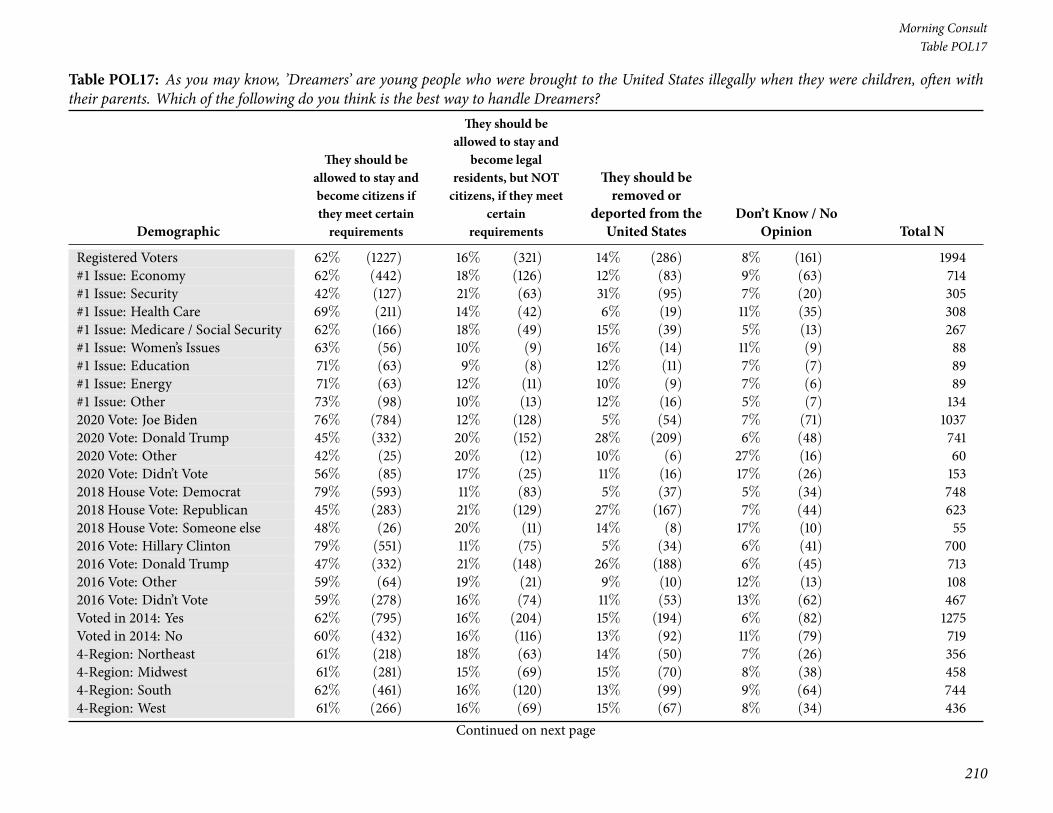
210
Morning ConsultTable POL17
Table POL17: As you may know, ’Dreamers’ are young people who were brought to the United States illegally when they were children, often withtheir parents. Which of the following do you think is the best way to handle Dreamers?
Demographic
They should beallowed to stay andbecome citizens ifthey meet certainrequirements
They should beallowed to stay and
become legalresidents, but NOTcitizens, if they meet
certainrequirements
They should beremoved or
deported from theUnited States
Don’t Know / NoOpinion Total N
Registered Voters 62% (1227) 16% (321) 14% (286) 8% (161) 1994#1 Issue: Economy 62% (442) 18% (126) 12% (83) 9% (63) 714#1 Issue: Security 42% (127) 21% (63) 31% (95) 7% (20) 305#1 Issue: Health Care 69% (211) 14% (42) 6% (19) 11% (35) 308#1 Issue: Medicare / Social Security 62% (166) 18% (49) 15% (39) 5% (13) 267#1 Issue: Women’s Issues 63% (56) 10% (9) 16% (14) 11% (9) 88#1 Issue: Education 71% (63) 9% (8) 12% (11) 7% (7) 89#1 Issue: Energy 71% (63) 12% (11) 10% (9) 7% (6) 89#1 Issue: Other 73% (98) 10% (13) 12% (16) 5% (7) 1342020 Vote: Joe Biden 76% (784) 12% (128) 5% (54) 7% (71) 10372020 Vote: Donald Trump 45% (332) 20% (152) 28% (209) 6% (48) 7412020 Vote: Other 42% (25) 20% (12) 10% (6) 27% (16) 602020 Vote: Didn’t Vote 56% (85) 17% (25) 11% (16) 17% (26) 1532018 House Vote: Democrat 79% (593) 11% (83) 5% (37) 5% (34) 7482018 House Vote: Republican 45% (283) 21% (129) 27% (167) 7% (44) 6232018 House Vote: Someone else 48% (26) 20% (11) 14% (8) 17% (10) 552016 Vote: Hillary Clinton 79% (551) 11% (75) 5% (34) 6% (41) 7002016 Vote: Donald Trump 47% (332) 21% (148) 26% (188) 6% (45) 7132016 Vote: Other 59% (64) 19% (21) 9% (10) 12% (13) 1082016 Vote: Didn’t Vote 59% (278) 16% (74) 11% (53) 13% (62) 467Voted in 2014: Yes 62% (795) 16% (204) 15% (194) 6% (82) 1275Voted in 2014: No 60% (432) 16% (116) 13% (92) 11% (79) 7194-Region: Northeast 61% (218) 18% (63) 14% (50) 7% (26) 3564-Region: Midwest 61% (281) 15% (69) 15% (70) 8% (38) 4584-Region: South 62% (461) 16% (120) 13% (99) 9% (64) 7444-Region: West 61% (266) 16% (69) 15% (67) 8% (34) 436
Continued on next page
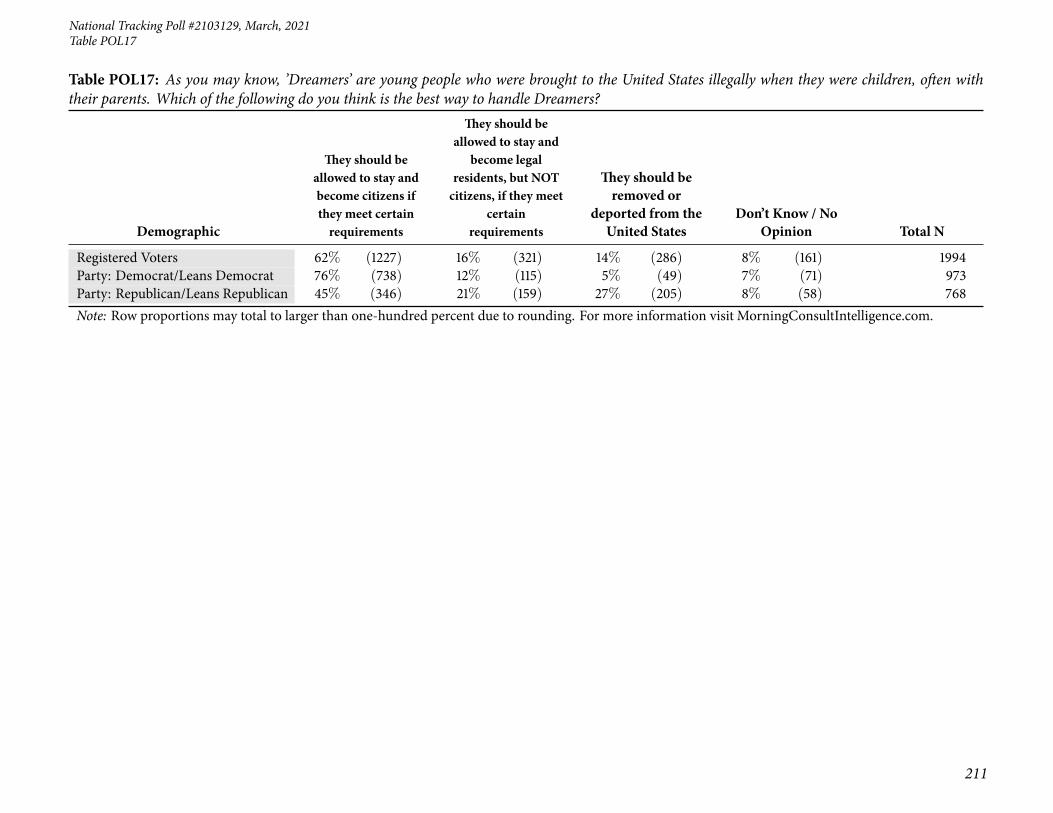
National Tracking Poll #2103129, March, 2021
211
Table POL17
Table POL17: As you may know, ’Dreamers’ are young people who were brought to the United States illegally when they were children, often withtheir parents. Which of the following do you think is the best way to handle Dreamers?
Demographic
They should beallowed to stay andbecome citizens ifthey meet certainrequirements
They should beallowed to stay and
become legalresidents, but NOTcitizens, if they meet
certainrequirements
They should beremoved or
deported from theUnited States
Don’t Know / NoOpinion Total N
Registered Voters 62% (1227) 16% (321) 14% (286) 8% (161) 1994Party: Democrat/Leans Democrat 76% (738) 12% (115) 5% (49) 7% (71) 973Party: Republican/Leans Republican 45% (346) 21% (159) 27% (205) 8% (58) 768Note: Row proportions may total to larger than one-hundred percent due to rounding. For more information visit MorningConsultIntelligence.com.
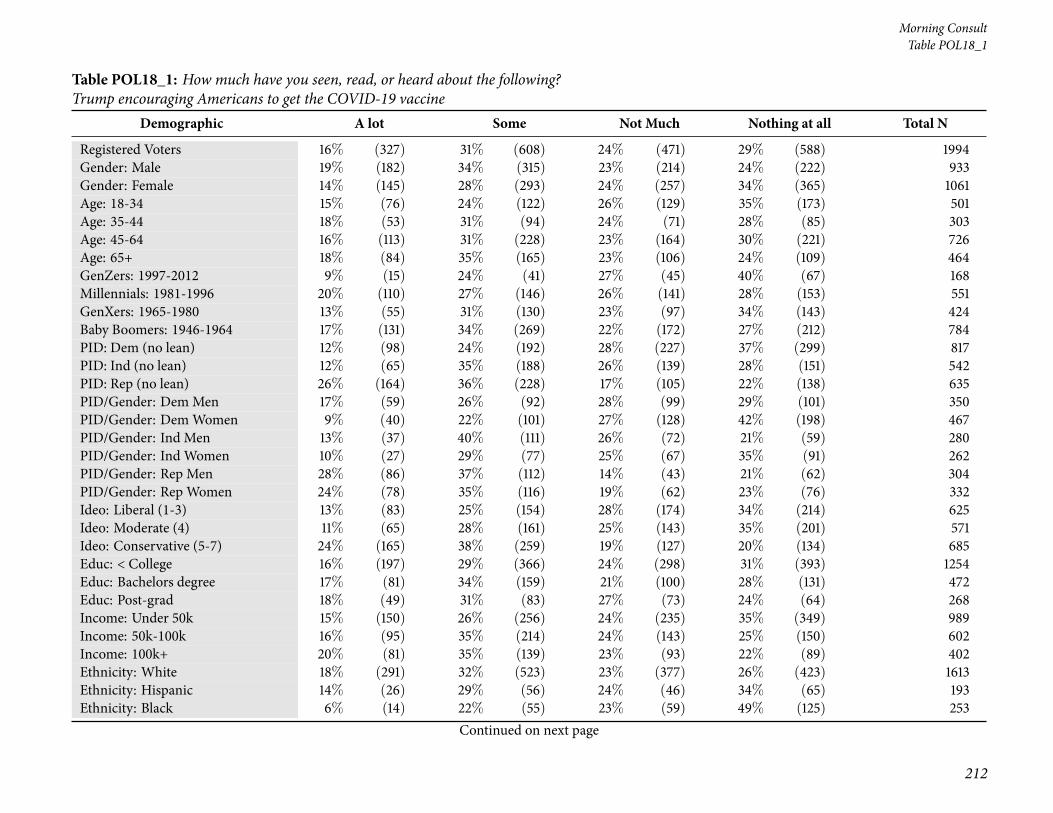
212
Morning ConsultTable POL18_1
Table POL18_1: How much have you seen, read, or heard about the following?Trump encouraging Americans to get the COVID-19 vaccine
Demographic A lot Some Not Much Nothing at all Total N
Registered Voters 16% (327) 31% (608) 24% (471) 29% (588) 1994Gender: Male 19% (182) 34% (315) 23% (214) 24% (222) 933Gender: Female 14% (145) 28% (293) 24% (257) 34% (365) 1061Age: 18-34 15% (76) 24% (122) 26% (129) 35% (173) 501Age: 35-44 18% (53) 31% (94) 24% (71) 28% (85) 303Age: 45-64 16% (113) 31% (228) 23% (164) 30% (221) 726Age: 65+ 18% (84) 35% (165) 23% (106) 24% (109) 464GenZers: 1997-2012 9% (15) 24% (41) 27% (45) 40% (67) 168Millennials: 1981-1996 20% (110) 27% (146) 26% (141) 28% (153) 551GenXers: 1965-1980 13% (55) 31% (130) 23% (97) 34% (143) 424Baby Boomers: 1946-1964 17% (131) 34% (269) 22% (172) 27% (212) 784PID: Dem (no lean) 12% (98) 24% (192) 28% (227) 37% (299) 817PID: Ind (no lean) 12% (65) 35% (188) 26% (139) 28% (151) 542PID: Rep (no lean) 26% (164) 36% (228) 17% (105) 22% (138) 635PID/Gender: DemMen 17% (59) 26% (92) 28% (99) 29% (101) 350PID/Gender: DemWomen 9% (40) 22% (101) 27% (128) 42% (198) 467PID/Gender: Ind Men 13% (37) 40% (111) 26% (72) 21% (59) 280PID/Gender: Ind Women 10% (27) 29% (77) 25% (67) 35% (91) 262PID/Gender: Rep Men 28% (86) 37% (112) 14% (43) 21% (62) 304PID/Gender: Rep Women 24% (78) 35% (116) 19% (62) 23% (76) 332Ideo: Liberal (1-3) 13% (83) 25% (154) 28% (174) 34% (214) 625Ideo: Moderate (4) 11% (65) 28% (161) 25% (143) 35% (201) 571Ideo: Conservative (5-7) 24% (165) 38% (259) 19% (127) 20% (134) 685Educ: < College 16% (197) 29% (366) 24% (298) 31% (393) 1254Educ: Bachelors degree 17% (81) 34% (159) 21% (100) 28% (131) 472Educ: Post-grad 18% (49) 31% (83) 27% (73) 24% (64) 268Income: Under 50k 15% (150) 26% (256) 24% (235) 35% (349) 989Income: 50k-100k 16% (95) 35% (214) 24% (143) 25% (150) 602Income: 100k+ 20% (81) 35% (139) 23% (93) 22% (89) 402Ethnicity: White 18% (291) 32% (523) 23% (377) 26% (423) 1613Ethnicity: Hispanic 14% (26) 29% (56) 24% (46) 34% (65) 193Ethnicity: Black 6% (14) 22% (55) 23% (59) 49% (125) 253
Continued on next page

National Tracking Poll #2103129, March, 2021
213
Table POL18_1
Table POL18_1: How much have you seen, read, or heard about the following?Trump encouraging Americans to get the COVID-19 vaccine
Demographic A lot Some Not Much Nothing at all Total N
Registered Voters 16% (327) 31% (608) 24% (471) 29% (588) 1994Ethnicity: Other 17% (22) 24% (31) 27% (35) 31% (40) 128All Christian 19% (199) 35% (361) 21% (215) 25% (260) 1036All Non-Christian 28% (32) 26% (30) 23% (26) 23% (27) 115Atheist 8% (7) 18% (16) 42% (36) 33% (29) 88Agnostic/Nothing in particular 10% (43) 27% (120) 27% (123) 37% (165) 450Something Else 15% (46) 27% (82) 23% (70) 35% (106) 305Religious Non-Protestant/Catholic 23% (33) 29% (41) 21% (30) 26% (37) 141Evangelical 19% (104) 34% (184) 21% (115) 26% (144) 547Non-Evangelical 19% (139) 32% (238) 21% (157) 28% (208) 742Community: Urban 19% (111) 26% (150) 23% (136) 32% (190) 586Community: Suburban 14% (129) 31% (285) 25% (235) 30% (275) 924Community: Rural 18% (87) 36% (173) 21% (100) 25% (123) 484Employ: Private Sector 16% (109) 30% (199) 23% (151) 31% (203) 663Employ: Government 19% (22) 30% (36) 21% (25) 31% (37) 120Employ: Self-Employed 21% (37) 26% (45) 25% (43) 28% (50) 176Employ: Homemaker 10% (12) 32% (38) 24% (28) 34% (40) 118Employ: Student 9% (8) 24% (22) 26% (23) 41% (37) 91Employ: Retired 17% (93) 35% (185) 24% (128) 24% (129) 534Employ: Unemployed 18% (33) 27% (49) 22% (41) 33% (59) 182Employ: Other 11% (12) 31% (35) 28% (32) 30% (33) 111Military HH: Yes 18% (60) 27% (90) 29% (96) 26% (86) 333Military HH: No 16% (267) 31% (518) 23% (375) 30% (501) 1661RD/WT: Right Direction 13% (136) 25% (254) 27% (273) 35% (354) 1017RD/WT: Wrong Track 20% (191) 36% (354) 20% (198) 24% (234) 977Biden Job Approve 12% (139) 25% (282) 26% (297) 36% (409) 1127Biden Job Disapprove 22% (173) 39% (305) 21% (165) 19% (149) 792Biden Job Strongly Approve 16% (104) 23% (150) 25% (166) 37% (242) 663Biden Job Somewhat Approve 8% (35) 28% (132) 28% (131) 36% (166) 464Biden Job Somewhat Disapprove 14% (32) 37% (86) 28% (64) 21% (47) 229Biden Job Strongly Disapprove 25% (141) 39% (220) 18% (101) 18% (101) 562
Continued on next page
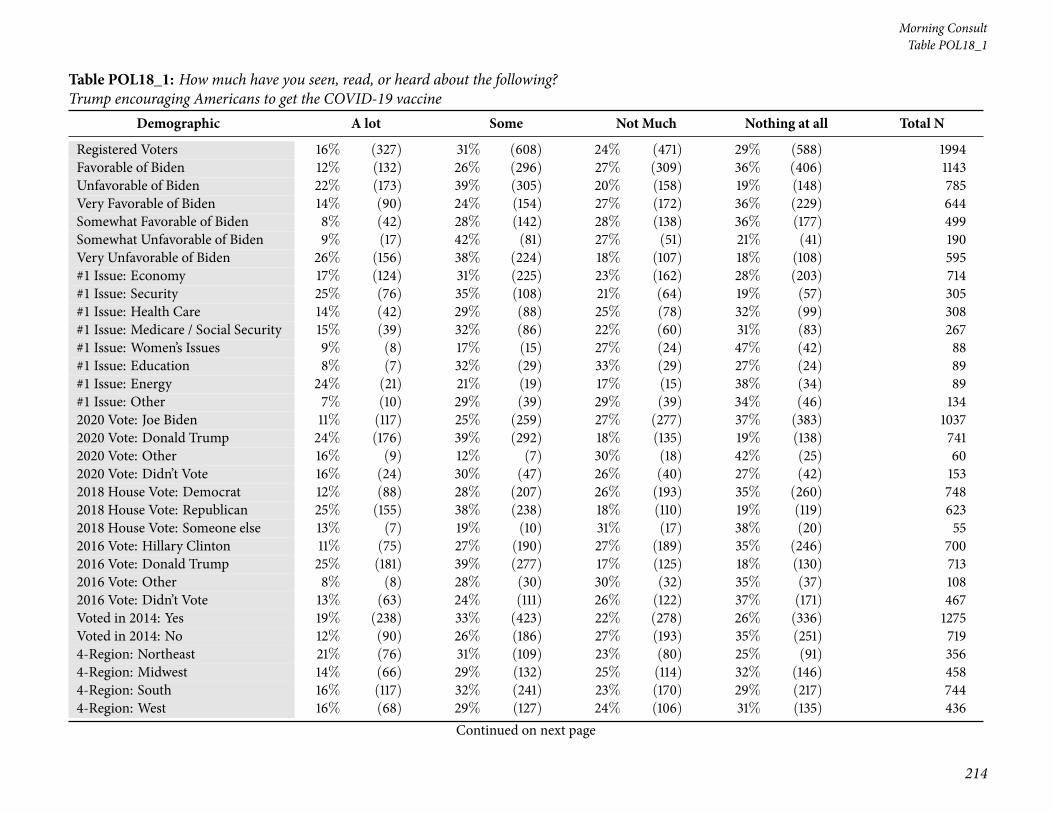
214
Morning ConsultTable POL18_1
Table POL18_1: How much have you seen, read, or heard about the following?Trump encouraging Americans to get the COVID-19 vaccine
Demographic A lot Some Not Much Nothing at all Total N
Registered Voters 16% (327) 31% (608) 24% (471) 29% (588) 1994Favorable of Biden 12% (132) 26% (296) 27% (309) 36% (406) 1143Unfavorable of Biden 22% (173) 39% (305) 20% (158) 19% (148) 785Very Favorable of Biden 14% (90) 24% (154) 27% (172) 36% (229) 644Somewhat Favorable of Biden 8% (42) 28% (142) 28% (138) 36% (177) 499Somewhat Unfavorable of Biden 9% (17) 42% (81) 27% (51) 21% (41) 190Very Unfavorable of Biden 26% (156) 38% (224) 18% (107) 18% (108) 595#1 Issue: Economy 17% (124) 31% (225) 23% (162) 28% (203) 714#1 Issue: Security 25% (76) 35% (108) 21% (64) 19% (57) 305#1 Issue: Health Care 14% (42) 29% (88) 25% (78) 32% (99) 308#1 Issue: Medicare / Social Security 15% (39) 32% (86) 22% (60) 31% (83) 267#1 Issue: Women’s Issues 9% (8) 17% (15) 27% (24) 47% (42) 88#1 Issue: Education 8% (7) 32% (29) 33% (29) 27% (24) 89#1 Issue: Energy 24% (21) 21% (19) 17% (15) 38% (34) 89#1 Issue: Other 7% (10) 29% (39) 29% (39) 34% (46) 1342020 Vote: Joe Biden 11% (117) 25% (259) 27% (277) 37% (383) 10372020 Vote: Donald Trump 24% (176) 39% (292) 18% (135) 19% (138) 7412020 Vote: Other 16% (9) 12% (7) 30% (18) 42% (25) 602020 Vote: Didn’t Vote 16% (24) 30% (47) 26% (40) 27% (42) 1532018 House Vote: Democrat 12% (88) 28% (207) 26% (193) 35% (260) 7482018 House Vote: Republican 25% (155) 38% (238) 18% (110) 19% (119) 6232018 House Vote: Someone else 13% (7) 19% (10) 31% (17) 38% (20) 552016 Vote: Hillary Clinton 11% (75) 27% (190) 27% (189) 35% (246) 7002016 Vote: Donald Trump 25% (181) 39% (277) 17% (125) 18% (130) 7132016 Vote: Other 8% (8) 28% (30) 30% (32) 35% (37) 1082016 Vote: Didn’t Vote 13% (63) 24% (111) 26% (122) 37% (171) 467Voted in 2014: Yes 19% (238) 33% (423) 22% (278) 26% (336) 1275Voted in 2014: No 12% (90) 26% (186) 27% (193) 35% (251) 7194-Region: Northeast 21% (76) 31% (109) 23% (80) 25% (91) 3564-Region: Midwest 14% (66) 29% (132) 25% (114) 32% (146) 4584-Region: South 16% (117) 32% (241) 23% (170) 29% (217) 7444-Region: West 16% (68) 29% (127) 24% (106) 31% (135) 436
Continued on next page

National Tracking Poll #2103129, March, 2021
215
Table POL18_1
Table POL18_1: How much have you seen, read, or heard about the following?Trump encouraging Americans to get the COVID-19 vaccine
Demographic A lot Some Not Much Nothing at all Total N
Registered Voters 16% (327) 31% (608) 24% (471) 29% (588) 1994Party: Democrat/Leans Democrat 11% (109) 24% (236) 29% (277) 36% (350) 973Party: Republican/Leans Republican 24% (187) 38% (291) 17% (130) 21% (160) 768Note: Row proportions may total to larger than one-hundred percent due to rounding. For more information visit MorningConsultIntelligence.com.

216
Morning ConsultTable POL18_2
Table POL18_2: How much have you seen, read, or heard about the following?A shooting spree at three spas in the Atlanta area that left 8 people dead, including 6 women of Asian descent
Demographic A lot Some Not Much Nothing at all Total N
Registered Voters 48% (948) 31% (610) 12% (236) 10% (200) 1994Gender: Male 47% (440) 31% (285) 14% (128) 9% (80) 933Gender: Female 48% (508) 31% (324) 10% (108) 11% (121) 1061Age: 18-34 39% (195) 31% (153) 14% (70) 17% (83) 501Age: 35-44 36% (110) 32% (97) 16% (47) 16% (49) 303Age: 45-64 50% (364) 31% (228) 11% (81) 7% (54) 726Age: 65+ 60% (279) 28% (132) 8% (37) 3% (15) 464GenZers: 1997-2012 41% (69) 27% (46) 13% (21) 19% (31) 168Millennials: 1981-1996 36% (201) 32% (175) 16% (89) 16% (85) 551GenXers: 1965-1980 44% (186) 32% (134) 13% (57) 11% (48) 424Baby Boomers: 1946-1964 57% (446) 31% (240) 8% (65) 4% (33) 784PID: Dem (no lean) 55% (448) 25% (201) 11% (92) 9% (76) 817PID: Ind (no lean) 45% (243) 34% (184) 13% (68) 9% (47) 542PID: Rep (no lean) 40% (257) 35% (225) 12% (76) 12% (78) 635PID/Gender: DemMen 53% (184) 23% (81) 16% (57) 8% (28) 350PID/Gender: DemWomen 57% (264) 26% (120) 7% (35) 10% (48) 467PID/Gender: Ind Men 44% (124) 38% (105) 12% (33) 6% (17) 280PID/Gender: Ind Women 45% (119) 30% (79) 13% (35) 11% (30) 262PID/Gender: Rep Men 43% (132) 33% (99) 12% (37) 12% (35) 304PID/Gender: Rep Women 38% (125) 38% (126) 12% (38) 13% (42) 332Ideo: Liberal (1-3) 60% (377) 25% (154) 8% (51) 7% (43) 625Ideo: Moderate (4) 43% (243) 30% (172) 16% (89) 12% (67) 571Ideo: Conservative (5-7) 44% (301) 37% (250) 11% (78) 8% (56) 685Educ: < College 45% (563) 31% (383) 14% (170) 11% (139) 1254Educ: Bachelors degree 52% (246) 30% (142) 9% (41) 9% (42) 472Educ: Post-grad 52% (139) 32% (85) 9% (25) 7% (20) 268Income: Under 50k 47% (462) 29% (289) 13% (124) 12% (114) 989Income: 50k-100k 50% (299) 31% (186) 11% (66) 9% (52) 602Income: 100k+ 46% (187) 33% (135) 11% (46) 9% (35) 402Ethnicity: White 47% (752) 33% (530) 11% (182) 9% (148) 1613Ethnicity: Hispanic 44% (84) 31% (60) 11% (21) 14% (28) 193Ethnicity: Black 50% (127) 21% (52) 14% (36) 15% (38) 253
Continued on next page

National Tracking Poll #2103129, March, 2021
217
Table POL18_2
Table POL18_2: How much have you seen, read, or heard about the following?A shooting spree at three spas in the Atlanta area that left 8 people dead, including 6 women of Asian descent
Demographic A lot Some Not Much Nothing at all Total N
Registered Voters 48% (948) 31% (610) 12% (236) 10% (200) 1994Ethnicity: Other 54% (69) 22% (28) 13% (17) 11% (14) 128All Christian 49% (503) 32% (333) 12% (122) 8% (78) 1036All Non-Christian 56% (64) 29% (34) 5% (6) 10% (12) 115Atheist 53% (46) 35% (30) 6% (6) 6% (6) 88Agnostic/Nothing in particular 47% (214) 26% (119) 15% (67) 11% (50) 450Something Else 40% (122) 31% (93) 11% (35) 18% (55) 305Religious Non-Protestant/Catholic 51% (71) 31% (43) 7% (9) 12% (17) 141Evangelical 41% (226) 36% (195) 12% (67) 11% (60) 547Non-Evangelical 52% (388) 29% (212) 10% (78) 9% (64) 742Community: Urban 48% (281) 25% (149) 14% (82) 13% (73) 586Community: Suburban 50% (463) 31% (285) 11% (101) 8% (75) 924Community: Rural 42% (204) 36% (175) 11% (52) 11% (52) 484Employ: Private Sector 42% (280) 32% (214) 15% (96) 11% (73) 663Employ: Government 51% (61) 29% (34) 10% (12) 10% (12) 120Employ: Self-Employed 51% (90) 27% (48) 12% (20) 10% (17) 176Employ: Homemaker 29% (34) 42% (49) 13% (15) 16% (19) 118Employ: Student 49% (45) 24% (22) 15% (13) 12% (11) 91Employ: Retired 58% (312) 30% (161) 9% (46) 3% (16) 534Employ: Unemployed 44% (79) 30% (54) 9% (16) 18% (33) 182Employ: Other 42% (47) 26% (29) 15% (16) 17% (19) 111Military HH: Yes 55% (182) 31% (105) 8% (28) 6% (19) 333Military HH: No 46% (767) 30% (505) 13% (208) 11% (182) 1661RD/WT: Right Direction 53% (535) 26% (268) 11% (116) 10% (98) 1017RD/WT: Wrong Track 42% (413) 35% (342) 12% (119) 11% (103) 977Biden Job Approve 54% (611) 25% (283) 11% (123) 10% (110) 1127Biden Job Disapprove 40% (315) 38% (302) 13% (103) 9% (71) 792Biden Job Strongly Approve 59% (391) 23% (150) 9% (59) 9% (62) 663Biden Job Somewhat Approve 47% (220) 29% (132) 14% (64) 10% (48) 464Biden Job Somewhat Disapprove 34% (77) 44% (101) 16% (36) 7% (15) 229Biden Job Strongly Disapprove 42% (238) 36% (201) 12% (67) 10% (56) 562
Continued on next page

218
Morning ConsultTable POL18_2
Table POL18_2: How much have you seen, read, or heard about the following?A shooting spree at three spas in the Atlanta area that left 8 people dead, including 6 women of Asian descent
Demographic A lot Some Not Much Nothing at all Total N
Registered Voters 48% (948) 31% (610) 12% (236) 10% (200) 1994Favorable of Biden 54% (612) 26% (300) 11% (125) 9% (106) 1143Unfavorable of Biden 40% (316) 38% (294) 13% (105) 9% (70) 785Very Favorable of Biden 58% (376) 22% (140) 10% (65) 10% (63) 644Somewhat Favorable of Biden 47% (236) 32% (160) 12% (60) 9% (43) 499Somewhat Unfavorable of Biden 38% (72) 41% (79) 12% (23) 9% (17) 190Very Unfavorable of Biden 41% (244) 36% (216) 14% (82) 9% (53) 595#1 Issue: Economy 45% (321) 31% (218) 13% (92) 12% (83) 714#1 Issue: Security 42% (129) 37% (113) 14% (43) 7% (20) 305#1 Issue: Health Care 52% (161) 25% (76) 11% (35) 12% (35) 308#1 Issue: Medicare / Social Security 51% (137) 31% (84) 9% (23) 9% (24) 267#1 Issue: Women’s Issues 43% (38) 36% (32) 11% (10) 9% (8) 88#1 Issue: Education 34% (30) 33% (30) 16% (14) 17% (15) 89#1 Issue: Energy 58% (51) 25% (22) 7% (6) 11% (9) 89#1 Issue: Other 60% (81) 27% (36) 9% (12) 4% (6) 1342020 Vote: Joe Biden 56% (576) 26% (270) 10% (100) 9% (90) 10372020 Vote: Donald Trump 40% (299) 37% (273) 13% (96) 10% (73) 7412020 Vote: Other 28% (17) 37% (22) 14% (8) 21% (13) 602020 Vote: Didn’t Vote 35% (54) 29% (44) 20% (31) 16% (24) 1532018 House Vote: Democrat 60% (451) 25% (189) 8% (59) 7% (49) 7482018 House Vote: Republican 44% (272) 36% (224) 12% (74) 8% (53) 6232018 House Vote: Someone else 33% (18) 40% (22) 9% (5) 18% (10) 552016 Vote: Hillary Clinton 58% (409) 25% (175) 9% (65) 7% (50) 7002016 Vote: Donald Trump 43% (303) 38% (272) 12% (83) 8% (54) 7132016 Vote: Other 42% (46) 38% (41) 13% (14) 7% (7) 1082016 Vote: Didn’t Vote 40% (188) 26% (121) 15% (71) 19% (88) 467Voted in 2014: Yes 52% (669) 31% (389) 10% (132) 7% (85) 1275Voted in 2014: No 39% (279) 31% (220) 14% (104) 16% (116) 7194-Region: Northeast 53% (189) 23% (83) 12% (42) 12% (42) 3564-Region: Midwest 41% (189) 37% (168) 14% (62) 8% (38) 4584-Region: South 50% (371) 29% (217) 12% (87) 9% (70) 7444-Region: West 46% (200) 32% (141) 10% (44) 12% (51) 436
Continued on next page
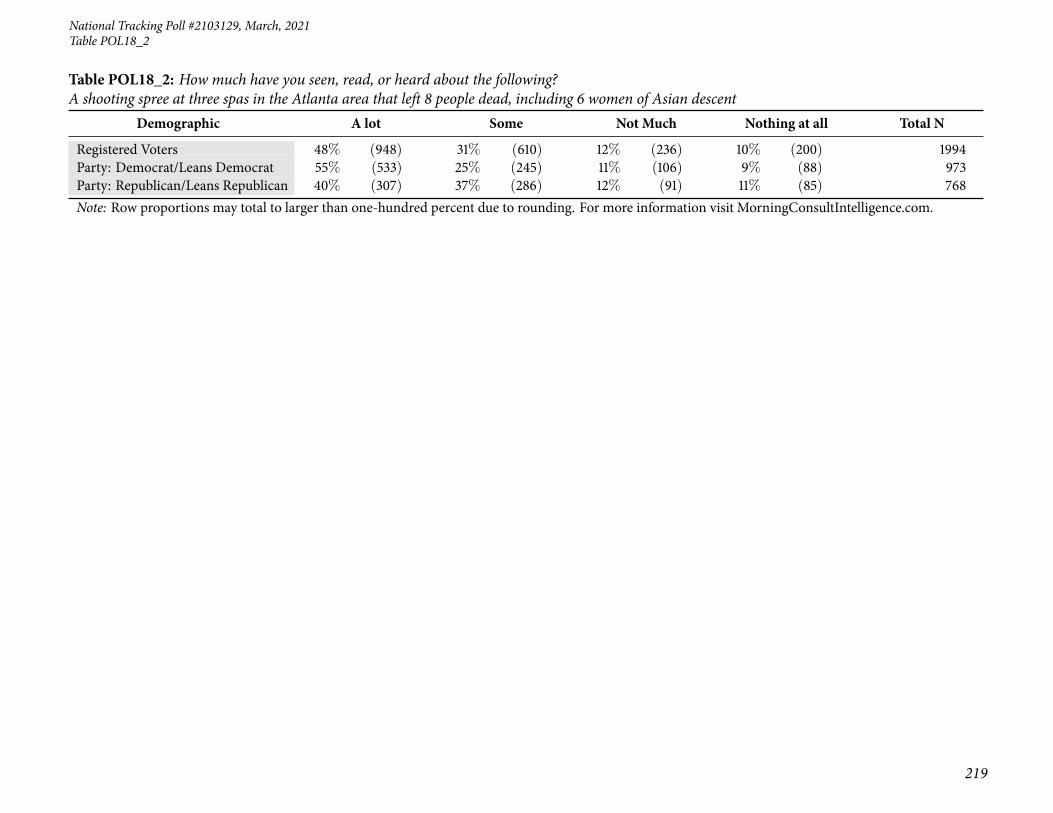
National Tracking Poll #2103129, March, 2021
219
Table POL18_2
Table POL18_2: How much have you seen, read, or heard about the following?A shooting spree at three spas in the Atlanta area that left 8 people dead, including 6 women of Asian descent
Demographic A lot Some Not Much Nothing at all Total N
Registered Voters 48% (948) 31% (610) 12% (236) 10% (200) 1994Party: Democrat/Leans Democrat 55% (533) 25% (245) 11% (106) 9% (88) 973Party: Republican/Leans Republican 40% (307) 37% (286) 12% (91) 11% (85) 768Note: Row proportions may total to larger than one-hundred percent due to rounding. For more information visit MorningConsultIntelligence.com.

220
Morning ConsultTable POL18_3
Table POL18_3: How much have you seen, read, or heard about the following?The opening weekend of the NCAAMarch Madness basketball tournaments
Demographic A lot Some Not Much Nothing at all Total N
Registered Voters 25% (503) 27% (538) 20% (393) 28% (561) 1994Gender: Male 30% (283) 29% (267) 19% (179) 22% (204) 933Gender: Female 21% (220) 25% (270) 20% (214) 34% (356) 1061Age: 18-34 24% (119) 26% (131) 18% (91) 32% (160) 501Age: 35-44 21% (63) 24% (73) 22% (66) 33% (101) 303Age: 45-64 27% (197) 28% (202) 20% (144) 25% (183) 726Age: 65+ 27% (125) 28% (132) 20% (91) 25% (116) 464GenZers: 1997-2012 23% (39) 22% (36) 21% (36) 34% (57) 168Millennials: 1981-1996 22% (121) 27% (151) 20% (111) 30% (167) 551GenXers: 1965-1980 25% (106) 29% (125) 18% (75) 28% (119) 424Baby Boomers: 1946-1964 28% (216) 26% (208) 21% (162) 25% (198) 784PID: Dem (no lean) 26% (212) 29% (239) 21% (171) 24% (195) 817PID: Ind (no lean) 23% (127) 24% (129) 20% (107) 33% (178) 542PID: Rep (no lean) 26% (164) 27% (169) 18% (114) 29% (187) 635PID/Gender: DemMen 31% (110) 33% (114) 19% (65) 17% (60) 350PID/Gender: DemWomen 22% (102) 27% (125) 23% (105) 29% (135) 467PID/Gender: Ind Men 28% (80) 24% (68) 20% (55) 28% (77) 280PID/Gender: Ind Women 18% (48) 23% (61) 20% (52) 38% (101) 262PID/Gender: Rep Men 31% (93) 28% (86) 19% (58) 22% (67) 304PID/Gender: Rep Women 21% (71) 25% (84) 17% (56) 36% (121) 332Ideo: Liberal (1-3) 26% (161) 29% (179) 24% (153) 21% (133) 625Ideo: Moderate (4) 24% (139) 29% (166) 17% (100) 29% (167) 571Ideo: Conservative (5-7) 27% (183) 26% (177) 18% (127) 29% (198) 685Educ: < College 24% (295) 25% (308) 20% (245) 32% (406) 1254Educ: Bachelors degree 27% (128) 32% (149) 18% (86) 23% (108) 472Educ: Post-grad 30% (80) 30% (81) 23% (61) 17% (46) 268Income: Under 50k 23% (226) 23% (223) 19% (191) 35% (348) 989Income: 50k-100k 26% (158) 32% (190) 20% (122) 22% (132) 602Income: 100k+ 29% (118) 31% (125) 20% (79) 20% (80) 402Ethnicity: White 24% (386) 28% (444) 20% (330) 28% (453) 1613Ethnicity: Hispanic 24% (46) 25% (49) 13% (25) 38% (73) 193Ethnicity: Black 35% (87) 25% (64) 13% (33) 27% (68) 253
Continued on next page

National Tracking Poll #2103129, March, 2021
221
Table POL18_3
Table POL18_3: How much have you seen, read, or heard about the following?The opening weekend of the NCAAMarch Madness basketball tournaments
Demographic A lot Some Not Much Nothing at all Total N
Registered Voters 25% (503) 27% (538) 20% (393) 28% (561) 1994Ethnicity: Other 23% (30) 23% (30) 23% (29) 31% (39) 128All Christian 28% (291) 30% (310) 20% (202) 22% (232) 1036All Non-Christian 28% (32) 28% (32) 15% (17) 29% (34) 115Atheist 24% (21) 26% (23) 20% (18) 29% (26) 88Agnostic/Nothing in particular 23% (104) 23% (104) 21% (94) 33% (149) 450Something Else 18% (54) 23% (69) 20% (61) 39% (120) 305Religious Non-Protestant/Catholic 26% (36) 25% (36) 18% (25) 31% (43) 141Evangelical 25% (139) 32% (173) 16% (86) 27% (150) 547Non-Evangelical 27% (200) 26% (194) 22% (163) 25% (186) 742Community: Urban 28% (162) 28% (164) 19% (111) 26% (150) 586Community: Suburban 25% (233) 26% (241) 22% (202) 27% (248) 924Community: Rural 22% (108) 27% (133) 17% (80) 34% (163) 484Employ: Private Sector 24% (161) 31% (206) 24% (157) 21% (139) 663Employ: Government 33% (39) 24% (29) 16% (19) 27% (32) 120Employ: Self-Employed 28% (48) 23% (40) 17% (29) 33% (58) 176Employ: Homemaker 17% (20) 24% (28) 10% (11) 49% (58) 118Employ: Student 27% (24) 18% (17) 24% (22) 31% (28) 91Employ: Retired 28% (148) 28% (152) 20% (105) 24% (130) 534Employ: Unemployed 18% (33) 23% (41) 19% (34) 41% (74) 182Employ: Other 26% (29) 22% (25) 14% (16) 37% (41) 111Military HH: Yes 33% (110) 27% (89) 18% (61) 22% (72) 333Military HH: No 24% (393) 27% (449) 20% (331) 29% (488) 1661RD/WT: Right Direction 27% (271) 31% (313) 20% (200) 23% (233) 1017RD/WT: Wrong Track 24% (232) 23% (225) 20% (193) 33% (327) 977Biden Job Approve 26% (298) 30% (337) 20% (225) 24% (267) 1127Biden Job Disapprove 25% (195) 24% (191) 19% (153) 32% (254) 792Biden Job Strongly Approve 30% (202) 28% (187) 18% (118) 24% (156) 663Biden Job Somewhat Approve 21% (96) 32% (150) 23% (107) 24% (111) 464Biden Job Somewhat Disapprove 22% (50) 26% (59) 19% (43) 34% (77) 229Biden Job Strongly Disapprove 26% (145) 23% (132) 19% (110) 31% (176) 562
Continued on next page

222
Morning ConsultTable POL18_3
Table POL18_3: How much have you seen, read, or heard about the following?The opening weekend of the NCAAMarch Madness basketball tournaments
Demographic A lot Some Not Much Nothing at all Total N
Registered Voters 25% (503) 27% (538) 20% (393) 28% (561) 1994Favorable of Biden 26% (297) 29% (335) 21% (235) 24% (275) 1143Unfavorable of Biden 24% (192) 24% (191) 20% (154) 31% (247) 785Very Favorable of Biden 28% (179) 30% (195) 19% (121) 23% (150) 644Somewhat Favorable of Biden 24% (119) 28% (140) 23% (114) 25% (125) 499Somewhat Unfavorable of Biden 22% (42) 31% (59) 18% (33) 29% (55) 190Very Unfavorable of Biden 25% (150) 22% (132) 20% (121) 32% (192) 595#1 Issue: Economy 26% (189) 28% (196) 19% (138) 27% (190) 714#1 Issue: Security 24% (72) 28% (85) 21% (63) 28% (85) 305#1 Issue: Health Care 24% (74) 28% (85) 18% (57) 30% (92) 308#1 Issue: Medicare / Social Security 26% (69) 27% (72) 23% (60) 25% (66) 267#1 Issue: Women’s Issues 23% (20) 21% (18) 23% (20) 33% (29) 88#1 Issue: Education 28% (25) 27% (24) 14% (13) 30% (27) 89#1 Issue: Energy 27% (24) 26% (23) 11% (10) 36% (32) 89#1 Issue: Other 22% (29) 25% (34) 24% (32) 29% (40) 1342020 Vote: Joe Biden 26% (272) 29% (305) 21% (220) 23% (240) 10372020 Vote: Donald Trump 26% (190) 25% (182) 19% (138) 31% (232) 7412020 Vote: Other 17% (10) 18% (11) 21% (13) 44% (27) 602020 Vote: Didn’t Vote 20% (30) 26% (40) 13% (20) 41% (63) 1532018 House Vote: Democrat 27% (203) 30% (221) 21% (155) 23% (169) 7482018 House Vote: Republican 29% (181) 26% (162) 18% (114) 27% (166) 6232018 House Vote: Someone else 17% (9) 21% (11) 23% (13) 39% (21) 552016 Vote: Hillary Clinton 27% (186) 29% (204) 22% (151) 23% (159) 7002016 Vote: Donald Trump 27% (195) 27% (192) 18% (131) 27% (195) 7132016 Vote: Other 28% (30) 22% (24) 20% (21) 31% (33) 1082016 Vote: Didn’t Vote 20% (92) 24% (114) 19% (87) 37% (174) 467Voted in 2014: Yes 27% (350) 28% (355) 21% (265) 24% (304) 1275Voted in 2014: No 21% (153) 25% (182) 18% (127) 36% (257) 7194-Region: Northeast 24% (86) 29% (103) 19% (69) 27% (98) 3564-Region: Midwest 29% (133) 27% (123) 19% (88) 25% (114) 4584-Region: South 24% (181) 27% (204) 20% (148) 28% (211) 7444-Region: West 24% (103) 25% (108) 20% (87) 32% (138) 436
Continued on next page

National Tracking Poll #2103129, March, 2021
223
Table POL18_3
Table POL18_3: How much have you seen, read, or heard about the following?The opening weekend of the NCAAMarch Madness basketball tournaments
Demographic A lot Some Not Much Nothing at all Total N
Registered Voters 25% (503) 27% (538) 20% (393) 28% (561) 1994Party: Democrat/Leans Democrat 26% (254) 29% (279) 21% (204) 24% (236) 973Party: Republican/Leans Republican 26% (202) 26% (197) 18% (139) 30% (231) 768Note: Row proportions may total to larger than one-hundred percent due to rounding. For more information visit MorningConsultIntelligence.com.
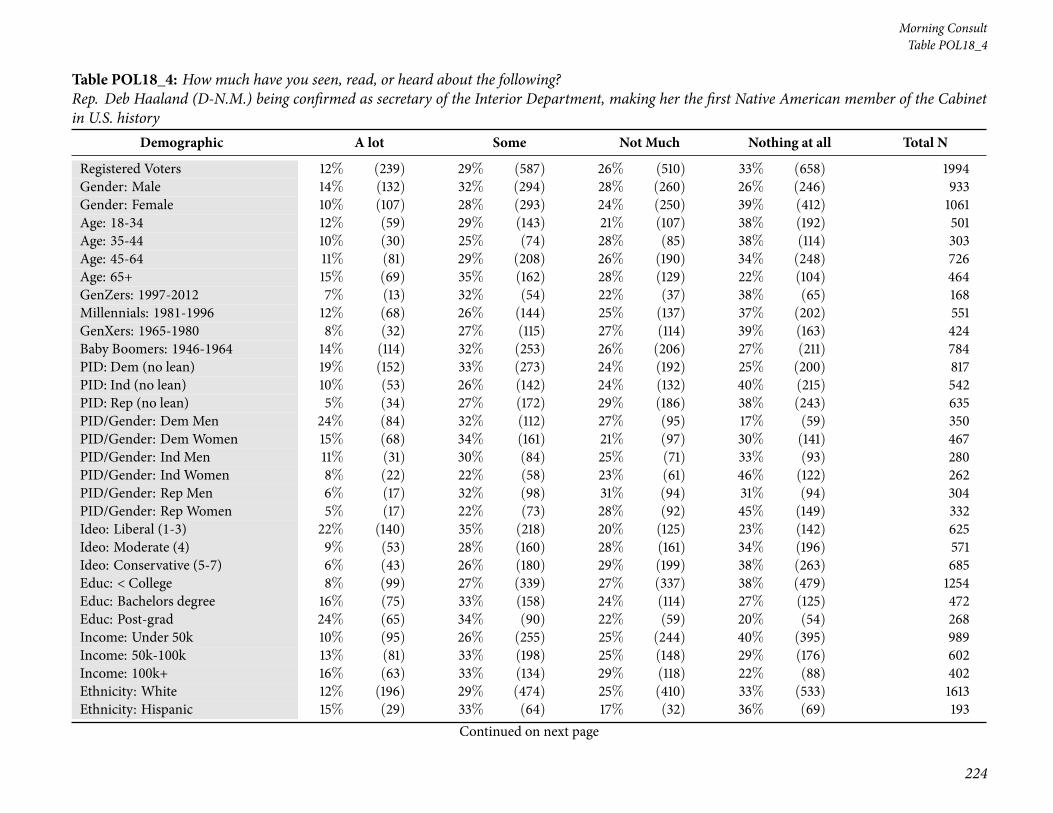
224
Morning ConsultTable POL18_4
Table POL18_4: How much have you seen, read, or heard about the following?Rep. Deb Haaland (D-N.M.) being confirmed as secretary of the Interior Department, making her the first Native American member of the Cabinetin U.S. history
Demographic A lot Some Not Much Nothing at all Total N
Registered Voters 12% (239) 29% (587) 26% (510) 33% (658) 1994Gender: Male 14% (132) 32% (294) 28% (260) 26% (246) 933Gender: Female 10% (107) 28% (293) 24% (250) 39% (412) 1061Age: 18-34 12% (59) 29% (143) 21% (107) 38% (192) 501Age: 35-44 10% (30) 25% (74) 28% (85) 38% (114) 303Age: 45-64 11% (81) 29% (208) 26% (190) 34% (248) 726Age: 65+ 15% (69) 35% (162) 28% (129) 22% (104) 464GenZers: 1997-2012 7% (13) 32% (54) 22% (37) 38% (65) 168Millennials: 1981-1996 12% (68) 26% (144) 25% (137) 37% (202) 551GenXers: 1965-1980 8% (32) 27% (115) 27% (114) 39% (163) 424Baby Boomers: 1946-1964 14% (114) 32% (253) 26% (206) 27% (211) 784PID: Dem (no lean) 19% (152) 33% (273) 24% (192) 25% (200) 817PID: Ind (no lean) 10% (53) 26% (142) 24% (132) 40% (215) 542PID: Rep (no lean) 5% (34) 27% (172) 29% (186) 38% (243) 635PID/Gender: DemMen 24% (84) 32% (112) 27% (95) 17% (59) 350PID/Gender: DemWomen 15% (68) 34% (161) 21% (97) 30% (141) 467PID/Gender: Ind Men 11% (31) 30% (84) 25% (71) 33% (93) 280PID/Gender: Ind Women 8% (22) 22% (58) 23% (61) 46% (122) 262PID/Gender: Rep Men 6% (17) 32% (98) 31% (94) 31% (94) 304PID/Gender: Rep Women 5% (17) 22% (73) 28% (92) 45% (149) 332Ideo: Liberal (1-3) 22% (140) 35% (218) 20% (125) 23% (142) 625Ideo: Moderate (4) 9% (53) 28% (160) 28% (161) 34% (196) 571Ideo: Conservative (5-7) 6% (43) 26% (180) 29% (199) 38% (263) 685Educ: < College 8% (99) 27% (339) 27% (337) 38% (479) 1254Educ: Bachelors degree 16% (75) 33% (158) 24% (114) 27% (125) 472Educ: Post-grad 24% (65) 34% (90) 22% (59) 20% (54) 268Income: Under 50k 10% (95) 26% (255) 25% (244) 40% (395) 989Income: 50k-100k 13% (81) 33% (198) 25% (148) 29% (176) 602Income: 100k+ 16% (63) 33% (134) 29% (118) 22% (88) 402Ethnicity: White 12% (196) 29% (474) 25% (410) 33% (533) 1613Ethnicity: Hispanic 15% (29) 33% (64) 17% (32) 36% (69) 193
Continued on next page

National Tracking Poll #2103129, March, 2021
225
Table POL18_4
Table POL18_4: How much have you seen, read, or heard about the following?Rep. Deb Haaland (D-N.M.) being confirmed as secretary of the Interior Department, making her the first Native American member of the Cabinetin U.S. history
Demographic A lot Some Not Much Nothing at all Total N
Registered Voters 12% (239) 29% (587) 26% (510) 33% (658) 1994Ethnicity: Black 12% (30) 30% (77) 27% (68) 31% (78) 253Ethnicity: Other 10% (13) 28% (36) 25% (32) 37% (47) 128All Christian 13% (135) 32% (329) 26% (264) 30% (307) 1036All Non-Christian 26% (30) 33% (38) 19% (22) 22% (25) 115Atheist 12% (11) 48% (42) 17% (15) 23% (20) 88Agnostic/Nothing in particular 10% (47) 27% (122) 25% (114) 37% (167) 450Something Else 5% (16) 18% (55) 31% (94) 45% (139) 305Religious Non-Protestant/Catholic 22% (31) 31% (43) 19% (27) 28% (39) 141Evangelical 10% (52) 24% (133) 30% (166) 36% (195) 547Non-Evangelical 13% (96) 32% (238) 24% (180) 31% (230) 742Community: Urban 16% (95) 31% (184) 23% (132) 30% (176) 586Community: Suburban 11% (99) 29% (270) 27% (253) 33% (302) 924Community: Rural 9% (45) 28% (133) 26% (125) 37% (181) 484Employ: Private Sector 12% (77) 32% (213) 26% (175) 30% (197) 663Employ: Government 15% (18) 33% (39) 24% (29) 28% (34) 120Employ: Self-Employed 16% (28) 28% (48) 30% (53) 26% (45) 176Employ: Homemaker 5% (6) 19% (23) 21% (24) 55% (64) 118Employ: Student 11% (10) 33% (30) 17% (16) 39% (35) 91Employ: Retired 15% (79) 33% (177) 27% (142) 26% (137) 534Employ: Unemployed 6% (12) 16% (30) 26% (47) 51% (93) 182Employ: Other 8% (9) 24% (27) 20% (23) 47% (53) 111Military HH: Yes 14% (48) 34% (112) 23% (76) 29% (97) 333Military HH: No 11% (191) 29% (475) 26% (434) 34% (561) 1661RD/WT: Right Direction 17% (178) 35% (354) 23% (229) 25% (256) 1017RD/WT: Wrong Track 6% (61) 24% (233) 29% (281) 41% (402) 977Biden Job Approve 18% (204) 33% (371) 23% (259) 26% (292) 1127Biden Job Disapprove 4% (35) 26% (207) 30% (238) 39% (312) 792
Continued on next page

226
Morning ConsultTable POL18_4
Table POL18_4: How much have you seen, read, or heard about the following?Rep. Deb Haaland (D-N.M.) being confirmed as secretary of the Interior Department, making her the first Native American member of the Cabinetin U.S. history
Demographic A lot Some Not Much Nothing at all Total N
Registered Voters 12% (239) 29% (587) 26% (510) 33% (658) 1994Biden Job Strongly Approve 23% (155) 35% (232) 19% (127) 22% (149) 663Biden Job Somewhat Approve 10% (49) 30% (139) 28% (132) 31% (144) 464Biden Job Somewhat Disapprove 3% (6) 28% (63) 29% (66) 41% (94) 229Biden Job Strongly Disapprove 5% (29) 26% (144) 31% (172) 39% (218) 562Favorable of Biden 17% (195) 34% (383) 23% (266) 26% (300) 1143Unfavorable of Biden 5% (41) 25% (195) 30% (235) 40% (314) 785Very Favorable of Biden 22% (144) 34% (220) 22% (142) 21% (138) 644Somewhat Favorable of Biden 10% (51) 33% (163) 25% (123) 32% (161) 499Somewhat Unfavorable of Biden 5% (10) 24% (46) 28% (54) 42% (80) 190Very Unfavorable of Biden 5% (32) 25% (148) 30% (181) 39% (234) 595#1 Issue: Economy 9% (66) 31% (219) 27% (195) 33% (234) 714#1 Issue: Security 11% (35) 24% (74) 24% (74) 40% (122) 305#1 Issue: Health Care 16% (50) 31% (96) 23% (70) 30% (91) 308#1 Issue: Medicare / Social Security 13% (35) 28% (75) 28% (76) 31% (82) 267#1 Issue: Women’s Issues 7% (6) 27% (24) 24% (21) 42% (37) 88#1 Issue: Education 8% (7) 45% (40) 18% (16) 30% (27) 89#1 Issue: Energy 24% (21) 27% (24) 23% (20) 26% (23) 89#1 Issue: Other 14% (19) 26% (35) 27% (37) 32% (42) 1342020 Vote: Joe Biden 18% (191) 33% (346) 23% (235) 25% (264) 10372020 Vote: Donald Trump 5% (38) 25% (183) 28% (210) 42% (310) 7412020 Vote: Other 4% (3) 22% (13) 26% (16) 48% (29) 602020 Vote: Didn’t Vote 5% (7) 29% (44) 30% (46) 36% (55) 1532018 House Vote: Democrat 22% (164) 36% (271) 22% (167) 20% (146) 7482018 House Vote: Republican 6% (38) 28% (177) 27% (169) 38% (239) 6232018 House Vote: Someone else 7% (4) 18% (10) 22% (12) 53% (29) 552016 Vote: Hillary Clinton 22% (153) 36% (254) 22% (155) 20% (139) 7002016 Vote: Donald Trump 7% (48) 27% (194) 27% (196) 39% (275) 7132016 Vote: Other 11% (12) 25% (27) 25% (27) 39% (42) 1082016 Vote: Didn’t Vote 6% (26) 24% (111) 28% (129) 43% (201) 467
Continued on next page

National Tracking Poll #2103129, March, 2021
227
Table POL18_4
Table POL18_4: How much have you seen, read, or heard about the following?Rep. Deb Haaland (D-N.M.) being confirmed as secretary of the Interior Department, making her the first Native American member of the Cabinetin U.S. history
Demographic A lot Some Not Much Nothing at all Total N
Registered Voters 12% (239) 29% (587) 26% (510) 33% (658) 1994Voted in 2014: Yes 15% (195) 32% (406) 25% (323) 28% (351) 1275Voted in 2014: No 6% (44) 25% (181) 26% (187) 43% (307) 7194-Region: Northeast 15% (55) 33% (116) 22% (78) 30% (107) 3564-Region: Midwest 10% (47) 29% (132) 29% (132) 32% (147) 4584-Region: South 11% (80) 29% (215) 26% (196) 34% (253) 7444-Region: West 13% (57) 29% (125) 24% (103) 35% (151) 436Party: Democrat/Leans Democrat 18% (180) 33% (325) 23% (228) 25% (240) 973Party: Republican/Leans Republican 5% (41) 26% (198) 29% (224) 40% (305) 768Note: Row proportions may total to larger than one-hundred percent due to rounding. For more information visit MorningConsultIntelligence.com.
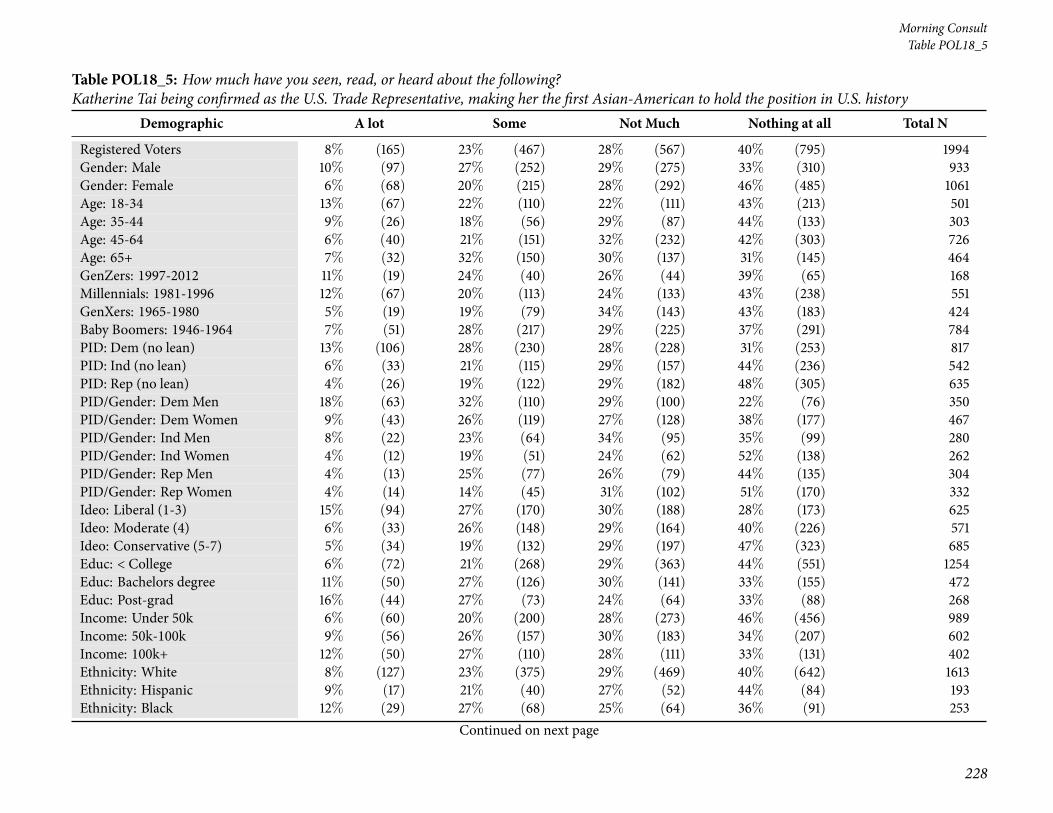
228
Morning ConsultTable POL18_5
Table POL18_5: How much have you seen, read, or heard about the following?Katherine Tai being confirmed as the U.S. Trade Representative, making her the first Asian-American to hold the position in U.S. history
Demographic A lot Some Not Much Nothing at all Total N
Registered Voters 8% (165) 23% (467) 28% (567) 40% (795) 1994Gender: Male 10% (97) 27% (252) 29% (275) 33% (310) 933Gender: Female 6% (68) 20% (215) 28% (292) 46% (485) 1061Age: 18-34 13% (67) 22% (110) 22% (111) 43% (213) 501Age: 35-44 9% (26) 18% (56) 29% (87) 44% (133) 303Age: 45-64 6% (40) 21% (151) 32% (232) 42% (303) 726Age: 65+ 7% (32) 32% (150) 30% (137) 31% (145) 464GenZers: 1997-2012 11% (19) 24% (40) 26% (44) 39% (65) 168Millennials: 1981-1996 12% (67) 20% (113) 24% (133) 43% (238) 551GenXers: 1965-1980 5% (19) 19% (79) 34% (143) 43% (183) 424Baby Boomers: 1946-1964 7% (51) 28% (217) 29% (225) 37% (291) 784PID: Dem (no lean) 13% (106) 28% (230) 28% (228) 31% (253) 817PID: Ind (no lean) 6% (33) 21% (115) 29% (157) 44% (236) 542PID: Rep (no lean) 4% (26) 19% (122) 29% (182) 48% (305) 635PID/Gender: DemMen 18% (63) 32% (110) 29% (100) 22% (76) 350PID/Gender: DemWomen 9% (43) 26% (119) 27% (128) 38% (177) 467PID/Gender: Ind Men 8% (22) 23% (64) 34% (95) 35% (99) 280PID/Gender: Ind Women 4% (12) 19% (51) 24% (62) 52% (138) 262PID/Gender: Rep Men 4% (13) 25% (77) 26% (79) 44% (135) 304PID/Gender: Rep Women 4% (14) 14% (45) 31% (102) 51% (170) 332Ideo: Liberal (1-3) 15% (94) 27% (170) 30% (188) 28% (173) 625Ideo: Moderate (4) 6% (33) 26% (148) 29% (164) 40% (226) 571Ideo: Conservative (5-7) 5% (34) 19% (132) 29% (197) 47% (323) 685Educ: < College 6% (72) 21% (268) 29% (363) 44% (551) 1254Educ: Bachelors degree 11% (50) 27% (126) 30% (141) 33% (155) 472Educ: Post-grad 16% (44) 27% (73) 24% (64) 33% (88) 268Income: Under 50k 6% (60) 20% (200) 28% (273) 46% (456) 989Income: 50k-100k 9% (56) 26% (157) 30% (183) 34% (207) 602Income: 100k+ 12% (50) 27% (110) 28% (111) 33% (131) 402Ethnicity: White 8% (127) 23% (375) 29% (469) 40% (642) 1613Ethnicity: Hispanic 9% (17) 21% (40) 27% (52) 44% (84) 193Ethnicity: Black 12% (29) 27% (68) 25% (64) 36% (91) 253
Continued on next page

National Tracking Poll #2103129, March, 2021
229
Table POL18_5
Table POL18_5: How much have you seen, read, or heard about the following?Katherine Tai being confirmed as the U.S. Trade Representative, making her the first Asian-American to hold the position in U.S. history
Demographic A lot Some Not Much Nothing at all Total N
Registered Voters 8% (165) 23% (467) 28% (567) 40% (795) 1994Ethnicity: Other 7% (9) 18% (24) 27% (34) 48% (61) 128All Christian 9% (98) 25% (263) 28% (293) 37% (382) 1036All Non-Christian 21% (24) 34% (40) 17% (20) 27% (32) 115Atheist 9% (8) 28% (24) 36% (31) 27% (24) 88Agnostic/Nothing in particular 4% (19) 23% (103) 31% (138) 42% (191) 450Something Else 6% (18) 12% (36) 28% (85) 54% (165) 305Religious Non-Protestant/Catholic 17% (24) 33% (47) 17% (24) 32% (46) 141Evangelical 10% (56) 20% (108) 28% (156) 42% (228) 547Non-Evangelical 8% (59) 24% (176) 28% (208) 40% (299) 742Community: Urban 15% (88) 27% (158) 21% (125) 37% (215) 586Community: Suburban 7% (64) 22% (207) 31% (287) 40% (366) 924Community: Rural 3% (14) 21% (101) 32% (155) 44% (214) 484Employ: Private Sector 9% (61) 25% (167) 30% (198) 36% (237) 663Employ: Government 16% (20) 24% (29) 25% (30) 34% (41) 120Employ: Self-Employed 11% (20) 26% (46) 30% (53) 32% (57) 176Employ: Homemaker 4% (5) 9% (11) 23% (27) 64% (75) 118Employ: Student 12% (11) 17% (15) 28% (26) 42% (39) 91Employ: Retired 7% (37) 29% (154) 30% (160) 34% (183) 534Employ: Unemployed 4% (8) 15% (26) 27% (49) 54% (99) 182Employ: Other 3% (4) 18% (20) 21% (23) 58% (64) 111Military HH: Yes 12% (39) 25% (83) 29% (97) 34% (114) 333Military HH: No 8% (126) 23% (384) 28% (470) 41% (681) 1661RD/WT: Right Direction 13% (128) 29% (300) 29% (291) 29% (299) 1017RD/WT: Wrong Track 4% (38) 17% (167) 28% (276) 51% (496) 977Biden Job Approve 12% (132) 28% (316) 29% (328) 31% (351) 1127Biden Job Disapprove 4% (31) 19% (147) 29% (230) 48% (383) 792Biden Job Strongly Approve 16% (109) 30% (197) 28% (188) 25% (169) 663Biden Job Somewhat Approve 5% (22) 26% (119) 30% (140) 39% (183) 464Biden Job Somewhat Disapprove 5% (10) 24% (55) 22% (51) 49% (112) 229Biden Job Strongly Disapprove 4% (21) 16% (92) 32% (179) 48% (271) 562
Continued on next page

230
Morning ConsultTable POL18_5
Table POL18_5: How much have you seen, read, or heard about the following?Katherine Tai being confirmed as the U.S. Trade Representative, making her the first Asian-American to hold the position in U.S. history
Demographic A lot Some Not Much Nothing at all Total N
Registered Voters 8% (165) 23% (467) 28% (567) 40% (795) 1994Favorable of Biden 11% (130) 28% (315) 29% (330) 32% (368) 1143Unfavorable of Biden 4% (29) 18% (144) 29% (229) 49% (383) 785Very Favorable of Biden 16% (105) 30% (196) 27% (176) 26% (167) 644Somewhat Favorable of Biden 5% (25) 24% (118) 31% (154) 40% (201) 499Somewhat Unfavorable of Biden 3% (5) 24% (46) 23% (44) 50% (95) 190Very Unfavorable of Biden 4% (24) 16% (98) 31% (185) 48% (288) 595#1 Issue: Economy 7% (50) 26% (187) 27% (193) 40% (283) 714#1 Issue: Security 8% (26) 20% (60) 29% (90) 42% (129) 305#1 Issue: Health Care 12% (37) 22% (69) 30% (91) 36% (111) 308#1 Issue: Medicare / Social Security 5% (13) 23% (62) 31% (83) 41% (109) 267#1 Issue: Women’s Issues 7% (6) 19% (17) 32% (28) 42% (37) 88#1 Issue: Education 7% (7) 28% (25) 22% (19) 43% (38) 89#1 Issue: Energy 21% (19) 21% (19) 28% (25) 30% (27) 89#1 Issue: Other 6% (8) 21% (28) 28% (38) 45% (61) 1342020 Vote: Joe Biden 12% (126) 28% (292) 29% (302) 30% (315) 10372020 Vote: Donald Trump 4% (29) 19% (143) 27% (202) 50% (367) 7412020 Vote: Other 3% (2) 13% (8) 32% (19) 52% (31) 602020 Vote: Didn’t Vote 5% (8) 16% (24) 28% (43) 51% (78) 1532018 House Vote: Democrat 14% (107) 28% (213) 30% (222) 28% (206) 7482018 House Vote: Republican 4% (26) 23% (140) 28% (172) 46% (284) 6232018 House Vote: Someone else 3% (2) 12% (7) 33% (18) 52% (28) 552016 Vote: Hillary Clinton 14% (99) 28% (195) 30% (212) 28% (194) 7002016 Vote: Donald Trump 5% (33) 22% (155) 29% (205) 45% (320) 7132016 Vote: Other 3% (3) 21% (23) 29% (31) 47% (51) 1082016 Vote: Didn’t Vote 6% (30) 19% (90) 25% (118) 49% (229) 467Voted in 2014: Yes 10% (129) 26% (328) 29% (371) 35% (447) 1275Voted in 2014: No 5% (37) 19% (139) 27% (196) 48% (347) 7194-Region: Northeast 12% (42) 29% (105) 23% (82) 36% (127) 3564-Region: Midwest 6% (27) 21% (98) 35% (161) 38% (172) 4584-Region: South 8% (62) 22% (166) 27% (203) 42% (314) 7444-Region: West 8% (35) 23% (99) 28% (121) 42% (181) 436
Continued on next page
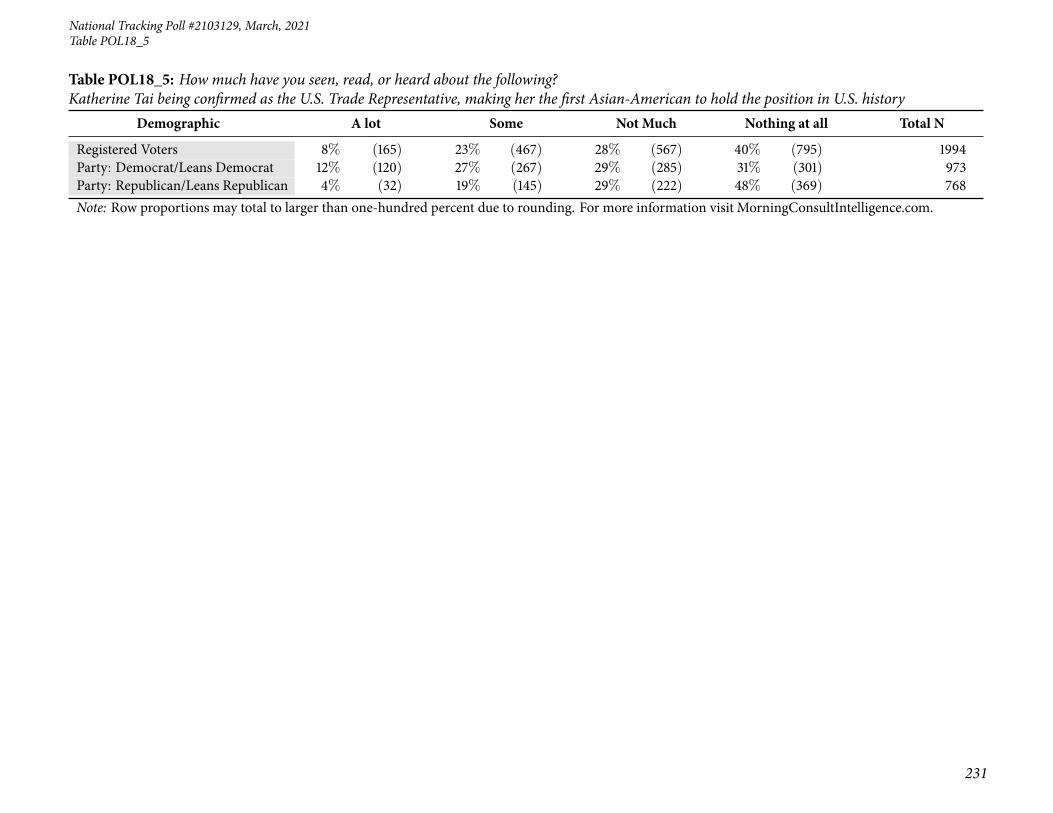
National Tracking Poll #2103129, March, 2021
231
Table POL18_5
Table POL18_5: How much have you seen, read, or heard about the following?Katherine Tai being confirmed as the U.S. Trade Representative, making her the first Asian-American to hold the position in U.S. history
Demographic A lot Some Not Much Nothing at all Total N
Registered Voters 8% (165) 23% (467) 28% (567) 40% (795) 1994Party: Democrat/Leans Democrat 12% (120) 27% (267) 29% (285) 31% (301) 973Party: Republican/Leans Republican 4% (32) 19% (145) 29% (222) 48% (369) 768Note: Row proportions may total to larger than one-hundred percent due to rounding. For more information visit MorningConsultIntelligence.com.

232
Morning ConsultTable POL18_6
Table POL18_6: How much have you seen, read, or heard about the following?Jury selection in the trial of Derek Chauvin, the Minneapolis police officer accused of killing George Floyd
Demographic A lot Some Not Much Nothing at all Total N
Registered Voters 23% (451) 38% (756) 20% (408) 19% (379) 1994Gender: Male 23% (212) 41% (383) 20% (188) 16% (150) 933Gender: Female 22% (238) 35% (373) 21% (220) 22% (229) 1061Age: 18-34 24% (122) 32% (162) 17% (84) 27% (133) 501Age: 35-44 20% (59) 36% (108) 23% (69) 22% (67) 303Age: 45-64 22% (160) 37% (268) 23% (169) 18% (130) 726Age: 65+ 24% (110) 47% (219) 19% (87) 10% (49) 464GenZers: 1997-2012 39% (66) 22% (37) 11% (19) 27% (46) 168Millennials: 1981-1996 18% (100) 38% (207) 21% (115) 23% (129) 551GenXers: 1965-1980 18% (78) 35% (150) 23% (98) 23% (99) 424Baby Boomers: 1946-1964 25% (192) 42% (330) 21% (163) 13% (99) 784PID: Dem (no lean) 27% (219) 37% (300) 20% (167) 16% (130) 817PID: Ind (no lean) 21% (116) 40% (216) 19% (105) 19% (105) 542PID: Rep (no lean) 18% (115) 38% (240) 21% (136) 23% (144) 635PID/Gender: DemMen 28% (96) 40% (139) 20% (70) 13% (45) 350PID/Gender: DemWomen 26% (123) 35% (161) 21% (98) 18% (85) 467PID/Gender: Ind Men 21% (58) 44% (124) 20% (55) 15% (42) 280PID/Gender: Ind Women 22% (58) 35% (92) 19% (49) 24% (63) 262PID/Gender: Rep Men 19% (58) 40% (120) 21% (63) 21% (63) 304PID/Gender: Rep Women 17% (57) 36% (120) 22% (73) 24% (81) 332Ideo: Liberal (1-3) 27% (169) 41% (255) 20% (125) 12% (76) 625Ideo: Moderate (4) 20% (112) 38% (215) 21% (118) 22% (126) 571Ideo: Conservative (5-7) 21% (143) 39% (265) 21% (147) 19% (131) 685Educ: < College 23% (282) 35% (443) 21% (259) 21% (270) 1254Educ: Bachelors degree 20% (94) 43% (204) 21% (97) 16% (76) 472Educ: Post-grad 28% (74) 41% (110) 19% (51) 12% (33) 268Income: Under 50k 23% (232) 34% (334) 21% (208) 22% (215) 989Income: 50k-100k 21% (127) 43% (261) 19% (112) 17% (103) 602Income: 100k+ 23% (92) 40% (162) 22% (88) 15% (61) 402Ethnicity: White 20% (329) 40% (640) 21% (345) 19% (299) 1613Ethnicity: Hispanic 26% (50) 36% (70) 20% (39) 18% (34) 193Ethnicity: Black 39% (98) 29% (72) 13% (32) 20% (50) 253
Continued on next page

National Tracking Poll #2103129, March, 2021
233
Table POL18_6
Table POL18_6: How much have you seen, read, or heard about the following?Jury selection in the trial of Derek Chauvin, the Minneapolis police officer accused of killing George Floyd
Demographic A lot Some Not Much Nothing at all Total N
Registered Voters 23% (451) 38% (756) 20% (408) 19% (379) 1994Ethnicity: Other 19% (24) 34% (44) 24% (31) 23% (29) 128All Christian 22% (227) 42% (432) 20% (212) 16% (165) 1036All Non-Christian 28% (32) 39% (45) 17% (20) 16% (19) 115Atheist 34% (30) 30% (26) 23% (20) 14% (12) 88Agnostic/Nothing in particular 23% (102) 35% (158) 22% (98) 21% (93) 450Something Else 20% (60) 31% (95) 19% (59) 30% (90) 305Religious Non-Protestant/Catholic 24% (33) 37% (52) 19% (27) 20% (28) 141Evangelical 20% (108) 37% (202) 21% (118) 22% (120) 547Non-Evangelical 24% (176) 41% (306) 19% (143) 16% (117) 742Community: Urban 28% (166) 35% (204) 19% (112) 18% (104) 586Community: Suburban 21% (191) 40% (372) 21% (190) 18% (171) 924Community: Rural 19% (93) 37% (180) 22% (106) 21% (103) 484Employ: Private Sector 19% (125) 40% (265) 21% (142) 20% (130) 663Employ: Government 24% (29) 33% (40) 22% (27) 20% (24) 120Employ: Self-Employed 28% (49) 39% (68) 17% (30) 16% (29) 176Employ: Homemaker 11% (13) 28% (33) 23% (27) 38% (45) 118Employ: Student 34% (31) 29% (27) 9% (9) 27% (24) 91Employ: Retired 24% (129) 45% (239) 20% (108) 11% (58) 534Employ: Unemployed 25% (45) 29% (53) 23% (41) 23% (43) 182Employ: Other 27% (30) 28% (32) 21% (23) 24% (26) 111Military HH: Yes 26% (87) 40% (132) 20% (66) 15% (48) 333Military HH: No 22% (364) 38% (624) 21% (343) 20% (330) 1661RD/WT: Right Direction 25% (254) 39% (393) 20% (200) 17% (170) 1017RD/WT: Wrong Track 20% (197) 37% (363) 21% (209) 21% (208) 977Biden Job Approve 26% (288) 39% (439) 19% (217) 16% (182) 1127Biden Job Disapprove 19% (149) 38% (298) 23% (183) 21% (162) 792Biden Job Strongly Approve 30% (198) 39% (260) 17% (114) 14% (91) 663Biden Job Somewhat Approve 19% (90) 39% (180) 22% (103) 20% (91) 464Biden Job Somewhat Disapprove 20% (47) 31% (71) 27% (62) 22% (50) 229Biden Job Strongly Disapprove 18% (102) 40% (228) 21% (121) 20% (112) 562
Continued on next page
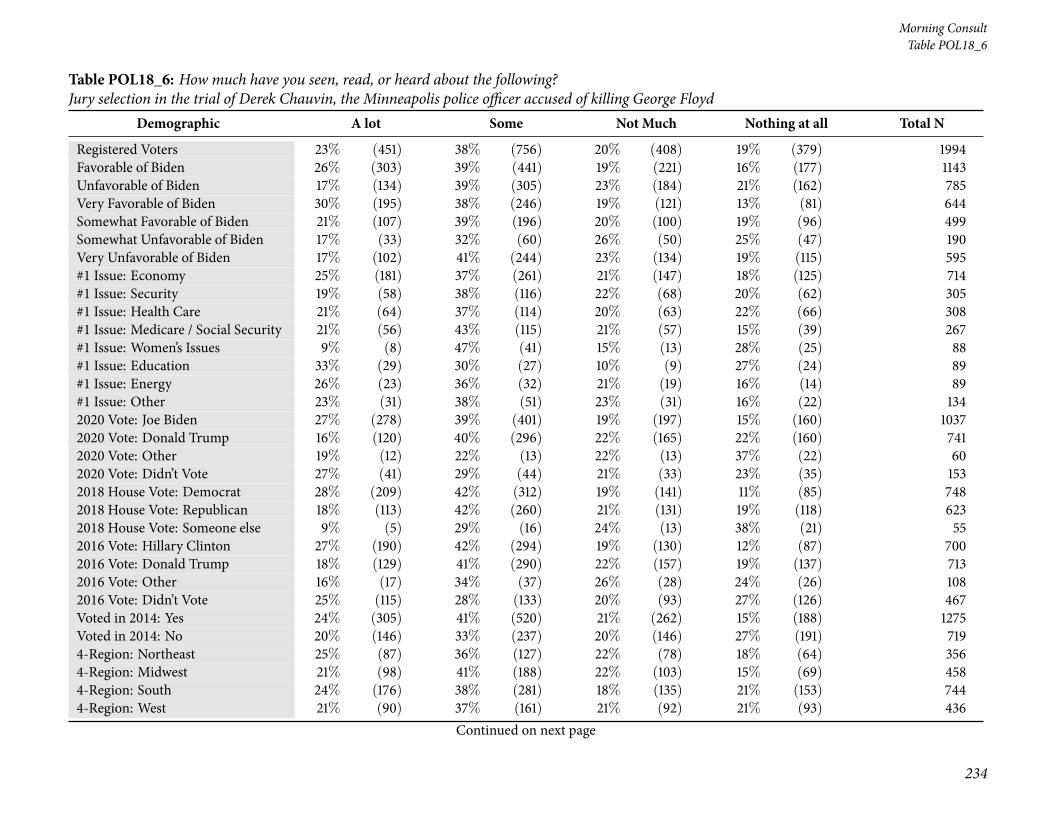
234
Morning ConsultTable POL18_6
Table POL18_6: How much have you seen, read, or heard about the following?Jury selection in the trial of Derek Chauvin, the Minneapolis police officer accused of killing George Floyd
Demographic A lot Some Not Much Nothing at all Total N
Registered Voters 23% (451) 38% (756) 20% (408) 19% (379) 1994Favorable of Biden 26% (303) 39% (441) 19% (221) 16% (177) 1143Unfavorable of Biden 17% (134) 39% (305) 23% (184) 21% (162) 785Very Favorable of Biden 30% (195) 38% (246) 19% (121) 13% (81) 644Somewhat Favorable of Biden 21% (107) 39% (196) 20% (100) 19% (96) 499Somewhat Unfavorable of Biden 17% (33) 32% (60) 26% (50) 25% (47) 190Very Unfavorable of Biden 17% (102) 41% (244) 23% (134) 19% (115) 595#1 Issue: Economy 25% (181) 37% (261) 21% (147) 18% (125) 714#1 Issue: Security 19% (58) 38% (116) 22% (68) 20% (62) 305#1 Issue: Health Care 21% (64) 37% (114) 20% (63) 22% (66) 308#1 Issue: Medicare / Social Security 21% (56) 43% (115) 21% (57) 15% (39) 267#1 Issue: Women’s Issues 9% (8) 47% (41) 15% (13) 28% (25) 88#1 Issue: Education 33% (29) 30% (27) 10% (9) 27% (24) 89#1 Issue: Energy 26% (23) 36% (32) 21% (19) 16% (14) 89#1 Issue: Other 23% (31) 38% (51) 23% (31) 16% (22) 1342020 Vote: Joe Biden 27% (278) 39% (401) 19% (197) 15% (160) 10372020 Vote: Donald Trump 16% (120) 40% (296) 22% (165) 22% (160) 7412020 Vote: Other 19% (12) 22% (13) 22% (13) 37% (22) 602020 Vote: Didn’t Vote 27% (41) 29% (44) 21% (33) 23% (35) 1532018 House Vote: Democrat 28% (209) 42% (312) 19% (141) 11% (85) 7482018 House Vote: Republican 18% (113) 42% (260) 21% (131) 19% (118) 6232018 House Vote: Someone else 9% (5) 29% (16) 24% (13) 38% (21) 552016 Vote: Hillary Clinton 27% (190) 42% (294) 19% (130) 12% (87) 7002016 Vote: Donald Trump 18% (129) 41% (290) 22% (157) 19% (137) 7132016 Vote: Other 16% (17) 34% (37) 26% (28) 24% (26) 1082016 Vote: Didn’t Vote 25% (115) 28% (133) 20% (93) 27% (126) 467Voted in 2014: Yes 24% (305) 41% (520) 21% (262) 15% (188) 1275Voted in 2014: No 20% (146) 33% (237) 20% (146) 27% (191) 7194-Region: Northeast 25% (87) 36% (127) 22% (78) 18% (64) 3564-Region: Midwest 21% (98) 41% (188) 22% (103) 15% (69) 4584-Region: South 24% (176) 38% (281) 18% (135) 21% (153) 7444-Region: West 21% (90) 37% (161) 21% (92) 21% (93) 436
Continued on next page
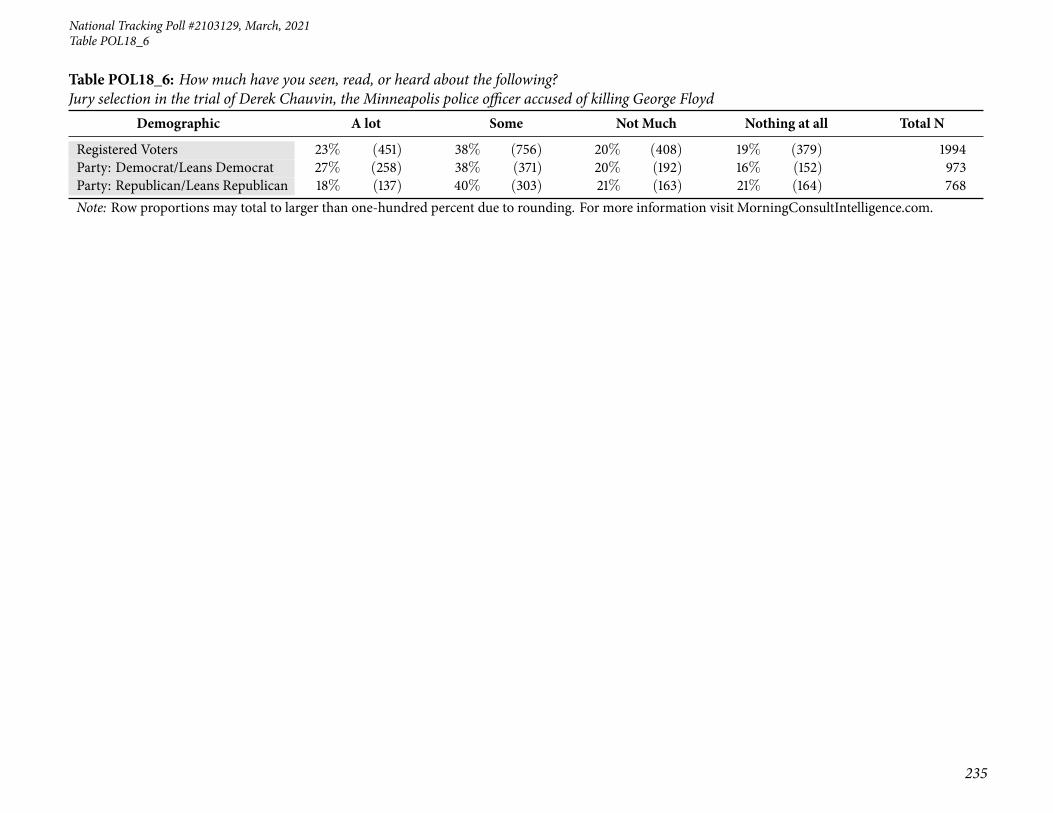
National Tracking Poll #2103129, March, 2021
235
Table POL18_6
Table POL18_6: How much have you seen, read, or heard about the following?Jury selection in the trial of Derek Chauvin, the Minneapolis police officer accused of killing George Floyd
Demographic A lot Some Not Much Nothing at all Total N
Registered Voters 23% (451) 38% (756) 20% (408) 19% (379) 1994Party: Democrat/Leans Democrat 27% (258) 38% (371) 20% (192) 16% (152) 973Party: Republican/Leans Republican 18% (137) 40% (303) 21% (163) 21% (164) 768Note: Row proportions may total to larger than one-hundred percent due to rounding. For more information visit MorningConsultIntelligence.com.

236
Morning ConsultTable POL18_7
Table POL18_7: How much have you seen, read, or heard about the following?President Joe Biden’s dog, Major, biting someone at the White House
Demographic A lot Some Not Much Nothing at all Total N
Registered Voters 18% (354) 33% (663) 20% (396) 29% (581) 1994Gender: Male 18% (169) 34% (314) 20% (187) 28% (263) 933Gender: Female 17% (185) 33% (349) 20% (209) 30% (318) 1061Age: 18-34 13% (66) 26% (128) 24% (118) 38% (189) 501Age: 35-44 20% (60) 28% (84) 18% (56) 34% (104) 303Age: 45-64 18% (129) 36% (260) 19% (141) 27% (196) 726Age: 65+ 21% (100) 41% (192) 18% (81) 20% (91) 464GenZers: 1997-2012 9% (15) 19% (32) 25% (42) 47% (78) 168Millennials: 1981-1996 17% (92) 29% (162) 21% (114) 33% (182) 551GenXers: 1965-1980 17% (74) 32% (135) 19% (83) 31% (132) 424Baby Boomers: 1946-1964 20% (155) 40% (310) 19% (147) 22% (173) 784PID: Dem (no lean) 21% (170) 34% (276) 19% (156) 26% (215) 817PID: Ind (no lean) 14% (77) 33% (181) 22% (117) 31% (167) 542PID: Rep (no lean) 17% (107) 32% (206) 19% (123) 31% (199) 635PID/Gender: DemMen 22% (78) 31% (109) 19% (68) 27% (94) 350PID/Gender: DemWomen 20% (92) 36% (167) 19% (88) 26% (120) 467PID/Gender: Ind Men 14% (40) 38% (105) 23% (65) 25% (70) 280PID/Gender: Ind Women 14% (38) 29% (76) 20% (52) 37% (96) 262PID/Gender: Rep Men 17% (51) 33% (101) 18% (54) 32% (98) 304PID/Gender: Rep Women 17% (55) 32% (105) 21% (69) 31% (102) 332Ideo: Liberal (1-3) 21% (132) 33% (209) 21% (130) 25% (154) 625Ideo: Moderate (4) 14% (81) 36% (205) 19% (111) 30% (173) 571Ideo: Conservative (5-7) 19% (131) 33% (227) 19% (129) 29% (198) 685Educ: < College 15% (187) 33% (412) 20% (256) 32% (398) 1254Educ: Bachelors degree 21% (101) 34% (161) 20% (93) 25% (116) 472Educ: Post-grad 24% (66) 33% (90) 17% (47) 25% (67) 268Income: Under 50k 16% (154) 32% (314) 21% (206) 32% (315) 989Income: 50k-100k 19% (112) 37% (223) 18% (109) 26% (158) 602Income: 100k+ 22% (88) 31% (126) 20% (81) 27% (107) 402Ethnicity: White 19% (303) 34% (550) 20% (317) 27% (443) 1613Ethnicity: Hispanic 13% (25) 37% (72) 18% (35) 31% (61) 193Ethnicity: Black 15% (37) 31% (80) 19% (48) 35% (88) 253
Continued on next page
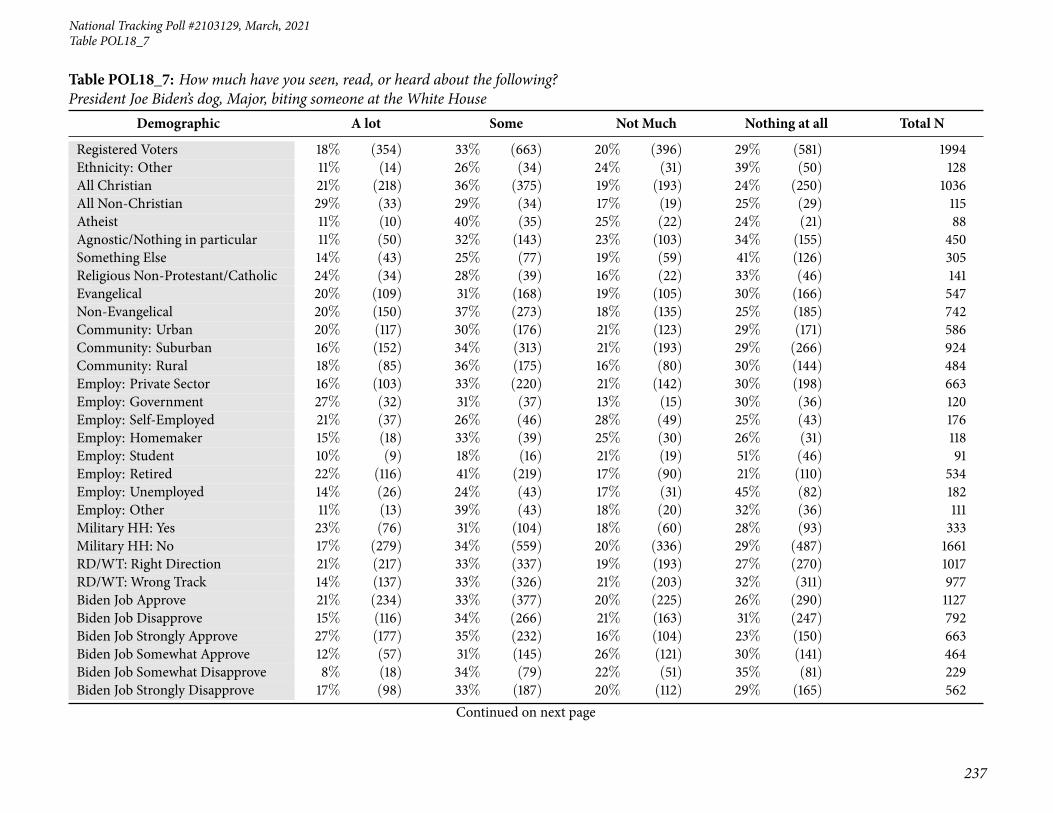
National Tracking Poll #2103129, March, 2021
237
Table POL18_7
Table POL18_7: How much have you seen, read, or heard about the following?President Joe Biden’s dog, Major, biting someone at the White House
Demographic A lot Some Not Much Nothing at all Total N
Registered Voters 18% (354) 33% (663) 20% (396) 29% (581) 1994Ethnicity: Other 11% (14) 26% (34) 24% (31) 39% (50) 128All Christian 21% (218) 36% (375) 19% (193) 24% (250) 1036All Non-Christian 29% (33) 29% (34) 17% (19) 25% (29) 115Atheist 11% (10) 40% (35) 25% (22) 24% (21) 88Agnostic/Nothing in particular 11% (50) 32% (143) 23% (103) 34% (155) 450Something Else 14% (43) 25% (77) 19% (59) 41% (126) 305Religious Non-Protestant/Catholic 24% (34) 28% (39) 16% (22) 33% (46) 141Evangelical 20% (109) 31% (168) 19% (105) 30% (166) 547Non-Evangelical 20% (150) 37% (273) 18% (135) 25% (185) 742Community: Urban 20% (117) 30% (176) 21% (123) 29% (171) 586Community: Suburban 16% (152) 34% (313) 21% (193) 29% (266) 924Community: Rural 18% (85) 36% (175) 16% (80) 30% (144) 484Employ: Private Sector 16% (103) 33% (220) 21% (142) 30% (198) 663Employ: Government 27% (32) 31% (37) 13% (15) 30% (36) 120Employ: Self-Employed 21% (37) 26% (46) 28% (49) 25% (43) 176Employ: Homemaker 15% (18) 33% (39) 25% (30) 26% (31) 118Employ: Student 10% (9) 18% (16) 21% (19) 51% (46) 91Employ: Retired 22% (116) 41% (219) 17% (90) 21% (110) 534Employ: Unemployed 14% (26) 24% (43) 17% (31) 45% (82) 182Employ: Other 11% (13) 39% (43) 18% (20) 32% (36) 111Military HH: Yes 23% (76) 31% (104) 18% (60) 28% (93) 333Military HH: No 17% (279) 34% (559) 20% (336) 29% (487) 1661RD/WT: Right Direction 21% (217) 33% (337) 19% (193) 27% (270) 1017RD/WT: Wrong Track 14% (137) 33% (326) 21% (203) 32% (311) 977Biden Job Approve 21% (234) 33% (377) 20% (225) 26% (290) 1127Biden Job Disapprove 15% (116) 34% (266) 21% (163) 31% (247) 792Biden Job Strongly Approve 27% (177) 35% (232) 16% (104) 23% (150) 663Biden Job Somewhat Approve 12% (57) 31% (145) 26% (121) 30% (141) 464Biden Job Somewhat Disapprove 8% (18) 34% (79) 22% (51) 35% (81) 229Biden Job Strongly Disapprove 17% (98) 33% (187) 20% (112) 29% (165) 562
Continued on next page

238
Morning ConsultTable POL18_7
Table POL18_7: How much have you seen, read, or heard about the following?President Joe Biden’s dog, Major, biting someone at the White House
Demographic A lot Some Not Much Nothing at all Total N
Registered Voters 18% (354) 33% (663) 20% (396) 29% (581) 1994Favorable of Biden 20% (232) 33% (381) 19% (221) 27% (308) 1143Unfavorable of Biden 15% (114) 34% (268) 21% (168) 30% (234) 785Very Favorable of Biden 27% (177) 33% (210) 17% (112) 23% (145) 644Somewhat Favorable of Biden 11% (56) 34% (171) 22% (109) 33% (163) 499Somewhat Unfavorable of Biden 7% (14) 34% (65) 25% (48) 33% (63) 190Very Unfavorable of Biden 17% (100) 34% (203) 20% (121) 29% (171) 595#1 Issue: Economy 15% (106) 33% (236) 21% (153) 31% (218) 714#1 Issue: Security 21% (63) 35% (106) 18% (55) 27% (81) 305#1 Issue: Health Care 21% (65) 32% (99) 21% (65) 26% (79) 308#1 Issue: Medicare / Social Security 22% (59) 39% (104) 16% (42) 23% (62) 267#1 Issue: Women’s Issues 16% (14) 26% (23) 22% (19) 36% (32) 88#1 Issue: Education 10% (9) 26% (24) 17% (16) 46% (41) 89#1 Issue: Energy 21% (19) 36% (32) 15% (14) 27% (24) 89#1 Issue: Other 15% (20) 29% (38) 24% (33) 32% (43) 1342020 Vote: Joe Biden 21% (216) 34% (350) 21% (216) 25% (255) 10372020 Vote: Donald Trump 16% (118) 33% (247) 19% (139) 32% (237) 7412020 Vote: Other 15% (9) 19% (11) 14% (9) 53% (32) 602020 Vote: Didn’t Vote 7% (11) 36% (55) 20% (31) 37% (56) 1532018 House Vote: Democrat 21% (158) 38% (287) 18% (135) 22% (168) 7482018 House Vote: Republican 18% (114) 34% (211) 20% (123) 28% (175) 6232018 House Vote: Someone else 19% (10) 22% (12) 26% (14) 33% (18) 552016 Vote: Hillary Clinton 21% (146) 36% (255) 22% (151) 21% (149) 7002016 Vote: Donald Trump 18% (125) 36% (255) 18% (130) 29% (203) 7132016 Vote: Other 15% (16) 34% (36) 24% (26) 28% (30) 1082016 Vote: Didn’t Vote 14% (67) 24% (114) 19% (90) 42% (196) 467Voted in 2014: Yes 20% (255) 36% (465) 20% (249) 24% (306) 1275Voted in 2014: No 14% (99) 28% (198) 20% (147) 38% (275) 7194-Region: Northeast 23% (81) 32% (115) 18% (64) 27% (96) 3564-Region: Midwest 16% (75) 35% (162) 23% (104) 26% (118) 4584-Region: South 17% (126) 34% (254) 19% (143) 30% (221) 7444-Region: West 16% (71) 30% (133) 20% (85) 34% (146) 436
Continued on next page

National Tracking Poll #2103129, March, 2021
239
Table POL18_7
Table POL18_7: How much have you seen, read, or heard about the following?President Joe Biden’s dog, Major, biting someone at the White House
Demographic A lot Some Not Much Nothing at all Total N
Registered Voters 18% (354) 33% (663) 20% (396) 29% (581) 1994Party: Democrat/Leans Democrat 20% (196) 34% (334) 20% (190) 26% (252) 973Party: Republican/Leans Republican 17% (131) 33% (254) 20% (150) 30% (232) 768Note: Row proportions may total to larger than one-hundred percent due to rounding. For more information visit MorningConsultIntelligence.com.
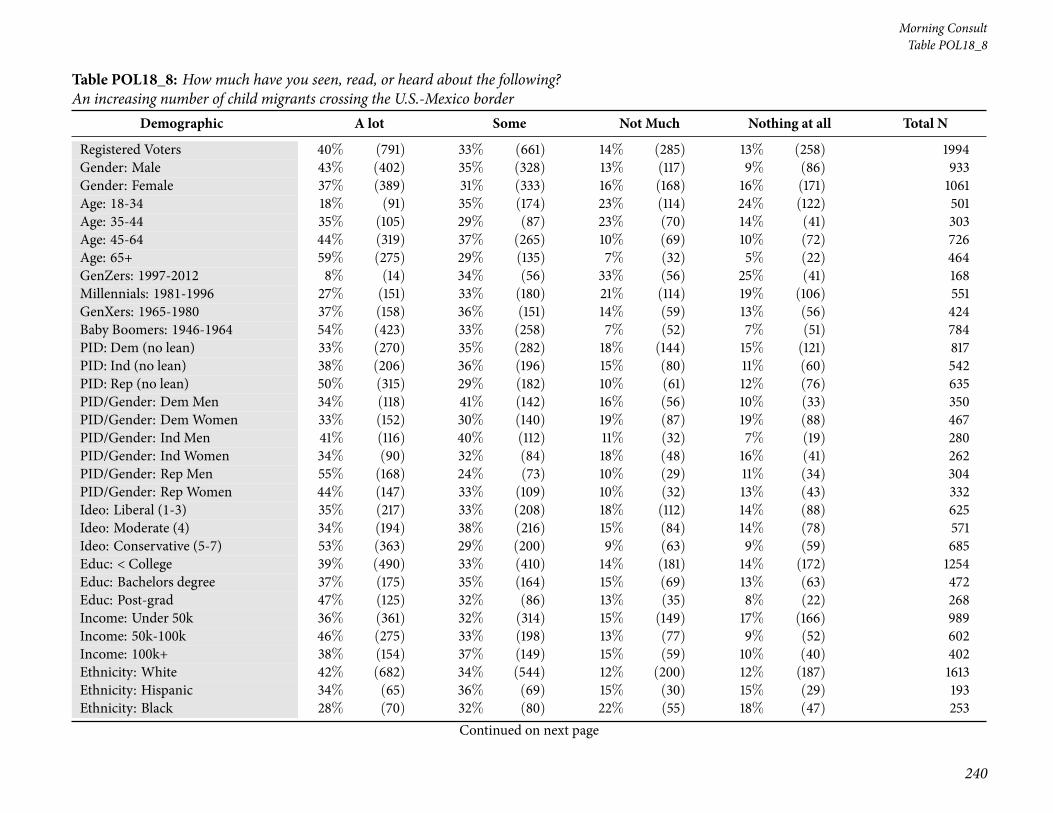
240
Morning ConsultTable POL18_8
Table POL18_8: How much have you seen, read, or heard about the following?An increasing number of child migrants crossing the U.S.-Mexico border
Demographic A lot Some Not Much Nothing at all Total N
Registered Voters 40% (791) 33% (661) 14% (285) 13% (258) 1994Gender: Male 43% (402) 35% (328) 13% (117) 9% (86) 933Gender: Female 37% (389) 31% (333) 16% (168) 16% (171) 1061Age: 18-34 18% (91) 35% (174) 23% (114) 24% (122) 501Age: 35-44 35% (105) 29% (87) 23% (70) 14% (41) 303Age: 45-64 44% (319) 37% (265) 10% (69) 10% (72) 726Age: 65+ 59% (275) 29% (135) 7% (32) 5% (22) 464GenZers: 1997-2012 8% (14) 34% (56) 33% (56) 25% (41) 168Millennials: 1981-1996 27% (151) 33% (180) 21% (114) 19% (106) 551GenXers: 1965-1980 37% (158) 36% (151) 14% (59) 13% (56) 424Baby Boomers: 1946-1964 54% (423) 33% (258) 7% (52) 7% (51) 784PID: Dem (no lean) 33% (270) 35% (282) 18% (144) 15% (121) 817PID: Ind (no lean) 38% (206) 36% (196) 15% (80) 11% (60) 542PID: Rep (no lean) 50% (315) 29% (182) 10% (61) 12% (76) 635PID/Gender: DemMen 34% (118) 41% (142) 16% (56) 10% (33) 350PID/Gender: DemWomen 33% (152) 30% (140) 19% (87) 19% (88) 467PID/Gender: Ind Men 41% (116) 40% (112) 11% (32) 7% (19) 280PID/Gender: Ind Women 34% (90) 32% (84) 18% (48) 16% (41) 262PID/Gender: Rep Men 55% (168) 24% (73) 10% (29) 11% (34) 304PID/Gender: Rep Women 44% (147) 33% (109) 10% (32) 13% (43) 332Ideo: Liberal (1-3) 35% (217) 33% (208) 18% (112) 14% (88) 625Ideo: Moderate (4) 34% (194) 38% (216) 15% (84) 14% (78) 571Ideo: Conservative (5-7) 53% (363) 29% (200) 9% (63) 9% (59) 685Educ: < College 39% (490) 33% (410) 14% (181) 14% (172) 1254Educ: Bachelors degree 37% (175) 35% (164) 15% (69) 13% (63) 472Educ: Post-grad 47% (125) 32% (86) 13% (35) 8% (22) 268Income: Under 50k 36% (361) 32% (314) 15% (149) 17% (166) 989Income: 50k-100k 46% (275) 33% (198) 13% (77) 9% (52) 602Income: 100k+ 38% (154) 37% (149) 15% (59) 10% (40) 402Ethnicity: White 42% (682) 34% (544) 12% (200) 12% (187) 1613Ethnicity: Hispanic 34% (65) 36% (69) 15% (30) 15% (29) 193Ethnicity: Black 28% (70) 32% (80) 22% (55) 18% (47) 253
Continued on next page

National Tracking Poll #2103129, March, 2021
241
Table POL18_8
Table POL18_8: How much have you seen, read, or heard about the following?An increasing number of child migrants crossing the U.S.-Mexico border
Demographic A lot Some Not Much Nothing at all Total N
Registered Voters 40% (791) 33% (661) 14% (285) 13% (258) 1994Ethnicity: Other 30% (38) 28% (36) 23% (30) 19% (24) 128All Christian 46% (480) 32% (336) 11% (118) 10% (102) 1036All Non-Christian 39% (45) 32% (37) 14% (16) 15% (17) 115Atheist 31% (27) 38% (33) 20% (17) 11% (10) 88Agnostic/Nothing in particular 31% (141) 33% (149) 18% (82) 17% (78) 450Something Else 32% (97) 35% (106) 17% (51) 16% (50) 305Religious Non-Protestant/Catholic 36% (51) 32% (45) 13% (18) 19% (26) 141Evangelical 40% (218) 38% (207) 12% (67) 10% (55) 547Non-Evangelical 47% (347) 29% (214) 13% (98) 11% (84) 742Community: Urban 36% (213) 35% (206) 14% (84) 14% (84) 586Community: Suburban 41% (382) 30% (276) 16% (150) 13% (117) 924Community: Rural 40% (196) 37% (179) 11% (52) 12% (57) 484Employ: Private Sector 34% (227) 35% (234) 16% (109) 14% (93) 663Employ: Government 38% (46) 40% (48) 13% (15) 10% (12) 120Employ: Self-Employed 42% (73) 31% (54) 13% (23) 14% (24) 176Employ: Homemaker 34% (39) 33% (39) 11% (13) 22% (26) 118Employ: Student 12% (11) 37% (33) 34% (30) 18% (16) 91Employ: Retired 55% (295) 31% (163) 8% (41) 7% (35) 534Employ: Unemployed 29% (54) 34% (62) 18% (33) 18% (34) 182Employ: Other 41% (46) 25% (28) 17% (19) 16% (18) 111Military HH: Yes 46% (154) 31% (103) 16% (52) 7% (23) 333Military HH: No 38% (636) 34% (558) 14% (233) 14% (234) 1661RD/WT: Right Direction 34% (341) 35% (356) 17% (173) 14% (147) 1017RD/WT: Wrong Track 46% (450) 31% (305) 11% (112) 11% (111) 977Biden Job Approve 34% (380) 36% (409) 17% (187) 13% (151) 1127Biden Job Disapprove 50% (395) 30% (235) 11% (84) 10% (77) 792Biden Job Strongly Approve 41% (274) 34% (226) 12% (79) 13% (84) 663Biden Job Somewhat Approve 23% (106) 39% (183) 23% (108) 14% (67) 464Biden Job Somewhat Disapprove 28% (64) 37% (86) 20% (46) 15% (33) 229Biden Job Strongly Disapprove 59% (331) 27% (149) 7% (39) 8% (43) 562
Continued on next page
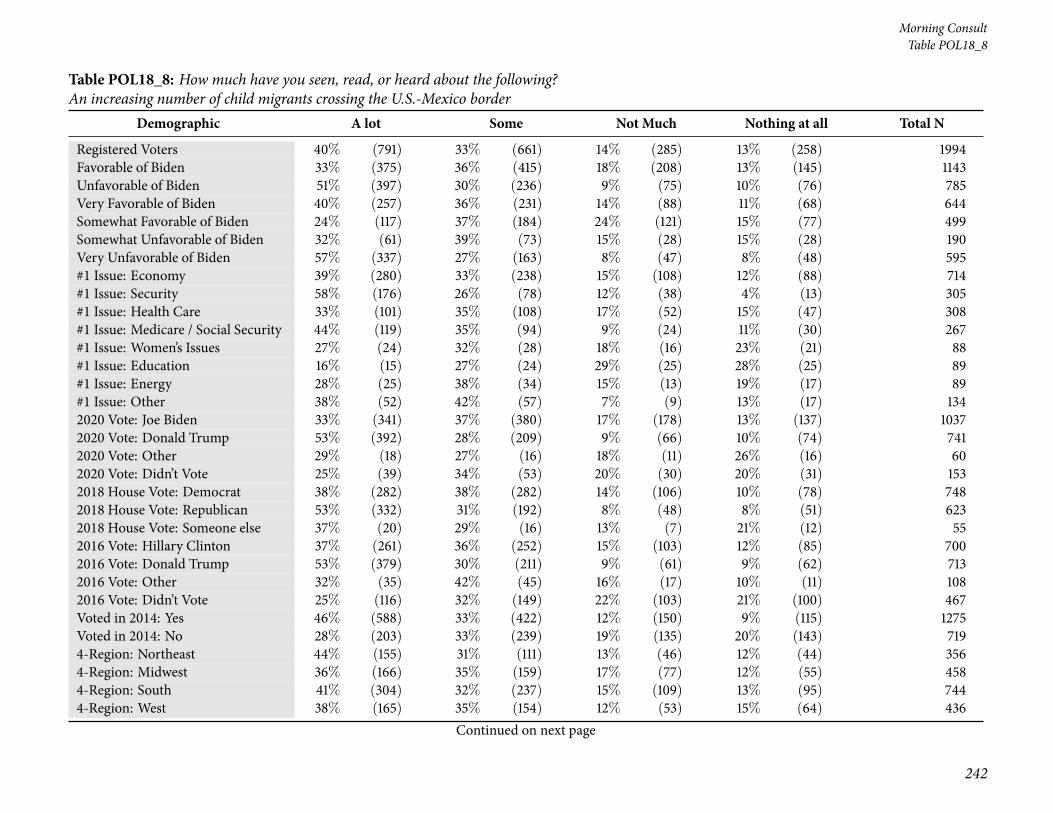
242
Morning ConsultTable POL18_8
Table POL18_8: How much have you seen, read, or heard about the following?An increasing number of child migrants crossing the U.S.-Mexico border
Demographic A lot Some Not Much Nothing at all Total N
Registered Voters 40% (791) 33% (661) 14% (285) 13% (258) 1994Favorable of Biden 33% (375) 36% (415) 18% (208) 13% (145) 1143Unfavorable of Biden 51% (397) 30% (236) 9% (75) 10% (76) 785Very Favorable of Biden 40% (257) 36% (231) 14% (88) 11% (68) 644Somewhat Favorable of Biden 24% (117) 37% (184) 24% (121) 15% (77) 499Somewhat Unfavorable of Biden 32% (61) 39% (73) 15% (28) 15% (28) 190Very Unfavorable of Biden 57% (337) 27% (163) 8% (47) 8% (48) 595#1 Issue: Economy 39% (280) 33% (238) 15% (108) 12% (88) 714#1 Issue: Security 58% (176) 26% (78) 12% (38) 4% (13) 305#1 Issue: Health Care 33% (101) 35% (108) 17% (52) 15% (47) 308#1 Issue: Medicare / Social Security 44% (119) 35% (94) 9% (24) 11% (30) 267#1 Issue: Women’s Issues 27% (24) 32% (28) 18% (16) 23% (21) 88#1 Issue: Education 16% (15) 27% (24) 29% (25) 28% (25) 89#1 Issue: Energy 28% (25) 38% (34) 15% (13) 19% (17) 89#1 Issue: Other 38% (52) 42% (57) 7% (9) 13% (17) 1342020 Vote: Joe Biden 33% (341) 37% (380) 17% (178) 13% (137) 10372020 Vote: Donald Trump 53% (392) 28% (209) 9% (66) 10% (74) 7412020 Vote: Other 29% (18) 27% (16) 18% (11) 26% (16) 602020 Vote: Didn’t Vote 25% (39) 34% (53) 20% (30) 20% (31) 1532018 House Vote: Democrat 38% (282) 38% (282) 14% (106) 10% (78) 7482018 House Vote: Republican 53% (332) 31% (192) 8% (48) 8% (51) 6232018 House Vote: Someone else 37% (20) 29% (16) 13% (7) 21% (12) 552016 Vote: Hillary Clinton 37% (261) 36% (252) 15% (103) 12% (85) 7002016 Vote: Donald Trump 53% (379) 30% (211) 9% (61) 9% (62) 7132016 Vote: Other 32% (35) 42% (45) 16% (17) 10% (11) 1082016 Vote: Didn’t Vote 25% (116) 32% (149) 22% (103) 21% (100) 467Voted in 2014: Yes 46% (588) 33% (422) 12% (150) 9% (115) 1275Voted in 2014: No 28% (203) 33% (239) 19% (135) 20% (143) 7194-Region: Northeast 44% (155) 31% (111) 13% (46) 12% (44) 3564-Region: Midwest 36% (166) 35% (159) 17% (77) 12% (55) 4584-Region: South 41% (304) 32% (237) 15% (109) 13% (95) 7444-Region: West 38% (165) 35% (154) 12% (53) 15% (64) 436
Continued on next page

National Tracking Poll #2103129, March, 2021
243
Table POL18_8
Table POL18_8: How much have you seen, read, or heard about the following?An increasing number of child migrants crossing the U.S.-Mexico border
Demographic A lot Some Not Much Nothing at all Total N
Registered Voters 40% (791) 33% (661) 14% (285) 13% (258) 1994Party: Democrat/Leans Democrat 33% (318) 35% (344) 18% (175) 14% (135) 973Party: Republican/Leans Republican 51% (392) 29% (221) 9% (67) 11% (88) 768Note: Row proportions may total to larger than one-hundred percent due to rounding. For more information visit MorningConsultIntelligence.com.

244
Morning ConsultTable POL18_POL18_9
Table POL18_POL18_9: How much have you seen, read, or heard about the following?The Centers for Disease Control and Prevention relaxing its physical distancing guidelines for students in school from 6 feet to 3 feet
Demographic A lot Some Not Much Nothing at all Total N
Registered Voters 25% (490) 43% (849) 16% (327) 16% (329) 1994Gender: Male 26% (244) 42% (392) 17% (163) 14% (135) 933Gender: Female 23% (245) 43% (457) 15% (164) 18% (194) 1061Age: 18-34 22% (109) 40% (200) 17% (83) 22% (109) 501Age: 35-44 26% (80) 39% (119) 17% (51) 17% (53) 303Age: 45-64 23% (163) 44% (317) 18% (129) 16% (117) 726Age: 65+ 30% (137) 46% (213) 14% (63) 11% (51) 464GenZers: 1997-2012 23% (39) 40% (66) 17% (28) 20% (34) 168Millennials: 1981-1996 23% (127) 40% (221) 17% (95) 19% (107) 551GenXers: 1965-1980 21% (88) 42% (177) 19% (80) 19% (80) 424Baby Boomers: 1946-1964 28% (217) 45% (349) 15% (119) 13% (100) 784PID: Dem (no lean) 29% (233) 42% (343) 15% (125) 14% (115) 817PID: Ind (no lean) 23% (123) 44% (237) 16% (87) 18% (95) 542PID: Rep (no lean) 21% (134) 42% (268) 18% (115) 19% (118) 635PID/Gender: DemMen 32% (113) 40% (141) 17% (59) 11% (37) 350PID/Gender: DemWomen 26% (120) 43% (202) 14% (66) 17% (78) 467PID/Gender: Ind Men 20% (55) 49% (136) 15% (43) 16% (45) 280PID/Gender: Ind Women 26% (67) 38% (101) 17% (44) 19% (50) 262PID/Gender: Rep Men 25% (76) 38% (114) 20% (61) 17% (52) 304PID/Gender: Rep Women 17% (58) 46% (154) 16% (53) 20% (66) 332Ideo: Liberal (1-3) 30% (188) 42% (260) 14% (89) 14% (88) 625Ideo: Moderate (4) 22% (126) 44% (249) 19% (108) 15% (88) 571Ideo: Conservative (5-7) 24% (162) 43% (295) 17% (119) 16% (109) 685Educ: < College 20% (257) 42% (527) 18% (231) 19% (239) 1254Educ: Bachelors degree 29% (138) 43% (205) 14% (67) 13% (62) 472Educ: Post-grad 35% (95) 43% (116) 11% (29) 10% (28) 268Income: Under 50k 20% (200) 40% (399) 17% (173) 22% (217) 989Income: 50k-100k 27% (163) 46% (275) 14% (87) 13% (78) 602Income: 100k+ 31% (126) 43% (175) 17% (67) 9% (34) 402Ethnicity: White 25% (408) 44% (705) 15% (248) 16% (253) 1613Ethnicity: Hispanic 21% (41) 45% (87) 15% (29) 19% (36) 193Ethnicity: Black 20% (51) 40% (100) 22% (55) 18% (46) 253
Continued on next page

National Tracking Poll #2103129, March, 2021
245
Table POL18_POL18_9
Table POL18_POL18_9: How much have you seen, read, or heard about the following?The Centers for Disease Control and Prevention relaxing its physical distancing guidelines for students in school from 6 feet to 3 feet
Demographic A lot Some Not Much Nothing at all Total N
Registered Voters 25% (490) 43% (849) 16% (327) 16% (329) 1994Ethnicity: Other 24% (31) 34% (44) 18% (24) 23% (30) 128All Christian 26% (273) 44% (453) 16% (170) 14% (140) 1036All Non-Christian 40% (46) 30% (34) 11% (12) 20% (23) 115Atheist 28% (25) 41% (36) 18% (16) 12% (11) 88Agnostic/Nothing in particular 21% (94) 45% (202) 17% (78) 17% (76) 450Something Else 17% (52) 40% (123) 17% (50) 26% (79) 305Religious Non-Protestant/Catholic 34% (48) 30% (42) 12% (17) 24% (34) 141Evangelical 23% (125) 42% (229) 16% (89) 19% (103) 547Non-Evangelical 26% (194) 44% (325) 17% (123) 14% (101) 742Community: Urban 28% (162) 40% (237) 16% (94) 16% (93) 586Community: Suburban 24% (222) 44% (402) 16% (152) 16% (147) 924Community: Rural 22% (105) 43% (209) 17% (80) 18% (89) 484Employ: Private Sector 23% (155) 42% (281) 20% (130) 14% (96) 663Employ: Government 25% (30) 51% (62) 11% (13) 13% (15) 120Employ: Self-Employed 27% (47) 36% (63) 20% (36) 17% (29) 176Employ: Homemaker 20% (24) 40% (47) 13% (15) 27% (32) 118Employ: Student 26% (24) 41% (37) 15% (14) 18% (16) 91Employ: Retired 28% (152) 45% (242) 14% (76) 12% (65) 534Employ: Unemployed 16% (29) 42% (76) 14% (25) 29% (52) 182Employ: Other 26% (29) 37% (41) 17% (19) 21% (23) 111Military HH: Yes 27% (89) 44% (147) 13% (42) 16% (54) 333Military HH: No 24% (400) 42% (701) 17% (285) 17% (275) 1661RD/WT: Right Direction 29% (293) 43% (435) 13% (135) 15% (154) 1017RD/WT: Wrong Track 20% (196) 42% (414) 20% (192) 18% (174) 977Biden Job Approve 29% (332) 42% (475) 14% (153) 15% (168) 1127Biden Job Disapprove 19% (151) 45% (353) 20% (161) 16% (128) 792Biden Job Strongly Approve 36% (235) 39% (255) 12% (83) 13% (89) 663Biden Job Somewhat Approve 21% (96) 47% (219) 15% (70) 17% (78) 464Biden Job Somewhat Disapprove 15% (34) 48% (110) 22% (50) 16% (36) 229Biden Job Strongly Disapprove 21% (117) 43% (243) 20% (111) 16% (92) 562
Continued on next page

246
Morning ConsultTable POL18_POL18_9
Table POL18_POL18_9: How much have you seen, read, or heard about the following?The Centers for Disease Control and Prevention relaxing its physical distancing guidelines for students in school from 6 feet to 3 feet
Demographic A lot Some Not Much Nothing at all Total N
Registered Voters 25% (490) 43% (849) 16% (327) 16% (329) 1994Favorable of Biden 29% (326) 43% (487) 14% (161) 15% (169) 1143Unfavorable of Biden 19% (150) 45% (350) 20% (159) 16% (125) 785Very Favorable of Biden 36% (230) 38% (246) 14% (88) 12% (79) 644Somewhat Favorable of Biden 19% (96) 48% (241) 15% (73) 18% (90) 499Somewhat Unfavorable of Biden 16% (31) 45% (85) 21% (41) 17% (33) 190Very Unfavorable of Biden 20% (119) 45% (265) 20% (119) 16% (92) 595#1 Issue: Economy 24% (174) 41% (295) 19% (135) 15% (109) 714#1 Issue: Security 23% (72) 43% (131) 17% (51) 17% (52) 305#1 Issue: Health Care 26% (81) 44% (136) 14% (42) 16% (49) 308#1 Issue: Medicare / Social Security 21% (57) 45% (119) 16% (42) 18% (49) 267#1 Issue: Women’s Issues 21% (18) 39% (34) 22% (19) 19% (17) 88#1 Issue: Education 22% (20) 45% (40) 15% (13) 18% (16) 89#1 Issue: Energy 33% (30) 39% (35) 12% (11) 15% (13) 89#1 Issue: Other 28% (37) 44% (59) 11% (14) 18% (24) 1342020 Vote: Joe Biden 29% (305) 44% (456) 13% (138) 13% (138) 10372020 Vote: Donald Trump 20% (150) 42% (310) 18% (136) 20% (145) 7412020 Vote: Other 13% (8) 35% (21) 27% (16) 25% (15) 602020 Vote: Didn’t Vote 17% (27) 40% (61) 23% (35) 20% (30) 1532018 House Vote: Democrat 32% (237) 43% (323) 13% (100) 12% (88) 7482018 House Vote: Republican 23% (146) 42% (262) 19% (118) 15% (96) 6232018 House Vote: Someone else 7% (4) 43% (24) 24% (13) 26% (14) 552016 Vote: Hillary Clinton 32% (221) 43% (300) 14% (98) 12% (81) 7002016 Vote: Donald Trump 22% (159) 43% (305) 19% (132) 16% (117) 7132016 Vote: Other 18% (20) 51% (55) 16% (17) 14% (15) 1082016 Vote: Didn’t Vote 19% (88) 40% (186) 17% (79) 24% (114) 467Voted in 2014: Yes 28% (353) 43% (549) 17% (211) 13% (162) 1275Voted in 2014: No 19% (137) 42% (299) 16% (116) 23% (167) 7194-Region: Northeast 36% (127) 39% (139) 14% (48) 12% (42) 3564-Region: Midwest 22% (102) 47% (214) 16% (74) 15% (69) 4584-Region: South 21% (156) 44% (326) 17% (129) 18% (134) 7444-Region: West 24% (104) 39% (171) 17% (76) 19% (85) 436
Continued on next page

National Tracking Poll #2103129, March, 2021
247
Table POL18_POL18_9
Table POL18_POL18_9: How much have you seen, read, or heard about the following?The Centers for Disease Control and Prevention relaxing its physical distancing guidelines for students in school from 6 feet to 3 feet
Demographic A lot Some Not Much Nothing at all Total N
Registered Voters 25% (490) 43% (849) 16% (327) 16% (329) 1994Party: Democrat/Leans Democrat 28% (274) 44% (423) 15% (143) 14% (132) 973Party: Republican/Leans Republican 22% (170) 42% (320) 18% (135) 19% (143) 768Note: Row proportions may total to larger than one-hundred percent due to rounding. For more information visit MorningConsultIntelligence.com.
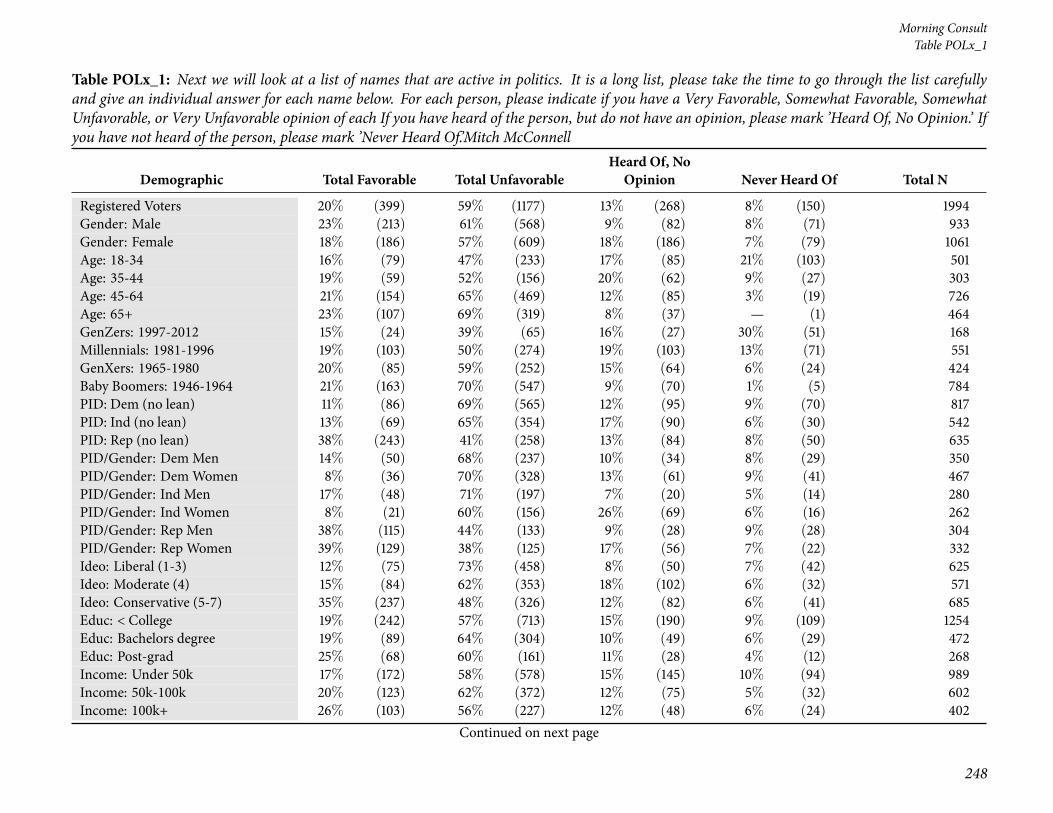
248
Morning ConsultTable POLx_1
Table POLx_1: Next we will look at a list of names that are active in politics. It is a long list, please take the time to go through the list carefullyand give an individual answer for each name below. For each person, please indicate if you have a Very Favorable, Somewhat Favorable, SomewhatUnfavorable, or Very Unfavorable opinion of each If you have heard of the person, but do not have an opinion, please mark ’Heard Of, No Opinion.’ Ifyou have not heard of the person, please mark ’Never Heard Of.’Mitch McConnell
Demographic Total Favorable Total UnfavorableHeard Of, NoOpinion Never Heard Of Total N
Registered Voters 20% (399) 59% (1177) 13% (268) 8% (150) 1994Gender: Male 23% (213) 61% (568) 9% (82) 8% (71) 933Gender: Female 18% (186) 57% (609) 18% (186) 7% (79) 1061Age: 18-34 16% (79) 47% (233) 17% (85) 21% (103) 501Age: 35-44 19% (59) 52% (156) 20% (62) 9% (27) 303Age: 45-64 21% (154) 65% (469) 12% (85) 3% (19) 726Age: 65+ 23% (107) 69% (319) 8% (37) — (1) 464GenZers: 1997-2012 15% (24) 39% (65) 16% (27) 30% (51) 168Millennials: 1981-1996 19% (103) 50% (274) 19% (103) 13% (71) 551GenXers: 1965-1980 20% (85) 59% (252) 15% (64) 6% (24) 424Baby Boomers: 1946-1964 21% (163) 70% (547) 9% (70) 1% (5) 784PID: Dem (no lean) 11% (86) 69% (565) 12% (95) 9% (70) 817PID: Ind (no lean) 13% (69) 65% (354) 17% (90) 6% (30) 542PID: Rep (no lean) 38% (243) 41% (258) 13% (84) 8% (50) 635PID/Gender: DemMen 14% (50) 68% (237) 10% (34) 8% (29) 350PID/Gender: DemWomen 8% (36) 70% (328) 13% (61) 9% (41) 467PID/Gender: Ind Men 17% (48) 71% (197) 7% (20) 5% (14) 280PID/Gender: Ind Women 8% (21) 60% (156) 26% (69) 6% (16) 262PID/Gender: Rep Men 38% (115) 44% (133) 9% (28) 9% (28) 304PID/Gender: Rep Women 39% (129) 38% (125) 17% (56) 7% (22) 332Ideo: Liberal (1-3) 12% (75) 73% (458) 8% (50) 7% (42) 625Ideo: Moderate (4) 15% (84) 62% (353) 18% (102) 6% (32) 571Ideo: Conservative (5-7) 35% (237) 48% (326) 12% (82) 6% (41) 685Educ: < College 19% (242) 57% (713) 15% (190) 9% (109) 1254Educ: Bachelors degree 19% (89) 64% (304) 10% (49) 6% (29) 472Educ: Post-grad 25% (68) 60% (161) 11% (28) 4% (12) 268Income: Under 50k 17% (172) 58% (578) 15% (145) 10% (94) 989Income: 50k-100k 20% (123) 62% (372) 12% (75) 5% (32) 602Income: 100k+ 26% (103) 56% (227) 12% (48) 6% (24) 402
Continued on next page
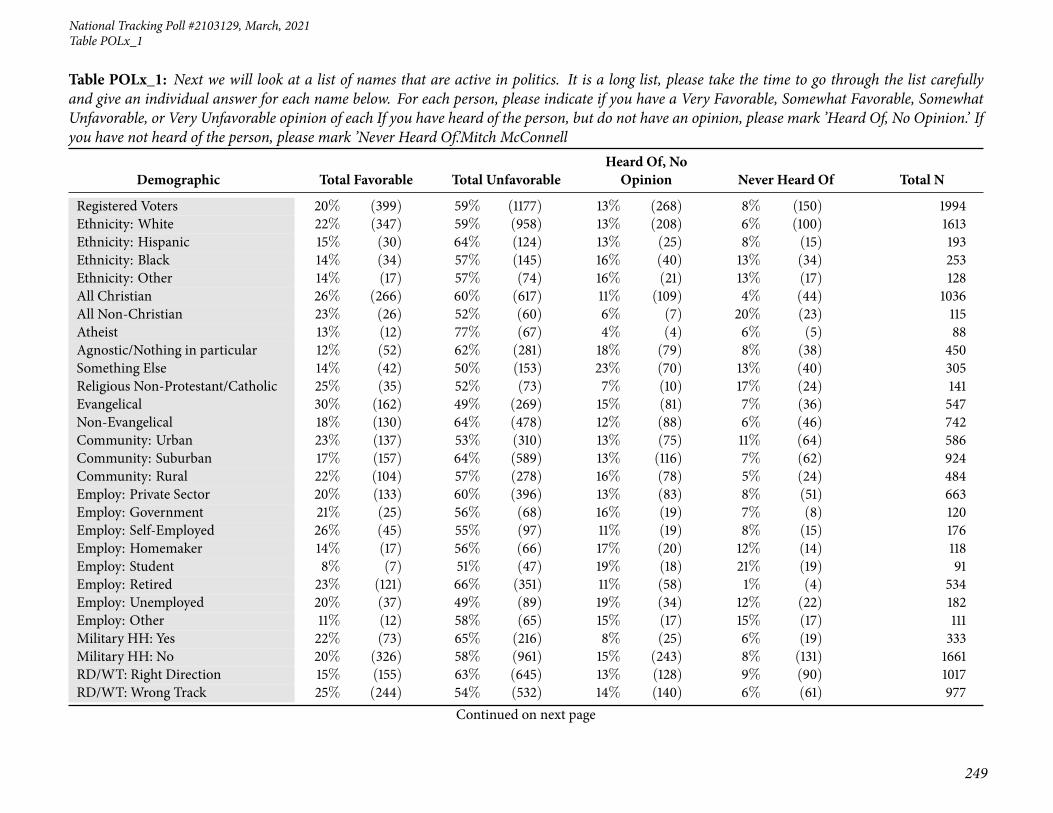
National Tracking Poll #2103129, March, 2021
249
Table POLx_1
Table POLx_1: Next we will look at a list of names that are active in politics. It is a long list, please take the time to go through the list carefullyand give an individual answer for each name below. For each person, please indicate if you have a Very Favorable, Somewhat Favorable, SomewhatUnfavorable, or Very Unfavorable opinion of each If you have heard of the person, but do not have an opinion, please mark ’Heard Of, No Opinion.’ Ifyou have not heard of the person, please mark ’Never Heard Of.’Mitch McConnell
Demographic Total Favorable Total UnfavorableHeard Of, NoOpinion Never Heard Of Total N
Registered Voters 20% (399) 59% (1177) 13% (268) 8% (150) 1994Ethnicity: White 22% (347) 59% (958) 13% (208) 6% (100) 1613Ethnicity: Hispanic 15% (30) 64% (124) 13% (25) 8% (15) 193Ethnicity: Black 14% (34) 57% (145) 16% (40) 13% (34) 253Ethnicity: Other 14% (17) 57% (74) 16% (21) 13% (17) 128All Christian 26% (266) 60% (617) 11% (109) 4% (44) 1036All Non-Christian 23% (26) 52% (60) 6% (7) 20% (23) 115Atheist 13% (12) 77% (67) 4% (4) 6% (5) 88Agnostic/Nothing in particular 12% (52) 62% (281) 18% (79) 8% (38) 450Something Else 14% (42) 50% (153) 23% (70) 13% (40) 305Religious Non-Protestant/Catholic 25% (35) 52% (73) 7% (10) 17% (24) 141Evangelical 30% (162) 49% (269) 15% (81) 7% (36) 547Non-Evangelical 18% (130) 64% (478) 12% (88) 6% (46) 742Community: Urban 23% (137) 53% (310) 13% (75) 11% (64) 586Community: Suburban 17% (157) 64% (589) 13% (116) 7% (62) 924Community: Rural 22% (104) 57% (278) 16% (78) 5% (24) 484Employ: Private Sector 20% (133) 60% (396) 13% (83) 8% (51) 663Employ: Government 21% (25) 56% (68) 16% (19) 7% (8) 120Employ: Self-Employed 26% (45) 55% (97) 11% (19) 8% (15) 176Employ: Homemaker 14% (17) 56% (66) 17% (20) 12% (14) 118Employ: Student 8% (7) 51% (47) 19% (18) 21% (19) 91Employ: Retired 23% (121) 66% (351) 11% (58) 1% (4) 534Employ: Unemployed 20% (37) 49% (89) 19% (34) 12% (22) 182Employ: Other 11% (12) 58% (65) 15% (17) 15% (17) 111Military HH: Yes 22% (73) 65% (216) 8% (25) 6% (19) 333Military HH: No 20% (326) 58% (961) 15% (243) 8% (131) 1661RD/WT: Right Direction 15% (155) 63% (645) 13% (128) 9% (90) 1017RD/WT: Wrong Track 25% (244) 54% (532) 14% (140) 6% (61) 977
Continued on next page

250
Morning ConsultTable POLx_1
Table POLx_1: Next we will look at a list of names that are active in politics. It is a long list, please take the time to go through the list carefullyand give an individual answer for each name below. For each person, please indicate if you have a Very Favorable, Somewhat Favorable, SomewhatUnfavorable, or Very Unfavorable opinion of each If you have heard of the person, but do not have an opinion, please mark ’Heard Of, No Opinion.’ Ifyou have not heard of the person, please mark ’Never Heard Of.’Mitch McConnell
Demographic Total Favorable Total UnfavorableHeard Of, NoOpinion Never Heard Of Total N
Registered Voters 20% (399) 59% (1177) 13% (268) 8% (150) 1994Biden Job Approve 13% (143) 67% (759) 12% (133) 8% (92) 1127Biden Job Disapprove 32% (252) 50% (395) 12% (97) 6% (48) 792Biden Job Strongly Approve 13% (84) 71% (473) 8% (54) 8% (52) 663Biden Job Somewhat Approve 13% (59) 62% (285) 17% (79) 9% (41) 464Biden Job Somewhat Disapprove 24% (56) 50% (115) 17% (38) 9% (20) 229Biden Job Strongly Disapprove 35% (195) 50% (281) 11% (59) 5% (27) 562Favorable of Biden 13% (146) 68% (773) 12% (138) 8% (86) 1143Unfavorable of Biden 32% (251) 50% (394) 13% (102) 5% (37) 785Very Favorable of Biden 12% (80) 72% (462) 10% (65) 6% (37) 644Somewhat Favorable of Biden 13% (65) 62% (312) 15% (73) 10% (49) 499Somewhat Unfavorable of Biden 21% (41) 50% (94) 23% (43) 6% (12) 190Very Unfavorable of Biden 35% (210) 50% (300) 10% (59) 4% (25) 595#1 Issue: Economy 23% (161) 55% (393) 16% (112) 7% (47) 714#1 Issue: Security 36% (110) 45% (137) 13% (39) 6% (20) 305#1 Issue: Health Care 11% (33) 70% (214) 10% (31) 10% (30) 308#1 Issue: Medicare / Social Security 18% (47) 68% (183) 13% (35) 1% (2) 267#1 Issue: Women’s Issues 8% (7) 66% (58) 14% (12) 12% (11) 88#1 Issue: Education 10% (9) 46% (41) 19% (17) 26% (23) 89#1 Issue: Energy 15% (13) 57% (51) 12% (11) 15% (14) 89#1 Issue: Other 14% (19) 74% (100) 8% (11) 3% (4) 1342020 Vote: Joe Biden 11% (111) 72% (745) 10% (107) 7% (74) 10372020 Vote: Donald Trump 34% (255) 44% (329) 15% (111) 6% (47) 7412020 Vote: Other 6% (3) 56% (34) 33% (20) 5% (3) 602020 Vote: Didn’t Vote 19% (29) 43% (66) 20% (31) 17% (26) 1532018 House Vote: Democrat 11% (84) 75% (563) 9% (71) 4% (31) 7482018 House Vote: Republican 37% (230) 49% (303) 11% (66) 4% (24) 6232018 House Vote: Someone else 2% (1) 65% (35) 28% (15) 5% (3) 55
Continued on next page

National Tracking Poll #2103129, March, 2021
251
Table POLx_1
Table POLx_1: Next we will look at a list of names that are active in politics. It is a long list, please take the time to go through the list carefullyand give an individual answer for each name below. For each person, please indicate if you have a Very Favorable, Somewhat Favorable, SomewhatUnfavorable, or Very Unfavorable opinion of each If you have heard of the person, but do not have an opinion, please mark ’Heard Of, No Opinion.’ Ifyou have not heard of the person, please mark ’Never Heard Of.’Mitch McConnell
Demographic Total Favorable Total UnfavorableHeard Of, NoOpinion Never Heard Of Total N
Registered Voters 20% (399) 59% (1177) 13% (268) 8% (150) 19942016 Vote: Hillary Clinton 9% (66) 78% (548) 9% (62) 3% (24) 7002016 Vote: Donald Trump 36% (254) 47% (335) 13% (93) 4% (31) 7132016 Vote: Other 14% (15) 71% (77) 10% (11) 5% (5) 1082016 Vote: Didn’t Vote 13% (62) 46% (215) 21% (100) 19% (90) 467Voted in 2014: Yes 23% (294) 63% (803) 11% (134) 3% (44) 1275Voted in 2014: No 15% (105) 52% (374) 19% (134) 15% (106) 7194-Region: Northeast 22% (78) 55% (195) 14% (51) 9% (32) 3564-Region: Midwest 17% (76) 60% (274) 16% (75) 7% (32) 4584-Region: South 21% (157) 60% (444) 13% (96) 6% (48) 7444-Region: West 20% (88) 61% (264) 11% (46) 9% (37) 436Party: Democrat/Leans Democrat 10% (102) 70% (681) 12% (117) 7% (72) 973Party: Republican/Leans Republican 36% (278) 43% (328) 14% (107) 7% (55) 768Note: Row proportions may total to larger than one-hundred percent due to rounding. For more information visit MorningConsultIntelligence.com.

252
Morning ConsultTable POLx_2
Table POLx_2: Favorability forNancy Pelosi
Demographic Total Favorable Total UnfavorableHeard Of, NoOpinion Never Heard Of Total N
Registered Voters 38% (751) 51% (1009) 8% (160) 4% (74) 1994Gender: Male 37% (346) 52% (489) 6% (56) 5% (43) 933Gender: Female 38% (405) 49% (521) 10% (104) 3% (31) 1061Age: 18-34 32% (162) 40% (200) 14% (73) 13% (66) 501Age: 35-44 36% (109) 47% (142) 15% (45) 2% (7) 303Age: 45-64 39% (281) 57% (412) 5% (34) — (0) 726Age: 65+ 43% (199) 55% (256) 2% (9) — (0) 464GenZers: 1997-2012 22% (36) 41% (68) 23% (38) 15% (25) 168Millennials: 1981-1996 37% (202) 43% (234) 13% (69) 8% (45) 551GenXers: 1965-1980 41% (174) 50% (213) 8% (35) 1% (3) 424Baby Boomers: 1946-1964 40% (316) 58% (452) 2% (16) — (0) 784PID: Dem (no lean) 70% (569) 17% (137) 10% (80) 4% (30) 817PID: Ind (no lean) 25% (133) 61% (329) 11% (61) 4% (19) 542PID: Rep (no lean) 8% (49) 86% (543) 3% (19) 4% (24) 635PID/Gender: DemMen 70% (245) 17% (61) 7% (25) 5% (18) 350PID/Gender: DemWomen 69% (324) 16% (76) 12% (55) 3% (12) 467PID/Gender: Ind Men 26% (73) 64% (179) 7% (21) 3% (7) 280PID/Gender: Ind Women 23% (60) 57% (150) 15% (40) 5% (12) 262PID/Gender: Rep Men 9% (28) 82% (248) 3% (10) 6% (18) 304PID/Gender: Rep Women 6% (20) 89% (295) 3% (9) 2% (6) 332Ideo: Liberal (1-3) 68% (426) 22% (137) 5% (34) 4% (28) 625Ideo: Moderate (4) 43% (244) 42% (242) 14% (78) 1% (6) 571Ideo: Conservative (5-7) 10% (65) 85% (584) 3% (21) 2% (14) 685Educ: < College 32% (407) 55% (690) 9% (111) 4% (46) 1254Educ: Bachelors degree 45% (211) 44% (208) 6% (30) 5% (22) 472Educ: Post-grad 49% (132) 42% (112) 7% (19) 2% (5) 268Income: Under 50k 36% (359) 49% (488) 9% (94) 5% (49) 989Income: 50k-100k 36% (218) 56% (340) 5% (32) 2% (12) 602Income: 100k+ 43% (174) 45% (181) 9% (34) 3% (13) 402Ethnicity: White 35% (559) 56% (910) 6% (97) 3% (47) 1613Ethnicity: Hispanic 36% (70) 43% (84) 15% (28) 6% (11) 193
Continued on next page
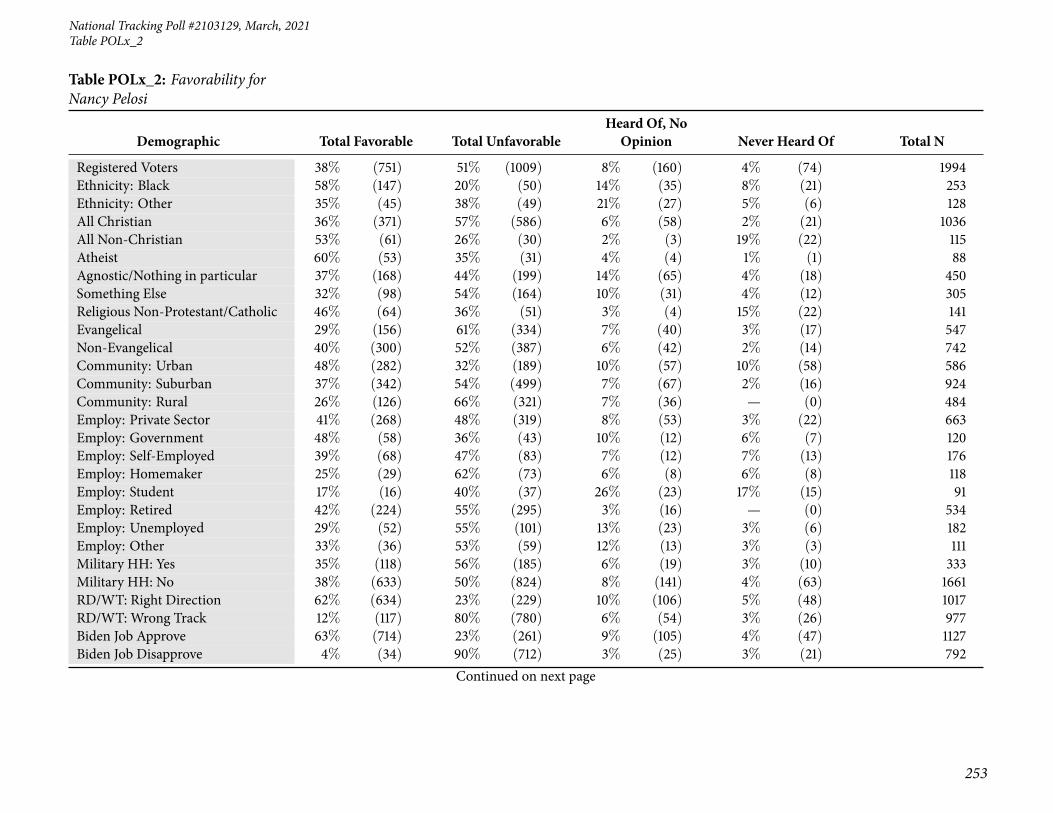
National Tracking Poll #2103129, March, 2021
253
Table POLx_2
Table POLx_2: Favorability forNancy Pelosi
Demographic Total Favorable Total UnfavorableHeard Of, NoOpinion Never Heard Of Total N
Registered Voters 38% (751) 51% (1009) 8% (160) 4% (74) 1994Ethnicity: Black 58% (147) 20% (50) 14% (35) 8% (21) 253Ethnicity: Other 35% (45) 38% (49) 21% (27) 5% (6) 128All Christian 36% (371) 57% (586) 6% (58) 2% (21) 1036All Non-Christian 53% (61) 26% (30) 2% (3) 19% (22) 115Atheist 60% (53) 35% (31) 4% (4) 1% (1) 88Agnostic/Nothing in particular 37% (168) 44% (199) 14% (65) 4% (18) 450Something Else 32% (98) 54% (164) 10% (31) 4% (12) 305Religious Non-Protestant/Catholic 46% (64) 36% (51) 3% (4) 15% (22) 141Evangelical 29% (156) 61% (334) 7% (40) 3% (17) 547Non-Evangelical 40% (300) 52% (387) 6% (42) 2% (14) 742Community: Urban 48% (282) 32% (189) 10% (57) 10% (58) 586Community: Suburban 37% (342) 54% (499) 7% (67) 2% (16) 924Community: Rural 26% (126) 66% (321) 7% (36) — (0) 484Employ: Private Sector 41% (268) 48% (319) 8% (53) 3% (22) 663Employ: Government 48% (58) 36% (43) 10% (12) 6% (7) 120Employ: Self-Employed 39% (68) 47% (83) 7% (12) 7% (13) 176Employ: Homemaker 25% (29) 62% (73) 6% (8) 6% (8) 118Employ: Student 17% (16) 40% (37) 26% (23) 17% (15) 91Employ: Retired 42% (224) 55% (295) 3% (16) — (0) 534Employ: Unemployed 29% (52) 55% (101) 13% (23) 3% (6) 182Employ: Other 33% (36) 53% (59) 12% (13) 3% (3) 111Military HH: Yes 35% (118) 56% (185) 6% (19) 3% (10) 333Military HH: No 38% (633) 50% (824) 8% (141) 4% (63) 1661RD/WT: Right Direction 62% (634) 23% (229) 10% (106) 5% (48) 1017RD/WT: Wrong Track 12% (117) 80% (780) 6% (54) 3% (26) 977Biden Job Approve 63% (714) 23% (261) 9% (105) 4% (47) 1127Biden Job Disapprove 4% (34) 90% (712) 3% (25) 3% (21) 792
Continued on next page
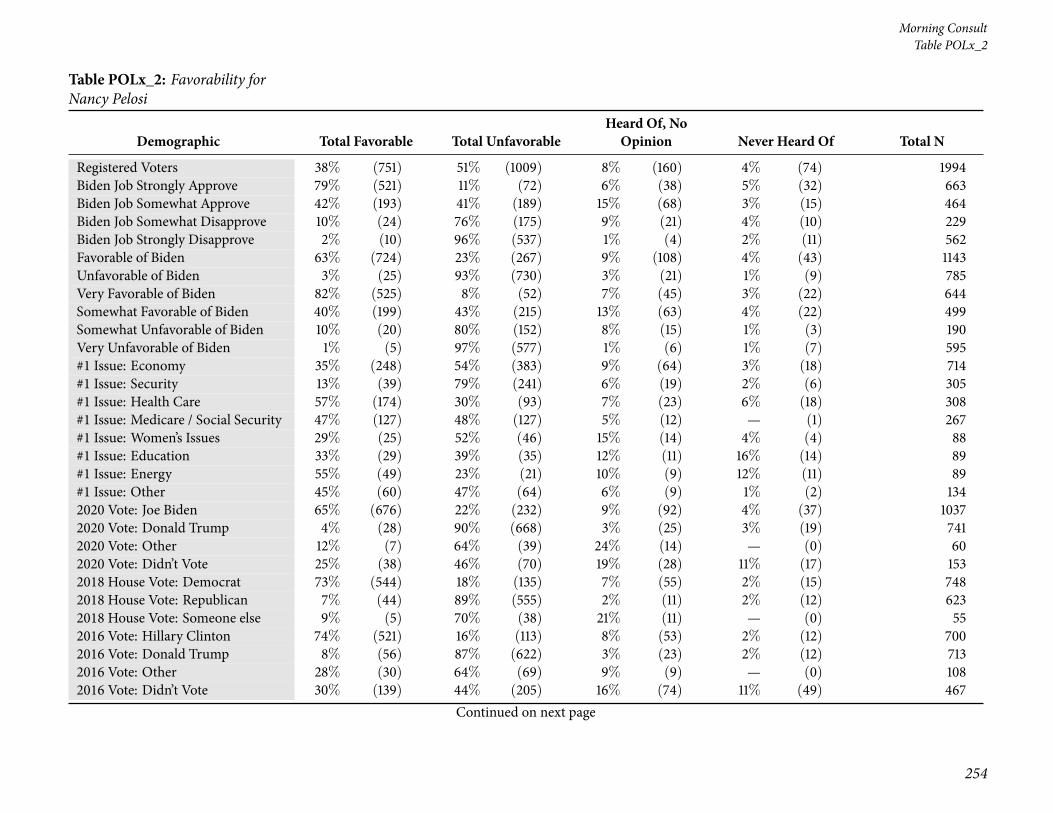
254
Morning ConsultTable POLx_2
Table POLx_2: Favorability forNancy Pelosi
Demographic Total Favorable Total UnfavorableHeard Of, NoOpinion Never Heard Of Total N
Registered Voters 38% (751) 51% (1009) 8% (160) 4% (74) 1994Biden Job Strongly Approve 79% (521) 11% (72) 6% (38) 5% (32) 663Biden Job Somewhat Approve 42% (193) 41% (189) 15% (68) 3% (15) 464Biden Job Somewhat Disapprove 10% (24) 76% (175) 9% (21) 4% (10) 229Biden Job Strongly Disapprove 2% (10) 96% (537) 1% (4) 2% (11) 562Favorable of Biden 63% (724) 23% (267) 9% (108) 4% (43) 1143Unfavorable of Biden 3% (25) 93% (730) 3% (21) 1% (9) 785Very Favorable of Biden 82% (525) 8% (52) 7% (45) 3% (22) 644Somewhat Favorable of Biden 40% (199) 43% (215) 13% (63) 4% (22) 499Somewhat Unfavorable of Biden 10% (20) 80% (152) 8% (15) 1% (3) 190Very Unfavorable of Biden 1% (5) 97% (577) 1% (6) 1% (7) 595#1 Issue: Economy 35% (248) 54% (383) 9% (64) 3% (18) 714#1 Issue: Security 13% (39) 79% (241) 6% (19) 2% (6) 305#1 Issue: Health Care 57% (174) 30% (93) 7% (23) 6% (18) 308#1 Issue: Medicare / Social Security 47% (127) 48% (127) 5% (12) — (1) 267#1 Issue: Women’s Issues 29% (25) 52% (46) 15% (14) 4% (4) 88#1 Issue: Education 33% (29) 39% (35) 12% (11) 16% (14) 89#1 Issue: Energy 55% (49) 23% (21) 10% (9) 12% (11) 89#1 Issue: Other 45% (60) 47% (64) 6% (9) 1% (2) 1342020 Vote: Joe Biden 65% (676) 22% (232) 9% (92) 4% (37) 10372020 Vote: Donald Trump 4% (28) 90% (668) 3% (25) 3% (19) 7412020 Vote: Other 12% (7) 64% (39) 24% (14) — (0) 602020 Vote: Didn’t Vote 25% (38) 46% (70) 19% (28) 11% (17) 1532018 House Vote: Democrat 73% (544) 18% (135) 7% (55) 2% (15) 7482018 House Vote: Republican 7% (44) 89% (555) 2% (11) 2% (12) 6232018 House Vote: Someone else 9% (5) 70% (38) 21% (11) — (0) 552016 Vote: Hillary Clinton 74% (521) 16% (113) 8% (53) 2% (12) 7002016 Vote: Donald Trump 8% (56) 87% (622) 3% (23) 2% (12) 7132016 Vote: Other 28% (30) 64% (69) 9% (9) — (0) 1082016 Vote: Didn’t Vote 30% (139) 44% (205) 16% (74) 11% (49) 467
Continued on next page

National Tracking Poll #2103129, March, 2021
255
Table POLx_2
Table POLx_2: Favorability forNancy Pelosi
Demographic Total Favorable Total UnfavorableHeard Of, NoOpinion Never Heard Of Total N
Registered Voters 38% (751) 51% (1009) 8% (160) 4% (74) 1994Voted in 2014: Yes 41% (527) 52% (665) 5% (64) 2% (19) 1275Voted in 2014: No 31% (224) 48% (344) 13% (96) 8% (54) 7194-Region: Northeast 43% (153) 43% (152) 7% (25) 7% (26) 3564-Region: Midwest 35% (159) 58% (268) 6% (29) — (2) 4584-Region: South 35% (259) 52% (388) 9% (68) 4% (29) 7444-Region: West 41% (180) 46% (202) 8% (37) 4% (16) 436Party: Democrat/Leans Democrat 69% (667) 19% (183) 9% (91) 3% (33) 973Party: Republican/Leans Republican 7% (53) 87% (664) 3% (26) 3% (25) 768Note: Row proportions may total to larger than one-hundred percent due to rounding. For more information visit MorningConsultIntelligence.com.

256
Morning ConsultTable POLx_3
Table POLx_3: Favorability forCharles Schumer
Demographic Total Favorable Total UnfavorableHeard Of, NoOpinion Never Heard Of Total N
Registered Voters 31% (624) 39% (784) 17% (345) 12% (242) 1994Gender: Male 34% (315) 47% (439) 11% (104) 8% (75) 933Gender: Female 29% (309) 32% (344) 23% (241) 16% (167) 1061Age: 18-34 20% (102) 24% (118) 23% (115) 33% (166) 501Age: 35-44 29% (88) 36% (110) 22% (68) 12% (37) 303Age: 45-64 34% (245) 46% (335) 16% (114) 4% (32) 726Age: 65+ 41% (188) 48% (221) 10% (48) 2% (7) 464GenZers: 1997-2012 11% (19) 13% (22) 27% (45) 49% (82) 168Millennials: 1981-1996 27% (148) 31% (173) 21% (118) 20% (112) 551GenXers: 1965-1980 33% (138) 40% (168) 22% (92) 6% (26) 424Baby Boomers: 1946-1964 38% (294) 49% (383) 11% (84) 3% (23) 784PID: Dem (no lean) 54% (437) 15% (125) 18% (149) 13% (105) 817PID: Ind (no lean) 26% (140) 43% (234) 18% (98) 13% (70) 542PID: Rep (no lean) 7% (46) 67% (425) 15% (97) 11% (67) 635PID/Gender: DemMen 60% (210) 19% (65) 12% (41) 10% (34) 350PID/Gender: DemWomen 49% (227) 13% (60) 23% (108) 15% (71) 467PID/Gender: Ind Men 28% (77) 56% (155) 11% (30) 6% (18) 280PID/Gender: Ind Women 24% (63) 30% (78) 26% (69) 20% (52) 262PID/Gender: Rep Men 9% (28) 72% (219) 11% (33) 8% (23) 304PID/Gender: Rep Women 6% (18) 62% (206) 19% (64) 13% (44) 332Ideo: Liberal (1-3) 55% (341) 16% (102) 17% (109) 12% (73) 625Ideo: Moderate (4) 36% (203) 33% (189) 20% (116) 11% (63) 571Ideo: Conservative (5-7) 10% (68) 70% (482) 12% (84) 8% (52) 685Educ: < College 25% (319) 41% (520) 20% (249) 13% (166) 1254Educ: Bachelors degree 39% (185) 35% (164) 14% (64) 12% (59) 472Educ: Post-grad 45% (120) 37% (100) 12% (32) 7% (17) 268Income: Under 50k 28% (273) 36% (352) 22% (216) 15% (149) 989Income: 50k-100k 33% (201) 45% (273) 13% (76) 9% (52) 602Income: 100k+ 37% (150) 40% (159) 13% (53) 10% (41) 402Ethnicity: White 30% (489) 44% (708) 15% (245) 11% (171) 1613Ethnicity: Hispanic 28% (54) 35% (67) 20% (40) 17% (33) 193
Continued on next page
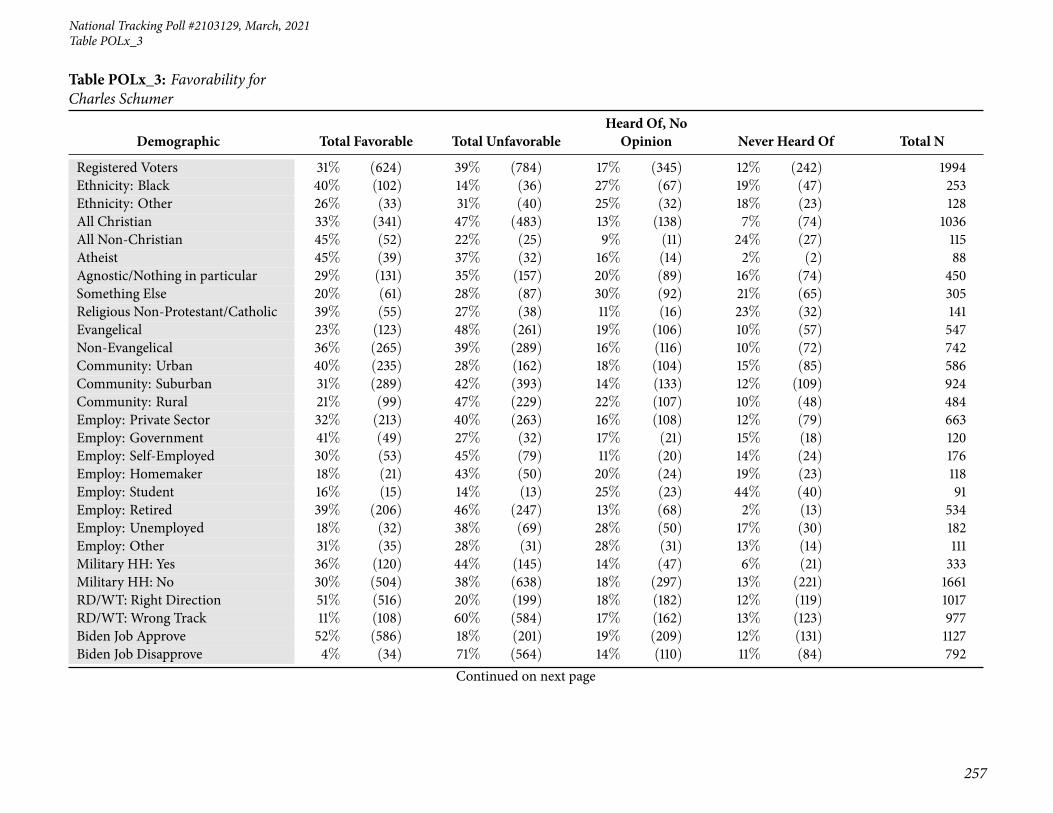
National Tracking Poll #2103129, March, 2021
257
Table POLx_3
Table POLx_3: Favorability forCharles Schumer
Demographic Total Favorable Total UnfavorableHeard Of, NoOpinion Never Heard Of Total N
Registered Voters 31% (624) 39% (784) 17% (345) 12% (242) 1994Ethnicity: Black 40% (102) 14% (36) 27% (67) 19% (47) 253Ethnicity: Other 26% (33) 31% (40) 25% (32) 18% (23) 128All Christian 33% (341) 47% (483) 13% (138) 7% (74) 1036All Non-Christian 45% (52) 22% (25) 9% (11) 24% (27) 115Atheist 45% (39) 37% (32) 16% (14) 2% (2) 88Agnostic/Nothing in particular 29% (131) 35% (157) 20% (89) 16% (74) 450Something Else 20% (61) 28% (87) 30% (92) 21% (65) 305Religious Non-Protestant/Catholic 39% (55) 27% (38) 11% (16) 23% (32) 141Evangelical 23% (123) 48% (261) 19% (106) 10% (57) 547Non-Evangelical 36% (265) 39% (289) 16% (116) 10% (72) 742Community: Urban 40% (235) 28% (162) 18% (104) 15% (85) 586Community: Suburban 31% (289) 42% (393) 14% (133) 12% (109) 924Community: Rural 21% (99) 47% (229) 22% (107) 10% (48) 484Employ: Private Sector 32% (213) 40% (263) 16% (108) 12% (79) 663Employ: Government 41% (49) 27% (32) 17% (21) 15% (18) 120Employ: Self-Employed 30% (53) 45% (79) 11% (20) 14% (24) 176Employ: Homemaker 18% (21) 43% (50) 20% (24) 19% (23) 118Employ: Student 16% (15) 14% (13) 25% (23) 44% (40) 91Employ: Retired 39% (206) 46% (247) 13% (68) 2% (13) 534Employ: Unemployed 18% (32) 38% (69) 28% (50) 17% (30) 182Employ: Other 31% (35) 28% (31) 28% (31) 13% (14) 111Military HH: Yes 36% (120) 44% (145) 14% (47) 6% (21) 333Military HH: No 30% (504) 38% (638) 18% (297) 13% (221) 1661RD/WT: Right Direction 51% (516) 20% (199) 18% (182) 12% (119) 1017RD/WT: Wrong Track 11% (108) 60% (584) 17% (162) 13% (123) 977Biden Job Approve 52% (586) 18% (201) 19% (209) 12% (131) 1127Biden Job Disapprove 4% (34) 71% (564) 14% (110) 11% (84) 792
Continued on next page
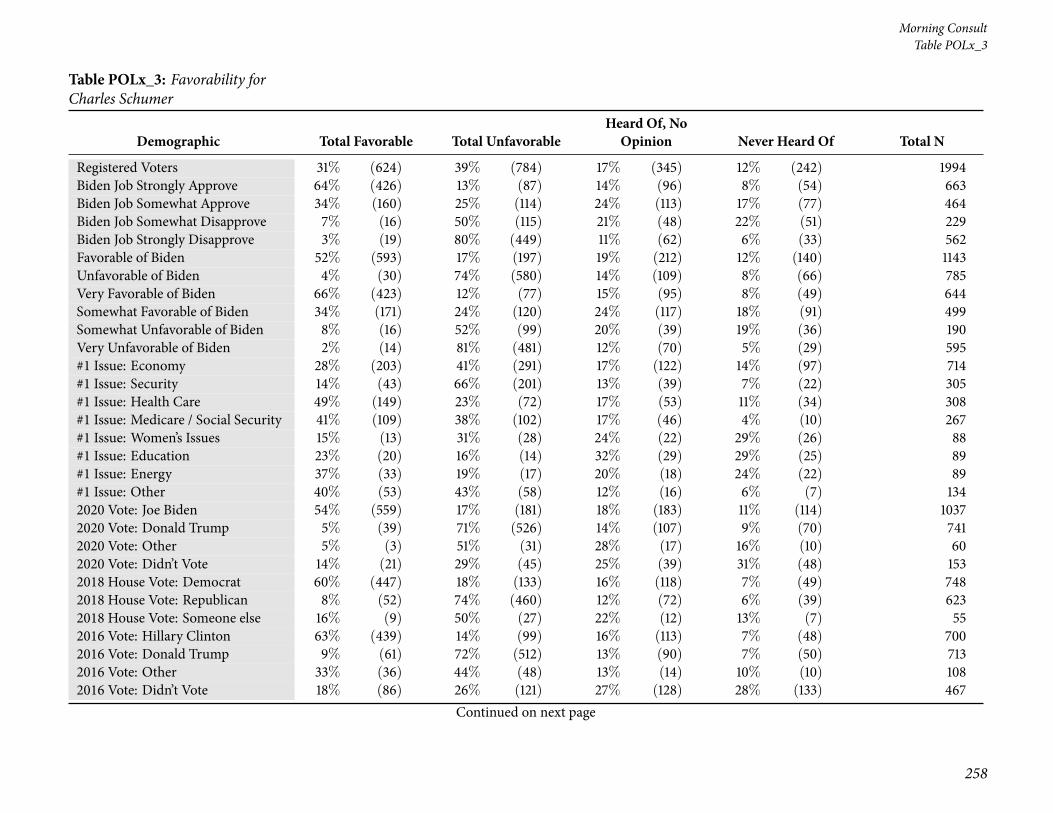
258
Morning ConsultTable POLx_3
Table POLx_3: Favorability forCharles Schumer
Demographic Total Favorable Total UnfavorableHeard Of, NoOpinion Never Heard Of Total N
Registered Voters 31% (624) 39% (784) 17% (345) 12% (242) 1994Biden Job Strongly Approve 64% (426) 13% (87) 14% (96) 8% (54) 663Biden Job Somewhat Approve 34% (160) 25% (114) 24% (113) 17% (77) 464Biden Job Somewhat Disapprove 7% (16) 50% (115) 21% (48) 22% (51) 229Biden Job Strongly Disapprove 3% (19) 80% (449) 11% (62) 6% (33) 562Favorable of Biden 52% (593) 17% (197) 19% (212) 12% (140) 1143Unfavorable of Biden 4% (30) 74% (580) 14% (109) 8% (66) 785Very Favorable of Biden 66% (423) 12% (77) 15% (95) 8% (49) 644Somewhat Favorable of Biden 34% (171) 24% (120) 24% (117) 18% (91) 499Somewhat Unfavorable of Biden 8% (16) 52% (99) 20% (39) 19% (36) 190Very Unfavorable of Biden 2% (14) 81% (481) 12% (70) 5% (29) 595#1 Issue: Economy 28% (203) 41% (291) 17% (122) 14% (97) 714#1 Issue: Security 14% (43) 66% (201) 13% (39) 7% (22) 305#1 Issue: Health Care 49% (149) 23% (72) 17% (53) 11% (34) 308#1 Issue: Medicare / Social Security 41% (109) 38% (102) 17% (46) 4% (10) 267#1 Issue: Women’s Issues 15% (13) 31% (28) 24% (22) 29% (26) 88#1 Issue: Education 23% (20) 16% (14) 32% (29) 29% (25) 89#1 Issue: Energy 37% (33) 19% (17) 20% (18) 24% (22) 89#1 Issue: Other 40% (53) 43% (58) 12% (16) 6% (7) 1342020 Vote: Joe Biden 54% (559) 17% (181) 18% (183) 11% (114) 10372020 Vote: Donald Trump 5% (39) 71% (526) 14% (107) 9% (70) 7412020 Vote: Other 5% (3) 51% (31) 28% (17) 16% (10) 602020 Vote: Didn’t Vote 14% (21) 29% (45) 25% (39) 31% (48) 1532018 House Vote: Democrat 60% (447) 18% (133) 16% (118) 7% (49) 7482018 House Vote: Republican 8% (52) 74% (460) 12% (72) 6% (39) 6232018 House Vote: Someone else 16% (9) 50% (27) 22% (12) 13% (7) 552016 Vote: Hillary Clinton 63% (439) 14% (99) 16% (113) 7% (48) 7002016 Vote: Donald Trump 9% (61) 72% (512) 13% (90) 7% (50) 7132016 Vote: Other 33% (36) 44% (48) 13% (14) 10% (10) 1082016 Vote: Didn’t Vote 18% (86) 26% (121) 27% (128) 28% (133) 467
Continued on next page
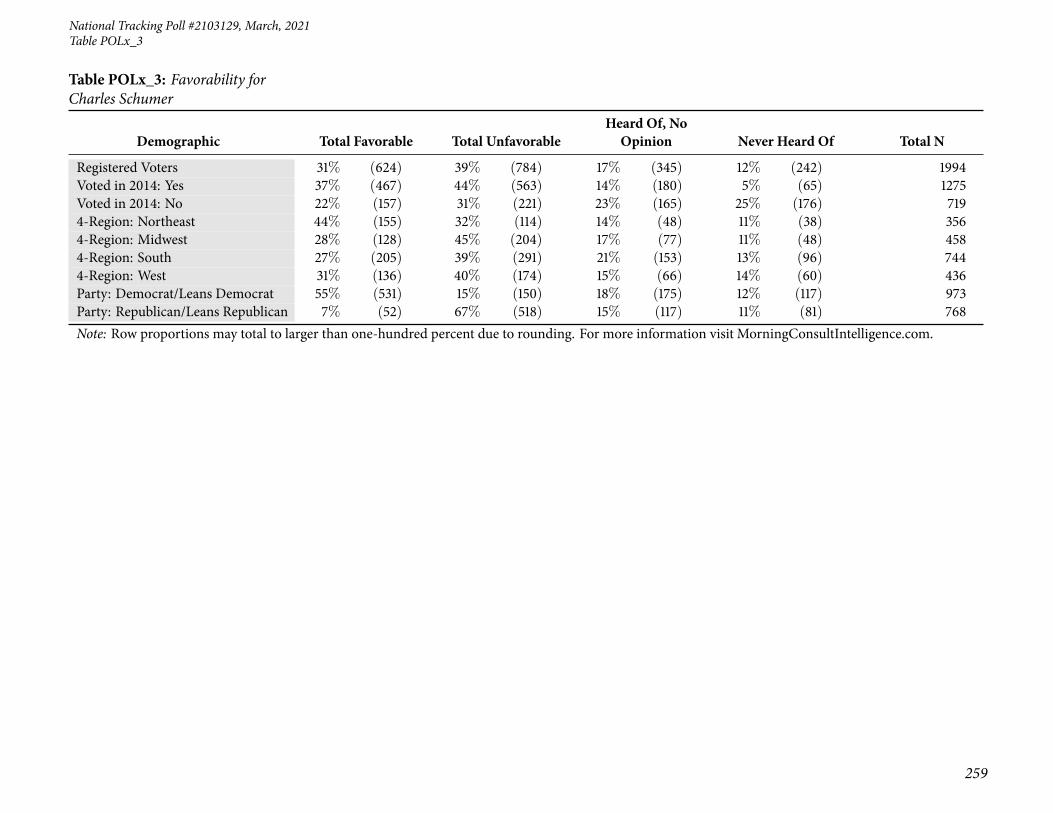
National Tracking Poll #2103129, March, 2021
259
Table POLx_3
Table POLx_3: Favorability forCharles Schumer
Demographic Total Favorable Total UnfavorableHeard Of, NoOpinion Never Heard Of Total N
Registered Voters 31% (624) 39% (784) 17% (345) 12% (242) 1994Voted in 2014: Yes 37% (467) 44% (563) 14% (180) 5% (65) 1275Voted in 2014: No 22% (157) 31% (221) 23% (165) 25% (176) 7194-Region: Northeast 44% (155) 32% (114) 14% (48) 11% (38) 3564-Region: Midwest 28% (128) 45% (204) 17% (77) 11% (48) 4584-Region: South 27% (205) 39% (291) 21% (153) 13% (96) 7444-Region: West 31% (136) 40% (174) 15% (66) 14% (60) 436Party: Democrat/Leans Democrat 55% (531) 15% (150) 18% (175) 12% (117) 973Party: Republican/Leans Republican 7% (52) 67% (518) 15% (117) 11% (81) 768Note: Row proportions may total to larger than one-hundred percent due to rounding. For more information visit MorningConsultIntelligence.com.
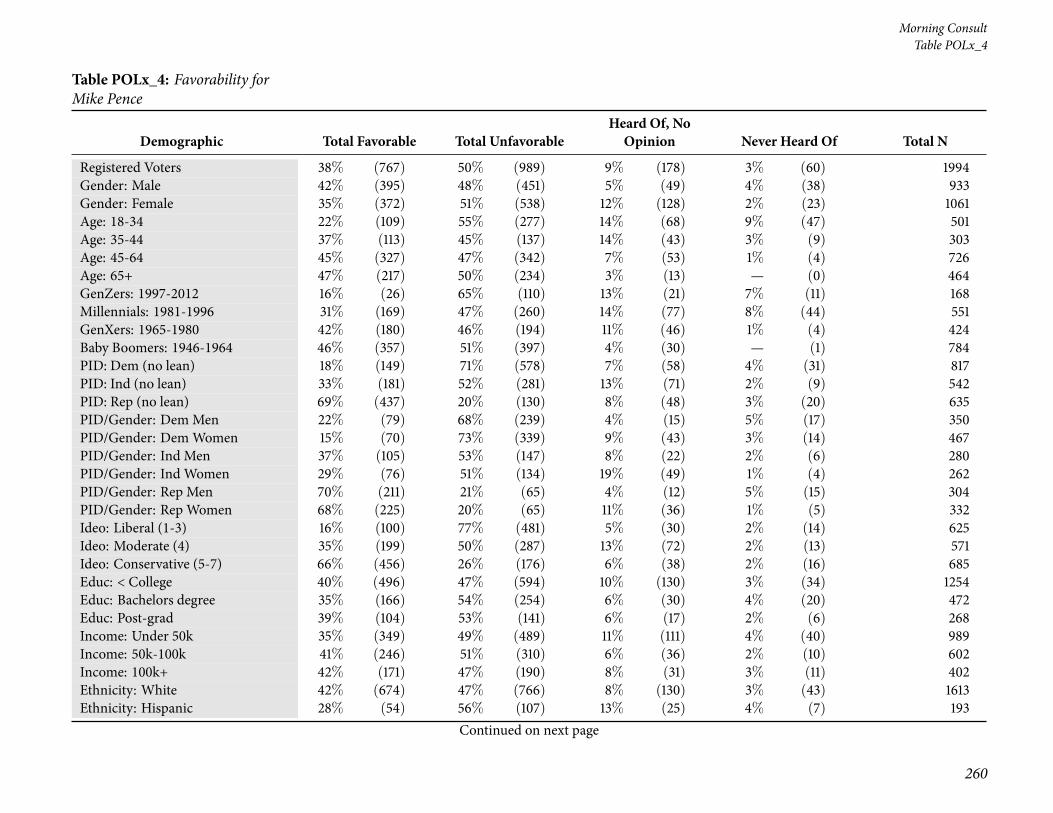
260
Morning ConsultTable POLx_4
Table POLx_4: Favorability forMike Pence
Demographic Total Favorable Total UnfavorableHeard Of, NoOpinion Never Heard Of Total N
Registered Voters 38% (767) 50% (989) 9% (178) 3% (60) 1994Gender: Male 42% (395) 48% (451) 5% (49) 4% (38) 933Gender: Female 35% (372) 51% (538) 12% (128) 2% (23) 1061Age: 18-34 22% (109) 55% (277) 14% (68) 9% (47) 501Age: 35-44 37% (113) 45% (137) 14% (43) 3% (9) 303Age: 45-64 45% (327) 47% (342) 7% (53) 1% (4) 726Age: 65+ 47% (217) 50% (234) 3% (13) — (0) 464GenZers: 1997-2012 16% (26) 65% (110) 13% (21) 7% (11) 168Millennials: 1981-1996 31% (169) 47% (260) 14% (77) 8% (44) 551GenXers: 1965-1980 42% (180) 46% (194) 11% (46) 1% (4) 424Baby Boomers: 1946-1964 46% (357) 51% (397) 4% (30) — (1) 784PID: Dem (no lean) 18% (149) 71% (578) 7% (58) 4% (31) 817PID: Ind (no lean) 33% (181) 52% (281) 13% (71) 2% (9) 542PID: Rep (no lean) 69% (437) 20% (130) 8% (48) 3% (20) 635PID/Gender: DemMen 22% (79) 68% (239) 4% (15) 5% (17) 350PID/Gender: DemWomen 15% (70) 73% (339) 9% (43) 3% (14) 467PID/Gender: Ind Men 37% (105) 53% (147) 8% (22) 2% (6) 280PID/Gender: Ind Women 29% (76) 51% (134) 19% (49) 1% (4) 262PID/Gender: Rep Men 70% (211) 21% (65) 4% (12) 5% (15) 304PID/Gender: Rep Women 68% (225) 20% (65) 11% (36) 1% (5) 332Ideo: Liberal (1-3) 16% (100) 77% (481) 5% (30) 2% (14) 625Ideo: Moderate (4) 35% (199) 50% (287) 13% (72) 2% (13) 571Ideo: Conservative (5-7) 66% (456) 26% (176) 6% (38) 2% (16) 685Educ: < College 40% (496) 47% (594) 10% (130) 3% (34) 1254Educ: Bachelors degree 35% (166) 54% (254) 6% (30) 4% (20) 472Educ: Post-grad 39% (104) 53% (141) 6% (17) 2% (6) 268Income: Under 50k 35% (349) 49% (489) 11% (111) 4% (40) 989Income: 50k-100k 41% (246) 51% (310) 6% (36) 2% (10) 602Income: 100k+ 42% (171) 47% (190) 8% (31) 3% (11) 402Ethnicity: White 42% (674) 47% (766) 8% (130) 3% (43) 1613Ethnicity: Hispanic 28% (54) 56% (107) 13% (25) 4% (7) 193
Continued on next page

National Tracking Poll #2103129, March, 2021
261
Table POLx_4
Table POLx_4: Favorability forMike Pence
Demographic Total Favorable Total UnfavorableHeard Of, NoOpinion Never Heard Of Total N
Registered Voters 38% (767) 50% (989) 9% (178) 3% (60) 1994Ethnicity: Black 23% (58) 62% (156) 11% (28) 4% (11) 253Ethnicity: Other 27% (34) 53% (68) 16% (20) 5% (7) 128All Christian 48% (494) 44% (460) 7% (68) 1% (15) 1036All Non-Christian 29% (33) 49% (57) 5% (6) 17% (20) 115Atheist 14% (13) 79% (69) 7% (6) — (0) 88Agnostic/Nothing in particular 24% (109) 61% (274) 12% (56) 3% (12) 450Something Else 39% (118) 43% (129) 14% (43) 5% (14) 305Religious Non-Protestant/Catholic 32% (45) 48% (67) 6% (9) 14% (20) 141Evangelical 52% (287) 35% (192) 9% (49) 4% (19) 547Non-Evangelical 40% (300) 51% (379) 8% (56) 1% (7) 742Community: Urban 35% (208) 50% (292) 8% (47) 7% (40) 586Community: Suburban 35% (327) 54% (502) 9% (82) 1% (13) 924Community: Rural 48% (232) 40% (196) 10% (49) 2% (7) 484Employ: Private Sector 38% (251) 50% (329) 9% (62) 3% (21) 663Employ: Government 38% (46) 48% (58) 8% (10) 6% (7) 120Employ: Self-Employed 33% (58) 54% (95) 5% (9) 8% (13) 176Employ: Homemaker 46% (54) 40% (48) 13% (15) 1% (1) 118Employ: Student 18% (16) 64% (58) 12% (11) 6% (5) 91Employ: Retired 46% (244) 49% (261) 5% (28) — (1) 534Employ: Unemployed 31% (57) 47% (85) 18% (32) 4% (8) 182Employ: Other 37% (41) 50% (56) 9% (10) 3% (4) 111Military HH: Yes 44% (145) 49% (163) 5% (18) 2% (7) 333Military HH: No 37% (622) 50% (826) 10% (160) 3% (53) 1661RD/WT: Right Direction 25% (254) 63% (640) 8% (81) 4% (42) 1017RD/WT: Wrong Track 53% (513) 36% (349) 10% (97) 2% (18) 977Biden Job Approve 22% (249) 66% (748) 8% (86) 4% (45) 1127Biden Job Disapprove 63% (500) 28% (221) 8% (62) 1% (9) 792
Continued on next page

262
Morning ConsultTable POLx_4
Table POLx_4: Favorability forMike Pence
Demographic Total Favorable Total UnfavorableHeard Of, NoOpinion Never Heard Of Total N
Registered Voters 38% (767) 50% (989) 9% (178) 3% (60) 1994Biden Job Strongly Approve 19% (124) 71% (468) 6% (41) 4% (30) 663Biden Job Somewhat Approve 27% (124) 60% (280) 10% (45) 3% (15) 464Biden Job Somewhat Disapprove 54% (124) 34% (78) 12% (27) — (1) 229Biden Job Strongly Disapprove 67% (376) 25% (143) 6% (34) 2% (9) 562Favorable of Biden 22% (253) 68% (776) 7% (82) 3% (32) 1143Unfavorable of Biden 65% (507) 26% (204) 9% (69) 1% (5) 785Very Favorable of Biden 20% (126) 72% (464) 6% (37) 3% (17) 644Somewhat Favorable of Biden 26% (127) 62% (312) 9% (44) 3% (15) 499Somewhat Unfavorable of Biden 54% (103) 29% (56) 16% (31) — (0) 190Very Unfavorable of Biden 68% (403) 25% (148) 6% (38) 1% (5) 595#1 Issue: Economy 43% (307) 45% (318) 9% (67) 3% (21) 714#1 Issue: Security 67% (203) 24% (73) 8% (23) 2% (6) 305#1 Issue: Health Care 23% (72) 66% (203) 6% (19) 4% (13) 308#1 Issue: Medicare / Social Security 38% (102) 54% (145) 7% (18) 1% (2) 267#1 Issue: Women’s Issues 13% (12) 71% (63) 11% (10) 4% (4) 88#1 Issue: Education 17% (15) 56% (50) 18% (16) 9% (8) 89#1 Issue: Energy 16% (15) 63% (57) 14% (12) 6% (5) 89#1 Issue: Other 31% (41) 60% (81) 9% (12) — (0) 1342020 Vote: Joe Biden 18% (184) 72% (748) 7% (71) 3% (34) 10372020 Vote: Donald Trump 69% (511) 20% (148) 8% (61) 3% (21) 7412020 Vote: Other 35% (21) 41% (25) 24% (14) — (0) 602020 Vote: Didn’t Vote 33% (50) 43% (65) 21% (32) 4% (6) 1532018 House Vote: Democrat 18% (133) 73% (547) 7% (51) 2% (17) 7482018 House Vote: Republican 68% (424) 25% (154) 5% (32) 2% (12) 6232018 House Vote: Someone else 33% (18) 41% (22) 21% (12) 5% (3) 552016 Vote: Hillary Clinton 16% (114) 74% (521) 8% (54) 2% (12) 7002016 Vote: Donald Trump 68% (481) 24% (172) 6% (44) 2% (16) 7132016 Vote: Other 34% (37) 55% (60) 9% (10) 2% (2) 1082016 Vote: Didn’t Vote 29% (134) 50% (232) 15% (71) 7% (31) 467
Continued on next page

National Tracking Poll #2103129, March, 2021
263
Table POLx_4
Table POLx_4: Favorability forMike Pence
Demographic Total Favorable Total UnfavorableHeard Of, NoOpinion Never Heard Of Total N
Registered Voters 38% (767) 50% (989) 9% (178) 3% (60) 1994Voted in 2014: Yes 42% (537) 49% (626) 7% (87) 2% (24) 1275Voted in 2014: No 32% (229) 51% (364) 13% (90) 5% (36) 7194-Region: Northeast 36% (127) 50% (177) 9% (31) 6% (21) 3564-Region: Midwest 39% (180) 51% (235) 8% (39) 1% (4) 4584-Region: South 42% (313) 46% (345) 10% (71) 2% (16) 7444-Region: West 34% (147) 53% (232) 9% (37) 5% (20) 436Party: Democrat/Leans Democrat 18% (173) 72% (699) 7% (69) 3% (32) 973Party: Republican/Leans Republican 67% (511) 23% (175) 8% (62) 3% (20) 768Note: Row proportions may total to larger than one-hundred percent due to rounding. For more information visit MorningConsultIntelligence.com.

264
Morning ConsultTable POLx_5
Table POLx_5: Favorability forDonald Trump
Demographic Total Favorable Total UnfavorableHeard Of, NoOpinion Never Heard Of Total N
Registered Voters 39% (777) 58% (1156) 2% (48) 1% (13) 1994Gender: Male 41% (387) 56% (520) 1% (14) 1% (13) 933Gender: Female 37% (391) 60% (636) 3% (34) — (0) 1061Age: 18-34 29% (144) 64% (321) 5% (25) 2% (11) 501Age: 35-44 41% (124) 54% (165) 5% (14) — (0) 303Age: 45-64 44% (320) 55% (399) 1% (8) — (0) 726Age: 65+ 41% (189) 59% (272) — (2) — (1) 464GenZers: 1997-2012 12% (20) 79% (133) 8% (13) 1% (2) 168Millennials: 1981-1996 40% (222) 54% (297) 4% (22) 2% (10) 551GenXers: 1965-1980 42% (179) 56% (236) 2% (9) — (0) 424Baby Boomers: 1946-1964 41% (321) 59% (461) — (3) — (0) 784PID: Dem (no lean) 8% (66) 89% (727) 2% (15) 1% (9) 817PID: Ind (no lean) 36% (194) 59% (320) 5% (27) — (1) 542PID: Rep (no lean) 81% (517) 17% (109) 1% (6) — (3) 635PID/Gender: DemMen 11% (39) 86% (299) 1% (3) 3% (9) 350PID/Gender: DemWomen 6% (28) 92% (427) 3% (12) — (0) 467PID/Gender: Ind Men 39% (110) 57% (161) 3% (8) — (1) 280PID/Gender: Ind Women 32% (84) 61% (159) 7% (19) — (0) 262PID/Gender: Rep Men 78% (238) 20% (60) 1% (3) 1% (3) 304PID/Gender: Rep Women 84% (279) 15% (49) 1% (3) — (0) 332Ideo: Liberal (1-3) 10% (63) 87% (546) 1% (8) 1% (9) 625Ideo: Moderate (4) 28% (162) 67% (384) 4% (23) — (2) 571Ideo: Conservative (5-7) 75% (515) 24% (162) 1% (6) — (2) 685Educ: < College 43% (536) 54% (677) 3% (35) — (6) 1254Educ: Bachelors degree 34% (159) 64% (300) 1% (7) 1% (7) 472Educ: Post-grad 31% (83) 67% (179) 2% (6) — (0) 268Income: Under 50k 38% (371) 59% (581) 3% (32) — (5) 989Income: 50k-100k 41% (248) 57% (345) 1% (6) 1% (4) 602Income: 100k+ 39% (158) 57% (230) 2% (10) 1% (4) 402Ethnicity: White 45% (720) 53% (854) 2% (29) 1% (10) 1613Ethnicity: Hispanic 30% (58) 63% (122) 5% (10) 2% (3) 193
Continued on next page

National Tracking Poll #2103129, March, 2021
265
Table POLx_5
Table POLx_5: Favorability forDonald Trump
Demographic Total Favorable Total UnfavorableHeard Of, NoOpinion Never Heard Of Total N
Registered Voters 39% (777) 58% (1156) 2% (48) 1% (13) 1994Ethnicity: Black 10% (26) 87% (219) 3% (8) — (0) 253Ethnicity: Other 25% (32) 64% (83) 8% (11) 2% (3) 128All Christian 45% (468) 53% (550) 1% (14) — (5) 1036All Non-Christian 33% (38) 60% (69) 2% (2) 5% (6) 115Atheist 18% (15) 82% (72) 1% (1) — (0) 88Agnostic/Nothing in particular 27% (120) 69% (310) 4% (19) — (2) 450Something Else 45% (137) 51% (155) 4% (12) — (0) 305Religious Non-Protestant/Catholic 36% (51) 58% (82) 2% (2) 4% (6) 141Evangelical 55% (302) 41% (227) 3% (16) 1% (3) 547Non-Evangelical 38% (279) 61% (453) 1% (10) — (1) 742Community: Urban 31% (183) 64% (378) 2% (14) 2% (12) 586Community: Suburban 36% (335) 61% (564) 3% (24) — (1) 924Community: Rural 54% (259) 44% (214) 2% (11) — (0) 484Employ: Private Sector 38% (253) 59% (390) 2% (16) 1% (4) 663Employ: Government 36% (43) 63% (75) 1% (2) — (0) 120Employ: Self-Employed 42% (73) 52% (91) 3% (5) 3% (6) 176Employ: Homemaker 57% (67) 41% (48) 2% (2) — (0) 118Employ: Student 15% (14) 75% (68) 10% (9) — (0) 91Employ: Retired 41% (219) 59% (313) — (2) — (1) 534Employ: Unemployed 37% (68) 55% (101) 6% (12) 1% (2) 182Employ: Other 37% (41) 62% (69) 1% (1) — (0) 111Military HH: Yes 41% (137) 56% (186) 2% (5) 1% (5) 333Military HH: No 39% (641) 58% (970) 3% (43) — (8) 1661RD/WT: Right Direction 15% (149) 82% (831) 2% (25) 1% (13) 1017RD/WT: Wrong Track 64% (629) 33% (325) 2% (23) — (0) 977Biden Job Approve 11% (123) 86% (971) 2% (22) 1% (10) 1127Biden Job Disapprove 80% (632) 19% (153) — (4) — (3) 792
Continued on next page

266
Morning ConsultTable POLx_5
Table POLx_5: Favorability forDonald Trump
Demographic Total Favorable Total UnfavorableHeard Of, NoOpinion Never Heard Of Total N
Registered Voters 39% (777) 58% (1156) 2% (48) 1% (13) 1994Biden Job Strongly Approve 11% (70) 87% (574) 1% (9) 1% (10) 663Biden Job Somewhat Approve 12% (53) 86% (397) 3% (13) — (0) 464Biden Job Somewhat Disapprove 59% (134) 40% (92) 1% (2) — (1) 229Biden Job Strongly Disapprove 88% (497) 11% (62) — (2) — (2) 562Favorable of Biden 10% (115) 88% (1005) 2% (19) — (4) 1143Unfavorable of Biden 82% (645) 17% (137) — (3) — (0) 785Very Favorable of Biden 7% (47) 90% (583) 2% (11) 1% (4) 644Somewhat Favorable of Biden 14% (68) 85% (423) 2% (8) — (0) 499Somewhat Unfavorable of Biden 61% (115) 39% (74) 1% (1) — (0) 190Very Unfavorable of Biden 89% (530) 11% (63) — (2) — (0) 595#1 Issue: Economy 42% (303) 54% (383) 4% (26) — (2) 714#1 Issue: Security 74% (227) 25% (75) 1% (2) — (0) 305#1 Issue: Health Care 16% (49) 81% (250) 1% (4) 2% (5) 308#1 Issue: Medicare / Social Security 33% (88) 65% (174) 1% (3) — (1) 267#1 Issue: Women’s Issues 24% (21) 69% (61) 3% (3) 3% (3) 88#1 Issue: Education 26% (23) 71% (64) 3% (2) — (0) 89#1 Issue: Energy 26% (23) 67% (59) 5% (4) 2% (2) 89#1 Issue: Other 32% (43) 66% (89) 2% (3) — (0) 1342020 Vote: Joe Biden 6% (60) 92% (952) 2% (16) 1% (8) 10372020 Vote: Donald Trump 87% (645) 11% (83) 1% (9) 1% (5) 7412020 Vote: Other 15% (9) 61% (37) 24% (15) — (0) 602020 Vote: Didn’t Vote 41% (62) 54% (82) 6% (9) — (0) 1532018 House Vote: Democrat 10% (76) 88% (657) 1% (10) 1% (5) 7482018 House Vote: Republican 80% (499) 19% (120) 1% (3) — (0) 6232018 House Vote: Someone else 38% (20) 50% (27) 12% (7) — (0) 552016 Vote: Hillary Clinton 8% (54) 91% (636) 1% (8) — (2) 7002016 Vote: Donald Trump 80% (569) 19% (137) 1% (8) — (0) 7132016 Vote: Other 20% (22) 75% (81) 5% (5) — (0) 1082016 Vote: Didn’t Vote 28% (130) 64% (300) 6% (27) 2% (10) 467
Continued on next page

National Tracking Poll #2103129, March, 2021
267
Table POLx_5
Table POLx_5: Favorability forDonald Trump
Demographic Total Favorable Total UnfavorableHeard Of, NoOpinion Never Heard Of Total N
Registered Voters 39% (777) 58% (1156) 2% (48) 1% (13) 1994Voted in 2014: Yes 43% (542) 56% (717) 1% (13) — (2) 1275Voted in 2014: No 33% (235) 61% (439) 5% (35) 1% (10) 7194-Region: Northeast 35% (125) 60% (213) 3% (11) 2% (8) 3564-Region: Midwest 43% (198) 56% (255) 1% (4) — (1) 4584-Region: South 40% (298) 58% (428) 2% (18) — (0) 7444-Region: West 36% (156) 60% (260) 4% (16) 1% (4) 436Party: Democrat/Leans Democrat 8% (81) 89% (866) 2% (16) 1% (10) 973Party: Republican/Leans Republican 81% (621) 18% (136) 1% (8) — (3) 768Note: Row proportions may total to larger than one-hundred percent due to rounding. For more information visit MorningConsultIntelligence.com.
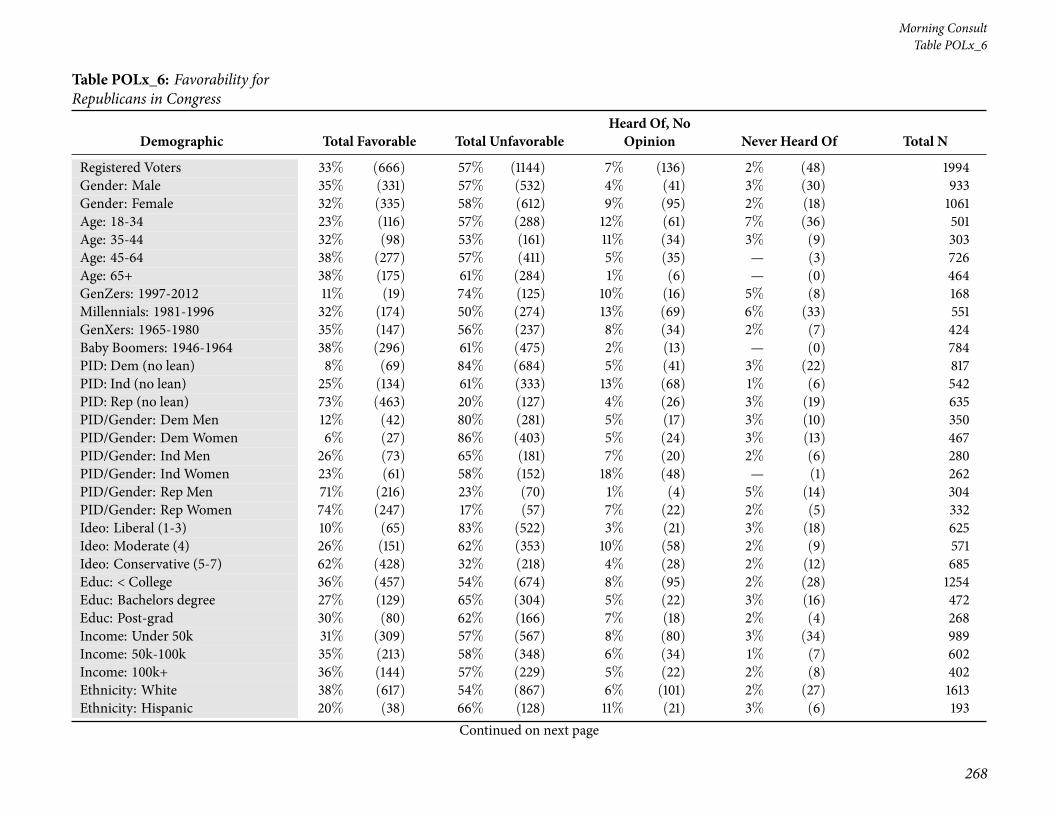
268
Morning ConsultTable POLx_6
Table POLx_6: Favorability forRepublicans in Congress
Demographic Total Favorable Total UnfavorableHeard Of, NoOpinion Never Heard Of Total N
Registered Voters 33% (666) 57% (1144) 7% (136) 2% (48) 1994Gender: Male 35% (331) 57% (532) 4% (41) 3% (30) 933Gender: Female 32% (335) 58% (612) 9% (95) 2% (18) 1061Age: 18-34 23% (116) 57% (288) 12% (61) 7% (36) 501Age: 35-44 32% (98) 53% (161) 11% (34) 3% (9) 303Age: 45-64 38% (277) 57% (411) 5% (35) — (3) 726Age: 65+ 38% (175) 61% (284) 1% (6) — (0) 464GenZers: 1997-2012 11% (19) 74% (125) 10% (16) 5% (8) 168Millennials: 1981-1996 32% (174) 50% (274) 13% (69) 6% (33) 551GenXers: 1965-1980 35% (147) 56% (237) 8% (34) 2% (7) 424Baby Boomers: 1946-1964 38% (296) 61% (475) 2% (13) — (0) 784PID: Dem (no lean) 8% (69) 84% (684) 5% (41) 3% (22) 817PID: Ind (no lean) 25% (134) 61% (333) 13% (68) 1% (6) 542PID: Rep (no lean) 73% (463) 20% (127) 4% (26) 3% (19) 635PID/Gender: DemMen 12% (42) 80% (281) 5% (17) 3% (10) 350PID/Gender: DemWomen 6% (27) 86% (403) 5% (24) 3% (13) 467PID/Gender: Ind Men 26% (73) 65% (181) 7% (20) 2% (6) 280PID/Gender: Ind Women 23% (61) 58% (152) 18% (48) — (1) 262PID/Gender: Rep Men 71% (216) 23% (70) 1% (4) 5% (14) 304PID/Gender: Rep Women 74% (247) 17% (57) 7% (22) 2% (5) 332Ideo: Liberal (1-3) 10% (65) 83% (522) 3% (21) 3% (18) 625Ideo: Moderate (4) 26% (151) 62% (353) 10% (58) 2% (9) 571Ideo: Conservative (5-7) 62% (428) 32% (218) 4% (28) 2% (12) 685Educ: < College 36% (457) 54% (674) 8% (95) 2% (28) 1254Educ: Bachelors degree 27% (129) 65% (304) 5% (22) 3% (16) 472Educ: Post-grad 30% (80) 62% (166) 7% (18) 2% (4) 268Income: Under 50k 31% (309) 57% (567) 8% (80) 3% (34) 989Income: 50k-100k 35% (213) 58% (348) 6% (34) 1% (7) 602Income: 100k+ 36% (144) 57% (229) 5% (22) 2% (8) 402Ethnicity: White 38% (617) 54% (867) 6% (101) 2% (27) 1613Ethnicity: Hispanic 20% (38) 66% (128) 11% (21) 3% (6) 193
Continued on next page
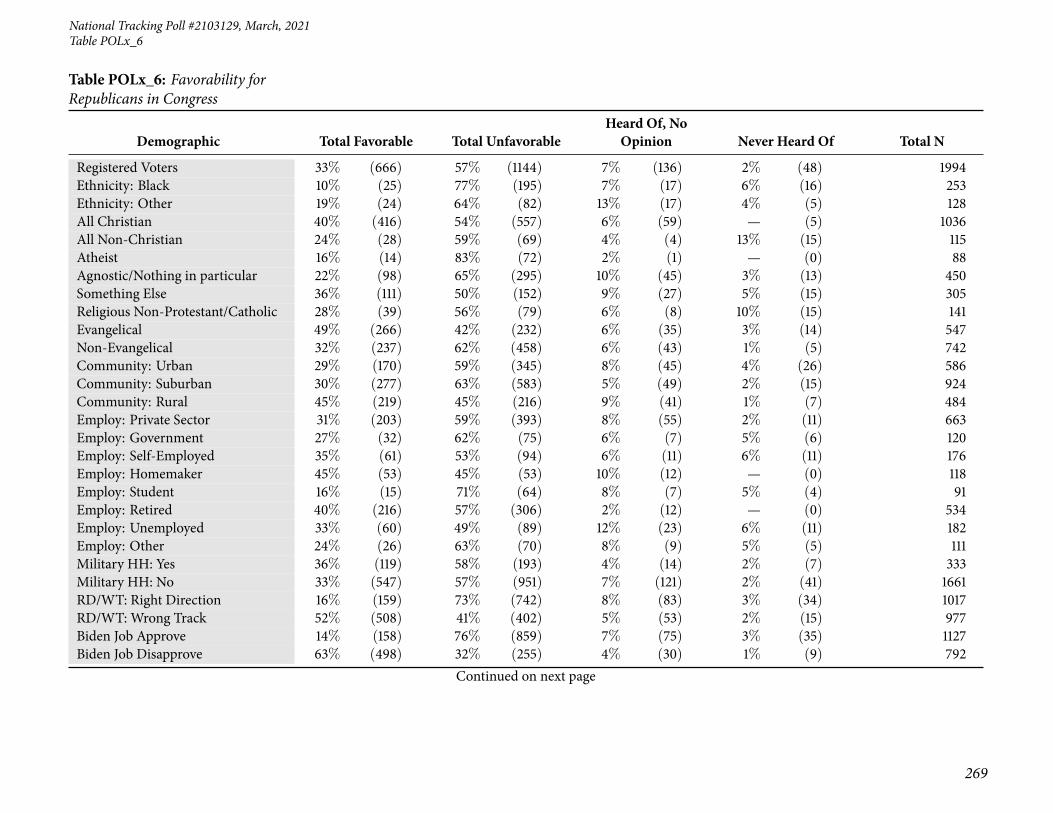
National Tracking Poll #2103129, March, 2021
269
Table POLx_6
Table POLx_6: Favorability forRepublicans in Congress
Demographic Total Favorable Total UnfavorableHeard Of, NoOpinion Never Heard Of Total N
Registered Voters 33% (666) 57% (1144) 7% (136) 2% (48) 1994Ethnicity: Black 10% (25) 77% (195) 7% (17) 6% (16) 253Ethnicity: Other 19% (24) 64% (82) 13% (17) 4% (5) 128All Christian 40% (416) 54% (557) 6% (59) — (5) 1036All Non-Christian 24% (28) 59% (69) 4% (4) 13% (15) 115Atheist 16% (14) 83% (72) 2% (1) — (0) 88Agnostic/Nothing in particular 22% (98) 65% (295) 10% (45) 3% (13) 450Something Else 36% (111) 50% (152) 9% (27) 5% (15) 305Religious Non-Protestant/Catholic 28% (39) 56% (79) 6% (8) 10% (15) 141Evangelical 49% (266) 42% (232) 6% (35) 3% (14) 547Non-Evangelical 32% (237) 62% (458) 6% (43) 1% (5) 742Community: Urban 29% (170) 59% (345) 8% (45) 4% (26) 586Community: Suburban 30% (277) 63% (583) 5% (49) 2% (15) 924Community: Rural 45% (219) 45% (216) 9% (41) 1% (7) 484Employ: Private Sector 31% (203) 59% (393) 8% (55) 2% (11) 663Employ: Government 27% (32) 62% (75) 6% (7) 5% (6) 120Employ: Self-Employed 35% (61) 53% (94) 6% (11) 6% (11) 176Employ: Homemaker 45% (53) 45% (53) 10% (12) — (0) 118Employ: Student 16% (15) 71% (64) 8% (7) 5% (4) 91Employ: Retired 40% (216) 57% (306) 2% (12) — (0) 534Employ: Unemployed 33% (60) 49% (89) 12% (23) 6% (11) 182Employ: Other 24% (26) 63% (70) 8% (9) 5% (5) 111Military HH: Yes 36% (119) 58% (193) 4% (14) 2% (7) 333Military HH: No 33% (547) 57% (951) 7% (121) 2% (41) 1661RD/WT: Right Direction 16% (159) 73% (742) 8% (83) 3% (34) 1017RD/WT: Wrong Track 52% (508) 41% (402) 5% (53) 2% (15) 977Biden Job Approve 14% (158) 76% (859) 7% (75) 3% (35) 1127Biden Job Disapprove 63% (498) 32% (255) 4% (30) 1% (9) 792
Continued on next page

270
Morning ConsultTable POLx_6
Table POLx_6: Favorability forRepublicans in Congress
Demographic Total Favorable Total UnfavorableHeard Of, NoOpinion Never Heard Of Total N
Registered Voters 33% (666) 57% (1144) 7% (136) 2% (48) 1994Biden Job Strongly Approve 13% (85) 80% (527) 3% (23) 4% (28) 663Biden Job Somewhat Approve 16% (73) 72% (332) 11% (52) 2% (7) 464Biden Job Somewhat Disapprove 49% (112) 42% (97) 8% (18) 1% (2) 229Biden Job Strongly Disapprove 69% (386) 28% (159) 2% (11) 1% (7) 562Favorable of Biden 14% (155) 78% (894) 6% (74) 2% (20) 1143Unfavorable of Biden 64% (506) 30% (239) 5% (36) — (3) 785Very Favorable of Biden 11% (70) 82% (531) 4% (24) 3% (18) 644Somewhat Favorable of Biden 17% (85) 73% (363) 10% (50) — (2) 499Somewhat Unfavorable of Biden 50% (94) 40% (76) 10% (19) 1% (1) 190Very Unfavorable of Biden 69% (411) 28% (164) 3% (18) — (2) 595#1 Issue: Economy 35% (249) 54% (388) 8% (60) 2% (16) 714#1 Issue: Security 62% (188) 30% (92) 8% (23) 1% (2) 305#1 Issue: Health Care 16% (48) 75% (231) 7% (21) 3% (8) 308#1 Issue: Medicare / Social Security 35% (93) 62% (167) 3% (8) — (0) 267#1 Issue: Women’s Issues 18% (16) 68% (60) 5% (5) 9% (8) 88#1 Issue: Education 15% (14) 68% (61) 11% (10) 6% (5) 89#1 Issue: Energy 24% (21) 64% (57) 5% (5) 6% (5) 89#1 Issue: Other 28% (38) 66% (89) 3% (4) 3% (4) 1342020 Vote: Joe Biden 9% (92) 83% (862) 6% (57) 2% (26) 10372020 Vote: Donald Trump 68% (503) 24% (181) 5% (40) 2% (17) 7412020 Vote: Other 23% (14) 47% (28) 27% (16) 4% (2) 602020 Vote: Didn’t Vote 37% (57) 46% (70) 15% (22) 2% (3) 1532018 House Vote: Democrat 10% (75) 84% (631) 4% (33) 1% (8) 7482018 House Vote: Republican 67% (417) 28% (173) 4% (23) 2% (10) 6232018 House Vote: Someone else 13% (7) 62% (34) 18% (10) 6% (3) 552016 Vote: Hillary Clinton 9% (60) 85% (596) 6% (39) 1% (5) 7002016 Vote: Donald Trump 65% (465) 29% (204) 5% (33) 1% (11) 7132016 Vote: Other 18% (20) 69% (75) 13% (14) — (0) 1082016 Vote: Didn’t Vote 25% (118) 57% (267) 11% (50) 7% (32) 467
Continued on next page

National Tracking Poll #2103129, March, 2021
271
Table POLx_6
Table POLx_6: Favorability forRepublicans in Congress
Demographic Total Favorable Total UnfavorableHeard Of, NoOpinion Never Heard Of Total N
Registered Voters 33% (666) 57% (1144) 7% (136) 2% (48) 1994Voted in 2014: Yes 36% (462) 58% (738) 4% (56) 1% (19) 1275Voted in 2014: No 28% (205) 56% (406) 11% (79) 4% (29) 7194-Region: Northeast 32% (115) 54% (193) 8% (29) 5% (20) 3564-Region: Midwest 34% (158) 59% (269) 6% (27) 1% (4) 4584-Region: South 35% (263) 56% (419) 7% (56) 1% (7) 7444-Region: West 30% (130) 60% (263) 5% (24) 4% (18) 436Party: Democrat/Leans Democrat 9% (88) 84% (814) 5% (49) 2% (22) 973Party: Republican/Leans Republican 70% (537) 22% (173) 5% (39) 3% (19) 768Note: Row proportions may total to larger than one-hundred percent due to rounding. For more information visit MorningConsultIntelligence.com.
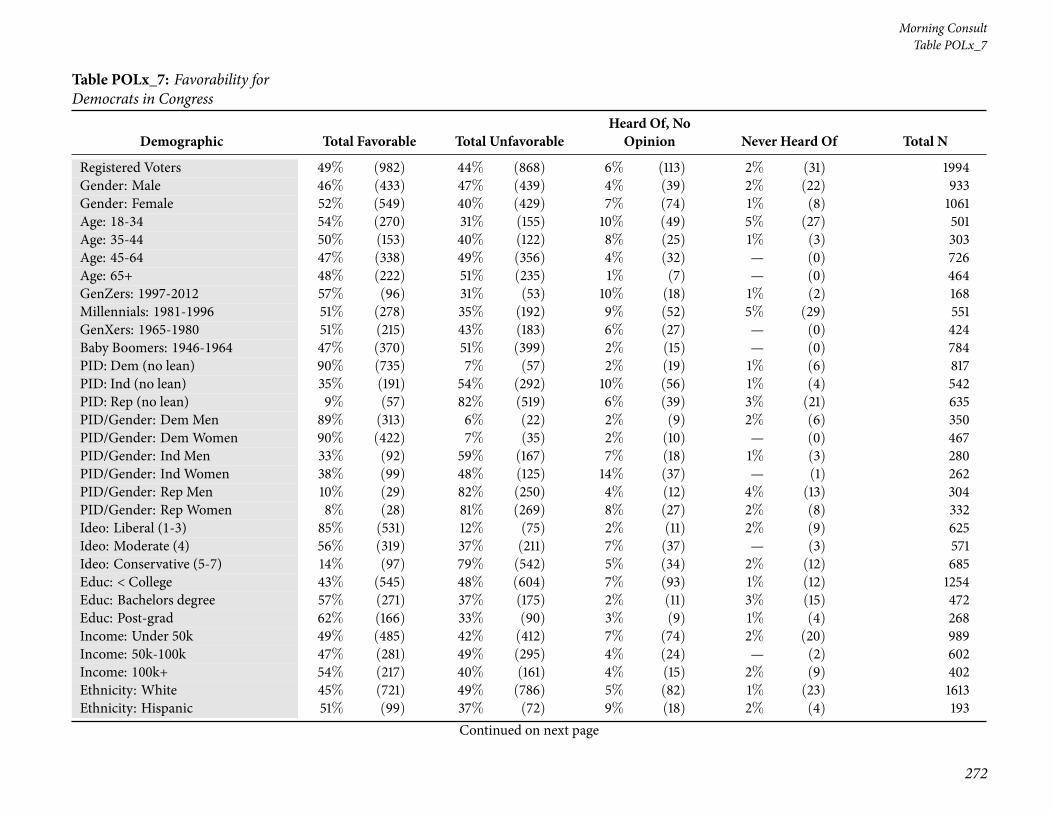
272
Morning ConsultTable POLx_7
Table POLx_7: Favorability forDemocrats in Congress
Demographic Total Favorable Total UnfavorableHeard Of, NoOpinion Never Heard Of Total N
Registered Voters 49% (982) 44% (868) 6% (113) 2% (31) 1994Gender: Male 46% (433) 47% (439) 4% (39) 2% (22) 933Gender: Female 52% (549) 40% (429) 7% (74) 1% (8) 1061Age: 18-34 54% (270) 31% (155) 10% (49) 5% (27) 501Age: 35-44 50% (153) 40% (122) 8% (25) 1% (3) 303Age: 45-64 47% (338) 49% (356) 4% (32) — (0) 726Age: 65+ 48% (222) 51% (235) 1% (7) — (0) 464GenZers: 1997-2012 57% (96) 31% (53) 10% (18) 1% (2) 168Millennials: 1981-1996 51% (278) 35% (192) 9% (52) 5% (29) 551GenXers: 1965-1980 51% (215) 43% (183) 6% (27) — (0) 424Baby Boomers: 1946-1964 47% (370) 51% (399) 2% (15) — (0) 784PID: Dem (no lean) 90% (735) 7% (57) 2% (19) 1% (6) 817PID: Ind (no lean) 35% (191) 54% (292) 10% (56) 1% (4) 542PID: Rep (no lean) 9% (57) 82% (519) 6% (39) 3% (21) 635PID/Gender: DemMen 89% (313) 6% (22) 2% (9) 2% (6) 350PID/Gender: DemWomen 90% (422) 7% (35) 2% (10) — (0) 467PID/Gender: Ind Men 33% (92) 59% (167) 7% (18) 1% (3) 280PID/Gender: Ind Women 38% (99) 48% (125) 14% (37) — (1) 262PID/Gender: Rep Men 10% (29) 82% (250) 4% (12) 4% (13) 304PID/Gender: Rep Women 8% (28) 81% (269) 8% (27) 2% (8) 332Ideo: Liberal (1-3) 85% (531) 12% (75) 2% (11) 2% (9) 625Ideo: Moderate (4) 56% (319) 37% (211) 7% (37) — (3) 571Ideo: Conservative (5-7) 14% (97) 79% (542) 5% (34) 2% (12) 685Educ: < College 43% (545) 48% (604) 7% (93) 1% (12) 1254Educ: Bachelors degree 57% (271) 37% (175) 2% (11) 3% (15) 472Educ: Post-grad 62% (166) 33% (90) 3% (9) 1% (4) 268Income: Under 50k 49% (485) 42% (412) 7% (74) 2% (20) 989Income: 50k-100k 47% (281) 49% (295) 4% (24) — (2) 602Income: 100k+ 54% (217) 40% (161) 4% (15) 2% (9) 402Ethnicity: White 45% (721) 49% (786) 5% (82) 1% (23) 1613Ethnicity: Hispanic 51% (99) 37% (72) 9% (18) 2% (4) 193
Continued on next page

National Tracking Poll #2103129, March, 2021
273
Table POLx_7
Table POLx_7: Favorability forDemocrats in Congress
Demographic Total Favorable Total UnfavorableHeard Of, NoOpinion Never Heard Of Total N
Registered Voters 49% (982) 44% (868) 6% (113) 2% (31) 1994Ethnicity: Black 79% (199) 15% (38) 4% (11) 2% (4) 253Ethnicity: Other 48% (61) 34% (44) 16% (20) 2% (3) 128All Christian 46% (480) 49% (505) 4% (43) 1% (8) 1036All Non-Christian 68% (78) 20% (23) 2% (3) 10% (12) 115Atheist 61% (54) 38% (33) 1% (1) — (0) 88Agnostic/Nothing in particular 52% (232) 37% (168) 10% (47) 1% (3) 450Something Else 45% (137) 46% (139) 7% (20) 3% (8) 305Religious Non-Protestant/Catholic 61% (86) 27% (38) 3% (4) 8% (12) 141Evangelical 40% (217) 54% (295) 4% (24) 2% (11) 547Non-Evangelical 51% (379) 44% (324) 5% (36) — (3) 742Community: Urban 62% (365) 28% (166) 6% (34) 4% (22) 586Community: Suburban 49% (451) 46% (422) 5% (44) 1% (7) 924Community: Rural 34% (167) 58% (280) 7% (35) — (2) 484Employ: Private Sector 52% (343) 42% (278) 5% (32) 2% (10) 663Employ: Government 62% (75) 30% (36) 5% (6) 3% (4) 120Employ: Self-Employed 44% (77) 46% (80) 7% (12) 4% (7) 176Employ: Homemaker 36% (42) 54% (64) 8% (9) 2% (3) 118Employ: Student 55% (50) 34% (31) 11% (10) — (0) 91Employ: Retired 48% (257) 49% (264) 3% (14) — (0) 534Employ: Unemployed 41% (75) 44% (80) 13% (23) 2% (3) 182Employ: Other 58% (65) 32% (36) 6% (7) 3% (4) 111Military HH: Yes 45% (151) 49% (163) 4% (14) 2% (5) 333Military HH: No 50% (831) 42% (705) 6% (100) 2% (26) 1661RD/WT: Right Direction 78% (798) 14% (145) 5% (50) 2% (23) 1017RD/WT: Wrong Track 19% (184) 74% (723) 6% (63) 1% (7) 977Biden Job Approve 82% (921) 13% (141) 4% (44) 2% (20) 1127Biden Job Disapprove 6% (48) 88% (698) 5% (37) 1% (8) 792
Continued on next page

274
Morning ConsultTable POLx_7
Table POLx_7: Favorability forDemocrats in Congress
Demographic Total Favorable Total UnfavorableHeard Of, NoOpinion Never Heard Of Total N
Registered Voters 49% (982) 44% (868) 6% (113) 2% (31) 1994Biden Job Strongly Approve 91% (603) 6% (37) 1% (6) 3% (18) 663Biden Job Somewhat Approve 69% (319) 23% (105) 8% (38) 1% (2) 464Biden Job Somewhat Disapprove 14% (33) 77% (178) 7% (17) 1% (2) 229Biden Job Strongly Disapprove 3% (16) 93% (521) 4% (20) 1% (6) 562Favorable of Biden 84% (959) 12% (135) 4% (42) 1% (7) 1143Unfavorable of Biden 3% (21) 92% (723) 5% (36) 1% (5) 785Very Favorable of Biden 95% (615) 3% (19) 1% (6) 1% (4) 644Somewhat Favorable of Biden 69% (344) 23% (115) 7% (36) — (2) 499Somewhat Unfavorable of Biden 9% (18) 81% (155) 9% (16) 1% (1) 190Very Unfavorable of Biden 1% (3) 96% (568) 3% (19) 1% (4) 595#1 Issue: Economy 45% (324) 47% (339) 6% (45) 1% (6) 714#1 Issue: Security 19% (57) 74% (225) 7% (21) 1% (3) 305#1 Issue: Health Care 71% (217) 23% (69) 6% (17) 1% (4) 308#1 Issue: Medicare / Social Security 58% (154) 40% (107) 2% (5) — (1) 267#1 Issue: Women’s Issues 54% (48) 33% (29) 7% (6) 7% (6) 88#1 Issue: Education 59% (53) 23% (20) 12% (10) 6% (6) 89#1 Issue: Energy 59% (53) 30% (26) 5% (4) 6% (5) 89#1 Issue: Other 57% (77) 39% (52) 4% (5) — (0) 1342020 Vote: Joe Biden 85% (877) 11% (117) 3% (31) 1% (12) 10372020 Vote: Donald Trump 5% (35) 86% (640) 7% (48) 2% (18) 7412020 Vote: Other 12% (7) 58% (35) 30% (18) — (0) 602020 Vote: Didn’t Vote 40% (61) 49% (75) 11% (16) — (1) 1532018 House Vote: Democrat 86% (640) 11% (84) 2% (17) 1% (6) 7482018 House Vote: Republican 9% (58) 84% (524) 5% (29) 2% (12) 6232018 House Vote: Someone else 23% (13) 56% (30) 19% (10) 2% (1) 552016 Vote: Hillary Clinton 88% (617) 9% (60) 3% (20) — (3) 7002016 Vote: Donald Trump 10% (72) 83% (592) 5% (36) 2% (12) 7132016 Vote: Other 41% (45) 49% (53) 10% (10) — (0) 1082016 Vote: Didn’t Vote 52% (243) 35% (162) 10% (46) 3% (15) 467
Continued on next page
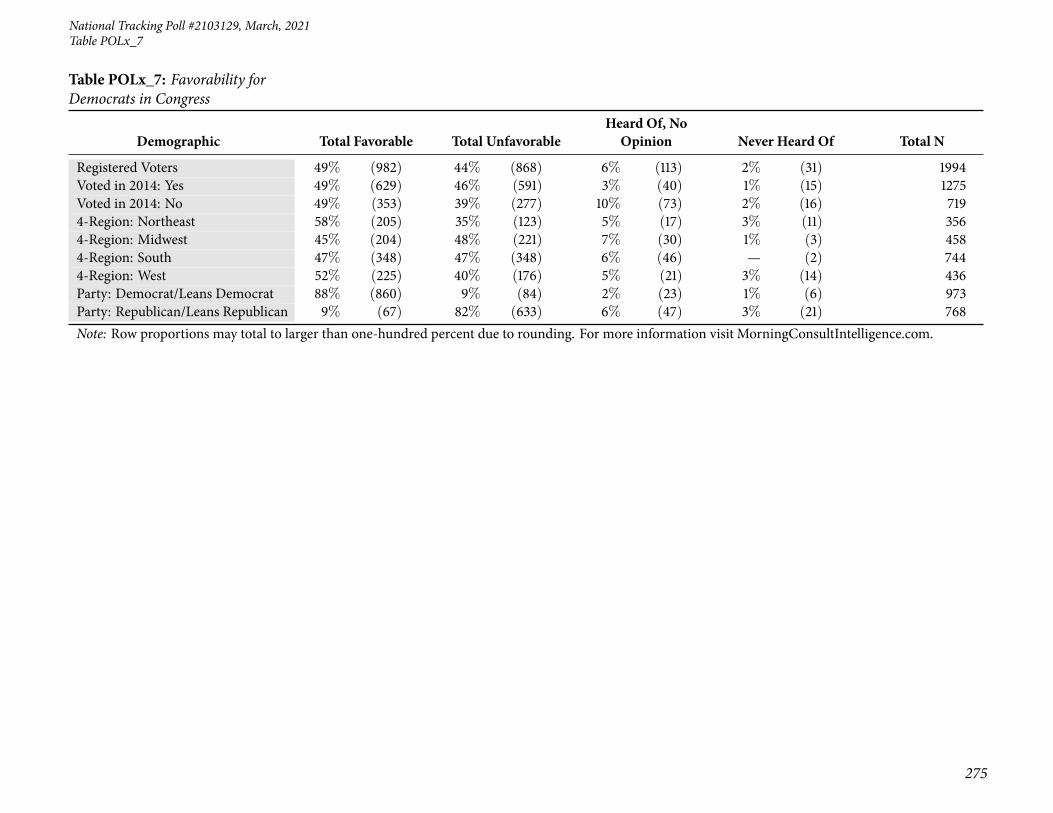
National Tracking Poll #2103129, March, 2021
275
Table POLx_7
Table POLx_7: Favorability forDemocrats in Congress
Demographic Total Favorable Total UnfavorableHeard Of, NoOpinion Never Heard Of Total N
Registered Voters 49% (982) 44% (868) 6% (113) 2% (31) 1994Voted in 2014: Yes 49% (629) 46% (591) 3% (40) 1% (15) 1275Voted in 2014: No 49% (353) 39% (277) 10% (73) 2% (16) 7194-Region: Northeast 58% (205) 35% (123) 5% (17) 3% (11) 3564-Region: Midwest 45% (204) 48% (221) 7% (30) 1% (3) 4584-Region: South 47% (348) 47% (348) 6% (46) — (2) 7444-Region: West 52% (225) 40% (176) 5% (21) 3% (14) 436Party: Democrat/Leans Democrat 88% (860) 9% (84) 2% (23) 1% (6) 973Party: Republican/Leans Republican 9% (67) 82% (633) 6% (47) 3% (21) 768Note: Row proportions may total to larger than one-hundred percent due to rounding. For more information visit MorningConsultIntelligence.com.
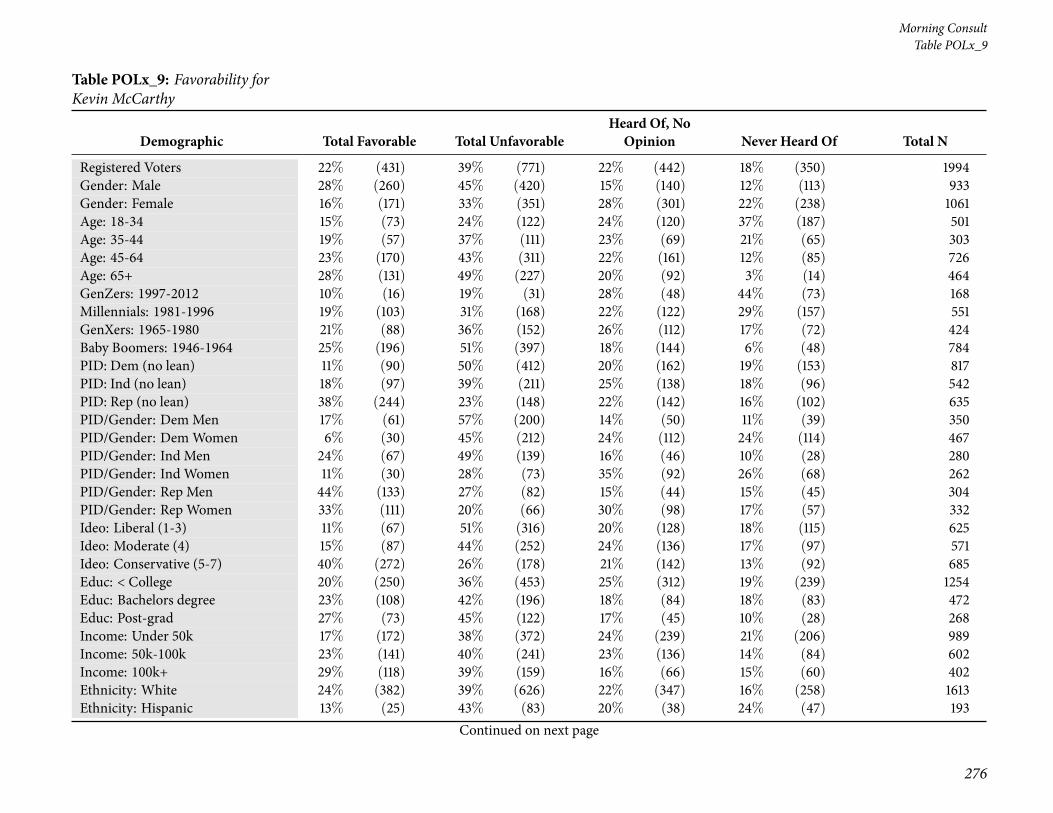
276
Morning ConsultTable POLx_9
Table POLx_9: Favorability forKevin McCarthy
Demographic Total Favorable Total UnfavorableHeard Of, NoOpinion Never Heard Of Total N
Registered Voters 22% (431) 39% (771) 22% (442) 18% (350) 1994Gender: Male 28% (260) 45% (420) 15% (140) 12% (113) 933Gender: Female 16% (171) 33% (351) 28% (301) 22% (238) 1061Age: 18-34 15% (73) 24% (122) 24% (120) 37% (187) 501Age: 35-44 19% (57) 37% (111) 23% (69) 21% (65) 303Age: 45-64 23% (170) 43% (311) 22% (161) 12% (85) 726Age: 65+ 28% (131) 49% (227) 20% (92) 3% (14) 464GenZers: 1997-2012 10% (16) 19% (31) 28% (48) 44% (73) 168Millennials: 1981-1996 19% (103) 31% (168) 22% (122) 29% (157) 551GenXers: 1965-1980 21% (88) 36% (152) 26% (112) 17% (72) 424Baby Boomers: 1946-1964 25% (196) 51% (397) 18% (144) 6% (48) 784PID: Dem (no lean) 11% (90) 50% (412) 20% (162) 19% (153) 817PID: Ind (no lean) 18% (97) 39% (211) 25% (138) 18% (96) 542PID: Rep (no lean) 38% (244) 23% (148) 22% (142) 16% (102) 635PID/Gender: DemMen 17% (61) 57% (200) 14% (50) 11% (39) 350PID/Gender: DemWomen 6% (30) 45% (212) 24% (112) 24% (114) 467PID/Gender: Ind Men 24% (67) 49% (139) 16% (46) 10% (28) 280PID/Gender: Ind Women 11% (30) 28% (73) 35% (92) 26% (68) 262PID/Gender: Rep Men 44% (133) 27% (82) 15% (44) 15% (45) 304PID/Gender: Rep Women 33% (111) 20% (66) 30% (98) 17% (57) 332Ideo: Liberal (1-3) 11% (67) 51% (316) 20% (128) 18% (115) 625Ideo: Moderate (4) 15% (87) 44% (252) 24% (136) 17% (97) 571Ideo: Conservative (5-7) 40% (272) 26% (178) 21% (142) 13% (92) 685Educ: < College 20% (250) 36% (453) 25% (312) 19% (239) 1254Educ: Bachelors degree 23% (108) 42% (196) 18% (84) 18% (83) 472Educ: Post-grad 27% (73) 45% (122) 17% (45) 10% (28) 268Income: Under 50k 17% (172) 38% (372) 24% (239) 21% (206) 989Income: 50k-100k 23% (141) 40% (241) 23% (136) 14% (84) 602Income: 100k+ 29% (118) 39% (159) 16% (66) 15% (60) 402Ethnicity: White 24% (382) 39% (626) 22% (347) 16% (258) 1613Ethnicity: Hispanic 13% (25) 43% (83) 20% (38) 24% (47) 193
Continued on next page

National Tracking Poll #2103129, March, 2021
277
Table POLx_9
Table POLx_9: Favorability forKevin McCarthy
Demographic Total Favorable Total UnfavorableHeard Of, NoOpinion Never Heard Of Total N
Registered Voters 22% (431) 39% (771) 22% (442) 18% (350) 1994Ethnicity: Black 14% (36) 39% (100) 25% (63) 21% (54) 253Ethnicity: Other 11% (14) 35% (45) 24% (31) 30% (38) 128All Christian 28% (294) 40% (409) 21% (214) 11% (118) 1036All Non-Christian 24% (27) 43% (50) 10% (11) 23% (27) 115Atheist 13% (11) 59% (52) 18% (16) 10% (9) 88Agnostic/Nothing in particular 11% (52) 43% (192) 24% (107) 22% (101) 450Something Else 15% (47) 22% (68) 31% (94) 32% (96) 305Religious Non-Protestant/Catholic 24% (34) 40% (57) 10% (14) 26% (36) 141Evangelical 31% (171) 30% (164) 25% (135) 14% (78) 547Non-Evangelical 21% (152) 41% (301) 23% (168) 16% (121) 742Community: Urban 26% (152) 36% (211) 19% (110) 19% (114) 586Community: Suburban 18% (170) 43% (394) 22% (200) 17% (160) 924Community: Rural 23% (109) 34% (166) 27% (132) 16% (77) 484Employ: Private Sector 21% (142) 42% (278) 20% (129) 17% (113) 663Employ: Government 23% (28) 29% (35) 23% (27) 25% (30) 120Employ: Self-Employed 27% (47) 41% (72) 16% (29) 16% (28) 176Employ: Homemaker 16% (19) 26% (30) 25% (29) 33% (39) 118Employ: Student 7% (7) 17% (16) 41% (37) 35% (31) 91Employ: Retired 28% (149) 46% (248) 22% (115) 4% (22) 534Employ: Unemployed 13% (24) 31% (56) 23% (41) 33% (60) 182Employ: Other 14% (15) 32% (36) 30% (34) 24% (26) 111Military HH: Yes 30% (101) 36% (118) 26% (86) 8% (28) 333Military HH: No 20% (331) 39% (652) 21% (356) 19% (322) 1661RD/WT: Right Direction 15% (149) 49% (493) 20% (205) 17% (169) 1017RD/WT: Wrong Track 29% (282) 28% (277) 24% (236) 19% (181) 977Biden Job Approve 12% (140) 49% (556) 20% (227) 18% (205) 1127Biden Job Disapprove 36% (286) 25% (201) 24% (191) 14% (113) 792
Continued on next page

278
Morning ConsultTable POLx_9
Table POLx_9: Favorability forKevin McCarthy
Demographic Total Favorable Total UnfavorableHeard Of, NoOpinion Never Heard Of Total N
Registered Voters 22% (431) 39% (771) 22% (442) 18% (350) 1994Biden Job Strongly Approve 14% (93) 57% (375) 16% (107) 13% (87) 663Biden Job Somewhat Approve 10% (47) 39% (181) 26% (119) 25% (117) 464Biden Job Somewhat Disapprove 21% (48) 26% (59) 29% (66) 24% (56) 229Biden Job Strongly Disapprove 42% (238) 25% (142) 22% (125) 10% (58) 562Favorable of Biden 12% (141) 49% (560) 21% (236) 18% (206) 1143Unfavorable of Biden 37% (289) 26% (201) 24% (185) 14% (110) 785Very Favorable of Biden 14% (89) 55% (356) 18% (116) 13% (83) 644Somewhat Favorable of Biden 10% (52) 41% (203) 24% (120) 25% (123) 499Somewhat Unfavorable of Biden 20% (39) 28% (53) 28% (52) 24% (45) 190Very Unfavorable of Biden 42% (250) 25% (148) 22% (132) 11% (65) 595#1 Issue: Economy 23% (162) 36% (259) 22% (157) 19% (136) 714#1 Issue: Security 42% (128) 25% (76) 24% (74) 9% (27) 305#1 Issue: Health Care 13% (39) 49% (150) 19% (59) 19% (59) 308#1 Issue: Medicare / Social Security 20% (52) 49% (132) 24% (65) 7% (18) 267#1 Issue: Women’s Issues 12% (11) 28% (25) 24% (21) 37% (32) 88#1 Issue: Education 11% (10) 26% (23) 32% (29) 31% (27) 89#1 Issue: Energy 11% (10) 40% (35) 21% (19) 29% (26) 89#1 Issue: Other 15% (20) 53% (71) 14% (18) 19% (25) 1342020 Vote: Joe Biden 11% (112) 53% (548) 19% (199) 17% (177) 10372020 Vote: Donald Trump 39% (288) 22% (164) 25% (186) 14% (102) 7412020 Vote: Other 12% (7) 34% (21) 29% (18) 25% (15) 602020 Vote: Didn’t Vote 15% (23) 23% (35) 25% (39) 37% (56) 1532018 House Vote: Democrat 11% (86) 58% (437) 17% (127) 13% (97) 7482018 House Vote: Republican 42% (260) 26% (163) 22% (135) 10% (65) 6232018 House Vote: Someone else 12% (7) 44% (24) 24% (13) 19% (11) 552016 Vote: Hillary Clinton 11% (77) 58% (406) 19% (133) 12% (84) 7002016 Vote: Donald Trump 39% (281) 25% (182) 23% (161) 12% (89) 7132016 Vote: Other 14% (15) 50% (54) 20% (21) 16% (17) 1082016 Vote: Didn’t Vote 12% (58) 27% (126) 27% (126) 34% (158) 467
Continued on next page

National Tracking Poll #2103129, March, 2021
279
Table POLx_9
Table POLx_9: Favorability forKevin McCarthy
Demographic Total Favorable Total UnfavorableHeard Of, NoOpinion Never Heard Of Total N
Registered Voters 22% (431) 39% (771) 22% (442) 18% (350) 1994Voted in 2014: Yes 26% (329) 45% (569) 20% (250) 10% (128) 1275Voted in 2014: No 14% (103) 28% (202) 27% (192) 31% (223) 7194-Region: Northeast 23% (82) 38% (136) 19% (66) 20% (71) 3564-Region: Midwest 21% (94) 38% (174) 26% (119) 16% (71) 4584-Region: South 22% (163) 38% (281) 24% (177) 17% (124) 7444-Region: West 21% (93) 41% (179) 18% (80) 19% (84) 436Party: Democrat/Leans Democrat 11% (109) 51% (492) 20% (197) 18% (175) 973Party: Republican/Leans Republican 38% (295) 23% (175) 23% (178) 16% (120) 768Note: Row proportions may total to larger than one-hundred percent due to rounding. For more information visit MorningConsultIntelligence.com.

280
Morning ConsultTable POLx_10
Table POLx_10: Favorability forJoe Biden
Demographic Total Favorable Total UnfavorableHeard Of, NoOpinion Never Heard Of Total N
Registered Voters 57% (1143) 39% (785) 2% (46) 1% (20) 1994Gender: Male 55% (516) 40% (378) 2% (20) 2% (20) 933Gender: Female 59% (627) 38% (407) 3% (27) — (0) 1061Age: 18-34 64% (323) 28% (139) 4% (19) 4% (20) 501Age: 35-44 59% (178) 37% (111) 4% (13) — (0) 303Age: 45-64 54% (396) 44% (320) 1% (10) — (0) 726Age: 65+ 53% (246) 46% (214) 1% (4) — (0) 464GenZers: 1997-2012 72% (121) 23% (39) 3% (6) 1% (2) 168Millennials: 1981-1996 59% (324) 34% (185) 4% (23) 3% (18) 551GenXers: 1965-1980 59% (249) 39% (165) 2% (9) — (0) 424Baby Boomers: 1946-1964 54% (422) 45% (356) 1% (6) — (0) 784PID: Dem (no lean) 95% (772) 4% (33) 1% (7) 1% (5) 817PID: Ind (no lean) 50% (271) 44% (240) 5% (29) — (2) 542PID: Rep (no lean) 16% (100) 81% (512) 2% (10) 2% (13) 635PID/Gender: DemMen 95% (332) 3% (11) — (2) 1% (5) 350PID/Gender: DemWomen 94% (440) 5% (22) 1% (6) — (0) 467PID/Gender: Ind Men 48% (134) 48% (133) 4% (10) 1% (2) 280PID/Gender: Ind Women 52% (137) 41% (106) 7% (19) — (0) 262PID/Gender: Rep Men 16% (49) 77% (233) 3% (8) 4% (13) 304PID/Gender: Rep Women 15% (50) 84% (279) 1% (2) — (0) 332Ideo: Liberal (1-3) 90% (562) 8% (49) 1% (6) 1% (9) 625Ideo: Moderate (4) 65% (374) 31% (176) 4% (21) — (0) 571Ideo: Conservative (5-7) 21% (142) 77% (528) 1% (6) 1% (9) 685Educ: < College 52% (653) 45% (560) 3% (34) 1% (7) 1254Educ: Bachelors degree 63% (299) 32% (150) 2% (9) 3% (13) 472Educ: Post-grad 71% (191) 28% (74) 1% (3) — (0) 268Income: Under 50k 58% (571) 38% (371) 3% (31) 2% (16) 989Income: 50k-100k 54% (328) 44% (266) 1% (6) — (2) 602Income: 100k+ 61% (244) 37% (147) 2% (9) — (2) 402Ethnicity: White 53% (852) 44% (717) 2% (29) 1% (15) 1613Ethnicity: Hispanic 59% (114) 32% (62) 7% (14) 2% (3) 193
Continued on next page

National Tracking Poll #2103129, March, 2021
281
Table POLx_10
Table POLx_10: Favorability forJoe Biden
Demographic Total Favorable Total UnfavorableHeard Of, NoOpinion Never Heard Of Total N
Registered Voters 57% (1143) 39% (785) 2% (46) 1% (20) 1994Ethnicity: Black 88% (223) 10% (26) 1% (2) 1% (2) 253Ethnicity: Other 53% (68) 32% (42) 12% (16) 2% (3) 128All Christian 54% (555) 45% (462) 1% (15) — (4) 1036All Non-Christian 73% (84) 15% (17) 1% (2) 11% (12) 115Atheist 71% (62) 28% (25) 1% (1) — (0) 88Agnostic/Nothing in particular 63% (284) 31% (139) 5% (24) 1% (4) 450Something Else 52% (157) 47% (142) 2% (5) — (0) 305Religious Non-Protestant/Catholic 69% (97) 21% (29) 1% (2) 9% (12) 141Evangelical 45% (244) 54% (293) 1% (7) 1% (4) 547Non-Evangelical 59% (437) 39% (293) 2% (13) — (0) 742Community: Urban 72% (420) 24% (139) 1% (7) 3% (20) 586Community: Suburban 58% (533) 40% (369) 2% (22) — (0) 924Community: Rural 39% (190) 57% (276) 4% (18) — (0) 484Employ: Private Sector 61% (401) 36% (239) 2% (15) 1% (7) 663Employ: Government 70% (85) 26% (32) 1% (1) 2% (3) 120Employ: Self-Employed 50% (89) 44% (78) 2% (4) 3% (5) 176Employ: Homemaker 39% (46) 58% (68) 2% (2) 1% (1) 118Employ: Student 76% (69) 22% (20) 2% (2) — (0) 91Employ: Retired 55% (292) 44% (237) 1% (5) — (0) 534Employ: Unemployed 50% (92) 40% (72) 8% (14) 2% (4) 182Employ: Other 63% (69) 35% (38) 3% (3) — (0) 111Military HH: Yes 52% (172) 45% (151) 2% (5) 2% (6) 333Military HH: No 58% (971) 38% (634) 2% (41) 1% (15) 1661RD/WT: Right Direction 89% (909) 7% (71) 2% (19) 2% (18) 1017RD/WT: Wrong Track 24% (234) 73% (714) 3% (27) — (2) 977Biden Job Approve 95% (1071) 3% (33) 1% (9) 1% (13) 1127Biden Job Disapprove 6% (51) 92% (729) 1% (7) 1% (5) 792
Continued on next page
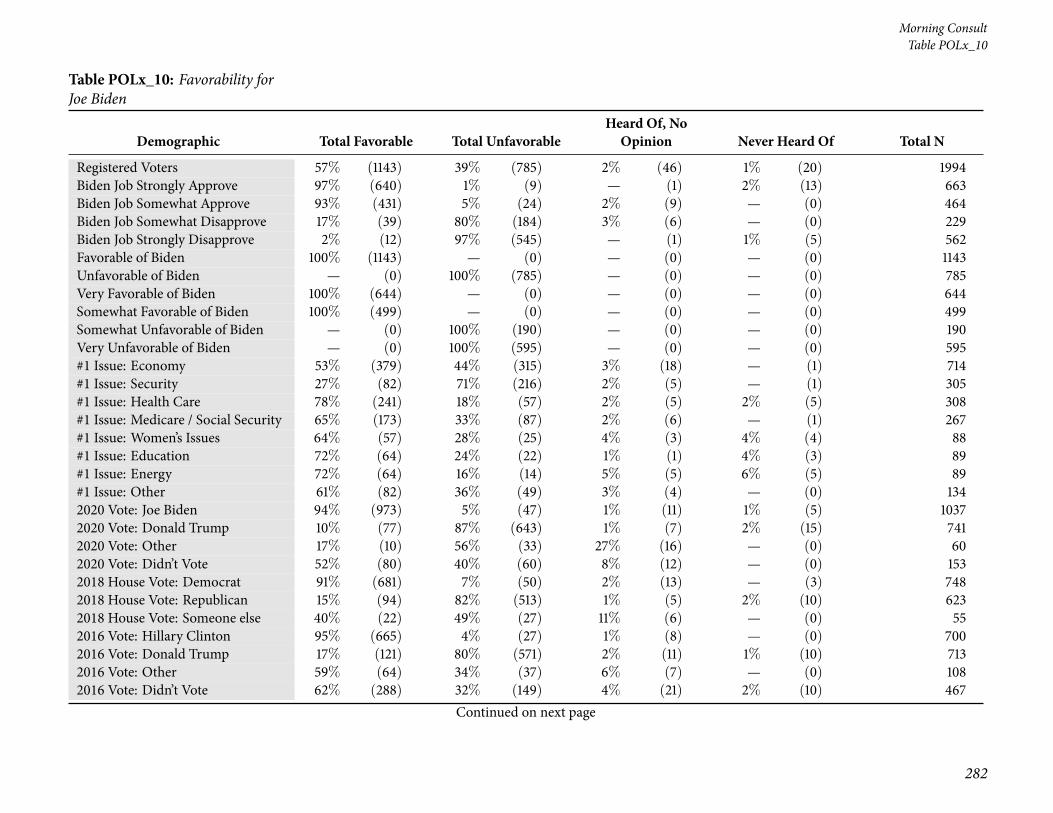
282
Morning ConsultTable POLx_10
Table POLx_10: Favorability forJoe Biden
Demographic Total Favorable Total UnfavorableHeard Of, NoOpinion Never Heard Of Total N
Registered Voters 57% (1143) 39% (785) 2% (46) 1% (20) 1994Biden Job Strongly Approve 97% (640) 1% (9) — (1) 2% (13) 663Biden Job Somewhat Approve 93% (431) 5% (24) 2% (9) — (0) 464Biden Job Somewhat Disapprove 17% (39) 80% (184) 3% (6) — (0) 229Biden Job Strongly Disapprove 2% (12) 97% (545) — (1) 1% (5) 562Favorable of Biden 100% (1143) — (0) — (0) — (0) 1143Unfavorable of Biden — (0) 100% (785) — (0) — (0) 785Very Favorable of Biden 100% (644) — (0) — (0) — (0) 644Somewhat Favorable of Biden 100% (499) — (0) — (0) — (0) 499Somewhat Unfavorable of Biden — (0) 100% (190) — (0) — (0) 190Very Unfavorable of Biden — (0) 100% (595) — (0) — (0) 595#1 Issue: Economy 53% (379) 44% (315) 3% (18) — (1) 714#1 Issue: Security 27% (82) 71% (216) 2% (5) — (1) 305#1 Issue: Health Care 78% (241) 18% (57) 2% (5) 2% (5) 308#1 Issue: Medicare / Social Security 65% (173) 33% (87) 2% (6) — (1) 267#1 Issue: Women’s Issues 64% (57) 28% (25) 4% (3) 4% (4) 88#1 Issue: Education 72% (64) 24% (22) 1% (1) 4% (3) 89#1 Issue: Energy 72% (64) 16% (14) 5% (5) 6% (5) 89#1 Issue: Other 61% (82) 36% (49) 3% (4) — (0) 1342020 Vote: Joe Biden 94% (973) 5% (47) 1% (11) 1% (5) 10372020 Vote: Donald Trump 10% (77) 87% (643) 1% (7) 2% (15) 7412020 Vote: Other 17% (10) 56% (33) 27% (16) — (0) 602020 Vote: Didn’t Vote 52% (80) 40% (60) 8% (12) — (0) 1532018 House Vote: Democrat 91% (681) 7% (50) 2% (13) — (3) 7482018 House Vote: Republican 15% (94) 82% (513) 1% (5) 2% (10) 6232018 House Vote: Someone else 40% (22) 49% (27) 11% (6) — (0) 552016 Vote: Hillary Clinton 95% (665) 4% (27) 1% (8) — (0) 7002016 Vote: Donald Trump 17% (121) 80% (571) 2% (11) 1% (10) 7132016 Vote: Other 59% (64) 34% (37) 6% (7) — (0) 1082016 Vote: Didn’t Vote 62% (288) 32% (149) 4% (21) 2% (10) 467
Continued on next page

National Tracking Poll #2103129, March, 2021
283
Table POLx_10
Table POLx_10: Favorability forJoe Biden
Demographic Total Favorable Total UnfavorableHeard Of, NoOpinion Never Heard Of Total N
Registered Voters 57% (1143) 39% (785) 2% (46) 1% (20) 1994Voted in 2014: Yes 56% (714) 42% (533) 1% (17) 1% (10) 1275Voted in 2014: No 60% (428) 35% (252) 4% (29) 1% (10) 7194-Region: Northeast 65% (230) 30% (108) 2% (9) 3% (9) 3564-Region: Midwest 54% (249) 45% (205) 1% (4) — (0) 4584-Region: South 54% (404) 43% (322) 2% (18) — (0) 7444-Region: West 60% (260) 34% (148) 4% (16) 3% (11) 436Party: Democrat/Leans Democrat 94% (914) 5% (46) 1% (7) 1% (5) 973Party: Republican/Leans Republican 15% (117) 81% (625) 2% (13) 2% (13) 768Note: Row proportions may total to larger than one-hundred percent due to rounding. For more information visit MorningConsultIntelligence.com.
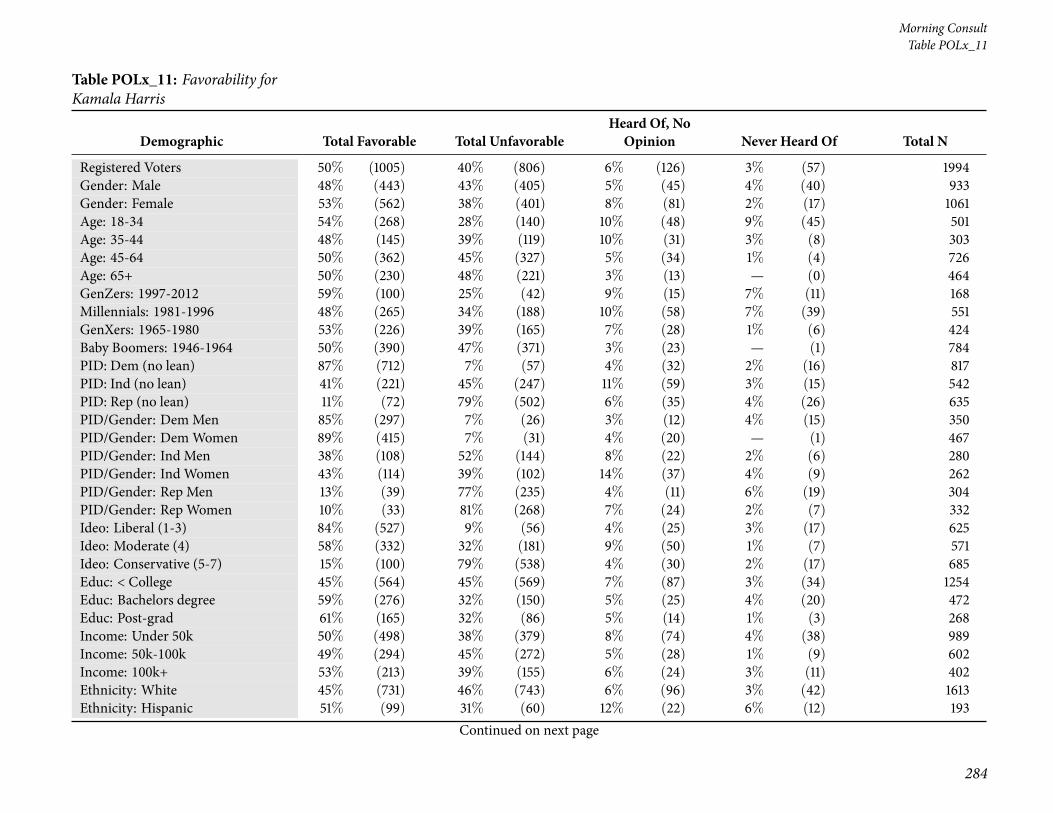
284
Morning ConsultTable POLx_11
Table POLx_11: Favorability forKamala Harris
Demographic Total Favorable Total UnfavorableHeard Of, NoOpinion Never Heard Of Total N
Registered Voters 50% (1005) 40% (806) 6% (126) 3% (57) 1994Gender: Male 48% (443) 43% (405) 5% (45) 4% (40) 933Gender: Female 53% (562) 38% (401) 8% (81) 2% (17) 1061Age: 18-34 54% (268) 28% (140) 10% (48) 9% (45) 501Age: 35-44 48% (145) 39% (119) 10% (31) 3% (8) 303Age: 45-64 50% (362) 45% (327) 5% (34) 1% (4) 726Age: 65+ 50% (230) 48% (221) 3% (13) — (0) 464GenZers: 1997-2012 59% (100) 25% (42) 9% (15) 7% (11) 168Millennials: 1981-1996 48% (265) 34% (188) 10% (58) 7% (39) 551GenXers: 1965-1980 53% (226) 39% (165) 7% (28) 1% (6) 424Baby Boomers: 1946-1964 50% (390) 47% (371) 3% (23) — (1) 784PID: Dem (no lean) 87% (712) 7% (57) 4% (32) 2% (16) 817PID: Ind (no lean) 41% (221) 45% (247) 11% (59) 3% (15) 542PID: Rep (no lean) 11% (72) 79% (502) 6% (35) 4% (26) 635PID/Gender: DemMen 85% (297) 7% (26) 3% (12) 4% (15) 350PID/Gender: DemWomen 89% (415) 7% (31) 4% (20) — (1) 467PID/Gender: Ind Men 38% (108) 52% (144) 8% (22) 2% (6) 280PID/Gender: Ind Women 43% (114) 39% (102) 14% (37) 4% (9) 262PID/Gender: Rep Men 13% (39) 77% (235) 4% (11) 6% (19) 304PID/Gender: Rep Women 10% (33) 81% (268) 7% (24) 2% (7) 332Ideo: Liberal (1-3) 84% (527) 9% (56) 4% (25) 3% (17) 625Ideo: Moderate (4) 58% (332) 32% (181) 9% (50) 1% (7) 571Ideo: Conservative (5-7) 15% (100) 79% (538) 4% (30) 2% (17) 685Educ: < College 45% (564) 45% (569) 7% (87) 3% (34) 1254Educ: Bachelors degree 59% (276) 32% (150) 5% (25) 4% (20) 472Educ: Post-grad 61% (165) 32% (86) 5% (14) 1% (3) 268Income: Under 50k 50% (498) 38% (379) 8% (74) 4% (38) 989Income: 50k-100k 49% (294) 45% (272) 5% (28) 1% (9) 602Income: 100k+ 53% (213) 39% (155) 6% (24) 3% (11) 402Ethnicity: White 45% (731) 46% (743) 6% (96) 3% (42) 1613Ethnicity: Hispanic 51% (99) 31% (60) 12% (22) 6% (12) 193
Continued on next page

National Tracking Poll #2103129, March, 2021
285
Table POLx_11
Table POLx_11: Favorability forKamala Harris
Demographic Total Favorable Total UnfavorableHeard Of, NoOpinion Never Heard Of Total N
Registered Voters 50% (1005) 40% (806) 6% (126) 3% (57) 1994Ethnicity: Black 82% (208) 10% (26) 4% (9) 4% (9) 253Ethnicity: Other 51% (65) 29% (37) 16% (21) 4% (6) 128All Christian 46% (479) 46% (480) 6% (60) 2% (16) 1036All Non-Christian 69% (80) 14% (16) 3% (4) 14% (16) 115Atheist 65% (57) 30% (27) 5% (4) — (0) 88Agnostic/Nothing in particular 55% (250) 32% (145) 9% (41) 3% (14) 450Something Else 46% (139) 45% (138) 6% (17) 3% (10) 305Religious Non-Protestant/Catholic 60% (84) 23% (33) 5% (8) 11% (16) 141Evangelical 39% (213) 54% (294) 5% (25) 3% (15) 547Non-Evangelical 53% (392) 41% (303) 5% (39) 1% (9) 742Community: Urban 63% (368) 25% (148) 5% (32) 7% (39) 586Community: Suburban 50% (466) 42% (387) 6% (58) 1% (12) 924Community: Rural 35% (170) 56% (272) 7% (36) 1% (6) 484Employ: Private Sector 51% (336) 39% (256) 8% (52) 3% (19) 663Employ: Government 59% (71) 27% (33) 9% (11) 5% (5) 120Employ: Self-Employed 49% (85) 42% (73) 3% (6) 6% (11) 176Employ: Homemaker 37% (43) 55% (64) 6% (7) 3% (3) 118Employ: Student 61% (55) 25% (23) 5% (5) 9% (8) 91Employ: Retired 51% (271) 46% (245) 3% (18) — (0) 534Employ: Unemployed 43% (78) 41% (74) 12% (21) 5% (8) 182Employ: Other 58% (65) 34% (38) 5% (6) 2% (2) 111Military HH: Yes 48% (161) 45% (151) 4% (13) 3% (8) 333Military HH: No 51% (844) 39% (655) 7% (113) 3% (49) 1661RD/WT: Right Direction 80% (810) 10% (105) 6% (64) 4% (38) 1017RD/WT: Wrong Track 20% (195) 72% (701) 6% (62) 2% (19) 977Biden Job Approve 84% (942) 8% (89) 6% (62) 3% (33) 1127Biden Job Disapprove 6% (47) 88% (694) 4% (30) 3% (20) 792
Continued on next page
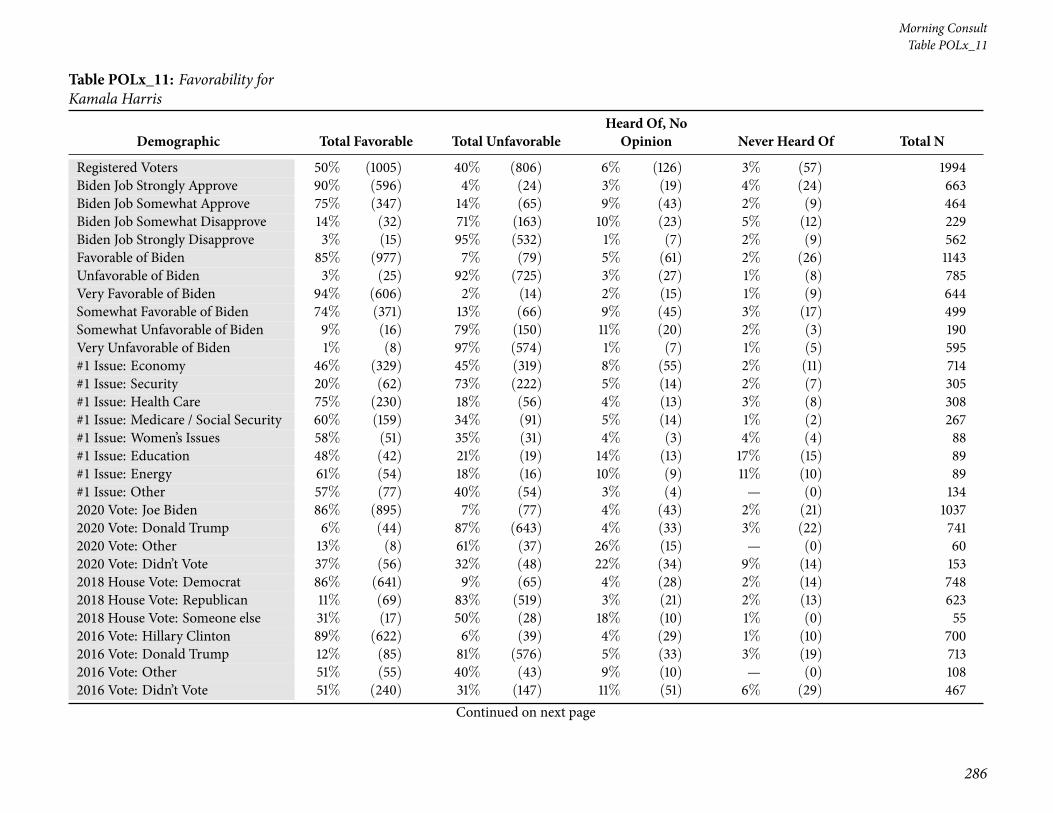
286
Morning ConsultTable POLx_11
Table POLx_11: Favorability forKamala Harris
Demographic Total Favorable Total UnfavorableHeard Of, NoOpinion Never Heard Of Total N
Registered Voters 50% (1005) 40% (806) 6% (126) 3% (57) 1994Biden Job Strongly Approve 90% (596) 4% (24) 3% (19) 4% (24) 663Biden Job Somewhat Approve 75% (347) 14% (65) 9% (43) 2% (9) 464Biden Job Somewhat Disapprove 14% (32) 71% (163) 10% (23) 5% (12) 229Biden Job Strongly Disapprove 3% (15) 95% (532) 1% (7) 2% (9) 562Favorable of Biden 85% (977) 7% (79) 5% (61) 2% (26) 1143Unfavorable of Biden 3% (25) 92% (725) 3% (27) 1% (8) 785Very Favorable of Biden 94% (606) 2% (14) 2% (15) 1% (9) 644Somewhat Favorable of Biden 74% (371) 13% (66) 9% (45) 3% (17) 499Somewhat Unfavorable of Biden 9% (16) 79% (150) 11% (20) 2% (3) 190Very Unfavorable of Biden 1% (8) 97% (574) 1% (7) 1% (5) 595#1 Issue: Economy 46% (329) 45% (319) 8% (55) 2% (11) 714#1 Issue: Security 20% (62) 73% (222) 5% (14) 2% (7) 305#1 Issue: Health Care 75% (230) 18% (56) 4% (13) 3% (8) 308#1 Issue: Medicare / Social Security 60% (159) 34% (91) 5% (14) 1% (2) 267#1 Issue: Women’s Issues 58% (51) 35% (31) 4% (3) 4% (4) 88#1 Issue: Education 48% (42) 21% (19) 14% (13) 17% (15) 89#1 Issue: Energy 61% (54) 18% (16) 10% (9) 11% (10) 89#1 Issue: Other 57% (77) 40% (54) 3% (4) — (0) 1342020 Vote: Joe Biden 86% (895) 7% (77) 4% (43) 2% (21) 10372020 Vote: Donald Trump 6% (44) 87% (643) 4% (33) 3% (22) 7412020 Vote: Other 13% (8) 61% (37) 26% (15) — (0) 602020 Vote: Didn’t Vote 37% (56) 32% (48) 22% (34) 9% (14) 1532018 House Vote: Democrat 86% (641) 9% (65) 4% (28) 2% (14) 7482018 House Vote: Republican 11% (69) 83% (519) 3% (21) 2% (13) 6232018 House Vote: Someone else 31% (17) 50% (28) 18% (10) 1% (0) 552016 Vote: Hillary Clinton 89% (622) 6% (39) 4% (29) 1% (10) 7002016 Vote: Donald Trump 12% (85) 81% (576) 5% (33) 3% (19) 7132016 Vote: Other 51% (55) 40% (43) 9% (10) — (0) 1082016 Vote: Didn’t Vote 51% (240) 31% (147) 11% (51) 6% (29) 467
Continued on next page

National Tracking Poll #2103129, March, 2021
287
Table POLx_11
Table POLx_11: Favorability forKamala Harris
Demographic Total Favorable Total UnfavorableHeard Of, NoOpinion Never Heard Of Total N
Registered Voters 50% (1005) 40% (806) 6% (126) 3% (57) 1994Voted in 2014: Yes 51% (644) 43% (552) 4% (55) 2% (24) 1275Voted in 2014: No 50% (360) 35% (254) 10% (71) 5% (33) 7194-Region: Northeast 56% (199) 33% (118) 5% (19) 6% (20) 3564-Region: Midwest 46% (209) 47% (214) 6% (29) 1% (6) 4584-Region: South 50% (372) 42% (314) 6% (43) 2% (16) 7444-Region: West 52% (225) 37% (161) 8% (34) 4% (16) 436Party: Democrat/Leans Democrat 87% (846) 7% (70) 4% (38) 2% (19) 973Party: Republican/Leans Republican 11% (81) 80% (611) 6% (50) 3% (26) 768Note: Row proportions may total to larger than one-hundred percent due to rounding. For more information visit MorningConsultIntelligence.com.

288
Morning ConsultTable POLx_12
Table POLx_12: Favorability forVladamir Putin
Demographic Total Favorable Total UnfavorableHeard Of, NoOpinion Never Heard Of Total N
Registered Voters 9% (180) 69% (1385) 15% (298) 7% (131) 1994Gender: Male 14% (128) 72% (667) 10% (94) 5% (43) 933Gender: Female 5% (52) 68% (717) 19% (204) 8% (88) 1061Age: 18-34 10% (50) 54% (272) 21% (103) 15% (76) 501Age: 35-44 13% (39) 62% (188) 21% (63) 5% (14) 303Age: 45-64 10% (70) 73% (532) 12% (89) 5% (35) 726Age: 65+ 5% (22) 85% (393) 9% (43) 1% (6) 464GenZers: 1997-2012 3% (6) 58% (97) 19% (32) 20% (34) 168Millennials: 1981-1996 13% (73) 55% (305) 22% (120) 10% (53) 551GenXers: 1965-1980 13% (54) 66% (280) 14% (61) 7% (30) 424Baby Boomers: 1946-1964 6% (43) 82% (646) 10% (82) 2% (14) 784PID: Dem (no lean) 7% (54) 75% (615) 11% (92) 7% (56) 817PID: Ind (no lean) 9% (46) 70% (379) 15% (81) 6% (35) 542PID: Rep (no lean) 13% (80) 62% (391) 20% (125) 6% (40) 635PID/Gender: DemMen 12% (43) 74% (260) 8% (28) 5% (19) 350PID/Gender: DemWomen 2% (11) 76% (355) 14% (63) 8% (38) 467PID/Gender: Ind Men 10% (29) 78% (218) 9% (25) 2% (7) 280PID/Gender: Ind Women 7% (17) 61% (161) 21% (56) 11% (28) 262PID/Gender: Rep Men 19% (56) 62% (189) 13% (40) 6% (18) 304PID/Gender: Rep Women 7% (23) 61% (201) 26% (85) 7% (22) 332Ideo: Liberal (1-3) 7% (47) 80% (498) 7% (46) 6% (35) 625Ideo: Moderate (4) 9% (53) 66% (378) 18% (105) 6% (35) 571Ideo: Conservative (5-7) 11% (77) 69% (474) 16% (107) 4% (28) 685Educ: < College 7% (94) 67% (838) 18% (224) 8% (98) 1254Educ: Bachelors degree 10% (49) 74% (349) 10% (48) 6% (26) 472Educ: Post-grad 14% (38) 73% (197) 10% (27) 2% (7) 268Income: Under 50k 7% (74) 66% (649) 17% (173) 9% (93) 989Income: 50k-100k 10% (59) 75% (451) 11% (68) 4% (24) 602Income: 100k+ 12% (48) 71% (284) 14% (57) 3% (13) 402Ethnicity: White 9% (152) 71% (1149) 14% (229) 5% (83) 1613Ethnicity: Hispanic 12% (23) 67% (129) 12% (23) 10% (19) 193
Continued on next page
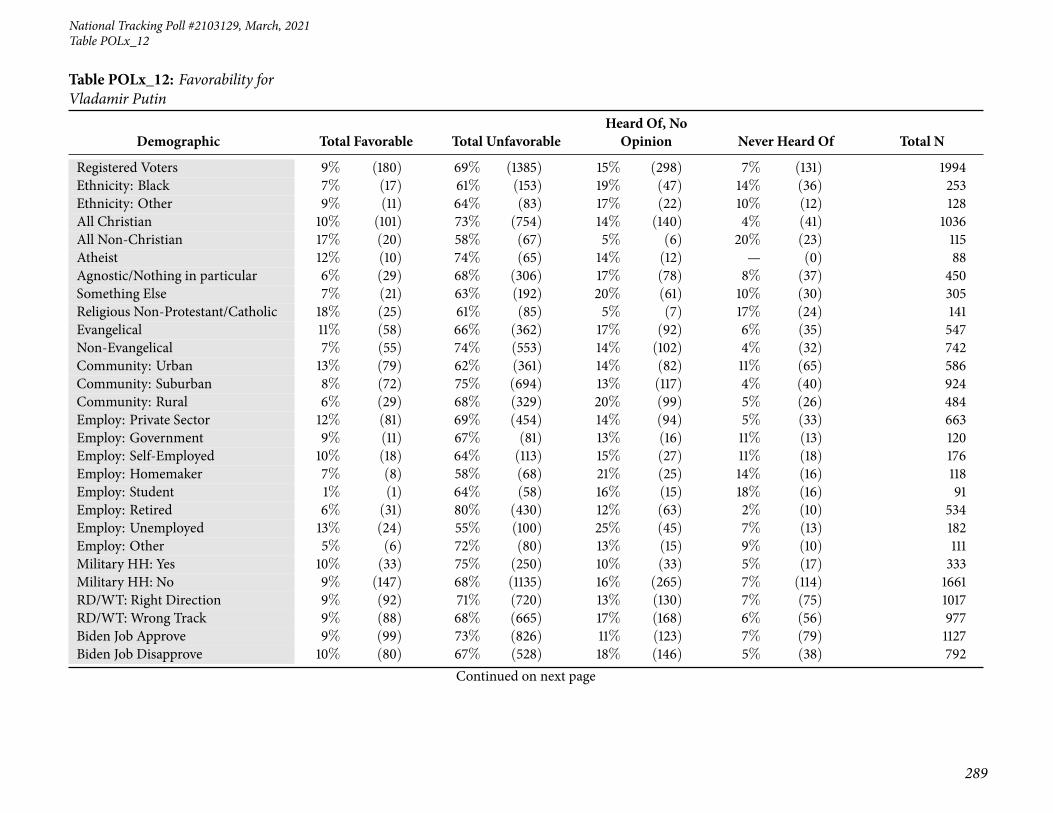
National Tracking Poll #2103129, March, 2021
289
Table POLx_12
Table POLx_12: Favorability forVladamir Putin
Demographic Total Favorable Total UnfavorableHeard Of, NoOpinion Never Heard Of Total N
Registered Voters 9% (180) 69% (1385) 15% (298) 7% (131) 1994Ethnicity: Black 7% (17) 61% (153) 19% (47) 14% (36) 253Ethnicity: Other 9% (11) 64% (83) 17% (22) 10% (12) 128All Christian 10% (101) 73% (754) 14% (140) 4% (41) 1036All Non-Christian 17% (20) 58% (67) 5% (6) 20% (23) 115Atheist 12% (10) 74% (65) 14% (12) — (0) 88Agnostic/Nothing in particular 6% (29) 68% (306) 17% (78) 8% (37) 450Something Else 7% (21) 63% (192) 20% (61) 10% (30) 305Religious Non-Protestant/Catholic 18% (25) 61% (85) 5% (7) 17% (24) 141Evangelical 11% (58) 66% (362) 17% (92) 6% (35) 547Non-Evangelical 7% (55) 74% (553) 14% (102) 4% (32) 742Community: Urban 13% (79) 62% (361) 14% (82) 11% (65) 586Community: Suburban 8% (72) 75% (694) 13% (117) 4% (40) 924Community: Rural 6% (29) 68% (329) 20% (99) 5% (26) 484Employ: Private Sector 12% (81) 69% (454) 14% (94) 5% (33) 663Employ: Government 9% (11) 67% (81) 13% (16) 11% (13) 120Employ: Self-Employed 10% (18) 64% (113) 15% (27) 11% (18) 176Employ: Homemaker 7% (8) 58% (68) 21% (25) 14% (16) 118Employ: Student 1% (1) 64% (58) 16% (15) 18% (16) 91Employ: Retired 6% (31) 80% (430) 12% (63) 2% (10) 534Employ: Unemployed 13% (24) 55% (100) 25% (45) 7% (13) 182Employ: Other 5% (6) 72% (80) 13% (15) 9% (10) 111Military HH: Yes 10% (33) 75% (250) 10% (33) 5% (17) 333Military HH: No 9% (147) 68% (1135) 16% (265) 7% (114) 1661RD/WT: Right Direction 9% (92) 71% (720) 13% (130) 7% (75) 1017RD/WT: Wrong Track 9% (88) 68% (665) 17% (168) 6% (56) 977Biden Job Approve 9% (99) 73% (826) 11% (123) 7% (79) 1127Biden Job Disapprove 10% (80) 67% (528) 18% (146) 5% (38) 792
Continued on next page

290
Morning ConsultTable POLx_12
Table POLx_12: Favorability forVladamir Putin
Demographic Total Favorable Total UnfavorableHeard Of, NoOpinion Never Heard Of Total N
Registered Voters 9% (180) 69% (1385) 15% (298) 7% (131) 1994Biden Job Strongly Approve 9% (58) 74% (489) 9% (61) 8% (55) 663Biden Job Somewhat Approve 9% (41) 73% (337) 13% (62) 5% (24) 464Biden Job Somewhat Disapprove 10% (22) 60% (137) 21% (47) 10% (23) 229Biden Job Strongly Disapprove 10% (58) 69% (390) 18% (99) 3% (15) 562Favorable of Biden 9% (98) 74% (848) 11% (123) 6% (74) 1143Unfavorable of Biden 10% (80) 66% (521) 20% (156) 4% (28) 785Very Favorable of Biden 8% (55) 75% (483) 9% (60) 7% (46) 644Somewhat Favorable of Biden 9% (43) 73% (364) 13% (63) 6% (28) 499Somewhat Unfavorable of Biden 11% (22) 57% (108) 23% (44) 9% (17) 190Very Unfavorable of Biden 10% (58) 70% (414) 19% (112) 2% (11) 595#1 Issue: Economy 12% (84) 67% (475) 16% (114) 6% (41) 714#1 Issue: Security 13% (40) 64% (196) 20% (60) 3% (9) 305#1 Issue: Health Care 8% (24) 72% (222) 11% (35) 9% (27) 308#1 Issue: Medicare / Social Security 5% (13) 78% (209) 14% (36) 3% (9) 267#1 Issue: Women’s Issues 5% (4) 68% (60) 14% (12) 13% (11) 88#1 Issue: Education 2% (2) 58% (52) 23% (21) 17% (15) 89#1 Issue: Energy 9% (8) 71% (63) 6% (6) 14% (12) 89#1 Issue: Other 5% (6) 80% (107) 11% (14) 5% (7) 1342020 Vote: Joe Biden 7% (73) 76% (789) 11% (111) 6% (63) 10372020 Vote: Donald Trump 11% (82) 65% (482) 19% (141) 5% (36) 7412020 Vote: Other 7% (4) 63% (38) 24% (15) 6% (3) 602020 Vote: Didn’t Vote 14% (21) 48% (73) 20% (30) 19% (29) 1532018 House Vote: Democrat 8% (57) 80% (602) 8% (59) 4% (30) 7482018 House Vote: Republican 12% (75) 67% (418) 17% (109) 3% (21) 6232018 House Vote: Someone else 6% (3) 68% (37) 14% (8) 12% (6) 552016 Vote: Hillary Clinton 7% (48) 80% (559) 11% (74) 3% (20) 7002016 Vote: Donald Trump 12% (89) 67% (478) 17% (120) 4% (27) 7132016 Vote: Other 6% (7) 80% (87) 9% (10) 5% (5) 1082016 Vote: Didn’t Vote 7% (34) 55% (258) 20% (95) 17% (80) 467
Continued on next page

National Tracking Poll #2103129, March, 2021
291
Table POLx_12
Table POLx_12: Favorability forVladamir Putin
Demographic Total Favorable Total UnfavorableHeard Of, NoOpinion Never Heard Of Total N
Registered Voters 9% (180) 69% (1385) 15% (298) 7% (131) 1994Voted in 2014: Yes 9% (114) 75% (962) 12% (156) 3% (44) 1275Voted in 2014: No 9% (67) 59% (423) 20% (142) 12% (87) 7194-Region: Northeast 10% (37) 65% (231) 18% (63) 7% (25) 3564-Region: Midwest 7% (32) 72% (329) 18% (82) 3% (15) 4584-Region: South 7% (53) 70% (517) 15% (112) 8% (62) 7444-Region: West 13% (59) 71% (308) 9% (41) 6% (28) 436Party: Democrat/Leans Democrat 7% (66) 76% (741) 10% (102) 7% (64) 973Party: Republican/Leans Republican 12% (96) 63% (482) 20% (151) 5% (40) 768Note: Row proportions may total to larger than one-hundred percent due to rounding. For more information visit MorningConsultIntelligence.com.

292
Morning ConsultTable POLx_13
Table POLx_13: Favorability forXi Jinping
Demographic Total Favorable Total UnfavorableHeard Of, NoOpinion Never Heard Of Total N
Registered Voters 5% (101) 38% (752) 17% (340) 40% (802) 1994Gender: Male 8% (76) 48% (445) 15% (138) 29% (273) 933Gender: Female 2% (24) 29% (306) 19% (202) 50% (529) 1061Age: 18-34 7% (35) 26% (131) 20% (102) 47% (233) 501Age: 35-44 11% (34) 31% (94) 19% (58) 39% (117) 303Age: 45-64 3% (25) 40% (292) 16% (117) 40% (292) 726Age: 65+ 1% (7) 51% (235) 14% (63) 34% (160) 464GenZers: 1997-2012 1% (2) 19% (32) 24% (40) 56% (94) 168Millennials: 1981-1996 11% (62) 30% (166) 18% (102) 40% (221) 551GenXers: 1965-1980 5% (21) 35% (150) 18% (77) 41% (176) 424Baby Boomers: 1946-1964 2% (15) 46% (362) 14% (111) 38% (297) 784PID: Dem (no lean) 7% (54) 36% (295) 19% (154) 38% (314) 817PID: Ind (no lean) 4% (22) 40% (217) 16% (89) 39% (214) 542PID: Rep (no lean) 4% (25) 38% (240) 15% (96) 43% (274) 635PID/Gender: DemMen 10% (36) 45% (159) 19% (65) 26% (90) 350PID/Gender: DemWomen 4% (18) 29% (136) 19% (89) 48% (224) 467PID/Gender: Ind Men 7% (19) 52% (145) 14% (39) 27% (77) 280PID/Gender: Ind Women 1% (3) 27% (72) 19% (50) 52% (137) 262PID/Gender: Rep Men 7% (22) 47% (142) 11% (34) 35% (106) 304PID/Gender: Rep Women 1% (3) 30% (99) 19% (63) 50% (167) 332Ideo: Liberal (1-3) 7% (41) 41% (255) 18% (111) 35% (218) 625Ideo: Moderate (4) 6% (36) 33% (186) 18% (105) 43% (243) 571Ideo: Conservative (5-7) 3% (22) 44% (302) 13% (88) 40% (274) 685Educ: < College 2% (29) 33% (414) 19% (235) 46% (575) 1254Educ: Bachelors degree 8% (36) 44% (206) 15% (70) 34% (160) 472Educ: Post-grad 13% (35) 49% (132) 13% (35) 25% (66) 268Income: Under 50k 2% (24) 32% (314) 18% (177) 48% (475) 989Income: 50k-100k 6% (37) 44% (263) 17% (100) 34% (203) 602Income: 100k+ 10% (40) 43% (175) 16% (64) 31% (124) 402Ethnicity: White 5% (81) 40% (638) 15% (245) 40% (649) 1613Ethnicity: Hispanic 6% (12) 37% (71) 17% (32) 41% (78) 193
Continued on next page

National Tracking Poll #2103129, March, 2021
293
Table POLx_13
Table POLx_13: Favorability forXi Jinping
Demographic Total Favorable Total UnfavorableHeard Of, NoOpinion Never Heard Of Total N
Registered Voters 5% (101) 38% (752) 17% (340) 40% (802) 1994Ethnicity: Black 4% (11) 26% (67) 28% (71) 41% (104) 253Ethnicity: Other 7% (9) 36% (46) 19% (25) 38% (48) 128All Christian 5% (56) 41% (429) 15% (160) 38% (391) 1036All Non-Christian 16% (18) 41% (48) 9% (10) 34% (40) 115Atheist 4% (4) 49% (43) 15% (13) 31% (27) 88Agnostic/Nothing in particular 3% (14) 35% (156) 21% (94) 41% (186) 450Something Else 3% (9) 25% (76) 20% (62) 52% (157) 305Religious Non-Protestant/Catholic 13% (19) 39% (54) 11% (15) 38% (53) 141Evangelical 7% (41) 35% (193) 18% (98) 39% (216) 547Non-Evangelical 3% (20) 40% (295) 16% (117) 42% (311) 742Community: Urban 10% (60) 31% (180) 19% (113) 40% (233) 586Community: Suburban 3% (29) 42% (389) 15% (143) 39% (363) 924Community: Rural 2% (11) 38% (183) 17% (84) 42% (205) 484Employ: Private Sector 8% (55) 39% (259) 18% (116) 35% (231) 663Employ: Government 9% (10) 29% (35) 15% (19) 47% (57) 120Employ: Self-Employed 7% (13) 41% (72) 12% (21) 40% (70) 176Employ: Homemaker 2% (2) 28% (32) 11% (13) 60% (70) 118Employ: Student 1% (1) 25% (23) 33% (30) 41% (37) 91Employ: Retired 2% (10) 48% (255) 15% (79) 36% (191) 534Employ: Unemployed 4% (7) 25% (45) 21% (38) 50% (91) 182Employ: Other 3% (3) 27% (30) 21% (23) 49% (55) 111Military HH: Yes 5% (18) 42% (140) 18% (59) 35% (115) 333Military HH: No 5% (82) 37% (611) 17% (281) 41% (686) 1661RD/WT: Right Direction 8% (85) 34% (342) 19% (191) 39% (398) 1017RD/WT: Wrong Track 2% (15) 42% (409) 15% (149) 41% (404) 977Biden Job Approve 8% (87) 35% (394) 18% (208) 39% (438) 1127Biden Job Disapprove 1% (10) 44% (345) 16% (124) 40% (313) 792
Continued on next page
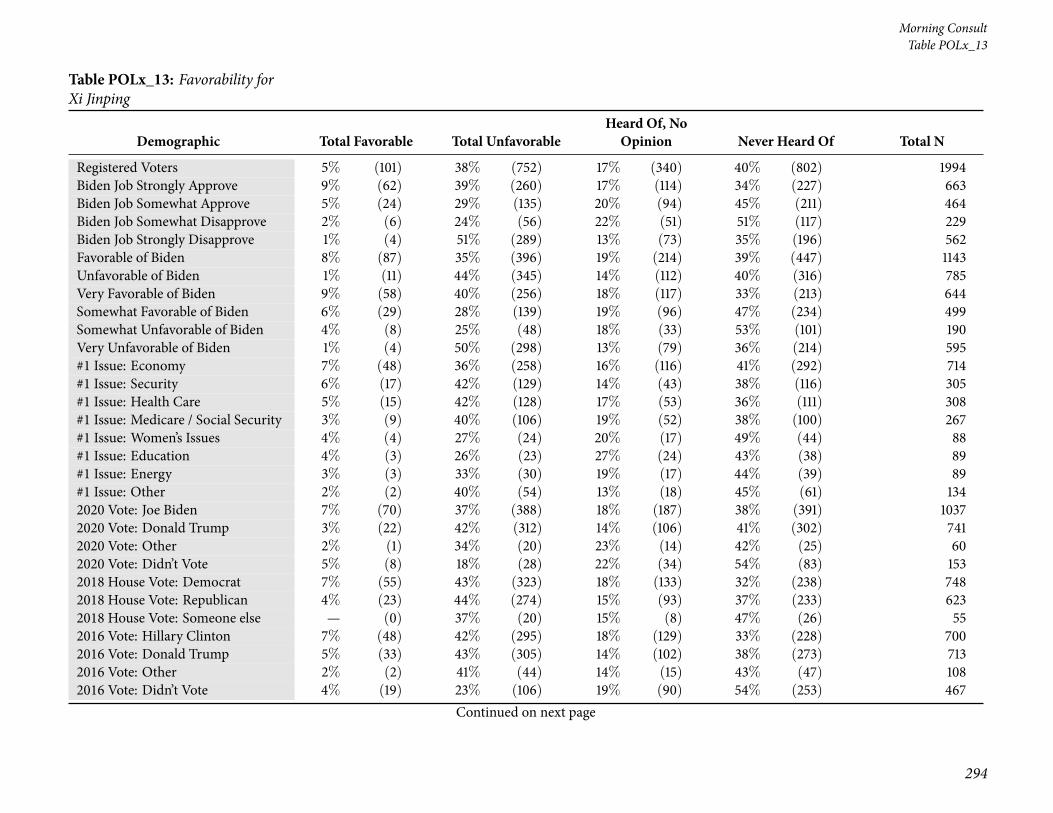
294
Morning ConsultTable POLx_13
Table POLx_13: Favorability forXi Jinping
Demographic Total Favorable Total UnfavorableHeard Of, NoOpinion Never Heard Of Total N
Registered Voters 5% (101) 38% (752) 17% (340) 40% (802) 1994Biden Job Strongly Approve 9% (62) 39% (260) 17% (114) 34% (227) 663Biden Job Somewhat Approve 5% (24) 29% (135) 20% (94) 45% (211) 464Biden Job Somewhat Disapprove 2% (6) 24% (56) 22% (51) 51% (117) 229Biden Job Strongly Disapprove 1% (4) 51% (289) 13% (73) 35% (196) 562Favorable of Biden 8% (87) 35% (396) 19% (214) 39% (447) 1143Unfavorable of Biden 1% (11) 44% (345) 14% (112) 40% (316) 785Very Favorable of Biden 9% (58) 40% (256) 18% (117) 33% (213) 644Somewhat Favorable of Biden 6% (29) 28% (139) 19% (96) 47% (234) 499Somewhat Unfavorable of Biden 4% (8) 25% (48) 18% (33) 53% (101) 190Very Unfavorable of Biden 1% (4) 50% (298) 13% (79) 36% (214) 595#1 Issue: Economy 7% (48) 36% (258) 16% (116) 41% (292) 714#1 Issue: Security 6% (17) 42% (129) 14% (43) 38% (116) 305#1 Issue: Health Care 5% (15) 42% (128) 17% (53) 36% (111) 308#1 Issue: Medicare / Social Security 3% (9) 40% (106) 19% (52) 38% (100) 267#1 Issue: Women’s Issues 4% (4) 27% (24) 20% (17) 49% (44) 88#1 Issue: Education 4% (3) 26% (23) 27% (24) 43% (38) 89#1 Issue: Energy 3% (3) 33% (30) 19% (17) 44% (39) 89#1 Issue: Other 2% (2) 40% (54) 13% (18) 45% (61) 1342020 Vote: Joe Biden 7% (70) 37% (388) 18% (187) 38% (391) 10372020 Vote: Donald Trump 3% (22) 42% (312) 14% (106) 41% (302) 7412020 Vote: Other 2% (1) 34% (20) 23% (14) 42% (25) 602020 Vote: Didn’t Vote 5% (8) 18% (28) 22% (34) 54% (83) 1532018 House Vote: Democrat 7% (55) 43% (323) 18% (133) 32% (238) 7482018 House Vote: Republican 4% (23) 44% (274) 15% (93) 37% (233) 6232018 House Vote: Someone else — (0) 37% (20) 15% (8) 47% (26) 552016 Vote: Hillary Clinton 7% (48) 42% (295) 18% (129) 33% (228) 7002016 Vote: Donald Trump 5% (33) 43% (305) 14% (102) 38% (273) 7132016 Vote: Other 2% (2) 41% (44) 14% (15) 43% (47) 1082016 Vote: Didn’t Vote 4% (19) 23% (106) 19% (90) 54% (253) 467
Continued on next page

National Tracking Poll #2103129, March, 2021
295
Table POLx_13
Table POLx_13: Favorability forXi Jinping
Demographic Total Favorable Total UnfavorableHeard Of, NoOpinion Never Heard Of Total N
Registered Voters 5% (101) 38% (752) 17% (340) 40% (802) 1994Voted in 2014: Yes 5% (68) 44% (560) 16% (206) 35% (441) 1275Voted in 2014: No 5% (33) 27% (192) 19% (134) 50% (361) 7194-Region: Northeast 9% (31) 35% (123) 18% (65) 38% (136) 3564-Region: Midwest 3% (12) 41% (188) 13% (58) 43% (199) 4584-Region: South 4% (29) 35% (262) 19% (143) 42% (310) 7444-Region: West 6% (28) 41% (178) 17% (73) 36% (156) 436Party: Democrat/Leans Democrat 7% (68) 37% (360) 18% (176) 38% (370) 973Party: Republican/Leans Republican 4% (28) 40% (305) 14% (109) 43% (327) 768Note: Row proportions may total to larger than one-hundred percent due to rounding. For more information visit MorningConsultIntelligence.com.
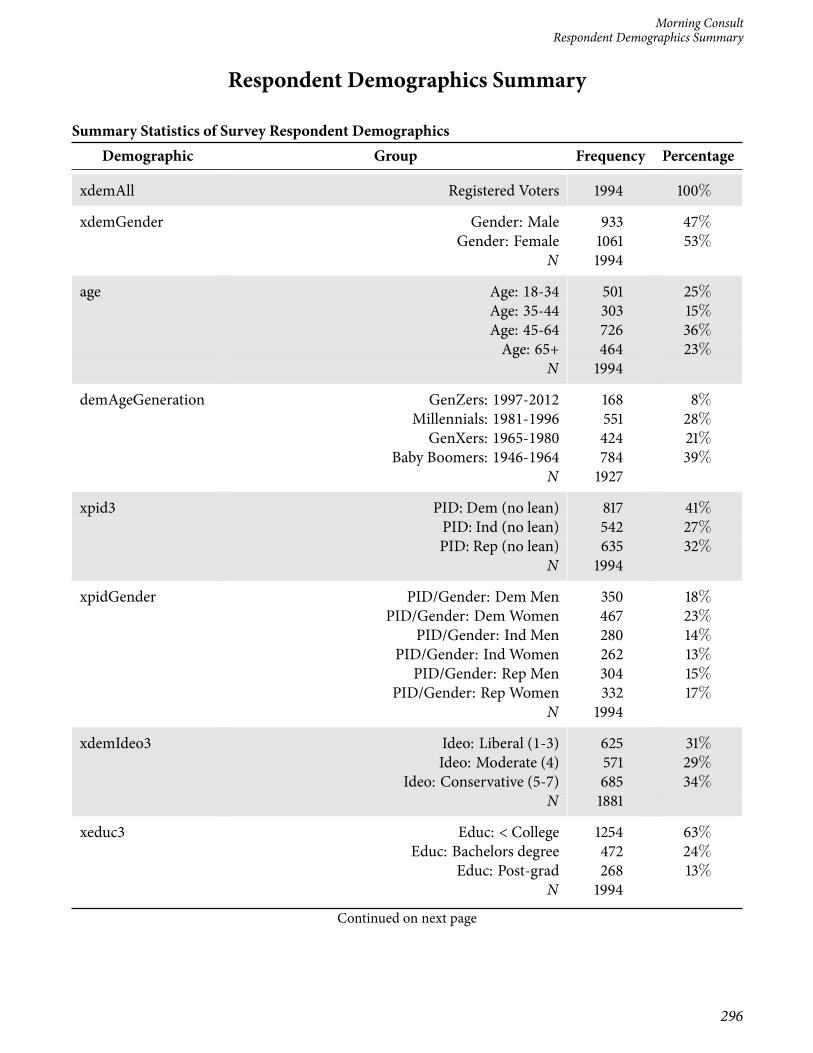
Morning ConsultRespondent Demographics Summary
Respondent Demographics Summary
Summary Statistics of Survey Respondent DemographicsDemographic Group Frequency Percentage
xdemAll Registered Voters 1994 100%
xdemGender Gender: Male 933 47%Gender: Female 1061 53%
N 1994
age Age: 18-34 501 25%Age: 35-44 303 15%Age: 45-64 726 36%Age: 65+ 464 23%
N 1994
demAgeGeneration GenZers: 1997-2012 168 8%Millennials: 1981-1996 551 28%GenXers: 1965-1980 424 21%
Baby Boomers: 1946-1964 784 39%N 1927
xpid3 PID: Dem (no lean) 817 41%PID: Ind (no lean) 542 27%PID: Rep (no lean) 635 32%
N 1994
xpidGender PID/Gender: DemMen 350 18%PID/Gender: DemWomen 467 23%
PID/Gender: Ind Men 280 14%PID/Gender: Ind Women 262 13%
PID/Gender: Rep Men 304 15%PID/Gender: Rep Women 332 17%
N 1994
xdemIdeo3 Ideo: Liberal (1-3) 625 31%Ideo: Moderate (4) 571 29%
Ideo: Conservative (5-7) 685 34%N 1881
xeduc3 Educ: < College 1254 63%Educ: Bachelors degree 472 24%
Educ: Post-grad 268 13%N 1994
Continued on next page
296
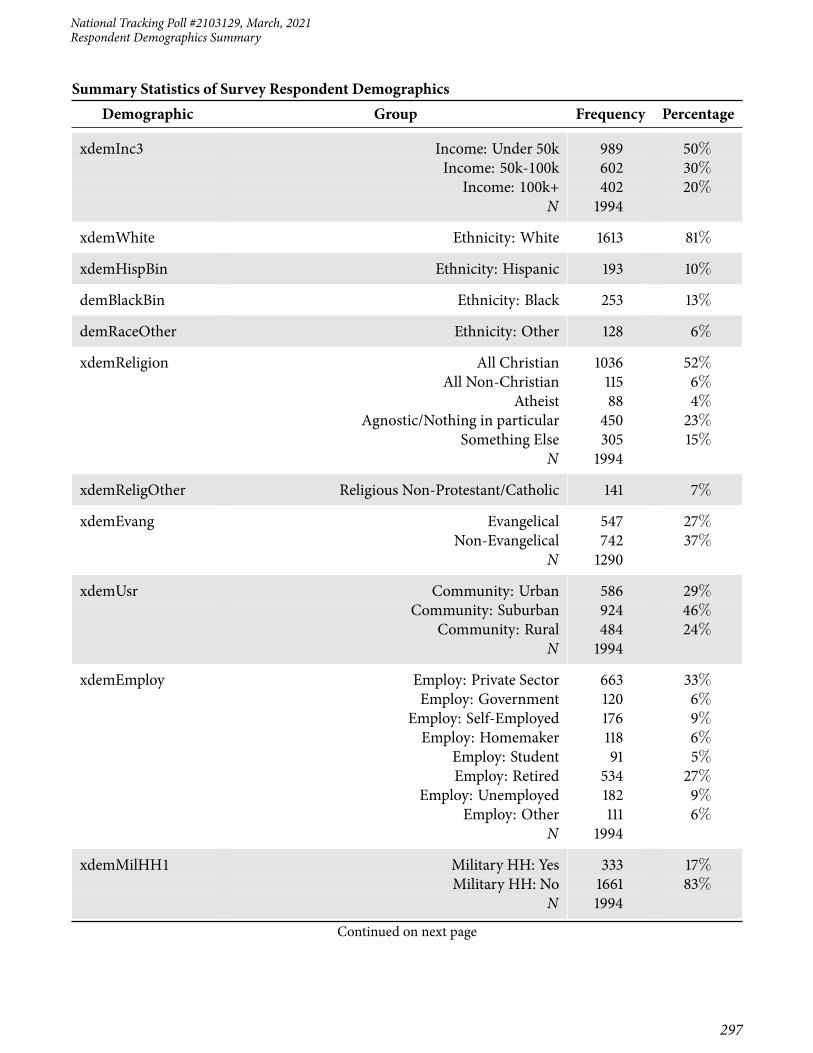
National Tracking Poll #2103129, March, 2021Respondent Demographics Summary
Summary Statistics of Survey Respondent DemographicsDemographic Group Frequency Percentage
xdemInc3 Income: Under 50k 989 50%Income: 50k-100k 602 30%
Income: 100k+ 402 20%N 1994
xdemWhite Ethnicity: White 1613 81%
xdemHispBin Ethnicity: Hispanic 193 10%
demBlackBin Ethnicity: Black 253 13%
demRaceOther Ethnicity: Other 128 6%
xdemReligion All Christian 1036 52%All Non-Christian 115 6%
Atheist 88 4%Agnostic/Nothing in particular 450 23%
Something Else 305 15%N 1994
xdemReligOther Religious Non-Protestant/Catholic 141 7%
xdemEvang Evangelical 547 27%Non-Evangelical 742 37%
N 1290
xdemUsr Community: Urban 586 29%Community: Suburban 924 46%
Community: Rural 484 24%N 1994
xdemEmploy Employ: Private Sector 663 33%Employ: Government 120 6%
Employ: Self-Employed 176 9%Employ: Homemaker 118 6%
Employ: Student 91 5%Employ: Retired 534 27%
Employ: Unemployed 182 9%Employ: Other 111 6%
N 1994
xdemMilHH1 Military HH: Yes 333 17%Military HH: No 1661 83%
N 1994
Continued on next page
297

Morning ConsultRespondent Demographics Summary
Summary Statistics of Survey Respondent DemographicsDemographic Group Frequency Percentage
xnr1 RD/WT: Right Direction 1017 51%RD/WT: Wrong Track 977 49%
N 1994
xdemBidenApprove Biden Job Approve 1127 57%Biden Job Disapprove 792 40%
N 1918
xdemBidenApprove2 Biden Job Strongly Approve 663 33%Biden Job Somewhat Approve 464 23%
Biden Job Somewhat Disapprove 229 12%Biden Job Strongly Disapprove 562 28%
N 1918
xdemBidenFav Favorable of Biden 1143 57%Unfavorable of Biden 785 39%
N 1927
xdemBidenFavFull Very Favorable of Biden 644 32%Somewhat Favorable of Biden 499 25%
Somewhat Unfavorable of Biden 190 10%Very Unfavorable of Biden 595 30%
N 1927
xnr3 #1 Issue: Economy 714 36%#1 Issue: Security 305 15%
#1 Issue: Health Care 308 15%#1 Issue: Medicare / Social Security 267 13%
#1 Issue: Women’s Issues 88 4%#1 Issue: Education 89 4%
#1 Issue: Energy 89 4%#1 Issue: Other 134 7%
N 1994
xsubVote20O 2020 Vote: Joe Biden 1037 52%2020 Vote: Donald Trump 741 37%
2020 Vote: Other 60 3%2020 Vote: Didn’t Vote 153 8%
N 1991
xsubVote18O 2018 House Vote: Democrat 748 38%2018 House Vote: Republican 623 31%
2018 House Vote: Someone else 55 3%N 1425
Continued on next page
298

National Tracking Poll #2103129, March, 2021Respondent Demographics Summary
Summary Statistics of Survey Respondent DemographicsDemographic Group Frequency Percentage
xsubVote16O 2016 Vote: Hillary Clinton 700 35%2016 Vote: Donald Trump 713 36%
2016 Vote: Other 108 5%2016 Vote: Didn’t Vote 467 23%
N 1988
xsubVote14O Voted in 2014: Yes 1275 64%Voted in 2014: No 719 36%
N 1994
xreg4 4-Region: Northeast 356 18%4-Region: Midwest 458 23%
4-Region: South 744 37%4-Region: West 436 22%
N 1994
xdemPidLean Party: Democrat/Leans Democrat 973 49%Party: Republican/Leans Republican 768 39%
N 1741
Note: Group proportions may total to larger than one-hundred percent due to rounding. All statistics are calcu-lated with demographic post-stratification weights applied.
299

300 Morning Consult
