Typhoid and Paratyphoid Fevers NSW Control Guidelines for ...
November 2016 CS 272391-A
National Typhoid and Paratyphoid Fever Surveillance Annual Summary, 2014
An overview of the National Typhoid and Paratyphoid Fever Surveillance (NTPFS) system is available at http://www.cdc.gov/ncezid/dfwed/PDFs/typhi_surveillance_overview_508c.pdf
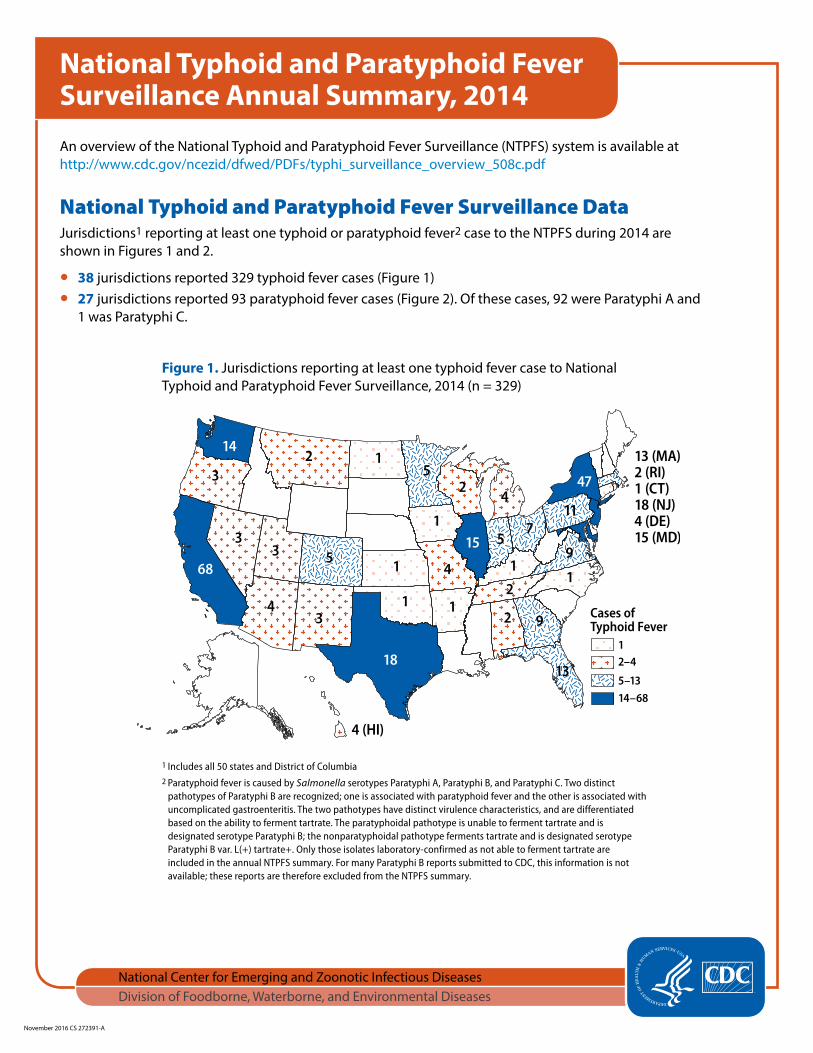
National Typhoid and Paratyphoid Fever Surveillance DataJurisdictions1 reporting at least one typhoid or paratyphoid fever2 case to the NTPFS during 2014 are shown in Figures 1 and 2.
● 38 jurisdictions reported 329 typhoid fever cases (Figure 1) ● 27 jurisdictions reported 93 paratyphoid fever cases (Figure 2). Of these cases, 92 were Paratyphi A and
1 was Paratyphi C.
Figure 1. Jurisdictions reporting at least one typhoid fever case to National Typhoid and Paratyphoid Fever Surveillance, 2014 (n = 329)
1 Includes all 50 states and District of Columbia2 Paratyphoid fever is caused by Salmonella serotypes Paratyphi A, Paratyphi B, and Paratyphi C. Two distinct
pathotypes of Paratyphi B are recognized; one is associated with paratyphoid fever and the other is associated with uncomplicated gastroenteritis. The two pathotypes have distinct virulence characteristics, and are differentiated based on the ability to ferment tartrate. The paratyphoidal pathotype is unable to ferment tartrate and is designated serotype Paratyphi B; the nonparatyphoidal pathotype ferments tartrate and is designated serotype Paratyphi B var. L(+) tartrate+. Only those isolates laboratory-confirmed as not able to ferment tartrate are included in the annual NTPFS summary. For many Paratyphi B reports submitted to CDC, this information is not available; these reports are therefore excluded from the NTPFS summary.
Page 2 of 8
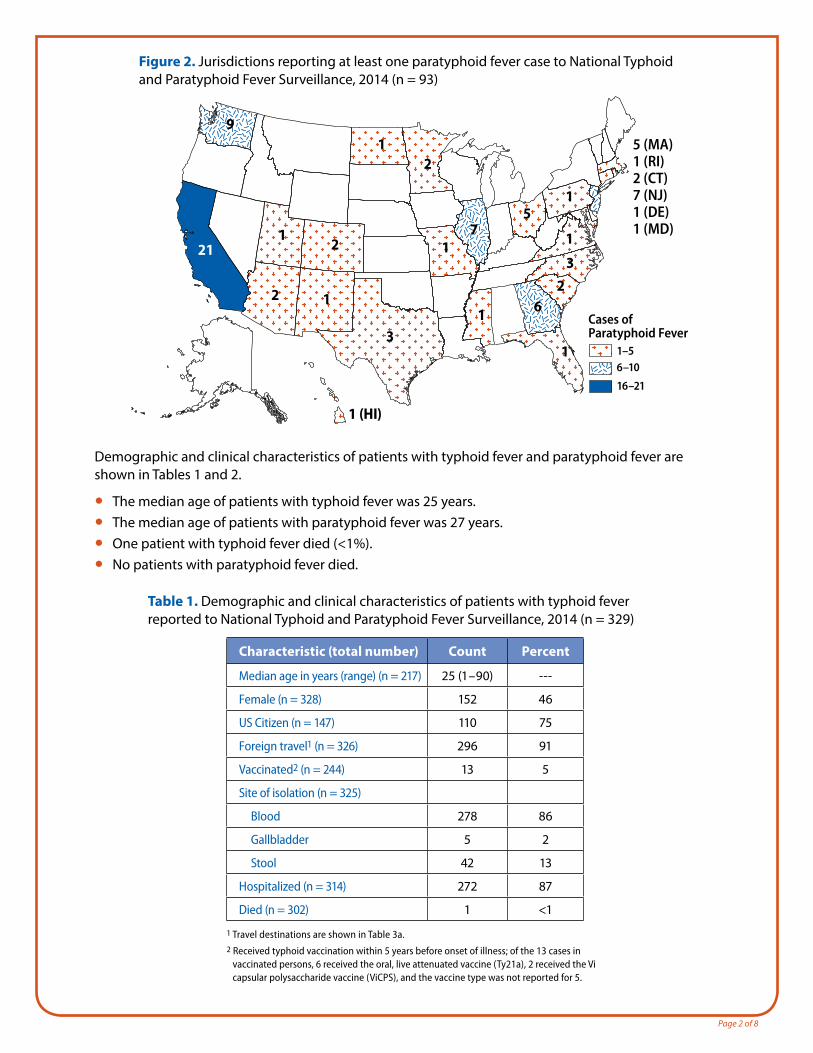
Figure 2. Jurisdictions reporting at least one paratyphoid fever case to National Typhoid and Paratyphoid Fever Surveillance, 2014 (n = 93)
Demographic and clinical characteristics of patients with typhoid fever and paratyphoid fever are shown in Tables 1 and 2.
● The median age of patients with typhoid fever was 25 years. ● The median age of patients with paratyphoid fever was 27 years. ● One patient with typhoid fever died (<1%). ● No patients with paratyphoid fever died.
Table 1. Demographic and clinical characteristics of patients with typhoid fever reported to National Typhoid and Paratyphoid Fever Surveillance, 2014 (n = 329)
Characteristic (total number) Count Percent
Median age in years (range) (n = 217) 25 (1 – 90) ---
Female (n = 328) 152 46
US Citizen (n = 147) 110 75
Foreign travel1 (n = 326) 296 91
Vaccinated2 (n = 244) 13 5
Site of isolation (n = 325)
Blood 278 86
Gallbladder 5 2
Stool 42 13
Hospitalized (n = 314) 272 87
Died (n = 302) 1 <1
1 Travel destinations are shown in Table 3a.2 Received typhoid vaccination within 5 years before onset of illness; of the 13 cases in
vaccinated persons, 6 received the oral, live attenuated vaccine (Ty21a), 2 received the Vi capsular polysaccharide vaccine (ViCPS), and the vaccine type was not reported for 5.
Page 3 of 8
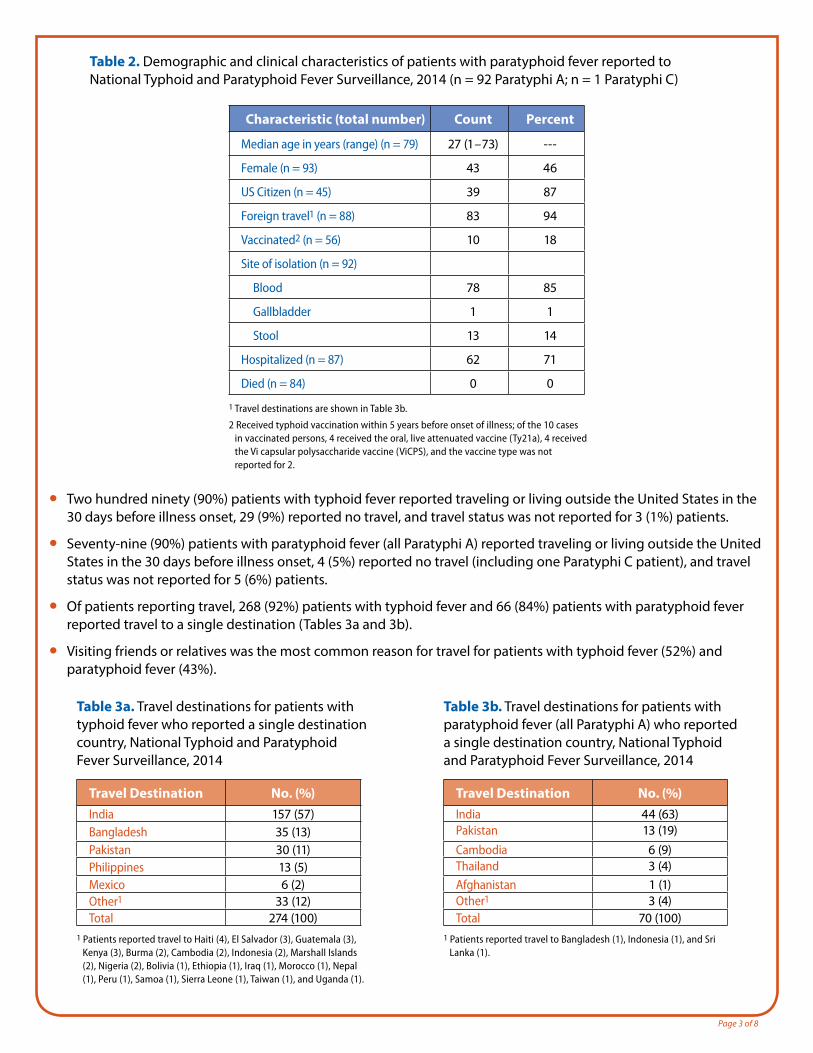
Table 2. Demographic and clinical characteristics of patients with paratyphoid fever reported to National Typhoid and Paratyphoid Fever Surveillance, 2014 (n = 92 Paratyphi A; n = 1 Paratyphi C)
Characteristic (total number) Count Percent
Median age in years (range) (n = 79) 27 (1 – 73) ---
Female (n = 93) 43 46
US Citizen (n = 45) 39 87
Foreign travel1 (n = 88) 83 94
Vaccinated2 (n = 56) 10 18
Site of isolation (n = 92)
Blood 78 85
Gallbladder 1 1
Stool 13 14
Hospitalized (n = 87) 62 71
Died (n = 84) 0 0
1 Travel destinations are shown in Table 3b.
2 Received typhoid vaccination within 5 years before onset of illness; of the 10 cases in vaccinated persons, 4 received the oral, live attenuated vaccine (Ty21a), 4 received the Vi capsular polysaccharide vaccine (ViCPS), and the vaccine type was not reported for 2.
● Two hundred ninety (90%) patients with typhoid fever reported traveling or living outside the United States in the 30 days before illness onset, 29 (9%) reported no travel, and travel status was not reported for 3 (1%) patients.
● Seventy-nine (90%) patients with paratyphoid fever (all Paratyphi A) reported traveling or living outside the United States in the 30 days before illness onset, 4 (5%) reported no travel (including one Paratyphi C patient), and travel status was not reported for 5 (6%) patients.
● Of patients reporting travel, 268 (92%) patients with typhoid fever and 66 (84%) patients with paratyphoid fever reported travel to a single destination (Tables 3a and 3b).
● Visiting friends or relatives was the most common reason for travel for patients with typhoid fever (52%) and paratyphoid fever (43%).
Table 3a. Travel destinations for patients with typhoid fever who reported a single destination country, National Typhoid and Paratyphoid Fever Surveillance, 2014
Travel Destination No. (%)India 157 (57)Bangladesh 35 (13)Pakistan 30 (11)Philippines 13 (5)Mexico 6 (2)Other1 33 (12)Total 274 (100)
1 Patients reported travel to Haiti (4), El Salvador (3), Guatemala (3), Kenya (3), Burma (2), Cambodia (2), Indonesia (2), Marshall Islands (2), Nigeria (2), Bolivia (1), Ethiopia (1), Iraq (1), Morocco (1), Nepal (1), Peru (1), Samoa (1), Sierra Leone (1), Taiwan (1), and Uganda (1).
Table 3b. Travel destinations for patients with paratyphoid fever (all Paratyphi A) who reported a single destination country, National Typhoid and Paratyphoid Fever Surveillance, 2014
Travel Destination No. (%)India 44 (63)Pakistan 13 (19)Cambodia 6 (9)Thailand 3 (4)Afghanistan 1 (1)Other1 3 (4)Total 70 (100)
1 Patients reported travel to Bangladesh (1), Indonesia (1), and Sri Lanka (1).
Page 4 of 8
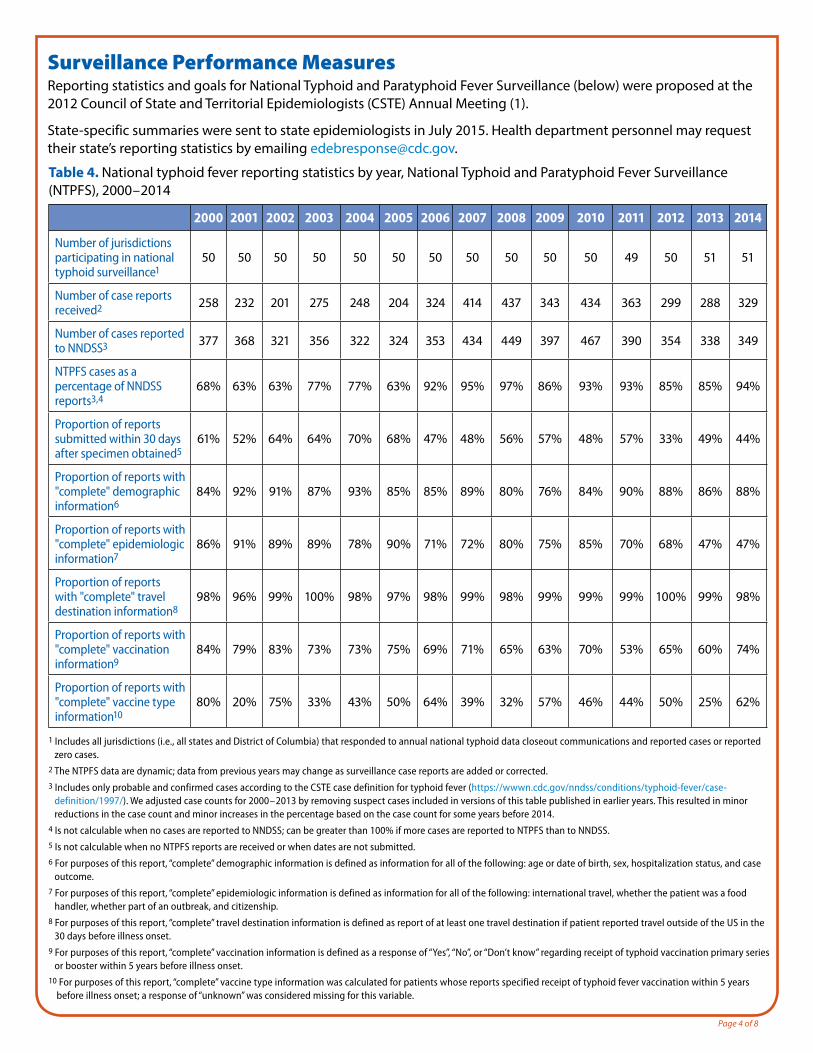
Surveillance Performance MeasuresReporting statistics and goals for National Typhoid and Paratyphoid Fever Surveillance (below) were proposed at the 2012 Council of State and Territorial Epidemiologists (CSTE) Annual Meeting (1).
State-specific summaries were sent to state epidemiologists in July 2015. Health department personnel may request their state’s reporting statistics by emailing [email protected].
Table 4. National typhoid fever reporting statistics by year, National Typhoid and Paratyphoid Fever Surveillance (NTPFS), 2000 – 2014
2000 2001 2002 2003 2004 2005 2006 2007 2008 2009 2010 2011 2012 2013 2014
Number of jurisdictions participating in national typhoid surveillance1
50 50 50 50 50 50 50 50 50 50 50 49 50 51 51
Number of case reports received2 258 232 201 275 248 204 324 414 437 343 434 363 299 288 329
Number of cases reported to NNDSS3 377 368 321 356 322 324 353 434 449 397 467 390 354 338 349
NTPFS cases as a percentage of NNDSS reports3,4
68% 63% 63% 77% 77% 63% 92% 95% 97% 86% 93% 93% 85% 85% 94%
Proportion of reports submitted within 30 days after specimen obtained5
61% 52% 64% 64% 70% 68% 47% 48% 56% 57% 48% 57% 33% 49% 44%
Proportion of reports with "complete" demographic information6
84% 92% 91% 87% 93% 85% 85% 89% 80% 76% 84% 90% 88% 86% 88%
Proportion of reports with "complete" epidemiologic information7
86% 91% 89% 89% 78% 90% 71% 72% 80% 75% 85% 70% 68% 47% 47%
Proportion of reports with "complete" travel destination information8
98% 96% 99% 100% 98% 97% 98% 99% 98% 99% 99% 99% 100% 99% 98%
Proportion of reports with "complete" vaccination information9
84% 79% 83% 73% 73% 75% 69% 71% 65% 63% 70% 53% 65% 60% 74%
Proportion of reports with "complete" vaccine type information10
80% 20% 75% 33% 43% 50% 64% 39% 32% 57% 46% 44% 50% 25% 62%
1 Includes all jurisdictions (i.e., all states and District of Columbia) that responded to annual national typhoid data closeout communications and reported cases or reported zero cases.
2 The NTPFS data are dynamic; data from previous years may change as surveillance case reports are added or corrected.3 Includes only probable and confirmed cases according to the CSTE case definition for typhoid fever (https://wwwn.cdc.gov/nndss/conditions/typhoid-fever/case-
definition/1997/). We adjusted case counts for 2000 – 2013 by removing suspect cases included in versions of this table published in earlier years. This resulted in minor reductions in the case count and minor increases in the percentage based on the case count for some years before 2014.
4 Is not calculable when no cases are reported to NNDSS; can be greater than 100% if more cases are reported to NTPFS than to NNDSS. 5 Is not calculable when no NTPFS reports are received or when dates are not submitted.6 For purposes of this report, “complete” demographic information is defined as information for all of the following: age or date of birth, sex, hospitalization status, and case
outcome.7 For purposes of this report, “complete” epidemiologic information is defined as information for all of the following: international travel, whether the patient was a food
handler, whether part of an outbreak, and citizenship.8 For purposes of this report, “complete” travel destination information is defined as report of at least one travel destination if patient reported travel outside of the US in the
30 days before illness onset.9 For purposes of this report, “complete” vaccination information is defined as a response of “Yes”, “No”, or “Don’t know” regarding receipt of typhoid vaccination primary series
or booster within 5 years before illness onset.10 For purposes of this report, “complete” vaccine type information was calculated for patients whose reports specified receipt of typhoid fever vaccination within 5 years
before illness onset; a response of “unknown” was considered missing for this variable.
Page 5 of 8
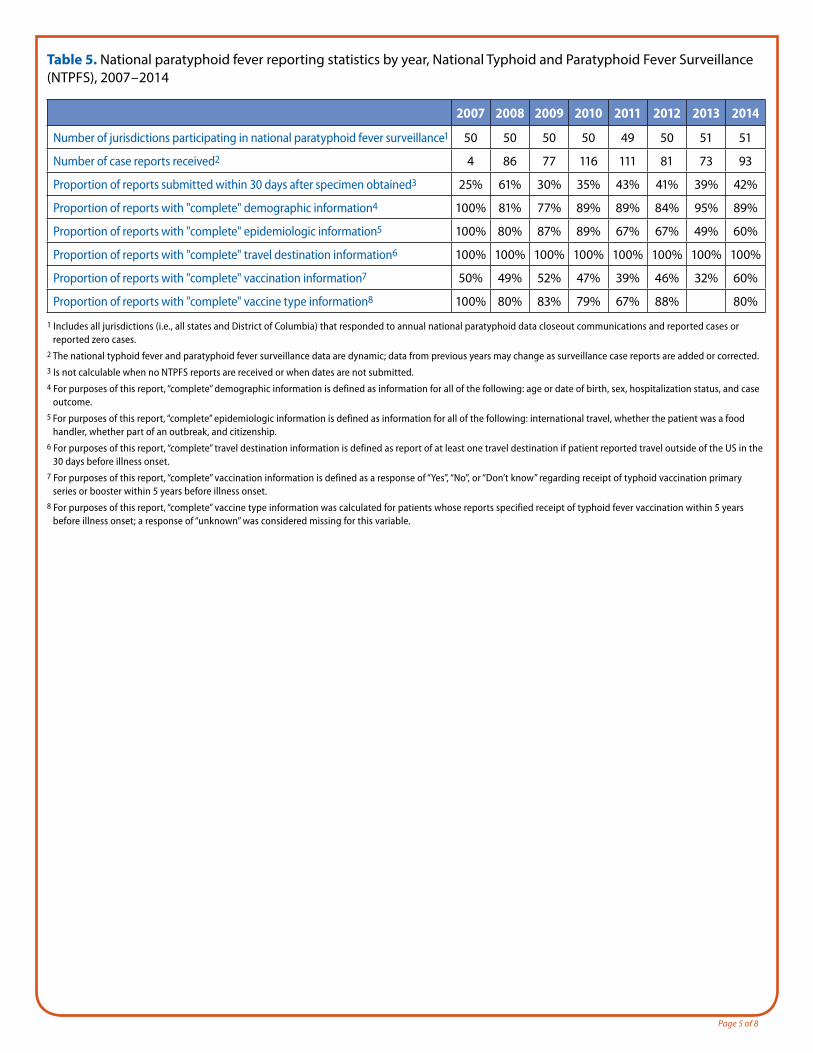
Table 5. National paratyphoid fever reporting statistics by year, National Typhoid and Paratyphoid Fever Surveillance (NTPFS), 2007 – 2014
2007 2008 2009 2010 2011 2012 2013 2014
Number of jurisdictions participating in national paratyphoid fever surveillance1 50 50 50 50 49 50 51 51
Number of case reports received2 4 86 77 116 111 81 73 93
Proportion of reports submitted within 30 days after specimen obtained3 25% 61% 30% 35% 43% 41% 39% 42%
Proportion of reports with "complete" demographic information4 100% 81% 77% 89% 89% 84% 95% 89%
Proportion of reports with "complete" epidemiologic information5 100% 80% 87% 89% 67% 67% 49% 60%
Proportion of reports with "complete" travel destination information6 100% 100% 100% 100% 100% 100% 100% 100%
Proportion of reports with "complete" vaccination information7 50% 49% 52% 47% 39% 46% 32% 60%
Proportion of reports with "complete" vaccine type information8 100% 80% 83% 79% 67% 88% 80%
1 Includes all jurisdictions (i.e., all states and District of Columbia) that responded to annual national paratyphoid data closeout communications and reported cases or reported zero cases.
2 The national typhoid fever and paratyphoid fever surveillance data are dynamic; data from previous years may change as surveillance case reports are added or corrected.3 Is not calculable when no NTPFS reports are received or when dates are not submitted.4 For purposes of this report, “complete” demographic information is defined as information for all of the following: age or date of birth, sex, hospitalization status, and case
outcome.5 For purposes of this report, “complete” epidemiologic information is defined as information for all of the following: international travel, whether the patient was a food
handler, whether part of an outbreak, and citizenship.6 For purposes of this report, “complete” travel destination information is defined as report of at least one travel destination if patient reported travel outside of the US in the
30 days before illness onset.7 For purposes of this report, “complete” vaccination information is defined as a response of “Yes”, “No”, or “Don’t know” regarding receipt of typhoid vaccination primary
series or booster within 5 years before illness onset.8 For purposes of this report, “complete” vaccine type information was calculated for patients whose reports specified receipt of typhoid fever vaccination within 5 years
before illness onset; a response of “unknown” was considered missing for this variable.
Page 6 of 8
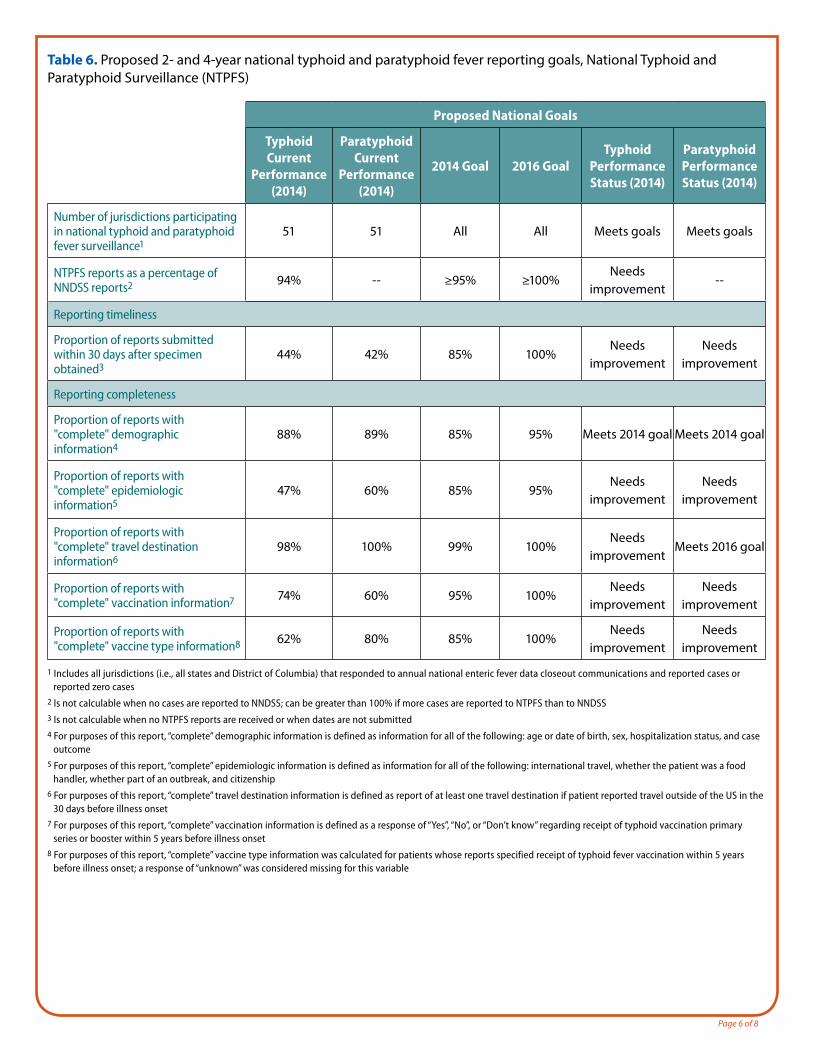
Table 6. Proposed 2- and 4-year national typhoid and paratyphoid fever reporting goals, National Typhoid and Paratyphoid Surveillance (NTPFS)
Proposed National Goals
Typhoid Current
Performance (2014)
Paratyphoid Current
Performance (2014)
2014 Goal 2016 GoalTyphoid
Performance Status (2014)
Paratyphoid Performance Status (2014)
Number of jurisdictions participating in national typhoid and paratyphoid fever surveillance1
51 51 All All Meets goals Meets goals
NTPFS reports as a percentage of NNDSS reports2 94% -- ≥95% ≥100%
Needs improvement
--
Reporting timeliness
Proportion of reports submitted within 30 days after specimen obtained3
44% 42% 85% 100%Needs
improvementNeeds
improvement
Reporting completeness
Proportion of reports with "complete" demographic information4
88% 89% 85% 95% Meets 2014 goal Meets 2014 goal
Proportion of reports with "complete" epidemiologic information5
47% 60% 85% 95%Needs
improvementNeeds
improvement
Proportion of reports with "complete" travel destination information6
98% 100% 99% 100%Needs
improvementMeets 2016 goal
Proportion of reports with "complete" vaccination information7 74% 60% 95% 100%
Needs improvement
Needs improvement
Proportion of reports with "complete" vaccine type information8 62% 80% 85% 100%
Needs improvement
Needs improvement
1 Includes all jurisdictions (i.e., all states and District of Columbia) that responded to annual national enteric fever data closeout communications and reported cases or reported zero cases
2 Is not calculable when no cases are reported to NNDSS; can be greater than 100% if more cases are reported to NTPFS than to NNDSS3 Is not calculable when no NTPFS reports are received or when dates are not submitted4 For purposes of this report, “complete” demographic information is defined as information for all of the following: age or date of birth, sex, hospitalization status, and case
outcome 5 For purposes of this report, “complete” epidemiologic information is defined as information for all of the following: international travel, whether the patient was a food
handler, whether part of an outbreak, and citizenship6 For purposes of this report, “complete” travel destination information is defined as report of at least one travel destination if patient reported travel outside of the US in the
30 days before illness onset7 For purposes of this report, “complete” vaccination information is defined as a response of “Yes”, “No”, or “Don’t know” regarding receipt of typhoid vaccination primary
series or booster within 5 years before illness onset8 For purposes of this report, “complete” vaccine type information was calculated for patients whose reports specified receipt of typhoid fever vaccination within 5 years
before illness onset; a response of “unknown” was considered missing for this variable
Page 7 of 8
NNDSS DataThe National Notifiable Disease Surveillance System (NNDSS) collects and compiles reports of nationally notifiable infectious diseases, including typhoid fever. Paratyphoid fever is not nationally notifiable. Reports can be found at http://www.cdc.gov/mmwr/mmwr_nd/index.html
Antimicrobial Resistance DataThe National Antimicrobial Resistance Monitoring System (NARMS) monitors antimicrobial resistance among enteric bacteria (including Salmonella serotype Typhi and Paratyphi A and C) from humans. In Enterobacteriaceae, resistance to nalidixic acid, an elementary quinolone, correlates with decreased susceptibility to ciprofloxacin (MIC ≥0.12 μg / mL) and possible fluoroquinolone treatment failure. For Salmonella serotypes Typhi and Paratyphi, resistance to traditional first-line antimicrobial agents, ampicillin, chloramphenicol, and trimethoprim-sulfamethoxazole (ACT / S) were defined as multidrug resistant.
The 2014 data, available at wwwn.cdc.gov/NARMS, showed the following:
For Salmonella serotype Typhi isolates
● 72% were resistant to nalidixic acid
● 5% were resistant to ciprofloxacin
● No isolates were resistant to ceftriaxone
● 11% were multidrug resistant
For Salmonella serotype Paratyphi A isolates
● 80% were resistant to nalidixic acid
● No isolates were resistant to ciprofloxacin
● No isolates were resistant to ceftriaxone
● No isolates were multidrug resistant
Outbreak DataThe Foodborne Disease Outbreak Surveillance System (FDOSS) collects reports of foodborne disease outbreaks from local, state, tribal, and territorial public health agencies. The most recently published foodborne outbreaks annual report is from 2014, available at http://www.cdc.gov/foodsafety/pdfs/foodborne-outbreaks-annual-report-2014-508.pdf.
The Waterborne Disease and Outbreak Surveillance System (WBDOSS) collects reports of waterborne disease outbreaks associated with drinking water and recreational water from local, state, tribal, and territorial public health agencies. Findings for waterborne outbreaks of typhoid fever are preliminary. Reports from years prior are available at http://www.cdc.gov/healthywater/surveillance/surveillance-reports.html.
● In 2014, no typhoid fever outbreaks were reported.
Page 8 of 8
References1. Fullerton KE, Newton AE, Heiman KE, Silk BJ. Cholera, vibriosis, typhoid and paratyphoid fever: National Surveillance. 2012 Council of State and Territorial
Epidemiologists Annual Conference, Omaha, NE; June 3 – 7, 2012.
2. Centers for Disease Control and Prevention (CDC). National Antimicrobial Resistance Monitoring System for Enteric Bacteria (NARMS): Human Isolates Surveillance Report for 2014 (Final Report). Atlanta, Georgia: U.S. Department of Health and Human Services, CDC, 2016.
3. Centers for Disease Control and Prevention (CDC). Foodborne Outbreak Online Database. Atlanta, Georgia: U.S. Department of Health and Human Services, Center for Disease Control and Prevention. Available from URL: http://wwwn.cdc.gov/foodborneoutbreaks. Accessed 8/23/2016.
4. Centers for Disease Control and Prevention (CDC). Surveillance for Foodborne Disease Outbreaks, United States, 2014, Annual Report. Atlanta, Georgia: US Department of Health and Human Services, CDC, 2016.
5. Centers for Disease Control and Prevention (CDC). Waterborne Disease & Outbreak Surveillance Reporting. Atlanta, Georgia: U.S. Department of Health and Human Services, Center for Disease Control and Prevention. Available from URL: http://www.cdc.gov/healthywater/surveillance/index.html. Accessed 8 / 23 / 2016.
Recommended Citation: Centers for Disease Control and Prevention (CDC). National Typhoid and Paratyphoid Fever Surveillance Annual Summary, 2014. Atlanta, Georgia: US Department of Health and Human Services, CDC, 2016.
NCEZID Atlanta: For more information please contact Centers for Disease Control and Prevention, 1600 Clifton Road NE, Atlanta, GA 30333 MS C-09 Telephone: 1-404-639-2206 / Email: [email protected]