NATIONAL TREASURY ANNUAL REPORT VOTE 7
450
N AT I O N A L TREASURY ANNUAL REPORT VOTE 7
Transcript of NATIONAL TREASURY ANNUAL REPORT VOTE 7
NATIONAL TREASURYANNUAL REPORT
VOTE 7

NATIONAL TREASURYANNUAL REPORT

NATIONAL TREASURYANNUAL REPORT
TABLE OF CONTENTS
PART A:GENERAL INFORMATION .................................................................................................1
1. DEPARTMENT INFORMATION ...................................................................................................................1
2. LIST OF ABBREVIATIONS/ACRONYMS ...................................................................................................2
3. FOREWORD BY THE MINISTER ..................................................................................................................11
4. REPORT OF THE DEPUTY MINISTER .......................................................................................................13
5. REPORT OF THE ACCOUNTING OFFICER ..............................................................................................15
6. STATEMENT OF RESPONSIBILITY AND CONFIRMATION OF ACCURACY FOR THE ANNUAL REPORT .........................................................................................................................27
7. STRATEGIC OVERVIEW ..................................................................................................................................28
8. LEGISLATIVE AND OTHER MANDATES ..................................................................................................29
9. ORGANISATIONAL STRUCTURE ...............................................................................................................30
10. PUBLIC ENTITIES REPORTING TO THE MINISTER ..............................................................................32

PART B:PERFORMANCE INFORMATION ..................................................................................48
1. AUDITOR-GENERAL’S REPORT: PREDETERMINED OBJECTIVES .................................................49
2. OVERVIEW OF DEPARTMENTAL PERFORMANCE .............................................................................49
3. STRATEGIC OUTCOME ORIENTED GOALS ...........................................................................................53
4. PERFORMANCE INFORMATION BY PROGRAMME ...........................................................................72
4.1 PROGRAMME 1: ADMINISTRATION ................................................................................................................................................................72
4.2 PROGRAMME 2: ECONOMIC POLICY, TAX, FINANCIAL REGULATION AND RESEARCH ..............................................82
4.3 PROGRAMME 3: PUBLIC FINANCE AND BUDGET MANAGEMENT ...........................................................................................93
4.4 PROGRAMME 4: ASSET AND LIABILITY MANAGEMENT ...................................................................................................................119
4.5 PROGRAMME 5: FINANCIAL ACCOUNTING AND SUPPLY CHAIN MANAGEMENT SYSTEMS .................................129
4.6 PROGRAMME 6: INTERNATIONAL FINANCIAL RELATIONS .............................................................................................................153
4.7 PROGRAMME 7: CIVIL AND MILITARY PENSIONS, CONTRIBUTIONS TO FUNDS AND OTHER BENEFITS.........161
4.8 PROGRAMME 8: TECHNICAL AND MANAGEMENT SUPPORT AND DEVELOPMENT FINANCE .............................166
TABLE OF CONTENTS

NATIONAL TREASURYANNUAL REPORT
5. TRANSFER PAYMENTS ...................................................................................................................................181
6. CONDITIONAL GRANTS ...............................................................................................................................188
7. DONOR FUNDS ................................................................................................................................................192
8. CAPITAL INVESTMENT ..................................................................................................................................194
PART C:GOVERNANCE ..........................................................................................................................195
1. INTRODUCTION ...............................................................................................................................................196
2. RISK MANAGEMENT ......................................................................................................................................196
3. FRAUD AND CORRUPTION .........................................................................................................................197
4. MINIMISING CONFLICT OF INTEREST ....................................................................................................197
5. CODE OF CONDUCT ......................................................................................................................................197
6. HEALTH, SAFETY AND ENVIRONMENTAL ISSUES ............................................................................198
7. PORTFOLIO COMMITTEES ..........................................................................................................................199
8. SCOPA RESOLUTIONS ...................................................................................................................................208
TABLE OF CONTENTS

9. PRIOR MODIFICATIONS TO AUDIT REPORTS ......................................................................................208
10. INTERNAL CONTROL UNIT ..........................................................................................................................210
11. INTERNAL AUDIT AND AUDIT COMMITTEES .....................................................................................210
12. AUDIT COMMITTEE REPORT ......................................................................................................................211
PART D:HUMAN RESOURCE MANAGEMENT .......................................................................215
1. INTRODUCTION ...............................................................................................................................................216
2. OVERVIEW OF HUMAN RESOURCES ......................................................................................................216
2.1 STATUS OF HUMAN RESOURCES IN THE DEPARTMENT...................................................................................................................216
2.2 HUMAN RESOURCE PRIORITIES FOR THE YEAR UNDER REVIEW ................................................................................................216
2.3 WORKFORCE PLANNING AND KEY STRATEGIES TO ATTRACT AND RECRUIT SKILLED AND CAPABLE
WORKFORCE ..................................................................................................................................................................................................................217
2.4 EMPLOYEE PERFORMANCE MANAGEMENT ............................................................................................................................................217
2.5 EMPLOYEE HEALTH AND WELLNESS PROGRAMME ...........................................................................................................................217
TABLE OF CONTENTS
TABLE OF CONTENTS
NATIONAL TREASURYANNUAL REPORT
2.6 ACHIEVEMENTS AND CHALLENGES FACED BY THE DEPARTMENT .........................................................................................218
2.7 FUTURE HUMAN RESOURCE PLANS/GOALS ...........................................................................................................................................218
3. HUMAN RESOURCES OVERSIGHT STATISTICS ...................................................................................219
PART E:FINANCIAL INFORMATION .............................................................................................257


NATIONAL TREASURYANNUAL REPORT
PART A:GENERAL INFORMATION

1
PART A: GENERAL INFORMATION
DEPARTMENT National Treasury
PHYSICAL ADDRESS 40 Church Square
Pretoria
0002
POSTAL ADDRESS Private Bag X115
Pretoria
0001
TELEPHONE NUMBER/S 027 12 315 5944
FAX NUMBER 027 12 406 5095
EMAIL ADDRESS [email protected]
WEBSITE ADDRESS www.treasury.gov.za
ISBN 978-0-621-47610-1 | RP 249/2019
1. DEPARTMENT INFORMATION

2
PART A: GENERAL INFORMATION - Continued
2. LIST OF ABBREVIATIONS/ACRONYMS
ADF African Development Fund
AENE Adjusted Estimates of National Expenditure
AfDB African Development Bank
AFIAAR African Forum of Independent Accounting and Audit Regulators
AFS Annual Financial Statements
AGSA Auditor-General South Africa
AIF Africa Investment Forum
ALM Asset and Liability Management
AO Accounting Officer
APP Annual Performance Plan
APR Annual Performance Report
ARC Africa Regional Centre
ASB Accounting Standards Board
AU African Union
BAS Basic Accounting System
BBBEE Broad Based Black Economic Empowerment
BBCBE Black Business Council Built Environment
BBI Broadband Infraco
BCM Business Continuity Management
BEE Black Economic Empowerment
BEPP Built Environment Performance Plan
BEPS Base Erosion and Profit Shifting
BFI Budget Facility for Infrastructure
BMA Border Management Agency
BO Budget Office
BPA Benefits Payment Automation
BRICS Brazil, Russia, India, China and South Africa
BTC Belgian Technical Cooperation
BTO Budget and Treasury Office
CA Chartered Accountants
CAA Chartered Accountants Academy
CAHF Centre for Affordable Housing Finance in Africa
CBDA Co-operative Banks Development Agency
CD Chief Directorate
CDS Capacity Development Strategy
CEF Central Energy Fund
CFI Co-operative Financial Institution

3
PART A: GENERAL INFORMATION - Continued
2. LIST OF ABBREVIATIONS/ACRONYMS
CFO Chief Financial Officer
CFPs Calls for Proposals
CGICTPF Corporate Governance of Information and Communications Technology Policy Framework
CIDMS Cities’ Infrastructure Delivery and Management System
CIGFARO Chartered Institute of Government Finance, Auditing and Risk Officers
CIT Company Income Tax
CoE Compensation of Employees
COGHSTA Cooperative Governance, Human Settlements and Traditional Affairs
CoGTA Cooperative Governance and Traditional Affairs
COLA Cost of Living Adjustment
COMAF Communication of Audit Findings
CPS Cash Paymaster Services
CS Corporate Services
CSD Central Supplier Database
CSIPs City Support Implementation Plans
CSO Civil Society Organisations
CSP Cities Support Programme
CSPs Country Strategy Papers
CwA Compact with Africa
DBE Department of Basic Education
DBSA Development Bank of Southern Africa
DCoG Department of Cooperative Governance
DFI Development Finance Institution
DFID Department for International Development
DFIs Development Finance Institutions
DHET Department of Higher Education and Training
DIRCO Department of International Relations and Cooperation
DMTN Domestic Medium-Term Note
DoJCD Department of Justice and Constitutional Development
DoRA Division of Revenue Act
DORB Division of Revenue Bill
DPCI Directorate for Priority Crime Investigation
DPME Department of Planning, Monitoring and Evaluation
DPW Department of Public Works
DTI Department of Trade and Industry
DTPS Department of Telecommunications and Postal Services
DTT Digital Terrestrial Television

4
PART A: GENERAL INFORMATION - Continued
DVD Digital Video Disc
EAOs Emolument Attachment Orders
ECA Equivalent Competent Authority
ECIC Export Credit Insurance Corporation
ECOSOC Economic and Social Council
EDMS Electronic Document Management System
eEd PDMS e-Education Procurement and Delivery Management Standard
EHW Employee Health and Wellness
ELP Executive Leadership Programme
ENE Estimates of National Expenditure
EPI Expanded Programme on Immunisation
EPWP Expanded Public Works Programme
ERM Enterprise Risk Management
ETD Education Training and Development
EU European Union
EWRM Enterprise Wide Risk Management
F15 Committee of Fifteen Finance Ministers
FAC Finance and Audit Committee
FAIS Financial Advisory and Intermediary Services
FAIS Ombud Financial Advisory and Intermediary Services Ombud
FAOA Federal Audit Oversight Authority
FFC Financial and Fiscal Commission
FIC Financial Intelligence Centre
FICA Financial Intelligence Centre Act
FIDPM Framework for Infrastructure Delivery and Procurement Management
Fitch Fitch Ratings Agency
FLC Fiscal Liability Committee
FMCMM Financial Management Capability Maturity Model
FMG Financial Management Grant
FMIP Financial Management Improvement Programme
FMISD Financial Management Capacity Development Programme for Improved Service Delivery
FOSAD Forum of South African Directors-General
FRP Financial Recovery Plan
FSB Financial Services Board
FSCA Financial Sector Conduct Authority
FSR Financial Sector Regulation
FSRB Financial Sector Regulation Bill
2. LIST OF ABBREVIATIONS/ACRONYMS

5
PART A: GENERAL INFORMATION - Continued
G20 Group of Twenty
GAVI Global Alliance for Vaccines and Immunisation
GCI General Capital Increase
GEHS Government Employees Housing Scheme
GEPF Government Employees Pension Fund
GPAA Government Pensions Administration Agency
GPW Government Printing Works
GRAP Standards of Generally Recognised Accounting Practice
GTAC Government Technical Advisory Centre
HIV Human Immunodeficiency Virus
HLPF High Level Political Forum
HOD Head of Department
HR Human Resources
HSRC Human Sciences Research Council
IA Internal Audit
ICASA Independent Communications Authority of South Africa
ICDG Integrated City Development Grant
ICT Information and Communication Technology
IDA International Development Association
IDC Industrial Development Corporation
IDIP Infrastructure Delivery Improvement Programme
IDMS Infrastructure Delivery Management System
IDMSBOK Infrastructure Delivery Management System Body of Knowledge
IDP Integrated Development Programme
IDT Independent Development Trust
IES Income and Expenditure Survey
IFIAR International Forum of Independent Audit Regulators
IFMS Integrated Financial Management System
IGR Inter-Governmental Relations
IIF Institute of International Finance
IMC Inter-Ministerial Committee
IMF International Monetary Fund
IPID Independent Police Investigative Directorate
IPPs Independent Power Producers
IPSASB International Public Sector Standards Board
IRBA Independent Regulatory Board for Auditors
ISDG Infrastructure Skills Development Grant
2. LIST OF ABBREVIATIONS/ACRONYMS
6
PART A: GENERAL INFORMATION - Continued
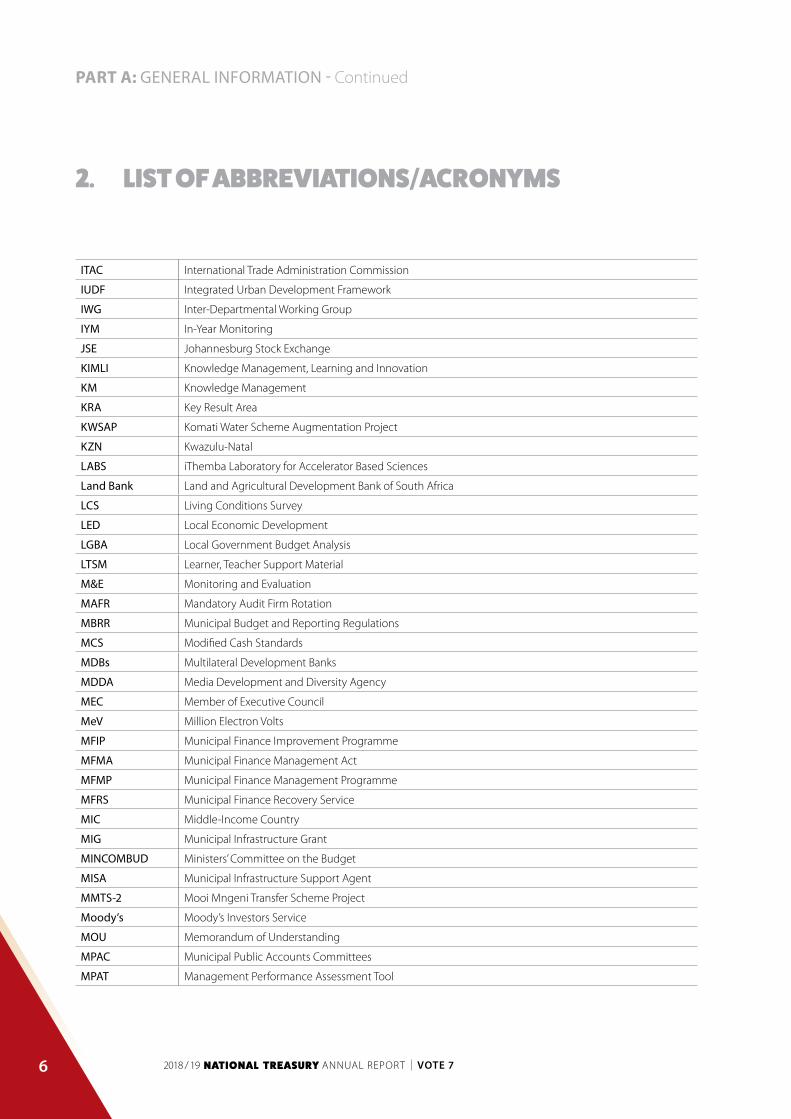
ITAC International Trade Administration Commission
IUDF Integrated Urban Development Framework
IWG Inter-Departmental Working Group
IYM In-Year Monitoring
JSE Johannesburg Stock Exchange
KIMLI Knowledge Management, Learning and Innovation
KM Knowledge Management
KRA Key Result Area
KWSAP Komati Water Scheme Augmentation Project
KZN Kwazulu-Natal
LABS iThemba Laboratory for Accelerator Based Sciences
Land Bank Land and Agricultural Development Bank of South Africa
LCS Living Conditions Survey
LED Local Economic Development
LGBA Local Government Budget Analysis
LTSM Learner, Teacher Support Material
M&E Monitoring and Evaluation
MAFR Mandatory Audit Firm Rotation
MBRR Municipal Budget and Reporting Regulations
MCS Modified Cash Standards
MDBs Multilateral Development Banks
MDDA Media Development and Diversity Agency
MEC Member of Executive Council
MeV Million Electron Volts
MFIP Municipal Finance Improvement Programme
MFMA Municipal Finance Management Act
MFMP Municipal Finance Management Programme
MFRS Municipal Finance Recovery Service
MIC Middle-Income Country
MIG Municipal Infrastructure Grant
MINCOMBUD Ministers’ Committee on the Budget
MISA Municipal Infrastructure Support Agent
MMTS-2 Mooi Mngeni Transfer Scheme Project
Moody’s Moody’s Investors Service
MOU Memorandum of Understanding
MPAC Municipal Public Accounts Committees
MPAT Management Performance Assessment Tool
2. LIST OF ABBREVIATIONS/ACRONYMS

7
PART A: GENERAL INFORMATION - Continued
MPC Monetary Policy Committee
mSCOA Municipal Standard Chart of Accounts
MTBPS Medium Term Budget Policy Statement
MTEC Medium Term Expenditure Committee
MTEF Medium Term Expenditure Framework
MTREF Medium Term Revenue and Expenditure Framework
MTSF Medium Term Strategic Framework
NCOP National Council of Provinces
NDB New Development Bank
NDOH National Department of Health
NDP National Development Plan
NDPG Neighbourhood Development Partnership Grant
NECSA Nuclear Energy Corporation of South Africa
NEDLAC National Economic Development and Labour Council
NHI National Health Insurance
NPA National Prosecuting Authority
NPS National Payment System
NQF National Qualifications Framework
NRF National Research Foundation
NRF National Research Facility
NSA National Skills Authority
NSG National School of Government
NWDC North West Development Corporation
OAG Office of the Accountant General
OCPO Office of the Chief Procurement Officer
ODA Official Development Assistance
OECD Organisation for Economic Cooperation and Development
OHS Occupational Health and Safety
OPFA Office of the Pension Fund Adjudicator
OSBP One Stop Border Post
OTO Office of the Tax Ombud
PCG Principles Consultative Group
PCM Pensioner Case Management
PCU Programme Coordinating Unit
PDFIs Provincial Development Finance Institutions
PMDS Performance Management and Development System
PEOU Public Entities Oversight Unit
2. LIST OF ABBREVIATIONS/ACRONYMS

8
PART A: GENERAL INFORMATION - Continued
PEPA Public Expenditure and Policy Analysis
PER Performance Expenditure Reviews
PERSAL Personnel and Salary Administration System
PF Public Finance
PFM Public Finance Management
PFMA Public Finance Management Act
PFS Public Finance Statistics
PIC Public Investment Corporation
PINK Procurement, Infrastructure Management and Knowledge Management Capacity Building Programme
PMTE Property Management Trading Entity
PMU Programme Management Unit
PoE Port of Entry
PPAs Power Purchase Agreements
PPP Public Private Partnership
PPPFA Preferential Procurement Policy Framework Act
PPRs Preferential Procurement Regulations
PSC Public Service Commission
PSCBC Public Service Co-ordinating Bargaining Council
PSO Parliamentary Service Office
PSO Programme Support Office
PSP Private Sector Participation
PSRAF Public Sector Remuneration Analysis and Forecasting
PT Provincial Treasury
R&D Research and Development
R&I Ratings and Investment Information
RDP Reconstruction and Development Programme
REDI Research Project on Employment, Income Distribution and Inclusive Growth
S&P Standard and Poor’s Global Ratings Agency
SA South Africa
SAA South African Airways
SACU Southern African Customs Union
SADC Southern African Development Community
SAFE Sanitation Appropriate for Education
SAHPRA South African Health Products Regulatory Authority
SAIPA South African Institute of Professional Accountants
SALGA South African Local Government Association
SAPO South African Post Office
2. LIST OF ABBREVIATIONS/ACRONYMS

9
PART A: GENERAL INFORMATION - Continued
SAPS South African Police Service
SARS South African Revenue Service
SAS Specialised Audit Services
SA-SAMS South African School Administration and Management System
SASRIA South African Special Risks Insurance Association
SASSA South African Social Security Agency
SAX South African Express
SCM Supply Chain Management
SCOA Standard Chart of Accounts
SCoA Standing Committee on Appropriations
SCoF Standing Committee on Finance
SCOPA Standing Committee on Public Accounts
SDIP Service Delivery Improvement Plan
SECO Swiss State Secretariat for Economic Development
SeCoA Select Committee on Appropriations
SeCoF Select Committee on Finance
SHRA Social Housing Regulatory Authority
SIPDM Standards for Infrastructure Procurement and Delivery Management
SITA State Information Technology Agency
SLA Service Level Agreement
SMME Small, Medium and Micro Enterprises
SMS Senior Management Service
SOC State-Owned Company
SOERG State-Owned Enterprises Remuneration Guide
SOP Standard Operating Procedures
SPF Strategic Procurement Framework
SQL Structured Query Language
SSA State Security Agency
STER Single Transport Economic Regulator
TALAB Tax Administration Laws Amendment Bill
TAS Time Accounting System
TB Tuberculosis
TCTA Trans-Caledon Tunnel Authority
TETA Transport Education and Training Authority
TFST Thin Film Solar Technology
TLAB Taxation Laws Amendment Bill
TR Treasury Regulations
2. LIST OF ABBREVIATIONS/ACRONYMS
10
PART A: GENERAL INFORMATION - Continued
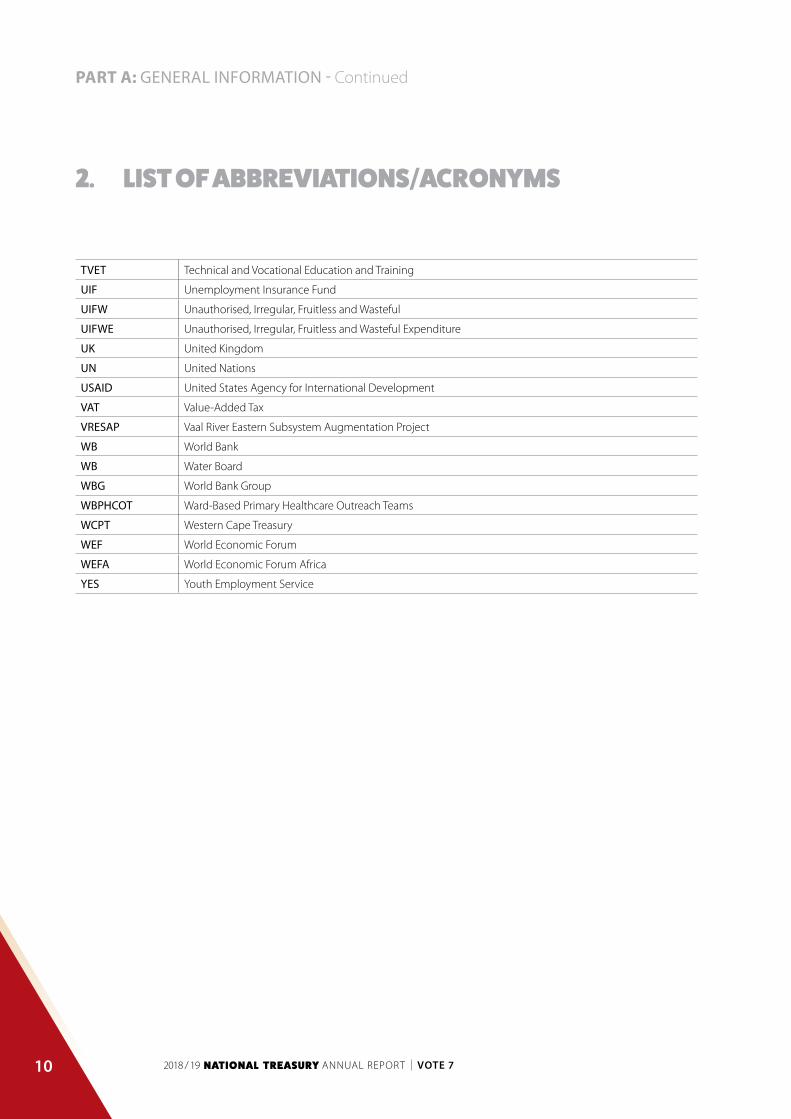
TVET Technical and Vocational Education and Training
UIF Unemployment Insurance Fund
UIFW Unauthorised, Irregular, Fruitless and Wasteful
UIFWE Unauthorised, Irregular, Fruitless and Wasteful Expenditure
UK United Kingdom
UN United Nations
USAID United States Agency for International Development
VAT Value-Added Tax
VRESAP Vaal River Eastern Subsystem Augmentation Project
WB World Bank
WB Water Board
WBG World Bank Group
WBPHCOT Ward-Based Primary Healthcare Outreach Teams
WCPT Western Cape Treasury
WEF World Economic Forum
WEFA World Economic Forum Africa
YES Youth Employment Service
2. LIST OF ABBREVIATIONS/ACRONYMS

11
PART A: GENERAL INFORMATION - Continued
3. FOREWORD BY THE MINISTER
In the year 2019 we celebrate 25 years since the dawn of democracy and reflect on the achievements of a united South Africa.
Remarkable progress has been made to expand opportunities and build a vibrant democracy while maintaining economic stability
in the face of significant headwinds. On the eve of the sixth democratic administration, a number of old challenges remain while
new ones have emerged. Though the past rainy seasons have recently given way to dry spells, our resilience and capacity for self-
correction is being confirmed by recent actions to restore trust in our institutions, attract investment into our economy, and plant
the seeds of an economy that works for all South Africans.
Economic activity grew by only 0.8 per cent in real terms in 2018, compared to 1.3 per cent in 2017. These figures are important
to digest when considering the increase in the country’s population, which grew by 1.55 per cent in the same period according
to Statistics South Africa. This means that the economy’s growth is not keeping up with the additional people being added to the
population and this has serious implications for the general welfare of families, the ability to find work, and the capacity of the state
to obtain the resources necessary to fund critical public services.
The lacklustre performance reflects a combination of difficult global conditions and domestic impediments to growth, including
high unemployment, poor skills competitiveness and low investor confidence. Poor growth and revenue shortfalls have also
necessitated substantial fiscal consolidation against the existing baselines, with additional revenue measures and additional savings
in the 2019 Medium Term Expenditure Framework (MTEF). While sobering, these realities offer us an opportunity to take ownership
and unite behind a common purpose.
The National Treasury is focused on its constitutional mandate, and remains committed to ensuring the sustainability of public
finances for service delivery and macro-economic stability.
Under the leadership of President Cyril Ramaphosa, government has acted to raise confidence in the economy, improve governance,
address the challenges in state-owned companies (SOCs), and cushion the blow of economic hardship on ordinary South Africans.
Minister of Finance
TT Mboweni

12
PART A: GENERAL INFORMATION - Continued
The President announced five measures to help stimulate the economy, with a major focus on raising the levels of investment and
thus potential growth. In the short term, these efforts have yielded positive results, including investment pledges of around R300
billion at the time of the February 2019 Budget, while efforts to address policy uncertainty contributed to a noticeable increase in
investments in renewable energy and mining.
Moreover, significant progress has been made to address governance failures and restore confidence in public institutions. While the
work of several commissions of inquiry continued, new leadership was appointed in various SOCs and institutions, culminating in
the appointment of a new South African Revenue Service (SARS) Commissioner at the end of the financial year.
Finally, during the year we also adopted the Twin Peaks model of financial regulation, with the aim of ensuring a safer financial
sector that serves South Africans better. On the fiscal side, we appointed an independent panel of experts to investigate options for
lowering the impact of the Value-Added Tax (VAT) increase on lower income households and consequently provided relief in the
form of a zero-rating of additional consumer products, such as bread flour, cake flour and sanitary pads.
The path to renewal and growth remains challenging, but like the fertile fields that cover our land, South Africa has immense
potential for a fruitful future. As government, we have a responsibility to reverse the lack of a satisfactory recovery in the economy
and the loss of trust in public institutions. We must replant anew and tend to the seeds of our future.
Finally, I wish to thank Deputy Minister David Masondo for his commitment to the public service and for serving all citizens with
dedication and selflessness. To Director-General Dondo Mogajane and the National Treasury team, once again you have risen to the
challenge and delivered. I and the country thank you.
TT MboweniMinister of Finance
20 September 2019
3. FOREWORD BY THE MINISTER

13
PART A: GENERAL INFORMATION - Continued
4. REPORT OF THE DEPUTY MINISTER
South Africa continues to navigate a highly challenging environment and address its shortcomings with tenacity. We are working
to reverse the recent weakening of our institutions and SOCs, and to achieve inclusive growth, including by protecting the most
vulnerable in our society, and ensuring that public institutions are able to fulfil their mandate without being a drag on the fiscus.
Much still needs to be done, but reform momentum will continue.
Drawing from the findings of the Presidential Review Committee on SOCs, key challenges facing our institutions include policy
and mandate misalignments, inefficient operations, governance failings and poor accountability mechanisms, as well as weak
financial positions. The National Treasury has been working closely with shareholder departments, commissions of inquiry, and
the SOCs and institutions themselves to find the appropriate solutions. While debate continues on the future of some entities,
we are committed to making sure that they are financially stable and are able to fulfil their mandates, including investment in
infrastructure and human capital.
The Public Investment Corporation (PIC) is undergoing a difficult but important process that should ultimately see a reinforcement
of its core mandate and reputation as a client-centred investment manager. Although additional fiscal support had to be provided
to SOCs such as Eskom and South African Airways (SAA), the National Treasury is developing stronger oversight mechanisms for
these and other SOCs, as well as crafting a long-run strategy for government in this regard. Accordingly, frameworks for costing the
developmental mandates, private sector participation, and the disposal of non-strategic assets have been developed.
In fulfilling its core fiscal policy mandate, the National Treasury has admirably navigated difficult obligations, including measures to
ensure the public sector wage bill remains within the approved ceilings, and maintaining a contingency reserve for unforeseen fiscal
pressures. In addition, the 2019 Budget contained clear proposals for stabilising the gross government debt, as well as reinforcing the
strategic risk benchmarks for the debt portfolio.
Finally, during this financial year government also took a further step towards a more inclusive economy by enacting the first national
minimum wage in the country’s history. While recognising the need for a more dynamic labour market, the minimum wage is aimed
Deputy Minister of Finance
David Masondo

14
PART A: GENERAL INFORMATION - Continued
at ensuring more equitable compensation for the poorest workers in our economy. Effects on labour market participation will be
carefully monitored, but we take much comfort in the fact that that the appropriateness of this policy is shared by our partners in
the private sector and civil society.
I wish to thank Minister Mboweni for his unerring and courageous guidance and commend the staff of the National Treasury, under
the leadership of DG Mogajane, for their hard work and unceasing commitment to the betterment of the country and all who live
in it.
David MasondoDeputy Minister of Finance
20 September 2019
4. REPORT OF THE DEPUTY MINISTER

15
PART A: GENERAL INFORMATION - Continued
5. REPORT OF THE ACCOUNTING OFFICER
5.1 OVERVIEW OF THE OPERATIONS OF THE DEPARTMENT
Building a South Africa underpinned by democratic principles, free of discrimination and equal in opportunities and access to
economic resources, is a long and arduous journey with many dangers and detours impeding our progress and frustrating our
collective efforts. And yet, it is hardly possible to contemplate any endeavour that is more important; all sectors of South Africa
continue to unite as we celebrate the nation’s 25th anniversary of freedom, refocus our energies and redouble our efforts in
addressing recent challenges and redressing past legacies.
The National Development Plan, which articulates our nation’s shared vision, is built on the premise of a vibrant, inclusive and
growing economy. It is a prerequisite to defeating the triple challenges of unemployment, inequality and poverty, and requisite
to strengthening our democracy to fully realise economic freedom and dignity for the majority of South Africans. South African
economic growth has stubbornly remained below what is needed, with the full fiscal year GDP having expanded by only 0.6
per cent compared to fiscal year 2017/18. The economy was negatively affected by external factors including the slowdown in
economic activity in the Euro Area, escalating global trade tensions, heightened global geopolitics, and higher oil import bills.
Domestically pressure continued to be exerted by the poor performance of agriculture, which contracted by 6.2 per cent as a result
of drought-related difficulties, a slowdown in mining and quarrying, contractions in construction and low demand and productivity
in manufacturing as a whole. Compounding matters further, the economy was negatively impacted by the financial tightening
alongside the normalisation of monetary policy in the larger advanced economies that contributed to a waning of all global growth
momentum as the year progressed. With this weakness expected to persist, the International Monetary Fund (IMF) projects a decline
in growth in 2019 of 70 percent of the global economy. Despite these challenges, positive growth signs were recorded in financial
and business services, food and beverages and manufacturing, with strong exports of motor vehicles and parts.
Confidence, which initially rallied at the start of the financial year, waned during the reporting period in response to the continued
poor economic outlook. Consumption remained weak, with household consumption growing at a modest 1.1 per cent as South
Director-General
Dondo Mogajane

16
PART A: GENERAL INFORMATION - Continued
Africans struggled with relatively high indebtedness, moderate real wage growth and high levels of unemployment. In contrast,
consumption expenditure by government grew at 1.7 per cent. The struggling economy with weak domestic growth has had an
adverse effect on South Africa’s fiscal position. The budget deficit has come in at 0.6 per cent higher than forecast, while gross
government debt rose by 0.5 per cent higher than anticipated. The contraction in public finances continues to exert pressure
on government’s ability to balance the need for public services with constraints in public resources. This has required and will
continue to demand of the public sector to operate in an increasingly complex environment, requiring prioritisation of reliable
public service delivery and strengthening of responsive public administration while continuously ensuring informed, value-for-
money decision-making.
Government, together with all social partners, is responding to these challenges by applying measures to tackle structural constraints
and stimulate growth, restore investor confidence and public trust, reduce policy uncertainty and lower the cost of doing business.
While much remains to be done, progress is being made.
For the National Treasury, our most important contribution has been to ensure fiscal sustainability. The national budget was
prepared and published in a manner that ensured resources allocations met the priorities set by government while adhering to
expenditure containment. Through monitoring the use of scarce public resources by national spending agencies, the efficient and
effective use of these resources has been promoted. Fiscal relations between national, provincial and local spheres of government
was coordinated in advancement of sound budgetary planning at provincial and local spheres of government, as well as building
capacity that will enable efficient and effective management practices. The National Treasury has continued its efforts to renew trust
in public institutions, exercising oversight over state-owned companies with a priority to enabling these institutions to better achieve
government’s policy objectives in a financially and fiscally sustainable manner. Public debt and funding of government’s borrowing
requirements as well as government’s cash resources was optimally managed. Measures to build a transformed financial sector
were further advanced with the development of the necessary Twin Peaks implementation regulations, as well as a comprehensive
prudential and market conduct framework for new authorities. Relevant economic research that informed economic policy and
frameworks was conducted. The National Treasury continued to reinforce a commitment to ethical behaviour and ethical leadership
through various monitoring mechanisms, investigative processes and capacity building initiatives to improve financial management
governance and compliance across all spheres and entities in government, giving effect to the Public Finance Management Act
(PFMA) and the Municipal Finance Management Act (MFMA). Strategic procurement was further developed and implemented, and
initiatives were implemented to modernise and automate government supply chain processes. The National Treasury continues
to work tirelessly to build partnerships and diligently maintain stakeholder relations to optimise and impact results in change-
agent programmes such as the Jobs Fund (employment creation facilitation programme), the Municipal Finance Improvement
Programme (MFIP) and the Cities Support Programme (CSP).
Economic Policy, Tax and Financial Regulation and Research provided specialist policy research, analysis and advisory services in
macroeconomics, microeconomics, taxation and regulatory reform. The research focus for this reporting period was to produce
analysis on both macro- and microeconomic issues to create a supportive environment for job creation. Additional key research
covered areas of analysis on foreign currency reserves, energy choices and capital flows. Tax proposals from the 2018 Budget were
drafted, tabled and legislated, including the significant measure of increasing VAT from 14 per cent to 15 per cent and the identification
of further items for zero-rating. After nine years of consultation, the Carbon Tax Bill was tabled and adopted by Parliament and
enacted into law. The regulations that led to the commencement of the Financial Sector Regulation Act were finalised, which
5. REPORT OF THE ACCOUNTING OFFICER

17
PART A: GENERAL INFORMATION - Continued
creates a new system of financial regulation by establishing a prudential authority and a financial sector conduct authority. The
division provided logistical support to the ministry in implementing the recommendations of the Nugent Commission to rebuild
the capacity of the South African Revenue Service (SARS) as well as continuing to work with the Financial Intelligence Centre to
implement the Financial Intelligence Centre Amendment Act. A World Bank diagnostic report that identified potential shortcomings
in bank conduct and steps to improve market conduct practices in the banking sector was published, and in conjunction with the
Reserve Bank, the National Payment System Act review policy paper was published for public comment.
The Budget Office has led the national budget process effectively during a time of particular fiscal constraints in a stressed
economy. The division oversaw expenditure planning, provided fiscal advice and managed official development assistance, as well
as compiling finance statistics. The budget reform programme was led both interdepartmentally and internationally, as well as
conducting national budget outreach activities that facilitated wide-reaching and informative discussions on budget matters. As
part of improving oversight, national departments’ in-year monitoring reporting and public entities’ quarterly reporting system were
improved and an information dashboard rolled out.
Public Finance oversaw budgetary planning and execution in national departments, provided advice and analysis on sectorial
policies and programmes, meticulously monitored public expenditure, and advised on financial and budgetary aspects of public
policy and spending proposals. Work was done in conjunction with the appropriate departments on the One Stop Border Post
National Framework, reviewing the National Youth Agency Development Act, 2008, cross-border currency solutions, the business
case for the establishment of a state legal services public entity, the evaluation of learner transport and an early grade reading
strategy. Furthermore, in conjunction with the Department of Trade and Industry, work was done on measures to address blockages
in the Unemployment Insurance Fund (UIF), support was provided to the Department of Health and the Presidency in revising the
National Health Insurance Bill (NHI), the projection model for social grants was refined, and with the Department of Small Business
Development the National Treasury participated in the conceptualisation of a small business and innovation fund.
Intergovernmental Relations coordinates fiscal and financial relations between the national, provincial and local spheres of
government. Inputs to the Division of Revenue, the annual Division of Revenue Bill and the draft Policy Framework for Municipal
Borrowing, which proposes reforms to expand the scope of municipal borrowing, were coordinated. The 2019 Division of Revenue
Bill introduced a new conditional grant to fill critical vacancies in the health sector, a new grant structure to enable and incentivise
integrated infrastructure development in intermediate cities and a new incentive component for the Public Transport Network
Grant that rewards cities running a successful public transport system. In addition, a ring fenced funding mechanisms and associated
planning rules for the upgrading of informal settlements were introduced as part of the Human Settlements Development Grant
and the Urban Settlements Development Grant. A number of policies have been updated to encourage and enhance the role of the
private sector in funding municipal infrastructure as well as coordinating efforts to enhance engagements between government and
the private sector. Progress has been made in the process to amend the Municipal Fiscal Powers and Functions Act, 2007, to improve
the regulation of development charges. The Cities Support Programme continued supporting the metropolitan municipalities to
take the lead in economic development. The Cities Support implementation plans identified a number of key programmes that were
embarked on, including introduction of a component on climate Resilience into the Built Environment Performance Plans and the
Executive Leadership Programme for political and administrative heads, focusing on sustainability and resilience of the metros. The
Integrated City Development Grant focused on investment in the identified integration zones, with 12 catalytic programmes being
planned and 10 implemented. There has been a focus on ensuring that all municipal budgets and adjusted budgets are funded.
5. REPORT OF THE ACCOUNTING OFFICER

18
PART A: GENERAL INFORMATION - Continued
To this end, support and guidance was provided to the 17 non-delegated municipalities as well as publishing Circulars 93 and 94
to provide guidance to all municipalities on preparing their 2018/19 Medium Term Revenue and Expenditure Framework budgets.
The National Treasury continued to provide assistance to low-performing municipalities to improve spending and manage their
conditional grants. While much work remains, significant progress has been made in the implementation of the Municipal Standard
Chart of Accounts (mSCOA). In an effort to build a capable state, capacity building continued in the provincial sphere. This included
the piloting of coaching for senior management, essentials of budget formulation and budget analysis, revenue management and
collection and division of revenue. By the end of the financial year, significant progress was made with the North West intervention
by the end of the financial year on directives issued by the National Treasury in relation to budget.
During the period under review, Assets and Liabilities exercised oversight over State-owned Companies (SOCs) to ensure their
alignment with government priorities, financial sustainability and soundness of governance as well as the proactive identification of
possible risks proactively so that appropriate mitigation actions could be taken. To this end, in this reporting period 100 per cent of
Schedule 2 and 3b (SOCs, DFIs and water boards) corporate plans and annual reports received were reviewed within the stipulated
timeframe with analysis conducted, including risk assessment. Government’s gross borrowing requirements were successfully
financed through net issuance of domestic short- and long-term loans and foreign loans. Relations with the sovereign credit rating
agencies were maintained, and government’s contingent liabilities were managed.
The Office of the Accountant-General prepared and tabled the 2017/18 consolidated annual financial statements for the National
Revenue Fund, the Reconstruction and Development Programme Fund, national departments and public entities. Support
was provided to national departments, provincial treasuries, entities and municipalities on accounting and reporting queries,
improvement of audit outcomes, AFS preparation plans and audit action plans. The work of internal audit and risk management in
both the PFMA and MFMA was supported including facilitation of information-sharing platforms, peer interactions and guidance
provided. Implementation of the IFMS remains a challenge for the interdepartmental steering committee that oversees this game-
changing initiative across government. The National Treasury commissioned a forensic investigation into both the IFMS 1 and IFMS 2
contracting processes, and is currently taking the outcomes forward in respect of strengthening various components of organisational
administration and consequence management. Investigative capacity was provided to the state, with 48 forensic investigations
and specialised performance audit reports being conducted. Advisory services were provided to law enforcement agencies and
anti-corruption task teams, with 90 cases referred for criminal investigation. An Irregular Expenditure Framework was developed
to provide procedures that accounting offices and accounting authorities must follow when dealing with irregular expenditure
and to address implementation challenges previously experienced. Capacity building continued to make a significant impact with
the enabling support of donors, including the conclusion of FMIP III and, based on its success, the commitment fund follow-up
Public Financial Management Capacity Development Programme for Improved Service Delivery over 2018-2023, the initiation of
the Procurement, Infrastructure Management and Knowledge Management Capacity Development Programme and the Municipal
Financial Management Technical Assistance Project. Eleven new trainee accountants were recruited into the Chartered Accountants
Academy, nine trainees qualified to attend the support programme towards writing the board exam and eight candidates qualified
as chartered accountants. In total, this programme has developed 63 chartered accountants since its inception. During this reporting
period the MFMA helpdesk continued to provide support and assistance to municipalities and municipal entities on matters from
budgets to supply chain and borrowing to consequence management procedures. Support was provided to 30 municipalities
prioritised for receiving adverse and disclaimer audit opinions, including reviewing the audit action plans and monitoring progress.
Engagements were held with the senior municipal management of the highest 10 contributors to the previous financial year’s
5. REPORT OF THE ACCOUNTING OFFICER

19
PART A: GENERAL INFORMATION - Continued
total unauthorised, irregular and wasteful expenditure. The Municipal Public Accounts Committees’ guide and toolkit were released.
Further support was provided by the Rapid Response Technical Team that assisted nine municipalities with the preparations of their
financial recovery plans.
The Office of the Chief Procurement Officer continued to exercise oversight over compliance to SCM policies, procedures, norms and
standards. Procurement plans, deviations and contract expansions to departments and public entities continued to be published in
a continual effort to strengthen transparency in public sector procurement. Sourcing strategies were developed and implemented,
22 transversal contracts were renewed and the business case for a government online travel booking system was approved. An
e-Education Procurement and Delivery Management Framework was developed and the existing Standard for Infrastructure
Procurement and Delivery Management was reviewed and better aligned to the Infrastructure Delivery Management System.
Significantly, the Public Procurement Bill was finalised and awaits Cabinet approval for public comment as well as the finalisation of
the contract management framework for all of government.
International Financial Relations successfully supported the Minister of Finance in his newly established role of budget oversight
at the African Union through the Committee of Fifteen Finance Ministers, having achieved a 12 per cent year-on-year saving on
the AU budget. Progress was made in the work of the Southern African Customs Union, and in particular the review of the 2002
SACU agreement with the aim of putting the union on a development path. South Africa successfully chaired the Southern African
Development Community for a 12-month period from August 2017. Participation in the OECD, World Economic Forum, G20, IMF and
the World Bank continued with benefits impacting positively on advancing the interests of South Africa and Africa internationally.
Significantly, South Africa co-hosted the Africa Investment Forum with the African Development Bank in support of the President’s
US$100 billion investment mobilisation. Furthermore, South Africa assumed the chair of the New Development Bank board of
governors and hosted their fourth annual meeting.
The civil and military pension contributions to funds and other benefits continue to provide pension and post-retirement medical
benefits to former employees of state departments and bodies, as well as providing similar benefits to retired members of the
military. Concerning client data, a figure of 100 per cent integrity was achieved as well as for customer service complaints responded
to within seven days. This contributed to the achievement of 99 per cent of benefits being paid out within liable dates.
The Government Technical Advisory Centre (GTAC) continued to work towards the building and strengthening of a capable, ethical
and developmental orientated state with capacity to work with the private sector in promoting growth, employment, infrastructure
investment and public service delivery. Support was provided in assisting the National Treasury in conceptualising the budget facility
for infrastructure as part of the ongoing reform process. A total of 56 project proposals were received in response to the second call
for submissions under the BFI initiative, of which 32 were selected for detailed analysis by the GTAC with recommendations. Eighty
projects aimed at building institutional capacity of client departments were supported. Twenty-six transactional advisory projects
were registered, and reviews of public private partnership assessments were completed. The Municipal Finance Improvement
Programme (MFIP) procured and deployed 69 technical advisers to provide support to departments and enhance programme
management capabilities. The 8th call for proposals was completed, with 43 of the 214 concept note applications invited
to submit a full business case application. The Jobs Fund has approved 152 projects since its inception. The Cities Support
Programme continues to make significant impact, with the delivery of an Executive Leadership Programme to both political and
administrative heads of metros.
5. REPORT OF THE ACCOUNTING OFFICER

20
PART A: GENERAL INFORMATION - Continued
5.2 OVERVIEW OF THE FINANCIAL RESULTS OF THE DEPARTMENT
5.2.1 DEPARTMENTAL RECEIPTS
The table below provides a breakdown of the sources of revenue and performance for the 2018/19 financial year.
Table 1: Source of Revenue
DEPARTMENTAL RECEIPTS
2017/18 2018/19
ESTIMATEACTUAL
AMOUNT COLLECTED
(OVER)/UNDER COLLECTION
ESTIMATEACTUAL
AMOUNT COLLECTED
(OVER)/UNDER COLLECTION
R’000 R’000 R’000 R’000 R’000 R’000
Tax Receipts - - - - - -
Sale of goods and services
other than capital assets31 728 116 648 (84 920) 119 379 125 379 (6 000)
Interest, dividends and rent
on land2 988 602 3 325 439 (336 837) 3 260 761 6 830 187 (3 569 426)
Sale of capital assets 659 683 (24)
-
-
-
Financial transactions in
assets and liabilities1 090 340 988 002 102 338 260 500 158 157 102 343
Total 4 111 329 4 430 772 (319 443) 3 640 640 7 113 723 (3 473 083)
The revenue received on the interest and dividends item relates to 96% of the department’s total revenue.
Sale of goods and services
The higher amount of R6 million is mainly due to an increase in guarantee fees collected from South African Airways (SAA), South African National Roads Agency Limited (SANRAL).
Interest
The highest amount of revenue received for the department is interest received from the four commercial banks as well as from the newly introduced CITI Bank. An amount of R3,7 billion was also received from the South African Reserve Bank on foreign currency
deposits that increased the revenue projected.
5. REPORT OF THE ACCOUNTING OFFICER

21
PART A: GENERAL INFORMATION - Continued
Financial transactions
The deficit of R102 343 is due to lesser than anticipated surplus funds received from entities.
5.2.2 PROGRAMME EXPENDITURE
The table below provides a high-level comparison of 2017/18 versus 2018/19 of the expenditure incurred by the Department
against appropriated funds.
Table 2: Payment expenditure made by programmes for the period 1 April 2018 to 31 March 2019
PROGRAMME 2017/18 2018/19
FINAL APPROPRIATION
ACTUAL EXPENDITURE
(OVER)/ UNDER EXPENDITURE
FINAL APPROPRIATION
ACTUAL EXPENDITURE
(OVER)/ UNDER EXPENDITURE
R’000 R’000 R’000 R’000 R’000 R’000
Administration 445 620 437 869 7 751 453 819 424 274 29 545
Economic Policy
Tax Financial
Regulation and
Research
163 991 151 860 12 131 152 770 138 756 14 014
Public Finance
and Budget
Management
302 296 288 635 13 661 298 047 295 370 2 677
Asset and
Liability
Management
10 100 312 10 089 761 10 551 101 585 91 185 10,400
Financial
Accounting and
Supply Chain
Management
Systems
1 000 846 885 833 115 013 1 102 085 869 104 232 981
International
Financial
Relations
5 940 689 5 469 838 470 851 5 883 121 5 807 686 75 435
5. REPORT OF THE ACCOUNTING OFFICER

22
PART A: GENERAL INFORMATION - Continued
PROGRAMME 2017/18 2018/19
FINAL APPROPRIATION
ACTUAL EXPENDITURE
(OVER)/ UNDER EXPENDITURE
FINAL APPROPRIATION
ACTUAL EXPENDITURE
(OVER)/ UNDER EXPENDITURE
R’000 R’000 R’000 R’000 R’000 R’000
Civil and
Military
Pensions
Contributions
to Funds and
Other Benefits
4 648 202 4 618 088 30 114 5 021 277 5 020 100 1 177
Technical
Support and
Development
Finance
2 558 513 2 526 350 32 163 2 926 779 2 235 067 691 712
Revenue
Administration
10 218 198 10 218 198 - 9 007 217 9 007 217 -
Financial
Intelligence and
State Security
5 105 639 5 105 639 - 4 763 533 4 763 533 -
Total 40 484 306 39 792 071 692 235 29 710 233 28 650 931 1 057 941
The Department spent 96.4% of its appropriated funds. The underspending of R1.1 billion had no negative impact on attaining
predetermined objectives, as processes were constantly assessed in order to improve spending effectiveness and efficiency. 60% of
the total underspending represents unspent funds of R400 million on the Development Bank Southern Africa (DBSA) Infrastructure
funds which were not transferred due to pending Memorandum of Agreement and the Business case.
PROGRAMME 1
The programme has spent 93.5% of its R453.8 million budget for the 2018/19 financial year. Underspending of R4.1 million on
compensation of employees was mainly due to vacant posts not being filled. Savings of R12.2 million on goods and services items
such as computer services, consultancy services, contractors, stationary and travel costs were mainly due to implementation of the
cost containment measures. Underspending of R9.1 million on machinery and equipment mainly due to the pending procurement
of wireless infrastructure for the Centurion building as well as upgrading the current obsolete wireless infrastructure in Cape Town,
240 Madiba Street and 40 Church Buildings.
5. REPORT OF THE ACCOUNTING OFFICER

23
PART A: GENERAL INFORMATION - Continued
PROGRAMME 2
The programme has spent 90.8% of its R152.8 million budget for the 2018/19 financial year. Unspent funds of R7.9 million on transfer
and subsidies was mainly due to transfer payment to the Economic Research Southern Africa (ERSA) which did not materialise as a
result of discontinuation of the research. Underspending of R5.7 million on compensation of employees was mainly due to vacant
posts not being filled. The saving of R600 000 on various items mainly due to implementation of cost containment measures.
PROGRAMME 3
The programme has spent 99.1% of its R298 million budget for the 2018/19 financial year. The Underspending of R601 000 on
compensation of employees was mainly due to vacant posts that haven’t been filled. Furthermore, the saving of R1.3 million on goods
and services was on various items such as bursaries, catering, entertainment, travel and stationery mainly due to implementation
of cost containment measures. Underspending of R800 000 on machinery and equipment due to non-replacement of obsolete
equipment.
PROGRAMME 4
The programme has spent 89.8% of its R101.6 million budget for the 2018/19 financial year. Underspending of R4.9 million on
compensation of employees was mainly due to vacant posts not being filled. Underspending of R5.5 million on goods and
services was mainly due delays in the appointment of a consultant to assist with the completion of the final phase of the ALM
Back Office System as well as the tender issuance process for a new support, maintenance and enhancement contract for the
ALM Back Office System.
PROGRAMME 5
The programme has spent 78.9% of its R1.1 billion budget for the 2018/19 financial year. Underspending of R227.8 million on
goods and services was mainly on the Integrated Financial Management Systems (IFMS) project relating to the rescheduling of
the procurement of various services. Underspending of R4.5 million on machinery and equipment was due to non-replacement of
system servers for transversal systems.
PROGRAMME 6
The programme has spent 98.7% of its R5.9 billion budget for the 2018/19 financial year. Saving of R56 million on payment of
financial assets was mainly due to saving realised on payment to New Development Bank (NDB) and African Development Bank
(AfDB) as a result of foreign exchange rate difference. Saving of R15.6 million on transfers and subsidies was mainly on Common
Monetary Area (CMA) compensation due to less than anticipated yield on the South African long-term bonds. The underspending
of R1.5 million on compensation of employees was mainly due to vacant posts not being filled. Saving of R1.8 million on goods and
services on various items mainly due to implementation of the cost containment measures.
5. REPORT OF THE ACCOUNTING OFFICER

24
PART A: GENERAL INFORMATION - Continued
PROGRAMME 7
The programme has spent 100% of its R5 billion budget for the 2018/19 financial year. The expenditure on the programme was on
par with the budgeted amount with immaterial variance.
PROGRAMME 8
The programme has spent 76.4% of its R2.9 billion budget for the 2018/19 financial year. Underspending of R418 million on goods
and services was mainly due to R400 million on the Development Bank Southern Africa (DBSA) Infrastructure funds which were not
transferred due to pending Memorandum of Agreement and the Business Case and R11.6 million mainly on Jobs Fund operational
expenditure which experienced delays in appointing service providers in the Job Fund operational budget. The underspending of
R226 million on transfers and subsidies was mainly on the Jobs Fund grant disbursement due to lower than projected disbursements
by the Jobs Fund Partners for the current financial year.
PROGRAMME 9
The programme has transferred 100% of its R9 billion budget for the 2018/19 financial year.
PROGRAMME 10
The programme has transferred 100% of its R4.7 billion budget for the 2018/19 financial year.
5.2.3 VIREMENTS/ROLLOVERS
The department had virements totalling R340.3 million between various programmes which experienced financial shortages and
surpluses. The virement process was conducted during the 2018/19 year-end process through reprioritisation, where funds from
under-performing programmes-“Surplus funds” were redirected to financially struggling programmes- “Shortages”.
In summary, the significant virements per programme were as follows:
• R20 million from Programme 1 to Programme 6.
• R92 million from Programme 5 to Programme 6.
• R142.5 million from Programme 7 to Programme 6, and
• R85.8 million from Programme 8 to Programme 6.
No rollovers were requested by the Department.
5.2.4 UNAUTHORISED EXPENDITURE
The National Treasury did not incur any unauthorised expenditure during the year under review.
5. REPORT OF THE ACCOUNTING OFFICER

25
PART A: GENERAL INFORMATION - Continued
5.2.5 IRREGULAR EXPENDITURE
The department incurred irregular expenditure of R465.9 million during the year under review and the main contributors were:
• R140.9 million on transfer of the Municipal Finance Improvement Programme (MFIP) funds to Government Technical Advisory
Centre (GTAC) was not approved by the Accounting Officer.
• R185 million was incurred for the maintenance and support of the legacy systems (BAS, PERSAL, LOGIS and VULINDLELA).
5.2.6 FRUITLESS AND WASTEFUL EXPENDITURE
As reported in the previous financial year, the National Treasury procured software licences for the Integrated Financial Management
System (IFMS) and was required to pay an annual fee for the technical support and maintenance.
Fruitless and wasteful expenditure of R68 million was incurred due to the payment of the Integrated Financial Management System
(IFMS) for technical support and maintenance.
5.2.7 SUPPLY CHAIN MANAGEMENT
The National Treasury does not use the unsolicited bid process.
The National Treasury experienced challenges in the areas of supply chain management (SCM) procedures, policies and systems
during the 2018/19 financial year due to non-compliance. Measures to strengthen the SCM control environment includes conducting
a gap-analysis by assessing the current practices, policies, procedures and relevant information as it pertains to the department’s
SCM environment, identifying weakness areas and make improvement recommendations.
Based on the outcome of the gap analysis, the following improvement activities are underway:
• Review and institutionalisation of the entire SCM system policy,
• Development and institutionalisation of frameworks, mechanisms, procedures, manuals and application tools specifically
addressing:
• Demand Management and procurement planning,
• Acquisition management processes and procedures,
• Contract management and administration inclusive of a reformed contracts and commitment register, and
• Development of an improved performance and risk management mechanism inclusive of monitoring and reporting tools and an
updated SCM risk register focusing on both operational and procedural risks.
5.2.8 NON-ADJUSTING EVENTS AFTER THE REPORTING DATE
Eskom is under the control of the Department of Public Enterprises. However, on 2 April 2019 the Minister of Finance approved that
Section 16 (1) of the PFMA be invoked to transfer R17.652 million to Eskom to meet its obligations and to avoid a call on its existing
government guarantees by 30 May 2019. Transfers were made through the bank account of the National Treasury in accordance
with the cash flow requirements of Eskom. On 2 April 2019 R5 billion was transferred and on 29 April 2019 a further R8.5 billion.
As at 31 May 2019 the National Treasury has transferred a total of R13.5 billion to Eskom. Details on how the Department of Public
5. REPORT OF THE ACCOUNTING OFFICER

26
PART A: GENERAL INFORMATION - Continued
Enterprises envisaged to manage Eskom to remain financially viable can be obtained from the Annual report of the Department of
Public Enterprises.
5.2.9 OTHER MATTERS
Included under note 26 in the Annual Financial Statements is the Irregular Expenditure of R75 million out of a total of R465.9 million.
The amount of R75 million relates to transfers made to GTAC as an implementing agent in terms of the Principal-Agent relationship
since 2014.
APPRECIATION AND CONCLUSION
I wish to thank the NT team, who with dedication and professionalism are committed to the building of a public service worthy of
the democracy we envision. They serve with confidence, courage and compassion. I extend my gratitude towards Minister Mboweni
and Deputy Minister Masondo for their leadership, clarity and determination in guiding and shaping consensus in critical national
debates on matters as far-reaching and wide-ranging as the fiscal framework, SOCs and economic growth.
Dondo Mogajane Accounting Officer
Date: 17 September 2019
5. REPORT OF THE ACCOUNTING OFFICER

27
PART A: GENERAL INFORMATION - Continued
6. STATEMENT OF RESPONSIBILITY AND CONFIRMATION OF ACCURACY FOR THE ANNUAL REPORT
To the best of my knowledge and belief, I confirm the following:
All information and amounts disclosed throughout the annual report are consistent. The annual report is complete, accurate and is
free from any omissions.
The annual report has been prepared in accordance with the guidelines on the annual report as issued by the National Treasury.
The annual financial statements (Part E) have been prepared in accordance with the modified cash standard and the relevant
frameworks and guidelines issued by the National Treasury.
The Accounting Officer is responsible for the preparation of the annual financial statements and for the judgements made in this
information.
The Accounting Officer is responsible for establishing and implementing a system of internal control that has been designed to
provide reasonable assurance as to the integrity and reliability of the performance information, the human resources information
and the annual financial statements.
The external auditors are engaged to express an independent opinion on the annual financial statements.
In my opinion, the annual report fairly reflects the operations, the performance information, the human resources information and
the financial affairs of the department for the financial year ended 31 March 2019.
Yours faithfully
Dondo Mogajane Accounting Officer
Date: 6 September 2019

28
PART A: GENERAL INFORMATION - Continued
7. STRATEGIC OVERVIEW
7.1 VISION
The National Treasury is the custodian of the nation’s financial resources. We hold ourselves accountable to the nation to discharge
our responsibilities professionally and with humility, with the aim of promoting growth and prosperity for all.
We aspire to excellence in the quality of our analysis and advice, and in the execution of our financial management responsibilities.
We aim to realise the full potential of South Africa’s economy and people and to mobilise the resources of the state, business
enterprises and the wider community in a partnership of trust and mutual respect.
7.2 MISSION
The National Treasury supports economic growth and development, good governance, social progress and rising living standards
through the accountable, economic, efficient, equitable and sustainable management of South Africa’s public finances, maintenance
of macroeconomic and financial sector stability and effective financial regulation of the economy.
7.3 VALUES
As custodian of the nation’s financial resources, the National Treasury acknowledges the authority of Parliament through whom we
are accountable to the nation. We value teamwork, sound planning and enthusiasm, and strive continually to improve the quality,
accuracy and reliability of our service delivery. Our people are our most valued assets. We seek to be an employer of choice, we invest
in the education and training of our staff, we cultivate a learning and consultative environment, we make use of the best available
technological support and we aim to mobilise the full potential of our people.
In our dealings with the public and with our colleagues, we act transparently and with integrity, showing respect and demonstrating
fairness and objectivity. In achieving these things, we will honour the faith that the South African public has placed in us.

29
PART A: GENERAL INFORMATION - Continued
8. LEGISLATIVE AND OTHER MANDATES
The National Treasury’s legislative mandate is based on Chapter 13, Section 216(1) of the Constitution, which calls for the establishment
of a national treasury to ensure transparency, accountability and sound financial controls in the management of the country’s public
finances. This role is further elaborated in the Public Finance Management Act, 1999 (Act No. 1 of 1999) (PFMA) and the Municipal
Finance Management Act, 2003 (Act No. 56 of 2003).
The department is mandated to promote the national government’s fiscal policy and the coordination of macroeconomic policy;
ensure the stability and soundness of the financial system and financial services; coordinate intergovernmental financial and fiscal
relations; manage the budget preparation process; and enforce transparency and effective management in respect of revenue and
expenditure, assets and liabilities, public entities and constitutional institutions. Accordingly, there have been no significant changes
to the National Treasury’s legislative and other mandates.
8.1 PARLIAMENTARY SERVICE
The Minister of Finance, as the political principal of the department, regards active collaboration with Parliament as vital. The
National Treasury will continue to maintain good relations with parliamentary committees during the period ahead, including the
Standing Committee on Finance, the Select Committee on Finance, the Standing Committee on Public Accounts, and the Standing
Committee on Appropriations.

30
PART A: GENERAL INFORMATION - Continued
9. ORGANISATIONAL STRUCTURE
Minister of Finance
TT Mboweni (MP)
Stadi Mngomezulu
Malijeng Ngqaleni
Anthony Julies
Ismail Momoniat
Willie Mathebula
Vuyelwa Vumendlini
Mampho Modise
Duncan Pieterse
Ian Stuart
Zanele Mxunyelwa
Deputy Minister of Finance
David Masondo (MP)Director-General
Dondo Mogajane
31
PART A: GENERAL INFORMATION - Continued
9. ORGANISATIONAL STRUCTURE
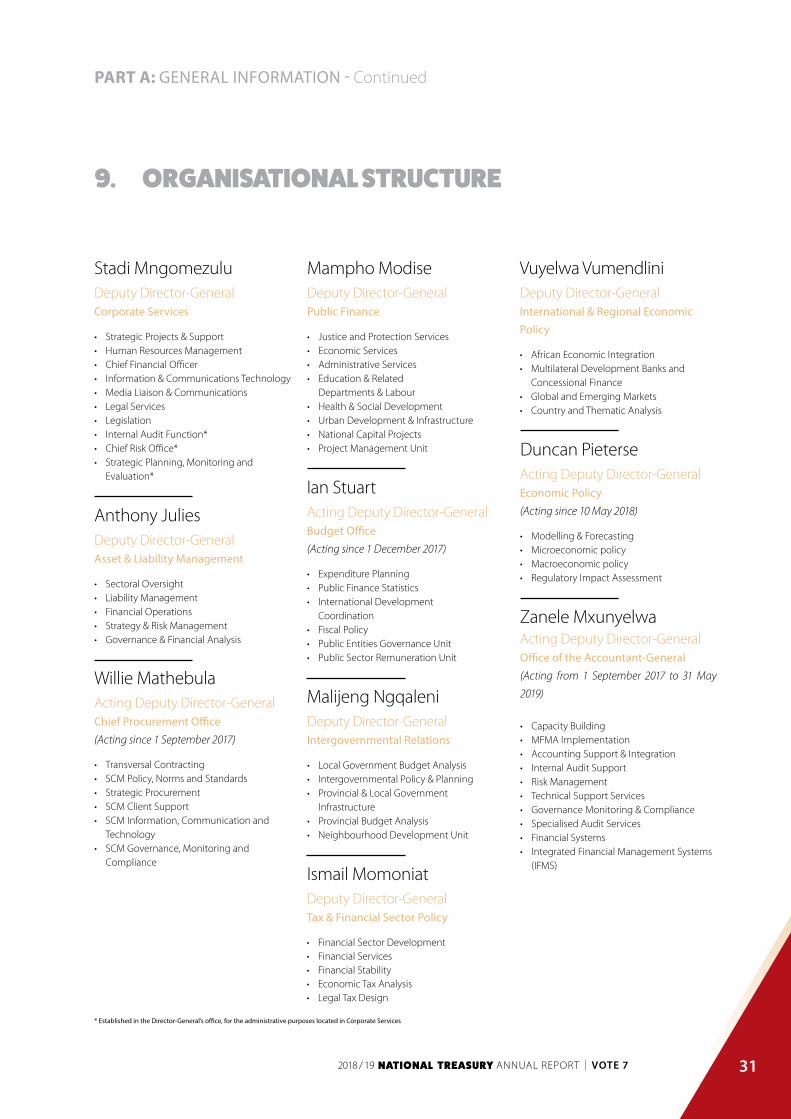
Deputy Director-GeneralCorporate Services
• Strategic Projects & Support• Human Resources Management • Chief Financial Officer • Information & Communications Technology• Media Liaison & Communications• Legal Services• Legislation• Internal Audit Function*• Chief Risk Office*• Strategic Planning, Monitoring and
Evaluation*
Stadi Mngomezulu Mampho ModiseDeputy Director-GeneralPublic Finance
• Justice and Protection Services • Economic Services • Administrative Services • Education & Related
Departments & Labour • Health & Social Development • Urban Development & Infrastructure • National Capital Projects• Project Management Unit
Ian StuartActing Deputy Director-General Budget Office(Acting since 1 December 2017)
• Expenditure Planning • Public Finance Statistics • International Development
Coordination • Fiscal Policy • Public Entities Governance Unit • Public Sector Remuneration Unit
Duncan PieterseActing Deputy Director-General Economic Policy(Acting since 10 May 2018)
• Modelling & Forecasting • Microeconomic policy • Macroeconomic policy• Regulatory Impact Assessment
Malijeng NgqaleniDeputy Director-General Intergovernmental Relations
• Local Government Budget Analysis • Intergovernmental Policy & Planning • Provincial & Local Government
Infrastructure • Provincial Budget Analysis• Neighbourhood Development Unit
Zanele MxunyelwaActing Deputy Director-General Office of the Accountant-General(Acting from 1 September 2017 to 31 May
2019)
• Capacity Building • MFMA Implementation • Accounting Support & Integration • Internal Audit Support • Risk Management • Technical Support Services • Governance Monitoring & Compliance • Specialised Audit Services• Financial Systems • Integrated Financial Management Systems
(IFMS)
Vuyelwa VumendliniDeputy Director-General International & Regional Economic Policy
• African Economic Integration • Multilateral Development Banks and
Concessional Finance • Global and Emerging Markets• Country and Thematic Analysis
Anthony JuliesDeputy Director-GeneralAsset & Liability Management
• Sectoral Oversight • Liability Management • Financial Operations • Strategy & Risk Management • Governance & Financial Analysis
Willie MathebulaActing Deputy Director-GeneralChief Procurement Office(Acting since 1 September 2017)
• Transversal Contracting • SCM Policy, Norms and Standards • Strategic Procurement• SCM Client Support• SCM Information, Communication and
Technology• SCM Governance, Monitoring and
ComplianceIsmail MomoniatDeputy Director-General Tax & Financial Sector Policy
• Financial Sector Development • Financial Services • Financial Stability • Economic Tax Analysis • Legal Tax Design
* Established in the Director-General’s office, for the administrative purposes located in Corporate Services

32
PART A: GENERAL INFORMATION - Continued
10. PUBLIC ENTITIES REPORTING TO THE MINISTER
Sixteen entities report to the Minister of Finance through governance arrangements that give each entity autonomy but also enable
them to align their strategies with government policy. Eight of these entities - the Accounting Standards Board (ASB), the Co-
operative Banks Development Agency (CBDA), the Financial and Fiscal Commission (FFC), the Financial Intelligence Centre (FIC), the
Government Technical Advisory Centre (GTAC), the Independent Regulatory Board for Auditors (IRBA), the Office of the Tax Ombud
(OTO) and the South African Revenue Service (SARS) - receive transfers from the National Treasury.
The remaining eight are self-funded and generate their own revenue. They are the Financial Sector Conduct Authority (FSCA),
the Financial Advisory and Intermediary Services Ombud (FAIS Ombud), the Office of the Pension Funds Adjudicator (OPFA), the
Government Pensions Administration Agency (GPAA), the Development Bank of Southern Africa (DBSA), the Public Investment
Corporation (PIC), the Land and Agricultural Development Bank of South Africa (Land Bank) and the South African Special Risks
Insurance Association (SASRIA). Each entity develops and reports on its own strategic plan or corporate plan. The reporting on the
performance of the 16 entities describes the broad approach of each and how their work relates to the National Treasury’s strategic
objectives, which are in turn aimed at achieving the goals of the National Development Plan (NDP).

33
PART A: GENERAL INFORMATION - Continued
10. PUBLIC ENTITIES REPORTING TO THE MINISTER
ACCOUNTING STANDARDS BOARD (ASB)
(SCHEDULE 3A: NATIONAL PUBLIC ENTITY)
The ASB’s legislative mandate is to develop uniform standards of Generally Recognised Accounting Practice (GRAP) for all spheres of
government in terms of Section 216(1)(a) of the Constitution and the Public Finance Management Act, 1999 (Act No. 1 of 1999), as
amended. The ASB has to promote accountability, transparency and the effective management of revenue, expenditure, assets and
liabilities of the entities to which the standards of GRAP apply.
The ASB’s key achievements during the year under review include the following:
• The ASB issued guidance on how to account for landfill sites (both the asset and the obligations) and the treatment of adjustments
to revenue already recognised by an entity.
• The ASB issued guidance on applying materiality to ensure that the key users of financial statements and their information needs
are identified.
• The ASB issued an amended standard of GRAP on financial instruments to align it with the equivalent international private and
public sector standards.
• The Minister of Higher Education and Training determined that community education and training colleges should apply
standards of GRAP when preparing annual financial statements.
• The board assessed the effectiveness of amendments made to the standards of GRAP on investment property and property, plant
and equipment made based on the board’s post-implementation review in 2014.
• The board issued a response to eight frequently asked questions, hosted eight Public Sector Accounting Forum meetings and
submitted five articles to relevant accounting journals for publication.
• The ASB has received clean audit opinions every year since its establishment in October 2002.
CO-OPERATIVE BANKS DEVELOPMENT AGENCY (CBDA)
(SCHEDULE 3A: PUBLIC ENTITY)
The CBDA was established in terms of the Co-operative Banks Act, 2007 (Act No. 40 of 2007). The CBDA’s mandate is to create a strong
and vibrant cooperative banking sector. The biggest highlight was the implementation of the Financial Sector Regulation Act (FSRA).
The FSRA brings into effect the Twin Peaks framework i.e. having a prudential regulator, which will be known as the Prudential
Authority (PA), with the mandate of promoting and enhancing the safety and soundness of financial institutions, which include
cooperative banks and cooperative financial institutions (CFIs) as defined in the Co-operative Banks Act; to promote and enhance
the safety and soundness of market infrastructure; to protect financial customers against the risk of financial institutions failing to
meet their obligations; and to assist in maintaining financial stability.

34
PART A: GENERAL INFORMATION - Continued
The CBDA’s achievements during the year under review include the following:
• Ten CFIs are using the banking platform and are now fully functional on the system.
• In the year under review, 15 presentations were made to interested groups.
• R9.5 million was sourced from key stakeholders with a similar mandate to assist the CBDA in achieving its objective.
• The National Association of Co-operative Financial Institutions of South Africa (NACFISA) was registered as a representative body.
• ABSA was appointed as the banking partner for connecting to the National Payment System (NPS).
• The CBDA developed financial management and compliance management tools for enhancing CFI performance.
• The CBDA conducted 30 investor education workshops as part of CFI member education with the assistance of the Financial
Sector Conduct Authority.
OFFICE OF THE OMBUD FOR FINANCIAL SERVICES PROVIDERS (FAIS OMBUD)
(SCHEDULE 3A: NATIONAL PUBLIC ENTITY)
The FAIS Ombud was established in terms of Section 20 of the Financial Advisory and Intermediary Services Act, 2002 (Act No. 37
of 2002) (FAIS Act). The FAIS Ombud is a Schedule 3A entity in terms of the PFMA and reports to the board of the Financial Sector
Conduct Authority. Its mandate to resolve complaints in an economical, informal and expeditious manner flows from Section 20 of
the FAIS Act. A further mandate is derived from the Financial Services Ombud Schemes Act, 2004 (Act No. 37 of 2004).
Key achievements for the year under review include the following:
• During the 2018/19 financial year, the Ombud’s office received 9 323 complaints.
• The number of new complaints settled in favour of the complainant increased by 37 per cent from 883 during 2017/18 to 1 209
during 2018/19.
• Overall, the total number of complaints resolved (inclusive of complaints from all financial years) during the 2018/19 financial year
was 9 954.
• Once again, the number of complaints settled increased, rising from 1 392 during 2017/18 to 1 871 during 2018/19, an increase
of 34 per cent.
• This was the first time that this office achieved a settlement ratio of 30 per cent or more, which compares favourably with industry
standards.
10. PUBLIC ENTITIES REPORTING TO THE MINISTER

35
PART A: GENERAL INFORMATION - Continued
FINANCIAL AND FISCAL COMMISSION (FFC)
(SCHEDULE 1: CONSTITUTIONAL INSTITUTION)
The Financial and Fiscal Commission (FFC) derives its mandate from Chapter 13, Section 220 of the Constitution of the Republic
of South Africa Act, 1996 (Act No. 108 of 1996) (as amended). In addition, the FFC’s functions are also encompassed in Sections
214(2), 221, 222, 228 (2) (b), 229 (5), 230(2), and 230A (2) of the Constitution which provide, among others, that the commission is an
independent and impartial advisory state institution that government has to consult on the division of revenue among the three
spheres of government and in the enactment of legislation pertaining to provincial taxes, municipal fiscal powers and functions, and
provincial and municipal loans.
The FFC’s achievements in the year under review include the following:
• Timely delivery of all constitutional and legislative submissions, namely the FFC’s submission on the Division of Revenue 2019/20,
response to the 2018 Medium Term Budget Policy Statement, response to the Division of Revenue Bill and Appropriation Bill as
tabled by the Minister of Finance in 2019.
• The FFC’s annual submission for the 2019/20 Division of Revenue was tabled in Parliament on 31 May 2018 with the title: Re-
engineering the intergovernmental fiscal relations system for national development in a fiscally constrained environment.
FINANCIAL INTELLIGENCE CENTRE (FIC)
(SCHEDULE 3A: NATIONAL PUBLIC ENTITY)
The FIC was established in terms of the Financial Intelligence Centre Act, 2001 (Act 38 of 2001). The FIC Act works in concert with
the Prevention of Organised Crime Act, 1998 (Act 121 of 1998), the Protection of Constitutional Democracy Against Terrorist and
Related Activities Act, 2004 (Act 33 of 2004), the South African Police Service Act, 1995 (Act 68 of 1995) and the National Strategic
Intelligence Act, 1994 (Act 39 of 1994).
The FIC’s achievements in the year under review include the following:
• The FIC conducted 17 FICA compliance awareness initiatives and 138 inspections on accountable and reporting institutions, and
undertook 68 joint inspections with other supervisory bodies.
• The number of institutions registered with the FIC increased from 40 799 in 2017/18 to 42 353 in 2018/19.
• The FIC referred 1 059 matters for further investigation and responded to 1 840 requests for financial intelligence.
• The FIC blocked R53.5 million as suspected proceeds of crime, and contributed to 29 judicial actions and the recovery of
R2.14 billion in criminal proceeds.
10. PUBLIC ENTITIES REPORTING TO THE MINISTER

36
PART A: GENERAL INFORMATION - Continued
FINANCIAL SECTOR CONDUCT AUTHORITY (FSCA)
(SCHEDULE 3A: NATIONAL PUBLIC ENTITY)
The Financial Sector Conduct Authority (FSCA) is a market conduct regulator that commenced operating on 1 April 2018 in terms
of the Financial Sector Regulation (FSR) Act, 2017 (Act No. 9 of 2017). The FSCA focuses exclusively on regulating and supervising
the conduct of entities that provide the financial products and services set out in the FSR Act. This includes: 1) the non-banking
financial services industry (retirement funds, short- and long-term insurance companies, collective investment schemes, investment
institutions, and financial advisors and brokers; and 2) banking and services related to credit as well as the buying and selling of
foreign exchange. Crucially, the FSCA objectives include financial inclusion and transformation of the financial sector.
Highlights of the year under review include the following:
• The FSCA published its regulatory strategy that charts its trajectory as the country’s first dedicated financial conduct regulator
over the next three years.
• The FSCA undertook an organisational redesign and capacity building programme and made key appointments to the executive
team. A new activity-based functional operational structure and business model was designed to meet the needs of the expanded
jurisdiction of the FSCA and the intrusive regulatory approach envisaged in the act.
• The FSCA provided support in the development of the Conduct of Financial Institutions (CoFI) Bill, which will be the second piece
of legislation in the Twin Peaks regulatory architecture (the first being the FSR Act).
• The FSCA held 14 workshops for small and emerging financial service providers (FSPs) and 6 specialised training workshops for
candidates attempting FAIS exams, and took on 25 unemployed graduates as interns and learner trainees.
• The FSCA featured in 12 high-profile interviews and conducted 4 media round table discussions. The introduction of social media
has also increased the FSCA’s footprint – during the Money Smart Week 2018 campaign a total of 2.6 million impressions were
made on Facebook, Instagram, LinkedIn and YouTube.
• The FSCA implemented a total of 303 activities reaching about 440 000 consumers, and engaged with 107 stakeholders. As part
of its consumer education programme, the FSCA held 190 workshops and 19 exhibitions, and produced 10 research, monitoring
and evaluation (M&E) reports.
• During the year, the FSCA finalised 18 investigations. In some of these cases administrative penalties were levied; these amounted
to R31 440 000 for the year.
GOVERNMENT PENSIONS ADMINISTRATION AGENCY (GPAA)
(GOVERNMENT COMPONENT)
GPAA is a government component with the mandate to provide benefits administration services on behalf of its two customers, the
Government Employees Pension Fund (GEPF) and National Treasury’s Programme 7 funds. The establishment of this organisation
was gazetted in March 2010 in terms of Section 7A (4) of the Public Service Act of 1994 (Proclamation No. 103 of 1994). The provision
10. PUBLIC ENTITIES REPORTING TO THE MINISTER

37
PART A: GENERAL INFORMATION - Continued
of benefits administration services is regulated by service level agreements (SLAs) with both the GEPF and National Treasury. The
benefits administration services include the processing and paying of benefits and claims to clients who are pensioners, members,
spouses and orphans. All this is done in accordance with the Government Employees Pension (GEP) Law of 1996 and several other
pieces of legislation which fall under the ambit of National Treasury’s Programme 7 funds and schemes.
Notable achievements during the year under review include the following:
• An average of 93 per cent (National Treasury 99 per cent and GEPF 86 per cent) of benefits were paid on time upon the receipt of
duly completed documentation.
• An average of 94% customer satisfaction was achieved on services rendered to clients through various service channels across
the country.
• Mobile sites visited around the country totalled 848, with over 89 000 clients served.
• Contributions received amounted to R74.9 billion (compared to R71.4 billion in the previous financial year), with a total membership
of 1.26 million (compared to 1.27 million in the previous financial year).
• A total of 70 995 claims were received (compared to 73 957 in 2017/2018) and a total of 68 401 of these claims were paid
(compared to 73 336 in 2017/2018).
• The Self-Service functionality was successfully rolled out to over 18 000 members. It focused on authentication of the members
and providing electronic access to benefit statements.
• The GEPF’s new Child’s Pension was introduced on 1 June 2018 to replace the old Orphan’s Pension. This development was aimed
at bridging the gaps identified in the implementation of the Orphan’s Pension.
GOVERNMENT TECHNICAL ADVISORY CENTRE (GTAC)
(GOVERNMENT COMPONENT)
The GTAC was promulgated with effect from 30 March 2012 and began functioning as a government component in April 2014.
Its primary purpose is to assist organs of state build their capacity for efficient, effective and transparent financial management.
It stimulates debate and promotes discourse in the public economics space, using a range of communications and knowledge
management approaches to optimise learning across the public sector. Over the last financial year, the GTAC has remained a service
provider of choice in delivering value for money in advisory and support projects to all three spheres of government
.
Key highlights achieved during the year under review include the following:
• Eighty-three technical advisory projects were supported in the economic development and social development clusters which
included inter-governmental infrastructure delivery support, macro institutional support, organisational strengthening services,
and service delivery effectiveness and efficiency support.
• Public Expenditure and Policy Analysis (PEPA) has developed twenty-eight performance expenditure reviews (PERs) infographics
and provided a provincial baseline assessment and costing of new policies course within the Eastern Cape, Mpumalanga and
Limpopo provinces.
• Officials were capacitated in finding value for money in public expenditure and equipped on ways to use the PERs as a routine
part of budgeting and policy making in government.
10. PUBLIC ENTITIES REPORTING TO THE MINISTER
38
PART A: GENERAL INFORMATION - Continued
• The partnership with the National Treasury and civil society organisations continued in developing the budget data portal named
Vulekamali, which was successfully launched.
• The budget portal forms part of government’s continued commitment to transparency and budget participation reforms. Stage
2 of the project was formally completed during the period under review and built on stage 1 of the project, which had entailed
publishing data currently available within the National Treasury as well as budget-related data within the domain of civil society
organisations.
• Personnel establishment and expenditure trends have been analysed for the South African Police Service (SAPS), Defence,
Education, and General Public Service functional group using personnel and salary system (PERSAL) and other relevant datasets,
including tax and survey data.
• The GTAC assisted the National Treasury in its review and assessment of infrastructure investment proposals to ensure value for
money, affordability and efficiency in infrastructure expenditure, and completed 32 capital appraisal reports.
INDEPENDENT REGULATORY BOARD FOR AUDITORS (IRBA)
(SCHEDULE 3A: NATIONAL PUBLIC ENTITY)
The IRBA was established by an act of Parliament in April 2006. Its mandate, as set out in the Auditing Profession Act, 2005 (Act No. 26
of 2005), is to protect the sections of the public that rely on the services of registered auditors, and to provide support to registered
auditors. It is required to ensure that only suitably qualified individuals are admitted to the auditing profession, and that registered
auditors deliver services of the highest quality and adhere to the highest ethical standards.
Key achievements during the period under review include the following:
• The IRBA published a set of audit quality indicators (AQI) that have been rolled out to JSE-accredited firms. The availability of AQI
information will be useful to audit committees to more critically assess the performance of their current and (if relevant) future
auditors.
• The IRBA requested firms to publish transparency reports on a voluntary basis. Transparency reports will provide users with
information that will help them understand the firms’ approach to audit quality, leadership, culture and ethics, and the firms’ risk
management practices.
• The IRBA recognises early adopters of the mandatory audit firm rotation (MAFR) rule. With four years remaining until the effective
date for MAFR, approximately 17 per cent of JSE Limited main board listed companies have already voluntarily rotated their
auditors.
• The IRBA signed the Chartered Accountancy Profession Charter in support of the transformation of the chartered accountancy
profession.
10. PUBLIC ENTITIES REPORTING TO THE MINISTER

39
PART A: GENERAL INFORMATION - Continued
OFFICE OF THE PENSION FUNDS ADJUDICATOR (OPFA)
(SCHEDULE 3A: NATIONAL PUBLIC ENTITY)
The OPFA was established in 1998 and mandated to investigate and determine complaints lodged in terms of the Pension Funds
Act, 1956 (Act No. 24 of 1956). In order to deliver on its mandate, it is required to dispose of complaints in a procedurally fair,
economical and expeditious manner. It ensures awareness, affordability and access as an alternative dispute resolution mechanism
to fund members. The OPFA has jurisdiction solely on funds registered under the act.
Key achievements in the year under review include the following:
• During the year 11 399 new complaints were received from across all provinces and various mediums. These were mostly relevant
and justiciable, which reflects an improvement in consumer awareness about the existence and mandate of the OPFA.
• Of the 8 234 complaints which were finalised, 2 404 matters were settled, three were conciliated, 5 319 were formally determined,
711 were received out of time in terms of the Prescription Act, and 866 were referred to other forums.
OFFICE OF THE TAX OMBUD (OTO)
(SCHEDULE 3A: NATIONAL PUBLIC ENTITY)
The Office of the Tax Ombud (OTO) concluded a report on the investigation in terms of Section 16 (1)(b) of the Tax Administration
Act, 2011 (Act No. 28 of 2011) into alleged delayed payment of refunds as a systemic and emerging issue. The report generated
significant interest including that from media, Parliament and other stakeholders.
The Office of the Tax Ombud recorded among others the following achievements during the 2018/2019 financial year:
• OTO received 4 822 complaints, an increase of 32 per cent in comparison with the previous year’s complaints of 3 652.
• OTO finalised/facilitated the resolution of 2 043 complaints in the current financial year, an increase of 46 per cent in comparison
with the prior year’s finalised complaints.
• SARS implemented 99.27 per cent of the recommendations of finalised complaints.
• OTO signed a memorandum of understanding with SARS.
• OTO signed an MOU with the Public Protector.
• The office had 116 stakeholder engagements and collaborations during the financial year.
• The office continued to invest in 118 advertising campaigns through print, digital and broadcast media.
10. PUBLIC ENTITIES REPORTING TO THE MINISTER

40
PART A: GENERAL INFORMATION - Continued
SOUTH AFRICAN REVENUE SERVICE (SARS)
(SCHEDULE 3A: NATIONAL PUBLIC ENTITY)
The mandate of SARS since its inception, in terms of the South African Revenue Service Act (Act No. 34 of 1997), is to collect
all revenue due to the state and to support government in meeting its key growth and developmental objectives by facilitating
legitimate trade, protecting South African ports of entry and eliminating illegal trade and tax evasion.
• For the financial year ending 31 March 2019, SARS collected an amount of R1 287.7 billion, against the 2019 Budget (revised
estimate) of R1 302.2 billion, resulting in a deficit of R14.5 billion (-1.1 per cent).
• The net revenue outcome of R1 287.7 billion represents a growth of R71.2 billion (5.8 per cent) compared to the 2017/18 financial
year.
• Measured against the 2018/19 Budget (printed estimate) of R1 345.0 billion, it is a deficit of R57.3 billion (-4.3 per cent), and against
the revised estimate of R1 302.2 billion, a shortfall of R14.5 billion (-1.1 per cent).
The main sources of revenue that contributed to the R1 287.7 billion collected were:
• Personal Income Tax (PIT), which contributed R493.8 billion (38.3 per cent).
• Value-Added Tax (VAT), contributing R324.8 billion (25.2 per cent).
• Company Income Tax (CIT), which contributed R214.4 billion (16.6 per cent).
• Customs duties contributed R55.0 billion (4.3 per cent).
Tax season for PIT is SARS’s largest single engagement with taxpayers. SARS received 5.785 million returns by the close of tax season,
with 2.11 per cent more returns received year-on-year for non-provisional taxpayers by Friday, 31 October 2018, comprising:
• 4.229 million submissions by individuals for the 2017/18 tax year.
• 1.5 million returns for previous years submitted.
• 42 087 submissions by trusts for the 2017/18 tax year.
• 91.18 per cent of tax returns processed within 24 hours.
• 241 583 taxpayers used the Help-You-eFile service.
• 73 663 taxpayers used the SARS MobiApp to file returns.
• R17.9 billion in refunds paid to more than 2 million non-provisional individual taxpayers.
Volumes SARS processed during the 2018/19 financial year are as follows:
• Total tax return submissions: 17.2 million.
• Inbound calls answered: 4.6 million.
• Payments processed: 19.1 million.
• Taxpayers served in branches: 6.5 million.
• Customs declarations processed: 7.1 million.
• Audits conducted: 1.9 million.
• Tax clearance certificate requests received: 1.2 million.
10. PUBLIC ENTITIES REPORTING TO THE MINISTER

41
PART A: GENERAL INFORMATION - Continued
SOUTH AFRICAN SPECIAL RISKS INSURANCE ASSOCIATION (SASRIA)
(SCHEDULE 3B: NATIONAL GOVERNMENT BUSINESS ENTERPRISE)
SASRIA is a short-term insurance company wholly owned by the state, represented by the Minister of Finance. SASRIA also reports
to the Financial Sector Conduct Authority, the non-banking financial services industry regulator of South Africa. It is a member of
the South African Insurance Association (SAIA). As a state-owned entity, it has a strategic mandate that is prescribed and further
informed by the Reinsurance of Damages and Losses Act, 1989 (Act No. 56 of 1989), the Conversion of SASRIA Act, 1998 (Act No. 134
of 1998) and continual engagement with the National Treasury.
Key achievements during the year under review included the following:
• Gross written premiums increased from R1.99 billion to R2.16 billion, an increase of 8.5 per cent.
• SASRIA settled 71.1 per cent of the large claims under R250 000 within 30 days, and 85.6 per cent of large claims within 60 days.
• SASRIA’s capital and solvency positions remain strong, underpinned by a continued focus on risk management in its disciplined
investment and underwriting strategies.
• Assets under management amounted to R8.4 billion and shareholder equity decreased to R6.5 billion by 31 March 2019 (2017/18:
R6.6 billion).
DEVELOPMENT BANK OF SOUTHERN AFRICA (DBSA)
(SCHEDULE 2: MAJOR PUBLIC ENTITY)
The bank was reconstituted in terms of the Development Bank of Southern Africa Act No. 13 of 1997 (Amended Act No. 41 of
2014), as a development finance institution wholly owned by the South African government. The geographic mandate of the bank
has been extended beyond the Southern African Development Community (SADC) to any country on the African continent and
its oceanic islands. The bank aims to deepen its development impact in South Africa, SADC and the rest of the African continent
by expanding access to development finance while effectively integrating and implementing sustainable development solutions.
Since its founding in 1983, the bank has expanded its role to serve as financier, advisor, partner, implementer and integrator to the
benefit of its clients and communities. There have been no material changes to the nature of the business from the prior years.
The key financial indicators for the year under review are:
• Profitability of R3.10 billion (31 March 2018: R2.28 billion).
• Net interest income increased by 17 per cent to R4.49 billion from R3.84 billion in 2018.
• Operating income increased by 47 per cent to R5.64 billion from R3.84 billion in 2018.
• Development loans and equity disbursements amounted to R9.0 billion (31 March 2018: R12.2 billion).
• Value of infrastructure unlocked to under-resourced municipalities was R916 million against the target of R500 million.
• Value of infrastructure delivered amounted to R3.475 billion.
10. PUBLIC ENTITIES REPORTING TO THE MINISTER

42
PART A: GENERAL INFORMATION - Continued
PUBLIC INVESTMENT CORPORATION LIMITED (PIC)
(SCHEDULE 3B: NATIONAL GOVERNMENT BUSINESS ENTERPRISE)
The Public Investment Corporation (PIC) is a South African state-owned asset management company that manages assets for
clients, all of which are public sector entities. It was originally established in 1911 as Public Debt Commissioners, with the PIC
being corporatised on 1 April 2005, following the promulgation of the Public Investment Corporation Act, 2004 (Act No. 23 of
2004) (PIC Act).
Key highlights during the year under review included the following:
• The unlisted investment portfolio increased by 15 per cent to R86.41 billion (2017/18: R75.2 billion) during the year.
• Disbursements amounted to R7.4 billion (2017/18: R18.2 billion), representing a drop of 59 per cent compared to the previous
year.
• Approvals during the year were R12.1 billion (2017/18: R12.7 billion) representing a decrease of 5% compared to the prior year.
• The PIC committed R1.2 billion for investment in the Edcon restructuring, which will result in a job preservation of approximately
38 000 direct jobs and 100 000 indirect jobs as well as prevention of a total UIF payment of R1.2 billion over a period of 8 months.
• The unlisted property portfolio increased in capital value by 3.5 per cent to R50.62 billion (2017/18: R49.7 billion) during the year.
• New approvals during the year for transactions within South Africa totalled R4.93 billion. In addition to this, US$85 million (R1.2
billion) was approved for investments in the rest of Africa, bringing total new commitments to R6.1 billion and representing an
80/20 split in favour of domestic investment.
• A total of 37 per cent of the approved unlisted property transactions was funding towards Black Economic Empowerment (BEE)
companies, and 40 per cent of the approved BEE transactions were allocated to women participants.
• Prior commitments to student accommodation development resulted in approved deals to construct 1 991 beds during the year.
THE LAND AND AGRICULTURAL DEVELOPMENT BANK OF SOUTH AFRICA (LAND BANK)
(SCHEDULE 2: MAJOR PUBLIC ENTITY)
Established in 1912, the Land Bank is a wholly government-owned development finance institution (DFI), with the sole mandate of
financing agricultural development to achieve food security, and to drive economic growth and rural development in South Africa.
It is charged with promoting agricultural and rural development and providing a range of financial products and services, including
insurance such as crop insurance to farmers and agribusinesses. Its mandate stems from the Land and Agricultural Development
Bank Act, 2002 (Act No. 15 of 2002).
10. PUBLIC ENTITIES REPORTING TO THE MINISTER

43
PART A: GENERAL INFORMATION - Continued
Key highlights during the year under review included the following:
• A substantial increase in the proportion of the bank’s gross loan book that supports transformation from R4.9 billion (10.8 per cent)
in 2017/18 to R7.9 billion (17.5 per cent) by 2018/19;
• Maintenance of the bank’s total capital adequacy ratio of 16.7 per cent, well above the 15 per cent target.
• A cost-to-income ratio of 62.4 per cent (financial year 2017/18: 57.5 per cent).
• A strong liquidity position with a liquidity coverage ratio of 450.9 per cent (financial year 2017/18: 226.1 per cent) and a net stable
funding ratio of 102.8 per cent (financial year 2017/18: 107.7 per cent), ensuring sufficient levels of liquidity and appropriate
funding to support the bank’s operations.
• Net new funding raised during the year amounted to R2.7 billion (R9.1 billion at gross level).
• Net interest margins were 2.7 per cent from 3.0% in 2017/18, due to pressure from rising funding costs.
NAME OF ENTITY LEGISLATIVE MANDATE FINANCIAL RELATIONSHIP NATURE OF OPERATION
Accounting Standards Board
(ASB)
Public Finance Management
Act, 1999 (Act No. 1 of 1999)
Transfer payments The board serves the public
interest by setting standards
of generally recognised
accounting practice (GRAP)
and providing guidance
for financial and other
performance information
reported by the public sector.
Co-operative Banks
Development Agency (CBDA)
Co-operative Banks Act, 2007
(Act No. 40 of 2007)
Transfer payments To support, promote and
develop cooperative
banking and to register,
supervise and regulate
deposit taking financial
services cooperatives, savings
and credit cooperatives,
community banks and village
banks as cooperative banks.
Office of the Ombud for
Financial Services Providers
(FAIS Ombud)
Financial Advisory and
Intermediary Services Act,
2002 (Act No. 37 of 2002) (FAIS
Act)
Financial Services Ombud
Schemes Act, 2004 (Act No. 37
of 2004)
No transfer from the National
Treasury
To resolve financial services
complaints in an economical,
informal and expeditious
manner that flows directly
from Section 20 of the FAIS
Act.
10. PUBLIC ENTITIES REPORTING TO THE MINISTER

44
PART A: GENERAL INFORMATION - Continued
NAME OF ENTITY LEGISLATIVE MANDATE FINANCIAL RELATIONSHIP NATURE OF OPERATION
Financial and Fiscal
Commission (FFC)
Constitution of the Republic
of South Africa Act, 1996 (Act
No. 108 of 1996),
Chapter 13, Section 220
Transfer payments The commission makes
recommendations to organs
of state on financial and
fiscal matters in accordance
with Section 220 of the
Constitution.
Financial Intelligence Centre
(FIC)
Financial Intelligence Centre
Act, 2001 (Act No. 38 of
2001) (FICA)
Transfer payments To identify the proceeds
of crime, combat money
laundering and terror
financing, exchange
information with law
enforcement and other local
and international agencies,
supervise and enforce
compliance with the act and
facilitate effective supervision
and enforcement with
supervisory bodies.
Financial Sector Conduct
Authority (FSCA)
Financial Sector Regulation
Act, 2017 (Act No. 9 of 2017)
No transfer from the National
Treasury
To regulate and supervise
the financial services sector’s
market conduct, ensuring
the integrity and efficiency
of formal markets and allied
institutions, protecting
consumers of financial
services, and improving
access including financial
literacy programmes.
Government Pensions
Administration Agency (GPAA)
Public Service Act of 1994
(Proclamation No. 103 of
1994)
No transfer from the National
Treasury
To administrate benefits
on behalf of Government
Employees Pension Fund
(GEPF) and National Treasury
pension benefits, funeral
benefits, post-retirement
medical subsidies, military
pensions, injury on duty
payments, and special
pensions.
10. PUBLIC ENTITIES REPORTING TO THE MINISTER

45
PART A: GENERAL INFORMATION - Continued
NAME OF ENTITY LEGISLATIVE MANDATE FINANCIAL RELATIONSHIP NATURE OF OPERATION
Government Technical
Advisory Centre (GTAC)
Section 7A (4) of the Public
Service Act (1994) through
Government Notice 261,
Gazette 35194, of 30 March
2012
Transfer payments To assist organs of state
to build their capacity
for efficient, effective
and transparent financial
management and stimulate
debate and promote
discourse in the public
economics space, using a
range of communications
and knowledge management
approaches to optimise
learning across the public
sector.
Independent Regulatory
Board for Auditors (IRBA)
Auditing Profession Act, 2005
(Act No. 26 of 2005)
Transfer payments To protect sections of the
public that rely on the
services of registered auditors,
and to provide support to
registered auditors.
Office of the Pension Funds
Adjudicator (OPFA)
Pension Funds Act, 1956 (Act
No. 24 of 1956)
No transfer from the National
Treasury
To investigate and determine
complaints lodged in terms of
the Pension Funds Act (1956).
Office of the Tax Ombud
(OTO)
Tax Administration Act, 2011
(Act No. 28 of 2011), Section
16(1)
Transfer payments To review and address any
complaint by a taxpayer
regarding a service matter, or
a procedural or administrative
matter arising from the
application of the provisions
of a tax act by the South
African Revenue Service
(SARS).
10. PUBLIC ENTITIES REPORTING TO THE MINISTER
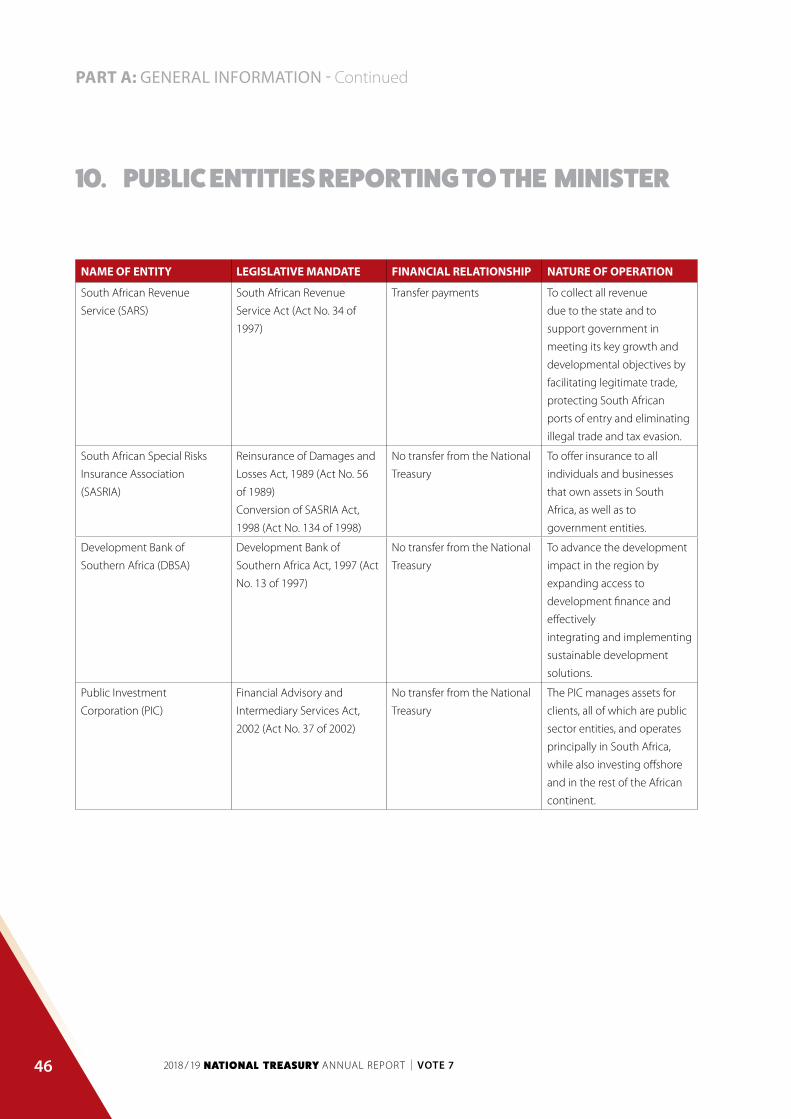
46
PART A: GENERAL INFORMATION - Continued
NAME OF ENTITY LEGISLATIVE MANDATE FINANCIAL RELATIONSHIP NATURE OF OPERATION
South African Revenue
Service (SARS)
South African Revenue
Service Act (Act No. 34 of
1997)
Transfer payments To collect all revenue
due to the state and to
support government in
meeting its key growth and
developmental objectives by
facilitating legitimate trade,
protecting South African
ports of entry and eliminating
illegal trade and tax evasion.
South African Special Risks
Insurance Association
(SASRIA)
Reinsurance of Damages and
Losses Act, 1989 (Act No. 56
of 1989)
Conversion of SASRIA Act,
1998 (Act No. 134 of 1998)
No transfer from the National
Treasury
To offer insurance to all
individuals and businesses
that own assets in South
Africa, as well as to
government entities.
Development Bank of
Southern Africa (DBSA)
Development Bank of
Southern Africa Act, 1997 (Act
No. 13 of 1997)
No transfer from the National
Treasury
To advance the development
impact in the region by
expanding access to
development finance and
effectively
integrating and implementing
sustainable development
solutions.
Public Investment
Corporation (PIC)
Financial Advisory and
Intermediary Services Act,
2002 (Act No. 37 of 2002)
No transfer from the National
Treasury
The PIC manages assets for
clients, all of which are public
sector entities, and operates
principally in South Africa,
while also investing offshore
and in the rest of the African
continent.
10. PUBLIC ENTITIES REPORTING TO THE MINISTER

47
PART A: GENERAL INFORMATION - Continued
NAME OF ENTITY LEGISLATIVE MANDATE FINANCIAL RELATIONSHIP NATURE OF OPERATION
Land and Agricultural
Development Bank of South
Africa (Land Bank)
Land and Agricultural
Development Bank Act, 2002
(Act No. 15 of 2002)
No transfer from the National
Treasury
To provide financial services
to the commercial farming
sector and to agri-business,
and to make available new,
appropriately designed
financial products that
would facilitate access to
finance by new entrants to
agriculture from historically
disadvantaged backgrounds.
10. PUBLIC ENTITIES REPORTING TO THE MINISTER

NATIONAL TREASURYANNUAL REPORT
PART B:PERFORMANCE INFORMATION

49
PART B: PERFORMANCE INFORMATION - ContinuedPART B: PERFORMANCE INFORMATION - Continued
1. AUDITOR-GENERAL'S REPORT: PREDETERMINED OBJECTIVES
AGSA provide a reasonable assurance opinion on the selected programmes in the management report and all material findings
reported therein will be included under the heading Report on the audit of the annual performance report in the auditor’s report.
Refer to page 259 for the Report of the Auditor-General, published as Part E: Financial Information
2. OVERVIEW OF DEPARTMENTAL PERFORMANCE
2.1 SERVICE DELIVERY ENVIRONMENT
The South African economy has grown at a rate below what is required to meaningfully address the triple challenges of poverty,
inequality and unemployment. In 2018/19, this trend continued. For the full fiscal year GDP expanded by 0.6 per cent compared to
fiscal year 2017/18.
Globally, growth of 3.8 per cent and 3.6 per cent was recorded in the 2017 and 2018 calendar years. The International Monetary
Fund has projected a growth rate for 2019 of 3.2 per cent. Global growth was driven by the Unites States of America (USA) and
several of the largest emerging markets. Growth however slowed as a result of a slowdown in economic activity in the euro area,
the negative effects of escalating global trade tensions, geopolitical tensions, and higher oil import bills. Macroeconomic stress in
Argentina and Turkey, disruptions to the auto sector in Germany, tighter credit policies in China, and financial tightening alongside
the normalisation of monetary policy in the larger advanced economies all contributed to a waning of global growth momentum
as the year progressed. With this weakness expected to persist, the IMF projects a decline in growth in 2019 for 70 per cent of the
global economy.
A major driver of South Africa’s growth slowdown was the poor performance of agriculture, which contracted by 6.2 per cent as a
result of drought-related difficulties. Mining and quarrying contracted by 2.6 per cent over the year as a result of continued policy
and regulatory uncertainty and operational challenges, including power outages and labour strikes. Construction contracted by
1.5 per cent as a result of weak investment and low demand. Low but positive growth was recorded in the financial and business
services, which grew at 2.1 per cent over the year, while manufacturing grew at 1.0 per cent driven by food and beverages and
strong exports of motor vehicles and parts. However, surveys indicated that the manufacturing sector as a whole remained under
significant pressure due to low demand and low competitiveness.
Domestically, confidence initially rose for both business and consumers in the first quarter of the financial year, although continued
economic weakness saw confidence end lower at the end of the fiscal year. As a result, private sector capital investment grew at a
modest 0.4 per cent compared to FY2017/18. Investment by general government declined by 5.2 per cent, and investment by public
corporations experienced a sharp decline of 10.0 per cent amid financial and governance challenges. Total investment shrank by
2.2 per cent over the fiscal year.
Consumption was also relatively weak over the year. Household consumption grew at 1.1 per cent as households were constrained
by relatively high indebtedness, moderate real wage growth and high levels of unemployment. Consumption expenditure by
government grew at 1.7 per cent.

50
PART B: PERFORMANCE INFORMATION - Continued
The current account deficit as a percentage of GDP widened to 3.2 per cent in 2018/19 from 2.6 per cent in the previous fiscal year,
despite the slowdown in growth. Although the trade balance remained in surplus, a rise in interest payments and dividends saw the
current account deficit widen.
Headline inflation slowed further from 4.7 per cent in 2017/18 to 4.6 per cent in 2018/19, as weak demand and surprisingly low food
inflation offset high petrol inflation. Fuel inflation rose as high as 24.6 per cent year-on-year in June 2018.
In November 2018 the Reserve Bank raised interest rates by 0.25 percentage points to 6.75 per cent, reversing a 25bps cut from
March 2018. The Monetary Policy Committee (MPC) expressed concern that long-term inflation risks were elevated, as inflation
expectations were in danger of becoming anchored at high levels.
Weak domestic growth had a negative feedback loop to the fiscal situation. The budget deficit, which had been forecast at 3.6 per
cent at the beginning of the fiscal year, came in at 4.2 per cent and gross government debt, which had been forecast to be 55.1 per
cent of GDP, rose to 55.6 per cent. Challenges in key SOCs remain a significant risk to the country’s fiscal position.
This fiscal deterioration, the threat posed by SOCs, and continued policy uncertainty through the year caused South Africa’s risk
premium to rise to 3.05 percentage points on average over 2018/19, from 2.63 percentage points in 2017/18. The risk premium
also rose as inward portfolio investment slowed to R29.8 billion over 2018/19, down from R342.3 billion in the previous fiscal year,
as non-residents sold both equities and bond holdings. Rand depreciation, driven by expectations of higher interest rates in the
USA alongside contained domestic inflation, saw the real effective exchange rate of the rand end the fiscal year 8.3 per cent lower.
In response to the weak growth outlook, government sought to forge partnerships with social partners to tackle the challenges
we face. The Investment Conference saw domestic and international investors committing to over R300bn worth of investment in
the coming years. The Jobs Summit sought to reach agreements through extensive collaboration with NEDLAC social partners to
provide lasting solutions to the problem of wide-ranging joblessness.
The President announced an economic recovery and stimulus package in October 2018. The plan consists of five broad elements
including:
• implementing key growth-enhancing reforms, including removing policy uncertainty and blockages to investment
• reprioritising public spending to support job creation, particularly in agriculture, townships and rural areas, and economic
infrastructure
• improving government’s approach to investment in infrastructure
• addressing the urgent and pressing matters in education and health
• investing in municipal social infrastructure improvement.
Progress in these areas will be critical if we are to sustainably increase our overall potential growth.
2. OVERVIEW OF DEPARTMENTAL PERFORMANCE

51
PART B: PERFORMANCE INFORMATION - Continued
ECONOMIC INDICATORS 2015/16 2016/17 2017/18 2018/19
GDP growth (y/y) 0.6% 0.9% 1.2% 0.6%
Household consumption growth (y/y) 1.5% 0.8% 2.8% 1.1%
Gross fixed investment growth (y/y) 1.3% -3.1% 0.4% -2.2%
RMB/BER Business Confidence Index (average) 38.3 38.0 35.8 33.3
RMB/BER Consumer Confidence Index (average) -10.8 -7.3 0.0 9.5
Unemployment rate 25.4% 27.0% 27.2% 27.4%
Consumer inflation (y/y) 5.2% 6.3% 4.7% 4.6%
2.2 SERVICE DELIVERY IMPROVEMENT PLAN
The National Treasury Service Delivery Improvement Plan is in the final stage of the approval process, and is pending alignment to
the National Treasury strategic plan 2020-2025 and the outcome of the organisational review process which is currently under way.
2.3 ORGANISATIONAL ENVIRONMENT
The National Treasury, while remaining measured and constant in its approach to improving the organisational environment,
commenced with a number of pivotal initiatives to prepare for the next strategic plan period towards enhancing service
delivery maturity.
The strategic planning 2020-25 process commenced with a number of engagements with the National Treasury executive committee
and between the executive committee and the Ministry of Finance, and will continue in earnest towards completion in the next
reporting period. A key early stage outcome was the development of an Optimising the Organisation Plan which, coupled with the
current organisational review, is anticipated to strengthen the department’s ability to deliver on economic policy imperatives and
growth priorities into the future. The National Treasury has continued the drive to fill vacant key positions while maintaining the cost
containment balance.
The National Treasury remained committed to achieving its mandate as set out in the Public Finance Management Act, namely to:
• Promote government’s fiscal policy framework
• Coordinate macroeconomic policy and intergovernmental financial relations
• Manage the budget preparation process
• Facilitate the Division of Revenue Act, which provides for an equitable distribution of nationally raised revenue between
national, provincial and local government
• Monitor the implementation of provincial budgets.
2. OVERVIEW OF DEPARTMENTAL PERFORMANCE

52
PART B: PERFORMANCE INFORMATION - Continued
The National Treasury worked to ensure that there was no compromise on delivery in each of its medium-term core delivery areas
identified as important for the sustainable economic wellbeing of the country. These are:
• Promoting economic policy coherence around the objectives of growth and jobs.
• Addressing risks on the public sector balance sheet.
• Executing a credible budget process that allocates resources sustainably to policy priorities and is in line with spending plans.
• Exercising public finance management oversight responsibilities, including capacity building, that deliver value for money.
• Making the financial sector serve South Africa better.
• Building an effective institution that is a centre of excellence.
• Implementing a strategic communications and outreach programme that addresses stakeholders’ needs.
2.4 KEY POLICY DEVELOPMENTS AND LEGISLATIVE CHANGES
No new key policy developments or legislative changes were made during this reporting period.
2. OVERVIEW OF DEPARTMENTAL PERFORMANCE

53
PART B: PERFORMANCE INFORMATION - Continued
3. STRATEGIC OUTCOME ORIENTED GOALS
STRATEGIC OUTCOME ACHIEVEMENT TO DATE TOWARDS THE 5-YEAR TARGETS
Programme 1: Administration
The programme ensures effective leadership, strategic
management and administrative support to the
National Treasury (NT) through continuous refinement
of organisational strategy and structure in line with
appropriate legislation and best practice.
Corporate Services Division
Corporate Services (CS) continued to provide integrated
business solutions in the areas of business continuity, knowledge
management, and information & communication technology
(ICT). Further effect was given to organisational optimisation
through cost savings and human resources utilisation and
retention. Knowledge Management continued to expand the
NT knowledge-sharing and preservation systems, and further
implemented knowledge-sharing fora. The Project Support Office
(PSO) continued to support strategic projects that strengthened
cross-functional collaboration to further improve service delivery
in NT.
CS further embedded good governance and effected a sound
control environment through the yearly implementation of
the risk-based internal audit plans. The Financial Management
team continued to be the first department nationally to close its
accounting records on the Basic Accounting System. The team
also submitted the NT annual and bi-annual tax reconciliations
more than four weeks before due dates set by the South African
Revenue Service (SARS). Staff security remained a high priority
over the period, with effectively implemented security and
emergency management procedures. A key area of emphasis has
been the management of staff vetting, in both the department
and ministry. As a responsible inner-city tenant, Facilities
Management has set up a working group and is in engagement
with stakeholders such as the City of Tshwane as well as the
public and private sectors to establish a City Improvement
Precinct. Human Resources Management continued to ensure
that all transactional and transformational HR support services are
rendered. Effective initiatives were undertaken towards enabling
NT to attract, develop and retain the skills needed to deliver on its
mandate.

54
PART B: PERFORMANCE INFORMATION - Continued
STRATEGIC OUTCOME ACHIEVEMENT TO DATE TOWARDS THE 5-YEAR TARGETS
Programme 1: Administration CS continues to provide support for strategic planning, project
planning, performance management and reporting across the
organisation. The Public Entities Oversight Unit has continued
to provide support to the Minister of Finance in his role as the
executive authority to oversee public entities reporting to the
Ministry, by reviewing quarterly reports, analysing annual reports
(irregular, unauthorised, wasteful and fruitless expenditure), and
reviewing strategic plans and annual performance plans (APPs) for
approval and tabling in Parliament. Strategic Planning, Monitoring
and Evaluation has further strengthened and expanded the NT
planning and reporting ecosystem. This included facilitating the
department’s strategic five-year and annual APP planning as well
as the introduction of divisions’ operational planning processes.
Operational plans are now being developed in cooperation with
risk planning, demand planning, budgeting and ICT planning.
Impactful monitoring, evaluation and reporting on departmental
performance delivery and outcomes reporting [Outcomes 4, 8, 11,
12 and Forum of South African Directors-General)] continue to be
embedded into the organisation’s reporting cycles. APP quarterly
monitoring has been strengthened with intelligent reporting
provided, including new datasets and combined quarterly
reports that include people’s matters, finance, risk, audit findings
and performance information. Monitoring of operational plans
commenced with a direct link established between operational
reports and individual performance reporting. Internal Audit
effectively executed annual internal audit plans for each year and
delivered on ad-hoc NT requests.
3. STRATEGIC OUTCOME ORIENTED GOALS
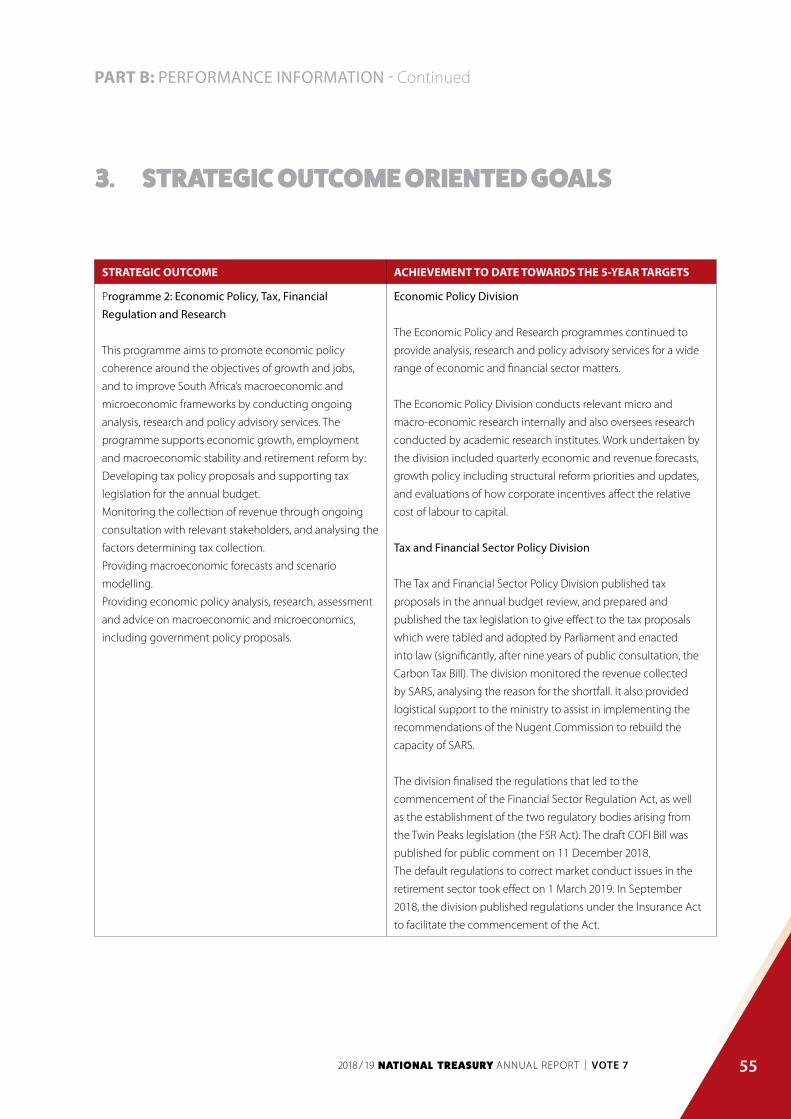
55
PART B: PERFORMANCE INFORMATION - Continued
STRATEGIC OUTCOME ACHIEVEMENT TO DATE TOWARDS THE 5-YEAR TARGETS
Programme 2: Economic Policy, Tax, Financial Regulation and Research
This programme aims to promote economic policy
coherence around the objectives of growth and jobs,
and to improve South Africa’s macroeconomic and
microeconomic frameworks by conducting ongoing
analysis, research and policy advisory services. The
programme supports economic growth, employment
and macroeconomic stability and retirement reform by:
Developing tax policy proposals and supporting tax
legislation for the annual budget.
Monitoring the collection of revenue through ongoing
consultation with relevant stakeholders, and analysing the
factors determining tax collection.
Providing macroeconomic forecasts and scenario
modelling.
Providing economic policy analysis, research, assessment
and advice on macroeconomic and microeconomics,
including government policy proposals.
Economic Policy Division
The Economic Policy and Research programmes continued to
provide analysis, research and policy advisory services for a wide
range of economic and financial sector matters.
The Economic Policy Division conducts relevant micro and
macro-economic research internally and also oversees research
conducted by academic research institutes. Work undertaken by
the division included quarterly economic and revenue forecasts,
growth policy including structural reform priorities and updates,
and evaluations of how corporate incentives affect the relative
cost of labour to capital.
Tax and Financial Sector Policy Division
The Tax and Financial Sector Policy Division published tax
proposals in the annual budget review, and prepared and
published the tax legislation to give effect to the tax proposals
which were tabled and adopted by Parliament and enacted
into law (significantly, after nine years of public consultation, the
Carbon Tax Bill). The division monitored the revenue collected
by SARS, analysing the reason for the shortfall. It also provided
logistical support to the ministry to assist in implementing the
recommendations of the Nugent Commission to rebuild the
capacity of SARS.
The division finalised the regulations that led to the
commencement of the Financial Sector Regulation Act, as well
as the establishment of the two regulatory bodies arising from
the Twin Peaks legislation (the FSR Act). The draft COFI Bill was
published for public comment on 11 December 2018.
The default regulations to correct market conduct issues in the
retirement sector took effect on 1 March 2019. In September
2018, the division published regulations under the Insurance Act
to facilitate the commencement of the Act.
3. STRATEGIC OUTCOME ORIENTED GOALS

56
PART B: PERFORMANCE INFORMATION - Continued
STRATEGIC OUTCOME ACHIEVEMENT TO DATE TOWARDS THE 5-YEAR TARGETS
Programme 3: Public Finance and Budget Management
This programme aims to promote growth, social
development and poverty reduction through sound fiscal
and financial policies and through effective, efficient
and appropriate allocation of public funds to address
government’s policy priorities. It aims to achieve these
objectives by:
• Providing analysis and advice on fiscal policy and public
finances, intergovernmental financial relations and
expenditure planning and priorities.
• Managing the annual budget process and providing
public finance management support.
Budget Office Division
The Budget Facility for Infrastructure (BFI), established to support
the execution of national priority projects, has completed its
review of 25 large infrastructure proposals under BFI Window 3.
Blended Finance projects that have come through the BFI will
be funded through the Infrastructure Fund. Options to engage
development finance institutions and the private sector through
the fund are being explored.
The 2018 Budget proposed major spending adjustments and tax
measures to reduce the budget deficit and stabilise national debt
as a share of Gross Domestic Product (GDP) over the medium
term. The main budget primary deficit will close over the medium
term, helping to stabilise gross government debt at 56.2 per cent
of GDP by 2022/23.
Increased pressure continued to be exerted on the compensation
budget, calling for cost containment measures to ensure that
the wage bill remains within the existing compensation ceilings.
The Department of Public Service and Administration has issued
a circular on “Early Retirement without Penalisation of Pension
Benefits in terms of Section 16(6) of the Public Service Act,
1994”. Implementation of the scaled-up early retirement without
reduction of pension benefits has started.
The State Report on remedial action contained in the Public
Protector Report No. 18 of 2011/12 on alleged maladministration
during the privatisation of the Venda Pension Funds has been
completed. Copies of the final report have been submitted
to both the Public Protector and the National Assembly for
consideration. Based on this report, the remedial action of the
Public Protector has been taken on judicial review.
The budget processes continued to ensure that the sharing
of division of revenue allocations among provinces and
municipalities was highly redistributive, with significantly higher
per capita allocations to poorer provinces and municipalities. This
will enable them to make progress in achieving their Medium-
Term Strategic Framework (MTSF) targets.
3. STRATEGIC OUTCOME ORIENTED GOALS

57
PART B: PERFORMANCE INFORMATION - Continued
STRATEGIC OUTCOME ACHIEVEMENT TO DATE TOWARDS THE 5-YEAR TARGETS
Programme 3: Public Finance and Budget Management Inter-Governmental Relations Division
Support has been provided to provinces to build infrastructure
capacity through the appointment of technical assistants and
structured training to government officials on the Infrastructure
Delivery Management System. This has continued to contribute
to improvement in the administration of public finances, planning
alignment, and budgeting.
Provincial infrastructure plans were assessed together with
national Departments of Health and Education. This contributes
to improved integrated planning and budgeting.
The Infrastructure Finance sub component of the Cities Support
Programme (CSP) has been providing technical and financial
assistance to cities to develop long-term financial strategies and
prepare catalytic urban land development projects identified in
municipal built environmental performance plans (BEPPs). This
year a Catalytic Land Development Guideline was produced that
has been successfully adopted and mainstreamed in the metros.
The Infrastructure Finance Reform project continued to support
municipalities to more effectively access and use available sources
of infrastructure finance through two related work-streams that
ddress policy and regulatory issues in municipal borrowing and
development charges.
The CSP provided inputs into reforming the national policy
environment for urban infrastructure finance within a coherent
a borrowing policy framework and functioning municipal debt
market.
3. STRATEGIC OUTCOME ORIENTED GOALS

58
PART B: PERFORMANCE INFORMATION - Continued
STRATEGIC OUTCOME ACHIEVEMENT TO DATE TOWARDS THE 5-YEAR TARGETS
Programme 3: Public Finance and Budget Management To partly address the challenges associated with unfunded
budgets, the work undertaken on revenue management had to
be better coordinated and collaboration improved to prevent
confusion and duplication. Consequently, a revenue steering
committee was established to guide intended revenue initiatives
to align with a single integrated approach. The National Treasury,
through its municipal finance improvement programme (MFIP III),
has placed technical advisors in five provinces to strengthen the
capacity of these treasuries as well as address revenue challenges
at selected municipalities. In addition, one senior advisor was
placed at the National Treasury.
The National Treasury continued to provide extensive support
to provincial treasuries and municipalities with Municipal
Standard Chart of Accounts (mSCOA) implementation and
institutionalisation. Regular stakeholder engagements and various
capacity building initiatives with provincial treasuries, system
vendors, municipalities and those with a role in local government
were held to ensure its successful implementation. Provincial
treasuries were also provided with technical advisors through the
MFIP to assist them with mSCOA implementation.
Municipal Money, a web-based tool designed to inform citizens
about their local authority’s financial performance, was launched.
Information is available 24/7 on internet and mobile devices. The
application promotes transparency and community participation
in the budget and planning cycle of the municipality. The Inter-
Governmental Relations Division continued to meaningfully
participate in and contribute to the Local Government cluster of
government.
Public Finance Division
The Public Finance division continued to work with national
government departments and their entities to make
recommendations on budgets, monitor budget execution, assist
on key policy issues related to government spending and assist
departments and their entities on financial management issues.
3. STRATEGIC OUTCOME ORIENTED GOALS

59
PART B: PERFORMANCE INFORMATION - Continued
STRATEGIC OUTCOME ACHIEVEMENT TO DATE TOWARDS THE 5-YEAR TARGETS
Programme 4: Asset and Liability Management
The programme manages government’s annual funding
programme in a manner that ensures prudent cash
management and an optimal portfolio of debt and other
fiscal obligations. This programme also seeks to promote
and enforce prudent financial management of state-
owned companies (SOCs) through financial analysis and
oversight.
Asset and Liability Management Division
All corporate plans and annual reports received timeously from
state-owned companies (SOCs), development finance institutions
(DFIs) and water boards have continued to be reviewed.
The Land and Agricultural Development Bank of South Africa
(Land Bank) repaid debt of R2.7 billion, thereby reducing
government guarantee exposure. The guarantees to Eskom,
Denel, South African Airways (SAA), South African Express
(SAX), the South African Post Office (SAPO), and the Land Bank
have been continuously monitored and quarterly reports on
compliance with guarantee conditions are provided to the Fiscal
Liability Committee (FLC). During the year, government issued
SAX, and Denel with an additional government guarantee of
R1.962 billion and R1 billion respectively.
3. STRATEGIC OUTCOME ORIENTED GOALS

60
PART B: PERFORMANCE INFORMATION - Continued
STRATEGIC OUTCOME ACHIEVEMENT TO DATE TOWARDS THE 5-YEAR TARGETS
Programme 4: Asset and Liability Management Government has extended Eskom’s R350 billion guarantee
from 31 March 2017 to 31 March 2023. The extension will allow
the utility to use the remaining portion of the guarantee to
complete its current capital expenditure programme to 2023. As
at 31 March 2019, an estimated R294 billion of the R350 billion
government guarantees had been drawn down. Government
has provided support of up to R200 billion for renewable energy
from Independent Power Producers (IPPs). As at 31 March 2019,
exposure to IPPs, representing the value of signed projects, was
estimated at R146.9 billion.
Eskom was also granted a foreign currency borrowing limit
amounting to R308 billion. SAA’s request for an R18 billion foreign
currency borrowing limit was rejected as the minister was of the
view that its balance sheet could not carry further debt. Approvals
of borrowing authorisations and related limits were granted to
Rand Water and the National Housing Finance Corporation.
The review of the Development Finance System and draft
development finance policy was completed. The outcome of the
review has been communicated to the minister for his review and
recommendation to the Cabinet.
Although the debt portfolio has grown from a gross loan debt
of R1.6 trillion in March 2014 to an estimated gross loan debt of
R2.9 trillion in March 2019, none of the benchmark indicators
were breached. In order to manage the natural tension that
exists between risk, funding and liquidity objectives, government
opted for an overarching objective of reducing refinancing risk
by increasing the weighted average term to maturity of the
government debt portfolio, reported to be 13 years and two
months in March 2019, while managing the cost of net new
funding prudently as and when government raised funding
to fully fund the budget deficit and successfully repay debt
redemptions due.
3. STRATEGIC OUTCOME ORIENTED GOALS

61
PART B: PERFORMANCE INFORMATION - Continued
STRATEGIC OUTCOME ACHIEVEMENT TO DATE TOWARDS THE 5-YEAR TARGETS
Programme 4: Asset and Liability Management Government successfully financed the gross borrowing
requirement of R237.8 billion. This was financed through net
issuance of domestic short-term loans (R33.4 billion), domestic
long-term loans (R198.7 billion) and foreign loans of R33.9 billion
(US$2.5 billion) with R28.2 billion used to increase the cash and
other balances. During 2017/18, R73.5 billion of short-dated
bonds was exchanged for long-dated bonds.
The cost of servicing government debt amounted to R162.6
billion, compared to an original budget of R162.4 billion.
Domestic and foreign loans of R28.4 billion were repaid during
2017/18. The Financial Operations Unit met all government’s rand
and foreign currency commitments on a daily basis. In addition,
surplus cash was optimally invested.
Programme 5: Financial Accounting and Supply Chain Management Systems
This programme is made up of two divisions: The Office of
the Accountant-General (OAG) and the Office of the Chief
Procurement Officer (OCPO).
The programme facilitates accountability, governance
and oversight by promoting effective, efficient, economic
and transparent management of revenue, expenditure,
assets and liabilities across all spheres of government and
public entities.
Office of the Accountant General Division
The Office of the Accountant General (OAG) is the custodian for
both the PFMA and MFMA within the National Treasury. The OAG
is tasked with facilitating accountability and transparency in the
management of the financial resources of the country.
A process has been initiated whereby the MFMA and Municipal
Systems Act are being aligned to ensure better correlation on
policy direction and implementation. This will result in changes
to national and provincial department mandates as they
relate to local government. Administrative governance will be
administered by the Department of Cooperative Governance
(DCoG) as well as coordinate service delivery sectors, while the
National Treasury is tasked with financial management and
financial governance. A Memorandum of Understanding (MOU)
was signed between the National Treasury and the DCoG in 2018
and its implementation has commenced.
3. STRATEGIC OUTCOME ORIENTED GOALS

62
PART B: PERFORMANCE INFORMATION - Continued
STRATEGIC OUTCOME ACHIEVEMENT TO DATE TOWARDS THE 5-YEAR TARGETS
Programme 5: Financial Accounting and Supply Chain Management Systems
The OAG also provides financial support through the
Financial Management Grant (FMG) and technical
assistance in the form of specialist advisor placements to
municipalities. This augments municipal own resources
to implement the reforms legislated in the Municipal
Finance Management Act, 2003 (Act No. 56 of 2003)
(MFMA). The grant further assists municipalities in
building institutional and technical skills in all aspects of
financial management including:
• Growing the internship programme designed for
graduates to be absorbed in municipalities.
• Implementing budget reforms.
• Improving supply chain management.
• Addressing shortcomings in revenue management.
• Implementing strict controls in expenditure
management.
• Developing management plans for assets that also
address their repair and maintenance.
• Producing accurate accounting records.
• Assisting in auditing compliance and producing reports
that are reliable and of a high standard.
• Supporting training of officials to meet the minimum
competencies.
As part of the objective to improve financial management
governance and compliance, the OAG has facilitated bi-annual
meetings with various stakeholders involved in the local
government sphere to discuss and take resolutions to improve
financial management in local government. This includes
discussions on the financial management grant, unauthorised,
irregular, fruitless and wasteful expenditure (UIFWE), audit
outcomes, Financial Management Capability Maturity Model
(FMCMM) progress, and financial recovery plans among others.
The annual MFMA compliance reports, compiled from quarterly
compliance reports, also highlight progress made and areas
where remedial actions are required to correct weaknesses.
The financial management grant of R504 566 was transferred to
all 257 municipalities. The annual review of the support plans
indicated that funds were allocated towards the appointment of
financial management interns, improving financial management
systems, compilation of annual financial statements (AFS), training
officials to meet the minimum competency levels, and addressing
audit findings and shortcomings in the FMCMM assessments as
well as strengthening the capacity of the Budget and Treasury
Office (BTO).
In conjunction with the South African Local Government
Association (SALGA), provincial treasuries (PTs) and CoGTA,
Municipal Public Accounts Committees (MPAC) are continuously
provided with training on their oversight functions to assist
in reducing UIFWE and other related functions. This was
underpinned by the issuance of the MPAC Guideline and Toolkit
and MFMA Circular 92 to further support MPACs. One-on-one
engagement sessions, including during the mid-year budget
assessment reviews, to discuss progress made in reducing
UIFWE and addressing slow progress continued with the top 10
municipalities contributing towards UIFWE.
3. STRATEGIC OUTCOME ORIENTED GOALS

63
PART B: PERFORMANCE INFORMATION - Continued
STRATEGIC OUTCOME ACHIEVEMENT TO DATE TOWARDS THE 5-YEAR TARGETS
Programme 5: Financial Accounting and Supply Chain Management Systems
Thirty municipalities with adverse and disclaimer audit opinions
were identified for support over the medium term. A rapid
response task team was formed to assist the Municipal Financial
Recovery Service with the preparation of Financial Recovery Plans.
A total of nine municipalities were assisted with developing/
reviewing their recovery plans.
The OAG has facilitated accountability and transparency in
the management of the financial resources of the country.
Noteworthy is the consolidation of the Forum of South African
Directors-General (FOSAD) and the Standing Committee
on Public Accounts (SCOPA) reports, which outline issues
of governance and proposed remedial actions. This annual
report is collated from the quarterly dashboard reports at local
government level. It demonstrates the level of compliance with
the MFMA in municipalities, progress made and areas where
remedial actions are required to correct weaknesses.
In addition, support has been provided to spending agencies at
national, provincial and local government levels in accounting,
risk management and internal audit. State of Readiness
assessments in internal audit, conducted for institutions that were
due for external quality assurance review, and a programme to
mentor officials and prepare their organisations for the external
review has also been introduced.
The consolidation of the annual financial statements for national
government and entities was tabled in Parliament to provide
oversight structures with the tools to hold spending agencies
accountable.
In order to ameliorate the skills deficit, capacity building in public
financial management is critical. To this end, the OAG has put in
place a number of interventions. These include the Chartered
Accountants Academy (CAA), which provides an avenue for
prospective chartered accountants (CAs) to receive training.
In addition, the African Development Bank (AfDB)-funded
Municipal Financial Management Technical Assistance Project
has been implemented to strengthen municipal public finance
management capacity and improve service delivery performance.
3. STRATEGIC OUTCOME ORIENTED GOALS

64
PART B: PERFORMANCE INFORMATION - Continued
STRATEGIC OUTCOME ACHIEVEMENT TO DATE TOWARDS THE 5-YEAR TARGETS
Programme 5: Financial Accounting and Supply Chain Management Systems
Municipalities which had shown a history of disclaimer and
adverse audit opinions for the past three financial years were
identified for support during 2017/18 and over the medium term.
Support to municipalities included providing advice and
placement of resources through the Municipal Finance
Improvement Programme (MFIP) as well as the development of
financial recovery plans for those municipalities under distress
or where governance failures occurred. The Municipal Financial
Recovery Service (MFRS) assisted municipalities with the
preparation of financial recovery plans.
The work of law enforcement authorities has been supported
through investigations and the production of germane reports.
The OAG division continued to meaningfully participate in and
contribute to the Governance and Administration cluster of
government.
Office of the Chief Procurement Officer Division
There has been continuous advancement in the use of
technology to modernise supply chain management in
government. A total of 16 242 tenders across all spheres of
government was published on an electronic tendering system
in the financial year 2018/19, exceeding the projected target of
10 000 for the year under review. The purpose of the system is to
improve transparency and enable easy access to procurement
opportunities in the public sector. Further, it has contributed
to reducing cost of doing business for potential suppliers while
reducing printing costs for government.
Supply chain management business processes have been
defined, with the focus in the year under review on gap
analysis. The office continues to provide technical support to
municipalities on SCM and contract management audit findings/
opinions, and monitoring corrective actions taken by non-
compliant municipalities. This has been done with the aim of
strengthening governance to reduce adverse audit findings.
3. STRATEGIC OUTCOME ORIENTED GOALS

65
PART B: PERFORMANCE INFORMATION - Continued
STRATEGIC OUTCOME ACHIEVEMENT TO DATE TOWARDS THE 5-YEAR TARGETS
Programme 5: Financial Accounting and Supply Chain Management Systems
The central supplier database (CSD) has been continuously
enhanced to cater for subcontracting requirements of the
Preferential Procurement Regulations, 2017 and to enable
government institutions to detect employees of the state who
are doing business with government. To date 625 432 suppliers
are registered on the CSD. Significant improvement in call centre
operations has resulted in reduced visits to the walk-in-centre.
The current system enables government to extract information
on procurement spend for statistical analysis, operational and
reporting purposes. The OCPO completed the first phase of
establishing a procurement codification standard to standardise
item description across all government spheres.
Oversight has continuously been exercised over compliance to
SCM policies, procedures, norms and standards. Procurement
plans, deviations and contract expansions for departments and
public entities continue to be published to improve transparency.
There is continuous review of bid specifications, evaluation
and adjudication to ensure compliance with policy, norms and
standards.
Twenty-two transversal contracts were renewed in the financial
year 2018/19 for a wide range of goods from medical and military
equipment to agricultural remedies, toilet paper and education
stationery supplies. The main aim of renewing these contracts
is to ensure that maintenance and sourcing is primarily done to
achieve economies of scale through bulk purchasing.
3. STRATEGIC OUTCOME ORIENTED GOALS

66
PART B: PERFORMANCE INFORMATION - Continued
STRATEGIC OUTCOME ACHIEVEMENT TO DATE TOWARDS THE 5-YEAR TARGETS
Programme 5: Financial Accounting and Supply Chain Management Systems
The department has completed 91 per cent of the project plans
on sourcing strategies. These reforms aim to institutionalise
strategic sourcing and continuous stream of projects to realise
efficiencies. Sourcing strategies have been developed and
implemented in order to improve service delivery in the health
sector, as well as to strengthen procurement efficiencies and
advance local economic development across all departments
of health. The business case for a government online travel
booking solution was approved in the financial year 2018/19.
The National Travel Policy Framework and cost containment
measures related to travel and subsistence were reviewed
and circulated for inputs and comments. The purpose of the
review was to bring the policy in line with best practice for
government travellers. The department continuously tracks airline
spend with the two domestic full-service carriers. It has also
benchmarked industry accommodation rates with government’s
maximum allowable rates as published in the cost containment
instruction. These reports will assist with future negotiations and
savings strategies. An e-Education Procurement and Delivery
Management Framework was developed and is currently being
implemented together with the Department of Basic Education.
The ultimate objective is to improve service delivery at schools
and to contribute to efficient and effective procurement by
expanding centre-led contracting for common goods and
services. The Standard for Infrastructure Procurement and
Delivery Management (SIPDM) has been reviewed to improve
identified shortcomings and align it with Infrastructure Delivery
Management Systems (IDMS) and other existing government
procurement policies.
Instructions for designated products to support local industrial
policy continued to be issued, with four released in the year under
review. The draft Public Procurement Bill has been finalised and
was tabled to Cabinet during February 2019 to obtain approval
to gazette for public comments. Cabinet has requested that it be
deferred to the sixth administration, and it will be tabled again as
soon as possible to the new Cabinet. Once finalised, the bill will
be the single overarching legislative framework regulating public
procurement in South Africa. A contract management framework
3. STRATEGIC OUTCOME ORIENTED GOALS
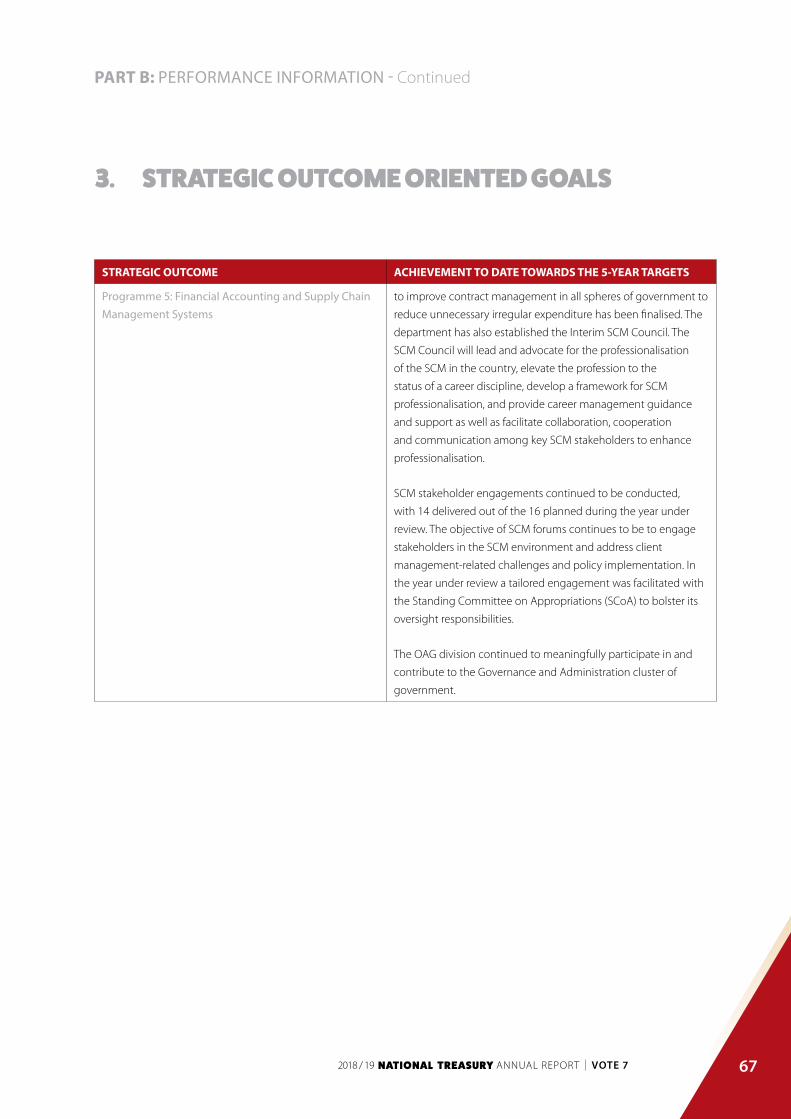
67
PART B: PERFORMANCE INFORMATION - Continued
STRATEGIC OUTCOME ACHIEVEMENT TO DATE TOWARDS THE 5-YEAR TARGETS
Programme 5: Financial Accounting and Supply Chain Management Systems
to improve contract management in all spheres of government to
reduce unnecessary irregular expenditure has been finalised. The
department has also established the Interim SCM Council. The
SCM Council will lead and advocate for the professionalisation
of the SCM in the country, elevate the profession to the
status of a career discipline, develop a framework for SCM
professionalisation, and provide career management guidance
and support as well as facilitate collaboration, cooperation
and communication among key SCM stakeholders to enhance
professionalisation.
SCM stakeholder engagements continued to be conducted,
with 14 delivered out of the 16 planned during the year under
review. The objective of SCM forums continues to be to engage
stakeholders in the SCM environment and address client
management-related challenges and policy implementation. In
the year under review a tailored engagement was facilitated with
the Standing Committee on Appropriations (SCoA) to bolster its
oversight responsibilities.
The OAG division continued to meaningfully participate in and
contribute to the Governance and Administration cluster of
government.
3. STRATEGIC OUTCOME ORIENTED GOALS

68
PART B: PERFORMANCE INFORMATION - Continued
STRATEGIC OUTCOME ACHIEVEMENT TO DATE TOWARDS THE 5-YEAR TARGETS
Programme 6: International Financial Relations
This programme manages South Africa’s interests in
shaping regional and global policies which advance the
economic, financial and development objectives of the
country and those of Africa as a whole.
International and Regional Economic Policy
The Committee of Fifteen Ministers of Finance (F15), of which
South Africa is a member, continued to oversee the formulation
of the African Union (AU) budget jointly with the Ministers
of Foreign Affairs. The 2019 Budget was approved by the AU
Assembly with a 12 per cent saving from the 2018 Budget. The
National Treasury successfully negotiated a lower scale of 7.5 per
cent for 2020-22 from the current 9.6 per cent for South Africa’s
contribution towards the AU.
The Southern African Customs Union (SACU) Heads of State and
Government continued to meet. For the year under review, the
meeting was held in June 2018 in Gaborone, Botswana, where
they re-affirmed their commitment to a developmental SACU
as a key outcome of the current review. Key areas identified to
support the developmental objective include industrialisation
through regional value chain development and infrastructure
development, which could be supported through a regional
financing mechanism.
As part of South Africa’s chairship of SADC from August
2017 to August 2018, the Minister of Finance hosted the
Committee of Ministers of Finance and Investment as well as the
Macroeconomic Peer Review Panel, which was co-hosted with
the Governor of the South African Reserve Bank in July 2018.
A key highlight was that South Africa was presented as one of
the countries that had been peer reviewed as part of the SADC
macroeconomic convergence peer review process.
The Minister of Finance participated in a Binational Commission
with Zimbabwe in March 2019. A key outcome was South Africa’s
undertaking to advocate for the clearance of debt arrears for
Zimbabwe with international development cooperation partners.
3. STRATEGIC OUTCOME ORIENTED GOALS

69
PART B: PERFORMANCE INFORMATION - Continued
STRATEGIC OUTCOME ACHIEVEMENT TO DATE TOWARDS THE 5-YEAR TARGETS
Programme 6: International Financial Relations During the period under review, a successful IMF Article IV
consultation was facilitated in May-June 2018 and a staff visit
in November 2018. South Africa facilitated a successful visit of
the IMF Managing Director, Christine Lagarde, to South Africa
in December 2018. The purpose of the visit was to enhance
policy dialogue and exchange views on South Africa’s economic
developments. South Africa became a member of the six-
member IMF Africa Group 1 Constituency Panel for a period of
two years.
The Institute of International Finance (IIF) granted observer status
to South Africa in the Principles Consultative Group (PCG) for the
Principles for Stable Capital Flows and Fair Debt Restructuring.
Continued support was provided to the President and Ministers
with a successful engagement at the Buenos Aires Group of
Twenty (G20) Summit in November 2018, where the President
of South Africa was a lead speaker in the “Building Consensus”
session, which focused on issues of international tax, the
international financial architecture and international trade.
In 2018, the National Treasury focused its efforts on strengthening
Brazil, Russia, India, China and South Africa (BRICS) institutions by
enhancing collaboration on infrastructure in the interest of South
Africa’s domestic development objectives, as well as those of the
region and continent. Through South Africa’s stewardship as BRICS
Chair, the New Development Bank (NDB) increased its scale of
work on expanding the bank’s membership by adopting criteria
for the expansion of membership and a shareholding framework.
The BRICS members have endorsed the Terms of Reference of
the Public Private Partnership and Infrastructure Task Force, and
produced the second annual publication of the BRICS Good
Practices on Public-Private Partnership Frameworks. Furthermore,
the task force committed itself to holding meetings on the
margins of future G20 Infrastructure Working Group meetings to
coordinate common positions on the issue.
3. STRATEGIC OUTCOME ORIENTED GOALS

70
PART B: PERFORMANCE INFORMATION - Continued
STRATEGIC OUTCOME ACHIEVEMENT TO DATE TOWARDS THE 5-YEAR TARGETS
Programme 6: International Financial Relations In 2018, the National Treasury represented South Africa in the
recapitalisation of the World Bank. Our continued participation
in these institutions has enabled South Africa to maintain her
voice and shareholding, as well as influence the decision-making
process at the bank. South Africa will subscribe to the shares
allocated to it.
In November 2018, South Africa co-hosted the Africa Investment
Forum (AIF) with the African Development Bank (AfDB) in
Johannesburg. The aim of the AIF is to mobilise funds for
infrastructure development and bridge an estimated funding
gap of US$130-US$170 billion a year in the continent. In support
of President Cyril Ramaphosa’s US$100 billion investment
mobilisation, South Africa successfully mobilised about US$ 6.8
billion from the forum.
In December 2018, the former President of the World Bank Group,
Dr Jim Yong Kim, visited South Africa to attend the Global Citizen
Festival at the invitation of President Cyril Ramaphosa. Bilateral
discussions between the two presidents focused on how the
World Bank Group could support the South African government’s
development priorities.
Programme 7: Civil and Military Pensions, Contributions to Funds and Other Benefits
This programme provides for the processing and payment
of pensions to members and their dependents in terms
of various statutes, collective bargaining agreements and
other commitments.
Civil and Military Pensions, Contributions to Funds and Other Benefits
The programme has continued to achieve above annual target.
In the year under review a 99.4 per cent delivery of its Service
Level Agreement indicators was achieved and targets exceeded
in all four Annual Performance Plan (APP) indicators. This is
attributed to payment of the correct amounts as per the legal
entitlement prescribed by legislation and rules of the funds under
its administration.
3. STRATEGIC OUTCOME ORIENTED GOALS

71
PART B: PERFORMANCE INFORMATION - Continued
STRATEGIC OUTCOME ACHIEVEMENT TO DATE TOWARDS THE 5-YEAR TARGETS
Programme 8: Technical and Management Support and Development Finance
This programme provides advisory services, programme
management and development finance support to
improve public finance management, support high-
impact government initiatives, facilitate employment
creation and strengthen infrastructure planning and
delivery.
Technical and Management Support and Development Finance
In the year under review, 109 projects were provided with
technical (80) and transactional (26) advisory support. Sixty-nine
financial management technical advisors were placed at the
National Treasury, provincial treasuries and municipalities to
support the implementation of the six local government financial
management game changers, and 509 township projects were
approved with 334 projects completed to date. The programme
continued to provide support to selected national and provincial
departments to institutionalise and sustainably implement the
IDMS, with the aim of improving infrastructure delivery in the
public sector.
3. STRATEGIC OUTCOME ORIENTED GOALS
72
PART B: PERFORMANCE INFORMATION - Continued
4. PERFORMANCE INFORMATION BY PROGRAMME
4.1 PROGRAMME 1: ADMINISTRATION
PURPOSE
The programme ensures effective leadership, strategic management and administrative support to National Treasury through
continuous refinement of organisational strategy and structure in line with appropriate legislation and best practice.
STRATEGIC OBJECTIVES
• Provide integrated business solutions
• Ensure good governance and sound control environment
• Provide support for strategic and performance management across the organisation
SUB-PROGRAMMES
Office of the Minister and Deputy Minister
The Minister of Finance provides strategic direction and leadership to National Treasury. Additionally, and with the support of the
Deputy Minister, the Minister of Finance is responsible for policy matters and Departmental outcomes.
This sub-programme supports the Minister and Deputy Minister by providing executive and administrative services. The sub-
programme is responsible for the development of systems and mechanisms that deal with parliamentary questions and replies,
Cabinet matters, correspondence, submissions and memoranda.
Office of the Director General
The Director General supports the Minister of Finance in providing strategic direction and leadership to National Treasury. Additionally
the Director General is responsible for Departmental outputs and implementation as well as all responsibilities conferred by being
the Department’s accounting officer.
Management
This sub-programme primarily provides administrative services to and reports directly to the Director-General. It consists of the
following support services:
Internal Audit (IA) contributes to the strengthening of National Treasury’s accountability and enhancing public stewardship by
evaluating and improving the adequacy and effectiveness of governance, risk management and control processes. The unit provides
robust and practical strategic advice and recommendations founded on aligning the business with best practice. By acting as a
frame of reference, the unit also supports the Office of the Accountant-General in providing guidance and support to internal audit
functions in government.

73
PART B: PERFORMANCE INFORMATION - Continued
4. PERFORMANCE INFORMATION BY PROGRAMME
Enterprise Risk Management improves organisational risk communication and knowledge sharing, developing a common risk
language that ensures that a risk management culture is embedded in National Treasury. The unit supports evidence based decision-
making by reducing uncertainty. This is realised by providing a holistic view of risk and the application of a robust risk management
system. Fraud prevention is an integral part of the strategy, operations and administration function. The unit ensures that National
Treasury has a strategic risk profile register that enables coordination and alignment of strategic initiatives across the Department.
Strategic Planning, Monitoring and Evaluation is tasked with embedding planning into National Treasury including facilitating the
Department’s short, medium and long term strategic planning processes and ensuring that plans are aligned to legislative mandates
and broader government imperatives. The unit develops and administers systems and processes that entrench proper monitoring,
evaluation and reporting on Departmental performance delivery and facilitates the development and implementation of service
delivery improvement.
Legal Services is responsible for providing a comprehensive legal advisory service to enable National Treasury to carry out its mandate
effectively within the law.
Legislation Services provides legislative services which include managing the National Treasury’s Legislative Programme, drafting or
checking draft fiscal and intergovernmental and financial sector regulation legislation, and commenting on other legislation as well
as advising on the interpretation of legislation.
Communication furthers National Treasury transparency imperatives by ensuring effective communication between National
Treasury and all stakeholders.
Corporate Services
The Corporate Services division delivers and oversees shared services in alignment with National Treasury’s needs. It does this by
proactively identifying requirements, monitoring and maintaining service levels and setting standards aligned with compliance and
best practices, including reporting on delivery.
Human Resources (HR) Management ensures transactional and transformational HR support so that National Treasury can attract,
develop and retain the skills needed to deliver on the Department’s mandate and objectives.
Financial Management administers compliance with all relevant financial statutes and regulations, the most important of which
is the PFMA. In ensuring compliance, the unit strives to attain a balance between achieving service excellence and maintaining
administrative controls.
Information and Communication Technology (ICT) improves National Treasury’s operational efficiency, optimises costs, drives
innovation and accelerates the delivery of services. The unit provides long term planning and day-to-day support in respect of ICT-
enabled delivery using ICT services and systems.
Strategic Projects and Support is responsible for preserving National Treasury’s institutional memory and tangible knowledge
and providing management support to internal projects. Knowledge management deals with the conservation and pollination

74
PART B: PERFORMANCE INFORMATION - Continued
4. PERFORMANCE INFORMATION BY PROGRAMME
of organisational information created within and in partnership with National Treasury. Records management focuses on the
preservation of tangible knowledge so that it can be accessed easily and be in compliance with the National Archives Act.
Public Entities Oversight unit ensures that entities reporting to the Minister of Finance are compliant with relevant governance and
reporting requirements and reports progress made in this regard to the Minister of Finance.
Facilities and Security Management ensures continuous stringent physical and information security and provides, maintains and
services available facilities.
SERVICE DELIVERY OBJECTIVES AND INDICATORS
Recent outputs
Risk Management unit continues to reconfigure its processes in order to entrench and improve the culture of risk management
in the organisation. In the 2018/19 financial period, the risk management function improved its risk management maturity score
as measured by the MPAT. There was improved alignment between strategic objectives and operational plans of divisions to risks
identified. This allowed the risk management unit to strengthen monitoring of implementation of risks mitigation strategies, from
which four quarterly monitoring reports were produced.
Business Continuity unit has finalised its implementation of a fully-fledged disaster recovery site in Pietermaritzburg and successfully
performed data backup and replication tests to the site. The implementation of business continuity processes during the 2018/19
financial period gained recognition from the Business Continuity Institute, with the business continuity unit named the best Africa
Region Continuity and Resilience Professional in the Public Sector.
Internal Audit implemented its annual risk-based audit plan for 2018/19 as part of the three-year rolling plan, after consultation
with management and approval by the National Treasury’s Audit Committee. Of the 46 planned audits, 41 audits were completed,
2 audits were still in progress while 2 audits were postponed to 2019/20 and 1 was cancelled due to emerging risks, changes in the
department and requests from management. All changes were approved by the Audit Committee. An additional 18 ad hoc audits
were also completed in the year under review, culminating in 59 audits being completed. All audits were conducted in accordance
with the International Standards for the Professional Practice of Internal Auditing, issued by the Institute of Internal Auditors (IIA).
Strategic Planning, Monitoring and Evaluation was further strengthened in the National Treasury with the full roll-out of
standardised operational planning for all 60 Chief Directorates, adding to the existing organisational planning ecosystem of
strategic, outcomes, annual performance and project planning. Operational objectives for each Chief Directorate have been aligned
to the key performance areas of each Chief Director, creating a direct link between organisational and individual performance. This
level of planning is a further contributor to aligning the planning practices of risk analysis, performance planning, budgeting, and
human resources performance management, and responding to internal audit findings and reporting. All performance information
plans and performance information reports requirements were met. Processes to monitor performance have been strengthened
principally in the area of compliance with the AGSA’s Annual Performance Report (APR) requirements, administration of reporting
and introducing of upfront agreements with divisions on the type and nature of evidence required for each indicator for each

75
PART B: PERFORMANCE INFORMATION - Continued
4. PERFORMANCE INFORMATION BY PROGRAMME
quarter. Reporting has been further strengthened through intelligent reporting enhancement. This included introducing new data
sets and combined reporting that includes peoples matters, risk reporting, expenditure reporting, and resolution of audit findings
acting as a basis for evidence-based decision-making. Project Management Support provided guidance to seven new projects
while continuing to provide support to all ongoing projects. Ongoing training was provided to teams in those units that have been
identified as high owners of projects including, but not limited to, Finance and Facilities.
Human Resource Management: In the 2018/19 financial year, the vacancy rate increased to 9.9 per cent compared to 5 per cent in
the 2017/18 financial year. This was a result of the high turnover and reprioritisation of funded posts to ensure that the department
remains within the compensation ceiling of employees, introduced by the National Treasury Budget Office.
As part of ensuring sustainable employee engagement, the department implemented the rotation of employees and also
encouraged employees to act in vacant, unfunded positions for exposure and development. The turnover rate for the period was
13.9 per cent. The rotation of employees and acting in higher positions ensured that the department has a diverse set of skills and is
able to recruit internally, should there be opportunities available. Three interns were appointed into permanent positions during the
last financial year, and 15 were appointed on a contract basis.
The employment equity statistics at the end of the financial year were 0.86 per cent in respect of persons with disabilities and 53.13
per cent in respect of women at SMS level. Recruiting persons with disabilities was a challenge experienced across all echelons.
There was an increase in awareness and utilisation of the Department’s Employee Health and Wellness (EHW) programme to an
overall utilisation of 8 per cent in 2018/19 from 6.13 per cent in 2017/18.
Knowledge Management unit implemented learning and innovation sharing events themed according to the topics dealt with
during Learning and Innovation week, and documented National Treasury core business processes as part of the Organisational
Review project. The directorate has secured funding through the Office of the Accountant-General (OAG) to implement knowledge
management in collaboration with Office of the Chief Procurement Office (OCPO) and Intergovernmental Relations for the
implementation of the Procurement Infrastructure and Knowledge Management Capacity Development Programme (PINK) project,
funded by the State Secretariat for Economic Affairs (SECO). The Records Management unit continued to ensure the effective
management of records of the National Treasury in line with the National Archives Act. Availability of filing space in the operational
environment was facilitated through the identification, removal, archiving and capturing of records in the records management
database. Two Records Management Training workshops were conducted. Approximately 3 tons of redundant records that had
reached their full retention period and no longer had any administrative value were disposed in line with the standing disposal
authority issued by the National Archives and Records Service of South Africa. The National Treasury’s Promotion of Access to
Information Act manual was approved and published on the departmental website. Thirty-two requests for information from members
of the public were received and finalised in line with the Promotion of Access to Information Act. The GTAC was assisted to set up its
records management system, and the GTAC file plan was developed in-house and approved by the National Archives.
Information and Communication Technology (ICT) retained a Management Performance Assessment Tool (MPAT) rating of 4 on ICT
governance for the second year running. The unit continued its drive to digitise and automate departmental processes. This included:
• A content management project
• A unified communication and collaboration project

76
PART B: PERFORMANCE INFORMATION - Continued
4. PERFORMANCE INFORMATION BY PROGRAMME
• Consolidation and automation of service desk systems of the National Treasury
• Automation of HR recruitment processes.
ICT took steps to position the department for the fourth industrial revolution by strengthening governance and reducing shadow
IT. The department delivered against its mandates, and processes such as budgeting were once again conducted in a secure and
collaborative environment enabled by ICT.
Financial Management unit continued to focus on reducing instances of deviations and non-compliance. The unit successfully
reviewed 96 per cent of existing contracts and 100 per cent of close-out reports in respect of expiring contracts. Semi-annual and
annual tax reconciliations were compiled accurately and submitted to the South African Revenue Service (SARS) six weeks before
the closing date. On 4 April 2019, the National Treasury was the first national department to close its financial records for the 2018/19
reporting period. The unit increased its efforts in processing supplier payments, and processed 97 per cent of payments within an
average of 12 days from receipt of an invoice.

77
PART B: PERFORMANCE INFORMATION - Continued
4. PERFORMANCE INFORMATION BY PROGRAMME
PERF
ORM
AN
CE IN
DIC
ATO
RS
PRO
GRA
MM
E 1:
AD
MIN
ISTR
ATIO
N
APP #
INDI
CATO
RAC
TUAL
2015
/16
ACTU
AL20
16/1
7AC
TUAL
20
17/2
018
TARG
ET
2018
/201
9AC
TUAL
20
18/2
019
DEVI
ATIO
N FR
OM
PLAN
NED
TARG
ET
REAS
ON FO
R DEV
IATIO
N
STRA
TEG
IC O
BJEC
TIVE
1.1
: PRO
VID
E IN
TEG
RATE
D B
USI
NES
S SO
LUTI
ON
S
1.1.
1Pe
rcen
tage
com
plet
ion
of th
e bu
sine
ss c
ontin
uity
st
rate
gy
N/A
90%
28,6
%70
% o
f Ph
ase
370
% o
f Ph
ase
3N
/AN
/A
1.1.
2Pe
rcen
tage
sav
ed o
n th
e Ra
nd v
alue
bud
gete
d fo
r pa
per u
sage
, tra
vel a
nd
stra
tegi
c so
urci
ng
A s
avin
g of
R4
925
306.
40
agai
nst e
xpen
ditu
re o
f R65
7 21
2 68
5.63
was
att
aine
d fo
r Apr
il to
M
arch
16.
Thi
s re
sults
in a
sav
ing
of 0
.7%
.
1%0,
7%1%
2.4%
1.4%
Ove
r-pe
rfor
man
ce is
att
ribut
ed to
:Se
rvic
e pr
ovid
ers
bein
g in
a p
ositi
on
/ w
illin
g to
neg
otia
te p
rices
.In
crea
sed
mon
itorin
g of
pap
er u
sage
w
ith re
duct
ion
enco
urag
ed b
y ea
ch
unit.
Effici
ency
in a
ppro
val o
f tra
vel
quot
atio
ns b
y Bu
dget
Man
ager
s th
ereb
y qu
alify
ing
for l
ow tr
avel
fa
res
rate
.

78
PART B: PERFORMANCE INFORMATION - Continued
4. PERFORMANCE INFORMATION BY PROGRAMME
PRO
GRA
MM
E 1:
AD
MIN
ISTR
ATIO
N
APP #
INDI
CATO
RAC
TUAL
2015
/16
ACTU
AL20
16/1
7AC
TUAL
20
17/2
018
TARG
ET
2018
/201
9AC
TUAL
20
18/2
019
DEVI
ATIO
N FR
OM
PLAN
NED
TARG
ET
REAS
ON FO
R DEV
IATIO
N
STRA
TEG
IC O
BJEC
TIVE
1.2
: EN
SURE
GO
OD
GO
VERN
AN
CE A
ND
SO
UN
D C
ON
TRO
L EN
VIRO
NM
ENT
1.2.
1Pe
rcen
tage
com
plet
ion
of th
e ap
prov
ed ri
sk-
base
d IA
pla
n
The
annu
al ri
sk-b
ased
inte
rnal
aud
it pl
an h
as b
een
fully
(100
%) i
mpl
emen
ted,
with
55
(41
plan
ned
and
14
adho
c) a
udits
com
plet
ely
exec
uted
dur
ing
the
2015
/16
finan
cial
yea
r.
The
initi
al a
udit
plan
was
appr
oved
with
50
audi
ts,
and
was
sub
sequ
ently
revi
sed
durin
g th
e ye
ar a
s
a re
sult
of re
ques
ts fr
om
man
agem
ent t
o po
stpo
ne
som
e au
dits
(9);
thes
e
requ
ests
for p
ostp
onem
ent
wer
e ap
prov
ed b
y th
e au
dit
com
mitt
ee. T
he a
ppro
val o
f
the
post
pone
men
t lef
t the
plan
with
41
audi
ts a
nd w
as
com
plet
ely
exec
uted
.
100%
100%
100%
90.7
%9.
3%U
nder
-per
form
ance
is
attr
ibut
ed to
the
incr
ease
d
num
ber o
f adh
oc a
ssig
nmen
ts
com
poun
ded
by c
apac
ity
chal
leng
es w
ithin
the
unit.

79
PART B: PERFORMANCE INFORMATION - Continued
4. PERFORMANCE INFORMATION BY PROGRAMME
PRO
GRA
MM
E 1:
AD
MIN
ISTR
ATIO
N
APP #
INDI
CATO
RAC
TUAL
2015
/16
ACTU
AL20
16/1
7AC
TUAL
20
17/2
018
TARG
ET
2018
/201
9AC
TUAL
20
18/2
019
DEVI
ATIO
N FR
OM
PLAN
NED
TARG
ET
REAS
ON FO
R DEV
IATIO
N
1.2.
2N
umbe
r of q
uart
erly
risk
im
plem
enta
tion
asse
ssm
ent
repo
rts
prod
uced
N/A
N/A
1 Pl
an4
Repo
rts
44
N/A
N/A
1.2.
3N
umbe
r of q
uart
erly
repo
rts
on m
onito
red
perf
orm
ance
of
ent
ities
repo
rtin
g to
MO
F
All
quar
terly
repo
rts
wer
e su
bmitt
ed to
the
Min
iste
r in
com
plia
nce
with
NT
Regu
latio
ns, 3
0 da
ys a
fter
su
bmis
sion
from
the
entit
ies.
4044
44
N/A
N/A

80
PART B: PERFORMANCE INFORMATION - Continued
4. PERFORMANCE INFORMATION BY PROGRAMME
STRATEGY TO OVERCOME AREAS OF UNDER-PERFORMANCE(INDICATORS AND ACTION PLANS)
UNDER-PERFORMING INDICATORS AND ACTION PLANS
PROGRAMME 1: ADMINISTRATION
APP # Indicator Deviation Action Plan
STRATEGIC OBJECTIVE 1.2: ENSURE GOOD GOVERNANCE AND SOUND CONTROL ENVIRONMENT
1.2.1 Percentage completion of the approved risk-based IA plan
Under-performance is attributed to the increased number of adhoc assignments compounded by capacity challenges within the unit.
The outstanding audits were outsourced to the appointed panel of service providers to execute and assist with capacity challenges in the unit.
CHANGES TO PLANNED TARGETS
There are no changes to planned targets for this reporting period.

81
PART B: PERFORMANCE INFORMATION - Continued
4. PERFORMANCE INFORMATION BY PROGRAMME
LIN
KIN
G P
ERFO
RMA
NCE
WIT
H B
UD
GET
S
PRO
GRA
MM
E 1:
A
DM
INIS
TRAT
ION
2018
/19
2017
/18
FIN
AL
APPR
OPR
IATI
ON
ACTU
ALEX
PEN
DIT
URE
(OVE
R)/U
ND
ER
EXPE
ND
ITU
REFI
NAL
AP
PRO
PRIA
TIO
NAC
TUAL
EXPE
ND
ITU
RE(O
VER)
/UN
DER
EX
PEN
DIT
URE
R’00
0R’
000
R’00
0R’
000
R’00
0R’
000
MIN
ISTR
Y4
659
3 69
296
74
555
3 76
8
787
DEP
ART
MEN
TAL
MA
NA
GEM
ENT
52 7
1451
055
1 65
971
201
70 1
36
1
065
CORP
ORA
TE S
ERVI
CES
139
960
126
410
13 5
5012
0 56
811
7 54
2
3
026
ENTE
RPRI
SE W
IDE
RISK
MA
NA
GEM
ENT
31 7
8629
318
2 46
828
703
28 3
01
402
FIN
AN
CIA
L A
DM
INIS
TRAT
ION
45 3
4243
397
1 94
541
993
41 4
90
503
LEG
AL
SERV
ICES
22 5
2422
297
227
22 0
5922
035
24
INTE
RNA
L AU
DIT
34 8
9232
182
2 71
024
520
24 0
50
470
COM
MU
NIC
ATIO
NS
10 9
609
681
1 27
912
779
12 4
57
322
OFF
ICE
ACC
OM
MO
DAT
ION
110
982
106
242
4 74
011
9 24
211
8 09
0
1 15
2
TO
TAL
453
819
424
274
29 5
4544
5 62
043
7 86
9
7
751
82
PART B: PERFORMANCE INFORMATION - Continued
4. PERFORMANCE INFORMATION BY PROGRAMME
4.2 PROGRAMME 2: ECONOMIC POLICY, TAX, FINANCIAL REGULATION AND RESEARCH
PURPOSE
Provide specialist policy research, analysis and advisory services in the areas of macroeconomics, microeconomics, the financial
sector, taxation and regulatory reform.
STRATEGIC OBJECTIVES
• Build economic research capacity in academic research institutions with the objective of promoting relevant research
• Provide policy advice on the financial sector
• Provide advice and input into tax policy, frameworks and legislation
• Provide input into economic policy, related frameworks and strategies
SUB-PROGRAMMES
Programme Management for Economic Policy, Tax, Financial Regulation and Research
This sub-programme provides overall programme management and policy advice to government relating to the promotion of
economic growth, employment, and microeconomic and macroeconomic stability.
Research
This sub-programme promotes economic research institutions by funding economic research in the public interest, and dedicated
economic research on behalf of National Treasury. This includes research into the promotion of macroeconomic stability, poverty
alleviation, social security and retirement reform and financial sector policy development. Most funding is assigned for long term
agreements with institutions and for ad hoc economic research related projects.
Financial Sector Policy
This sub-programme is responsible for developing policy on the regulation of the financial sector in South Africa, on
broadening access to financial services by all South Africans, and on improving the national savings rate through reforms to
the legislative framework governing the savings industry, including work being undertaken towards the implementation of
retirement reform proposals.
83
PART B: PERFORMANCE INFORMATION - Continued
4. PERFORMANCE INFORMATION BY PROGRAMME
Tax Policy
This sub-programme is responsible for preparing tax and revenue proposals for the annual national budget, and for drafting the
necessary tax legislation to give effect to the proposals adopted. The unit also processes recommendations made by the Davis
Tax Committee to the Minister of Finance and provides advice to the Minister on such recommendations. The unit promotes an
effective, equitable and efficient tax policy framework and tax administrative system that ensures sustainable growth and delivery
on government’s mandate to address the needs of all South Africans. This includes providing tax proposals towards improved
environmental sustainability, reduction of inequality, and raising of revenue.
Economic Policy
This sub-programme provides macroeconomic and microeconomic policy analysis, economic forecasts that inform the budget
and Medium Term Budget Policy Statement and scenario modeling. The sound policy advice on the economic environment assists
in promoting economic policy coherence in relation to the objectives of growth and jobs, and helps to improve South Africa’s
macroeconomic and microeconomic framework as policy advice is mainly focused on creating decent employment through
inclusive economic growth.
SERVICE DELIVERY OBJECTIVES AND INDICATORSRecent outputs
Tax and Financial Sector Policy
The Tax Policy Chief Directorates implemented the tax proposals from the 2018 Budget during the 2018/19 financial year, entailing
the drafting, tabling and enactment of legislation. Significant measures included the increase in VAT from 14 per cent to 15 per
cent and the identification of further items for zero-rating, including white bread-flour and sanitary pads. Significantly, the division
supported the process to table and enact the Carbon Tax Bill, following a nine-year consultation process. The President signed the
bill into law on 23 May 2019, to enable the tax to take effect on 1 June 2019. The carbon tax forms an integral part of ensuring that
South Africa meets its nationally-determined contribution targets as committed to in terms of the Paris Agreement.
The Tax Policy Chief Directorates also carried out research and provided advice to the minister on options for tax policy proposals for
the 2019 Budget, which included proposals to increase tax revenues by R15 billion for the 2019/20 year to address the deterioration
in the fiscal position. The final measures included limiting the relief for the effects of inflation on personal income tax. The division
coordinated and chaired the Revenue Analysis Working Committee which provided revised tax revenue forecasts for the 2019
Budget, updated the estimates for tax expenditures and proposed numerous technical tax amendments to be legislated in 2019.
The division provided logistical support to the ministry to assist in implementing the recommendations of the Nugent Commission
to rebuild the capacity of SARS, including the appointment of a new Commissioner by the President, who was announced on 27
March 2019.
The Financial Sector Policy Chief Directorates implemented the Financial Sector Regulation (FSR) Act, developing the guidelines
to enable the commencement of the Act and the establishment of the two regulators from 1 April 2018. through Parliament. The

84
PART B: PERFORMANCE INFORMATION - Continued
4. PERFORMANCE INFORMATION BY PROGRAMME
FSR Act establishes a Twin Peaks approach to financial sector regulation, giving the Reserve Bank the responsibility of overseeing
the stability of the financial system, establishing the Prudential Authority (PA) to oversee the safety and soundness of financial
institutions, and establishing the Financial Sector Conduct Authority as a dedicated market conduct regulator to ensure the fair
treatment of customers. The division also assisted in the passage of the Financial Matters Amendment Act, 2019 (Act No.18 of 2019),
which includes amendments to the Banks Act to enable national state-owned companies as public entities for purposes of the
application of the Banks Act. It also amends the Insolvency Act to protect rights over collateral security in the event of settlement
or dispute.
The division published a World Bank diagnostic report that identified potential shortcomings in bank conduct and steps to improve
market conduct practices in the banking sector. The division also secured the approval of Cabinet to publish the draft Conduct of
Financial Institutions Bill for public comment on 11 December 2018. The default regulations in terms of the Pension Funds Act also
took effect on 1 March 2019 for retirement funds.
The division, in conjunction with the South African Reserve Bank, also published the National Payment System Act review policy
paper for public comment. The aim of the review is to ensure that the payments regulatory and legislative framework remains,
robust, flexible and adaptable to technological changes and provides an enabling environment for innovation to thrive.
In September 2018, the division published regulations under the Insurance Act to facilitate the commencement of the Insurance
Act, including regulating microinsurance in SA.
The Tax and Financial Sector Policy division continued to work with the Financial Intelligence Centre to implement the Financial
Intelligence Centre Amendment Act, including the setting up of key consultative mechanisms within government and with the
banking sector. Preparations are also under way to prepare South Africa for the coming Mutual Evaluation Process in 2019.
Economic Policy
The Macroeconomic Policy unit provided support into labour policy, such as the inception and development of the Youth
Employment Service Initiative, analysis of monetary and exchange rate policy in light of global and financial market events,
growth policy including structural reform priorities and updates, and the Southern African Development Community (SADC)
peer review process.
The Microeconomic Policy unit contributed research and analysis in several areas including labour intensive sectors such as inputs
to Operation Phakisa, industrial and trade policy including participation in the DTI’s incentives review programme and International
Trade Administration Commission (ITAC) processes, modern and competitive network industries and competition, firm entry and
SME development including high growth firms in South Africa.
The Modelling and Forecasting unit continued to produce quarterly economic and revenue forecasts accompanied by scenarios
highlighting the main risks to the baseline forecast. In addition to regular model maintenance, a number of additional projects
were completed. These included research notes on capital requirements and how they affect the economy, sudden stops and fiscal
multipliers. In addition, the unit continued to assist with the evaluation of tax and expenditure proposals on a macro level.

85
PART B: PERFORMANCE INFORMATION - Continued
4. PERFORMANCE INFORMATION BY PROGRAMME
PERF
ORM
AN
CE IN
DIC
ATO
RS
PRO
GRA
MM
E 2:
ECO
NO
MIC
PO
LICY
, TA
X, F
INA
NCI
AL
REG
ULA
TIO
N A
ND
RES
EARC
H
APP #
INDI
CATO
RAC
TUAL
2015
/16
ACTU
AL 20
16/1
7AC
TUAL
201
7/20
18TA
RGET
20
18/2
019
ACTU
AL20
18/2
019
DEVI
ATIO
N FR
OM
PLAN
NED T
ARGE
TRE
ASON
FOR
DEVI
ATIO
N
STRA
TEG
IC O
BJEC
TIVE
2.1
: BU
ILD
ECO
NO
MIC
RES
EARC
H C
APA
CITY
IN A
CAD
EMIC
RES
EARC
H IN
STIT
UTI
ON
S W
ITH
TH
E O
BJEC
TIVE
OF
PRO
MO
TIN
G
RELE
VAN
T RE
SEA
RCH
2.1.
1N
umbe
r of
pap
ers
publ
ishe
d in
as
soci
atio
n w
ith a
cade
mic
re
sear
ch
inst
itutio
ns
80 E
RSA
pap
ers
publ
ishe
d.4
rese
arch
pap
ers.
8080
5050
N/A
N/A

86
PART B: PERFORMANCE INFORMATION - Continued
4. PERFORMANCE INFORMATION BY PROGRAMME
PRO
GRA
MM
E 2:
ECO
NO
MIC
PO
LICY
, TA
X, F
INA
NCI
AL
REG
ULA
TIO
N A
ND
RES
EARC
H
APP #
INDI
CATO
RAC
TUAL
2015
/16
ACTU
AL 20
16/1
7AC
TUAL
201
7/20
18TA
RGET
20
18/2
019
ACTU
AL20
18/2
019
DEVI
ATIO
N FR
OM
PLAN
NED T
ARGE
TRE
ASON
FOR
DEVI
ATIO
N
STRA
TEG
IC O
BJEC
TIVE
2.2
: PRO
VID
E PO
LICY
AD
VICE
ON
TH
E FI
NA
NCI
AL
SECT
OR
2.2.
1Tw
in P
eaks
m
odel
le
gisl
atio
n im
plem
ente
d
N/A
N/A
New
regu
lato
ry
auth
oriti
es
esta
blis
hed.
Com
men
cem
ent
Not
ice
and
Regu
latio
ns
impl
emen
ting
prov
isio
ns o
f th
e FS
R A
ct
publ
ishe
d on
29
Mar
ch 2
018.
Dev
elop
men
t of
Tw
in P
eaks
Im
plem
enta
tion
Regu
latio
ns
as w
ell a
s a
com
preh
ensi
ve
prud
entia
l and
m
arke
t con
duct
fra
mew
ork
for
new
aut
horit
ies.
Twin
Pea
ks
Impl
emen
tatio
n Re
gula
tions
de
velo
ped
and
two
regu
lato
rs
esta
blis
hed.
A
com
preh
ensi
ve
prud
entia
l and
m
arke
t con
duct
fra
mew
ork
for
new
aut
horit
ies
not f
ully
de
velo
ped
havi
ng b
een
publ
ishe
d fo
r co
mm
ent.
Ther
eaft
er th
e CO
FI b
ill w
ill
then
pro
ceed
in
to th
e pa
rliam
enta
ry
proc
ess.
COFI
Bill
in
cons
ulta
tion
proc
ess
and
not y
et
supp
orte
d th
roug
h th
e pa
rliam
enta
ry
enga
gem
ent
proc
ess.
Und
er-
perf
orm
ance
is
att
ribut
ed
to th
e en
gage
men
t w
ith
Parli
amen
t ov
er
COFI
Bill
, w
hich
will
co
mm
ence
la
ter t
han
expe
cted
, af
ter p
ublic
co
mm
ents
ar
e ta
ken
into
acc
ount
an
d an
y re
vise
d ch
ange
s to
the
Bill
appr
oved
by
Cabi
net f
or
tabl
ing.

87
PART B: PERFORMANCE INFORMATION - Continued
4. PERFORMANCE INFORMATION BY PROGRAMME
PRO
GRA
MM
E 2:
ECO
NO
MIC
PO
LICY
, TA
X, F
INA
NCI
AL
REG
ULA
TIO
N A
ND
RES
EARC
H
APP #
INDI
CATO
RAC
TUAL
2015
/16
ACTU
AL 20
16/1
7AC
TUAL
201
7/20
18TA
RGET
20
18/2
019
ACTU
AL20
18/2
019
DEVI
ATIO
N FR
OM
PLAN
NED T
ARGE
TRE
ASON
FOR
DEVI
ATIO
N
2.2.
2Im
plem
ent
savi
ngs
and
retir
emen
t po
licie
s
Tax
harm
onis
atio
nla
ws
impl
emen
ted
from
1 M
arch
2015
and
Rev
enue
La
ws
Am
endm
ent
Bill
curr
ently
bef
ore
Parli
amen
t.Bi
ll po
stpo
nes
annu
itisa
tion
by tw
o ye
ars
to 2
018.
Def
ault
regu
latio
ns re
leas
ed
on 2
2 Ju
ly 2
015
and
curr
ently
goi
ng
thro
ugh
cons
ulta
tions
.Th
e ta
x la
wha
rmon
isin
g th
e ta
xatio
n an
d be
nefit
pa
y-ou
ts o
f all
retir
emen
t fun
ds
was
rele
ased
for
publ
ic c
onsu
ltatio
n an
d ap
prov
ed b
y Pa
rliam
ent.
The
Bill
post
poni
ngan
nuiti
satio
n cu
rren
tly
bein
g co
nsid
ered
by
NCO
P.
2nd
draf
t D
efau
ltRe
gula
tions
fo
r Re
tirem
ent
fund
s re
leas
ed in
D
ecem
ber
2016
.
A n
umbe
r of
enga
gem
ents
ha
ve b
een
cond
ucte
d an
d co
nsul
tatio
ns
with
NED
LAC
stil
l in
pro
gres
s.
Impl
emen
tatio
n
of a
nnui
tisat
ion
reso
lutio
n
Ann
uitis
atio
n
reso
lutio
n
impl
emen
ted
N/A
N/A
Impl
emen
tatio
n of
def
ault
regu
latio
ns fo
r re
tirem
ent f
unds
Def
ault
regu
latio
ns
for r
etire
men
t fu
nd n
ot fu
lly
impl
emen
ted
Dra
ft
Stan
dard
s fo
r re
gula
tions
fo
r ret
irem
ent
fund
s ha
ve b
een
deve
lope
d an
d is
sued
fo
r pub
lic
com
men
ts.
Und
er-
perf
orm
ance
is
att
ribut
ed
to th
e pr
oces
s fo
r as
sess
ing
publ
ic
com
men
ts
and
revi
sing
st
anda
rds
taki
ng
long
er th
an
antic
ipat
ed
and
will
be
don
e in
20
19/2
0.

88
PART B: PERFORMANCE INFORMATION - Continued
4. PERFORMANCE INFORMATION BY PROGRAMME
PRO
GRA
MM
E 2:
ECO
NO
MIC
PO
LICY
, TA
X, F
INA
NCI
AL
REG
ULA
TIO
N A
ND
RES
EARC
H
APP #
INDI
CATO
RAC
TUAL
2015
/16
ACTU
AL 20
16/1
7AC
TUAL
201
7/20
18TA
RGET
20
18/2
019
ACTU
AL20
18/2
019
DEVI
ATIO
N FR
OM
PLAN
NED T
ARGE
TRE
ASON
FOR
DEVI
ATIO
N
STRA
TEG
IC O
BJEC
TIVE
2.3
: PRO
VID
E A
DVI
CE A
ND
INPU
T IN
TO TA
X PO
LICY
, FRA
MEW
ORK
S A
ND
LEG
ISLA
TIO
N
2.3.
1Pu
blis
h ta
x pr
opos
als
in
annu
al b
udge
t re
view
2016
Tax
pro
posa
lspu
blis
hed
in C
hapt
er
4 of
Bud
get R
evie
w
on B
udge
t Day
, 24
Febr
uary
201
6.
Reve
nue
Law
sA
men
dmen
t Bill
and
Ra
tes
Bill
curr
ently
be
fore
Par
liam
ent.
Cons
ulta
tions
for
2016
TLA
B ha
ve
com
men
ced.
i Tax
pr
opos
als
to
rais
eR2
8 bi
llion
in
clud
ed in
th
e Bu
dget
Revi
ew.
Incl
udin
g a
new
top
rate
of 4
5%
abov
e R1
.5
mill
ion,
pa
rtia
l br
acke
t cr
eep
relie
f and
in
crea
ses
in
the
fuel
levy
an
d ex
cise
du
ties.
ii Re
vise
d fo
reca
sts
for a
ll ta
x in
stru
men
tsin
clud
ed in
th
eBu
dget
Re
view
.
Publ
ishe
d ta
x an
d re
venu
e pr
opos
als
in th
e 20
17 B
udge
t Re
view
Publ
ish
tax
and
reve
nue
prop
osal
s on
201
8 Bu
dget
Tax
and
reve
nue
prop
osal
s on
20
18 B
udge
t Pu
blis
hed
N/A
N/A
Upd
ated
reve
nue
estim
ates
for
2017
Med
ium
Te
rm B
udge
t Po
licy
Stat
emen
t (M
TBPS
)
Upd
ate
reve
nue
estim
ates
for
2018
Med
ium
Te
rm B
udge
t Po
licy
Stat
emen
t (M
TBPS
)
Reve
nue
estim
ates
for
2018
Med
ium
Te
rm B
udge
t Po
licy
Stat
emen
t (M
TBPS
) up
date
d
N/A
N/A

89
PART B: PERFORMANCE INFORMATION - Continued
4. PERFORMANCE INFORMATION BY PROGRAMME
PRO
GRA
MM
E 2:
ECO
NO
MIC
PO
LICY
, TA
X, F
INA
NCI
AL
REG
ULA
TIO
N A
ND
RES
EARC
H
APP #
INDI
CATO
RAC
TUAL
2015
/16
ACTU
AL 20
16/1
7AC
TUAL
201
7/20
18TA
RGET
20
18/2
019
ACTU
AL20
18/2
019
DEVI
ATIO
N FR
OM
PLAN
NED T
ARGE
TRE
ASON
FOR
DEVI
ATIO
N
2.3.
2Im
plem
ent
legi
slat
ion
to
give
effe
ct to
tax
prop
osal
s fro
m
the
Budg
et.
The
draf
t Car
bon
Tax
Bill
is b
eing
revi
sed
to
take
acc
ount
of p
ublic
co
mm
ents
.Pr
oces
s of
con
sulta
tion
com
plet
ed.
Tax
Law
s pr
omul
gate
dby
the
Pres
iden
t of
the
Repu
blic
of
Sou
th
Afri
cain
Dec
embe
r 20
16.
Prep
ared
, pu
blis
hed
and
tabl
ed ta
x le
gisl
atio
n in
Pa
rliam
ent.
Prep
are,
pub
lish,
an
d ta
ble
tax
legi
slat
ion
in
Parli
amen
t
Tax
legi
slat
ion
in P
arlia
men
t pr
epar
ed,
publ
ishe
d, a
nd
tabl
ed.
N/A
N/A
STRA
TEG
IC O
BJEC
TIVE
2.4
: PRO
VID
E IN
PUT
INTO
ECO
NO
MIC
PO
LICY
, REL
ATED
FRA
MEW
ORK
S A
ND
STR
ATEG
IES
2.4.
1N
umbe
r of
econ
omic
m
odel
s m
aint
aine
d
N/A
625
2020
N/A
N/A
2.4.
2N
umbe
r of
econ
omic
fo
reca
sts
deve
lope
d
N/A
254
44
N/A
N/A
2.4.
3C
hapt
er 2
of
the
MTB
PS a
nd
Budg
et R
evie
w
publ
ishe
d
N/A
42
2 do
cum
ents
pu
blis
hed
2 do
cum
ents
pu
blis
hed
N/A
N/A
2.4.
4Pe
rcen
tage
re
spon
se to
us
er re
ques
ts
to d
evel
op
new
eco
nom
ic
mod
els
N/A
N/A
100%
100%
100%
N/A
No
requ
ests
re
ceiv
ed
in th
is
repo
rtin
g pe
riod.

90
PART B: PERFORMANCE INFORMATION - Continued
4. PERFORMANCE INFORMATION BY PROGRAMME
PRO
GRA
MM
E 2:
ECO
NO
MIC
PO
LICY
, TA
X, F
INA
NCI
AL
REG
ULA
TIO
N A
ND
RES
EARC
H
APP #
INDI
CATO
RAC
TUAL
2015
/16
ACTU
AL 20
16/1
7AC
TUAL
201
7/20
18TA
RGET
20
18/2
019
ACTU
AL20
18/2
019
DEVI
ATIO
N FR
OM
PLAN
NED T
ARGE
TRE
ASON
FOR
DEVI
ATIO
N
2.4.
5Pe
rcen
tage
re
spon
se to
us
ers
requ
ests
fo
r eco
nom
ic
rese
arch
and
po
licy
anal
ysis
, an
d as
sess
men
ts
of g
over
nmen
t po
licy
prop
osal
s
N/A
N/A
100%
100%
100%
N/A
N/A
2.4.
6Pe
rcen
tage
re
spon
se to
us
er re
ques
ts
for p
olic
y an
d sc
enar
io
mod
ellin
g
N/A
N/A
100%
100%
100%
N/A
N/A
2.4.
7Pe
rcen
tage
re
spon
se to
use
r re
ques
ts fo
r co
mm
enta
ries
on e
cono
mic
da
ta
N/A
N/A
100%
100%
100%
N/A
N/A

91
PART B: PERFORMANCE INFORMATION - Continued
4. PERFORMANCE INFORMATION BY PROGRAMME
STRATEGY TO OVERCOME AREAS OF UNDER-PERFORMANCE(INDICATORS AND ACTION PLANS)
UNDER-PERFORMING INDICATORS AND ACTION PLANS
PROGRAMME 2: ECONOMIC POLICY, TAX, FINANCIAL REGULATION AND RESEARCH
APP # Indicator Deviation Action Plan
STRATEGIC OBJECTIVE 2.2: PROVIDE POLICY ADVICE ON THE FINANCIAL SECTOR
2.2.1 Twin Peaks model legislation
implemented
Under-performance is attributed to
the engagement with Parliament
over COFI Bill, which will commence
later than expected, after public
comments are taken into account
and any revised changes to the Bill
approved by Cabinet for tabling.
The Conduct of Financial Institutions
Bill will be supported through the
Parliamentary engagement process
in the 2019/20 financial year.
2.2.2 Implement savings and retirement
policies
Under-performance is attributed
to the process for assessing public
comments and revising standards
taking longer than anticipated and
will be done in 2019/20.
Report on tax free savings account
has been deferred to 2019/20
financial year to allow for further
engagements with SARS.
CHANGES TO PLANNED TARGETS
There are no changes to planned targets for this reporting period.

92
PART B: PERFORMANCE INFORMATION - Continued
4. PERFORMANCE INFORMATION BY PROGRAMME
LIN
KIN
G P
ERFO
RMA
NCE
WIT
H B
UD
GET
S
PRO
GRA
MM
E 2:
ECO
NO
MIC
PO
LICY
TA
X FI
NA
NCI
AL
REG
ULA
TIO
N A
ND
RES
EARC
H
2018
/19
2017
/18
FIN
AL
APPR
OPR
IATI
ON
ACTU
ALEX
PEN
DIT
URE
(OVE
R)/U
ND
ER
EXPE
ND
ITU
REFI
NAL
AP
PRO
PRIA
TIO
NAC
TUAL
EXPE
ND
ITU
RE(O
VER)
/UN
DER
EX
PEN
DIT
URE
R’00
0R’
000
R’00
0R’
000
R’00
0R’
000
PRO
GRA
MM
E M
AN
AG
EMEN
T FO
R
ECO
NO
MIC
PO
LIC
Y TA
X FI
NA
NC
IAL
REG
ULA
TIO
N A
ND
RES
EARC
H
52 3
3244
417
7 91
550
207
43 5
59
6
648
RESE
ARC
H-
--
10 8
2710
827
-
FIN
AN
CIA
L SE
CTO
R PO
LIC
Y23
839
21 5
742
265
27 2
1424
851
2 3
63
TAX
POLI
CY
31 3
1130
942
369
30 3
8128
621
1 7
60
ECO
NO
MIC
PO
LIC
Y25
405
21 9
403
465
26 0
8824
727
1
361
COO
PERA
TIVE
BA
NKS
DEV
ELO
PMEN
T A
GEN
CY
19 8
8319
883
-19
275
19 2
75
-
TOTA
L15
2 77
013
8 75
614
014
163
991
151
860
12 1
31

93
PART B: PERFORMANCE INFORMATION - Continued
4. PERFORMANCE INFORMATION BY PROGRAMME
4.3 PROGRAMME 3: PUBLIC FINANCE AND BUDGET MANAGEMENT
PURPOSE
Provide analysis and advice on fiscal policy and public finances, intergovernmental financial relations, expenditure planning and
priorities. Manage government’s annual budget process and provide public finance management support.
STRATEGIC OBJECTIVES
• Developing and implementing South Africa’s fiscal policy and related frameworks
• Preparation of the national budget
• Publication of the national budget
• Monitoring and analysis of public expenditure and service delivery
• Coordinating international development cooperation
• Coordinating intergovernmental relations
SUB-PROGRAMMES
Three divisions within National Treasury are jointly responsible for fulfilling the functions of this programme. They are the Budget
Office, Public Finance and Intergovernmental Relations.
Budget Office
The Budget Office is responsible for providing fiscal policy advice by monitoring economic and fiscal trends and advising on policy
options and the budget framework. The Budget Office coordinates the national budgeting process which includes coordinating
resource allocation to meet priorities set by government. The Budget Office oversees expenditure planning, leads the budget reform
programme, coordinates international development cooperation, provides advice on public service remuneration and pension
arrangements and compiles public finance statistics.

94
PART B: PERFORMANCE INFORMATION - Continued
4. PERFORMANCE INFORMATION BY PROGRAMME
Public Finance
Public Finance provides financial and budgetary analysis, advises on policy and service delivery trends, and manages National
Treasury’s relations with other national Departments as well as its own analytical work. The division monitors the use of scarce public
resources by national spending agencies, engaging where necessary with accounting officers and other officials to promote efficient
and effective use of these resources. Based on engagements with Departments, the Public Finance team provides recommendations
annually to the Medium Term Expenditure Committee (MTEC).
Intergovernmental Relations
Intergovernmental Relations coordinates fiscal relations between national, provincial and local government, promotes sound
provincial and municipal budgetary planning, monitors implementation through periodic reporting and assists in building capacity
that enables efficient and effective financial management practices. The division monitors the use of scarce public resources by
provincial and local government, regularly engaging with a range of stakeholders to promote efficient and effective use of these
resources. It also provides technical assistance to government Departments to promote improved planning and management of
infrastructure delivery.
SERVICE DELIVERY OBJECTIVES AND INDICATORS
Recent outputs
Budget Office
The Budget Office is responsible for the national budget process, including the publication of the Budget Review, Medium Term
Budget Policy Statement (MTBPS), the Estimates of National Expenditure (ENE) and Adjusted Estimates of National Expenditure
(AENE). The division oversaw expenditure planning, provided fiscal advice, led the budget reform programme, managed official
development assistance and compiled public finance statistics.
The Fiscal Policy unit manages and develops the fiscal framework used to advise the Minister of Finance on policy options available in
setting the budget. This includes expenditure and revenue measures to achieve deficit targets. Two fiscal frameworks are published
annually, one in the MTBPS and the other in the Budget Review. The unit also regulated, analysed and reported on public sector
infrastructure spending. The unit coordinated the production of the Budget Review and the MTBPS and published a formal fiscal
risks statement as part of the MTBPS.
The Expenditure Planning unit designs the annual national government Medium Term Expenditure Framework (MTEF) as well as
the in-year budget process. The annual processes for budget allocation decision-making are carried out in consultation with the
Minister of Finance and the Ministers’ Committee on the Budget (MINCOMBUD). The unit issued various guidelines to government
institutions on the input requirements for the budget process and administered the process of budget consultations, culminating
in Cabinet approval of the budget allocations tabled in the budget and in the adjustments budget. The unit also coordinated the
production of all budget legislation and accompanying documentation. The unit carried out budget outreach activities to enable
discussion of the budget with a wider cross-section of South African society.

95
PART B: PERFORMANCE INFORMATION - Continued
4. PERFORMANCE INFORMATION BY PROGRAMME
The unit also provided international and inter-departmental leadership for budget reform. Interactions with the Collaborative Africa
Budget Reform Initiative, the Global Initiative for Fiscal Transparency and Civil Society and other institutions continued to strengthen,
with the aim of increasing transparency, public participation and the understanding of budgeting processes and information.
Public Finance Statistics (PFS) provided public sector finance statistics summaries for the budget publications and detailed information
to various internal and external stakeholders after the budget process. The statistics are classified according to international and
national standards, and stored in a secure Structured Query Language (SQL) server database.
During the 2018/19 budget cycle, PFS consolidated government accounts including the operating account, the capital account
and consolidated financing position, classified by economic and functional classification, for the 2018 Medium Term Budget Policy
Statement and the 2019 Budget Review. The consolidation included all newly listed entities. Tables for the Estimates of National
Expenditure (ENE) 2019 were also prepared. PFS continued with the development of a data warehouse which will enhance
accessibility of data in the database, particularly for users with entry-level IT skills.
National Departments’ in-year monitoring (IYM) reporting and the public entities quarterly reporting system were also improved,
and a dashboard of the highlights of the information developed on Microsoft Power BI was rolled out. PFS continued to partner
with the Technical Assistance unit in the Office of the Accountant-General to manage the standard chart of accounts (SCOA) and
the SCOA committee. The committee published a number of classification circulars and participated in Basic Accounting System
(BAS) user forums.
The Public Entities Governance unit implements the recommendations of the public entities’ governance review framework. It
provides institutional support on a range of issues to various national and provincial public entities. The unit assisted with preparing
consolidated financial accounts and maintaining budget databases and administrative records of the general government sector,
including public entities. The unit developed and implemented remuneration frameworks related to public entities.
The unit also provided public entities with advice on legislative, financial, human resources and other issues, thereby supporting
an enhanced regulatory and governance environment. Various departmental review committees on public entities reporting to
ministers were supported, and departments consulted on budgets and policy-related matters concerning the public entities.
Development cooperation (DC) support to South Africa received from international partners in the form of grants, concessionary
loans and technical assistance is coordinated and managed by the Chief Directorate: International Development Cooperation in the
National Treasury. Such support has changed in focus over time from interventions directed at policy and strategy improvements to
those of strengthening service delivery of government and reducing poverty generally. Development coordination efforts continue
to target the intensification of support for government leadership at sector level with development partners. Official Development
Assistance (ODA) coordinators continued to work with both national and provincial spheres of government to strengthen
government coordination efforts at the departmental level. Several development partner consultations were organised over the
2018/19 financial year to enable overall coordination and management of programmes.
The global financial crisis has had a deep and profound impact over the past decade on the flow of DC funds to the country. It
has become commonplace for development partners not only to refocus their support to their own national priorities, but also to
develop policies that exclude South Africa from DC support in future. For example, South Africa has been categorised as a middle-

96
PART B: PERFORMANCE INFORMATION - Continued
4. PERFORMANCE INFORMATION BY PROGRAMME
income country (MIC) and DC funds have thus been redirected to new potential economic prospects on the continent. South
Africa now finds itself receiving significantly less DC funding, with a reduction of almost 75 per cent in some cases, which in grant
form is about R1.25 billion in the 2017/18 financial year. In contrast, there has been a slight increase in, and a willingness to, provide
concessionary loan financing over the 10-year period targeting infrastructure programmes, while technical assistance continued to
remain around similar levels of support. South Africa has therefore had to ensure effective and efficient use of such funds, maximising
value for money and insisting that such support enables innovation and the development of best practice.
The Public Sector Remuneration Analysis and Forecasting unit provided timely analysis and policy advice about the fiscal impact of
government compensation spending and changes in policy. The review of the existing cost of living adjustment (COLA) model is
still in progress. A process has been initiated to engage external system development experts to assist with finalisation of the model.
Appointment of these experts should be finalised during the course of the 2019/20 financial year.
The unit has fully supported work relating to the 2017/18 round of wage negotiations in the public service. On 8 June 2018 the
agreement enjoyed majority and was concluded as Public Service Co-ordinating Bargaining Council (PSCBC) Resolution 1 of
2018. Implementation of the wage agreement is on schedule. Measures are also being implemented to ameliorate cost pressures
originating from the wage agreement in order to protect the integrity of compensation ceilings. In particular, implementation of
the scaled-up early retirement without reduction of pension benefits in terms of Section 16(6) of the Public Service Act (PSA), 1994
has started.
The report on the implementation of the remedial action of the Public Protector contained in the Final Report No.15 of 2016/2017 on
privatisation of the Venda Pension Fund was completed. It was submitted to both the Public Protector and the National Assembly in
terms of the Public Protector’s remedial action. Furthermore, on 11 March 2019 the Minister of Finance brought a court application for
a declaratory order that the remedial action imposed by the Public Protector in Reports No. 18 of 2011/2012 and No. 15 of 2016/2017
(reports on alleged maladministration during the privatisation of the Venda Pension Fund) has been discharged or alternatively,
reviewing and setting aside the Public Protector’s Reports No. 18 of 2011/2012 and No. 15 of 2016/2017. The application is still
pending before court.
Public Finance
The Public Finance division oversees budgetary planning and execution in national departments, provides advice and analysis on
sectoral policies and programmes, monitors public expenditure and advises on financial and budgetary aspects of public policy
and spending proposals. The division provided advice to the Director-General, the Deputy Minister and the Minister on Cabinet
memoranda and public finance issues that require ministerial concurrence or approval by the National Treasury. It continued to be
the primary link between the National Treasury and other national departments and government agencies.
The Administrative Services unit oversees the finances and budgets of a number of central government departments and entities.
Departments and other key structures with which the unit worked in 2018/19 included:
• The Presidency: The unit provided guidance and funding support to the Presidency for the re-establishment of the research and
policy unit within the Presidency in order to ensure greater policy coordination.

97
PART B: PERFORMANCE INFORMATION - Continued
4. PERFORMANCE INFORMATION BY PROGRAMME
• Department of Home Affairs: The unit, together with Budget Office, is part of a working committee on the One Stop Border Post
(OSBP) National Framework. It also played a coordinating role in the process to operationalise the OSBP National Framework and
assist in developing a funding and operating model for the proposed OSBP. The unit further supported the department with the
public-private partnership (PPP) project for infrastructure improvements of six ports of entry and a PPP with banks for the issuing
of passports and smart identity documents.
• Department of Planning, Monitoring and Evaluation: The unit worked closely with the department on the development of its new
organisational structure, and processed the approval of the department’s revised budget programme structure which comprised
of a reduction in departmental programmes from seven to six, with effect from 2019/20. The unit continued participating in
the inter-departmental task team reviewing the National Youth Development Act, 2008 (Act No. 54 of 2008) and advised the
department on financial implications of new provisions to the Act.
• Department of International Relations and Cooperation: The unit, together with the Chief Directorate: African Economic
Integration, continued to participate in the Technical Committee of 15 Finance Ministers’ (TC F15) structures and engagements on
financing modalities and budgeting reforms. The unit facilitated and participated in ongoing discussions between Citibank, the
Reserve Bank and the Department of International Relations and Cooperation on cross-border currency solutions.
• Department of Public Works: The unit provided advice and support to the Property Management Trading Entity (PMTE) on its
proposal to introduce advance billing (a quarter in advance) of or prepayments by client departments as well as the charging of
interest on delayed payments. In line with requirements of the Public Finance Management Act (PFMA) and Treasury Regulations,
the unit highlighted to the PMTE the need for prepayments to be formally provided for through legally binding accommodation
agreements with clients, and for the Department of Public Works may obtain authorisation from the National Treasury for the
PMTE to operate fully in terms of the provisions of Treasury Regulation 19. The unit also advised the PMTE to develop a business
and funding model with a demonstrably adequate and stable capacity for operating the trading entity on a full-cost recovery
basis, and eventually without the support of annual transfer payments from the fiscus. The PMTE presented a possible funding
model to the National Treasury, and has been working on refining the model further in line with a review submitted by the unit.
The unit worked closely with the Intergovernmental Relations division in writing the Public Works chapter of the 2018 Provincial
Budget Review. It also worked with the Department of Public Works in analysing, understanding and proposing the way forward
on both the short- and long-term funding requirements of the Independent Development Trust.
• Department of Women: The unit worked closely with the Department of Women, through an interdepartmental task team in
drafting the framework for the policy on Sanitary Dignity. The Administrative Services Chief Directorate assisted by providing
advice, guidance and recommendations on the funding mechanism for implementing the policy. In the 2019/20 financial year,
provinces received funding of R157 million through the provincial equitable share for free sanitary products for learners from low
income households. The project is targeting girls in the country’s poorest schools (quintiles 1, 2 and 3). Results from this year will
be used to forecast the total project costs over the medium term and determine budget allocations for 2020/21 and 2021/22.
• Public Service Commission: The unit provided advice to the Public Service Commission on the resource and legal implications
of its policy proposal to extend its coverage to the local sphere of government. In its drafting of a bill which provides for the
expansion of the work of the commission to local government, the Public Service Commission considered the comments from
the unit and the Legislation Chief Directorate on attendant financial and legal consequences of the bill.

98
PART B: PERFORMANCE INFORMATION - Continued
4. PERFORMANCE INFORMATION BY PROGRAMME
The Justice and Protection Services unit oversees planning, expenditure and service delivery by departments in this sector. Key
achievements for 2018/19 included:
• Justice and Secret Services Directorate. The directorate provided policy support and advice to the client departments in respect
of a business case for the establishment of a state legal services public entity; proposed directives and financial instructions to be
issued in terms of the Justice Administered Fund Act (2017). A request was also received for consultation on the establishment of
an administration for the Information Regulator, as well as amendment of its corporate form; requests for funding for State Capture
Commission and SARS Commission of Inquiry operations was also received. The directorate also provided inputs to the High-Level
Review Panel on the State Security Agency and Related Matters.
• Police and the Independent Police Investigative Directorate. To strengthen accountability, governance and the management
of the Integrated Justice System programme, the Police and the Independent Police Investigative Directorate (IPID) directorate
facilitated the shifting of funds from the South African Police Service to the Department of Justice and Constitutional Development
(DoJCD) in the 2019 Medium Term Expenditure Framework (MTEF) budget. The directorate also provided guidance to the
Civilian Secretariat for the Police Service on the development of the implementation plan for the White Paper on Safety and
Security as a member of the task team established by the Secretariat to advise on key considerations for the development of the
implementation plan.
• Judicial Administration and Correctional Services Directorate. In response to a court challenge, the directorate continued to provide
support and advice on the financial implications associated with the proposed reconfiguration of the Judicial Inspectorate for
Correctional Services in order to strengthen its independence. Related to this, the directorate is also participating in the task team
responsible for exploring an appropriate organisational form that will enhance the independence of the Judicial Inspectorate for
Correctional Services.
• Defence and Military Veterans Directorate. The directorate engaged and advised the Department of Defence on the human
resource strategy that will enable the department to stay within the compensation of employees’ ceiling. The directorate also
provided ongoing support to the Department of Military Veterans to improve its delivery of benefits to military veterans and their
dependants.
The Education and Related Departments unit monitors and advises on a number of functions implemented largely by provinces and
public entities. During the year under review, the unit assisted with improved monitoring of expenditure and service delivery, and
with reviews of current departmental policy and implementation approaches.
Departments assisted included:
• Department of Basic Education: The unit served on steering committees for the evaluation of learner transport and the early
grade reading strategy. It assisted the Chief Directorate (CD): Public Sector Remuneration Analysis and Forecasting (PSRAF),
the Department of Basic Education (DBE) and the Personnel and Salary Administration System (PERSAL) in ensuring the fair
implementation of the resolution on equalising pay progression for teachers; it also provided assistance and guidance on an
appropriate funding mechanism for the modernisation of the South African School Administration and Management System

99
PART B: PERFORMANCE INFORMATION - Continued
4. PERFORMANCE INFORMATION BY PROGRAMME
(SA-SAMS). It further assisted and advised the sector on the planning and funding of the Sanitation Appropriate for Education
(SAFE) initiative. The unit also assisted the sector to improve the delivery of education services to learners with severe intellectual
disabilities by advising on adjustments to the conditional grant framework, so that the necessary personnel could be appointed
by provinces as required.
• Department of Higher Education and Training: The unit, with the CD: PSRAF and the Department of Public Service and Administration
(DPSA), assisted the department in resolving a payment dispute with Community Education and Training lecturers from Limpopo.
The unit continues to serve on steering committees for the National Skills Development Strategy III, and the technical and
vocational education and training expansion and capacity development programme. The unit is also represented in the extended
ministerial task team working on the state of readiness of integrating returning South African students from Cuba into local
universities and healthcare facilities for completion of their medical training. Along with the Department of Planning, Monitoring
and Evaluation (DPME) and the Department of Higher Education and Training (DHET), the unit is part of the task team working on
the roll-out of the new bursary scheme, implemented as part of the fee-free higher education and training policy.
• Department of Labour: The unit assisted the Department of Trade and Industry (DTI) Technical Working Group on Starting a Business
to address blockages encountered at the Unemployment Insurance Fund (UIF) and Compensation Fund in order to improve
South Africa’s ranking in the Doing Business Index of the World Bank. The unit provided extensive assistance and guidance to the
UIF on the Labour Activation Policy Framework and on the setting of application and evaluation criteria. The unit served on the
Task Team with the DPSA and UIF on developing a guideline for the inclusion of public servants in the UIF.
The Health and Social Development unit oversees budgets, expenditure and service delivery of the Departments of Health and
of Social Development respectively, and is closely involved in a number of policy areas for these sectors. Key work carried out in
2018/19 included:
• Department of Health: In line with the National Health Insurance (NHI) white paper proposals, the unit supported the Department
of Health (DOH) and Presidency on various aspects of NHI including costing of NHI and development of NHI Fund. An indirect
grant was created to address the shortage of critical staff in provinces, medical internship and community service posts, and
provided funding for the immediate need for beds and linen in hospitals. Provision was made for funding for the elimination of
malaria by creating new malaria components in the restructured human immunodeficiency virus (HIV), tuberculosis (TB), malaria
and community outreach grant, and support was provided for the development of the provincial health action plan. As part
of strengthening tertiary service provision, the unit supported the budget facility for infrastructure to finalise allocation for the
building of a new central hospital in Limpopo. The unit has also contributed to numerous internal and external publications,
including the finance chapter of the 2017/18 District Health Barometer and the South African Health Review 2018.
• Department of Social Development (DSD): The unit refined the projection model for social grants to inform the above-inflation
increases in social grants to compensate for the VAT increase. The unit also made a recommendation to the Constitutional Court as
per order regarding the price to be paid to Cash Paymaster Services (CPS) for the administration and payment of social grants, and
was extensively involved in the technical committee of the inter-ministerial committee (IMC) for comprehensive social security
regarding options for the new payment system for social grants. This included assessment of fees proposed by the South African

100
PART B: PERFORMANCE INFORMATION - Continued
4. PERFORMANCE INFORMATION BY PROGRAMME
Post Office (SAPO). Work continued in support of the South African Social Security Agency (SASSA) in oversight and grant payment
facilitation, to manage challenges during the transition from CPS to SAPO and the National Payment System (NPS).
The Economic Services unit works with economic and financial related government departments and agencies. The unit analysed
policy proposals, strategies, funding requests and expenditure plans of departments and state entities responsible for regulatory
oversight, economic development, employment, growth, science and technology, tourism, environmental protection, land reform,
rural development, agriculture, forestry, fisheries, trade and industrial development.
• Department of Public Enterprises: Together with the National Treasury’s Asset and Liability Management Division, the unit
prepared the recommendation on the funding of South African Express Airways.
• Department of Economic Development: As part of monitoring and ensuring implementation of the Public Finance Management
Act, the unit instructed the department to carry out a forensic investigation into irregular expenditure by the Competition
Commission. As a result, the unit developed the scope of the forensic investigation. Furthermore, the unit engaged with the
department on the suitable funding model for the Competition Commission. The Competition Commission and the Department
of Economic Development were further advised to implement cost saving measures, including being considerate with regards
to salary increases.
• Department of Small Business Development: The unit, as a member of the steering committee, participated in the European Union-
funded programme for employment promotion through small, micro and medium enterprises support. It further participated in
conceptualisation of the small business and innovation fund. The unit updated the list of government-funded programmes that
support small, micro and medium enterprises and cooperatives and organised site visits to companies that benefited from the
National Gazelles programme.
• Department of Trade and Industry: During the year, the unit organised site visits to Dube TradePort Special Economic Zone and
Coega Industrial Development Zone as part of monitoring programme implementation. As a result, support and advice were
provided to the department during the process of designating Nkomazi Special Economic Zone in Mpumalanga Province. In
addition, the unit provided comments to a number of Cabinet Memoranda and support was further provided through participating
in the evaluation of applications for the Agro-Processing Support Scheme, the Aquaculture Development and Enhancement
Programme, and participation in the steering committee on the evaluation of government business incentives.
• Department of Science and Technology: The unit provided comments to the Minister of Finance on the financing modalities for
the acquisition of a new 70 MeV cyclotron by iThemba Laboratory for Accelerator Based Sciences (iThemba LABS), a National
Research Facility within the NRF. The unit also provided comments on the 2018 White Paper on Science, Technology and
Innovation.
• Department of Environmental Affairs and Tourism: The unit facilitated the correction and reclassification of the Expanded Public
Works Programme budget and expenditure to align to the modified cash standard. It also represented the National Treasury in
the Reference Group on Financing Methodologies for Biodiversity, participated at the United Nations Development Programme
Regional Biodiversity Conference and the panel discussion on South Africa’s Low Emission Development Strategy. The unit
provided comments on the Tourism Amendment Bill, 2019.
101
PART B: PERFORMANCE INFORMATION - Continued
4. PERFORMANCE INFORMATION BY PROGRAMME
• Job Creation and Labour Affairs: The unit represented the National Treasury on the Expanded Public Works Programme (EPWP)
Inter-Ministerial Committee.
• Department of Agriculture, Forestry and Fisheries: The unit facilitated the development of a blended finance framework and
operating guidelines to ensure the efficient provision of concessionary loans and grants in the agricultural sector. The unit further
assisted the sector departments with reprioritisations to increase allocation towards the blended finance programme. To facilitate
agricultural exports to Europe, the unit arranged site visits funded by the private sector to observe and monitor how the funds
allocated to an import and export system are used and how the South African economy will benefit.
• Department of Mineral Resources: The unit participated in and provided comments on the Mining Charter process. The charter is
meant to help promote transformation of and investment in the mining sector, and its finalisation is expected to boost investment
in the mining sector and the South African economy.
• Department of Rural Development and Land Reform: The unit remains a key member of the IMC on land reform. It is aimed at
accelerating the land reform process, and is involved in all work streams intended to find sustainable land reform solutions.
The Urban Development and Infrastructure unit provides budget, policy and expenditure management and support to national
departments and public entities involved in the built environment and infrastructure investment including transport, energy, water
and sanitation, human settlements, telecommunications and postal services, cooperative governance and traditional affairs. Work
carried out by the unit in 2018/19 included:
• Department of Energy: The unit participated in the consultation of various regulatory and legislative reforms undertaken by
the department and participated in the Integrated National Electrification Programme Steering Committee. The unit provided
comments to the Minister of Finance on the authorisation fees for nuclear licence holders for the National Nuclear Regulator, and
authorisation fees for petroleum pipelines and piped gas for the National Energy Regulator of South Africa.
• Department of Human Settlements: The unit worked on establishing the Informal Settlements Upgrading Partnership Grant, which
will be implemented first as a window within the Human Settlements Development grant in 2019/20. The unit initiated a revised
budget programme structure for the national department. The unit also provided inputs into the Human Settlements Transition
Guide on Classification of Expenditure, and comments were provided on the updated Human Settlements White Paper. The unit
implemented a shift in the institutional arrangements for the Finance Linked Individual Subsidy Programme.
• Department of Telecommunications and Postal Services: The unit participated in the consultation of various legislative reforms
undertaken by the department related to the Information and Communication Technology (ICT) Policy White Paper, including the
Electronic Communications Amendment Bill, the ICT Sector Commission and Tribunal Bill, and the Digital Development Fund Bill.
• Department of Water and Sanitation: The unit coordinated efforts for interventions to address the pollution in the Vaal River system.
Through the National Disaster Management Centre, the unit remains active in the national drought task team and responded to
funding requests from various sectors. The unit provided support to the department in finalising the raw water pricing strategy,
the water and sanitation master plan, and mine water management policy.

102
PART B: PERFORMANCE INFORMATION - Continued
4. PERFORMANCE INFORMATION BY PROGRAMME
• Department of Transport: The unit provided comments to the department on the road tariff determination framework and the
Single Transport Economic Regulator (STER), and supported the department in cabinet approval of the final draft green transport
strategy. The unit represents the National Treasury on various task teams related to policy reform and programme management
support, including the rail policy, maritime strategy, and the intergovernmental steering committee for the rolling stock fleet
renewal programme. Comments were provided on the Civil Aviation Amendment Bill, the Revised Taxi Recapitalisation Programme
and the charter establishing the Southern African Development Community (SADC) aviation safety organisation.
Intergovernmental Relations
The Intergovernmental Relations (IGR) division coordinates fiscal and financial relations between the national, provincial and
local spheres of government. This is an important function given that R739.6 billion or 51.9 per cent of non-interest expenditure
for 2019/20 is allocated to provinces and municipalities. The bulk of this planned expenditure is for priority programmes such as
education, health care and the provision of free basic services.
IGR coordinates inputs to the division of nationally raised revenue between the three spheres of government, the annual Division of
Revenue Bill and Division of Revenue Amendment Bill, and the development of the framework for managing conditional grants. The
2019 Division of Revenue Bill was tabled in February 2019 and included a new conditional grant to fill critical vacancies in the health
sector, and a new grant structure to enable and incentivise integrated infrastructure development in intermediate cities funded
from a combination of grant funds and revenues raised and borrowed by the municipalities themselves. The bill also included a
new incentive component for the Public Transport Network Grant that rewards cities running successful public transport systems.
In addition, the bill introduces ring-fenced funding mechanisms and associated planning rules for the upgrading of informal
settlements in the Human Settlements Development Grant and the Urban Settlements Development Grant. Furthermore, the 2019
Division of Revenue Bill introduced the second change approved through the ongoing review of the provincial equitable share
formula. The education component of this formula now uses data from the Mid-Year Population Estimates produced by Statistics
South Africa for the school aged population, instead of using data from the 2011 Census.
Various policies have been updated to enhance the role of the private sector in financing municipal infrastructure. The municipal
borrowing policy framework was updated by the National Treasury to introduce reforms to expand the scope of municipal borrowing,
and will shortly be submitted to Cabinet for consideration/approval. As part of continued stakeholder engagement and advancement
of the reforms proposed by the Policy Framework for Municipal Borrowing in relation to Development Finance Institutions (DFIs), the
division has commenced with one-on-one engagements to support DFIs in developing indicators for the developmental and social
goals outlined in the policy. Engagement between government and the private sector is also facilitated through structured quarterly
meetings of the Urban Finance Working Group, which provides a platform for aligning private sector development strategies and
indicators with the vision (i.e. promoting investment in strategic infrastructure that drives urban transformation) of government as
outlined in the updated municipal borrowing policy framework. The division publishes a quarterly Municipal Borrowing Bulletin
which provides information on municipal borrowing trends and activities. Development charges are a key financing instrument for
the provision of strategic infrastructure that will accelerate economic growth. The division has consulted various stakeholders to
finalise the process of amending the Municipal Fiscal Powers and Functions Act, 2007 (Act No. 12 of 2007) to enable the improved
regulation of development charges. Formal consultation processes on the Municipal Fiscal Powers and Functions Amendment Bill
commenced by presenting the bill at the Governance and Administration and the Economic Sectors, Employment and Infrastructure
Development clusters. The division intends to submit the bill to Cabinet shortly for approval to publish for public comment.

103
PART B: PERFORMANCE INFORMATION - Continued
4. PERFORMANCE INFORMATION BY PROGRAMME
The Cities Support Programme (CSP) supports metropolitan municipalities to lead the development of more inclusive, productive
and sustainable cities. The CSP targets changes in the enabling policy and regulatory environment for city development and the
fiscal framework that funds this. It supports complementary best practices in urban development. Projects and associated activities
have been identified in consultation with cities through their City Support Implementation Plans (CSIPs). They are implemented at
a national level through five component plans (core city governance, human settlements, public transport, climate resilience and
economic development). Key programmes for the 2018/19 financial year included:
• The Planning Reforms project, which introduced a component on Climate Resilience into the Building Environment Performance
Plans (BEPP) Guidelines for 2019/20. This will signal a new focus on resilience brought into the planning and infrastructure delivery
sphere.
• The planning reforms projects that have been expanding discussions on spatial budgeting to include provincial government, with
a focus on creating an intergovernmental project pipeline. The mid-year budget and benchmarking engagements with the cities
are also reinforcing strategy-led budgeting in the metropolitan municipalities.
• The 2018 Executive Leadership Programme (ELP), which included the political and administrative heads of the metros. This five-
day programme, in cooperation with GIBS, focused on sustainability and resilience in our metros. The feedback confirmed a highly
successful ELP with significant political buy-in, support and programme participation.
• The finalised overview paper of the Urbanisation Review. The conclusions of the urbanisation review will be further discussed
with the relevant national departments in order to influence some of the sectoral and urban policy discussions and reforms.
Presentations on the urbanisation review summary findings have been made at a number of forums including the Extended
Technical Budget Forum on 17 July 2018, the Winter Budget Forum on 24 July 2018, the Gauteng MEC-Mayors meeting on 24
August 2018, the Centre for Affordable Housing Finance in Africa (CAHF) `Community of Practice’ on housing and economic
development, the Integrated Urban Development Framework (IUDF) meeting for provinces on 31 August 2018, and the Gauteng
Planning Division on 14 September 2018.
The Cities’ Infrastructure Delivery and Management System (CIDMS) manuals and companion were launched on 1 November 2018
as part of one Infrastructure Delivery Management System (IDMS) initiatives being rolled out by National Treasury. This will see the
development of targeted interventions in the form of toolkits for different spheres of government, but with a unifying objective of
improving and accelerating infrastructure delivery and enhancing its management. The CIDMS is being piloted in three cities: the
City of Johannesburg, the eThekwini Municipality and the City of Cape Town.
• The Cities Support Programme is seen as the platform for the implementation of the IUDF, especially for the metropolitan
municipalities. Projects undertaken through the CSP on accelerating land reform and the Urbanisation Review were elevated
through the IUDF platforms and structures. Further, technical inputs emanating from the CSP were also utilised in the Urban
Conference in October 2018 under the auspices of the IUDF.
• The Integrated City Development Grant (ICDG) was established in 2013/14 to provide incentives for metropolitan municipalities
to integrate and focus their infrastructure investments and regulatory instruments in identified integration zones. In the 2018/19
financial year, the grant continued to focus on investments in the identified integration zones in cities through financing of agreed
104
PART B: PERFORMANCE INFORMATION - Continued
4. PERFORMANCE INFORMATION BY PROGRAMME
studies and infrastructure. During the reporting period, 12 programmes were planned and 10 programmes implemented in the
integration zones.
The division continues to support the implementation of the infrastructure delivery management system (IDMS) to improve
infrastructure delivery performance across the provinces and in local governments. The implementation is supported by two
major initiatives: the Infrastructure Delivery Management toolkit, which guides the implementation of the IDMS, as well as the
Framework for Infrastructure Delivery and Procurement Management (FIDPM), which is the legislated arm of the IDMS. The
performance-based system was introduced for Education and Health to institutionalise IDMS principles relating to planning and
delivery in provinces. Thirty-six provincial infrastructure plans were assessed in collaboration with the relevant national sector
departments (Education and Health). A Best Practice Workshop was facilitated to allow cross learning among provinces in an
effort to strengthen various sections of the planning documents. Furthermore, provincial visits were conducted specifically
for provinces that did not qualify to address specific areas that required improvement. These interventions are hoped to yield
positive results during the next assessment period.
During the reporting period, the focus was on ensuring that all municipal budgets and adjustment budgets are funded. Extensive
work was done to support and guide in the main the 17 non-delegated municipalities under the direct umbrella of the National
Treasury’s support. Municipal Finance Management Act (MFMA) Circulars numbers 93 and 94 were published to provide municipalities
with guidance in preparing their 2018/19 Medium-Term Revenue and Expenditure Framework (MTREF) budgets, including annual
guidance on the effective utilisation of the conditional grants. In addition, follow-up training on the use of a generic framework for
assessment and analysis of municipal budgets in line with municipal budget and reporting regulations (MBRR) was undertaken.
For ten consecutive years, the division has institutionalised two formal annual engagements with the 17 non-delegated municipalities,
namely the municipal budget and benchmark, and the mid-year budget and performance assessment engagements. The metros’
2018/19 budget and benchmark engagement was conducted over two days in conjunction with the Department of Cooperative
Governance and Traditional Affairs (CoGTA) to allow for robust discussion on spatial development and integrated planning efforts,
as well as budgetary and performance issues; other cities’ engagements were held over a single day. Due to the maturing system of
budget engagements and assessment, metros are beginning to contribute meaningfully to the process. These engagements have
been instrumental in ensuring that the tabled budgets of 10 of the 17 non-delegated municipalities are credible, sustainable and
funded. The National Treasury has subsequently engaged with the municipalities with unfunded tabled budgets to ensure that they
adopt a funded budget. Notwithstanding this intervention, one (Mangaung) remained unfunded.
In-year reporting is now well institutionalised, with most municipalities consistently producing in-year financial reports. Consolidated
in-year reports on municipal financial performance reports were published quarterly, in line with Section 71 of the Municipal Finance
Management Act, 2003 (Act No. 56 of 2003) (MFMA), Section 30(3) of the Division of Revenue Act, 2018 (Act No. 1 of 2018) (DoRA) and
the Division of Revenue Amendment Act, 2018 (Act No. 14 of 2018). The National Treasury also published the annual consolidated
set of budget information for all municipalities 12 times consecutively. The routine publication of budget and in-year financial
performance information for local government enables better in-year management and oversight of budgets, since these reports
become management tools on the one hand, and early warning mechanisms on the other, thereby assisting councils to improve
their municipal performance.

105
PART B: PERFORMANCE INFORMATION - Continued
4. PERFORMANCE INFORMATION BY PROGRAMME
IGR continued to improve the conditional grant monitoring framework for local government. In the 2018/19 municipal financial
year, municipalities were allocated R62.7 billion in the form of the equitable share, and a total amount of R60.1 billion was transferred
to municipalities by 30 March 2019. The remaining balance of R2.6 billion was not transferred to municipalities as a result of the
offsetting of 2017/18 unspent conditional grants in terms of section 22(4) (a) of 2018 DoRA. The DoRA allows municipalities to repay
unspent funds in instalments, since offsetting the entire amount from the equitable share in a single tranche could risk crippling
their finances.
The National Treasury continues to assist low-performing municipalities to improve spending and manage their conditional grants.
The principle is that if conditional grants are unspent at the end of the financial year, municipalities must request permission to roll
over these unspent conditional grants. Failure to secure approval from the National Treasury, which oversees the process, results in
these unspent funds being recalled to the National Revenue Fund.
During the 2017/18 financial year, the total conditional grant rollover amount requested by municipalities amounted to R3.2 billion.
The National Treasury, however, only approved a rollover amount of R904.2 million (including the Urban Settlements Development
Grant) for implementation into the 2018/19 financial year.
The Municipal Infrastructure Grant (MIG) continues to show under-performance, reflected by poor spending of some municipalities.
During the 2018/19 financial year the Department of Cooperative Governance (DCoG), which administers the MIG, initiated
the withholding of funds from municipalities with under-spending of 40 per cent or more and as a result, the National Treasury
reallocated funds to municipalities that showed good spending performance. As part of the support provided by the National
Treasury to under-performing municipalities, the National Treasury reallocated monies from the Masilonyana, Makana, Ubuntu,
and Mamusa and redirected their MIG monies to Lejweleputswa, Sarah Baartman, Pixley Ka Seme and Dr Ruth Segomotsi
Mompati district municipalities respectively to implement the programme on their behalf. The arrangement assisted these local
municipalities to continue with projects while addressing their financial management and governance challenges. The Urban
Settlements Development Grant (USDG), allocated to metropolitan municipalities as a supplementary programme to the cities
capital programme, has seen a significant under-performance during the year.
Furthermore, the National Treasury continued to provide support to municipalities in the Eastern Cape, Free State, Limpopo,
Mpumalanga and North West provinces. These municipalities have experienced institutional and cash flow challenges that
impacted on their management of conditional grants. The National Treasury provided support to these municipalities through
management of the in-year payment schedule to only transfer funds upon verification of approved invoices for work done against
the conditional grant frameworks and complementary business plans. The National Treasury will continue to support some of these
municipalities in the new financial year. Since the introduction of the support, municipalities are beginning to safeguard conditional
grants, however extensive work still needs to be done to support these municipalities. The provincial treasuries and Cooperative
Governance, Human Settlements and Traditional Affairs (CoGHSTA) together with the Municipal Infrastructure Support Agent (MISA)
have been instrumental in this process, wherein they were at the forefront of the verification of submitted invoices, and verification
of work done (especially MISA), thus ensuring conditional grants are spent for their intended purposes and payments are in line with
work done.

106
PART B: PERFORMANCE INFORMATION - Continued
4. PERFORMANCE INFORMATION BY PROGRAMME
The Municipal Standard Chart of Accounts (mSCOA) enforces the link between planning (IDP) and the budget through the project
segment and enables annual reporting and performance management linked to strategic service delivery objectives. Towards
this end, the National Treasury has also continued to meet quarterly with the Reporting Reference Group to discuss and agree
on mSCOA-related reporting issues. The reference group consists of representatives from National and Provincial Treasuries, all
municipal system vendors, municipalities that act as their own vendors (Cities of Cape Town, eThekwini and Johannesburg), the
Accounting Standards Board (ASB) and the Chartered Institute of Government Finance, Audit and Risk Officers (CIGFARO). These
meetings have also eliminated the duplication of efforts when National and Provincial Treasuries meet with system vendors
separately on the same issues.
Significant strides have been made in the implementation of mSCOA post 1 July 2017. Two year post implementation, at least
ten of the 12 system vendors in the municipal space have fully integrated system solutions, while the submission rate of financial
information in the form of data strings by municipalities are exceeding 80 per cent. Nonetheless, mSCOA is an organisation-
wide reform and should be embraced by the whole organisation to achieve the overall objectives. It is noted that a number of
municipalities are exerting themselves to embrace the reform, while some are not putting in any effort, and others are simply not
able to. Where municipalities have taken ownership of mSCOA implementation significant progress has been made, but too much
reliance is still placed on consultants and system vendors.
In an effort to build a capable state, coaching was piloted in Mpumalanga treasury for senior management, which has had
a positive effect in improved teamwork and cooperation towards common goals, and realisation of the importance of self-
management. Capacity building continued in the provincial sphere of government, with the essentials of budget formulation
and budget analysis courses restructured and held within a week for efficiencies. The demand continued to be high, leading to
the set target being exceeded with 272 provincial officials trained during the year. Further 105 officials, mostly health revenue
clerks in hospitals, were trained on revenue management and collection. Division of Revenue workshops were also held with
relevant national and provincial departments.
The structure for the provincial budget benchmark meetings was changed from two half-day sessions to one full-day session per
province, following feedback received from treasuries as a way of improving processes and value-add provided to Provincial Treasuries.
The meeting focused on equitable distribution of resources and service delivery among departments, public entities and infrastructure.
The focus was also on the impact of population dynamics on service delivery, given fiscal constraints on how provinces are creating
fiscal space through cost-cutting or revenue improvement, and measures to improve provincial economic growth.
The division ensured that all provincial financial information is published quarterly, and brought the process forward to ensure
that savings are realised in the gazetting process; the gazette included infrastructure spending. IGR also provided comprehensive
parliamentary briefings on outcomes of provincial expenditure for 2017/18, and likely risks for provinces over the 2018 Medium Term
Expenditure Framework (MTEF), Additionally, there was also a focus on the performance of several conditional grants such as the
Human Settlements Development Grant and the Early Childhood Grant.
Significant progress was made in the North West intervention at the end of the financial year in the directives issued by the National
Treasury in relation to budget. The North West Development Corporation (NWDC) was relocated to Enterprise and Economic
Development, the budget of Health was increased as directed and entities were reviewed through the Government Technical
Advisory Centre (GTAC) to ensure readiness for configuration together with departments after elections.

107
PART B: PERFORMANCE INFORMATION - Continued
4. PERFORMANCE INFORMATION BY PROGRAMME
PERF
ORM
AN
CE IN
DIC
ATO
RS
PRO
GRA
MM
E 3:
PU
BLIC
FIN
AN
CE A
ND
BU
DG
ET M
AN
AG
EMEN
T
APP#
INDI
CATO
RAC
TUAL
2015
/16
ACTU
AL20
16/1
7AC
TUAL
2017
/201
8TA
RGET
20
18/2
019
ACTU
AL20
18/2
019
DEVI
ATIO
N FR
OM
PLAN
NED T
ARGE
TRE
ASON
FOR
DEVI
ATIO
N
STRA
TEG
IC O
BJEC
TIVE
3.1
: DEV
ELO
PIN
G A
ND
IMPL
EMEN
TIN
G S
OU
TH A
FRIC
A’S
FISC
AL
POLI
CY A
ND
REL
ATED
FRA
MEW
ORK
S
3.1.
1M
aint
ain
the
expe
nditu
re c
eilin
gPl
anne
d ex
pend
iture
fo
r the
201
6 M
TEF
perio
d is
in li
ne w
ith
expe
nditu
rece
iling
requ
irem
ents
2016
MTE
F: R
3.53
tr
illio
n m
ain
budg
et n
onin
tere
st
expe
nditu
rean
noun
ced
in th
e 20
15
MTE
F +
R25
9.5
billi
on
in te
rms
of th
e fis
cal
polic
y st
ance
= R
3.79
tr
illio
n. T
his
incl
udes
a
prov
isio
nal a
lloca
tion
not a
ssig
ned
to v
otes
of
R18
.3 b
illio
n an
d a
cont
inge
ncy
rese
rve
of R
31 b
illio
n.
0Le
ss th
an 0
for e
ach
year
Less
than
or
equ
al to
ex
pend
iture
ce
iling
an
noun
ced
in
mai
n bu
dget
Expe
nditu
re
ceili
ng
anno
unce
d in
m
ain
budg
et n
ot
less
than
or e
qual
to
exp
endi
ture
ce
iling
an
noun
ced
in
the
MTB
PS
Expe
nditu
re
ceili
ng
anno
unce
d in
m
ain
budg
et
grea
ter t
han
expe
nditu
re
ceili
ng
Und
er-
perf
orm
ance
is
att
ribut
ed
to th
e ex
pend
iture
ce
iling
bei
ng
revi
sed
upw
ards
by
R14
billi
on
in 2
019/
20,
R1.3
bill
ion
in
2020
/21
and
R732
mill
ion
in 2
021/
22 a
s an
noun
ced
in th
e m
ain
budg
et.
3.1.
2N
umbe
r of fi
scal
fra
mew
orks
pr
ovid
ed
N/A
22
22
N/A
N/A

108
PART B: PERFORMANCE INFORMATION - Continued
4. PERFORMANCE INFORMATION BY PROGRAMME
PRO
GRA
MM
E 3:
PU
BLIC
FIN
AN
CE A
ND
BU
DG
ET M
AN
AG
EMEN
T
APP#
INDI
CATO
RAC
TUAL
2015
/16
ACTU
AL20
16/1
7AC
TUAL
2017
/201
8TA
RGET
20
18/2
019
ACTU
AL20
18/2
019
DEVI
ATIO
N FR
OM
PLAN
NED T
ARGE
TRE
ASON
FOR
DEVI
ATIO
N
STRA
TEG
IC O
BJEC
TIVE
3.2
: PRE
PARA
TIO
N O
F TH
E N
ATIO
NA
L BU
DG
ET
3.2.
1N
umbe
r of
budg
et g
uide
lines
is
sued
N/A
1 se
t of M
TEF
guid
elin
esis
sued
by
July
1 pr
ogra
mm
e sc
hedu
ling
MTE
C m
eetin
gs
draf
ted
by Ju
ly
1 A
ENE
guid
elin
e is
sued
in A
ugus
t
1 EN
E gu
idel
ine
issu
ed in
Nov
embe
r
• 1 s
et o
f MTE
F gu
idel
ines
issu
ed
by Ju
ly• 1
pro
gram
me
sche
dulin
g M
TEC
m
eetin
gs d
raft
ed
by Ju
ly• 1
AEN
E gu
idel
ine
issu
ed in
Aug
ust
• 1 E
NE
guid
elin
e is
sued
in O
ctob
er
• 1 s
et o
f MTE
F gu
idel
ines
is
sued
by
July
• 1
AEN
E gu
idel
ine
issu
ed in
A
ugus
t• 1
EN
E gu
idel
ine
issu
ed in
O
ctob
er
• 1 s
et o
f MTE
F gu
idel
ines
is
sued
by
July
• 1
AEN
E gu
idel
ine
issu
ed in
A
ugus
t• 1
EN
E gu
idel
ine
issu
ed in
O
ctob
er
N/A
N/A

109
PART B: PERFORMANCE INFORMATION - Continued
4. PERFORMANCE INFORMATION BY PROGRAMME
PRO
GRA
MM
E 3:
PU
BLIC
FIN
AN
CE A
ND
BU
DG
ET M
AN
AG
EMEN
T
APP#
INDI
CATO
RAC
TUAL
2015
/16
ACTU
AL20
16/1
7AC
TUAL
2017
/201
8TA
RGET
20
18/2
019
ACTU
AL20
18/2
019
DEVI
ATIO
N FR
OM
PLAN
NED T
ARGE
TRE
ASON
FOR
DEVI
ATIO
N
3.2.
2O
btai
n bu
dget
ex
pend
iture
al
loca
tion
deci
sion
s fro
m th
e ex
ecut
ive
The
targ
ets
set b
y th
e M
TEC
Sec
reta
riat
wer
e m
et, w
ith
base
line
Allo
catio
nre
com
men
datio
ns
bein
g am
ende
dth
roug
hout
the
vario
us p
hase
s of
the
budg
et p
roce
ss a
nd
appr
oved
by M
TEC
, the
M
inis
ters
’Co
mm
ittee
on
the
Budg
et a
nd
ultim
atel
y Ca
bine
t. Fi
nal b
udge
t al
loca
tions
to d
epar
tmen
tsw
ere
dete
rmin
ed in
D
ecem
ber 2
015
and
Janu
ary
2016
.
Adj
ustm
ents
A
ppro
pria
tion
Bill,
201
6 ta
bled
in
Par
liam
ent o
n 26
Oct
ober
201
6.
2016
Adj
uste
d Es
timat
esof
Nat
iona
l Ex
pend
iture
tabl
ed in
Pa
rliam
ent o
n 26
O
ctob
er 2
016.
2016
Med
ium
Te
rm B
udge
tPo
licy
Stat
emen
t ta
bled
inPa
rliam
ent o
n 26
O
ctob
er20
16.
App
ropr
iatio
n Bi
ll, 2
017
tabl
ed in
Pa
rliam
ent o
n 22
Fe
brua
ry 2
017.
2017
Est
imat
es o
f N
atio
nal
Expe
nditu
re
tabl
ed in
Parli
amen
t on
22
Febr
uary
2017
.
• Var
ious
fund
ing
reco
mm
enda
tions
w
ere
mad
e to
th
e M
TEC
, the
M
INCO
MBU
D a
nd
Cabi
net w
ithin
bu
dget
cal
enda
r tim
elin
es• 1
Cab
inet
en
dors
emen
t of
nat
iona
l go
vern
men
t ex
pend
iture
al
loca
tions
ob
tain
ed b
y en
d of
cal
enda
r yea
r
• 1
Cabi
net
endo
rsem
ent
of n
atio
nal
gove
rnm
ent
expe
nditu
re
allo
catio
ns b
y en
d of
cal
enda
r ye
ar
• 1
Cabi
net
endo
rsem
ent
of n
atio
nal
gove
rnm
ent
expe
nditu
re
allo
catio
ns b
y en
d of
cal
enda
r ye
ar
N/A
N/A

110
PART B: PERFORMANCE INFORMATION - Continued
4. PERFORMANCE INFORMATION BY PROGRAMME
PRO
GRA
MM
E 3:
PU
BLIC
FIN
AN
CE A
ND
BU
DG
ET M
AN
AG
EMEN
T
APP#
INDI
CATO
RAC
TUAL
2015
/16
ACTU
AL20
16/1
7AC
TUAL
2017
/201
8TA
RGET
20
18/2
019
ACTU
AL20
18/2
019
DEVI
ATIO
N FR
OM
PLAN
NED T
ARGE
TRE
ASON
FOR
DEVI
ATIO
N
3.2.
220
17 B
udge
t Re
view
tabl
ed in
Pa
rliam
ent o
n22
Feb
ruar
y 20
17.
STRA
TEG
IC O
BJEC
TIVE
3.3
: PU
BLIC
ATIO
N O
F TH
E N
ATIO
NA
L BU
DG
ET
3.3.
1Bu
dget
legi
slat
ion
and
acco
mpa
nyin
g do
cum
enta
tion
tabl
ed in
Par
liam
ent
and
publ
ishe
d
The
ENE
and
AEN
E w
as c
ompi
led
and
tabl
ed in
line
with
the
parli
amen
tary
prog
ram
me
3 bu
dget
do
cum
ents
tabl
ed in
Feb
ruar
y3
budg
et
docu
men
tsta
bled
in O
ctob
er
• App
ropr
iatio
n Bi
ll,
ENE
and
Budg
et
Revi
ew ta
bled
in
Febr
uary
• A
djus
tmen
ts
App
ropr
iatio
n Bi
ll,
AEN
E an
d M
TBPS
ta
bled
in O
ctob
er
• A
ppro
pria
tion
Bill,
EN
E an
d Bu
dget
Rev
iew
ta
bled
in
Febr
uary
• A
djus
tmen
ts
App
ropr
iatio
n Bi
ll, A
ENE
and
MTB
PS ta
bled
in
Oct
ober
• A
ppro
pria
tion
Bill,
EN
E an
d Bu
dget
Rev
iew
ta
bled
in
Febr
uary
• A
djus
tmen
ts
App
ropr
iatio
n Bi
ll, A
ENE
and
MTB
PS ta
bled
in
Oct
ober
N/A
N/A

111
PART B: PERFORMANCE INFORMATION - Continued
4. PERFORMANCE INFORMATION BY PROGRAMME
PRO
GRA
MM
E 3:
PU
BLIC
FIN
AN
CE A
ND
BU
DG
ET M
AN
AG
EMEN
T
APP#
INDI
CATO
RAC
TUAL
2015
/16
ACTU
AL20
16/1
7AC
TUAL
2017
/201
8TA
RGET
20
18/2
019
ACTU
AL20
18/2
019
DEVI
ATIO
N FR
OM
PLAN
NED T
ARGE
TRE
ASON
FOR
DEVI
ATIO
N
3.3.
2N
umbe
r of
repo
rts
prod
uced
on
pub
lic
finan
ce s
tatis
tics
acco
rdin
g to
fu
nctio
n an
d ec
onom
ic
clas
sific
atio
n
Cons
olid
ated
budg
et a
ccou
nts
for B
udge
t Rev
iew
2016
-- n
atio
nal,
prov
inci
al a
nd p
ublic
en
titie
s. D
ata
used
in
the
com
pila
tion
of
finan
cial
sta
tistic
s fo
r th
e bu
dget
mov
ed
to a
n ap
prop
riate
st
orag
e pl
atfo
rm.
4 re
port
s4
44
N/A
N/A
3.3.
3N
umbe
r of r
epor
ts
prod
uced
on
guid
ance
giv
en to
D
epar
tmen
ts a
nd
entit
ies
on th
e cl
assi
ficat
ion
of
expe
nditu
re
Issu
ed c
lass
ifica
tion
circ
ular
s an
dgu
idel
ines
.Pr
ovid
ed a
dvic
e on
th
e in
terp
reta
tion
of th
e SC
OA
and
the
refe
renc
e gu
ide
on
econ
omic
clas
sific
atio
n.
4 re
port
s4
44
N/A
N/A
STRA
TEG
IC O
BJEC
TIVE
3.4
: MO
NIT
ORI
NG
AN
D A
NA
LYSI
S O
F PU
BLIC
EXP
END
ITU
RE A
ND
SER
VICE
DEL
IVER
Y
3.4.
1Pe
rcen
tage
re
spon
ses
to
Dep
artm
enta
l re
ques
ts fo
r PFM
A
and
TR a
ppro
vals
, se
ctor
al a
naly
sis
and
polic
y ad
vice
N/A
98.9
%97
.5%
100%
94.1
%5.
9%U
nder
-pe
rfor
man
ce
is a
ttrib
uted
to
del
ays
in g
ettin
g re
spon
ses
from
D
epar
tmen
ts/
entit
ies
on
clar
ity s
eeki
ng
ques
tions
.
3.4.
2Pe
rcen
tage
co
mm
ents
to
Cabi
net m
emos
N/A
N/A
N/A
100%
100%
N/A
N/A

112
PART B: PERFORMANCE INFORMATION - Continued
4. PERFORMANCE INFORMATION BY PROGRAMME
PRO
GRA
MM
E 3:
PU
BLIC
FIN
AN
CE A
ND
BU
DG
ET M
AN
AG
EMEN
T
APP#
INDI
CATO
RAC
TUAL
2015
/16
ACTU
AL20
16/1
7AC
TUAL
2017
/201
8TA
RGET
20
18/2
019
ACTU
AL20
18/2
019
DEVI
ATIO
N FR
OM
PLAN
NED T
ARGE
TRE
ASON
FOR
DEVI
ATIO
N
3.4.
3N
umbe
r of I
YM
feed
back
repo
rts
to
Dep
artm
ents
N/A
277
441
540
534
6U
nder
-pe
rfor
man
ce
is a
ttrib
uted
to
Parli
amen
t not
be
ing
requ
ired
to s
ubm
it IY
M
repo
rts
due
to
sepa
ratio
n of
po
wer
s.
3.4.
4N
umbe
r of q
uart
erly
ex
pend
iture
re
port
s su
bmitt
ed
to th
e St
andi
ng
Com
mitt
ee o
n A
ppro
pria
tions
N/A
160
160
44
N/A
N/A
3.4.
5N
umbe
r of
repo
rts
prod
uced
on
revi
ew a
nd
impl
emen
tatio
n of
th
e CO
LA c
ostin
g m
odel
The
mod
el h
as b
een
used
to e
stim
ate
cost
s fo
r im
plem
entin
gth
e 20
16 w
age
adju
stm
ents
as
per
PSC
BC R
esol
utio
n 8
of
2015
and
to fo
rmul
ate
com
pens
atio
n bu
dget
ce
iling
s fo
r the
201
6M
TEF.
Impr
ovem
ents
to
CO
LA m
odel
ar
e in
pro
gres
s w
ith a
naly
sis
of
rem
uner
atio
n po
licie
s an
d pr
elim
inar
y m
odel
de
sign
com
plet
ed.
42
44
N/A
N/A

113
PART B: PERFORMANCE INFORMATION - Continued
4. PERFORMANCE INFORMATION BY PROGRAMME
PRO
GRA
MM
E 3:
PU
BLIC
FIN
AN
CE A
ND
BU
DG
ET M
AN
AG
EMEN
T
APP#
INDI
CATO
RAC
TUAL
2015
/16
ACTU
AL20
16/1
7AC
TUAL
2017
/201
8TA
RGET
20
18/2
019
ACTU
AL20
18/2
019
DEVI
ATIO
N FR
OM
PLAN
NED T
ARGE
TRE
ASON
FOR
DEVI
ATIO
N
3.4.
6Pe
rcen
tage
re
spon
se to
re
ques
ts fo
r sup
port
on
gov
erna
nce
and
finan
cial
m
anag
emen
t m
onito
ring
and
com
plia
nce
syst
em
in p
ublic
ent
ities
pr
ovid
ed
Prov
ided
Inst
itutio
nal
supp
ort t
o N
atio
nal
and
Prov
inci
al p
ublic
en
titie
s re
late
d to
finan
cial
repo
rtin
ggo
vern
ance
and
com
plia
nce.
Fina
lised
NT
regu
latio
n in
puts
rela
ted
to p
ublic
en
titie
s.
100%
100%
100%
100%
N/A
N/A
3.4.
7Pe
rcen
tage
of
Budg
et F
acili
ty o
n In
frast
ruct
ure
(BFI
) pr
ojec
ts e
valu
ated
N/A
N/A
N/A
##
N/A
N/A
STA
RTEG
IC O
BJEC
TIVE
3.5
: CO
ORD
INAT
ING
INTE
RNAT
ION
AL
DEV
ELO
PMEN
T CO
OPE
RATI
ON
3.5.
1Pe
rcen
tage
al
ignm
ent o
f de
velo
pmen
t co
oper
atio
n to
go
vern
men
t pol
icy
and
prio
ritie
s
N/A
100%
100%
100%
100%
N/A
N/A
3.5.
2Pe
rcen
tage
m
anag
emen
t an
d co
ordi
natio
n of
dev
elop
men
t co
oper
atio
n in
So
uth
Afri
ca
N/A
100%
100%
100%
100%
N/A
N/A
STRA
TEG
IC O
BJEC
TIVE
3.6
: CO
ORD
INAT
ING
INTE
RGO
VERN
MEN
TAL
RELA
TIO
NS
3.6.
1N
umbe
r of D
ivis
ion
of R
even
ue a
nd
Div
isio
n of
Rev
enue
A
men
dmen
t Bill
s pu
blis
hed
annu
ally
N/A
32
22
N/A
N/A

114
PART B: PERFORMANCE INFORMATION - Continued
4. PERFORMANCE INFORMATION BY PROGRAMME
PRO
GRA
MM
E 3:
PU
BLIC
FIN
AN
CE A
ND
BU
DG
ET M
AN
AG
EMEN
T
APP#
INDI
CATO
RAC
TUAL
2015
/16
ACTU
AL20
16/1
7AC
TUAL
2017
/201
8TA
RGET
20
18/2
019
ACTU
AL20
18/2
019
DEVI
ATIO
N FR
OM
PLAN
NED T
ARGE
TRE
ASON
FOR
DEVI
ATIO
N
3.6.
2N
umbe
r of r
efor
ms
intr
oduc
ed
to e
nhan
ce
prov
inci
al a
nd lo
cal
gove
rnm
ent fi
scal
fra
mew
orks
N/A
42
22
N/A
N/A
3.6.
3N
umbe
r of p
lans
as
sess
ed to
sup
port
im
prov
emen
ts
in in
frast
ruct
ure
plan
ning
and
im
plem
enta
tion
in
prov
ince
s
N/A
1834
3636
N/A
N/A
3.6.
4N
umbe
r of b
uilt
envi
ronm
ent
perf
orm
ance
pla
ns
asse
ssed
to s
uppo
rt
impr
ovem
ent i
n th
e m
etro
polit
an
mun
icip
aliti
es
N/A
88
88
N/A
N/A
3.6.
5N
umbe
r of c
apac
ity
build
ing
initi
ativ
es
to fa
cilit
ate
impr
oved
pla
nnin
g,
budg
etin
g an
d fin
anci
al
man
agem
ent
N/A
3359
5050
N/A
N/A
3.6.
6N
umbe
r of q
uart
erly
fin
anci
al re
port
s pu
blis
hed
N/A
44
88
N/A
N/A
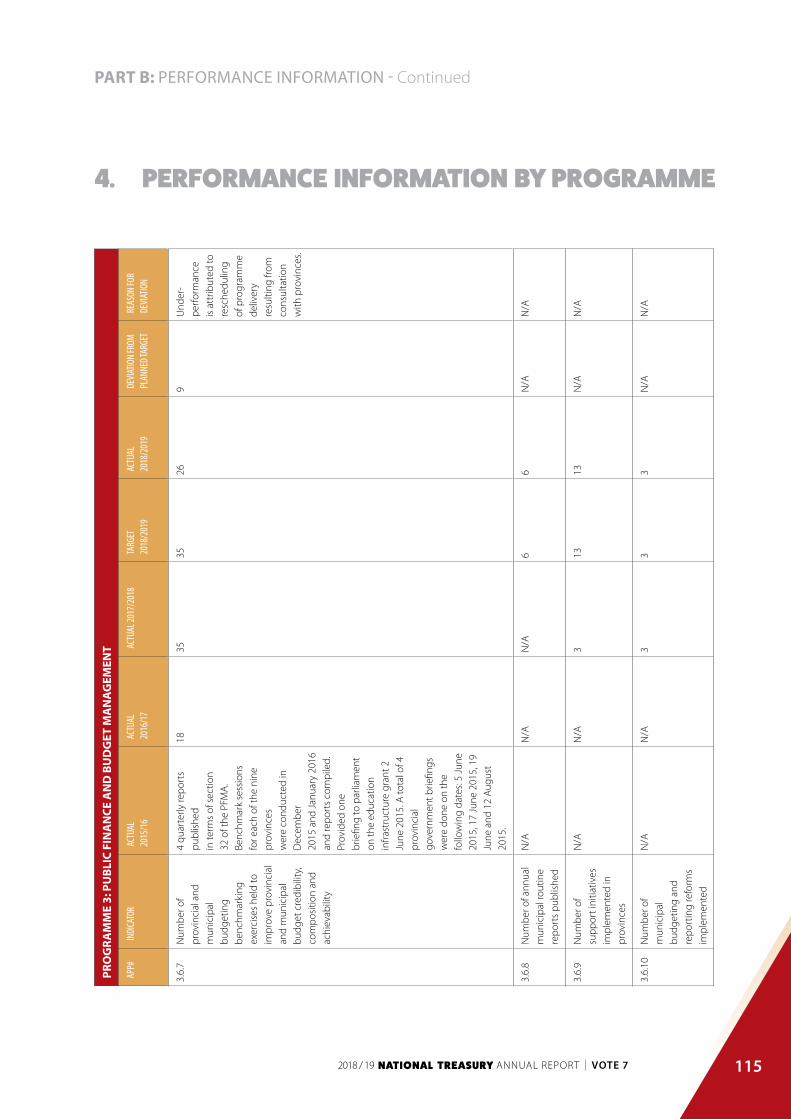
115
PART B: PERFORMANCE INFORMATION - Continued
4. PERFORMANCE INFORMATION BY PROGRAMME
PRO
GRA
MM
E 3:
PU
BLIC
FIN
AN
CE A
ND
BU
DG
ET M
AN
AG
EMEN
T
APP#
INDI
CATO
RAC
TUAL
2015
/16
ACTU
AL20
16/1
7AC
TUAL
2017
/201
8TA
RGET
20
18/2
019
ACTU
AL20
18/2
019
DEVI
ATIO
N FR
OM
PLAN
NED T
ARGE
TRE
ASON
FOR
DEVI
ATIO
N
3.6.
7N
umbe
r of
prov
inci
al a
nd
mun
icip
al
budg
etin
g be
nchm
arki
ng
exer
cise
s he
ld to
im
prov
e pr
ovin
cial
an
d m
unic
ipal
bu
dget
cre
dibi
lity,
co
mpo
sitio
n an
d ac
hiev
abili
ty
4 qu
arte
rly re
port
s pu
blis
hed
in te
rms
of s
ectio
n 32
of t
he P
FMA
. Be
nchm
ark
sess
ions
fo
r eac
h of
the
nine
pr
ovin
ces
wer
e co
nduc
ted
in
Dec
embe
r20
15 a
nd Ja
nuar
y 20
16
and
repo
rts
com
pile
d.
Prov
ided
one
brie
fing
to p
arlia
men
t on
the
educ
atio
n in
frast
ruct
ure
gran
t 2
June
201
5. A
tota
l of 4
pr
ovin
cial
gove
rnm
ent b
riefin
gs
wer
e do
ne o
n th
e fo
llow
ing
date
s: 5
June
20
15, 1
7 Ju
ne 2
015,
19
June
and
12
Aug
ust
2015
.
1835
3526
9U
nder
-pe
rfor
man
ce
is a
ttrib
uted
to
resc
hedu
ling
of p
rogr
amm
e de
liver
y re
sulti
ng fr
om
cons
ulta
tion
with
pro
vinc
es.
3.6.
8N
umbe
r of a
nnua
l m
unic
ipal
rout
ine
repo
rts
publ
ishe
d
N/A
N/A
N/A
66
N/A
N/A
3.6.
9N
umbe
r of
supp
ort i
nitia
tives
im
plem
ente
d in
pr
ovin
ces
N/A
N/A
313
13N
/AN
/A
3.6.
10N
umbe
r of
mun
icip
al
budg
etin
g an
d re
port
ing
refo
rms
impl
emen
ted
N/A
N/A
33
3N
/AN
/A
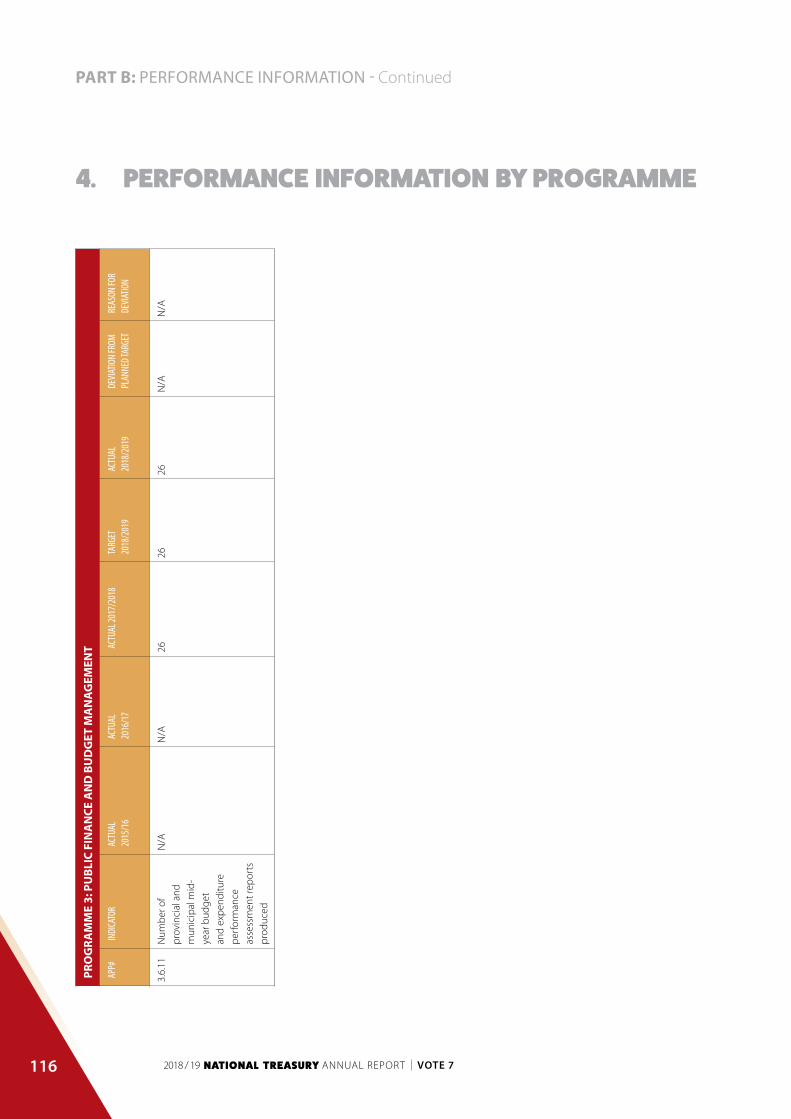
116
PART B: PERFORMANCE INFORMATION - Continued
4. PERFORMANCE INFORMATION BY PROGRAMME
PRO
GRA
MM
E 3:
PU
BLIC
FIN
AN
CE A
ND
BU
DG
ET M
AN
AG
EMEN
T
APP#
INDI
CATO
RAC
TUAL
2015
/16
ACTU
AL20
16/1
7AC
TUAL
2017
/201
8TA
RGET
20
18/2
019
ACTU
AL20
18/2
019
DEVI
ATIO
N FR
OM
PLAN
NED T
ARGE
TRE
ASON
FOR
DEVI
ATIO
N
3.6.
11N
umbe
r of
prov
inci
al a
nd
mun
icip
al m
id-
year
bud
get
and
expe
nditu
re
perf
orm
ance
as
sess
men
t rep
orts
pr
oduc
ed
N/A
N/A
2626
26N
/AN
/A

117
PART B: PERFORMANCE INFORMATION - Continued
4. PERFORMANCE INFORMATION BY PROGRAMME
STRATEGY TO OVERCOME AREAS OF UNDER-PERFORMANCE(INDICATORS AND ACTION PLANS)
UNDER-PERFORMING INDICATORS AND ACTION PLANS
PROGRAMME 3: PUBLIC FINANCE AND BUDGET MANAGEMENT
APP# Indicator Deviation Action Plan
STRATEGIC OBJECTIVE 3.1: DEVELOPING AND IMPLEMENTING SOUTH AFRICA’S FISCAL POLICY AND RELATED FRAMEWORKS
3.1.1 Maintain the expenditure ceiling Under-performance is attributed to
the expenditure ceiling being revised
upwards by R14 billion in 2019/20,
R1.3 billion in 2020/21 and R732
million in 2021/22 as announced in
the main budget.
N/A
STRATEGIC OBJECTIVE 3.4: MONITORING AND ANALYSIS OF PUBLIC EXPENDITURE AND SERVICE DELIVERY
3.4.1 Percentage responses to
Departmental requests for PFMA and
TR approvals, sectoral analysis and
policy advice
Under-performance is attributed
to delays in getting responses from
Departments/entities on clarity
seeking questions.
Engagements were held with
respective business units to ensure
that the required consultations
are finalised within the agreed
timeframes.
3.4.3 Number of IYM feedback reports to
Departments
Under-performance is attributed to
Parliament not being required to
submit IYM reports due to separation
of powers
N/A
STRATEGIC OBJECTIVE 3.6: COORDINATING INTERGOVERNMENTAL RELATIONS
3.6.7 Number of provincial and municipal
budgeting benchmarking exercises
held to improve provincial and
municipal budget credibility,
composition and achievability
Under-performance is attributed to
rescheduling of programme delivery
resulting from consultation with
provinces.
This area of work has been
restructured.
CHANGES TO PLANNED TARGETS
There are no changes to planned targets for this reporting period.

118
PART B: PERFORMANCE INFORMATION - Continued
4. PERFORMANCE INFORMATION BY PROGRAMME
LIN
KIN
G P
ERFO
RMA
NCE
WIT
H B
UD
GET
S
PRO
GRA
MM
E 3:
PU
BLIC
FI
NA
NCE
AN
D B
UD
GET
M
AN
AG
EMEN
T
2018
/19
2017
/18
FIN
AL
APPR
OPR
IATI
ON
ACTU
ALEX
PEN
DIT
URE
(OVE
R)/U
ND
ER
EXPE
ND
ITU
REFI
NAL
AP
PRO
PRIA
TIO
NAC
TUAL
EXPE
ND
ITU
RE(O
VER)
/UN
DER
EX
PEN
DIT
URE
R’00
0R’
000
R’00
0R’
000
R’00
0R’
000
PRO
GRA
MM
E M
AN
AG
EMEN
T FO
R
PUBL
IC F
INA
NC
E A
ND
BU
DG
ET
MA
NA
GEM
ENT
19 3
1619
121
195
24 5
3520
833
3 70
2
PUBL
IC F
INA
NC
E64
706
64 0
3766
964
221
61 6
872
534
BUD
GET
OFF
ICE
AN
D
COO
RDIN
ATIO
N
60 5
3059
666
864
59 6
2857
663
1 96
5
INTE
RGO
VERN
MEN
TAL
RELA
TIO
NS
101
713
100
764
949
103
265
97 8
055
460
FIN
AN
CIA
L A
ND
FIS
CA
L
COM
MIS
SIO
N
51 7
8251
782
-50
647
50 6
47-
TO
TAL
298
047
295
370
2 67
730
2 29
628
8 63
513
661

119
PART B: PERFORMANCE INFORMATION - Continued
4. PERFORMANCE INFORMATION BY PROGRAMME
4.4 PROGRAMME 4: ASSET AND LIABILITY MANAGEMENT
PURPOSE
Manage government’s annual funding programme in a manner that ensures prudent cash management, and an optimal portfolio
of debt and other fiscal obligations. Promote and enforce the prudent financial management of state-owned entities through
financial analysis and oversight.
STRATEGIC OBJECTIVES
• Exercise oversight of state-owned companies
• Optimal debt management and funding of government’s borrowing requirement
• Ensure sound management of government’s cash resources
• Minimise and mitigate risks emanating from government’s fiscal obligations
SUB-PROGRAMMES
Programme Management for Asset and Liability Management
This sub-programme provides the overall management and regulatory support related to this programme, including support
for planning, delivery implementation, monitoring and associated activities that include the management of government debt,
financial assets and investments.
State-Owned Companies Financial Management and Governance
This sub-programme is responsible for overseeing state-owned enterprises to enable them to meet government’s policy objectives
in a financially and fiscally sustainable manner, and for promoting sound corporate governance of these enterprises. Over the
medium term, the unit will continue to review and compile submissions on applications for funding, guarantees and borrowing
limits as well as other PFMA applications from state-owned companies. Where such applications are approved, the unit will monitor
financial performance and adherence to any conditions. It will also continue to review state owned enterprises’ corporate plans and
annual reports as they are received annually, and progress on the enterprises’ capital expenditure programmes will be monitored on
a quarterly basis. To strengthen regulatory compliance, the unit will report on compliance by major state-owned companies with
the PFMA, the Companies Act (2008), Treasury Regulations and the King III and IV Code on Corporate Governance.
Government Debt Management
This sub-programme is responsible for government’s long term funding needs. It manages the funding of domestic and foreign
debt, contributes to the development of domestic financial markets, maintains sound investor relations, and ensures that debt
servicing costs remain sustainable.

120
PART B: PERFORMANCE INFORMATION - Continued
4. PERFORMANCE INFORMATION BY PROGRAMME
Financial Operations
This sub-programme provides for government’s short term funding needs, invests government’s surplus cash, prudently manages
cash in all spheres of government, and ensures efficient accounting for debt, the supply of reliable systems, and the provision of
high- quality information.
Strategy and Risk Management
This sub-programme develops and maintains a risk management framework for the debt and contingent liabilities of government
and monitors the implementation of strategies to ensure that risks remain within tolerance thresholds and that the risk of an adverse
credit rating outcome for the sovereign credit rating is mitigated.
Financial Investments
This sub-programme provides for the transfer of funding to meet the needs of state-owned entities such as the re-capitalisation of
the Land and Agricultural Development Bank of South Africa, Postbank and the Development Bank of Southern Africa.
SERVICE DELIVERY OBJECTIVES AND INDICATORS
Recent outputs
The Governance and Financial Oversight of the State-Owned Companies (SOCs) annually reviews the corporate plans of all public
entities listed in Schedule 2 and 3B of the PFMA, including selected Schedule 3A entities. In addition to assessing their alignment with
government’s priorities, financial sustainability and soundness of governance, the review aims to identify possible risks proactively
so that appropriate mitigating actions can be taken. Similarly, public entities’ performance is evaluated through a review of their
annual reports. In 2018/19, 100 per cent of corporate plans and annual reports of Schedule 2 and 3B SOCs, development finance
institutions (DFIs) and water boards were received by the due date and reviewed within the stipulated timeframes. South African
Airways (SAA) and Overberg Water Board had not submitted their annual financial statements at the time of the review. A negative
economic outlook prevailed in the 2018/19 corporate plan projections, with SOCs collectively revising profitability downward. The
reviews highlighted that declining profitability is primarily driven by employee compensation, weak revenue growth and excessive
debt levels. Financially strained SOCs are expecting to realise better operational efficiencies over the Medium-Term Expenditure
Framework (MTEF) against a backdrop of proposed restructuring efforts centred on revenue optimisation, cost reduction/
containment initiatives and improved liquidity management.
The unit also analysed the performance of those Schedule 2 and 3B public entities that report to the minister of finance as their
executive authority, against the key performance indicators agreed in their individual shareholder compacts. The analysis informed
the remuneration incentives of the public entities, considering the State-Owned Enterprises Remuneration Guide (SOERG) and
organisational performance.
The appointment and re-appointment of non-executive directors to the Development Bank of Southern Africa (DBSA) board was
processed for Cabinet approval. The appointment of a Chief Executive Officer for the Land and Agricultural Development Bank of

121
PART B: PERFORMANCE INFORMATION - Continued
4. PERFORMANCE INFORMATION BY PROGRAMME
South Africa (Land Bank) and the appointment of the Public Investment Corporation board is still under way. The appointment of a
service provider that will assist the minister of finance to evaluate SOC boards that report to him, to ensure that members have the
relevant skills, experience and competencies to strengthen and capacitate these boards, was at an advanced stage.
During the year, government issued South African Express (SAX) and Denel with additional government guarantees of R1.962 billion
and R1 billion respectively.
Additionally, the Water Board tariff submissions were reviewed and analysed in terms of the Municipal Finance Management Act
(MFMA) and response letters were provided.
As the shareholder for South African Airways (SAA) for most part of the year until transfer to the Department of Public Enterprises,
the following Section 54 PFMA applications were finalised:
• Cease own metal operations to Abuja, Nigeria
• Purchase of two A340-600 aircraft
• Enter into direct operating lease agreement for eight B737-800 aircraft for a period of up to six years
• Cease SAA’s own metal service to Central Africa
• Extension of lease agreements for two B737-300 freighter aircraft for a period of seven and 16 months respectively,
• Mango Airlines to commence operations between Lanseria and Zanzibar
• SAA to commence operations between Johannesburg and Guangzhou, China.
In terms of guarantee conditions for Eskom, the minister of finance also approves Section 54 PFMA applications for the entity. The
following were completed:
• The retrofitting of flue gas desulphurisation technology at the Medupi power station.
• The renewable energy independent power producers’ procurement programme in terms of bid window 3.5, 4 and 4.5 following
the minister of energy’s recent announcement of the revised tariff level.
• The Highveld South Reinforcement Scheme.
A Section 54 PFMA notification regarding disposal of Thin Film Solar Technologies (TFST) shares by the Central Energy Fund was finalised.
Recapitalisation requests for Denel, the South African Post Office (SAPO), the South African Broadcasting Corporation (SABC), SAA
and SAX were reviewed and analysed, and inputs given. Inputs were provided on policy, legislation and strategies relating to Eskom,
SAA, SAPO, the SABC, Sentech, Broadband Infraco (BBI), and the National Water Master Plan. The Land and Agricultural Development
Bank of South Africa (Land Bank) repaid debt of R2.7 billion, thereby reducing government guarantee exposure. The guarantees to
Eskom, Denel, SAA, SAX, SAPO, and the Land Bank are monitored regularly and quarterly reports on compliance with guarantee
conditions were provided to the Fiscal Liability Committee (FLC).
During the year, Eskom was granted a foreign currency borrowing limit amounting to R308 billion. SAA’s request for an R18 billion
foreign currency borrowing limit was rejected as the Minister of Finance was of the view that SAA’s balance sheet could not carry
further debt. Approvals of borrowing authorisations and related limits were granted to Rand Water and the National Housing
Finance Corporation.

122
PART B: PERFORMANCE INFORMATION - Continued
4. PERFORMANCE INFORMATION BY PROGRAMME
The following activities were also undertaken during 2018/19:
• Review of 32 annual reports of SOCs/Development Finance Institutions (DFIs) and water boards, and 33 corporate plans of SOCs/
DFIs and water boards for the 2018/19 financial year.
• Funding proposals for the recapitalisation of the Land Bank, Denel, SAA, SAX, Sentech and SAPO were presented to the Ministers’
Committee on the Budget Technical Committee (MTEC).
• Conclusion of shareholder compacts with the Public Investment Corporation (PIC), the South African Special Risks Insurance
Association (SASRIA), SAA, the Land Bank and the Development Bank of Southern Africa (DBSA).
• Review of the annual reports and corporate plans of the PIC, SASRIA, the Land Bank and DBSA, which were tabled in Parliament.
• The Land Bank Decade Report was completed. The document summarised the development and government support provided
to the Land Bank since its transfer to the Minister of Finance.
• A report on the effectiveness of industrial policy as a tool for higher growth and developed was completed.
• Completion of the review of the Development Finance System and draft development finance policy. The outcome of the review
has been communicated to the minister for his review and recommendations to the Cabinet.
• Supported the minister as a member of the inter-ministerial committee on SOC reforms by distributing circulars to all departments
on the implementation of the Private Sector Participation framework as well as the framework for quantifying the costs of the
developmental activities undertaken by SOCs. The circular requested that entities incorporate these frameworks into their 2019/20
Corporate Plan submissions.
• Reviewed and provided inputs on the Johannesburg Stock Exchange (JSE) debt listing requirement with respect to its impact on
SOC debt financing activities.
• Reviewed and provided inputs to the drafting of various SOC Domestic Medium-Term Note (DMTN) programmes.
• Compiled a report on SOC liquidity and related risks as well as the potential threat to the fiscal framework.
• The strategic risk benchmark indicators express the preference of government to a set of exposure ranges and limits to refinancing
risk, inflation risk, interest rate risk and foreign currency risk. These ranges and limits characterise government’s portfolio and
funding decisions in terms of: the maturity structure (how much to issue in the short-term, medium-term and long-term), currency
structure (the share of local currency debt versus foreign currency debt) and the interest rate and/or indexation structure (fixed
rate versus floating rate versus inflation-linked debt) under conditions of risk and uncertainty.
• Although the debt portfolio has grown from a gross loan debt of R1.6 trillion in March 2014 to an estimated gross loan debt of
R2.9 trillion in March 2019, none of the benchmark indicators were breached. In order to manage the natural tension that exists
between risk, funding and liquidity objectives, government opted for an overarching objective of reducing refinancing risk by
increasing the weighted average term to maturity of government debt portfolio, reported to be 13 years and two months in
March 2019, while managing the cost of net new funding prudently as and when government raised funding to fully fund the
budget deficit and successfully repay debt redemptions due.
• South Africa’s debt structure and length of maturity are often highly commended by rating agencies as credit strength, since they
act as a buffer against external and interest shocks due to the relatively lower share of foreign currency debt of around 10 per
cent compared to similar rated peers, while 90 per cent of the total debt is in local currency and of long maturity, which does not
require frequent refinancing. These among other factors saw South Africa achieving stable outlooks from all rating agencies in
2018 from a challenging period of successive downgrades in 2017.
• The review of the Development Finance Institutions (DFIs) system has been completed, as well as a draft development finance
policy in this regard. A Cabinet memo has been drafted and is in the approval process to communicate the outcome of the review
as well as the draft policy.

123
PART B: PERFORMANCE INFORMATION - Continued
4. PERFORMANCE INFORMATION BY PROGRAMME
• Asset and Liability Management played a coordinating role in the Eskom unbundling process including defining the Chief
Restructuring Officer’s roles and responsibilities, and identifying debt restructuring options.
• The government successfully financed the gross borrowing requirement of R259.1 billion. This was financed through net issuance
of domestic short-term loans (R14.1 billion), domestic long-term loans (R183.0 billion) and foreign loans of R25.2 billion (US$2.0
billion). In addition, R36.8 billion of cash and other balances was used to finance part of the gross borrowing requirement. During
2018/19, R21.4 billion of short-dated bonds was exchanged for long-dated bonds.
• The cost of servicing government debt amounted to R181.8 billion, compared to an original budget of R180.1 billion. Domestic
and foreign loans of R15.6 billion were repaid during 2018/19. The Financial Operations Unit met all government’s rand and
foreign currency commitments on a daily basis. In addition, surplus cash was optimally invested.
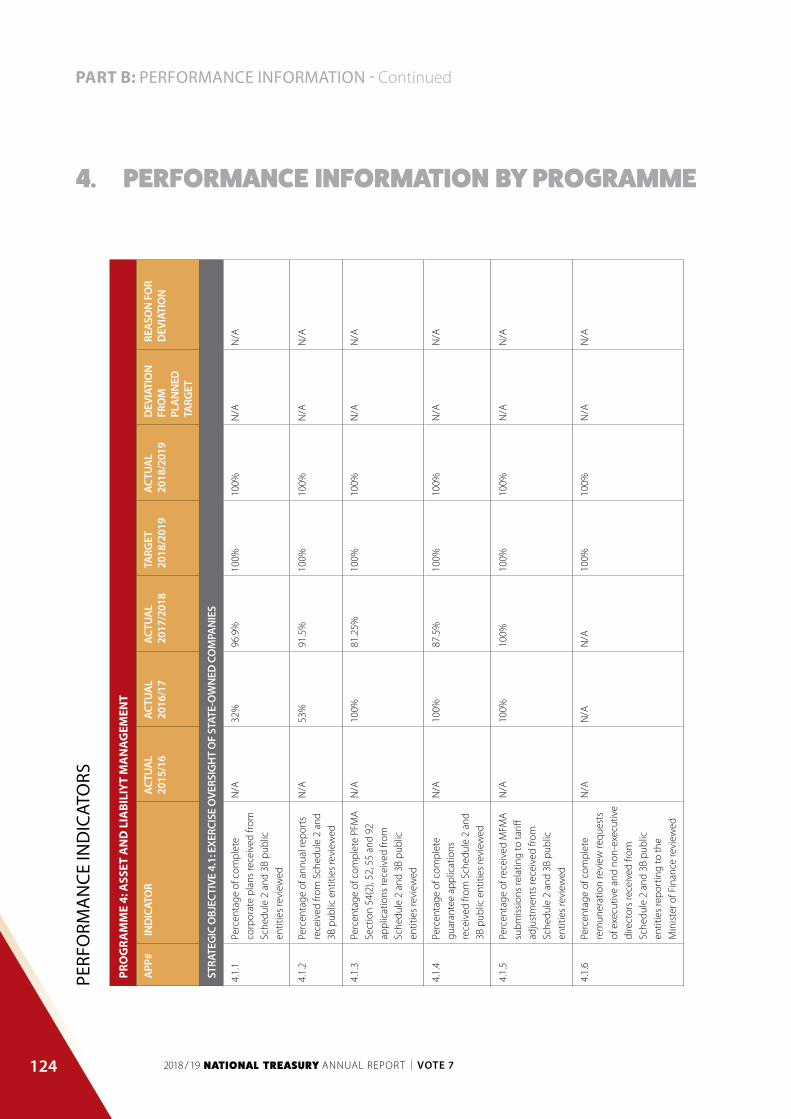
124
PART B: PERFORMANCE INFORMATION - Continued
4. PERFORMANCE INFORMATION BY PROGRAMME
PERF
ORM
AN
CE IN
DIC
ATO
RS
PRO
GRA
MM
E 4:
ASS
ET A
ND
LIA
BILI
YT M
AN
AG
EMEN
T
APP
#IN
DIC
ATO
RAC
TUA
L20
15/1
6AC
TUA
L20
16/1
7AC
TUA
L 20
17/2
018
TARG
ET
2018
/201
9AC
TUA
L20
18/2
019
DEV
IATI
ON
FR
OM
PL
AN
NED
TA
RGET
REA
SON
FO
R D
EVIA
TIO
N
STRA
TEG
IC O
BJEC
TIVE
4.1
: EXE
RCIS
E O
VERS
IGH
T O
F ST
ATE-
OW
NED
CO
MPA
NIE
S
4.1.
1Pe
rcen
tage
of c
ompl
ete
corp
orat
e pl
ans
rece
ived
from
Sc
hedu
le 2
and
3B
publ
ic
entit
ies
revi
ewed
N/A
32%
96.9
%10
0%10
0%N
/AN
/A
4.1.
2Pe
rcen
tage
of a
nnua
l rep
orts
re
ceiv
ed fr
om S
ched
ule
2 an
d 3B
pub
lic e
ntiti
es re
view
ed
N/A
53%
91.5
%10
0%10
0%N
/AN
/A
4.1.
3Pe
rcen
tage
of c
ompl
ete
PFM
A
Sect
ion
54(2
), 52
, 55
and
92
appl
icat
ions
rece
ived
from
Sc
hedu
le 2
and
3B
publ
ic
entit
ies
revi
ewed
N/A
100%
81.2
5%10
0%10
0%N
/AN
/A
4.1.
4Pe
rcen
tage
of c
ompl
ete
guar
ante
e ap
plic
atio
ns
rece
ived
from
Sch
edul
e 2
and
3B p
ublic
ent
ities
revi
ewed
N/A
100%
87.5
%10
0%10
0%N
/AN
/A
4.1.
5Pe
rcen
tage
of r
ecei
ved
MFM
A
subm
issi
ons
rela
ting
to ta
riff
adju
stm
ents
rece
ived
from
Sc
hedu
le 2
and
3B
publ
ic
entit
ies
revi
ewed
N/A
100%
100%
100%
100%
N/A
N/A
4.1.
6Pe
rcen
tage
of c
ompl
ete
rem
uner
atio
n re
view
requ
ests
of
exe
cutiv
e an
d no
n-ex
ecut
ive
dire
ctor
s re
ceiv
ed fr
om
Sche
dule
2 a
nd 3
B pu
blic
en
titie
s re
port
ing
to th
e M
inis
ter o
f Fin
ance
revi
ewed
N/A
N/A
N/A
100%
100%
N/A
N/A
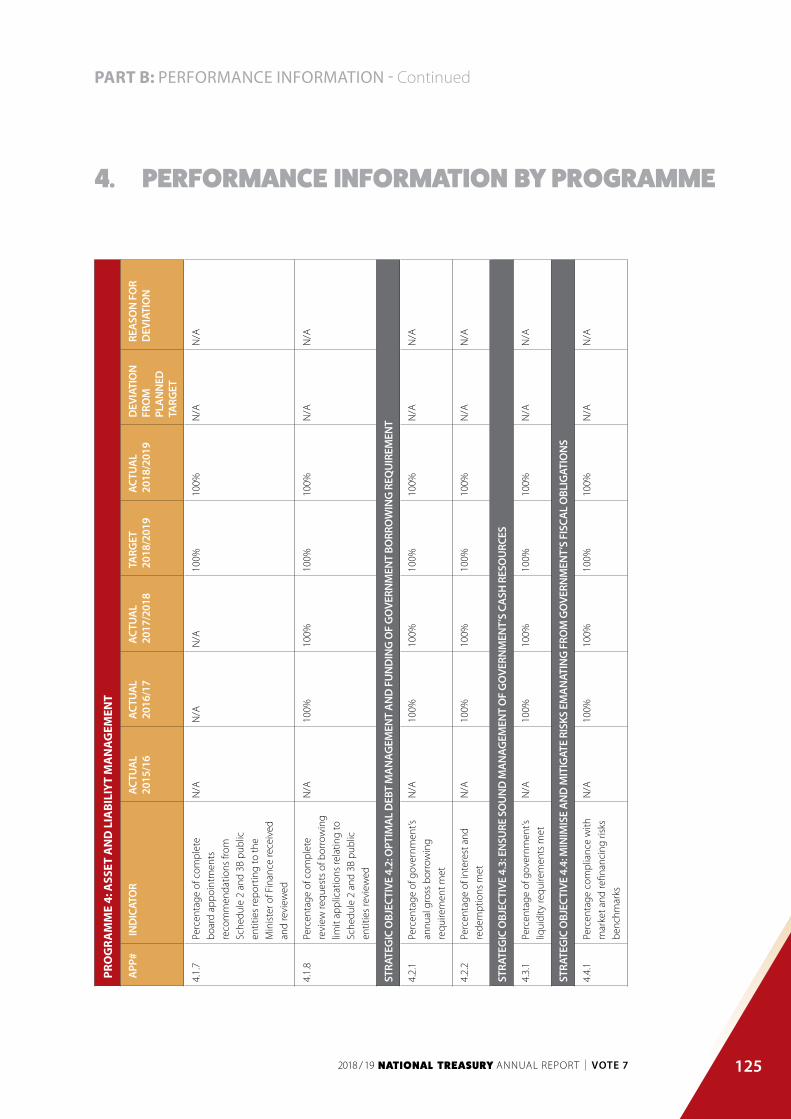
125
PART B: PERFORMANCE INFORMATION - Continued
4. PERFORMANCE INFORMATION BY PROGRAMME
PRO
GRA
MM
E 4:
ASS
ET A
ND
LIA
BILI
YT M
AN
AG
EMEN
T
APP
#IN
DIC
ATO
RAC
TUA
L20
15/1
6AC
TUA
L20
16/1
7AC
TUA
L 20
17/2
018
TARG
ET
2018
/201
9AC
TUA
L20
18/2
019
DEV
IATI
ON
FR
OM
PL
AN
NED
TA
RGET
REA
SON
FO
R D
EVIA
TIO
N
4.1.
7Pe
rcen
tage
of c
ompl
ete
boar
d ap
poin
tmen
ts
reco
mm
enda
tions
from
Sc
hedu
le 2
and
3B
publ
ic
entit
ies
repo
rtin
g to
the
Min
iste
r of F
inan
ce re
ceiv
ed
and
revi
ewed
N/A
N/A
N/A
100%
100%
N/A
N/A
4.1.
8Pe
rcen
tage
of c
ompl
ete
revi
ew re
ques
ts o
f bor
row
ing
limit
appl
icat
ions
rela
ting
to
Sche
dule
2 a
nd 3
B pu
blic
en
titie
s re
view
ed
N/A
100%
100%
100%
100%
N/A
N/A
STRA
TEG
IC O
BJEC
TIVE
4.2
: OPT
IMA
L D
EBT
MA
NAG
EMEN
T A
ND
FU
ND
ING
OF
GO
VERN
MEN
T BO
RRO
WIN
G R
EQU
IREM
ENT
4.2.
1Pe
rcen
tage
of g
over
nmen
t’s
annu
al g
ross
bor
row
ing
requ
irem
ent m
et
N/A
100%
100%
100%
100%
N/A
N/A
4.2.
2Pe
rcen
tage
of i
nter
est a
nd
rede
mpt
ions
met
N/A
100%
100%
100%
100%
N/A
N/A
STRA
TEG
IC O
BJEC
TIVE
4.3
: EN
SURE
SO
UN
D M
AN
AGEM
ENT
OF
GO
VERN
MEN
T’S
CASH
RES
OU
RCES
4.3.
1Pe
rcen
tage
of g
over
nmen
t’s
liqui
dity
requ
irem
ents
met
N/A
100%
100%
100%
100%
N/A
N/A
STRA
TEG
IC O
BJEC
TIVE
4.4
: MIN
IMIS
E A
ND
MIT
IGAT
E RI
SKS
EMA
NAT
ING
FRO
M G
OVE
RNM
ENT’
S FI
SCA
L O
BLIG
ATIO
NS
4.4.
1Pe
rcen
tage
com
plia
nce
with
m
arke
t and
refin
anci
ng ri
sks
benc
hmar
ks
N/A
100%
100%
100%
100%
N/A
N/A

126
PART B: PERFORMANCE INFORMATION - Continued
4. PERFORMANCE INFORMATION BY PROGRAMME
PRO
GRA
MM
E 4:
ASS
ET A
ND
LIA
BILI
YT M
AN
AG
EMEN
T
APP
#IN
DIC
ATO
RAC
TUA
L20
15/1
6AC
TUA
L20
16/1
7AC
TUA
L 20
17/2
018
TARG
ET
2018
/201
9AC
TUA
L20
18/2
019
DEV
IATI
ON
FR
OM
PL
AN
NED
TA
RGET
REA
SON
FO
R D
EVIA
TIO
N
4.4.
2N
umbe
r of i
nter
actio
ns to
m
anag
e an
d en
sure
effe
ctiv
e re
latio
ns w
ith th
e cr
edit
ratin
g ag
enci
es
N/A
6N
/A8
71
Und
er-
perf
orm
ance
is
attr
ibut
ed to
a
deci
sion
that
was
ta
ken
by o
ne c
redi
t ra
ting
agen
cy to
re
duce
the
num
ber
of a
nnua
l vis
its.
4.4.
3N
umbe
r of r
epor
ts o
n th
e m
anag
emen
t of g
over
nmen
t’s
cont
inge
nt li
abili
ties
and
coun
terp
arty
risk
’s co
ntin
gent
lia
bilit
ies
and
coun
terp
arty
risk
N/A
5N
/A6
6N
/AN
/A

127
PART B: PERFORMANCE INFORMATION - Continued
4. PERFORMANCE INFORMATION BY PROGRAMME
STRATEGY TO OVERCOME AREAS OF UNDER-PERFORMANCE(INDICATORS AND ACTION PLANS)
UNDER-PERFORMING INDICATORS AND ACTION PLANS
PROGRAMME 4: ASSET AND LIABILIYT MANAGEMENT
APP# Indicator Deviation Action Plan
STRATEGIC OBJECTIVE 4.4: MINIMISE AND MITIGATE RISKS EMANATING FROM GOVERNMENT’S FISCAL OBLIGATIONS
4.4.2 Number of interactions to manage
and ensure effective relations with
the credit rating agencies
Under-performance is attributed to a
decision that was taken by one credit
rating agency to reduce the number
of annual visits.
N/A
CHANGES TO PLANNED TARGETS
There are no changes to planned targets for this reporting period.

128
PART B: PERFORMANCE INFORMATION - Continued
4. PERFORMANCE INFORMATION BY PROGRAMME
LIN
KIN
G P
ERFO
RMA
NCE
WIT
H B
UD
GET
S
PRO
GRA
MM
E 4:
ASS
ET A
ND
LI
ABI
LITY
MA
NA
GEM
ENT
2018
/19
2017
/18
FIN
AL
APPR
OPR
IATI
ON
ACTU
ALEX
PEN
DIT
URE
(OVE
R)/U
ND
ER
EXPE
ND
ITU
REFI
NAL
AP
PRO
PRIA
TIO
NAC
TUAL
EXPE
ND
ITU
RE(O
VER)
/UN
DER
EX
PEN
DIT
URE
R’00
0R’
000
R’00
0R’
000
R’00
0R’
000
PRO
GRA
MM
E M
AN
AG
EMEN
T
FOR
ASS
ET A
ND
LIA
BILI
TY
MA
NA
GEM
ENT
11 8
196
944
4 87
512
463
6 11
06
353
STAT
E O
WN
ED E
NTI
TY F
INA
NC
IAL
MA
NA
GEM
ENT
AN
D G
OVE
RNA
NC
E
35 0
3731
452
3 58
510
035
025
10 0
33 6
651
360
GO
VERN
MEN
T D
EBT
MA
NA
GEM
ENT
19 9
8419
539
445
18 7
3517
924
811
FIN
AN
CIA
L O
PERA
TIO
NS
24 6
7724
227
450
22 3
9321
974
419
STRA
TEG
Y A
ND
RIS
K
MA
NA
GEM
ENT
10 0
689
023
1 04
511
696
10 0
881
608
TO
TAL
101
585
91 1
8510
400
10 1
00 3
1210
089
761
10 5
51

129
PART B: PERFORMANCE INFORMATION - Continued
4. PERFORMANCE INFORMATION BY PROGRAMME
4.5 PROGRAMME 5: FINANCIAL ACCOUNTING AND SUPPLY CHAIN MANAGEMENT SYSTEMS
PURPOSE
Facilitate governance and accountability by promoting and enforcing the transparent, economic and effective management of
revenue, expenditure, assets, liabilities and supply chain processes in the public sector.
STRATEGIC OBJECTIVES
• Improve financial management governance and compliance across all spheres and entities in government, giving effect to the
PFMA and MFMA
• Support and facilitate capacity development across all spheres of government in order to improve financial management
execution
• Manage existing financial systems and renew these as required to exercise comprehensive financial management
• Modernise SCM policies and procedures
• Monitor and evaluate SCM performance
• Develop and implement strategic procurement
• Build and strengthen stakeholder relations
• Modernise and automate SCM processes
SUB-PROGRAMMES
PROGRAMME MANAGEMENT FOR FINANCIAL ACCOUNTING AND SUPPLY CHAIN
SYSTEMS
This sub-programme supports planning, monitoring and coordinating deliverables of the programme plan.
Office of Accountant-General
The purpose of this sub-programme is to facilitate accountability, governance and oversight by promoting transparent, economic, efficient and effective management in respect of revenue, expenditure, assets and liabilities in the South African public sector through:• Financial Systems: Maintain and improve existing financial management systems and develop and implement the new IFMS.
This will replace ageing and fragmented financial, supply chain and HR management systems within national and provincial Departments
• Financial Reporting for National Accounts: Provides support to all spheres of government in implementing financial reporting frameworks and preparing consolidated financial statements. Responsibilities include monthly monitoring of state budgets and
expenditure reports in line with the PFMA

130
PART B: PERFORMANCE INFORMATION - Continued
4. PERFORMANCE INFORMATION BY PROGRAMME
• Financial Management Policy and Compliance Improvement: Promotes financial management compliance with the PFMA and
MFMA through the development of supporting guides and frameworks, instructions and regulations, and provides implementation
support in the three spheres of government. It regulates financial management and accounting policies and sets the risk and IA
frameworks in the three spheres of government. It also provides technical and other support for institutional capacity building
relating to financial management and provides assistance with specialised performance audits and investigations of malpractice
across all spheres of government
Office of the Chief Procurement Officer
The purpose of this sub-programme is to improve procurement systems in government, reduce wasteful expenditure and bring
about efficient and cost-effective procurement across government. The office aims to enable the efficient, economic, effective and
transparent use of financial and other resources, including state assets, for improved service delivery; and to promote, support and
enforce transparent and effective management of state procurement and sound stewardship of government assets and resources.
SERVICE DELIVERY OBJECTIVES AND INDICATORS
Recent outputs
Office of the Accountant-General
During this reporting period, the Office of the Accountant-General achieved the following objectives per sub-programme:
Accounting Support and Reporting
During the period under review, the unit prepared and tabled the 2017/18 consolidated annual financial statements (AFS) for the
National Revenue Fund, the Reconstruction and Development Programme Fund, and national departments and public entities.
The unit monitored and reported on information on national revenue and expenditure through reports published monthly in
terms of Section 32 of the Public Finance Management Act, 1999 (Act No. 1 of 1999) (PFMA). The unit continued its initiatives in
which national departments, entities, municipalities and provincial treasuries are supported in accounting and reporting queries,
the improvement of audit outcomes; the review, feedback and monitoring of AFS preparation plans, AFS and audit action plans;
participation in internal stakeholder engagements such as the mid-term budget visits and MFMA joint meetings; and external
stakeholder engagements such as the public sector accounting forum, thereby influencing technical accounting developments.
The Chief Financial Officers’ forums were hosted by the unit within the national and local government spheres, facilitating peer
learning and sharing of experiences by financial practitioners with regard to the operational impacts in respect of the coordination,
communication and implementation of financial management and governance reforms.
Internal Audit and Risk Management Support: The Internal Audit Support and Risk Management Chief Directorates continued to
support the work of internal audit and risk management in both the PFMA and MFMA spending agencies. Information-sharing
platforms and forums were set up to disseminate information on new initiatives as well as create opportunities for interaction with

131
PART B: PERFORMANCE INFORMATION - Continued
4. PERFORMANCE INFORMATION BY PROGRAMME
peers and provide guidance where necessary. Audit committees were also offered support through guidance available in various
platforms, induction of new audit committees, attendance of audit committee meetings and continued interaction with Chief Audit
Executives. State of Readiness assessments were conducted in those PFMA and MFMA spending agencies that were ready for them,
to determine the effectiveness of the internal audit function. Reports generated from these assessments were also used to provide
additional support. Targeted support was offered to the affected departments through the strategic support plans. An initiative on
building capacity in the performance of state-of-readiness assessments has also ensued.
Technical Support Services
Technical Support Services (TSS) continued to provide technical accounting support to all spheres of government following due
processes and established approaches. In providing technical accounting support, TSS kept record of the issues raised by clients
and stakeholders, and responded to them as accurately and timeously as possible to ensure that all clients and stakeholders
receive value.
As the custodians of the accounting framework for departments, the Modified Cash Standard (MCS), TSS interacted with various
users and conducted research to maintain and enhance knowledge on the accounting subject matter. Comments received though
interactions and research informed the development of relevant accounting frameworks, policies and guides. Development also
encompassed updating the MCS and updating or creating accounting manuals and tools, including templates.
In addition to being the MCS standard-setter, TSS participated in setting local and international public sector accounting standards
through board membership and providing comments on draft documents issued for comment by the Accounting Standards Board
(ASB) and the International Public Sector Standards Board (IPSASB). TSS contributions had an impact on public sector standard-
setting to achieve broader accountability.
The Office of the Accountant-General represented by TSS is the co-owner of the Standard Chart of Accounts (SCOA) with the Budget
Office, and together they form the SCOA Technical Committee which aims to achieve uniformity in classification in budgeting and
financial reporting. In the past year, the SCOA Technical Committee experienced an increase in requests for classification guidance
emanating primarily from classification matters raised as audit findings. The SCOA Technical Committee provided responses to issues
raised, issued circulars for pervasive issues and in certain instances collaborated with Provincial Treasuries in developing guidance.
Integrated Financial Management System
The Integrated Financial Management System (IFMS) Architecture Planning and Design phase was completed during the financial
year. This will guide the design of the functional, technology and security elements of the IFMS. The planning for the Common
Design phase of the programme also commenced in the third quarter of 2018/19. Common Design will be executed in 2019/20
and will provide the impetus for an acceleration of the final design and roll-out of the IFMS. The establishment of a panel of System
Implementers is at an advanced stage and will be finalised in 2019/20. The overall implementation of the IFMS is nine months
behind schedule, according to the plan approved by Cabinet in 2016. Actions to mitigate the impact of the delay have been factored
into the revised implementation plan.

132
PART B: PERFORMANCE INFORMATION - Continued
4. PERFORMANCE INFORMATION BY PROGRAMME
Financial Systems
The unit continued to operate at an optimum level, providing a stable platform for the systems operations of government. A slight
difficulty was, however, experienced in daily bank reconciliations, largely due to external factors.
Specialised Audit Services
The unit provided investigation capacity to the state agencies on critical and complex forensic investigations relating to public
procurement through 48 forensic investigations and specialised performance audit reports. In building the capacity of law
enforcement institutions SAS provided training to prosecutors and detectives on PFMA and MFMA case law for criminal convictions.
In addition, Specialised Audit Services (SAS) provided advisory services to law enforcement agencies which included the National
Prosecuting Authority (NPA) and the South African Police Service (SAPS) in the investigation of complex commercial crime cases
including Eskom coal procurement, the Free State Vrede Dairy Farm and the Eastern Cape/North West and Kwazulu-Natal (KZN)
Social Housing Regulatory Authorities (SHRAs). Ninety cases were referred for criminal investigations, with advisory services provided
to law enforcement agencies or anti-corruption task teams.
SAS is also collaborating with the NPA’s Asset Forfeiture Unit in the recovery of state funds to the National Revenue Fund and other
assets lost through criminal incidents.
Governance Monitoring and Compliance
The Chief Directorate continues to support departments and public entities with the interpretation and application of the Public
Finance Management Act (PFMA), Act No 1 of 1999 and Treasury regulations through the development of Treasury instructions,
frameworks, guidelines and conducting information sessions.
In assisting institutions with the interpretation and application of the PFMA and its related prescripts, the Chief Directorate developed
a Framework on Irregular Expenditure to provide procedures to be followed by accounting officers and accounting authorities when
dealing with irregular expenditure, and to address challenges experienced with the implementation of principles issued in previous
financial years. Advocacy sessions on the framework were undertaken with relevant stakeholders, including the Auditor-General of
South Africa, with the aim of addressing linkages between the Public Audit Amendment Act, 2018 (Act No.5 of 2018) and application
of the PFMA.
The Chief Directorate continued to monitor compliance with the requirement that spending agencies must pay suppliers within
30 days from receipt of an invoice. In this regard, regular reports were forwarded to the Forum of South African Directors-General
(FOSAD) through the Department of Planning, Monitoring and Evaluation (DPME) and to the Outcome 12: Governance and
Administration working sessions. The status of compliance in this regard is also reported annually to the Standing Committee on
Public Accounts (SCOPA) and to Cabinet.

133
PART B: PERFORMANCE INFORMATION - Continued
4. PERFORMANCE INFORMATION BY PROGRAMME
The Chief Directorate reports annually to SCOPA, the Standing Committee on Finance (SCoF) and Cabinet on progress with financial
management in PFMA-compliant institutions. The report further conveys the National Treasury`s initiatives in responding to
transversal issues identified as challenges in PFMA-compliant institutions.
Capacity Building
For the year under review, the unit has recorded significant achievements in the implementation of the Capacity Development Strategy
(CDS) for Public Finance Management (PFM) that seeks to achieve and sustain excellence in the management of public funds.
The unit concluded the €20 million European Union-funded Financial Management Improvement Programme (FMIP) III (2012
-2018). Key achievements included the development of a range of standard operating procedures and public service-oriented PFM
training programmes and the development of a Public Finance Management (PFM) Professionalisation Policy Framework as well
extensive technical support to the OCPO and the Provincial Treasuries of the North West, KwaZulu-Natal and the Western Cape.
Specific municipal support in eight pilot municipalities in the NW also yielded positive results. Towards the end of the programme,
the United Kingdom-based Department for International Development (DFID) provided an additional €2 million to strengthen
critical FMIP III capacity building initiatives such as: monitoring and evaluation, knowledge management, i-Develop (individual
competency development assessment), PFM Education Training and Development (ETD) solutions, revenue management, strategic
sourcing, and infrastructure procurement.
Based on the positive impact of FMIP III, the EU committed €15 million to funding the follow-up Public Financial Management
Capacity Development Programme for Improved Service Delivery (FMISD), over the 2018-23 period. The finance agreement has
been signed and the multi-annual programme has been drafted and submitted to the EU for endorsement. The four Key Result
Areas (KRAs) of the FMISD programme are:
• Result Area 1: Increased professionalisation of PFM within all spheres of government.
• Result Area 2: Enhanced capacity of provincial Treasuries to perform their roles with respect to provincial departments and
municipalities.
• Result Area 3: Improved capacity of municipalities to manage public funds and deliver services.
• Result Area 4: Increased ability of citizens and civil society organisations (CSOs) to participate in budget formulation and monitor
implementation.
The Chief Directorate: Capacity Building also initiated the R95 million Procurement, Infrastructure Management and Knowledge
Management Capacity Building Programme (PINK), funded by the Swiss State Secretariat for Economic Affairs (SECO) over the 2018-
22 period. PINK has the following Key Result Areas:
• KRA 1: More effective supply chain management (procurement) at local government level.
• KRA 2: Enhanced infrastructure management (budgeting, planning and asset management) at local government level.
• Crosscutting activity - knowledge management and peer learning.
During the period under review, the unit established the PINK Programme Coordinating Unit and completed the inception report
and the programme workplan.

134
PART B: PERFORMANCE INFORMATION - Continued
4. PERFORMANCE INFORMATION BY PROGRAMME
The unit implemented the Municipal Financial Management Technical Assistance Project, funded by the African Development Bank
(AfDB), to strengthen municipal public finance management capacity and improve service delivery performance.
The Chief Directorate: Capacity Building coordinated the Bi-annual Donor Coordination Forum (DCF), comprising the key international
development partners with an interest in good governance and PFM. The purpose of the Donor Coordination Forum is primarily to
enhance, coordinate and harmonise collaboration between the National Treasury and the various international donor institutions in
South Africa, specifically with regards to PFM capacity building.
The unit continued to support the development of a pool of accounting professionals through the Chartered Accountants Academy
(CAA). A total of 11 new trainee accountants were recruited in February 2019, and nine trainees qualified to attend the support
programme in preparation for writing board examinations. Eight candidates have qualified as chartered accountants through the
academy during this past year. To date the academy has developed a total of 63 chartered accountants since inception in 2008. The
academy currently has a total of 27 trainee accountants.
The OAG also continued to provide capacity development in the preparation of provincial consolidated financial statements,
provincial revenue fund statements and implementation of generally recognised accounting practices (GRAP) standards as well as
providing support in risk management and internal audit. This collaborative effort works effectively as skills are transferred to those
who are responsible for programmes.
The unit facilitated four internal audit short learning programmes, which were developed based on public sector content with an
emphasis on workplace practice-based solutions. The programmes focused on the review of financial statements from an internal
audit perspective, audit plan development, information technology general controls for non-information technology auditors
and audit of performance information. The National Treasury has further partnered and collaborated with the National School of
Government (NSG) and other departments in the co-development of the ethics for internal auditors short learning programme. This
programme capacitates internal auditors in the public service to handle ethical dilemmas specific to their work space professionally.
Furthermore, the Public Finance Management (PFM) Conference 2018, a flagship project funded by the European Union and the
British High Commission, was successfully delivered with the intent to strengthen the capacity of public secvtor practitioners
through knowledge sharing, and create a heightened awareness of challenges and solutions that contribute to an enabling
environment for good public financial management. It further geared the National Treasury to gather intelligence on the real issues
facing departments, which will enable further development responsive solutions for the continuous improvement and calibration
of government.
Within this reporting period, the i-Develop (Individual Competency Development Toolkit) underwent system enhancements
following the piloting of the programme in four provinces for the three disciplines of Supply Chain Management, Internal Audit
and Risk Management. The toolkit provides a systematic process for assessing the learning needs of individuals, the organisation
and the province. Competency statements for the financial accounting discipline were developed in partnership with the Western
Cape Provincial Treasury, and coordinated with the competency assessments of over 720 supply chain management practitioners in
North West provincial departments, municipalities and entities as part of the Section 100 Intervention.
Funding from the African Development Bank was secured to design and develop the standard Operating Procedures (SOPs) for
supply chain management, costing, budgeting and reporting and governance. The aim of SOPs is to strengthen the internal control
systems and processes in local government. These SOPs will be piloted in two provinces.

135
PART B: PERFORMANCE INFORMATION - Continued
4. PERFORMANCE INFORMATION BY PROGRAMME
Further funding was secured from the Transport Education and Training Authority (TETA) to pilot the roll-out of the supply chain
management learnership certificate (National Qualifications Framework Level 5) in five provinces to 259 employed municipal
officials and 30 unemployed youth.
MFMA Implementation
MFMA Legislation, Regulatory Oversight and Helpdesk: The MFMA Helpdesk facility was established in 2004 after the MFMA
became effective on 1 July 2004. Its aim is to provide responses to requests received from municipalities and municipal entities
including providing clarity on the implementation of the MFMA, its regulations and MFMA circulars. The MFMA Mailbox provides a
central point through which requests are processed to relevant departments, Provincial Treasuries (PTs), municipalities and municipal
entities for responses, including assistance in MFMA implementation.
Responses provided by the MFMA Helpdesk assisted municipalities and municipal entities to obtain a better understanding of
among others budgets, investments, supply chain, borrowing, minimum competencies, measures to process and manage
unauthorised, irregular, fruitless and wasteful expenditure, and application of consequence management procedures. The impact of
the responses is evident in the better understanding among municipal officials of their roles and responsibilities, including how the
specific provisions of the law are interpreted.
From 1 April 2018 to 31 March 2019, 238 requests were received via the helpdesk facility, and 222 (87 per cent) were responded to
as at 31 March 2019, of which 77.3 per cent were responded to within 30 days of receipt.
Unauthorised, Irregular, Fruitless and Wasteful Expenditure
The unit has worked with the Department of Performance Monitoring and Evaluation and the Department of Cooperative Governance
and Traditional Affairs to include financial indicators and reporting on progress in the Medium-Term Strategic Framework (MTSF
2014-2019) Outcome 9. This also gives effect to the memorandum of uderstanding (MOU) between the Department of Cooperative
Governance (DCoG) and the National Treasury, signed in April 2018, that transitions audit outcomes and actions related matters
to National and Provincial Treasuries. The MOU will be used to amend the MFMA and Master Services Agreement (MSA) going
forward. Therefore, the indicators on improvements in audit outcomes, financial management capability maturity assessments, and
reduction in the incidents of unauthorised, irregular, fruitless and wasteful expenditure (UIFWE) form part of the responsibilities of
the unit, as part of its coordination role.
The National and Provincial Treasuries prioritised 30 municipalities that received adverse and disclaimer audit opinions for support
during 2018/19 and over the medium term, as these municipalities have shown a history of unfavourable audit opinions over the
past three financial years. Support provided included reviewing audit action plans and monitoring progress on an ongoing basis,
periodic visits to assist in resolving audit findings, reviewing annual financial statements and audit files, attendance at audit steering
committee meetings and assisting in responding to contentious Communication of Audit Findings (COMAFs). It must be noted that
treasuries are still in the process of gearing up their support mechanisms and structures as part of the transition process to give
effect to the MOU between the DCoG and the National Treasury, and to undertake additional responsibilities.
136
PART B: PERFORMANCE INFORMATION - Continued
4. PERFORMANCE INFORMATION BY PROGRAMME
Moreover, engagements were conducted with senior municipal management of individual municipalities focused on the top 10
contributors to the R37 billion UIFWE expenditure. The purpose was to better understand the root causes that contributed towards
occurrence of the UIFWE and to find solutions for implementation. As a result, several steps are being taken by senior management
in processing the expenditure and controls put in place to manage the risk of reoccurrence. For the 2018/19 financial year, the unit
met with and obtained progress updates from the City of Johannesburg Metropolitan Municipality, the City of Tshwane Metropolitan
Municipality, the OR Tambo District Municipality, the Buffalo City Metropolitan Municipality, the Nelson Mandela Bay Metropolitan
Municipality, the Mangaung Metropolitan Municipality, the Rustenburg Local Municipality, the Mbombela Local Municipality, the
Polokwane Local Municipality, and the Mahikeng Local Municipality.
The unit also developed and issued the Municipal Public Accounts Committee (MPAC) Guideline and Toolkit, which is a comprehensive
reference source for the roles and responsibilities of the MPAC. In collaboration with the Department of Cooperative Governance and
Traditional Affairs and the South African Local Government Association, the unit coordinated the roll-out of countrywide workshops
where approximately 875 councillors received training on the guideline and toolkit. The results of this training effort and the impact
of the guideline and toolkit can only be properly assessed during the 2019/20 financial year. However, latest reviews suggest that
for the current year UIFWE has reduced significantly for the municipalities mentioned above. Additional detailed guidance on
how municipalities should go about addressing historical UIFWE coupled with more vigorous implementation of consequence
management was undertaken.
MFMA Coordination
Bi-annual MFMA coordinators meetings with officials of the provincial treasuries, national and provincial Departments of
Cooperative Governance, the Auditor-General and the South African Local Government Association (SALGA) were hosted in
September 2018 and March 2019. Provincial engagements were also undertaken at five provincial treasuries between November
2018 and March 2019. The purpose of these engagements was to improve the coordination of financial management reforms in
municipalities, identify gaps and areas of need and further define strategies that will enhance optimal municipal performance
and entrench MFMA reforms. The identified gaps and proposed strategic solutions are cascaded to municipalities through the
national non-delegated Chief Financial Officer (CFO) forums and provincial municipal CFO forums. This information also feeds
into the various divisions in national and provincial treasuries. Resolutions were taken and implementation followed up. The
annual MFMA compliance reports, compiled from the quarterly compliance reports, also highlighted progress made and areas
where remedial actions are required to correct weaknesses.
Financial Management Capability Maturity reassessments were conducted at five municipalities, namely Mantsopa Local Municipality,
Elias Motsoaledi Local Municipality, Thaba Chweu Local Municipality, Joe Morolong local Municipality and Nelson Mandela Bay
Metropolitan Municipality based on the unfavourable audit outcomes and low maturity levels from the previous assessment. These
municipalities were supported during the 2018/19 financial year to conduct the re-assessment and are currently in the process
of developing action plans which will be monitored on an ongoing basis. Further re-assessments will be conducted at selected
municipalities over the next financial year. Monitoring of progress on the development and implementation of action plans by
municipalities that previously conducted assessments is ongoing.

137
PART B: PERFORMANCE INFORMATION - Continued
4. PERFORMANCE INFORMATION BY PROGRAMME
Financial Management Grant
The financial management grant of R504 million was transferred to all 257 municipalities to assist in improving financial
management and implementing the MFMA. A review of the support plans submitted by municipalities indicated that funds were
allocated towards the appointment of financial management interns, improving financial management systems, compilation of
annual financial statements (AFS), training officials to meet the minimum competency levels, addressing audit findings, addressing
shortcomings in the Financial Management Capability Maturity Model (FMCMM) assessments and strengthening the capacity of
the Budget and Treasury Office (BTO).
Municipal Finance Recovery Services
The Municipal Finance Recovery Service (MFRS) was established in terms of Chapter 13 of the MFMA and is responsible for, among
others, the preparation of financial recovery plans, monitoring of the plans, and assisting the municipality to identify the causes of
and potential solutions to financial problems. This is undertaken upon request by the municipality in coordination with any other
provincial or national efforts, collection of information on municipal financial problems, financial status assessment and monitoring
of municipalities and best practices in resolving these problems.
The MFRS is supported by a Rapid Response Team that assisted nine municipalities with the preparation of financial recovery plans
(FRPs). The municipalities were Emalahleni, Enoch Mgijima, Harry Gwala, Emfuleni, Msunduzi, Mbombela, Mangaung Metro, Maluti-
a-Phofung and Kai Garib. The MFRS reviewed progress and provided guidance on the implementation of financial recovery plans
for the following 15 municipalities: Naledi, eDumbe, Msunduzi, Emalahleni, Kai Garib, Ubuntu, Mafube, Tshwane Metro, Dikgatlong,
Mbombela, Ba-Phalaborwa, Dipaleseng, Mangaung, Renosterberg and Nketoana. The monitoring of progress in these municipalities
is ongoing as short-, medium- and long-term deliverables form part of the adopted FRP.
Office of the Chief Procurement Officer
As part of using technology to modernise supply chain management in government, a total of 16 242 tenders across all spheres
of government were published on the electronic tendering system in the financial year 2018/19, exceeding the projected target
of 10 000 for the year under review. The purpose of the system is to improve transparency and enable easy access to procurement
opportunities in the public sector. It also contributes to reducing cost of doing business for potential suppliers while reducing
printing costs for government.
Fewer supply chain management business processes were defined, as this exercise was completed in the previous financial year
with the focus in the year under review on gap analysis. The office provided technical support to municipalities on supply chain
management (SCM) and contract management audit findings/opinions, monitoring corrective actions taken by non-compliant
municipalities. This was done with the aim of strengthening governance to reduce adverse audit findings.
The Central Supplier Database (CSD) has been enhanced to cater for subcontracting requirements of the Preferential Procurement
Regulations, 2017 and to enable government institutions to detect employees of the state who are doing business with government.
To date 625 432 suppliers have been registered on the CSD. Significant improvement in call centre operations resulted in reduced
visits to the walk-in-centre.
138
PART B: PERFORMANCE INFORMATION - Continued
4. PERFORMANCE INFORMATION BY PROGRAMME
The current system enables government to extract information on procurement spend for statistical analysis, operational and
reporting purposes. The OCPO completed the first phase of establishing a procurement codification standard to standardise item
description across all government spheres.
SCM Governance, Monitoring and Compliance
In the financial year 2018/19, the Office of the Chief Procurement Officer continued to exercise oversight over compliance to SCM
policies, procedures, norms and standards. Procurement plans, deviations and contract expansions for departments and public
entities continue to be published to improve transparency. There is continuous review of bid specifications, evaluation and
adjudication to ensure compliance with policy, norms and standards.
Transversal Contracting
Twenty-two transversal contracts were renewed in the financial year 2018/19. The principal aim for renewing these contracts is to
ensure that maintenance and sourcing is primarily done to achieve economies of scale through bulk purchasing. The contracts
mentioned were on diagnostic agents and contrast media, small volume parenterals and insulin devices, oncology and immunological
agents, medical equipment, male and female condoms and lubrication, office automation solutions, surgical catheters, tubes
and related items, bandages and dressings, biological preparations, lubrication oil, weapon oil, hydraulic fluid and grease, animal
feed, clothing, respiratory aids and anaesthetic accessories, anti-retroviral medicines, pharmaceutical packaging material, dental
instruments, dental materials and consumables, surgical instruments and equipment, hypodermic syringes, needles, administration
sets, crutches and walking aids, footwear, surgical sundries, radio graphical material, dosage forms, small volume parenterals and
insulin devices, fabric and towelling, blankets and house textiles, tyres and tubes, veterinary remedies, agricultural remedies, toilet
paper, and supply and delivery of textbooks and school stationery.
Strategic Procurement
Several sourcing strategies were developed and implemented to improve service delivery in the health sector, address procurement
efficiencies and advance local economic development across all Departments of Health. The department has completed 91 per
cent of the project plans on the sourcing strategies discussed below. These reforms aim to institutionalise strategic sourcing and
continuous stream of projects to realise efficiencies.
Health Reforms
Mental health equipment and therapeutic rehabilitation equipment strategic sourcing projects were developed to stabilise
procurement of equipment in the public health sector, standardise equipment specification and improve service delivery in
preparation for National Health Insurance (NHI).
The department commenced with the development of a sourcing strategy for Expanded Programme on Immunisation (EPI) vaccines
in collaboration with the Department of Health, Department of Science and Technology and Department of Trade and Industry with
the principal objective of supporting local manufacturing of some of these vaccines.
139
PART B: PERFORMANCE INFORMATION - Continued
4. PERFORMANCE INFORMATION BY PROGRAMME
Travel and Accommodation
The business case for a government online travel booking solution was approved in the financial year 2018/19. The project was
registered with SITA as a turn-key project for the development of a bespoke government solution. This solution will provide a single
platform from which government travel bookings will be made and provide more visibility on the travel spend. Travel policy rules
and budget will be built into the solution. It will further promote competition in the market.
The National Travel Policy Framework and Cost Containment Measures related to Travel and Subsistence were reviewed and circulated
for inputs and comments. The purpose of the review was to bring the policy in line with best practice for government travellers.
The unit continuously tracks airline spend with the two domestic full-service carriers. It has also benchmarked industry
accommodation rates with government’s maximum allowable rates as published in the cost containment instruction. These reports
will assist with future negotiations and savings strategies.
Education and related projects
An e-Education Procurement and Delivery Management Framework was developed and is being implemented together with the
department of Basic Education. The purpose of this framework is to provide a practical sourcing tool to procure any e-education-
related commodities and services. It provides a holistic view of all the elements that need to be taken into consideration when
procuring e-education commodities such as laptops, tablets and electronic teacher support items, to name but a few. The intended
objective is to improve service delivery at schools and to contribute to efficient and effective procurement by expanding centre-led
contracting for common goods and services.
Review of the Standard for Infrastructure Procurement and Delivery Management (SIPDM)
The existing SIPDM has been reviewed to improve identified shortcomings and align it with Infrastructure Delivery Management
Systems (IDMS) and other existing government procurement policies.
SCM Policy, Norms and Standards
Four instructions for designated products to support local industrial policy have been issued.
The draft Public Procurement Bill was finalised and tabled to Cabinet during February 2019 to obtain approval to gazette for public
comments. Cabinet has requested that it be deferred to the sixth administration and it will be tabled again to Cabinet during June
2019. Once finalised, the bill will be the single overarching legislative framework regulating public procurement in South Africa.
A contract management framework to improve contract management in all spheres of government, thereby reducing unnecessary
irregular expenditure, has been finalised.
The department has also established the Interim SCM Council. The SCM Council will lead to the professionalisation of SCM and
elevate the profession to the status of a career discipline. The SCM Council will also champion advocacy on SCM professionalisation,
140
PART B: PERFORMANCE INFORMATION - Continued
4. PERFORMANCE INFORMATION BY PROGRAMME
development of a framework for SCM professionalisation, provision of career management guidance and support as well as
facilitation of collaboration, cooperation and communication among SCM key stakeholders to enhance professionalisation.
Stakeholder and Client Management
Fourteen out of 16 planned SCM stakeholder engagements were conducted during the year under review. The objective of the
SCM forums is to engage stakeholders in the SCM environment and address client management-related challenges and policy
implementation. A tailored engagement was facilitated with the Standing Committee on Appropriations (SCoA) in support of the
committee’s oversight responsibilities.

141
PART B: PERFORMANCE INFORMATION - Continued
4. PERFORMANCE INFORMATION BY PROGRAMME
PERF
ORM
AN
CE IN
DIC
ATO
RS
PRO
GRA
MM
E 5:
FIN
AN
CIA
L A
CCO
UN
TIN
G A
ND
SU
PPLY
CH
AIN
MA
NA
GEM
ENT
SYST
EMS
APP#
INDI
CATO
RAC
TUAL
2015
/16
ACTU
AL 20
16/1
7AC
TUAL
AC
HIEV
EMEN
T 20
17/2
018
TARG
ET
2018
/201
9AC
TUAL
AC
HIEV
EMEN
T20
18/2
019
DEVI
ATIO
N FR
OM
PLAN
NED T
ARGE
TRE
ASON
FOR D
EVIAT
ION
IMPR
OVE
FIN
AN
CIA
L M
AN
AGEM
ENT
GO
VERN
AN
CE A
ND
CO
MPL
IAN
CE A
CRO
SS A
LL S
PHER
ES A
ND
EN
TITI
ES IN
GO
VERN
MEN
T, G
IVIN
G E
FFEC
T TO
TH
E PF
MA
AN
D M
FMA
5.1.
1N
umbe
r of w
orks
hops
co
nduc
ted
on IA
and
risk
m
anag
emen
t gui
delin
es
N/A
6629
1010
N/A
N/A
5.1.
2N
umbe
r of i
nstit
utio
ns
who
se A
udit
Com
mitt
ees
have
bee
n pr
ovid
ed w
ith
supp
ort
N/A
222
1518
3O
ver-
perf
orm
ance
is
attr
ibut
ed to
incr
ease
d de
man
d fo
r sup
port
due
to
Aud
it Co
mm
ittee
s no
w b
eing
re
ques
ted
to a
ppea
r bef
ore
Parli
amen
tary
ove
rsig
ht
com
mitt
ees.
5.1.
3N
umbe
r of s
uppo
rt
plan
s de
velo
ped
for
gove
rnm
ent e
ntiti
es
stru
gglin
g w
ith fi
nanc
ial
man
agem
ent a
s id
entifi
ed in
aud
it re
port
s
N/A
56
55
N/A
N/A
5.1.
4N
umbe
r of t
rain
ing
sess
ions
con
duct
ed in
ris
k m
anag
emen
t
N/A
N/A
N/A
43
1U
nder
-per
form
ance
is
attr
ibut
ed to
this
are
a of
wor
k be
ing
dem
and
driv
en.
5.1.
5N
umbe
r of g
uide
lines
on
risk
man
agem
ent
curr
icul
um d
evel
oped
fo
r ins
titut
ions
of h
ighe
r le
arni
ng
N/A
40
40
4U
nder
-per
form
ance
is
attr
ibut
ed to
this
are
a of
wor
k be
ing
rest
ruct
ured
.

142
PART B: PERFORMANCE INFORMATION - Continued
4. PERFORMANCE INFORMATION BY PROGRAMME
PRO
GRA
MM
E 5:
FIN
AN
CIA
L A
CCO
UN
TIN
G A
ND
SU
PPLY
CH
AIN
MA
NA
GEM
ENT
SYST
EMS
APP#
INDI
CATO
RAC
TUAL
2015
/16
ACTU
AL 20
16/1
7AC
TUAL
AC
HIEV
EMEN
T 20
17/2
018
TARG
ET
2018
/201
9AC
TUAL
AC
HIEV
EMEN
T20
18/2
019
DEVI
ATIO
N FR
OM
PLAN
NED T
ARGE
TRE
ASON
FOR D
EVIAT
ION
5.1.
6N
umbe
r of m
onito
ring
repo
rts
on im
prov
emen
t of
fina
ncia
l man
agem
ent
in n
atio
nal a
nd p
rovi
ncia
l in
stitu
tions
pro
duce
d
N/A
N/A
64
62
Ove
r-pe
rfor
man
ce is
att
ribut
ed
to th
e ad
ditio
nal R
epor
t fo
r 201
7/18
on
Fina
ncia
l Im
prov
emen
t to
SCO
PA a
nd a
Ca
bine
t Mem
oran
dum
on
Aud
it O
utco
mes
for 2
017/
18
5.1.
7N
umbe
r of g
uide
lines
to
ass
ist w
ith th
e im
plem
enta
tion
of
Trea
sury
Reg
ulat
ions
, po
licie
s an
d Tr
easu
ry
Inst
ruct
ions
dev
elop
ed
N/A
40
41
3U
nder
-per
form
ance
is
attr
ibut
ed to
gre
ater
st
akeh
olde
r eng
agem
ents
be
ing
requ
ired.
5.1.
8N
umbe
r of t
rain
ing
sess
ions
pro
vide
d to
su
ppor
t PFM
A in
stitu
tions
on
the
impl
emen
tatio
n of
Tre
asur
y Re
gula
tions
, Tr
easu
ry In
stru
ctio
ns a
nd
guid
elin
es
N/A
109
826
18O
ver-
perf
orm
ance
is a
ttrib
uted
to
an
incr
ease
d de
man
d fo
r in
form
atio
n se
ssio
ns.
5.1.
9N
umbe
r of f
oren
sic
inve
stig
atio
n re
port
s pr
oduc
ed
The
divi
sion
has
unde
rtak
enin
vest
igat
ion
in 2
8ta
rget
ed
depa
rtm
ent/
proj
ects
.
4148
2648
22O
ver-
perf
orm
ance
is a
ttrib
uted
to
enh
ance
d effi
cien
cy in
re
spon
ding
to re
ques
ts.
5.1.
10N
umbe
r of s
peci
alis
ed
audi
t rep
orts
pro
duce
dN
/AN
/AN
/A4
84
Ove
r-pe
rfor
man
ce is
att
ribut
ed
to e
nhan
ced
effici
ency
in
repo
rts
prod
uced
.

143
PART B: PERFORMANCE INFORMATION - Continued
4. PERFORMANCE INFORMATION BY PROGRAMME
PRO
GRA
MM
E 5:
FIN
AN
CIA
L A
CCO
UN
TIN
G A
ND
SU
PPLY
CH
AIN
MA
NA
GEM
ENT
SYST
EMS
APP#
INDI
CATO
RAC
TUAL
2015
/16
ACTU
AL 20
16/1
7AC
TUAL
AC
HIEV
EMEN
T 20
17/2
018
TARG
ET
2018
/201
9AC
TUAL
AC
HIEV
EMEN
T20
18/2
019
DEVI
ATIO
N FR
OM
PLAN
NED T
ARGE
TRE
ASON
FOR D
EVIAT
ION
5.1.
11N
umbe
r of c
rimin
al
inve
stig
atio
n ca
ses
supp
orte
d
The
divi
sion
ha
s re
ferr
ed
44 c
ases
fo
r crim
inal
pr
ocee
ding
s an
d ci
vil
reco
very
.
7450
3090
60O
ver-
perf
orm
ance
is a
ttrib
uted
to
enh
ance
d effi
cien
cy in
su
ppor
t pro
vide
d.
5.1.
12N
umbe
r of e
ngag
emen
ts
held
with
pub
lic o
ffici
als
to a
ddre
ss c
ompl
ianc
e an
d im
plem
enta
tion
of
regu
latio
ns, i
nstr
uctio
ns
and
guid
elin
es in
a
coor
dina
ted
and
cons
iste
nt m
anne
r
N/A
N/A
32
2N
/AN
/A
5.1.
13Pe
rcen
tage
of fi
nanc
ial
man
agem
ent g
rant
su
ppor
t pla
ns re
view
ed
for a
lignm
ent w
ith th
e gr
ant f
ram
ewor
k fo
r m
unic
ipal
ities
N/A
N/A
100%
100%
100%
N/A
N/A
5.1.
14Pe
rcen
tage
of c
ompl
ete
requ
ests
to d
raft
fin
anci
al re
cove
ry p
lans
re
spon
ded
to w
ithin
90
days
of r
ecei
pt
N/A
N/A
N/A
100%
100%
N/A
N/A
5.1.
15Pe
rcen
tage
of r
eque
sts
to th
e M
FMA
hel
pdes
k re
spon
ded
to w
ithin
30
days
of r
ecei
pt
N/A
N/A
92%
75%
77.3
%2.
3%O
ver-
perf
orm
ance
is a
ttrib
uted
to
effi
cien
cy in
man
agin
g in
tern
al c
onsu
ltatio
ns.
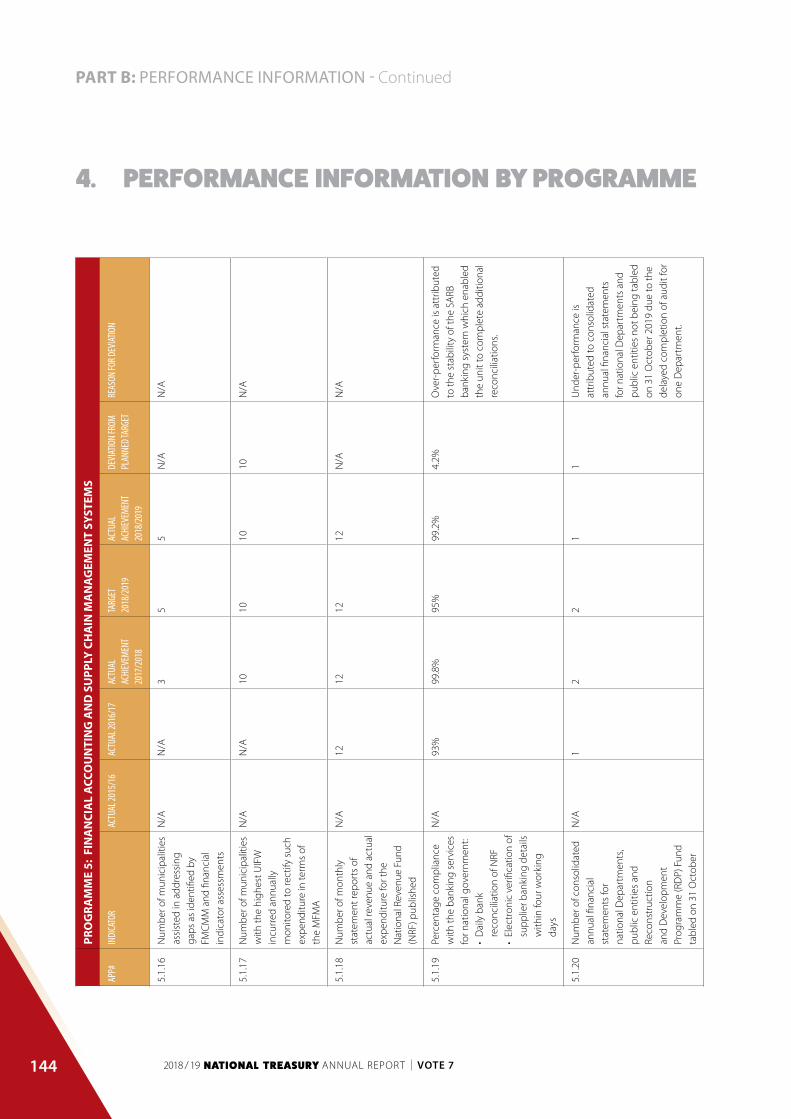
144
PART B: PERFORMANCE INFORMATION - Continued
4. PERFORMANCE INFORMATION BY PROGRAMME
PRO
GRA
MM
E 5:
FIN
AN
CIA
L A
CCO
UN
TIN
G A
ND
SU
PPLY
CH
AIN
MA
NA
GEM
ENT
SYST
EMS
APP#
INDI
CATO
RAC
TUAL
2015
/16
ACTU
AL 20
16/1
7AC
TUAL
AC
HIEV
EMEN
T 20
17/2
018
TARG
ET
2018
/201
9AC
TUAL
AC
HIEV
EMEN
T20
18/2
019
DEVI
ATIO
N FR
OM
PLAN
NED T
ARGE
TRE
ASON
FOR D
EVIAT
ION
5.1.
16N
umbe
r of m
unic
ipal
ities
as
sist
ed in
add
ress
ing
gaps
as
iden
tified
by
FMC
MM
and
fina
ncia
l in
dica
tor a
sses
smen
ts
N/A
N/A
35
5N
/AN
/A
5.1.
17N
umbe
r of m
unic
ipal
ities
w
ith th
e hi
ghes
t UIF
W
incu
rred
ann
ually
m
onito
red
to re
ctify
suc
h ex
pend
iture
in te
rms
of
the
MFM
A
N/A
N/A
1010
1010
N/A
5.1.
18N
umbe
r of m
onth
ly
stat
emen
t rep
orts
of
actu
al re
venu
e an
d ac
tual
ex
pend
iture
for t
he
Nat
iona
l Rev
enue
Fun
d (N
RF) p
ublis
hed
N/A
1212
1212
N/A
N/A
5.1.
19Pe
rcen
tage
com
plia
nce
with
the
bank
ing
serv
ices
fo
r nat
iona
l gov
ernm
ent:
• D
aily
ban
k re
conc
iliat
ion
of N
RF•
Elec
tron
ic v
erifi
catio
n of
su
pplie
r ban
king
det
ails
w
ithin
four
wor
king
da
ys
N/A
93%
99.8
%95
%99
.2%
4.2%
Ove
r-pe
rfor
man
ce is
att
ribut
ed
to th
e st
abili
ty o
f the
SA
RB
bank
ing
syst
em w
hich
ena
bled
th
e un
it to
com
plet
e ad
ditio
nal
reco
ncili
atio
ns.
5.1.
20N
umbe
r of c
onso
lidat
ed
annu
al fi
nanc
ial
stat
emen
ts fo
r na
tiona
l Dep
artm
ents
, pu
blic
ent
ities
and
Re
cons
truc
tion
and
Dev
elop
men
t Pr
ogra
mm
e (R
DP)
Fun
d ta
bled
on
31 O
ctob
er
N/A
12
21
1U
nder
-per
form
ance
is
attr
ibut
ed to
con
solid
ated
an
nual
fina
ncia
l sta
tem
ents
fo
r nat
iona
l Dep
artm
ents
and
pu
blic
ent
ities
not
bei
ng ta
bled
on
31
Oct
ober
201
9 du
e to
the
dela
yed
com
plet
ion
of a
udit
for
one
Dep
artm
ent.

145
PART B: PERFORMANCE INFORMATION - Continued
4. PERFORMANCE INFORMATION BY PROGRAMME
PRO
GRA
MM
E 5:
FIN
AN
CIA
L A
CCO
UN
TIN
G A
ND
SU
PPLY
CH
AIN
MA
NA
GEM
ENT
SYST
EMS
APP#
INDI
CATO
RAC
TUAL
2015
/16
ACTU
AL 20
16/1
7AC
TUAL
AC
HIEV
EMEN
T 20
17/2
018
TARG
ET
2018
/201
9AC
TUAL
AC
HIEV
EMEN
T20
18/2
019
DEVI
ATIO
N FR
OM
PLAN
NED T
ARGE
TRE
ASON
FOR D
EVIAT
ION
5.1.
21Pe
rcen
tage
of c
omm
ents
pr
ovid
ed to
Sta
ndar
d Se
tter
s on
loca
l and
in
tern
atio
nal e
xpos
ure
draf
ts
N/A
N/A
N/A
100%
100%
N/A
N/A
5.1.
22N
umbe
r of M
odifi
ed C
ash
Stan
dard
pub
lishe
dN
/AN
/AN
/A1
1N
/AN
/A
5.1.
23Pe
rcen
tage
resp
onse
s to
qu
erie
s lo
gged
on
the
SCO
A h
elpd
esk
N/A
N/A
N/A
100%
100%
N/A
N/A
STRA
TEG
IC O
BJEC
TIVE
5.2
: SU
PPO
RT A
ND
FACI
LITA
TE C
APA
CITY
DEV
ELO
PMEN
T AC
ROSS
ALL
SPH
ERES
OF
GO
VERN
MEN
T IN
ORD
ER T
O IM
PRO
VE
FIN
AN
CIA
L M
AN
AGEM
ENT
EXEC
UTI
ON
5.2.
1N
umbe
r of t
rain
ing
sess
ions
con
duct
ed
in th
e pr
epar
atio
n of
pr
ovin
cial
con
solid
ated
fin
anci
al s
tate
men
ts,
prov
inci
al re
venu
e fu
nd s
tate
men
ts a
nd
impl
emen
tatio
n of
ge
nera
lly re
cogn
ised
ac
coun
ting
prac
tices
(G
RAP)
sta
ndar
ds
N/A
N/A
N/A
48
4O
ver-
perf
orm
ance
is a
ttrib
uted
to
an
incr
ease
d de
man
d fo
r tr
aini
ng.
5.2.
2Pe
rcen
tage
of t
he p
ublic
fin
anci
al m
anag
emen
t ed
ucat
ion,
trai
ning
an
d de
velo
pmen
t im
plem
enta
tion
plan
ac
hiev
ed
N/A
N/A
100%
100%
100%
N/A
N/A

146
PART B: PERFORMANCE INFORMATION - Continued
4. PERFORMANCE INFORMATION BY PROGRAMME
PRO
GRA
MM
E 5:
FIN
AN
CIA
L A
CCO
UN
TIN
G A
ND
SU
PPLY
CH
AIN
MA
NA
GEM
ENT
SYST
EMS
APP#
INDI
CATO
RAC
TUAL
2015
/16
ACTU
AL 20
16/1
7AC
TUAL
AC
HIEV
EMEN
T 20
17/2
018
TARG
ET
2018
/201
9AC
TUAL
AC
HIEV
EMEN
T20
18/2
019
DEVI
ATIO
N FR
OM
PLAN
NED T
ARGE
TRE
ASON
FOR D
EVIAT
ION
5.2.
3N
umbe
r of m
unic
ipal
offi
cial
s tr
aine
d in
fin
anci
al m
anag
emen
t co
mpe
tenc
ies
1380
m
unic
ipal
offi
cial
s in
tr
aini
ng.
1080
1458
1000
1 18
518
5O
ver-
perf
orm
ance
is a
ttrib
uted
to
incr
ease
d de
man
d fo
r tr
aini
ng.
5.2.
4Pe
rcen
tage
of t
he p
ublic
fin
anci
al m
anag
emen
t ca
paci
ty d
evel
opm
ent
stra
tegy
(CD
S)
impl
emen
tatio
n pl
an
achi
eved
N/A
100%
of t
he
plan
ned
initi
ativ
es
com
plet
ed.
100%
100%
100%
N/A
N/A
5.2.
5.Pe
rcen
tage
of q
ualif
ying
tr
aine
es th
at p
artic
ipat
e in
the
acad
emic
su
ppor
t pro
gram
me
for
pros
pect
ive
char
tere
d ac
coun
tant
s
N/A
N/A
100%
100%
100%
N/A
N/A
5.2.
6N
umbe
r of m
unic
ipal
ities
m
onito
red
to c
ompl
y w
ith m
inim
um
com
pete
ncie
s re
gula
tions
for fi
nanc
ial
man
agem
ent
N/A
N/A
7070
70N
/AN
/A
5.2.
7N
umbe
r of m
unic
ipal
ities
th
at re
ceiv
ed d
iscl
aim
ers
and
adve
rse
opin
ions
pr
iorit
ised
by
NT
and
PTs
supp
orte
d
N/A
N/A
1030
30N
/AN
/A

147
PART B: PERFORMANCE INFORMATION - Continued
4. PERFORMANCE INFORMATION BY PROGRAMME
PRO
GRA
MM
E 5:
FIN
AN
CIA
L A
CCO
UN
TIN
G A
ND
SU
PPLY
CH
AIN
MA
NA
GEM
ENT
SYST
EMS
APP#
INDI
CATO
RAC
TUAL
2015
/16
ACTU
AL 20
16/1
7AC
TUAL
AC
HIEV
EMEN
T 20
17/2
018
TARG
ET
2018
/201
9AC
TUAL
AC
HIEV
EMEN
T20
18/2
019
DEVI
ATIO
N FR
OM
PLAN
NED T
ARGE
TRE
ASON
FOR D
EVIAT
ION
STRA
TEG
IC O
BJEC
TIVE
5.3
: MA
NAG
E EX
ISTI
NG
FIN
AN
CIA
L SY
STEM
S A
ND
REN
EW T
HES
E A
S RE
QU
IRED
TO
EXE
RCIS
E CO
MPR
EHEN
SIVE
FIN
AN
CIA
L M
AN
AGEM
ENT
5.3.
1Pe
rcen
tage
ava
ilabi
lity
of c
urre
nt tr
ansv
ersa
l sy
stem
s
Syst
em
avai
labi
lity
was
gr
eate
r tha
n 98
% d
urin
g th
e re
port
ing
perio
d.
99%
100%
98%
99.7
%1.
7%O
ver-
perf
orm
ance
is a
ttrib
uted
to
sta
bilit
y of
the
mai
nfra
mes
ho
stin
g th
e cu
rren
t tra
nsve
rsal
sy
stem
s.
5.3.
2Im
plem
enta
tion
of th
e IF
MS
II pl
anN
/AN
/AN
/APl
anni
ng
& de
sign
co
mpl
eted
.
Plan
ning
&
desi
gn
com
plet
ed.
N/A
N/A
Pilo
t site
pr
epar
atio
n fo
r N
atio
nal
Trea
sury
&
DPS
A.
Pilo
t site
for
Nat
iona
l Tr
easu
ry
and
DPS
A
prep
ared
.
N/A
N/A
STRA
TEG
IC O
BJEC
TIVE
5.4
: MO
DER
NIS
E SC
M P
OLI
CIES
AN
D P
ROCE
DU
RES
5.4.
1N
umbe
r of I
nstr
uctio
ns
issu
ed in
line
with
po
licy
inte
rven
tions
and
pr
opos
ed d
esig
nate
d pr
oduc
ts o
r cat
egor
ies
to
enha
nce
SCM
pol
icy
N/A
2211
64
2U
nder
-per
form
ance
is
attr
ibut
ed to
the
prot
ract
ed
cons
ulta
tive
proc
ess
requ
ired
prio
r to
issu
ing
an in
stru
ctio
n or
ci
rcul
ar, t
hus
som
e in
stru
ctio
ns
wer
e no
t con
clud
ed a
t the
end
of
the
finan
cial
yea
r, an
d on
ly 4
pr
oduc
ts w
ere
desi
gnat
ed.
STRA
TEG
IC O
BJEC
TIVE
5.5
: MO
NIT
OR
AN
D E
VALU
ATE
SCM
PER
FORM
AN
CE
5.5.
1Pe
rcen
tage
of
Dep
artm
ents
’ / e
ntiti
es’
devi
atio
n /
expa
nsio
n re
ques
ts re
view
ed
N/A
N/A
100%
100%
100%
N/A
N/A

148
PART B: PERFORMANCE INFORMATION - Continued
4. PERFORMANCE INFORMATION BY PROGRAMME
PRO
GRA
MM
E 5:
FIN
AN
CIA
L A
CCO
UN
TIN
G A
ND
SU
PPLY
CH
AIN
MA
NA
GEM
ENT
SYST
EMS
APP#
INDI
CATO
RAC
TUAL
2015
/16
ACTU
AL 20
16/1
7AC
TUAL
AC
HIEV
EMEN
T 20
17/2
018
TARG
ET
2018
/201
9AC
TUAL
AC
HIEV
EMEN
T20
18/2
019
DEVI
ATIO
N FR
OM
PLAN
NED T
ARGE
TRE
ASON
FOR D
EVIAT
ION
5.5.
2Pe
rcen
tage
of
proc
urem
ent p
lans
pu
blis
hed
on th
e e-
tend
er p
orta
l
N/A
100%
100%
100%
100%
N/A
N/A
5.5.
3Pe
rcen
tage
of b
ids
revi
ewed
to e
nsur
e co
mpl
ianc
e w
ith n
orm
s an
d st
anda
rds
N/A
100%
100%
100%
100%
N/A
N/A
5.5.
4Pe
rcen
tage
of p
roje
cts
insp
ecte
d to
ver
ify if
th
e de
liver
y of
aw
arde
d co
ntra
cts
is a
ligne
d w
ith
the
cont
ract
con
ditio
ns
N/A
100%
100%
100%
100%
N/A
N/A
STRA
TEG
IC O
BJEC
TIVE
5.6
: DEV
ELO
P A
ND
IMPL
EMEN
T ST
RATE
GIC
PRO
CURE
MEN
T
5.6.
1Pe
rcen
tage
im
plem
enta
tion
of
the
stra
tegi
c so
urci
ng
oppo
rtun
ities
pla
n
N/A
N/A
N/A
100%
91%
9%U
nder
-per
form
ance
is
attr
ibut
ed to
thre
e pr
ojec
ts
bein
g de
laye
d du
e th
e fo
llow
ing
reas
ons:
A re
ques
t by
DO
H th
at a
ll ph
arm
aceu
tical
con
trac
ts b
e ha
nded
bac
k to
them
follo
win
g a
Nat
iona
l Hea
lth C
ounc
il re
solu
tion;
Exte
nsio
n re
ques
ted
by
Dep
artm
ents
for s
ubm
issi
on o
f in
puts
requ
ired
on th
e tr
avel
po
licy
revi
ew; a
nd
Onl
ine
Book
ing
tool
that
will
be
regi
ster
ed a
s a
turn
-key
pro
ject
fo
r sys
tem
dev
elop
men
t.
5.6.
2N
umbe
r of t
rans
vers
al
term
con
trac
ts
impl
emen
ted
N/A
N/A
N/A
2222
N/A
N/A

149
PART B: PERFORMANCE INFORMATION - Continued
4. PERFORMANCE INFORMATION BY PROGRAMME
PRO
GRA
MM
E 5:
FIN
AN
CIA
L A
CCO
UN
TIN
G A
ND
SU
PPLY
CH
AIN
MA
NA
GEM
ENT
SYST
EMS
APP#
INDI
CATO
RAC
TUAL
2015
/16
ACTU
AL 20
16/1
7AC
TUAL
AC
HIEV
EMEN
T 20
17/2
018
TARG
ET
2018
/201
9AC
TUAL
AC
HIEV
EMEN
T20
18/2
019
DEVI
ATIO
N FR
OM
PLAN
NED T
ARGE
TRE
ASON
FOR D
EVIAT
ION
STRA
TEG
IC O
BJEC
TIVE
5.7
: BU
ILD
AN
D S
TREN
GTH
EN S
TAKE
HO
LDER
REL
ATIO
NS
5.7.
1N
umbe
r of s
take
hold
er
enga
gem
ents
con
duct
edN
/AN
/A10
0%16
142
Und
er-p
erfo
rman
ce is
at
trib
uted
to fo
rum
s be
ing
resc
hedu
led
due
to lo
w
resp
onse
s.
5.7.
2N
umbe
r of p
riorit
ised
D
epar
tmen
ts a
nd e
ntiti
es
supp
orte
d on
sup
ply
chai
n
N/A
3131
1015
5O
ver-
perf
orm
ance
is a
ttrib
uted
to
the
incr
ease
d nu
mbe
r of
requ
ests
for s
uppo
rt.
STRA
TEG
IC O
BJEC
TIVE
5.8
: MO
DER
NIS
E A
ND
AU
TOM
ATE
SCM
PRO
CESS
ES
5.8.
1N
umbe
r of t
ende
rs
adve
rtis
ed o
n an
el
ectr
onic
tend
erin
g pl
atfo
rm fo
r con
trac
ts
N/A
N/A
N/A
10 0
0016
242
6 24
2O
ver-
perf
orm
ance
is a
ttrib
uted
to
an
incr
ease
in th
e nu
mbe
r of
tend
ers
adve
rtis
ed.
5.8.
2N
umbe
r of b
usin
ess
proc
esse
s de
fined
for
SCM
N/A
N/A
N/A
124
114
10U
nder
-per
form
ance
is
attr
ibut
ed to
a g
ap a
naly
sis
that
was
con
duct
ed re
quiri
ng
few
er b
usin
ess
proc
esse
s to
be
defin
ed fo
r SC
M th
an
antic
ipat
ed
5.8.
3N
umbe
r of m
unic
ipal
ities
su
ppor
ted
in S
CM
and
co
ntra
ct m
anag
emen
t au
dit fi
ndin
gs /
opi
nion
s; m
onito
ring
corr
ectiv
e ac
tions
take
n by
non
-co
mpl
iant
mun
icip
aliti
es
N/A
N/A
N/A
Met
ros:
1D
istr
icts
: 10
Loca
l: 10
0
Met
ros:
8D
istr
icts
: 44
Loca
l: 20
5
Met
ros:
7D
istr
icts
: 34
Loca
l: 10
5
Ove
r-pe
rfor
man
ce is
att
ribut
ed
to e
nhan
ced
effici
enci
es
impl
emen
ted
by th
e un
it in
in
resp
onse
to th
e ga
ps id
entifi
ed
durin
g M
FMA
com
plia
nce
mon
itorin
g.

150
PART B: PERFORMANCE INFORMATION - Continued
4. PERFORMANCE INFORMATION BY PROGRAMME
STRATEGY TO OVERCOME AREAS OF UNDER-PERFORMANCE(INDICATORS AND ACTION PLANS)
UNDER-PERFORMING INDICATORS AND ACTION PLANS
PROGRAMME 5: FINANCIAL ACCOUNTING AND SUPPLY CHAIN MANAGEMENT SYSTEMS
APP# Indicator Deviation Action Plan
STRATEGIC OBJECTIVE 5.1: IMPROVE FINANCIAL MANAGEMENT GOVERNANCE AND COMPLIANCE ACROSS ALL SPHERES AND ENTITIES IN GOVERNMENT, GIVING EFFECT TO THE PFMA AND MFMA
5.1.4 Number of training sessions
conducted in risk management
Under-performance is attributed
to this area of work being demand
driven.
Appointments have been scheduled
for training sessions in the 2019/20
financial year
5.1.5 Number of guidelines on risk
management curriculum developed
for institutions of higher learning
Under-performance is attributed to
this area of work being restructured.
N/A
5.1.7 Number of guidelines to assist with
the implementation of Treasury
Regulations, policies and Treasury
Instructions developed
Under-performance is attributed to
greater stakeholder engagements
being required.
The planned guidelines will be
issued in the 2019/20 financial year.
5.1.20 Number of consolidated annual
financial statements for national
Departments, public entities and
Reconstruction and Development
Programme (RDP) Fund tabled on 31
October
Under-performance is attributed
to consolidated annual financial
statements for national Departments
and public entities not being tabled
on 31 October 2019 due to the
delayed completion of audit for one
Department.
The consolidated annual financial
statements for national departments
and public entities were submitted
for tabling in Parliament on 14
December.
STRATEGIC OBJECTIVE 5.4: MODERNISE SCM POLICIES AND PROCEDURES
5.4.1 Number of Instructions issued in
line with policy interventions and
proposed designated products or
categories to enhance SCM policy
Under-performance is attributed
to the protracted consultative
process required prior to issuing an
instruction or circular, thus some
instructions were not concluded at
the end of the financial year, and
only 4 products were designated.
Outstanding instructions will be
finalised in 2019/20 upon the
conclusion of the consultative
process.
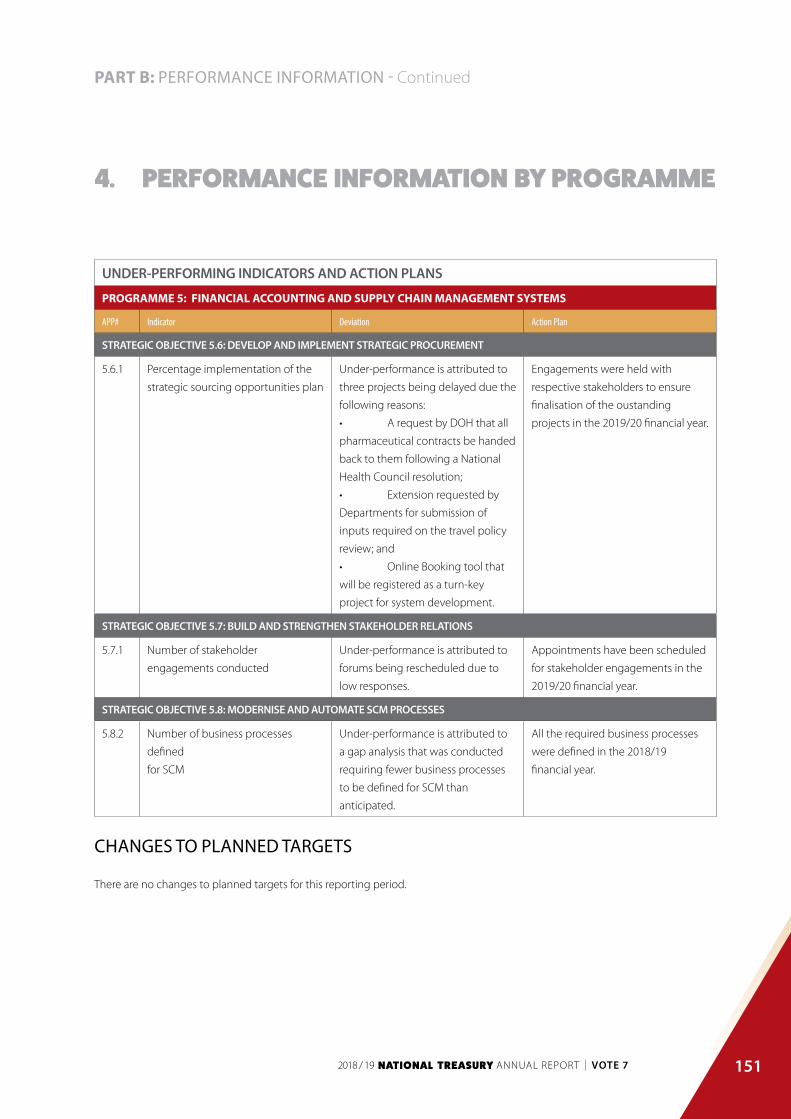
151
PART B: PERFORMANCE INFORMATION - Continued
4. PERFORMANCE INFORMATION BY PROGRAMME
UNDER-PERFORMING INDICATORS AND ACTION PLANS
PROGRAMME 5: FINANCIAL ACCOUNTING AND SUPPLY CHAIN MANAGEMENT SYSTEMS
APP# Indicator Deviation Action Plan
STRATEGIC OBJECTIVE 5.6: DEVELOP AND IMPLEMENT STRATEGIC PROCUREMENT
5.6.1 Percentage implementation of the
strategic sourcing opportunities plan
Under-performance is attributed to
three projects being delayed due the
following reasons:
• A request by DOH that all
pharmaceutical contracts be handed
back to them following a National
Health Council resolution;
• Extension requested by
Departments for submission of
inputs required on the travel policy
review; and
• Online Booking tool that
will be registered as a turn-key
project for system development.
Engagements were held with
respective stakeholders to ensure
finalisation of the oustanding
projects in the 2019/20 financial year.
STRATEGIC OBJECTIVE 5.7: BUILD AND STRENGTHEN STAKEHOLDER RELATIONS
5.7.1 Number of stakeholder
engagements conducted
Under-performance is attributed to
forums being rescheduled due to
low responses.
Appointments have been scheduled
for stakeholder engagements in the
2019/20 financial year.
STRATEGIC OBJECTIVE 5.8: MODERNISE AND AUTOMATE SCM PROCESSES
5.8.2 Number of business processes
defined
for SCM
Under-performance is attributed to
a gap analysis that was conducted
requiring fewer business processes
to be defined for SCM than
anticipated.
All the required business processes
were defined in the 2018/19
financial year.
CHANGES TO PLANNED TARGETS
There are no changes to planned targets for this reporting period.

152
PART B: PERFORMANCE INFORMATION - Continued
4. PERFORMANCE INFORMATION BY PROGRAMME
LIN
KIN
G P
ERFO
RMA
NCE
WIT
H B
UD
GET
S
PRO
GRA
MM
E 5:
FIN
AN
CIA
L A
CCO
UN
TIN
G A
ND
SU
PPLY
CH
AIN
MA
NA
GEM
ENT
SYST
EMS
2018
/19
2017
/18
FIN
AL
APP
ROPR
IATI
ON
ACTU
AL
EXPE
ND
ITU
RE(O
VER)
/UN
DER
EX
PEN
DIT
URE
FIN
AL
APP
ROPR
IATI
ON
ACTU
AL
EXPE
ND
ITU
RE(O
VER)
/UN
DER
EX
PEN
DIT
URE
R’00
0R’
000
R’00
0R’
000
R’00
0R’
000
PRO
GRA
MM
E M
AN
AG
EMEN
T FO
R
FIN
AN
CIA
L A
CCO
UN
TIN
G A
ND
SUPP
LY C
HA
IN M
AN
AG
EMEN
T
SYST
EMS
62 6
3750
175
12 4
6210
0 73
425
525
75 2
09
OFF
ICE
OF
THE
CH
IEF
PRO
CU
REM
ENT
OFF
ICER
70 5
7069
018
1 55
274
613
71 8
242
789
FIN
AN
CIA
L SY
STEM
S63
4 72
141
9 59
321
5 12
840
1 48
337
4 28
527
198
FIN
AN
CIA
L RE
PORT
ING
FO
R
NAT
ION
AL
ACC
OU
NTS
102
519
102
044
475
98 2
4097
284
956
FIN
AN
CIA
L M
AN
AG
EMEN
T
POLI
CY
AN
D C
OM
PLIA
NC
E
IMPR
OVE
MEN
T
133
611
130
261
3 35
012
9 22
512
0 45
68
769
AUD
IT S
TATU
TORY
BO
DIE
S97
738
97 7
38-
196
278
196
278
-
SERV
ICE
CH
ARG
ES: C
OM
MER
CIA
L
BAN
KS
289
275
1427
318
093
TO
TAL
1 10
2 08
586
9 10
423
2 98
11
000
846
885
833
115
013
153
PART B: PERFORMANCE INFORMATION - Continued
4. PERFORMANCE INFORMATION BY PROGRAMME
4.6 PROGRAMME 6: INTERNATIONAL FINANCIAL RELATIONS
PURPOSE
Manage South Africa’s interests in shaping regional and global policies that advance the economic, financial and development
objectives of the country and Africa.
STRATEGIC OBJECTIVES
• Advance South Africa’s interests specifically, and those of Africa more generally, through regular strategic analysis, engagements
and negotiations at regional and global financial and economic forums
• Increase Africa’s voice and South Africa’s influence in international institutions and forums
• Support an enabling environment for increased economic activity within Africa
SUB-PROGRAMMES
Programme Management for International Financial Relations
This sub-programme supports the planning, monitoring and delivering of the programme’s activities. The unit oversees South
Africa’s representation in international and regional financial institutions; manages bilateral and multilateral relationships on behalf
of National Treasury; and plans, implements and monitors programmes and activities within the divisional mandate.
International Economic Cooperation
This sub-programme focuses on improving South Africa’s participation in international and regional economic institutions. This
entails working through key economic institutions and fora such as the African Development Bank, the United Nations Economic
Commission for Africa, the New Partnership for Africa’s Development, the G20, the Brazil-Russia-India-China-South Africa (BRICS)
group of countries and the International Monetary Fund.
African Integration and Support
This sub-programme serves mainly as a vehicle to enable National Treasury to engage with Africa through the Southern African
Customs Union (SACU), the Southern African Development Co-operation (SADC) and the African Union (AU). Regional integration
in terms of growing trade, infrastructure investment and strengthening bilateral relations with key countries are the focus areas for
strengthening South Africa’s relations with SACU, SADC and Africa more broadly.

154
PART B: PERFORMANCE INFORMATION - Continued
4. PERFORMANCE INFORMATION BY PROGRAMME
International Development Funding Institutions
This sub-programme provides for subscriptions and contributions to international development institutions and multilateral banks.
It transfers funds to the African Development Bank and African Development Fund for buying shares and subscriptions, and for
accelerated encashment schedules to support African development; and to the World Bank Group (WBG) group for providing
concessional loans and grants to low income countries and for contributing to general and selective increases in the authorised
capital of the WBG.
International Projects
This sub-programme transfers funds to international projects and interventions. It supports priorities such as building capacity and
providing medical support to disaster-hit and impoverished areas. To this end, National Treasury contributes to the Commonwealth
Fund for Technical Cooperation and the International Finance Facility for Immunisation. The facility transfers funds to the Global
Alliance for Vaccines and Immunisation (GAVI), a public-private global health partnership aimed at supporting health care and
providing vaccines to reduce the number of vaccine-preventable deaths among children in low income countries.
SERVICE DELIVERY OBJECTIVES AND INDICATORS
Recent outputs
Africa Continental
Supported the Minister of Finance in his newly established role of budget oversight at the African Union (AU) through the Committee
of Fifteen Finance Ministers (F15). A key outcome was that the AU 2019 Budget was formulated and approved by the AU Summit
with a saving of 12 per cent from the 2018 Budget.
The participation of the F15 experts during the budget formulation led to the introduction of an effective budget planning and
management system, which was also supported by the South African chairperson at the technical budget formulation meetings.
The National Treasury participated in the AU Scale of Assessment negotiations for the financial years 2020-22. The key outcome was
a reduction of the scales of assessment from 9.6 per cent to 7.5 per cent for the period 2020-22 of the top contributing member
states, of which South Africa is part.
Southern African Customs Union
• Managed South Africa’s membership of the Southern African Customs Union (SACU), in collaboration with the Department of
Trade and Industry (DTI) and the South African Revenue Service (SARS), and led on the finance track of work.
• Exercised oversight over the effective governance of the SACU Secretariat by participating in the quarterly Finance and Audit
Committee (FAC) Commission meetings and SACU Council of Ministers’ meetings, as well as the 6th SACU Summit that took place
on 29 June 2018 in Botswana.
• The deliverables of work in this sphere includes overseeing the review of the 2002 SACU agreement with the objective of putting
SACU onto a developmental path.

155
PART B: PERFORMANCE INFORMATION - Continued
4. PERFORMANCE INFORMATION BY PROGRAMME
Southern Africa Development Community
• South Africa successfully chaired the Southern Africa Development Community (SADC) from August 2017 to August 2018.
• The National Treasury provided a supporting role to the Department of International Relations and Cooperation (DIRCO) as the
lead department during the Council of Ministers and the Heads of State and Government Summit in August 2018.
• The Minister of Finance hosted the Committee of Ministers of Finance and Investment as well as the Macroeconomic Peer Review
Panel, which was co-hosted with the Governor of the South African Reserve Bank in July 2018. A highlight was that that South
Africa was presented as one of the countries that had been peer reviewed as part of the SADC macroeconomic peer review
process.
• Supported the Minister of Finance’s bilateral engagement with Zimbabwe, which culminated in a Binational Commission in March
2019. A key outcome was South Africa’s undertaking to advocate for the clearance of debt arrears for Zimbabwe with international
development cooperation Partners.
Organisation for Economic Cooperation and Development
• South Africa is a key partner of the Organisation for Economic Cooperation and Development (OECD) alongside China, Brazil, India
and Indonesia. The National Treasury participated in the OECD bodies for experience-sharing, access to research and analysis,
benchmarking, and capacity building.
• Co-chaired the SA-OECD inter-departmental working group (IWG) with the DIRCO. Led the IWG work on the renewal of the
Cabinet mandate for SA-OECD relations and the negotiation of the South African Strategy for 2019/20.
World Economic Forum
The World Economic Forum (WEF) affords South Africa an opportunity to position the country as an attractive investment destination
to international investors. The National Treasury led the planning and coordination of South Africa’s participation at the January 2019
WEF Davos meeting, with the South African delegation led by President Cyril Ramaphosa.
World Bank
In 2018, the National Treasury represented South Africa (SA) in the recapitalisation of the World Bank. The recapitalisation of the
bank is critical in enabling it to deliver on its mandate of supporting member countries to achieve their development objectives of
reducing poverty and sharing prosperity. Participation in these institutions enables SA to maintain its voice and shareholding, as a
well as influence the decision-making process at the bank.
In December 2018, the former President of the World Bank Group, Dr Jim Yong Kim, visited South Africa and attended the Global
Citizen Festival at the invitation of President Ramaphosa. Bilateral discussions between the two focused on how the World Bank
Group could support the South African government’s development priorities, including addressing the human capital crisis facing
South Africa. Other interventions proposed included the school sanitation programme, scaling up the Youth Employment Service
(YES) initiative and identifying future drivers of growth. The President also held meetings with the relevant ministers and other key
stakeholders, where further areas of engagement in cities’ spatial integration and e-commerce platforms were identified.

156
PART B: PERFORMANCE INFORMATION - Continued
4. PERFORMANCE INFORMATION BY PROGRAMME
African Investment Forum
• South Africa co-hosted the Africa Investment Forum (AIF) with the African Development Bank (AfDB) in Johannesburg in
November 2018. The aim of the AIF is to mobilise funds for infrastructure development and bridge an estimated funding gap of
US$130-US$170 billion a year in the continent.
• It is supportive of the President’s US$100 billion investment mobilisation. South Africa managed to mobilise about US$ 6.8 billion
from the forum.
Brazil, Russia, India, China, South Africa
• South Africa assumed the Chair of the New Development Bank (NDB) Board of Governors in 2018 and subsequently, under the
stewardship of the National Treasury, successfully hosted the Fourth Annual Meeting of the Board of Governors of the NDB.
• In 2019, South Africa scaled up its engagement with the NDB and ramped up its project pipeline. South Africa’s total investments
from the NDB increased to US$ 1.46 billion, from US$ 680 million. The majority of the approved projects were in the clean energy
and water sectors.
• The NDB is in an advanced phase of preparation for launching a domestic bond programme in South Africa. The proceeds from
the bonds issued under the programme will be used for financing infrastructure and sustainable development projects in rands.
• As chair of Brazil, Russia, India, China, South Africa (BRICS), South Africa hosted the 10th Leaders’ Summit in Johannesburg. The
National Treasury co-hosted a seminar themed ‘BRICS and Africa: Navigating Global Economic Turbulence Together’ with the
South African Institute of International Affairs on the margins of the Leaders’ Summit,
Group of Twenty
• Supported South Africa’s effective engagement and coordination in the Group of Twenty (G20) and led on the finance track of
work.
• Supported the drafting of South Africa’s 2018 strategy for engagement with the G20, which was approved by Cabinet.
• Supported the President and ministers’ successful engagement at the Buenos Aires G20 Summit in November 2018, where the
President of South Africa was a lead speaker in the session called “Building Consensus”, which focused on issues of international
tax, the international financial architecture and international trade
• Supported the G20 Compact with Africa (CwA) initiative, which aims to stimulate economic activity in African economies and
has enrolled 12 African countries since its launch in 2017. The South African and German Finance Ministries co-chair this initiative.
• The Institute of International Finance (IIF) granted observer status to South Africa in the Principles Consultative Group (PCG) for the
principles for stable capital flows and fair debt restructuring.

157
PART B: PERFORMANCE INFORMATION - Continued
4. PERFORMANCE INFORMATION BY PROGRAMME
International Monetary Fund
• Impactful dialogue between South Africa and the International Monetary Fund (IMF) was sustained. During the period under
review, this included facilitating the IMF’s Article IV mission in May-June 2018 and the staff visit in November 2018.
• South Africa became one of the six members of the IMF Africa Group 1 Constituency Panel for a period of two years. The purpose
of the panel is to meet ahead of the Africa Group 1 Constituency meetings, where all 23 members are represented, to discuss
administrative issues related to the group. This was the first return of South Africa to the panel since 2014.
• South Africa facilitated a successful visit of the IMF Managing Director, Christine Lagarde, to South Africa in December 2018 during
which she met with South Africa’s President, the Reserve Bank Governor and ministers. The purpose of the visit was to enhance
policy dialogue and exchange views on South Africa’s economic development.

158
PART B: PERFORMANCE INFORMATION - Continued
4. PERFORMANCE INFORMATION BY PROGRAMME
PERF
ORM
AN
CE IN
DIC
ATO
RS
PRO
GRA
MM
E 6:
INTE
RNAT
ION
AL
FIN
AN
CIA
L RE
LATI
ON
S
APP#
INDI
CATO
RAC
TUAL
2015
/16
ACTU
AL20
16/1
7AC
TUAL
AC
HIEV
EMEN
T 20
17/2
018
TARG
ET
2018
/201
9AC
TUAL
AC
HIEV
EMEN
T20
18/2
019
DEVI
ATIO
N FR
OM
PLAN
NED T
ARGE
TRE
ASON
FOR
DEVI
ATIO
N
STRA
TEG
IC O
BJEC
TIVE
6.1
: AD
VAN
CE S
OU
TH A
FRIC
A’S
INTE
REST
S SP
ECIF
ICA
LLY,
AN
D T
HO
SE O
F A
FRIC
A M
ORE
GEN
ERA
LLY,
TH
ROU
GH
REG
ULA
R ST
RATE
GIC
AN
ALY
SIS,
EN
GAG
EMEN
TS A
ND
NEG
OTI
ATIO
NS
AT R
EGIO
NA
L A
ND
GLO
BAL
FIN
AN
CIA
L A
ND
ECO
NO
MIC
FO
RUM
S
6.1.
1Pe
rcen
tage
of o
blig
atio
ns to
war
ds
inte
rnat
iona
l agr
eem
ents
met
m
onito
red
N/A
100%
100%
100%
100%
N/A
N/A
6.1.
2Pe
rcen
tage
resp
onse
to c
usto
mer
re
ques
ts o
n m
anda
tory
brie
fing
note
s an
d an
alys
is
N/A
N/A
100%
100%
100%
N/A
N/A
6.1.
3Pe
rcen
tage
resp
onse
to c
usto
mer
re
ques
t on
ad-h
oc b
riefin
g no
tes
and
anal
yses
N/A
N/A
100%
100%
100%
N/A
N/A
STRA
TEG
IC O
BJEC
TIVE
6.2
: IN
CREA
SE A
FRIC
A’S
VOIC
E A
ND
SO
UTH
AFR
ICA’
S IN
FLU
ENCE
IN IN
TERN
ATIO
NA
L IN
STIT
UTI
ON
S A
ND
FO
RUM
S
6.2.
1N
umbe
r of i
nter
vent
ions
to
incr
ease
Sou
th A
frica
’s pr
esen
ce
with
in in
stitu
tions
of p
artic
ular
st
rate
gic
valu
e
N/A
01
11
N/A
N/A
6.2.
2Pe
rcen
tage
of i
nter
vent
ions
in
purs
uit o
f ins
titut
iona
l ref
orm
im
plem
ente
d
N/A
N/A
100%
100%
100%
N/A
N/A
STRA
TEG
IC O
BJEC
TIVE
6.3
: SU
PPO
RT A
N E
NA
BLIN
G E
NVI
RON
MEN
T FO
R IN
CREA
SED
ECO
NO
MIC
ACT
IVIT
Y W
ITH
IN A
FRIC
A
6.3.
1N
umbe
r of i
nitia
tives
dev
elop
ed
to e
xpan
d re
latio
ns w
ith k
ey
stra
tegi
c pa
rtne
rs in
Afri
ca
N/A
21
11
N/A
N/A
6.3.
2Pe
rcen
tage
of i
mpl
emen
ted
iden
tified
pro
ject
s an
d pl
ans
to
acce
lera
te re
gion
al in
tegr
atio
n re
view
ed
N/A
50%
100%
100%
100%
N/A
N/A

159
PART B: PERFORMANCE INFORMATION - Continued
4. PERFORMANCE INFORMATION BY PROGRAMME
STRATEGY TO OVERCOME AREAS OF UNDER-PERFORMANCE(INDICATORS AND ACTION PLANS)
No under-performance.
CHANGES TO PLANNED TARGETS
There are no changes to planned targets for this reporting period.

160
PART B: PERFORMANCE INFORMATION - Continued
4. PERFORMANCE INFORMATION BY PROGRAMME
LIN
KIN
G P
ERFO
RMA
NCE
WIT
H B
UD
GET
S
PRO
GRA
MM
E 6:
IN
TERN
ATIO
NA
L FI
NA
NCI
AL
RELA
TIO
NS
2018
/19
2017
/18
FIN
AL
APPR
OPR
IATI
ON
ACTU
ALEX
PEN
DIT
URE
(OVE
R)/U
ND
ER
EXPE
ND
ITU
REFI
NAL
AP
PRO
PRIA
TIO
NAC
TUAL
EXPE
ND
ITU
RE(O
VER)
/UN
DER
EX
PEN
DIT
URE
R’00
0R’
000
R’00
0R’
000
R’00
0R’
000
PRO
GRA
MM
E M
AN
AG
EMEN
T
FOR
INTE
RNAT
ION
AL
FIN
AN
CIA
L
RELA
TIO
NS
10 1
619
043
1 11
88
207
7 50
770
0
INTE
RNAT
ION
AL
ECO
NO
MIC
COO
PERA
TIO
N
49 3
9846
710
2 68
837
576
36 2
111
365
AFR
ICA
N IN
TEG
RATI
ON
AN
D
SUPP
ORT
1 01
7 11
91
002
585
14 5
3489
6 83
089
6 25
557
5
INTE
RNAT
ION
AL
DEV
ELO
PMEN
T
FUN
DIN
G IN
STIT
UTI
ON
S
4 78
6 12
74
729
982
56 1
454
977
549
4 51
2 03
646
5 51
3
INTE
RNAT
ION
AL
PRO
JEC
TS20
316
19 3
6695
020
527
17 8
292
698
5 88
3 12
15
807
686
75 4
355
940
689
5 46
9 83
847
0 85
1

161
PART B: PERFORMANCE INFORMATION - Continued
4. PERFORMANCE INFORMATION BY PROGRAMME
4.7 PROGRAMME 7: CIVIL AND MILITARY PENSIONS, CONTRIBUTIONS TO FUNDS AND OTHER BENEFITS
PURPOSE
Provide for government’s pension and post-retirement medical benefit obligations to former employees of state Departments and
bodies. Provide for similar benefits to retired members of the military.
STRATEGIC OBJECTIVES
• Ensure good governance and a robust control environment for fund administration
• Provide an improved and integrated customer service experience
SUB-PROGRAMMES
Civil Pensions and Contributions to Funds
This sub-programme, consisting of post-retirement medical benefits, injury on duty and special pensions, provides for medical
subsidies to retired civil servants and pension payments to injured and disabled civil servants, to the beneficiaries of deceased civil
servants and to former struggle veterans.
Military Pensions
This sub-programme provides for the payment of military pension benefits and medical claims arising from injuries sustained during
various wars including the liberation wars. The payment includes pension payments and medical assistance including devices and
other related expenses in terms of the Military Pensions Act.
Other Benefits
This sub-programme processes the payment of benefits to former members of legislative assemblies. These include payments to
former members of the legislative assemblies of the former Venda, Transkei, Ciskei and Bophuthatswana governments; judges or their
widows in terms of the Judges’ Remuneration and Conditions of Employment Act (Act No. 88 of 1989); and former state presidents.

162
PART B: PERFORMANCE INFORMATION - Continued
4. PERFORMANCE INFORMATION BY PROGRAMME
SERVICE DELIVERY OBJECTIVES AND INDICATORS
Recent outputs
The programme achieved 100 per cent resolution of the integrity of data against a target of 85 per cent, by maintaining continual
monitoring and data cleansing.
In terms of client queries, enquiries and complaints, the programme achieved its target of 100 per cent of queries resolved within
seven days. This is attributed to customer-centric team efforts and continual maintenance of stakeholder relationships.
The programme paid 99 per cent of benefits within 45 days against a target of 96 per cent.
The programme paid out pensions and benefits of R4.9 billion in 2018/19 compared to R4.6 billion in 2017/18, an increase of 6.5 per
cent. This can be attributed to the increase in post-retirement medical subsidies, injury on duty claims and annual increases.
The overall number of pensioners and beneficiaries increased by 5 per cent in 2017/18, from 132 407 in 2017/18 to 139 783 in
2018/19. The increase in applications received can be attributed to post-retirement medical subsidy and injury on duty claims.
Stakeholder Relations
The programme places a premium on building and maintaining stakeholder relations. This process entails planning, targeting,
monitoring and reporting of all stakeholder activities that took place during the year.
The programme held various workshops and roadshows to ensure that members are informed of the programme’s products and
services in the following areas:
Kimberly, Modimolle, George, De Aar, Bloemfontein, Kuruman, Upington, KwaMhlanga, Tzaneen (Ga-Kgapane), Potchefstroom, Ga-
Rankuwa, Mthatha, Oudtshoorn and Newcastle.
Focus areas arising from 2018/19
The programme will be embarking on a training initiative requested by the Northern Cape Province to all human resource
practitioners on the injury on duty product and its processes at employer department level. This initiative will be rolled out to other
provinces at a later stage.

163
PART B: PERFORMANCE INFORMATION - Continued
4. PERFORMANCE INFORMATION BY PROGRAMME
PERF
ORM
AN
CE IN
DIC
ATO
RS
PRO
GRA
MM
E 7:
CIV
IL M
ILIT
ARY
PEN
SIO
NS,
CO
NTR
IBU
TIO
NS
TO F
UN
DS
AN
D O
THER
BEN
EFIT
S
APP#
INDI
CATO
RAC
TUAL
2015
/16
ACTU
AL20
16/1
7
ACTU
AL
ACHI
EVEM
ENT
2017
/201
8
TARG
ET
2018
/201
9
ACTU
AL
ACHI
EVEM
ENT
2018
/201
9
DEVI
ATIO
N FR
OM
PLAN
NED T
ARGE
TRE
ASON
FOR D
EVIAT
ION
STRA
TEG
IC O
BJEC
TIVE
7.1
: EN
SURE
GO
OD
GO
VERN
AN
CE A
ND
RO
BUST
CO
NTR
OL
ENVI
RON
MEN
T FO
R FU
ND
AD
MIN
ISTR
ATIO
N
7.1.
1Pe
rcen
tage
of
bene
fits
valid
ated
for
paym
ent p
aid
with
in
liabl
e da
tes
92.5
% o
f ben
efits
pai
dw
ithin
liab
ility
dat
e.95
%99
%96
%99
%3%
Ove
r-pe
rfor
man
ce is
at
trib
uted
to e
ffect
ive
man
agem
ent o
f ad
min
istr
atio
n of
be
nefit
s.
7.1.
2Pe
rcen
tage
co
mpl
ianc
e w
ith
SLA
bet
wee
n N
T an
d G
PAA
spe
cific
ally
Pr
ogra
mm
e 7
rela
ted
indi
cato
rs
97.5
% C
ompl
ianc
ew
ith S
LA.
83%
100%
97.5
%99
.4%
1.9%
Ove
r-pe
rfor
man
ce
is a
ttrib
uted
to
effec
tive
and
effici
ent
adm
inis
trat
ion
of a
ll pr
ogra
mm
e 7
bene
fit
fund
s.
7.1.
3Pe
rcen
tage
inte
grity
of
clie
nt d
ata
55%
clie
nt d
ata
Inte
grity
.10
0%95
%85
%10
0%15
%O
ver-
perf
orm
ance
is
attr
ibut
ed to
con
tinuo
us
mon
itorin
g of
pr
ogra
mm
e da
ta.
STRA
TEG
IC O
BJEC
TIVE
7.2
: PRO
VID
E A
N IM
PRO
VED
AN
D IN
TEG
RATE
D C
UST
OM
ER S
ERVI
CE E
XPER
IEN
CE
7.2.
1Pe
rcen
tage
of
cust
omer
ser
vice
co
mpl
aint
s re
spon
ded
to w
ithin
se
ven
days
100%
of t
heco
mpl
aint
s w
ere
reso
lved
with
in 7
day
s.
100%
100%
100%
100%
N/A
N/A

164
PART B: PERFORMANCE INFORMATION - Continued
4. PERFORMANCE INFORMATION BY PROGRAMME
STRATEGY TO OVERCOME AREAS OF UNDER-PERFORMANCE (INDICATORS AND ACTION PLANS
No under-performance.
CHANGES TO PLANNED TARGETS
There are no changes to planned targets for this reporting period.

165
PART B: PERFORMANCE INFORMATION - Continued
4. PERFORMANCE INFORMATION BY PROGRAMME
LIN
KIN
G P
ERFO
RMA
NCE
WIT
H B
UD
GET
S
PRO
GRA
MM
E 7:
CIV
IL M
ILIT
ARY
PE
NSI
ON
S, C
ON
TRIB
UTI
ON
S TO
FU
ND
S A
ND
OTH
ER B
ENEF
ITS
2018
/19
2017
/18
FIN
AL
APPR
OPR
IATI
ON
ACTU
ALEX
PEN
DIT
URE
(OVE
R)/U
ND
ER
EXPE
ND
ITU
REFI
NAL
AP
PRO
PRIA
TIO
NAC
TUAL
EXPE
ND
ITU
RE(O
VER)
/UN
DER
EX
PEN
DIT
URE
R’00
0R’
000
R’00
0R’
000
R’00
0R’
000
GO
VERN
MEN
T PE
NSI
ON
S
AD
MIN
ISTR
ATIO
N A
GEN
CY
64 4
8864
488
-65
196
62 0
613
135
CIV
IL P
ENSI
ON
S A
ND
CON
TRIB
UTI
ON
S TO
FU
ND
S
4 01
7 70
94
017
142
567
3 63
8 82
23
614
441
24 3
81
MIL
ITA
RY P
ENSI
ON
S A
ND
OTH
ER
BEN
EFIT
S
939
080
938
470
610
944
184
941
586
2 59
8
TOTA
L 5
021
277
5 02
0 10
01
177
4 64
8 20
24
618
088
30 1
14

166
PART B: PERFORMANCE INFORMATION - Continued
4. PERFORMANCE INFORMATION BY PROGRAMME
4.8 PROGRAMME 8: TECHNICAL AND MANAGEMENT SUPPORT AND DEVELOPMENT FINANCE
PURPOSE
This programme provides advisory services, programme management and development finance support to improve public finance
management, support high-impact government initiatives, facilitate employment creation, and strengthen infrastructure planning
and delivery.
STRATEGIC OBJECTIVES
• Establish the GTAC as a centre of excellence in public sector advisory services, transaction support, project management and
public finance management
• Local government financial management improvement
• Promotion of urban integration and neighbourhood development
• Facilitation of employment creation and inclusive growth
• Improved infrastructure planning, management and skills development
Programme’s and sub-programmes
Government Technical Advisory Centre (GTAC)
GTAC draws its mandate from the responsibility of National Treasury to promote transparency and the effective management of
public finances and to assist organs of state in building their capacity for efficient, effective and transparent financial management,
as set out in section 6 of the Public Finance Management Act (PFMA). GTAC was established as a government component in terms
of section 7A(4) of the Public Service Act (Act No. 103 of 1994) through Government Notice 261, Gazette 35194, of 30 March 2012.
GTAC is a component of National Treasury. GTAC’s financing streams include core funding from National Treasury, donor funding
from international partners, and cost recovery on the provision of services.
GTAC’s scheduled functions are:
• To render technical consulting services to centre-of-government Departments and organs of state
• To provide specialised procurement support for high-impact government initiatives
• To provide advice on the feasibility of infrastructure projects
• To provide knowledge management for projects undertaken
• Anything ancillary to the functions listed

167
PART B: PERFORMANCE INFORMATION - Continued
4. PERFORMANCE INFORMATION BY PROGRAMME
In support of National Treasury and its functions as set out in the PFMA, GTAC’s responsibilities include the following:
• Advising on the feasibility and financing of major capital projects and the investment requirements of state-owned companies
• Supporting PPP transactions, in keeping with provisions of the PFMA and Treasury Regulations
• Undertaking expenditure and performance reviews for National Treasury and the DPME
• Providing support for budgetary and public finance management reform, enhancing accountability, transparency and effective
service delivery
• Advising on organisational development, strategic planning and operational improvements in public service delivery
• Providing support for infrastructure investment, economic development and social service delivery improvements, in line with
the NDP and the MTSF
GTAC’s long term strategic intent is to provide a centre of excellence in policy advice and public finance management, in partnership
with academic and research centres focused on public-sector management and training. In partnership with the Southern African
Labour and Development Research Unit at the University of Cape Town, GTAC supports a research programme on employment,
income distribution and inclusive growth and seeks to promote public discourse and understanding of public policy, social and
economic development and public finance management through publications, consultative forums and dialogue.
On behalf of National Treasury, GTAC administers the Employment Creation Facilitation Programme and the Municipal Finance
Improvement Programme, and contributes to the City Support and Infrastructure Delivery Improvement Programmes of the
Intergovernmental Relations division.
Within the context of the NDP and the MTSF, GTAC contributes to building a capable and development-oriented state while also
strengthening capacity to work with the private sector in promoting growth, employment, infrastructure investment and public
service delivery.
For the medium-term period ahead, GTAC’s activities are organised as follows:
• Management Support Services: Strategy, management and communications, financial management, human capital management,
including human resources management and professional services procurement
• Transaction and Advisory Services: Public policy and finance advice, organisational development, planning and project
management services, advice and support to Departments, municipalities and public entities on PPPs and high-impact
procurement projects; transaction and contract management support for large or complex procurement processes. Advice and
support for infrastructure and development finance, analysis of public expenditure and performance, environmental economics,
state actuarial advice and capital project appraisal
• Programme Management Services: Planning and administration of the Jobs Fund, monitoring and evaluation of projects and
support for employment-related research and planning, administration and monitoring of the MFIP III programme
Local Government Financial Management Support
The Local Government Financial Management Support sub-programme has one component:
• The Municipal Finance Improvement Programme (MFIP), which provides technical assistance and support to National Treasury,
provincial treasuries and municipalities by placing long term advisors with experience and expertise in municipal financial
management to facilitate key reforms, improvements and skills transfer

168
PART B: PERFORMANCE INFORMATION - Continued
4. PERFORMANCE INFORMATION BY PROGRAMME
The third phase of the MFIP (MFIP III) commenced in April 2017 and draws extensively on the experiences and lessons of the first
two phases of the programme. The MFIP is administered by a Programme Management Unit (PMU) located functionally in the Office
of the Accountant-General and led by the Head of the Programme Management (PMU). GTAC provides administrative support to
the PMU. Its responsibilities include assigning municipal finance specialists to assist national and provincial treasuries to improve
their ability to monitor and support municipalities, and place long term advisors directly at municipalities, based on requests for
assistance and diagnostic assessment outcomes.
The intended outcomes of the MFIP are to improve financial management capacity, qualified finance officers, enhanced budget and
financial management practices, and improved financial health and audit outcomes. The MFIP is overseen by a steering committee
chaired by the Accountant-General and constituted by national and provincial programme stakeholders.
Urban Development and Support
Urban Development and Support consists of two programmes:
The Neighbourhood Development Partnership Programme, which supports municipal planning and investment in targeted
locations, aimed at attracting and sustaining third-party capital investment and business development towards spatial and economic
transformation, with a focus on improving the quality of life and access to opportunities in under-served townships or settlements.
The Neighbourhood Development Partnership Grant (NDPG) was introduced in 2006 with an initial commitment of R10 billion to
invest in under-served residential neighborhoods and to leverage private sector development in these areas.
The NDP’s Urban Network Strategy targets urban hub precincts with secondary linkages to under-served residential areas and built
environment upgrade projects in urban or rural townships. The NDPG consists of two complementary components: a technical
assistance grant for municipal planning of potential capital projects within urban hubs across sectors and spheres, and a capital
grant for funding selected catalytic projects within urban hubs.
The programme aims to encourage complementary public and private investment in these targeted locations and in this way
contribute to the broader goal of livable, sustainable, resilient, efficient and integrated towns and cities. The Urban Network Strategy
aims to optimise the spatial impact of public infrastructure investment, fiscal and regulatory measures and coordinated urban
management in identified transit-oriented urban hubs. NDP projects in rural municipalities are supported in collaboration with the
Department of Rural Development and Land Reform.
The Cities Support Programme (CSP) aims to promote cities that are inclusive, productive and sustainable through accelerated
and more inclusive development in major urban areas. This is delivered by focusing on improvements to cities’ governance and
built environment planning, improved human settlements and public transport management, local economic development and
environmental sustainability as well as climate resilience. The CSP includes technical assistance, peer learning, collaborative reviews
and development finance support and is implemented through a partnership model that includes the Development Bank of
Southern Africa, the World Bank, SA Cities Network and GTAC.
The Integrated City Development Grant (ICDG) was introduced in 2013/14 and is a component of National Treasury’s broader
Cities Support Programme (CSP). The ICDG is intended as an incentive to metropolitan municipalities to strengthen planning and
169
PART B: PERFORMANCE INFORMATION - Continued
4. PERFORMANCE INFORMATION BY PROGRAMME
delivery capacity and to target infrastructure spending to transform inefficient urban landscapes into more inclusive, productive
and sustainable spatial forms. Eligibility is restricted to municipalities with sound financial management and acceptable levels of
capital expenditure performance. To receive the first 2015/16 transfer of the ICDG, municipalities must approve and submit a Built
Environment Performance Plan (BEPP) that identifies catalytic projects and associated outcome targets for identified integration
zones. Subsequent transfers will be linked to progress reports on these projects.
The NDPG is administered by the Neighbourhood Development Programme under the Intergovernmental Relations division, while
the CSP reports to the Provincial and Local Government Infrastructure units of the Intergovernmental Relations division.
EMPLOYMENT CREATION FACILITATION
The Employment Creation Facilitation sub-programme was introduced in 2011 to contribute to employment and inclusive growth
by supporting innovative approaches to job creation and enterprise development. The main component of the programme is
the Jobs Fund, a multi-year R9 billion investment which leverages complementary funding from public and private sector project
partners. It operates as a “challenge fund” and allocates matching grants following a competitive, open and transparent application
process. Project allocations are made by an independent investment committee.
As at 30 June 2016, the Jobs Fund had completed five funding rounds and approved 104 projects with a total grant value of R5.42
billion. Commitments by project partners amounted to a further R6.37 billion. The approved projects target the creation of 126
547 new permanent jobs, 88 997 permanent placements in existing vacant jobs and 222 377 training opportunities. Enterprise
development and work-seeker support projects account for the bulk of project allocations and employment commitments.
A further call for proposals was initiated in November 2015 aimed at providing financial assistance for new and innovative initiatives
that had high potential for direct job creation in the short to medium term and/or were focused on reducing barriers to job creation.
These initiatives had to display the potential for triggering systemic change in the South African market, thus unlocking long term
job creation. Concept note applications for this round opened on 17 November 2015 and closed on 1 February 2016. To date, 21
projects have been approved but the final outcome from this round is set to be confirmed by the Jobs Fund Investment Committee
(IC) by the end of the year. Once these have been confirmed, their contracted targets will be added to the current portfolio targets,
which will result in a possible new permanent job target of at least 140 000 and a permanent placement target of 98 000.
The Employment Facilitation sub-programme also supports a research project (REDI3x3), based at the Southern African Labour
and Development Research Unit at the University of Cape Town, and the www.econ3x3.org web forum which publishes accessible
policy-relevant research on employment, income distribution and inclusive growth.
INFRASTRUCTURE DEVELOPMENT SUPPORT
The Infrastructure Development Support sub-programme consists of two elements:
The Infrastructure Skills Development Grant (ISDG), which assists municipalities to provide built environment graduates with training
and support leading to professional registration.

170
PART B: PERFORMANCE INFORMATION - Continued
4. PERFORMANCE INFORMATION BY PROGRAMME
The Infrastructure Delivery Improvement Programme (IDIP), which provides advisory and technical support to provincial
Departments of health, education and public works, and to selected municipalities, to improve infrastructure planning,
procurement and contract management.
Municipalities apply for funding from the ISDG through a business plan which demonstrates that they have suitable projects, and
training and mentoring capacity to support identified graduates in engineering, town planning, architecture, quantity surveying,
geographic information systems and project management on the “road-to-registration” with the relevant statutory councils. The
business plan must include an absorption strategy for successful candidates in the applicant municipality or in another municipality.
The key intended outcomes of the grant are to develop technical capacity in local government and increase the number of qualified
and professionally registered graduates in built environment disciplines. The grant is administered by the Provincial and Local
Government Infrastructure Unit of the Intergovernmental Relations division and its requirements are set out in the ISDG Guidelines
published by the unit.
The Provincial and Local Government Infrastructure Unit is also responsible for the IDIP, through which experienced professional
advisors are assigned to provincial Departments or municipalities to assist with developing infrastructure planning and project
management capacity. Currently in its third phase, the IDIP programme includes implementation support for the Infrastructure
Delivery Management System (IDMS) developed in partnership with the Construction Industry Development Board. The programme
is implemented in cooperation with the national Departments of Basic Education, Health and Public Works.
SERVICE DELIVERY OBJECTIVES AND INDICATORS
Recent outputs
In 2018/19 GTAC’s current portfolio of work included projects in key sectors of government business:The Capital Projects Appraisal unit assisted the National Treasury in conceptualising the budget facility for infrastructure, as
part of the ongoing budget reform process. The facility aims to improve the rigour of technical assessment and budgeting for
full life cycle costs of projects. A second call for submissions under the Budget Facility for Infrastructure (BFI) initiative began
with publishing the updated guidelines, together with a budget statement template developed by the Government Technical
Advisory Centre (GTAC). A total of 56 project proposals were received, and the preliminary assessments were conducted based
on the guidelines’ set criteria to inform decisions on the selection of projects that would proceed to the detailed analysis stage. A
total of 32 projects were selected for detailed analysis, and project findings and recommendations reports were completed. GTAC
further completed two research reports in the energy planning area, which will be used to meaningfully contribute to policy
dialogue given the country’s energy challenges.
171
PART B: PERFORMANCE INFORMATION - Continued
4. PERFORMANCE INFORMATION BY PROGRAMME
The Technical Consulting Services unit supported 80 projects aimed at building institutional capacity of client departments. This
support is provided in four main areas: inter-governmental infrastructure delivery support, macro-institutional support, organisational
strengthening services, and service delivery effectiveness and efficiency support. Some of the projects undertaken during the year
include:
• Conducting a feasibility study for the Department of Public Service and Administration (DPSA) on the extension of the housing
allowance for retired employees.
• Review of Department of Telecommunications and Postal Services (DTPS) business cases for the establishment of the State
Infrastructure Company and State IT Company.
• Technical support to the Western Cape Delivery Support Unit, in the Western Cape Department of the Premier, to improve and
streamline the performance and operation of strategic initiatives (known as game changers) in the province.
• Assisting the Department of Higher Education and Training (DHET) to produce a business case for the National Skills Authority
(NSA) to improve its effectiveness and strengthen its new monitoring and evaluation role.
Transaction Advisory Services and Public-Private Partnership (PPP) has registered 26 transaction advisory projects and completed
reviews of public-private partnership assessments to streamline the implementation of these partnerships and improve project
delivery timelines.
The Public Expenditure and Policy Analysis (PEPA) unit conducted five performance expenditure reviews (PERs) feedback sessions
with relevant stakeholders (the National Treasury: Public Finance and Intergovernmental Relations representatives) in support of the
following five PERs:
• Fleet management
• Research, development and innovation
• Housing rental stock
• Defence
• General public service.
The Municipal Finance Improvement Programme (MFIP) procured and deployed a total of 69 technical advisors during the 2018/19
financial year to provide support in the functional areas referred to above, and to enhance programme management capabilities
within the Programme Management Unit (PMU).
As at 31 March 2018, the programme was providing support in the following areas:
• Direct capacity support to municipal Budget and Treasury Offices (BTOs) in general financial management areas: 19 advisors were
deployed in municipalities across the nine provinces
• Direct capacity support to the Municipal Finance Units of Provincial Treasuries (PTs); 31 technical advisors were placed at the PTs
providing:
• General PT support (5)
• Specialist supply chain management (SCM) support (7)
• Municipal standard chart of accounts (mSCOA) support (8)
• Specialist asset management support (6)
• Specialist revenue management support (5).

172
PART B: PERFORMANCE INFORMATION - Continued
4. PERFORMANCE INFORMATION BY PROGRAMME
• Direct capacity support to two National Treasury (NT) Chief Directorates (CDs), namely Local Government Budget Analysis (LGBA)
and MFMA Implementation. Thirteen technical advisors were placed in the two CDs, providing specialist support in the Financial
Management Capability Maturity Model (FMCMM) (2); audit outcomes (3); budgeting and reporting (1); the municipal finance
recovery service (MFRS) (6); and revenue management (1).
• The full complement of (6) technical advisors was procured to provide programme and project management capacity support to
officials in the MFIP PMU.
During the period under review, significant progress was made with the implementation of a range of measures to improve the
overall effectiveness and efficiency of the programme. These processes included strengthening the institutionalisation of the
modified MFIP business model; ongoing elucidation and advocacy of revised governance and management arrangements with
programme stakeholders; the appointment of PMU officials to further bolster programme accountability and sustainability; sourcing
of the majority of technical advisors to implement the entire spectrum of MFIP technical support to programme beneficiaries; and
implementing the MFIP knowledge and information management strategy and model to ensure increased efficiency in programme
administration and enhance knowledge sharing and collaborative learning across the MFIP project work streams.
The Jobs Fund Management unit assessed 214 Concept Note applications submitted in response to its 8th funding round; of these,
43 applicants were invited to submit a full business case application. The total grant request from applicants in the 8th funding round
was for a grant request of R3.7 billion to be matched with R8. 2 billion.
Since inception, 152 projects have been approved against a target of 150; 25 withdrew prior to contracting, leaving 127 on the
approved portfolio, with 116 projects currently in implementation. The quality of proposals submitted largely determines the
number of projects approved.
Urban Development and Infrastructure Development Support
In 2018/19, 716 officials in local, provincial and national departments were oriented through Infrastructure Delivery Management
System (IDMS) initiatives, including courses on infrastructure planning and budgeting, supply chain management and IDMS executive,
Standards for Infrastructure Procurement and Delivery Management (SIPDM) and the Infrastructure Progression Model (IPM).
In the 2018/19 financial year, 378 graduates received professionalisation exposure and training through the Infrastructure Skills
Development Grant (ICDG), which included 47 newly recruited graduates in the financial year 2018/19. In 2018/19, 18 graduates
completed training and acquired professional registration. Thirteen of these graduates were absorbed in municipalities.
The Cities Support Programme (CSP) delivered a final executive leadership programme (ELP) to political as well as administrative
heads of metros. This five-day programme, in cooperation with the Gordon Institute of Business Science (GIBS), focused on
sustainability and resilience in metros. The feedback confirmed a highly successful ELP with significant political buy-in, support and
programme participation.
Another flagship project was the delivery of the Urbanisation Review report for South Africa. The background to the Urbanisation
Review project was that although the challenges and opportunities of urban growth and development were receiving renewed
policy attention, the National Development Plan (NDP), the Integrated Urban Development Framework (IUDF) and various ministers
173
PART B: PERFORMANCE INFORMATION - Continued
4. PERFORMANCE INFORMATION BY PROGRAMME
had emphasised the need for a new approach to providing infrastructure, housing and public transport services to make cities
engines of economic growth while overcoming apartheid spatial divisions. Many key urban policy issues were not well understood,
and the project therefore aimed to contribute to public policy efforts to enhance returns from urbanisation by clarifying implications
of the evolution of the national urban system and of individual metros. It aimed to do this by identifying key policy recalibrations
most likely to promote inclusive economic growth, and by suggesting a framework for prioritising and sequencing policy initiatives
and institutional reforms. Ten papers constituted the major outputs of the Urbanisation Review project.
The CSP launched the Catalytic Land Development Guidelines on 18 August 2018. The CSP, the World Bank and the Swiss Economic
Cooperation Organisation (SECO) hosted a third workshop on Catalytic Land Development Programmes in July 2017. The workshop
was designed to mirror the CSP’s emerging framework on the Catalytic Land Development Life Cycle, and was structured around
three thematic areas:
• Catalytic Programme Inception and Concept stages
• Catalytic Programme Pre-feasibility and Feasibility stages
• Catalytic Programme Preparation Finalisation stage.
The guideline concluded the inputs and feedback from the workshop, and aimed at further supporting metropolitan municipalities
to conceptualise and implement catalytic land development programmes to achieve their strategic objectives.
Infrastructure Development Support
The Infrastructure Delivery Management System Book of Knowledge (IDMSBOK), which was necessary for institutionalisation of
the deliverables of the Infrastructure Delivery Improvement Programme (IDIP), which provided advisory and technical support to
provincial Departments of health, education and public works, and to selected municipalities, to improve infrastructure planning,
procurement and contract management.
The Provincial and Local Government Infrastructure unit continued to implement further infrastructure management reforms like
IDMSBOK since the end of IDIP, the program ended March 2018 after four phases. In the IDIP programme experienced professional
advisors were assigned to provincial Departments or municipalities to assist with developing infrastructure planning and project
management capacity. The IDMSBOK will create a platform through which information can be shared ubiquitously and a digital
platform that is systematically creating knowledge products through experiences of various professionals in the public sector.
In the reporting period we have continued to increase implementation support for the state through partnerships with the office
of Procurement Officer and Construction Industry Development Board. The programme is implemented in cooperation with the
national Departments of Basic Education, Health and Public Works. The IDIP program was implemented largely through appointment
of consultants, in the reporting period, we started to appoint qualified officials; to capacitate the state, in Health and Education
infrastructure units; that were created in the respective departments, through the use of a portion of Health Facility Revitalisation
grant and Education infrastructure grant respectively. A further need was identified to increase capacity of Provincial Treasuries in
quality of infrastructure spend by creating infrastructure units. This work was carried out and are awaiting finalisation by Minister of
department of Public Service and Administration (DPSA) before appointing to the structures.

174
PART B: PERFORMANCE INFORMATION - Continued
4. PERFORMANCE INFORMATION BY PROGRAMME
PERF
ORM
AN
CE IN
DIC
ATO
RS
PRO
GRA
MM
E 8:
TEC
HN
ICA
L A
ND
MA
NA
GEM
ENT
SUPP
ORT
AN
D D
EVEL
OPM
ENT
FIN
AN
CE
APP#
INDI
CATO
RAC
TUAL
2015
/16
ACTU
AL20
16/1
7AC
TUAL
AC
HIEV
EMEN
T 20
17/2
018
TARG
ET
2018
/201
9AC
TUAL
AC
HIEV
EMEN
T20
18/2
019
DEVI
ATIO
N FR
OM
PLAN
NED T
ARGE
TRE
ASON
FOR D
EVIAT
ION
STRA
TEG
IC O
BJEC
TIVE
8.1
: EST
ABL
ISH
MEN
T O
F G
TAC
AS
A C
ENTR
E O
F EX
CELL
ENCE
IN P
UBL
IC S
ECTO
R A
DVI
SORY
SER
VICE
S, T
RAN
SACT
ION
SU
PPO
RT,
PRO
JECT
MA
NAG
EMEN
T A
ND
PU
BLIC
FIN
AN
CE M
AN
AGEM
ENT
8.1.
1N
umbe
r of G
TAC
m
onito
ring
repo
rts
repo
rtin
g on
pro
gres
s pr
oduc
ed
N/A
4 qu
arte
rly
repo
rt to
the
Min
iste
r
44
4N
/AN
/A
8.1.
2N
umbe
r of t
echn
ical
ad
viso
ry p
roje
cts
supp
orte
d
135
8480
8080
N/A
N/A
8.1.
3N
umbe
r of
tran
sact
ion
advi
sory
pr
ojec
ts re
gist
ered
N/A
2519
1726
9O
ver-
perf
orm
ance
is a
ttrib
uted
to
gre
ater
resp
onse
than
an
ticip
ated
.
8.1.
4N
umbe
r of c
apita
l pr
ojec
t app
rais
al
repo
rts
com
plet
ed
N/A
1038
532
27O
ver-
perf
orm
ance
is a
ttrib
uted
to
a g
reat
er re
spon
se th
an
antic
ipat
ed g
iven
that
the
Budg
et F
acili
ty fo
r Inf
rast
ruct
ure
is a
rela
tivel
y ne
w in
itiat
ive
in
gove
rnm
ent.
8.1.
5N
umbe
r of
perf
orm
ance
and
ex
pend
iture
revi
ews
supp
orte
d
N/A
10 p
er y
ear
9 pe
r yea
r5
5N
/AN
/A
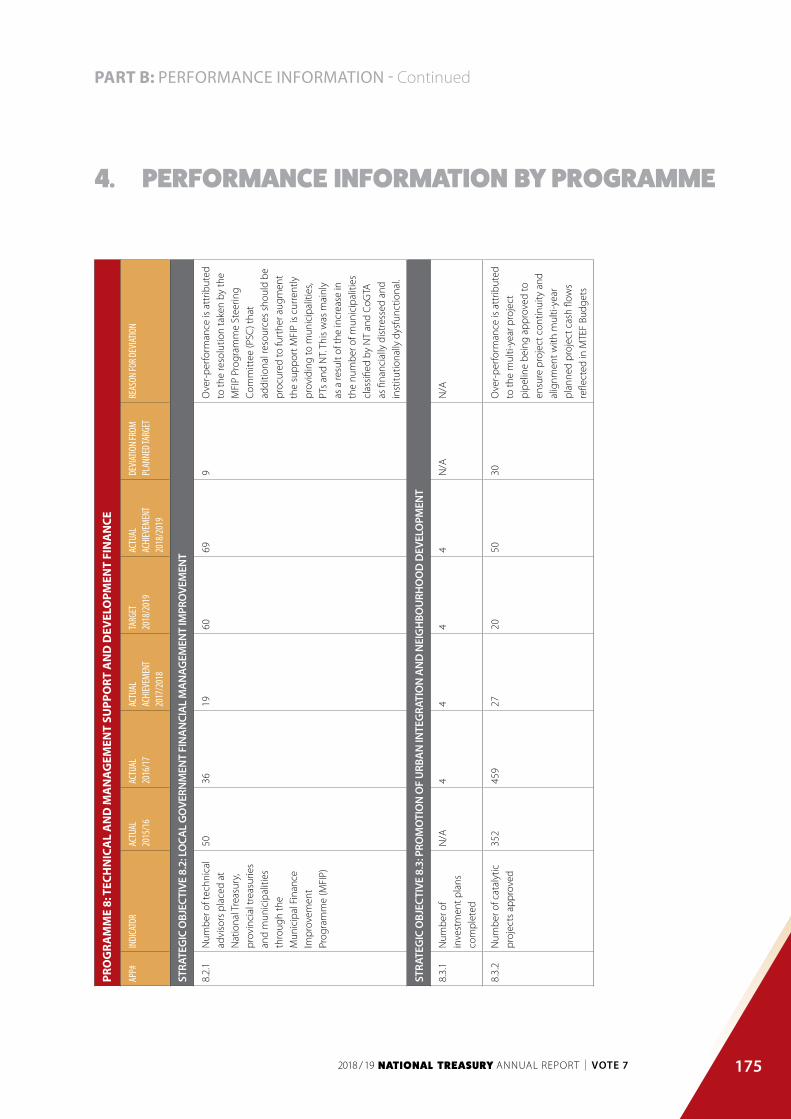
175
PART B: PERFORMANCE INFORMATION - Continued
4. PERFORMANCE INFORMATION BY PROGRAMME
PRO
GRA
MM
E 8:
TEC
HN
ICA
L A
ND
MA
NA
GEM
ENT
SUPP
ORT
AN
D D
EVEL
OPM
ENT
FIN
AN
CE
APP#
INDI
CATO
RAC
TUAL
2015
/16
ACTU
AL20
16/1
7AC
TUAL
AC
HIEV
EMEN
T 20
17/2
018
TARG
ET
2018
/201
9AC
TUAL
AC
HIEV
EMEN
T20
18/2
019
DEVI
ATIO
N FR
OM
PLAN
NED T
ARGE
TRE
ASON
FOR D
EVIAT
ION
STRA
TEG
IC O
BJEC
TIVE
8.2
: LO
CAL
GO
VERN
MEN
T FI
NA
NCI
AL
MA
NAG
EMEN
T IM
PRO
VEM
ENT
8.2.
1N
umbe
r of t
echn
ical
ad
viso
rs p
lace
d at
N
atio
nal T
reas
ury,
pr
ovin
cial
trea
surie
s an
d m
unic
ipal
ities
th
roug
h th
e M
unic
ipal
Fin
ance
Im
prov
emen
t Pr
ogra
mm
e (M
FIP)
5036
1960
699
Ove
r-pe
rfor
man
ce is
att
ribut
ed
to th
e re
solu
tion
take
n by
the
MFI
P Pr
ogra
mm
e St
eerin
g Co
mm
ittee
(PSC
) tha
t ad
ditio
nal r
esou
rces
sho
uld
be
proc
ured
to fu
rthe
r aug
men
t th
e su
ppor
t MFI
P is
cur
rent
ly
prov
idin
g to
mun
icip
aliti
es,
PTs
and
NT.
Thi
s w
as m
ainl
y as
a re
sult
of th
e in
crea
se in
th
e nu
mbe
r of m
unic
ipal
ities
cl
assi
fied
by N
T an
d Co
GTA
as
fina
ncia
lly d
istr
esse
d an
d in
stitu
tiona
lly d
ysfu
nctio
nal.
STRA
TEG
IC O
BJEC
TIVE
8.3
: PRO
MO
TIO
N O
F U
RBA
N IN
TEG
RATI
ON
AN
D N
EIG
HBO
URH
OO
D D
EVEL
OPM
ENT
8.3.
1N
umbe
r of
inve
stm
ent p
lans
co
mpl
eted
N/A
44
44
N/A
N/A
8.3.
2N
umbe
r of c
atal
ytic
pr
ojec
ts a
ppro
ved
352
459
2720
5030
Ove
r-pe
rfor
man
ce is
att
ribut
ed
to th
e m
ulti-
year
pro
ject
pi
pelin
e be
ing
appr
oved
to
ensu
re p
roje
ct c
ontin
uity
and
al
ignm
ent w
ith m
ulti-
year
pl
anne
d pr
ojec
t cas
h flo
ws
refle
cted
in M
TEF
Budg
ets

176
PART B: PERFORMANCE INFORMATION - Continued
4. PERFORMANCE INFORMATION BY PROGRAMME
PRO
GRA
MM
E 8:
TEC
HN
ICA
L A
ND
MA
NA
GEM
ENT
SUPP
ORT
AN
D D
EVEL
OPM
ENT
FIN
AN
CE
APP#
INDI
CATO
RAC
TUAL
2015
/16
ACTU
AL20
16/1
7AC
TUAL
AC
HIEV
EMEN
T 20
17/2
018
TARG
ET
2018
/201
9AC
TUAL
AC
HIEV
EMEN
T20
18/2
019
DEVI
ATIO
N FR
OM
PLAN
NED T
ARGE
TRE
ASON
FOR D
EVIAT
ION
8.3.
3N
umbe
r of
prog
ram
mes
in
Inte
grat
ion
Zone
s id
entifi
ed fo
rpl
anni
ng
3012
1212
12N
/AN
/A
8.3.
4N
umbe
r of
prog
ram
mes
in
Inte
grat
ion
Zone
s un
der
impl
emen
tatio
n
138
1010
10N
/AN
/A
STRA
TEG
IC O
BJEC
TIVE
8.4
: FAC
ILIT
ATIO
N O
F EM
PLO
YMEN
T CR
EATI
ON
AN
D IN
CLU
SIVE
GRO
WTH
8.4.
1N
umbe
r of J
obs
Fund
pr
ojec
ts a
ppro
ved
(cum
ulat
ive
acro
ss
the
term
of p
roje
ct)
107
125
127
150
127
23U
nder
-per
form
ance
is
attr
ibut
ed to
pro
ject
s th
at
with
drew
prio
r to
cont
ract
ing
afte
r app
rova
l by
the
Jobs
Fun
d In
vest
men
t Com
mitt
ee.
8.4.
2G
rant
fund
ing
appr
oved
(cum
ulat
ive
acro
ss th
e te
rm o
f pr
ojec
t)
R5 4
99m
R6 5
08m
R6 8
02m
R7 8
80m
R6 6
84m
R1 1
96m
Und
er-p
erfo
rman
ce is
at
trib
uted
to th
e w
ithdr
awal
of
pro
ject
s. G
rant
am
ount
ap
prov
ed is
rem
oved
onc
e a
proj
ect i
s w
ithdr
awn.
8.4.
3M
atch
ed fu
ndin
g co
mm
itted
(c
umul
ativ
e ac
ross
th
e te
rm o
f pro
ject
)
R6 4
42m
R9 0
99m
R9 7
02m
R7 8
80m
R9 4
73m
R1 5
93m
Ove
r-pe
rfor
man
ce is
att
ribut
ed
to th
e m
atch
ed fu
ndin
g ra
tio
bein
g gr
eate
r tha
n th
e re
quire
d 1:
1 w
ith p
roje
cts
com
mitt
ing
mor
e ow
n fu
ndin
g.
8.4.
4N
ew jo
bs c
ontr
acte
d (c
umul
ativ
e ac
ross
th
e te
rm o
f pro
ject
)
142
445
136
069
149
043
150
000
150
627
627
Ove
r-pe
rfor
man
ce is
att
ribut
ed
to p
roje
cts
cont
ract
ing
grea
ter
than
exp
ecte
d nu
mbe
r of n
ew
jobs
.

177
PART B: PERFORMANCE INFORMATION - Continued
4. PERFORMANCE INFORMATION BY PROGRAMME
PRO
GRA
MM
E 8:
TEC
HN
ICA
L A
ND
MA
NA
GEM
ENT
SUPP
ORT
AN
D D
EVEL
OPM
ENT
FIN
AN
CE
APP#
INDI
CATO
RAC
TUAL
2015
/16
ACTU
AL20
16/1
7AC
TUAL
AC
HIEV
EMEN
T 20
17/2
018
TARG
ET
2018
/201
9AC
TUAL
AC
HIEV
EMEN
T20
18/2
019
DEVI
ATIO
N FR
OM
PLAN
NED T
ARGE
TRE
ASON
FOR D
EVIAT
ION
8.4.
5N
umbe
r of
plac
emen
ts
cont
ract
ed
(cum
ulat
ive
acro
ss
the
term
of p
roje
ct)
77 3
1790
087
70 7
4410
5 00
075
718
29 2
82U
nder
-per
form
ance
is
attr
ibut
ed to
the
with
draw
al o
f pr
ojec
ts re
sulti
ng in
redu
ctio
n in
the
num
ber o
f pla
cem
ents
by
pro
ject
s.
8.4.
6N
umbe
r of t
rain
ing
oppo
rtun
ities
co
ntra
cted
(c
umul
ativ
e ac
ross
th
e te
rm o
f pro
ject
)
229
321
224
089
241
356
240
000
249
615
9 61
5O
ver-
perf
orm
ance
is a
ttrib
uted
to
a g
reat
er n
umbe
r of t
rain
ing
oppo
rtun
ities
hav
ing
been
co
ntra
cted
than
exp
ecte
d.
8.4.
7Va
lue
of g
rant
fu
ndin
g di
sbur
sed
(cum
ulat
ive
acro
ss
the
term
of p
roje
ct)
R 2
890m
R3 7
34m
R4 3
61m
R5 0
15m
R4 6
24m
R391
mU
nder
-per
form
ance
is
attr
ibut
ed to
a n
umbe
r of
fact
ors
that
incl
udes
pro
ject
w
ithdr
awal
s, te
rmin
atio
ns,
over
estim
atio
n of
cas
h flo
w
fore
cast
s pr
ovid
ed b
y pr
ojec
ts,
outp
ut b
ased
dis
burs
emen
t, sl
ow e
cono
mic
gro
wth
and
dr
ough
t.
8.4.
8N
umbe
r of J
obs
Fund
ev
alua
tion
repo
rts
and
diss
emin
atio
n of
le
arni
ng c
ondu
cted
N/A
Mid
-ter
m
eval
uatio
nRe
port
1 le
arni
ng e
vent
Port
folio
of
eval
uatio
ns
cons
istin
g of
2
eval
uatio
ns
com
plet
ed
1 le
arni
ng e
vent
2 pr
ojec
t ev
alua
tion
repo
rts
2 pr
ojec
t ev
alua
tion
repo
rts
N/A
N/A
1 le
arni
ng e
vent
1 le
arni
ng e
vent
N/A
STRA
TEG
IC O
BJEC
TIVE
8.5
: IM
PRO
VED
INFR
AST
RUCT
URE
PLA
NN
ING
, MA
NAG
EMEN
T A
ND
SKI
LLS
DEV
ELO
PMEN
T
8.5.
1Pe
rcen
tage
resp
onse
to
pro
cure
app
rove
d Pr
ofes
sion
al S
ervi
ce
Prov
ider
s to
ass
ist
with
inst
itutio
nalis
ing
the
IDM
S
N/A
N/A
100%
100%
100%
N/A
No
requ
ests
rece
ived
in th
is
repo
rtin
g pe
riod.

178
PART B: PERFORMANCE INFORMATION - Continued
4. PERFORMANCE INFORMATION BY PROGRAMME
PRO
GRA
MM
E 8:
TEC
HN
ICA
L A
ND
MA
NA
GEM
ENT
SUPP
ORT
AN
D D
EVEL
OPM
ENT
FIN
AN
CE
APP#
INDI
CATO
RAC
TUAL
2015
/16
ACTU
AL20
16/1
7AC
TUAL
AC
HIEV
EMEN
T 20
17/2
018
TARG
ET
2018
/201
9AC
TUAL
AC
HIEV
EMEN
T20
18/2
019
DEVI
ATIO
N FR
OM
PLAN
NED T
ARGE
TRE
ASON
FOR D
EVIAT
ION
8.5.
2N
umbe
r of o
ffici
als
trai
ned
on th
e in
frast
ruct
ure
deliv
ery
man
agem
ent s
yste
m
initi
ativ
es
183
1 79
316
3650
071
621
6O
ver-
perf
orm
ance
is a
ttrib
uted
to
a g
reat
er d
eman
d fo
r w
orks
hops
than
ant
icip
ated
.
8.5.
3N
umbe
r of
grad
uate
s in
trai
ning
fo
r pro
fess
iona
l re
gist
ratio
n
435
grad
uate
s in
trai
ning
, w
ith a
tota
l of
124
ha
ving
succ
essf
ully
com
plet
ed
trai
ning
and
63 h
ave
been
em
ploy
ed in
th
e se
ctor
.
439
425
500
378
122
Und
er-p
erfo
rman
ce is
at
trib
uted
to n
ewly
on-
boar
ded
mun
icip
aliti
es ta
king
long
er
than
ant
icip
ated
to re
crui
t gr
adua
tes.
8.5.
4N
umbe
r of c
apac
ity
impr
ovem
ent
initi
ativ
es u
nder
take
n to
sup
port
in
frast
ruct
ure
deliv
ery
N/A
N/A
247
2316
Ove
r-pe
rfor
man
ce is
att
ribut
ed
to a
gre
ater
dem
and
for
capa
city
impr
ovem
ent
initi
ativ
es th
an a
ntic
ipat
ed.

179
PART B: PERFORMANCE INFORMATION - Continued
4. PERFORMANCE INFORMATION BY PROGRAMME
STRATEGY TO OVERCOME AREAS OF UNDERPERFORMANCE(INDICATORS AND ACTION PLANS)
UNDER-PERFORMING INDICATORS AND ACTION PLANS
PROGRAMME 8: TECHNICAL AND MANAGEMENT SUPPORT AND DEVELOPMENT FINANCE
APP# Indicator Deviation Action Plan
FACILITATION OF EMPLOYMENT CREATION AND INCLUSIVE GROWTH
8.4.1 Number of Jobs Fund projects
approved (cumulative across the
term of project)
Under-performance is attributed
to projects that withdrew prior to
contracting after approval by the
Jobs Fund Investment Committee.
The 8th funding round assessments
will be finalised early 2019/20 and
this will yield additional projects.
8.4.2 Grant funding approved (cumulative
across the term of project)
Under-performance is attributed to
the withdrawal of projects. Grant
amount approved is removed once a
project is withdrawn.
The finalisation of the 8th funding
round in early 2019/20 will result
in the approval of additional grant
funding being approved.
8.4.5 Number of placements contracted
(cumulative across the term of
project)
Under-performance is attributed to
the withdrawal of projects resulting
in reduction in the number of
placements by projects.
The finalisation of the 8th funding
round in early 2019/20 will yield
additional placements once the
contracts for the projects have been
finalised.
8.4.7 Value of grant funding disbursed
(cumulative across the term of
project)
Under-performance is attributed to
a number of factors that includes
project withdrawals, terminations,
overestimation of cash flow forecasts
provided by projects, output based
disbursement, slow economic
growth and drought.
The finalisation of the 8th funding
round in early 2019/20 will lead to an
increase in grant disbursements once
the contracts for the projects have
been finalised and implementation
of new projects commences.
IMPROVED INFRASTRUCTURE PLANNING, MANAGEMENT AND SKILLS DEVELOPMENT
8.5.3 Number of graduates in training for
professional registration
Under-performance is attributed to
newly on-boarded municipalities
taking longer than anticipated to
recruit graduates.
The Municipalities are monitored
through an action log to recruit
additional graduates early to meet
ISDG targets.
CHANGES TO PLANNED TARGETSThere are no changes to planned targets for this reporting period.

180
PART B: PERFORMANCE INFORMATION - Continued
4. PERFORMANCE INFORMATION BY PROGRAMME
LIN
KIN
G P
ERFO
RMA
NCE
WIT
H B
UD
GET
S
PRO
GRA
MM
E 8:
TEC
HN
ICA
L A
ND
MA
NA
GEM
ENT
SUPP
ORT
A
ND
DEV
ELO
PMEN
T FI
NA
NCE
2018
/19
2017
/18
FIN
AL
APPR
OPR
IATI
ON
ACTU
ALEX
PEN
DIT
URE
(OVE
R)/U
ND
ER
EXPE
ND
ITU
REFI
NAL
AP
PRO
PRIA
TIO
NAC
TUAL
EXPE
ND
ITU
RE(O
VER)
/UN
DER
EX
PEN
DIT
URE
R’00
0R’
000
R’00
0R’
000
R’00
0R’
000
LOC
AL
GO
VERN
MEN
T FI
NA
NC
IAL
MA
NA
GEM
ENT
SUPP
ORT
645
481
645
481
-62
7 76
262
7 76
2-
URB
AN
DEV
ELO
PMEN
T A
ND
SUPP
ORT
924
829
910
853
13 9
7698
3 25
397
2 91
710
336
EMPL
OYM
ENT
CRE
ATIO
N
FAC
ILIT
ATIO
N
603
237
330
597
272
640
609
990
593
058
16 9
32
GO
VERN
MEN
T TE
CH
NIC
AL
AD
VISO
RY C
ENTR
E
71 8
5871
858
-80
818
80 8
18-
INFR
AST
RUC
TURE
DEV
ELO
PMEN
T
SUPP
ORT
681
374
276
278
405
096
256
690
251
795
4 89
5
TO
TAL
2 92
6 77
92
235
067
691
712
2 55
8 51
32
526
350
32 1
63

181
PART B: PERFORMANCE INFORMATION - Continued
5. TRANSFER PAYMENTS
5.1.
TRA
NSF
ER P
AYM
ENTS
TO
PU
BLIC
EN
TITI
ES
The
tabl
e be
low
refle
cts
the
tran
sfer
pay
men
ts m
ade
for t
he p
erio
d 1
Apr
il 20
18 to
31
Mar
ch 2
019
NA
ME
OF
PUBL
IC E
NTI
TYSE
RVIC
ES R
END
ERED
BY
THE
PUBL
IC E
NTI
TYA
MO
UN
T TR
AN
SFER
RED
TO
TH
E PU
BLIC
EN
TITY
(R’0
00)
AM
OU
NT
SPEN
T BY
TH
E PU
BLIC
EN
TITY
(R
’000
)
ACH
IEV
EMEN
TS O
F TH
E PU
BLIC
EN
TITY
1.
Acc
ount
ing
Stan
dard
s Bo
ard
Det
erm
ine
stan
dard
s of
Gen
eral
ly
Reco
gnis
ed A
ccou
ntin
g Pr
actic
e
14 0
54
14 0
54
Refe
r to
Gen
eral
Info
rmat
ion
Publ
ic
Entit
ies
repo
rtin
g to
Min
iste
r
2.
Co-o
pera
tive
Bank
s
Dev
elop
men
t Age
ncy
Regu
late
, pro
mot
e an
d de
velo
p
co-o
pera
tive
bank
ing,
incl
udin
g
depo
sit-
taki
ng a
nd le
ndin
g to
co-
oper
ativ
es
19 8
8319
883
Refe
r to
Gen
eral
Info
rmat
ion
Publ
ic
Entit
ies
repo
rtin
g to
Min
iste
r
3.
Fina
ncia
l and
Fis
cal
Com
mis
sion
Ass
ist a
nd m
aint
ain
the
bala
nce
betw
een
fisca
l dec
entr
alis
atio
n an
d
the
unita
ry s
tate
51 7
8251
782
Refe
r to
Gen
eral
Info
rmat
ion
Publ
ic
Entit
ies
repo
rtin
g to
Min
iste
r
4.
Fina
ncia
l Int
ellig
ence
Cen
tre
Ass
ist i
n th
e id
entifi
catio
n of
unla
wfu
l act
iviti
es a
nd c
omba
ting
of m
oney
laun
derin
g ac
tiviti
es,
finan
cing
of t
erro
rism
and
rela
ted
activ
ities
278
716
278
716
Refe
r to
Gen
eral
Info
rmat
ion
Publ
ic
Entit
ies
repo
rtin
g to
Min
iste
r

182
PART B: PERFORMANCE INFORMATION - ContinuedN
AM
E O
F PU
BLIC
EN
TITY
SERV
ICES
REN
DER
ED B
Y TH
E PU
BLIC
EN
TITY
AM
OU
NT
TRA
NSF
ERRE
D
TO T
HE
PUBL
IC
ENTI
TY (R
’000
)
AM
OU
NT
SPEN
T BY
TH
E PU
BLIC
EN
TITY
(R
’000
)
ACH
IEV
EMEN
TS O
F TH
E PU
BLIC
EN
TITY
5.
Gov
ernm
ent T
echn
ical
Adv
isor
y Ce
ntre
Supp
ort p
ublic
fina
nce
man
agem
ent t
hrou
gh p
rofe
ssio
nal
advi
sory
ser
vice
s, pr
ogra
mm
e
and
proj
ect m
anag
emen
t and
tran
sact
ion
supp
ort
71 8
5871
858
Refe
r to
Gen
eral
Info
rmat
ion
Publ
ic
Entit
ies
repo
rtin
g to
Min
iste
r
6.
Inde
pend
ent R
egul
ator
y Bo
ard
for A
udito
rs
Regi
stra
tion
of a
udito
rs a
nd th
e
regu
latio
n of
trai
ning
of p
ublic
acco
unta
nts
and
audi
tors
40 8
7440
874
Refe
r to
Gen
eral
Info
rmat
ion
Publ
ic
Entit
ies
repo
rtin
g to
Min
iste
r
7.
Sout
h A
frica
n Re
venu
e
Serv
ice*
Effici
ent a
nd e
ffect
ive
colle
ctio
n of
reve
nue
9 00
7 21
79
007
217
Refe
r to
Gen
eral
Info
rmat
ion
Publ
ic
Entit
ies
repo
rtin
g to
Min
iste
r
*Offi
ce o
f the
Tax O
mbu
d (O
TO) r
ecei
ve tr
ansf
ers t
hrou
gh S
ARS
5. TRANSFER PAYMENTS
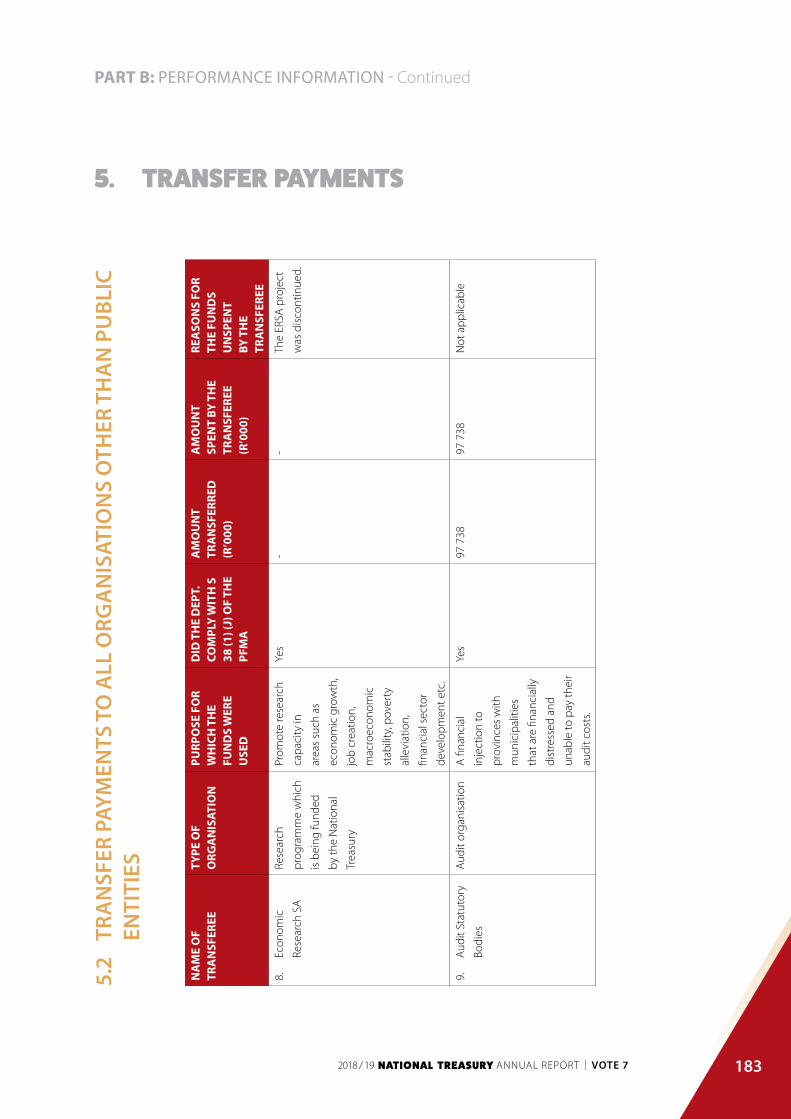
183
PART B: PERFORMANCE INFORMATION - Continued
5.2
TRA
NSF
ER P
AYM
ENTS
TO
ALL
ORG
AN
ISAT
ION
S O
THER
TH
AN
PU
BLIC
EN
TITI
ES
NA
ME
OF
TRA
NSF
EREE
TYPE
OF
ORG
AN
ISAT
ION
PURP
OSE
FO
R W
HIC
H T
HE
FUN
DS
WER
E U
SED
DID
TH
E D
EPT.
CO
MPL
Y W
ITH
S
38 (1
) (J)
OF
THE
PFM
A
AM
OU
NT
TRA
NSF
ERRE
D
(R’0
00)
AM
OU
NT
SPEN
T BY
TH
E TR
AN
SFER
EE
(R’0
00)
REA
SON
S FO
R TH
E FU
ND
S U
NSP
ENT
BY T
HE
TRA
NSF
EREE
8.
Econ
omic
Rese
arch
SA
Rese
arch
prog
ram
me
whi
ch
is b
eing
fund
ed
by th
e N
atio
nal
Trea
sury
Prom
ote
rese
arch
capa
city
in
area
s su
ch a
s
econ
omic
gro
wth
,
job
crea
tion,
mac
roec
onom
ic
stab
ility
, pov
erty
alle
viat
ion,
finan
cial
sec
tor
deve
lopm
ent e
tc.
Yes
--
The
ERSA
pro
ject
was
dis
cont
inue
d.
9.
Aud
it St
atut
ory
Bodi
es
Aud
it or
gani
satio
nA
fina
ncia
l
inje
ctio
n to
prov
ince
s w
ith
mun
icip
aliti
es
that
are
fina
ncia
lly
dist
ress
ed a
nd
unab
le to
pay
thei
r
audi
t cos
ts.
Yes
97 7
3897
738
Not
app
licab
le
5. TRANSFER PAYMENTS

184
PART B: PERFORMANCE INFORMATION - ContinuedN
AM
E O
F TR
AN
SFER
EETY
PE O
F O
RGA
NIS
ATIO
NPU
RPO
SE F
OR
WH
ICH
TH
E FU
ND
S W
ERE
USE
D
DID
TH
E D
EPT.
CO
MPL
Y W
ITH
S
38 (1
) (J)
OF
THE
PFM
A
AM
OU
NT
TRA
NSF
ERRE
D
(R’0
00)
AM
OU
NT
SPEN
T BY
TH
E TR
AN
SFER
EE
(R’0
00)
REA
SON
S FO
R TH
E FU
ND
S U
NSP
ENT
BY T
HE
TRA
NSF
EREE
10.
Afri
can
Regi
onal
Tech
nica
l
Ass
ista
nce
Cent
re
Fore
ign
and
Inte
rnat
iona
l
orga
nisa
tion
Prov
idin
g te
chni
cal
assi
stan
ce a
nd
coop
erat
ion
in c
ore
mac
roec
onom
ic
and
finan
cial
man
agem
ent.
Yes
1 07
41
074
Not
app
licab
le
11.
Afri
can
Risk
Capa
city
Fore
ign
and
Inte
rnat
iona
l
orga
nisa
tion
To a
ncho
r
the
Bank
’s
enga
gem
ents
with
Sou
th A
frica
and
mai
ntai
n
com
plim
enta
ry
linka
ges
with
deve
lopm
ent
inst
itutio
ns.
No
--
The
annu
al
mem
bers
hip
whi
ch c
ould
not
be tr
ansf
erre
d
as th
e co
ncep
t
to fo
r Sou
th
Afri
ca to
hav
e
a m
embe
rshi
p
with
ARC
is b
eing
plac
ed o
n ho
ld
until
furt
her
notic
e.
12.
Colla
bora
tive
Afri
can
Budg
et
Refo
rm In
itiat
ive
Fore
ign
and
Inte
rnat
iona
l
orga
nisa
tion
To p
rovi
de c
apac
ity
build
ing
in A
frica
’s
finan
cial
sec
tor
man
agem
ent,
budg
et re
form
and
gove
rnan
ce
thro
ugh
SA’s
cont
ribut
ion.
Yes
2 56
52
565
Not
app
licab
le
5. TRANSFER PAYMENTS

185
PART B: PERFORMANCE INFORMATION - ContinuedN
AM
E O
F TR
AN
SFER
EETY
PE O
F O
RGA
NIS
ATIO
NPU
RPO
SE F
OR
WH
ICH
TH
E FU
ND
S W
ERE
USE
D
DID
TH
E D
EPT.
CO
MPL
Y W
ITH
S
38 (1
) (J)
OF
THE
PFM
A
AM
OU
NT
TRA
NSF
ERRE
D
(R’0
00)
AM
OU
NT
SPEN
T BY
TH
E TR
AN
SFER
EE
(R’0
00)
REA
SON
S FO
R TH
E FU
ND
S U
NSP
ENT
BY T
HE
TRA
NSF
EREE
13.
Com
mon
Mon
etar
y A
rea
Com
pens
atio
n
(CM
A)
Fore
ign
and
Inte
rnat
iona
l
orga
nisa
tion
To c
ompe
nsat
e
the
cont
ract
ing
part
ies
of th
e M
MA
for t
he a
mou
nt o
f
rand
cur
renc
y in
circ
ulat
ion.
Yes
997
833
997
833
Not
app
licab
le
14.
Inst
itute
for
Dev
elop
men
t
and
Econ
omic
Plan
ning
(ID
EP)
Fore
ign
and
Inte
rnat
iona
l
orga
nisa
tion
For i
mpr
ovin
g
publ
ic s
ecto
r
man
agem
ent
and
deve
lopm
ent
plan
ning
in
supp
ort o
f
mem
ber S
tate
s’
stru
ctur
al
tran
sfor
mat
ion.
Yes
1 11
21
112
Not
app
licab
le
15.
Empl
oym
ent
Cre
atio
n
Faci
litat
ion
Fund
Empl
oym
ent
crea
tion
and
rese
arch
orga
nisa
tion
on
beha
lf of
Nat
iona
l
Trea
sury
To s
uppo
rt
inno
vativ
e
part
ners
hip-
base
d ap
proa
ches
to s
usta
inab
le
empl
oym
ent
crea
tion
and
rese
arch
into
empl
oym
ent,
inco
me
dist
ribut
ion
and
incl
usiv
e gr
owth
.
Yes
305
000
305
000
Not
app
licab
le
5. TRANSFER PAYMENTS

186
PART B: PERFORMANCE INFORMATION - ContinuedN
AM
E O
F TR
AN
SFER
EETY
PE O
F O
RGA
NIS
ATIO
NPU
RPO
SE F
OR
WH
ICH
TH
E FU
ND
S W
ERE
USE
D
DID
TH
E D
EPT.
CO
MPL
Y W
ITH
S
38 (1
) (J)
OF
THE
PFM
A
AM
OU
NT
TRA
NSF
ERRE
D
(R’0
00)
AM
OU
NT
SPEN
T BY
TH
E TR
AN
SFER
EE
(R’0
00)
REA
SON
S FO
R TH
E FU
ND
S U
NSP
ENT
BY T
HE
TRA
NSF
EREE
15.
Afri
can
Dev
elop
men
t
Bank
& F
und
(AfD
B)
Fore
ign
and
Inte
rnat
iona
l
orga
nisa
tion
To p
rovi
de fi
nanc
ial
and
capa
city
build
ing
supp
ort
to lo
w in
com
e
coun
trie
s th
at
are
mem
bers
of
the
AfD
B an
d
the
Wor
ld B
ank,
resp
ectiv
ely.
Yes
82 4
3182
431
Not
app
licab
le
16.
Wor
ld B
ank
Fore
ign
and
Inte
rnat
iona
l
orga
nisa
tion
To p
rovi
de
conc
essi
onal
loan
s
and
gran
ts to
low
inco
me
coun
trie
s.
Yes
53 5
9053
590
Not
app
licab
le
17.
Com
mon
wea
lth
Fund
for
Tech
nica
l
Coop
erat
ion
Fore
ign
and
Inte
rnat
iona
l
orga
nisa
tion
To p
rovi
de s
uppo
rt
for c
omm
on
secr
etar
ial g
oals
and
prog
ram
mes
on a
nnua
l bas
is.
Yes
5 81
65
816
Not
app
licab
le
5. TRANSFER PAYMENTS

187
PART B: PERFORMANCE INFORMATION - Continued
5. TRANSFER PAYMENTS
NA
ME
OF
TRA
NSF
EREE
TYPE
OF
ORG
AN
ISAT
ION
PURP
OSE
FO
R W
HIC
H T
HE
FUN
DS
WER
E U
SED
DID
TH
E D
EPT.
CO
MPL
Y W
ITH
S
38 (1
) (J)
OF
THE
PFM
A
AM
OU
NT
TRA
NSF
ERRE
D
(R’0
00)
AM
OU
NT
SPEN
T BY
TH
E TR
AN
SFER
EE
(R’0
00)
REA
SON
S FO
R TH
E FU
ND
S U
NSP
ENT
BY T
HE
TRA
NSF
EREE
18.
Inte
rnat
iona
l
Fina
nce
Faci
lity
for
Imm
unis
atio
n
(IFFI
)
Fore
ign
and
Inte
rnat
iona
l
orga
nisa
tion
To s
uppo
rt h
ealth
care
, par
ticul
arly
the
prov
isio
n
of v
acci
nes
to re
duce
the
num
ber o
f vac
cine
prev
enta
ble
deat
hs
amon
g ch
ildre
n
in lo
w in
com
e
coun
trie
s.
Yes
13 5
5013
550
Not
app
licab
le
Tran
sfer
pay
men
ts w
ere
mad
e in
resp
ect o
f all t
rans
fer p
aym
ents
bud
gete
d fo
r.

188
PART B: PERFORMANCE INFORMATION - Continued
6. CONDITIONAL GRANTS
6.1 CONDITIONAL GRANTS AND EARMARKED FUNDS PAID
The table below describes each of the conditional grants and earmarked funds paid by the department.
CONDITIONAL GRANT 1: INTEGRATED CITY DEVELOPMENT GRANT
DEPARTMENT WHO TRANSFERRED THE GRANT: NATIONAL TREASURY
Purpose of the grant To provide a financial incentive for metropolitan municipalities to achieve a more compact,
liveable inclusive, productive and sustainable urban spatial form.
Expected outputs of the grant
Metropolitan municipalities are to use the grant to conduct:
Authorised studies/strategies.
Infrastructure projects; acquire land and implement projects in identified integration zones.
Implement planned catalytic/strategic projects within identified integration zones.
Actual outputs achieved The grant allocation supported metropolitan municipalities towards integrated planning, spatial
targeting, project pipelining and implementation of projects funded by different infrastructure
grants in 34 identified integration zones. Overall the grant supported the realisation of national
priorities, namely outcomes six, eight and nine.
Amount per amended DoRA
R293 609 million
Amount received R293 609 million
Reasons if amount as per DoRA not received
Not applicable.
Amount spent by the Department/ municipality
R293 609 million was transferred to eight metropolitan municipalities.
Reasons for the funds unspent by the entity
Not applicable. The Integrated City Development Grant is a supplementary grant for various
municipal infrastructure grants.
Reasons for deviations on performance
Not applicable.
Measures taken to improve performance
Not applicable.
Monitoring mechanism by the receiving Department
Municipalities report on the grant expenditure through Section 71. Municipalities also report on
their financial and non-financial performance by submitting annual evaluation.

189
PART B: PERFORMANCE INFORMATION - Continued
CONDITIONAL GRANT 2: INFRASTRUCTURE SKILLS DEVELOPMENT GRANT
DEPARTMENT WHO TRANSFERRED THE GRANT: NATIONAL TREASURY
Purpose of the grant To recruit unemployed graduates into municipalities to be trained and professionally registered
as per the requirements of the relevant statutory councils within the built environment.
Expected outputs of the grant
Number of built environment graduates registered as candidates for training and professional
development as per requirements of the relevant statutory councils.
Number of graduates recognised as registered professionals by the relevant statutory councils.
Number of graduates employed as registered professionals within the built environment in local
government.
Actual outputs achieved In quarter three, 378 graduates were still receiving training in the programme, of which 241 have
successfully completed training and are registered as professionals, and 114 are permanently
employed within municipalities and across other sectors.
Amount per amended DoRA
R141. 492 million
Amount received R141. 492 million
Reasons if amount as per DoRA not received
Not applicable.
Amount spent by the Department/ municipality
R141. 492 million was transferred to ISDG participating municipalities.
Reasons for the funds unspent by the entity
Municipalities spent R104. 047 million out of R141. 492 million.
Spending was affected by slow recruitment in some municipalities.
Reasons for deviations on performance
Not applicable.
Measures taken to improve performance
Not applicable.
Monitoring mechanism by the receiving Department
Municipalities submit monthly, quarterly and annual reports reflecting their financial and non-
financial performance.
The National Treasury conducts site visits to verify training and graduates recruited.
6. CONDITIONAL GRANTS

190
PART B: PERFORMANCE INFORMATION - Continued
CONDITIONAL GRANT 3: NEIGHBOURHOOD DEVELOPMENT PARTNERSHIP GRANT
DEPARTMENT WHO TRANSFERRED THE GRANT: NATIONAL TREASURY
Purpose of the grant To provide spatially targeted capital funding of intergovernmental project pipelines, supporting
and facilitating economic development opportunities in previously disadvantaged areas.
Expected outputs of the grant
20 targeted infrastructure projects.
Actual outputs achieved 30 targeted infrastructure projects delivered at municipal year-end.
Amount per amended DORA Schedule 5B: R581.867 million, Schedule 6B: R49.353 million.
Amount received (R’000) Schedule 5B: R581.867 million; Schedule 6B R49.353 million.
Reasons if amount as per DoRA not received
The full DoRA amount was received.
Amount spent by the Department/ municipality
For Schedule 5B, R569.117 million was transferred to municipalities, and for Schedule 6B, R48.127
million was paid to service providers appointed by the municipalities.
Reasons for the funds unspent by the entity
For Schedule 5B, R7.250 million for Buffalo City municipality and R3.500 million for the City of
Tshwane was not transferred because the actual spend of the funds previously transferred was
not reported by the municipalities; R2 million was not transferred to Newcastle municipality
because its application for unspent funds for 2017/18 was approved and not yet fully spent.
For Schedule 6B, R1.225 million was not paid to municipal service providers because of delayed
invoice submissions before the end of the financial year.
Reasons for deviations on performance
Over-performance on the Baseline Management Process based on cash flows and associated
timelines, including support alignment attributed to the multi-year project pipeline being
approved to ensure project continuity and alignment with multi-year planned project cash flows
reflected in MTEF Budgets.
Measures taken to improve performance
Application of the Baseline Management Process based on cash flows and associated timelines,
including support for alignment.
Monitoring mechanism by the receiving Department
Actual spend measured against Baseline Management Cash flows.
6. CONDITIONAL GRANTS
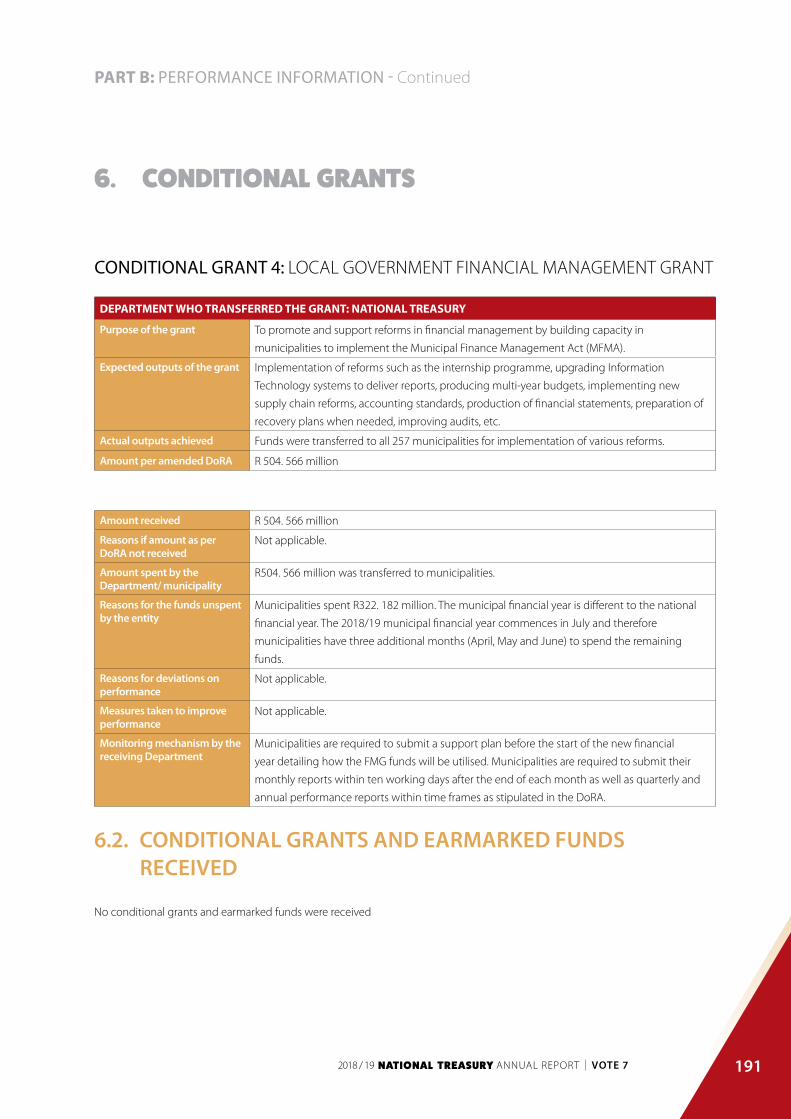
191
PART B: PERFORMANCE INFORMATION - Continued
CONDITIONAL GRANT 4: LOCAL GOVERNMENT FINANCIAL MANAGEMENT GRANT
DEPARTMENT WHO TRANSFERRED THE GRANT: NATIONAL TREASURY
Purpose of the grant To promote and support reforms in financial management by building capacity in
municipalities to implement the Municipal Finance Management Act (MFMA).
Expected outputs of the grant Implementation of reforms such as the internship programme, upgrading Information
Technology systems to deliver reports, producing multi-year budgets, implementing new
supply chain reforms, accounting standards, production of financial statements, preparation of
recovery plans when needed, improving audits, etc.
Actual outputs achieved Funds were transferred to all 257 municipalities for implementation of various reforms.
Amount per amended DoRA R 504. 566 million
Amount received R 504. 566 million
Reasons if amount as per DoRA not received
Not applicable.
Amount spent by the Department/ municipality
R504. 566 million was transferred to municipalities.
Reasons for the funds unspent by the entity
Municipalities spent R322. 182 million. The municipal financial year is different to the national
financial year. The 2018/19 municipal financial year commences in July and therefore
municipalities have three additional months (April, May and June) to spend the remaining
funds.
Reasons for deviations on performance
Not applicable.
Measures taken to improve performance
Not applicable.
Monitoring mechanism by the receiving Department
Municipalities are required to submit a support plan before the start of the new financial
year detailing how the FMG funds will be utilised. Municipalities are required to submit their
monthly reports within ten working days after the end of each month as well as quarterly and
annual performance reports within time frames as stipulated in the DoRA.
6.2. CONDITIONAL GRANTS AND EARMARKED FUNDS RECEIVED
No conditional grants and earmarked funds were received
6. CONDITIONAL GRANTS

192
PART B: PERFORMANCE INFORMATION - Continued
7. DONOR FUNDS
7.1. DONOR FUNDS RECEIVED
DONOR FUND: USAID TECHNICAL ASSISTANCE FACILITY (TAF)
Name of donor United States Agency for International Development (USAID)
Full amount of the funding
R 8 million
Period of the commitment
2016 - 2020
Purpose of the funding Design, implementation and ad hoc support towards development cooperation projects.
Expected outputs Technical assistance.
Actual outputs achieved Technical assistance provided.
Amount received in current period (R’000)
R6.1 million
Amount spent by the Department (R’000)
R3.1 million
Reasons for the funds unspent
Not applicable.
Monitoring mechanism by the donor
Not applicable.

193
PART B: PERFORMANCE INFORMATION - Continued
DONOR FUND: EUROPEAN UNION (EU)
Name of donor European Union (EU):
Capacity Building for Public Finance Management Programme in South Africa, also referred to as
Financial Management Improvement Programme III (FMIP III).
Full amount of the funding
€ 20 million
Period of the commitment
24 May 2012 – 24 May 2018, with an additional 6-month close-out phase ending 22 December 2018.
Purpose of the funding The programme aimed to develop public financial management capacity of national, provincial and
local government to contribute to improved financial performance of the government of South
Africa.
Expected outputs For the reporting period, the Programme Coordinating Unit (PCU) housed within the Office of
the Accountant-General: Capacity Building overseeing and managing the implementation of the
programme planned to:
• Support the 2018 PFM Conference.
• Coordinate the FMIP III close-out.
Undertake the FMIP III close-out and expenditure review.
Actual outputs achieved The FMIP III Programme came to its end during 2018/19, therefore the activities were geared towards
successful close-out and exit, namely:
• Hosted the May 2018 PFM Conference.
• Supported the Second Knowledge Management, Information, Learning and Innovation (KIMLI)
initiative.
• Coordinated the FMIP III close-out event with key stakeholders.
• Finalised the FMIP III close-out report and exit strategy of the technical assistance team.
• Undertook the independent expenditure review of the FMIP III Programme Estimate 6.
Amount received in current period (R’000)
R11 million through the Reconstruction and Development Programme (RDP) and R15 million in kind
contribution (paid for directly by the EU).
Amount spent by the Department (R’000)
R7.218 million
Reasons for the funds unspent
The PCU staff budgeted for could not be appointed, and therefore the operational costs were less
than anticipated.
Monitoring mechanism by the donor
The donor required:
• An independent expenditure review.
• FMIP III reports.
• Submissions at the NT Capacity Building Steering Committee.
7. DONOR FUNDS

194
PART B: PERFORMANCE INFORMATION - Continued
8. CAPITAL INVESTMENT
No capital investment was incurred during the 2018/19 financial year.

NATIONAL TREASURYANNUAL REPORT
PART C:GOVERNANCE

196
PART C: GOVERNANCE
1. INTRODUCTION
The National Treasury (NT) is committed to continuously strengthening compliance, managing risks and upholding good governance
within the governance, risk, and control environment. Good governance is fundamental to the management of public finances and
the assurance that the utilisation of NT resources is effective, efficient and realises optimum value for money. This, in turn, further
enables the NT to deliver on its mandate with an accessible, service-centred and solutions-oriented delivery approach.
The NT strives to achieve objectives and continuously drive improvement, as well as maintain legal and ethical standing with all
stakeholders including the wider community. The NT manages risks and uses resources responsibly and with accountability. Good
governance is achieved through both performance and conformance.
2. RISK MANAGEMENTNT enterprise-wide risk management incorporates two key functions, namely enterprise risk management and business continuity
management. Risk identification and assessments are performed at both Chief Directorate and divisional level. The resultant risk
registers and identified mitigation strategies are monitored every quarter.
The risks identified are aligned to both strategic objectives of the department and operational plans of Chief Directorates. From this
alignment, divisional strategic risk registers are developed from which the department’s top 20 strategic risks are compiled.
In the 2018/19 financial year, the NT improved its risk management maturity score and continued to re-engineer its processes
to further entrench the culture of risk management in the department. To this end, during the financial period the department
commenced reconfiguring its Risk Committee, previously chaired by an independent member, to a management-run Risk
Management Committee which has direct and frequent access to management and the Executive Committee.
Business continuity management also improved its maturity score and a fully-fledged disaster recovery site for the NT has been
established in Pietermaritzburg. Business continuity management in the NT received recognition of its implementation processes
when the business management function received a business continuity Africa award for best Africa Region Continuity and
Resilience Professional in the Public Sector for 2018.
A business continuity awareness campaign was conducted during the financial period to make all employees aware of the
importance of business continuity management.

197
PART C: GOVERNANCE - Continued
3. FRAUD AND CORRUPTION
The NT stance on fraud and corruption remains that of zero tolerance. The NT focuses on preventative procedures in its fight against
fraud and corruption. To this end all NT employees undergo a two-step process to ascertain their suitability for employment and
reduce the risk of fraud.
All new employees undergo an initial pre-employment suitability check, which is followed by a comprehensive vetting process once
the employee has been appointed. This process has already yielded results in identifying and dealing with employees who could
have potentially defrauded the department.
The NT runs a comprehensive annual anti-corruption awareness campaign which ensures that all employees of the department are
made aware of the internal and external impact of fraud and corruption.
4. MINIMISING CONFLICT OF INTERESTIn line with the 2016 Public Service Regulations, the NT supports the prohibition of employees doing business with any organs of
state, or of being a director of a public or private company conducting business with an organ of state. In 2016 a process was put in
place that required employees to either withdraw from such practices or to resign from the public service. Financial disclosures are
submitted electronically and have been rolled out to other levels of designated employees and middle management service (levels
11 and 12) as well as employees below level 11 in the supply chain and finance units.
These new measures assist the department in raising awareness of possible conflicts of interest for employees, and to avoid them.
The NT continues to raise awareness and to coach and guide employees on how to avoid conflicts of interest. Where such interests
are identified, employees are engaged and, where appropriate, standard disciplinary steps are taken in terms of the disciplinary code
and procedure of the Public Service.
5. CODE OF CONDUCTThe Code of Conduct outlines expectations regarding employees’ behaviour towards their colleagues, stakeholders, members of the
public, the legislature, and political and executive office bearers. The Code of Conduct is applicable to all NT employees. The NT is
committed to being exemplary at all times and in all respects, and for its work and conduct to be guided by the values outlined in
the Code of Conduct. The NT expects employees to be ethical, responsible and professional, and to fulfil their duties with integrity.
The NT builds a culture that encourages employees to think and behave ethically by providing training and awareness through
induction and employee relations capacity-building sessions. These sessions are conducted continuously to remind and reinforce
the ethical conduct of employees at all times. The NT will take disciplinary action in terms of the disciplinary code and procedure of
the Public Service against employees who repeatedly or intentionally fail to follow its Code of Conduct.
198
PART C: GOVERNANCE - Continued
6. HEALTH, SAFETY AND ENVIRONMENTAL ISSUES
The NT health and safety unit deals with occupational health and safety (OHS), and environmental issues. This unit reports to the
Director-General (DG) through the Health and Safety committee. The DG has assigned two employees at Deputy Director-General
level as emergency controllers.
All divisions in the various buildings occupied by the Department have trained firefighting and first aid emergency floor
representatives.
The NT has the necessary compliance certificates to provide reasonable assurance that employees will not be harmed due to OHS-
related issues. The NT performed a successful fire drill during the financial period and received a score of 98 per cent during the
physical security audit conducted by the South African Police Service.
The OHS unit performed periodical awareness sessions in all divisions during the period under review.

199
PART C: GOVERNANCE - Continued
7. PORTFOLIO COMMITTEES
Standing Committee on Appropriations (SCOA)
DATE OF MEETING MATTERS RAISED BY PARLIAMENTARY COMMITTEE HOW THE NATIONAL TREASURY HAS ADDR ESSED THESE MATTERS
27 February 2019 Public Works & Defence progress in moving infrastructure/
maintenance function on Defence
Matters addressed as presented at the
meeting and subsequent responses to
follow-up questions.
Records available from the committee
secretariat or on request from the NT.
21 February 2019 2019 Annual Budget Minister’s briefing to joint committees
13 February 2019 Deviations and expansions 2018/19 Q 2 and 3: Office of
Chief Procurement Officer
12 February 2019 National Treasury Q 2 & 3 performance; Jobs Fund update
27 November 2018 Committee report on 2018 MTBPS, Adjustments
Appropriation Bill and Special Appropriation Bill
23 November 2018 Adjustments Appropriation Bill: DBE hearing
22 November 2018 Adjustments Appropriation Bill: DW&S
21 November 2018 SAA on R5 billion Special Appropriation Bill
Adjustments Appropriation Bill: DoT motivation
12 November 2018 Division of Revenue Amendment Bill: committee report
adoption
17 October 2018 Statement on VBS Mutual Bank matter; VAT Panel report
and TLAB & TALAB Bills: Treasury and SARS response
8 November 2018 Division of Revenue Amendment Bill: NT briefing
7 November 2018 2018 MTBPS: HSRC briefing
6 November 2018 2018 MTBPS: PSC briefing
9 October 2018 Division of Revenue: FFC 2019-20 submission
14 September 2018 Land Bank and Agricultural Research Commission Q 1
briefing
4 September 2018 Defence facilities in Bloemfontein: Challenges
28 August 2018 Deviations and expansions: Office of Chief Procurement
Officer
21 August 2018 NT Q1: Deviations/expansions requests
22 May 2018 Committee Report on 2018 Appropriation Bill
16 May 2018 SAA latest quarterly report (meeting postponed)
11 May 2018 2018 Appropriation Bill: HSRC & DA
9 May 2018 2018 Appropriation Bill: PSC & BO
8 May 2018 2018 Appropriation Bill: FFC
4 May 2018 2018 Appropriation Bill: NT briefing
25 April 2018 SAA & SAA Post Office recapitalisation: progress
performance report
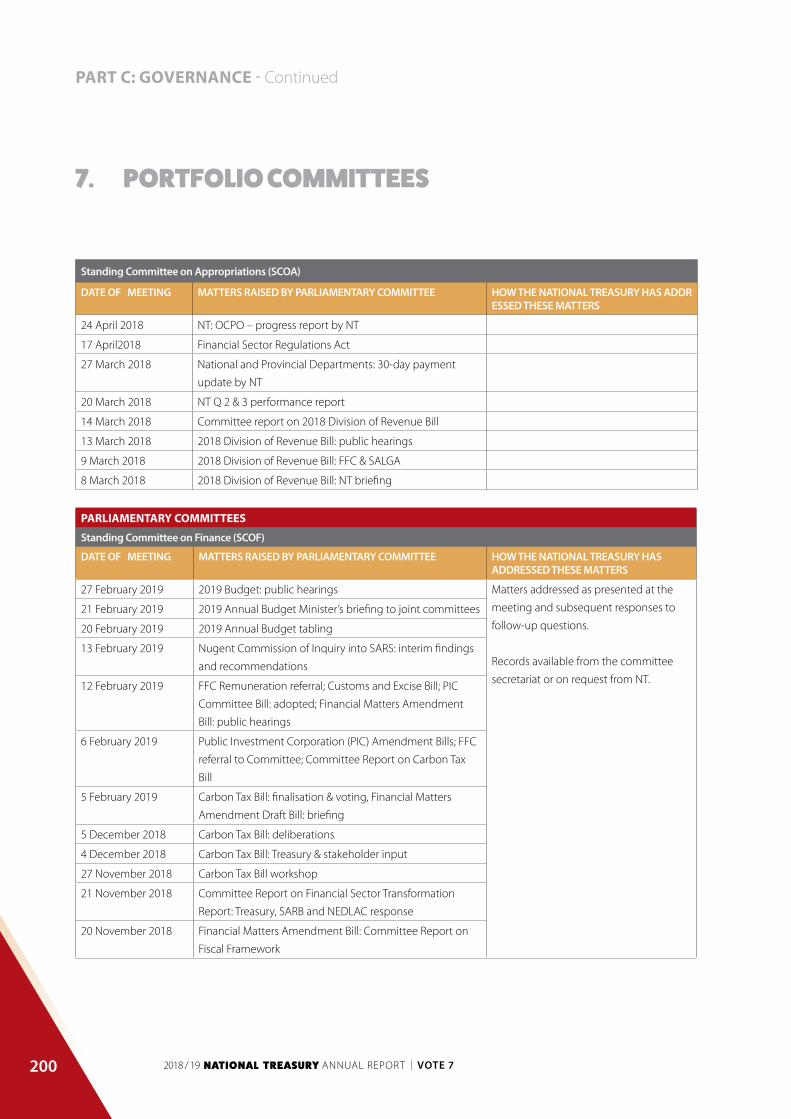
200
PART C: GOVERNANCE - Continued
Standing Committee on Appropriations (SCOA)
DATE OF MEETING MATTERS RAISED BY PARLIAMENTARY COMMITTEE HOW THE NATIONAL TREASURY HAS ADDR ESSED THESE MATTERS
24 April 2018 NT: OCPO – progress report by NT
17 April2018 Financial Sector Regulations Act
27 March 2018 National and Provincial Departments: 30-day payment
update by NT
20 March 2018 NT Q 2 & 3 performance report
14 March 2018 Committee report on 2018 Division of Revenue Bill
13 March 2018 2018 Division of Revenue Bill: public hearings
9 March 2018 2018 Division of Revenue Bill: FFC & SALGA
8 March 2018 2018 Division of Revenue Bill: NT briefing
PARLIAMENTARY COMMITTEES
Standing Committee on Finance (SCOF)
DATE OF MEETING MATTERS RAISED BY PARLIAMENTARY COMMITTEE HOW THE NATIONAL TREASURY HAS ADDRESSED THESE MATTERS
27 February 2019 2019 Budget: public hearings Matters addressed as presented at the
meeting and subsequent responses to
follow-up questions.
Records available from the committee
secretariat or on request from NT.
21 February 2019 2019 Annual Budget Minister’s briefing to joint committees
20 February 2019 2019 Annual Budget tabling
13 February 2019 Nugent Commission of Inquiry into SARS: interim findings
and recommendations
12 February 2019 FFC Remuneration referral; Customs and Excise Bill; PIC
Committee Bill: adopted; Financial Matters Amendment
Bill: public hearings
6 February 2019 Public Investment Corporation (PIC) Amendment Bills; FFC
referral to Committee; Committee Report on Carbon Tax
Bill
5 February 2019 Carbon Tax Bill: finalisation & voting, Financial Matters
Amendment Draft Bill: briefing
5 December 2018 Carbon Tax Bill: deliberations
4 December 2018 Carbon Tax Bill: Treasury & stakeholder input
27 November 2018 Carbon Tax Bill workshop
21 November 2018 Committee Report on Financial Sector Transformation
Report: Treasury, SARB and NEDLAC response
20 November 2018 Financial Matters Amendment Bill: Committee Report on
Fiscal Framework
7. PORTFOLIO COMMITTEES

201
PART C: GOVERNANCE - Continued
7. PORTFOLIO COMMITTEES
PARLIAMENTARY COMMITTEES
Standing Committee on Finance (SCOF)
DATE OF MEETING MATTERS RAISED BY PARLIAMENTARY COMMITTEE HOW THE NATIONAL TREASURY HAS ADDRESSED THESE MATTERS
14 November 2018 Rates and Monetary Amounts and Amendment of
Revenue Laws Bill; Taxation Laws Amendment Bill & Tax
Administration Laws Amendment Bill: adoption; PIC Bills &
Banks Amendment Bill: deliberations
Matters addressed as presented at the
meeting and subsequent responses to
follow-up questions.
Records available from the committee
secretariat or on request from NT.13 November 2018 Rates and Monetary Amounts & Amendment of
Revenue Laws Bill; Taxation Laws Amendment Bill; Tax
Administration Laws Amendment Bill
17 October 2018 Statement on VBS Mutual Bank matter; VAT Panel Report
and TLAB & TALAB Bills: Treasury and SARS response
7 November 2018 VBS Mutual Bank briefing
6 November 2018 Committee Report on 2018 MTBPS
31 October 2018 2018 MTBPS: public hearings
30 October 2018 2018 MTBPS: PBO and FFC briefing
25 October 2018 2018 MTBPS: Minister and Deputy Minister briefing on the
MTBPS
24 October 2018 2018 MTBPS: Tabling
17 October 2018 VAT Panel Report and TLAB and TALAB Bills: Treasury
Response
16 October 2018 National Treasury & SARS 2017/18 Annual Report, with
Minister & Deputy Minister present
10 October 2018 Auditor-General Briefing – National Treasury audit
13 September 2018 Non-VAT aspects: Rates and Monetary Amounts and
Amendment of Revenue Laws Bill & Tax Bills: Treasury &
SARS responses continued
12 September 2018 Zero VAT report: stakeholder responses; Taxation Laws
& Administration Bills: Treasury & SARS response to
submissions
4 September 2018 Bank Amendment Bill: public hearings
28 August 2018 VAT Commission report
21 August 2018 Taxation Laws & Tax Administration Laws Amendment Bills:
public hearings; Steinhoff Committee Resolution
16 August 2018 VAT Panel Recommendations; Taxation Laws Amendment
Bill & Tax Administration Laws Amendment Bill: briefing
15 August 2018 PIC Amendment Bills: hearings

202
PART C: GOVERNANCE - Continued
PARLIAMENTARY COMMITTEES
Standing Committee on Finance (SCOF)
DATE OF MEETING MATTERS RAISED BY PARLIAMENTARY COMMITTEE HOW THE NATIONAL TREASURY HAS ADDRESSED THESE MATTERS
7 June 2018 SAA Quarterly report with Deputy Minister; Carbon Tax Bill:
Treasury response to submissions
Matters addressed as presented at the
meeting and subsequent responses to
follow-up questions.
Records available from the committee
secretariat or on request from NT.
5 June 2018 Financial Sector Summit preparations; PIC rationale for
investment decisions with Deputy Minister
31 May 2018 PIC Bills: public hearings; partial closure of SAA meeting
30 May 2018 VBS Mutual Bank and Capitec follow-up meeting
23 May 2018 SARS on Makwakwa matter; KPMG Report; 2017/18
revenue; Steinhoff; Illicit Financial Flows; Illicit Tobacco
Trade
22 May 2018 PIC Amendment Bill (committee bill)
16 May 2018 SAA latest quarterly report (meeting postponed)
15 May 2018 Financial Sector Regulation Act Regulations; NT Budget:
Committee Report
8 May 2018 National Treasury 2018/19 Annual Performance Plan –
Minister and Deputy Minister
2 May 2018 Illicit Tobacco Trade - SARS
25 April 2018 Rates and Monetary Amounts and Amendment of
Revenue Laws (“VAT”) Bill: briefing & public hearings; Davis
Tax Committee
24 April 2018 PIC Amendment Bills briefing with NT and the GEPF input
17 April2018 Financial Sector Regulations Act
27 March 2018 SAA Quarterly Report – with Deputy Minister of Finance
20 March 2018 Capitec and VBS Mutual Bank briefing
14 March 2018 Carbon Tax Draft Bill: public hearings
13 March 2018 SARS follow-up: Makwakwa matter, SARS & KPMG report on
SARS Intelligence Unit
6 March 2018 Committee Report on 2018 Budget: adoption
2 March 2018 2018 Budget: NT and SARS response to public comments
7. PORTFOLIO COMMITTEES

203
PART C: GOVERNANCE - Continued
Select Committee on Finance
DATE OF MEETING MATTERS RAISED BY PARLIAMENTARY COMMITTEE HOW THE NATIONAL TREASURY HAS ADDRESSED THESE MATTERS
29 November 2018 Committee Reports on Rates and Monetary Amounts
& Amendment of Revenue Laws Bill & Taxation Laws
Amendment Bill
Matters addressed as presented at the
meeting and subsequent responses to
follow-up questions.
Records available from the committee
secretariat or on request from NT.
28 November 2018 Taxation Laws & Administration Amendment Bills; Rates
and Monetary Amounts & Amendment of Revenue Laws
Bill: public hearings
27 November 2018 Taxation Laws Amendment Bill; Tax Administration
Laws Amendment Bill; Rates and Monetary Amounts
and Amendment of Revenue Laws Bill: briefing; Fiscal
Framework Committee Report
6 November 2018 Money Bills Amendment Procedure and Related Matters
Amendment Bill: adoption and committee report on metro
engagements
9 October 2018 Money Bills Amendment Procedure and Related Matters
Amendment Bill: briefing and written submissions
12 September 2018 Money Bills Amendment Procedure and Related Matters
Amendment Bill: briefing
11 September 2018 Buffalo City metro progress report Treasury IGR & Cities Support Programme
officials supported the committee
4 September 2018 City of Cape Town on IDP, LED and NDP Treasury IGR attended to provide support
to the committee21 August 2018 Mangaung and eThekwini Metro Municipality on
Integrated Development Programme (IDP), Local Economic
Development (LED) and National Development Plan (NDP)
14 August 2018 Nelson Mandela Bay Municipality on IDP, LED and service
delivery
26 June 2018 Public Audit Amendment Bill: briefing and finalisation Treasury legal division attended to
provide support to the committee
22 June 2018 Free state and Gauteng 2017/18 expenditure outcomes:
Provincial Treasury
Treasury IGR attended to provide support
to the committee
19 June 2018 KwaZulu-Natal 2017/18 expenditure outcomes: Provincial
Treasury
12 June 2018 Mpumalanga 2017/18 expenditure outcomes: Provincial
Treasury
5 June 2018 Western Cape 2017/18 expenditure outcomes: Provincial
Treasury
7. PORTFOLIO COMMITTEES

204
PART C: GOVERNANCE - Continued
Select Committee on Finance
DATE OF MEETING MATTERS RAISED BY PARLIAMENTARY COMMITTEE HOW THE NATIONAL TREASURY HAS ADDRESSED THESE MATTERS
29 May 2018 Northern Cape & Limpopo 2017/18 expenditure outcomes:
Provincial Treasury
Treasury IGR attended to provide support
to the committee
15 May 2018 Eastern Cape 2017/18 expenditure outcomes: Provincial
Treasury
Standing Committee on Public Accounts (SCOPA)
DATE OF MEETING MATTERS RAISED BY PARLIAMENTARY COMMITTEE HOW THE NATIONAL TREASURY HAS ADDRESSED THESE MATTERS
6 December 2018 Public Investment Corporation (PIC) financial matters:
hearing, with Deputy Minister
Matters addressed as presented at the
meeting and subsequent responses to
follow-up questions.
Records available from the committee
secretariat or on request from NT.
5 December 2018 National Treasury Integrated Financial Management System
(IFMS) forensic report: hearing
4 December 2018 DWS & WTE deviations, irregular, fruitless and wasteful
expenditure: hearing; with Minister and Deputy Minister
Treasury OCPO and Public Finance
attended to provide support to the
committee28 November 2018 DWS unauthorised, irregular, fruitless & wasteful
expenditure: hearing, with Minister and Deputy Minister
27 November 2018 SIU investigations: progress report; Department of Water
and Sanitation challenges: Treasury briefing, with DWS
Minister
Matters addressed as presented at the
meeting and subsequent responses to
follow-up questions.
Records available from the committee
secretariat or on request from NT
21 November 2018 Public Investment Corporation (PIC) response to
information request, with Deputy Minister
20 November 2018 Integrated Financial Management System (IFMS) forensic
investigation: update, with Deputy Minister
14 November 2018 SABC on irregular, fruitless & wasteful expenditure: hearing Treasury OCPO attended to provide
support to the committee
13 November 2018 Defaulting municipalities owing Eskom: Inter-Ministerial
Task Team; with Minister
Matters addressed as presented at the
meeting and subsequent responses to
follow-up questions.
Records available from the committee
secretariat or on request from NT
7. PORTFOLIO COMMITTEES
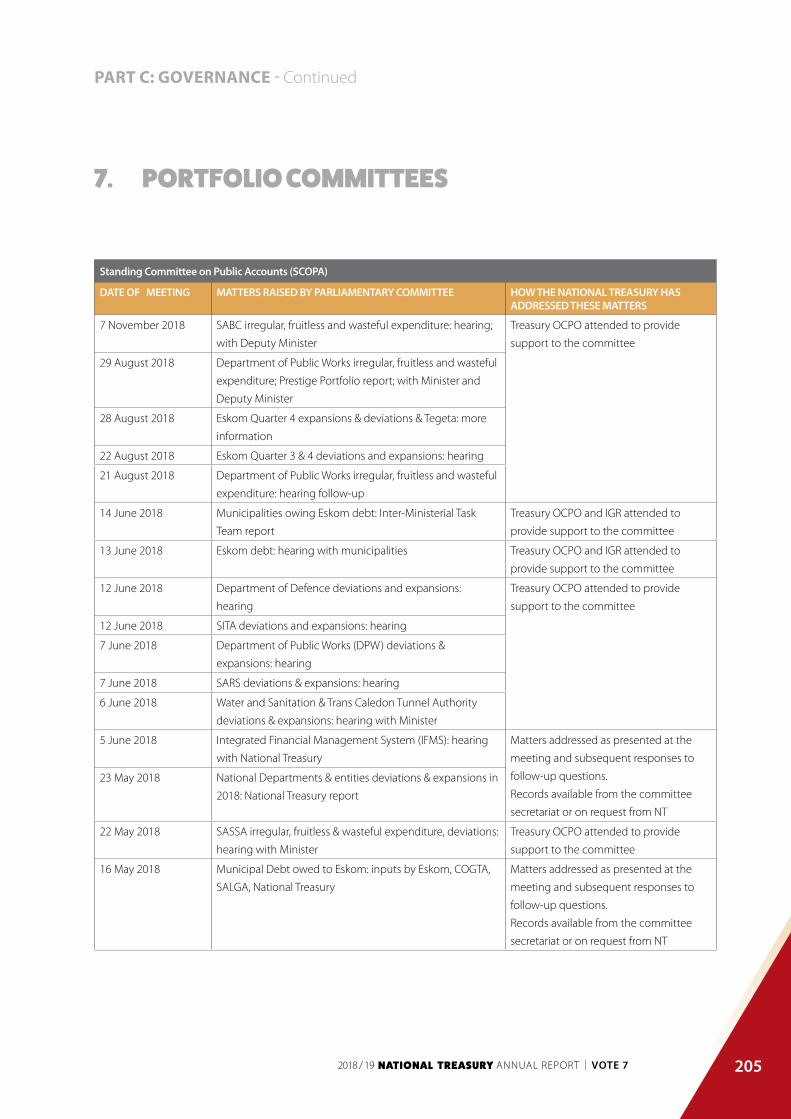
205
PART C: GOVERNANCE - Continued
Standing Committee on Public Accounts (SCOPA)
DATE OF MEETING MATTERS RAISED BY PARLIAMENTARY COMMITTEE HOW THE NATIONAL TREASURY HAS ADDRESSED THESE MATTERS
7 November 2018 SABC irregular, fruitless and wasteful expenditure: hearing;
with Deputy Minister
Treasury OCPO attended to provide
support to the committee
29 August 2018 Department of Public Works irregular, fruitless and wasteful
expenditure; Prestige Portfolio report; with Minister and
Deputy Minister
28 August 2018 Eskom Quarter 4 expansions & deviations & Tegeta: more
information
22 August 2018 Eskom Quarter 3 & 4 deviations and expansions: hearing
21 August 2018 Department of Public Works irregular, fruitless and wasteful
expenditure: hearing follow-up
14 June 2018 Municipalities owing Eskom debt: Inter-Ministerial Task
Team report
Treasury OCPO and IGR attended to
provide support to the committee
13 June 2018 Eskom debt: hearing with municipalities Treasury OCPO and IGR attended to
provide support to the committee
12 June 2018 Department of Defence deviations and expansions:
hearing
Treasury OCPO attended to provide
support to the committee
12 June 2018 SITA deviations and expansions: hearing
7 June 2018 Department of Public Works (DPW) deviations &
expansions: hearing
7 June 2018 SARS deviations & expansions: hearing
6 June 2018 Water and Sanitation & Trans Caledon Tunnel Authority
deviations & expansions: hearing with Minister
5 June 2018 Integrated Financial Management System (IFMS): hearing
with National Treasury
Matters addressed as presented at the
meeting and subsequent responses to
follow-up questions.
Records available from the committee
secretariat or on request from NT
23 May 2018 National Departments & entities deviations & expansions in
2018: National Treasury report
22 May 2018 SASSA irregular, fruitless & wasteful expenditure, deviations:
hearing with Minister
Treasury OCPO attended to provide
support to the committee
16 May 2018 Municipal Debt owed to Eskom: inputs by Eskom, COGTA,
SALGA, National Treasury
Matters addressed as presented at the
meeting and subsequent responses to
follow-up questions.
Records available from the committee
secretariat or on request from NT
7. PORTFOLIO COMMITTEES

206
PART C: GOVERNANCE - Continued
Standing Committee on Public Accounts (SCOPA)
DATE OF MEETING MATTERS RAISED BY PARLIAMENTARY COMMITTEE HOW THE NATIONAL TREASURY HAS ADDRESSED THESE MATTERS
24 April 2018 SAA 2016/17 financial statements & irregular, fruitless &
wasteful expenditure: hearing
Treasury attended to provide support to
the committee
6 March 2018 Defaulting municipalities: Eskom briefing Treasury OCPO attended to provide
support to the committee
6 March 2018 Integrated Financial Management Systems (IFMS): National
Treasury briefing; with Deputy Minister of Finance
Matters addressed as presented at the
meeting and subsequent responses to
follow-up questions.
Records available from the committee
secretariat or on request from NT
Portfolio Committee on Water & Sanitation
DATE OF MEETING MATTERS RAISED BY PARLIAMENTARY COMMITTEE HOW THE NATIONAL TREASURY HAS ADDRESSED THESE MATTERS
14 November 2018 Municipal water debt: Department; COGTA; Treasury;
SALGA update
Matters addressed as presented at the
meeting and subsequent responses to
follow-up questions.
Records available from the committee
secretariat or on request from NT.
9 October 2018 Department of Water and Sanitation on its 2017/18 Annual
Report, with AGSA & Treasury input; with the Minister
16 May 2018 Department of Water and Sanitation: Auditor-General &
Treasury input on audit & financial management; with
Minister
9 May 2018 Department of Water & Sanitation financial position &
contested audit: Treasury & Auditor-General briefing
27 March 2018 Department of Water and Sanitation challenges: SIU, AGSA
& National Treasury input
Portfolio Committee on Trade & Industry
DATE OF MEETING MATTERS RAISED BY PARLIAMENTARY COMMITTEE HOW THE NATIONAL TREASURY HAS ADDRESSED THESE MATTERS
11 September 2018 Southern African Customs Union (SACU); with Minister of
Finance & Deputy and Minister of Trade and Industry
Matters addressed as presented at the
meeting and subsequent responses to
follow-up questions.
Records available from the committee
secretariat or on request from NT.
12 June 2018 Steel & Sugar Tariffs: DTI, ITAC, SARS; Sugar Industry; Space
activities
7 March 2018 ‘Debt Intervention’ National Credit Amendment Bill:
Treasury on constitutionality & response to submissions
7. PORTFOLIO COMMITTEES
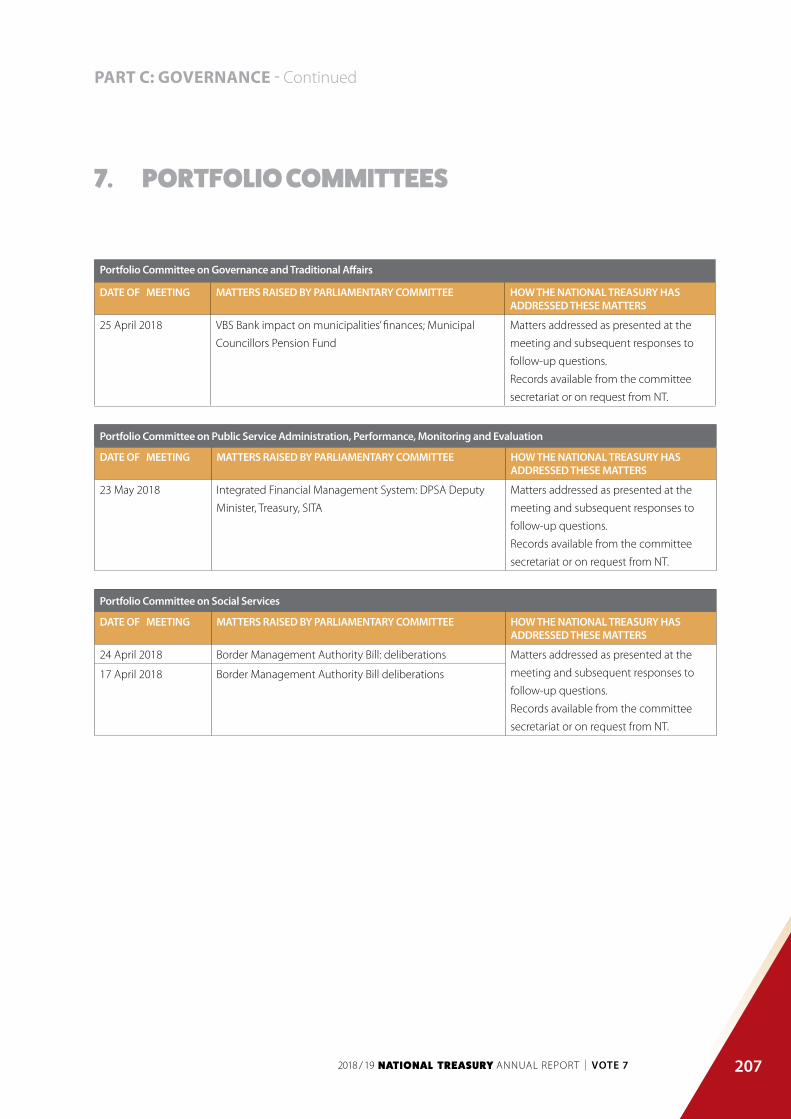
207
PART C: GOVERNANCE - Continued
7. PORTFOLIO COMMITTEES
Portfolio Committee on Governance and Traditional Affairs
DATE OF MEETING MATTERS RAISED BY PARLIAMENTARY COMMITTEE HOW THE NATIONAL TREASURY HAS ADDRESSED THESE MATTERS
25 April 2018 VBS Bank impact on municipalities’ finances; Municipal
Councillors Pension Fund
Matters addressed as presented at the
meeting and subsequent responses to
follow-up questions.
Records available from the committee
secretariat or on request from NT.
Portfolio Committee on Public Service Administration, Performance, Monitoring and Evaluation
DATE OF MEETING MATTERS RAISED BY PARLIAMENTARY COMMITTEE HOW THE NATIONAL TREASURY HAS ADDRESSED THESE MATTERS
23 May 2018 Integrated Financial Management System: DPSA Deputy
Minister, Treasury, SITA
Matters addressed as presented at the
meeting and subsequent responses to
follow-up questions.
Records available from the committee
secretariat or on request from NT.
Portfolio Committee on Social Services
DATE OF MEETING MATTERS RAISED BY PARLIAMENTARY COMMITTEE HOW THE NATIONAL TREASURY HAS ADDRESSED THESE MATTERS
24 April 2018 Border Management Authority Bill: deliberations Matters addressed as presented at the
meeting and subsequent responses to
follow-up questions.
Records available from the committee
secretariat or on request from NT.
17 April 2018 Border Management Authority Bill deliberations
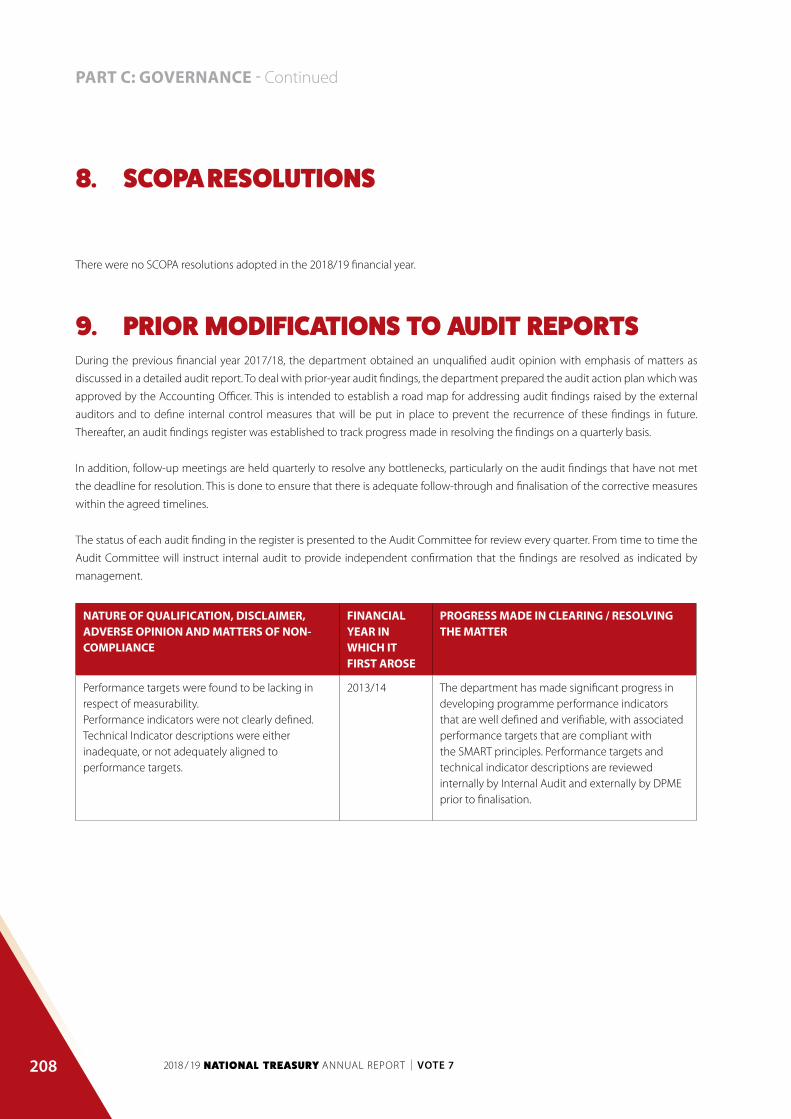
208
PART C: GOVERNANCE - Continued
8. SCOPA RESOLUTIONS
There were no SCOPA resolutions adopted in the 2018/19 financial year.
9. PRIOR MODIFICATIONS TO AUDIT REPORTSDuring the previous financial year 2017/18, the department obtained an unqualified audit opinion with emphasis of matters as
discussed in a detailed audit report. To deal with prior-year audit findings, the department prepared the audit action plan which was
approved by the Accounting Officer. This is intended to establish a road map for addressing audit findings raised by the external
auditors and to define internal control measures that will be put in place to prevent the recurrence of these findings in future.
Thereafter, an audit findings register was established to track progress made in resolving the findings on a quarterly basis.
In addition, follow-up meetings are held quarterly to resolve any bottlenecks, particularly on the audit findings that have not met
the deadline for resolution. This is done to ensure that there is adequate follow-through and finalisation of the corrective measures
within the agreed timelines.
The status of each audit finding in the register is presented to the Audit Committee for review every quarter. From time to time the
Audit Committee will instruct internal audit to provide independent confirmation that the findings are resolved as indicated by
management.
NATURE OF QUALIFICATION, DISCLAIMER, ADVERSE OPINION AND MATTERS OF NON- COMPLIANCE
FINANCIAL YEAR IN WHICH IT FIRST AROSE
PROGRESS MADE IN CLEARING / RESOLVING THE MATTER
Performance targets were found to be lacking in respect of measurability.Performance indicators were not clearly defined. Technical Indicator descriptions were either inadequate, or not adequately aligned to performance targets.
2013/14 The department has made significant progress in developing programme performance indicators that are well defined and verifiable, with associated performance targets that are compliant with the SMART principles. Performance targets and technical indicator descriptions are reviewed internally by Internal Audit and externally by DPME prior to finalisation.

209
PART C: GOVERNANCE - Continued
9. PRIOR MODIFICATIONS TO AUDIT REPORTS
Misstatements in the annual financial statements. 2015/16 Monthly reconciliations are performed on all control accounts. Checking and verification is done by senior management before sign off by the CFO. Collaboration with key role players that contribute in the preparation of financial statement disclosures is undertaken to ensure completeness and accuracy. Formal reviews of financial statements are performed at different management levels, including the Audit Committee, before submission for approval.
Non-compliance with the normal supply chain management processes and procedures as prescribed in relevant regulations.
2016/17 A revised process has been implemented and meetings of the Bids Steering Committee are taking place as scheduled. No limited bidding process is undertaken without market analysis except where it is impractical to do so. In such cases, reasons are recorded and approved by a properly delegated official.
Deficiencies in the design and implementation of effective internal controls for financial reporting and compliance with legislation.
2017/18 A revised process is being developed for (1) quarterly preparation and review of, accurate and complete financial reports that are supported by reliable information. (2) Develop and monitor the implementation of action plans to address internal control deficiencies.Review and monitor compliance with SCM legislation on a regular basis.

210
PART C: GOVERNANCE - Continued
10. INTERNAL CONTROL UNIT
For the 2018/19 financial year, the Internal Control Unit conducted inspections on compliance and financial information. Inspections
were performed on all payments related to procurement and transfers. Moreover, inspections were done on commitments and asset
reconciliation as well as the interim and annual financial statements. The Internal Control unit also performed the following tasks
during the period under review:
• Reported on all compliance matters in term of Section 40 of the Public Finance Management Act (PFMA).
• In collaboration with Internal Audit, followed up on the outstanding audit findings and provided reports on these to the Chief
Financial Officer (CFO) and Audit Committee.
• Investigated operational losses and irregular expenditure as well as fruitless and wasteful Expenditure, and provided reports to
the CFO on these.
• The Internal Control Unit continued to coordinate control activities within the department to promote efficiency and reduce risks.
11. INTERNAL AUDIT AND AUDIT COMMITTEES
Internal auditing is an independent and objective assurance and consulting activity that is guided by a policy of adding value to
improve the operations of the National Treasury, Co-operative Banks Development Agency (CBDA), Government Technical Advisory
Centre (GTAC), the Accounting Standards Board (ASB), Programme 7 and the Independent Regulatory Board for Auditors (IRBA).
It assists the National Treasury, CBDA, GTAC, ASB, and the IRBA in accomplishing their objectives by bringing a systematic and
disciplined approach (an annual and three-year rolling risk-based audit plan) to evaluate and improve the effectiveness of the
organisations’ governance, risk management and internal control.
Internal Audit (IA) implemented its annual risk-based audit plan for 2018/19 as part of the three-year rolling plan, after consultation
with management and approval by the National Treasury’s Audit Committee and the IRBA’s audit and risk committee. 46 Audits were
planned for the year, 41 were completed, 2 were still in progress at the end of the year, 2 audits were postponed to 2019/20 and 1
audit was cancelled due to emerging risks, changes in the department and requests from management. All the changes to planned
audits were approved by the Audit Committee. For the year, 41 planned audits with an additional 18 ad-hoc audits culminating in
59 audits, were conducted in the predetermined timeframe. This resulted in a 90% per cent completion of the approved 2018/19
internal audit annual plan, and an overall 97 per cent completion of all audits. All audits and other work of the Internal Audit function
were conducted in accordance with the International Standards for the Professional Practice of Internal Audit, as issued by the
Institute of Internal Auditors (IIA).
The Audit Committee is established as a statutory committee in terms of section 38(1)(a)(ii) of the PFMA and Treasury Regulations.
The committee performs an oversight and advisory role to the National Treasury and is accountable to the Accounting Officer,
Executive Authority and the public to properly consider and evaluate all matters as per its terms of reference.
The purpose of the committee is to assist the Executive Authority in fulfilling its oversight responsibilities and the Accounting
Officer in fulfilling executive duties regarding the financial reporting process, the management of risk, the system of internal control,
the audit process, and the department’s process for monitoring compliance with laws, regulations and code of conduct. The
Committee also has a primary responsibility to the public to form an opinion on the effectiveness of those issues within its ambit,
and communicates this in the annual report in terms of the Treasury Regulations.
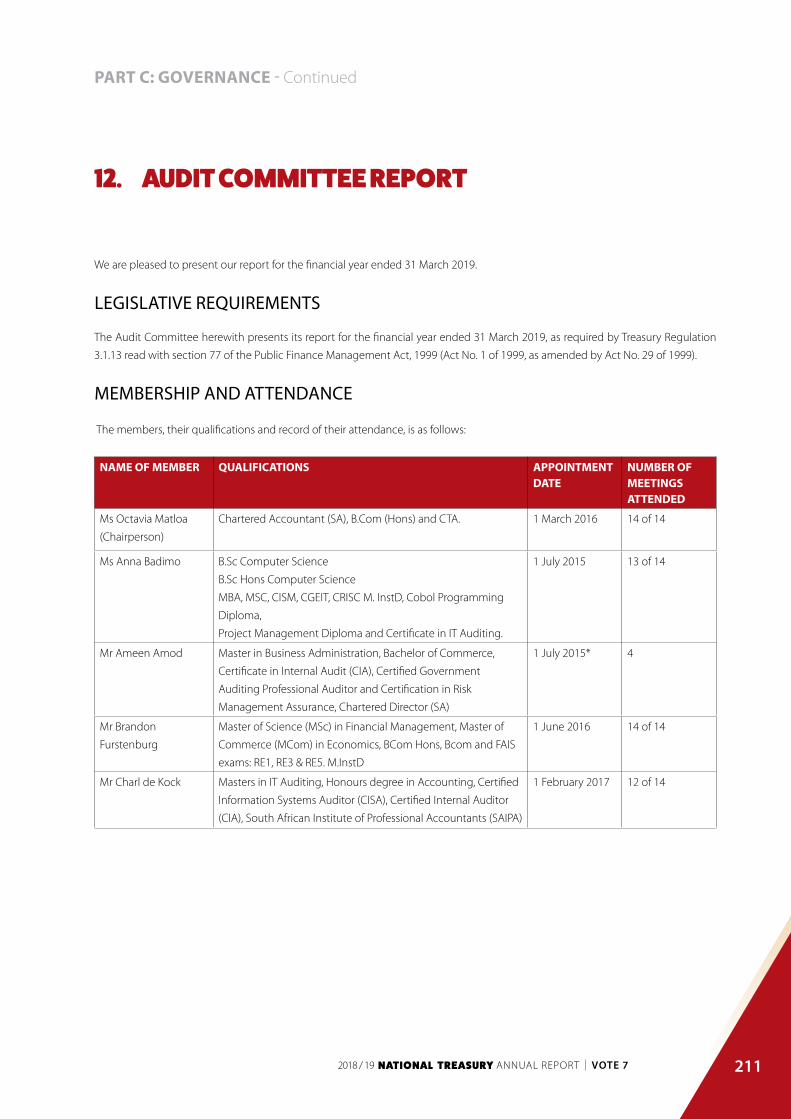
211
PART C: GOVERNANCE - Continued
12. AUDIT COMMITTEE REPORT
We are pleased to present our report for the financial year ended 31 March 2019.
LEGISLATIVE REQUIREMENTS
The Audit Committee herewith presents its report for the financial year ended 31 March 2019, as required by Treasury Regulation
3.1.13 read with section 77 of the Public Finance Management Act, 1999 (Act No. 1 of 1999, as amended by Act No. 29 of 1999).
MEMBERSHIP AND ATTENDANCE
The members, their qualifications and record of their attendance, is as follows:
NAME OF MEMBER QUALIFICATIONS APPOINTMENT DATE
NUMBER OFMEETINGS ATTENDED
Ms Octavia Matloa
(Chairperson)
Chartered Accountant (SA), B.Com (Hons) and CTA. 1 March 2016 14 of 14
Ms Anna Badimo B.Sc Computer Science
B.Sc Hons Computer Science
MBA, MSC, CISM, CGEIT, CRISC M. InstD, Cobol Programming
Diploma,
Project Management Diploma and Certificate in IT Auditing.
1 July 2015 13 of 14
Mr Ameen Amod Master in Business Administration, Bachelor of Commerce,
Certificate in Internal Audit (CIA), Certified Government
Auditing Professional Auditor and Certification in Risk
Management Assurance, Chartered Director (SA)
1 July 2015* 4
Mr Brandon
Furstenburg
Master of Science (MSc) in Financial Management, Master of
Commerce (MCom) in Economics, BCom Hons, Bcom and FAIS
exams: RE1, RE3 & RE5. M.InstD
1 June 2016 14 of 14
Mr Charl de Kock Masters in IT Auditing, Honours degree in Accounting, Certified
Information Systems Auditor (CISA), Certified Internal Auditor
(CIA), South African Institute of Professional Accountants (SAIPA)
1 February 2017 12 of 14
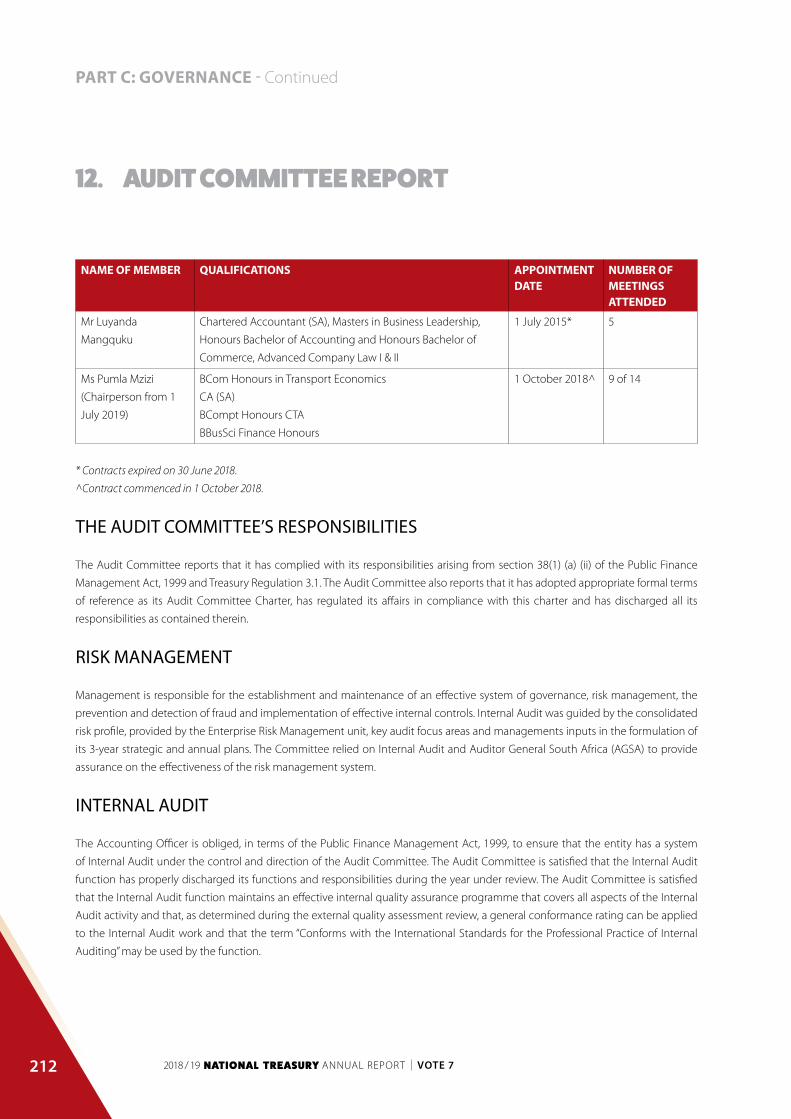
212
PART C: GOVERNANCE - Continued
NAME OF MEMBER QUALIFICATIONS APPOINTMENT DATE
NUMBER OFMEETINGS ATTENDED
Mr Luyanda
Mangquku
Chartered Accountant (SA), Masters in Business Leadership,
Honours Bachelor of Accounting and Honours Bachelor of
Commerce, Advanced Company Law I & II
1 July 2015* 5
Ms Pumla Mzizi
(Chairperson from 1
July 2019)
BCom Honours in Transport Economics
CA (SA)
BCompt Honours CTA
BBusSci Finance Honours
1 October 2018^ 9 of 14
* Contracts expired on 30 June 2018.
^Contract commenced in 1 October 2018.
THE AUDIT COMMITTEE’S RESPONSIBILITIES
The Audit Committee reports that it has complied with its responsibilities arising from section 38(1) (a) (ii) of the Public Finance
Management Act, 1999 and Treasury Regulation 3.1. The Audit Committee also reports that it has adopted appropriate formal terms
of reference as its Audit Committee Charter, has regulated its affairs in compliance with this charter and has discharged all its
responsibilities as contained therein.
RISK MANAGEMENT
Management is responsible for the establishment and maintenance of an effective system of governance, risk management, the
prevention and detection of fraud and implementation of effective internal controls. Internal Audit was guided by the consolidated
risk profile, provided by the Enterprise Risk Management unit, key audit focus areas and managements inputs in the formulation of
its 3-year strategic and annual plans. The Committee relied on Internal Audit and Auditor General South Africa (AGSA) to provide
assurance on the effectiveness of the risk management system.
INTERNAL AUDIT
The Accounting Officer is obliged, in terms of the Public Finance Management Act, 1999, to ensure that the entity has a system
of Internal Audit under the control and direction of the Audit Committee. The Audit Committee is satisfied that the Internal Audit
function has properly discharged its functions and responsibilities during the year under review. The Audit Committee is satisfied
that the Internal Audit function maintains an effective internal quality assurance programme that covers all aspects of the Internal
Audit activity and that, as determined during the external quality assessment review, a general conformance rating can be applied
to the Internal Audit work and that the term “Conforms with the International Standards for the Professional Practice of Internal
Auditing” may be used by the function.
12. AUDIT COMMITTEE REPORT

213
PART C: GOVERNANCE - Continued
12. AUDIT COMMITTEE REPORT
The Committee approved a risk-based three-year rolling strategic internal audit plan and an annual audit coverage plan for the
period 1 April 2018 to 31 March 2021 covering the following key audit activities for the 2018/2019 financial year:
TYPE TOTAL PLANNED AUDITS TOTAL COMPLETED
Regularity- and Compliance Audit 19 17(89%)
Performance Audit 8 7 (88%)
Information Technology Audit 14 13 (93%)
Compliance Audit 5 4 (80%)
Total planned audits 46 41 (90%)
Postponed Audits (3)
Ad hoc audits 18 18 (100%)
Total 61 59 (97%)
*NB All the postponed audits were approved by the Audit Committee.
Effectiveness of Internal Controls
In line with the Public Finance Management Act, 1999, Internal Audit provides the Audit Committee and Management with
assurance that the internal controls are appropriate and effective. This is achieved by evaluating internal controls to determine
their adequacy and efficiency, and by developing recommendations for enhancement or improvement. The Accounting Officer
retains responsibility for implementing such recommendations as per Treasury Regulation 3.1.12. The reports of Internal Audit and
the AGSA indicated the need to improve the system of internal control in areas pertaining to financial reporting, reporting on pre-
determined objectives and compliance with laws and regulations. The Committee concludes that the system on internal control for
the period under review has been generally adequate and effective.
Evaluation of Annual Financial Statements and the Annual Performance Information
The Committee has evaluated the annual financial statements and the annual performance information for the year ended 31
March 2019 and duly recommended them for the Accounting Officer’s approval prior to being submitted to the Auditor-General for
audit. Subsequently the material misstatements corrected were reviewed when the management report of the AGSA was discussed
with the Audit Committee. The Audit Committee has discussed the external audit outcomes on the reporting on pre-determined
objectives to be included in the annual report with the Auditor General South Africa and the Accounting Officer.
Compliance with Legal and Regulatory Provisions
The Audit Committee is concerned with the non-compliance with supply chain management laws and regulations that resulted in
irregular and fruitless and wasteful expenditure.

214
PART C: GOVERNANCE - Continued
Other Identified Concerns
The Committee hereby highlights the following matters of concern:
• High vacancy rates in critical positions;
• Inadequate capacity within the finance unit;
• Inadequate governance and internal controls of the IFMS project;
• The forensic investigation into IFMS 2 was concluded and the forensic report was shared with the Audit Committee. The
department is in the process of implementing the outcome of the investigation;
• Lack of consequence management;
• Inadequate ICT general controls; and
• Inability by the Committee to provide adequate oversight over the MSCOA project due to inadequate reporting.
External Audit
We have reviewed the department’s implementation plan for audit issues raised in the previous year and based on the interaction
with the Department and the internal audit reports, the committee is not satisfied that all matters have been adequately addressed.
The Audit Committee is not aware of any unresolved issues with respect to the current audit. The Audit Committee concurs and
accepts the conclusions of the Auditor-General on the Annual Financial Statements and is of the opinion that the Audited Annual
Financial Statements should be accepted and read together with the report of the Auditor-General.
We would like to express our appreciation to the Director-General, Mr. Dondo Mogajane, for his leadership and support, and to
Internal Audit and Management for their commitment and achievement of the unqualified audit opinion.
Ms. Pumla Mzizi CA(SA)Chairperson of the Audit Committee
National Treasury
Date: 06 September 2019
12. AUDIT COMMITTEE REPORT

NATIONAL TREASURYANNUAL REPORT
PART D:HUMAN RESOURCE
MANAGEMENT

216
PART D: HUMAN RESOURCE MANAGEMENT - Continued
1. INTRODUCTION
The information contained in this part of the annual report has been prescribed by the Minister for the Public Service and
Administration for all Departments in the public service.
2. OVERVIEW OF HUMAN RESOURCES
2.1 STATUS OF HUMAN RESOURCES IN THE DEPARTMENT
In the last financial year, the vacancy rate increased to 9.9% compared to 5% in 2017/18 financial year. This has been as a result of the
high turnover and the reprioritisation of funded posts to ensure that the Department remains within the ceiling on compensation
of employees, introduced through the government budget process.
As part of ensuring sustainable employee engagement, the Department implemented the rotation of employees and encouraged
employees to act in vacant unfunded positions for exposure and development. The turnover rate for the period was 13.9%. The
rotation of employees and encouraging acting in higher positions ensured that the Department has a diverse set of skills and is able
to recruit internally should there be opportunities available. Three interns were appointed in permanent positions during the last
financial year and 15 were appointed on contract basis.
The employment equity statistics at the end of the financial year, with respect to persons with disabilities was 0.86% and women at
SMS level was at 53.13%. Challenges experienced in recruiting persons with disabilities manifest across all echelons.
There was an increase in awareness and utilisation of the Department’s Employee Health and Wellness Programme which has
realised 89.6% utilisation in 2018/19 which is a highly improved service as compared to the previous year.
2.2 HUMAN RESOURCE PRIORITIES FOR THE YEAR UNDER REVIEW
The following were priorities for the year under review:
• Attraction of scarce and critical skills at middle and senior management level.
• Employee retention.
• Human resources information management that ensures improved efficiency in Human Resource (HR) processes and decision-
making.

217
PART D: HUMAN RESOURCE MANAGEMENT - Continued
2. OVERVIEW OF HUMAN RESOURCES
2.3 WORKFORCE PLANNING AND KEY STRATEGIES TO ATTRACT AND RECRUIT SKILLED AND CAPABLE WORKFORCE
Human Resources Management continues to drive its core strategies to address the workforce challenges identified. Increased
integration between Recruitment and Talent Management, has allowed the Department to focus on building talent within the
Department rather than relying on appointing talent from external sources. This further supports the retention challenges, in that
the Department is focusing on creating internal opportunities for employees, including international secondments, rotation within
the Department and promotional opportunities. The Department’s Graduate Development Programme continues to build a strong
foundation with 60 Interns focusing on scarce and critical skills areas, including economics, tax, finances, auditing and legal. Noting
that the current legislation prohibits absorptions into vacant permanent positions, the Department follows the recruitment process
to appoint Interns and Chartered Accountant Academy Cadets into some positions.
2.4 EMPLOYEE PERFORMANCE MANAGEMENT
The Department has an approved performance management and development policy for all staff. Senior Management Service
(SMS) members entered into performance agreements for the period under review. SMS members who did not sign performance
agreements will not be eligible for any reward. The performance evaluations process for 2018/19 is currently underway and will be
finalised before 30 December 2019 in line with DPSA Directive. The performance management system of the Department has been
enhanced with the review of the performance management and reward policies. This has encouraged a stronger culture of high
performance across the Department and has assisted in identifying shortfalls that can speedily be addressed through development
programmes.
2.5 EMPLOYEE HEALTH AND WELLNESS PROGRAMME
The Employee Health and Wellness programme is fully operational in the Department. 1 076 employees have undergone health risk
assessments in the 2018/19 financial year. Employees in the Department as well as their immediate family members have access to
a 24-hour counselling service, which is available either telephonically or face-to-face.

218
PART D: HUMAN RESOURCE MANAGEMENT - Continued
2.6 ACHIEVEMENTS AND CHALLENGES FACED BY THE DEPARTMENT
ACHIEVEMENTS
The priorities over the past year have been focused on attraction of scarce and critical skills. In addition, emphasis has been placed
on improving HR processes across the HR cycle to enhance accountability and improve efficiencies within the Human Resources
Management Chief Directorate. Employee engagement had been highlighted as requiring increased focus and this was prioritised
during 2018/19. Highly engaged employees feel they are valued and have a real stake in the organisation, they strive to efficiently
create new products, services and processes.
CHALLENGES
The skill combination sets required by the Department in terms of technical skill merged in a single position (e.g. Economics, Health
and Policy Analysis) creates unique challenges that require unique strategies. This combined with various regulatory requirements
that must be adhered to, places the Department in a position where internal development and skills transfer become key strategies
to ensuring capacity requirements are met. The limited flexibility within the existing structure still remains a challenge. Even though
the Department managed to promote internally from middle management to senior management positions, the fiscal challenges
faced by the Department currently makes it difficult to fill positions that are vacated by middle managers and other junior positions.
As a result, it leaves senior managers to perform both functions of middle and senior management services within their functional
areas. This is further aggravated by a lack of meeting employee’s financial needs in order to retain skills. Interns are appointed in
permanent positions after completing their internship programme, through the recruitment process. The Department is undergoing
an organisational optimisation process, which is envisaged to minimise these challenges.
2.7 FUTURE HUMAN RESOURCE PLANS/GOALS
• Enhance talent development and retention that is aligned to the Departmental strategic objectives.
• Enhance employee engagement initiatives.
• Improve compliance with the legislative framework.
• Improve efficiency in HR processes and decision-making.
2. OVERVIEW OF HUMAN RESOURCES

219
PART D: HUMAN RESOURCE MANAGEMENT - Continued
3. HUMAN RESOURCES OVERSIGHT STATISTICS
3.1 PERSONNEL RELATED EXPENDITURE
TABLE 3.1.1 Personnel expenditure by programme for the period 1 April 2018 to 31 March 2019
PROGRAMME TOTAL EXPENDITURE
(R’000)
PERSONNEL EXPENDITURE
(R’000)
TRAINING EXPENDITURE
(R’000)
PROFESSIONAL AND SPECIAL
SERVICES (R’000)
PERSONNEL EXPENDITURE
AS A % OF TOTAL
EXPENDITURE
AVERAGE PERSONNEL
COST PER EMPLOYEE
(R’000)*
Programme 1
Administration
424 274 190 837 1 302 12 304 45.0 582
Programme 2
Economic
Policy, Tax,
Financial
Regulation and
Research
138 756 73 003 561 31 201 52.6 936
Programme 3
Public Finance
and Budget
Management
295 370 213 854 165 4 627 72.4 859
Programme 4
Asset and
Liability
Management
91 185 73 813 73 987 80.9 785
Programme 5
Financial
Systems and
Accounting
869 104 206 944 437 119 450 23.8 778
Programme 6
International
Financial
Relations
5 807 686 31 893 107 0 0.5 966

220
PART D: HUMAN RESOURCE MANAGEMENT - Continued
PROGRAMME TOTAL EXPENDITURE
(R’000)
PERSONNEL EXPENDITURE
(R’000)
TRAINING EXPENDITURE
(R’000)
PROFESSIONAL AND SPECIAL
SERVICES (R’000)
PERSONNEL EXPENDITURE
AS A % OF TOTAL
EXPENDITURE
AVERAGE PERSONNEL
COST PER EMPLOYEE
(R’000)*
Programme 7
Civil and
Military
Pensions,
Contributions
to Funds and
other benefits
5 020 100 0 0 64 488 0 0
Programme 8
Technical and
Management
Support and
Development
Finance
2 235 067 0 0 349 010 0 0
Programme 9
Revenue
Administration
9 007 217 0 0 0 0 0
Programme 10
Financial
Intelligence
and State
Security
4 763 533 0 0 0 0 0
Total 28 652 292 790 344 2 645 582 067 2.8 754
* Note: Percentage of average personnel cost per employee calculated based on the number of employees in table 3.1.1. Minister and Deputy
Minister personnel expenditure included in total.
3. HUMAN RESOURCES OVERSIGHT STATISTICS

221
PART D: HUMAN RESOURCE MANAGEMENT - Continued
Table 3.1.2 Personnel costs by salary band for the period 2018/19
SALARY BANDS PERSONNEL EXPENDITURE
(R’000)
% OF TOTAL PERSONNEL
COST
NO. OF EMPLOYEES
AVERAGE PERSONNEL
COST PER EMPLOYEE(R’000)***
Lower skilled (Levels 1-2) 0 0 0 0
Skilled (Levels 3-5) 11 754 1.5 49 240
Highly skilled production (Levels 6-8) 102 395 13.0 265 386
Highly skilled supervision (Levels
9-12)
365 808 46.5 477 767
Senior management (Levels 13-16) 306 008 39.9 255 1 200
Total** 785 965 100 1 046 751
** Note: Minister and Deputy Minister personnel expenditure not included in total.
*** Note: Percentage of average personnel cost per employee calculated based on the number of employees in table 3.1.2.
The following tables provide a summary, per programme (Table 3.1.3) and salary band (Table 3.1.4), of expenditure incurred as a
result of salaries, overtime, home owners’ allowance (HOA) and medical assistance. In each case, the table indicates the percentage
of the personnel budget used for these items.
3. HUMAN RESOURCES OVERSIGHT STATISTICS
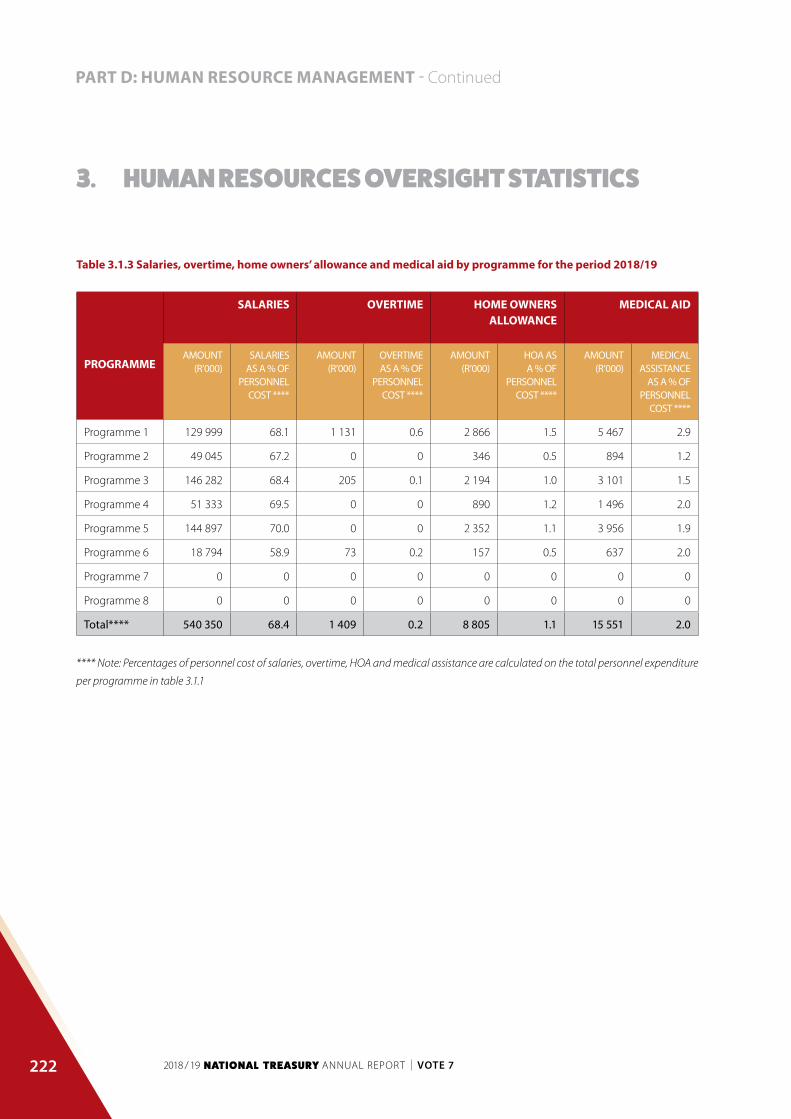
222
PART D: HUMAN RESOURCE MANAGEMENT - Continued
Table 3.1.3 Salaries, overtime, home owners’ allowance and medical aid by programme for the period 2018/19
PROGRAMME
SALARIES OVERTIME HOME OWNERS ALLOWANCE
MEDICAL AID
AMOUNT (R’000)
SALARIES AS A % OF
PERSONNELCOST ****
AMOUNT (R’000)
OVERTIME AS A % OF
PERSONNEL COST ****
AMOUNT (R’000)
HOA AS A % OF
PERSONNEL COST ****
AMOUNT (R’000)
MEDICAL ASSISTANCE
AS A % OF PERSONNEL
COST ****
Programme 1 129 999 68.1 1 131 0.6 2 866 1.5 5 467 2.9
Programme 2 49 045 67.2 0 0 346 0.5 894 1.2
Programme 3 146 282 68.4 205 0.1 2 194 1.0 3 101 1.5
Programme 4 51 333 69.5 0 0 890 1.2 1 496 2.0
Programme 5 144 897 70.0 0 0 2 352 1.1 3 956 1.9
Programme 6 18 794 58.9 73 0.2 157 0.5 637 2.0
Programme 7 0 0 0 0 0 0 0 0
Programme 8 0 0 0 0 0 0 0 0
Total**** 540 350 68.4 1 409 0.2 8 805 1.1 15 551 2.0
**** Note: Percentages of personnel cost of salaries, overtime, HOA and medical assistance are calculated on the total personnel expenditure
per programme in table 3.1.1
3. HUMAN RESOURCES OVERSIGHT STATISTICS

223
PART D: HUMAN RESOURCE MANAGEMENT - Continued
Table 3.1.4 Salaries, overtime, home owners’ allowance and medical aid by salary band for the period 2018/19
SALARY BANDS
SALARIES OVERTIME HOME OWNERS ALLOWANCE
MEDICAL AID
AMOUNT (R’000)
SALARIES AS A % OF
PERSONNELCOST
AMOUNT (R’000)
OVERTIME AS A % OF
PERSONNELCOST
AMOUNT (R’000)
HOA AS A % OF
PERSONNELCOST
AMOUNT (R’000)
MEDICAL ASSISTANCE
AS A % OF PERSONNEL
COST*****
Lower skilled
(Levels 1-2)
0 0 0 0 0 0 0 0
Skilled (Levels
3-5)
7 872 67.0 308 2.6 596 5.1 928 7.9
Highly skilled
production
(Levels 6-8)
76 995 75.2 519 0.5 2 855 2.8 5 382 5.3
Highly skilled
supervision
(Levels 9-12)
255 335 69.8 582 0.2 3 349 0.9 6 779 1.9
Senior
management
(Levels 13-16)
197 517 64.5 0 0 2 005 0.7 2 462 0.8
Total ***** 537 719 68.4 1 409 0.2 8 805 1.1 15 551 2.0
***** Note: Minister and Deputy Minister personnel expenditure not included in total.
3. HUMAN RESOURCES OVERSIGHT STATISTICS

224
PART D: HUMAN RESOURCE MANAGEMENT - Continued
3.2 EMPLOYMENT AND VACANCIES
Table 3.2.1 Employment and vacancies by programme as at 31 March 2019
PROGRAMME NUMBER OF FUNDED POSTS
HEADCOUNT VACANCY RATE%
NUMBER OF POSTS FILLED
ADDITIONAL TO THE ESTABLISHMENT
Programme 1 364 328 9.9 76
Programme 2 98 78 20.4 1
Programme 3 274 249 9.1 4
Programme 4 107 94 12.1 4
Programme 5 284 266 6.3 31
Programme 6 36 33 8.3 2
Programme 7 0 0 0 0
Programme 8 0 0 0 0
Total 1 163 1 048 9.9 118
NB: Minister and Deputy Minister included in totals.
3. HUMAN RESOURCES OVERSIGHT STATISTICS

225
PART D: HUMAN RESOURCE MANAGEMENT - Continued
Table 3.2.2 Employment and vacancies by salary band as at 31 March 2019
SALARY BANDS NUMBER OF POSTS HEADCOUNT VACANCY RATE%
NUMBER OF POSTS FILLED
ADDITIONAL TO THE ESTABLISHMENT
Lower skilled (Levels
1-2)
0 0 0 0
Skilled (Levels 3-5) 51 49 3.9 2
Highly skilled
production (Levels
6-8) 282 265 6.0 77
Highly skilled
supervision (Levels
9-12) 529 477 9.8 32
Senior management
(Levels 13-16) 301 257 14.6 7
Total 1 163 1 048 9.9 118
NB: Vacancy reduced by additional appointments. Minister and Deputy Minister included in totals
3. HUMAN RESOURCES OVERSIGHT STATISTICS
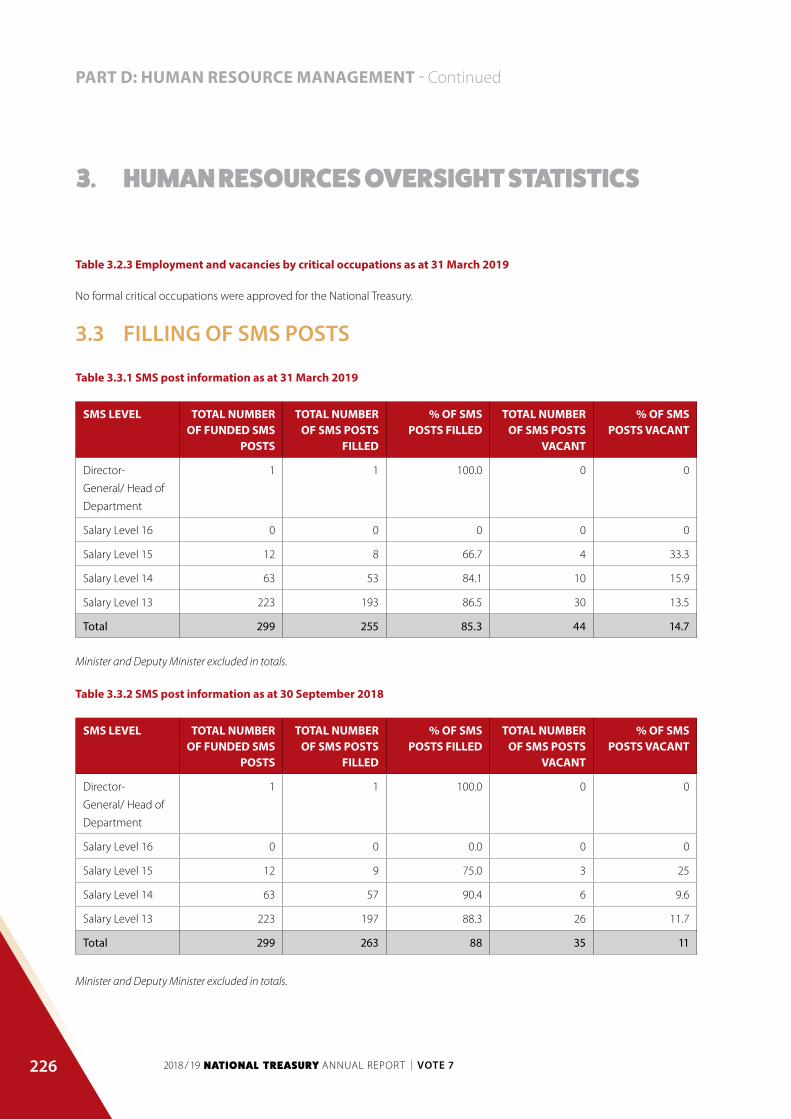
226
PART D: HUMAN RESOURCE MANAGEMENT - Continued
Table 3.2.3 Employment and vacancies by critical occupations as at 31 March 2019
No formal critical occupations were approved for the National Treasury.
3.3 FILLING OF SMS POSTS
Table 3.3.1 SMS post information as at 31 March 2019
SMS LEVEL TOTAL NUMBER OF FUNDED SMS
POSTS
TOTAL NUMBER OF SMS POSTS
FILLED
% OF SMS POSTS FILLED
TOTAL NUMBER OF SMS POSTS
VACANT
% OF SMS POSTS VACANT
Director-
General/ Head of
Department
1 1 100.0 0 0
Salary Level 16 0 0 0 0 0
Salary Level 15 12 8 66.7 4 33.3
Salary Level 14 63 53 84.1 10 15.9
Salary Level 13 223 193 86.5 30 13.5
Total 299 255 85.3 44 14.7
Minister and Deputy Minister excluded in totals.
Table 3.3.2 SMS post information as at 30 September 2018
SMS LEVEL TOTAL NUMBER OF FUNDED SMS
POSTS
TOTAL NUMBER OF SMS POSTS
FILLED
% OF SMS POSTS FILLED
TOTAL NUMBER OF SMS POSTS
VACANT
% OF SMS POSTS VACANT
Director-
General/ Head of
Department
1 1 100.0 0 0
Salary Level 16 0 0 0.0 0 0
Salary Level 15 12 9 75.0 3 25
Salary Level 14 63 57 90.4 6 9.6
Salary Level 13 223 197 88.3 26 11.7
Total 299 263 88 35 11
Minister and Deputy Minister excluded in totals.
3. HUMAN RESOURCES OVERSIGHT STATISTICS

227
PART D: HUMAN RESOURCE MANAGEMENT - Continued
Table 3.3.3 Advertising and filling of SMS posts for the period 1 April 2018 to 31 March 2019
SMS LEVEL ADVERTISING FILLING OF POSTS
NUMBER OF VACANCIES PER LEVEL ADVERTISED WITHIN 6 MONTHS
OF BECOMING VACANT
NUMBER OF VACANCIES PER LEVEL FILLED WITHIN 6 MONTHS OF
BECOMING VACANT
NUMBER OF VACANCIES PER LEVEL NOT FILLED WITHIN 6 MONTHS BUT
FILLED WITHIN 12MONTHS
Director-General/
Head of Department
0 0 0
Salary Level 16 0 0 0
Salary Level 15 0 0 0
Salary Level 14 6 3 3
Salary Level 13 29 7 3
Total 35 10 6
Table 3.3.4 Reasons for not having complied with the filling of funded vacant SMS – Advertised within 6 months and filled within 12 months after becoming vacant for the period 1 April 2018 to 31 March 2019
REASONS FOR VACANCIES NOT ADVERTISED WITHIN SIX MONTHS
Due to departmental financial constraints, the DG has requested the DDG: CS, the CFO and the CD: HR to analyse and
review capacity needs within the department. This would have to be accommodated in and aligned to the compensation of
employees (CoE) budget. The implication is that certain positions had to be put on hold after being vacated to first consider all
the positions deemed critical by the department and to advertise them upon the CFO’s confirmation of funding.
REASONS FOR VACANCIES NOT FILLED WITHIN TWELVE MONTHS
Reasons include the department choosing to have acting appointments so as to recruit internally, other reasons include inability
to find a good pool of skills for recruiting.
3. HUMAN RESOURCES OVERSIGHT STATISTICS

228
PART D: HUMAN RESOURCE MANAGEMENT - Continued
Table 3.3.5 Disciplinary steps taken for not complying with the prescribed timeframes for filling SMS posts within 12 months for the period 1 April 2018 to 31 March 2019
REASONS FOR VACANCIES NOT ADVERTISED WITHIN SIX MONTHS
Currently the department’s executive has taken a decision to only advertise critical technical positions as National Treasury
needs to ensure alignment with the department’s CoE budget in order to reduce and monitor the wage bill.
Filling of positions is controlled by the availability of funding. Even if a position becomes vacant, filling it would depend on the
needs of the department at that point in time. Hence the current resolution is to review the organisational structure to address
the above-mentioned matters.
REASONS FOR VACANCIES NOT FILLED WITHIN TWELVE MONTHS
The EXCO ensures that all recruitment activities are aligned with the compensation of employees’ budget and that the
department remains within the budget allocated per financial year. The time it takes for the executives to recommend and
approve posts, influences the average period within which such posts can be filled. However, the actual recruitment process to
fill posts is within the DPSA’s recommended timeline, which is within six months.
3. HUMAN RESOURCES OVERSIGHT STATISTICS

229
PART D: HUMAN RESOURCE MANAGEMENT - Continued
3.4 JOB EVALUATION
Table 3.4.1 Job evaluation by salary band for the period 1 April 2018 to 31 March 2019
SALARY BAND
NUMBER OF POSTS
ON APPROVED ESTABLISH-
MENT
NUMBER OF JOBS
EVALUATED
% OF POSTS
EVALUATED BY SALARY
BANDS
POSTS UPGRADED POSTS DOWNGRADED
NUMBER % OF POSTS EVALUATED
NUMBER % OF POSTS EVALUATED
Lower killed
(Levels 1-2)
0 0 0 0 0 0 0
Skilled
(Levels 3-5)
51 0 0 0 0 0 0
Highly skilled
production
(Levels 6-8)
282 7 25 0 0 0 0
Highly skilled
supervision
(Levels 9-12)
529 12 2.3 0 0 0 0
Senior
Management
Service Band A
223 15 6.7 0 0 0 0
Senior
Management
Service Band B
63 3 4.8 0 0 0 0
Senior
Management
Service Band C
12 1 8.3 0 0 0 0
Senior
Management
Service Band D
3 0 0 0 0 0 0
Total 1163 38 3.3 0 0 0 0
NB: Minister and Deputy Minister included in totals.
3. HUMAN RESOURCES OVERSIGHT STATISTICS

230
PART D: HUMAN RESOURCE MANAGEMENT - Continued
Table 3.4.2 Profile of employees whose salary positions were upgraded due to their posts being upgraded for the period 1 April 2018 to 31 March 2019
GENDER AFRICAN ASIAN COLOURED WHITE TOTAL
Female 0 0 0 0 0
Male 0 0 0 0 0
Employees with a disability 0 0 0 0 0
Total 0 0 0 0 0
Table 3.4.3 Employees with salary levels higher than determined by job evaluation by occupation for the period 1 April 2018 to 31 March 2019 (in terms of PSR 1.V.C.3)
OCCUPATION NUMBER OF EMPLOYEES
JOB EVALUATION LEVEL
REMUNERATION LEVEL
REASON FOR DEVIATION
0 0 0
Total number of employees whose salaries exceeded the level determined by job evaluation
Percentage of total employed (1048 as at 31 March 2019)
Table 3.4.4 Profile of employees who have salary levels higher than those determined by job evaluation for the period 1 April 2018 to 31 March 2019 (in terms of PSR 1.V.C.3)
Total number of employees whose salaries exceeded the grades determined by job evaluation None
3. HUMAN RESOURCES OVERSIGHT STATISTICS
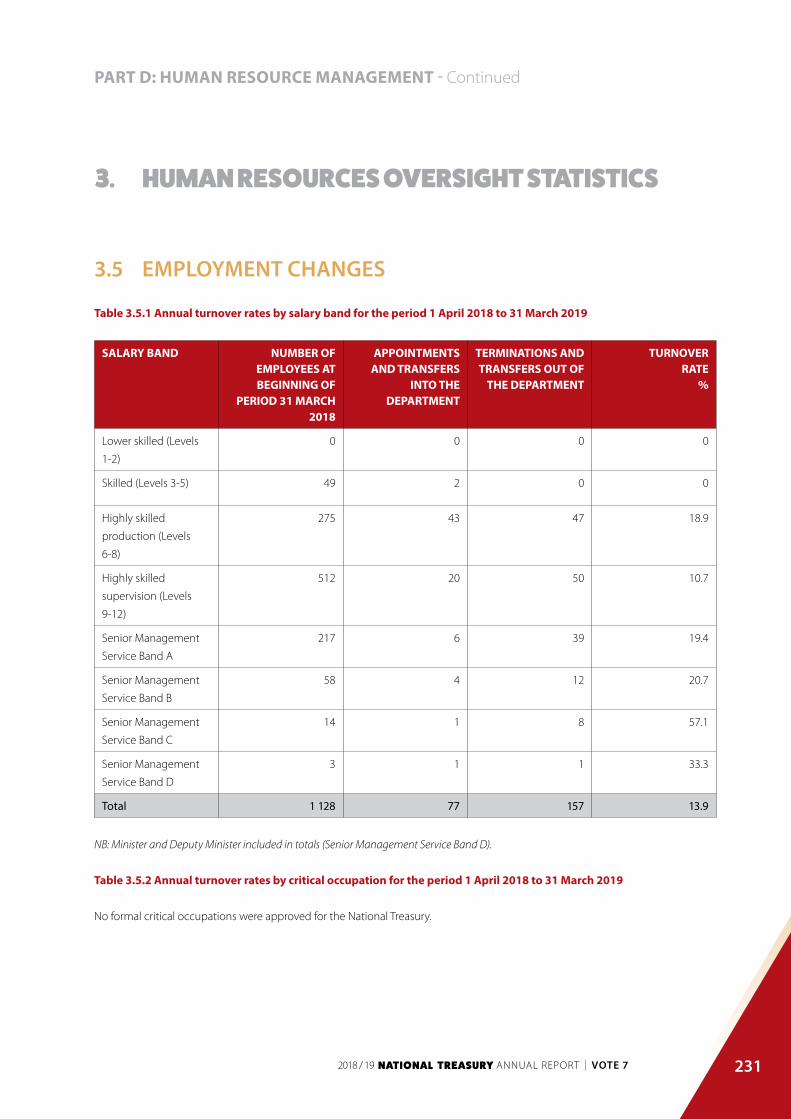
231
PART D: HUMAN RESOURCE MANAGEMENT - Continued
3.5 EMPLOYMENT CHANGES
Table 3.5.1 Annual turnover rates by salary band for the period 1 April 2018 to 31 March 2019
SALARY BAND NUMBER OF EMPLOYEES AT BEGINNING OF
PERIOD 31 MARCH 2018
APPOINTMENTS AND TRANSFERS
INTO THE DEPARTMENT
TERMINATIONS AND TRANSFERS OUT OF
THE DEPARTMENT
TURNOVERRATE
%
Lower skilled (Levels
1-2)
0 0 0 0
Skilled (Levels 3-5) 49 2 0 0
Highly skilled
production (Levels
6-8)
275 43 47 18.9
Highly skilled
supervision (Levels
9-12)
512 20 50 10.7
Senior Management
Service Band A
217 6 39 19.4
Senior Management
Service Band B
58 4 12 20.7
Senior Management
Service Band C
14 1 8 57.1
Senior Management
Service Band D
3 1 1 33.3
Total 1 128 77 157 13.9
NB: Minister and Deputy Minister included in totals (Senior Management Service Band D).
Table 3.5.2 Annual turnover rates by critical occupation for the period 1 April 2018 to 31 March 2019
No formal critical occupations were approved for the National Treasury.
3. HUMAN RESOURCES OVERSIGHT STATISTICS

232
PART D: HUMAN RESOURCE MANAGEMENT - Continued
Table 3.5.3 Reasons why staff left the department for the period 1 April 2018 to 31 March 2019
TERMINATION TYPE NUMBER % OF TOTAL RESIGNATIONS
Death 3 1.9
Resignation 76 48.4
Expiry of contract 52 33.1
Dismissal – operational changes 0 0
Dismissal – misconduct 3 1.9
Dismissal – inefficiency 0 0
Discharged due to ill-health 0 0
Retirement 8 5.1
Transfer to other public service departments 15 9.6
Other 0 0
Total 157 100
Total number of employees who left as a % of total employment (1048 as at 31 March 2019)
15
Table 3.5.4 Promotions by critical occupation for the period 1 April 2018 to 31 March 2019
No formal critical occupations were approved for the National Treasury.
Table 3.5.5 Promotions by salary band for the period 1 April 2018 to 31 March 2019
SALARY BAND EMPLOYEES 31 MARCH 2018
PROMOTIONS TO ANOTHER SALARY
LEVEL
SALARY BAND PROMOTIONS AS A %
OF EMPLOYEES BYSALARY LEVEL
Lower skilled (Levels 1-2) 0 0 0
Skilled (Levels 3-5) 49 0 0
Highly skilled production (Levels 6-8) 275 0 0
Highly skilled supervision (Levels 9-12) 512 11 2.1
Senior management (Levels13-16) 292 7 2.4
Total 1 128 18 1.6
3. HUMAN RESOURCES OVERSIGHT STATISTICS

233
PART D: HUMAN RESOURCE MANAGEMENT - Continued
3.6 EMPLOYMENT EQUITY
Table 3.6.1 Total number of employees (including employees with disabilities) in each of the following occupational categories as at 31 March 2019
OCCUPATIONAL CATEGORY
MALE FEMALE TOTAL
AFRICAN COLOURED INDIAN WHITE AFRICAN COLOURED INDIAN WHITE
Legislators, senior
officials and
managers
73 10 12 24 88 6 10 30 253
Professionals 187 13 6 26 217 6 8 21 484
Technicians
and associate
professionals
29 3 1 2 94 7 2 23 161
Clerks 29 0 0 0 65 1 3 11 109
Service and sales
workers
17 0 0 0 11 0 0 0 28
Plant and
machine
operators and
assemblers
0 0 0 0 0 0 0 0 0
Elementary
occupations
8 0 0 0 5 0 0 0 13
Total 343 26 19 52 480 20 23 85 1 048
Employees with disabilities
0 2 0 0 0 0 0 0 2
NB: Minister and Deputy Minister included in totals (legislators, senior officials and managers).
3. HUMAN RESOURCES OVERSIGHT STATISTICS

234
PART D: HUMAN RESOURCE MANAGEMENT - Continued
Table 3.6.2 Total number of employees (including employees with disabilities) in each of the following occupational bands as at 31 March 2019
OCCUPATIONAL BAND
MALE FEMALE TOTAL
AFRICAN COLOURED INDIAN WHITE AFRICAN COLOURED INDIAN WHITE
Top management 7 1 2 1 6 0 0 2 19
Senior
management
69 11 10 25 85 6 10 29 245
Professionally
qualified and
experienced
specialists
and mid-
management
135 8 6 21 136 8 4 24 342
Skilled technical
and academically
qualified
workers, junior
management,
supervisors,
foremen and
superintendents
109 4 1 4 234 6 9 30 397
Semi-skilled and
discretionary
decision making
23 2 0 1 19 0 0 0 45
Unskilled and
defined decision
making
0 0 0 0 0 0 0 0 0
Total 343 26 19 52 480 20 23 85 1 048
NB: Minister and Deputy Minister included in totals (top management).
3. HUMAN RESOURCES OVERSIGHT STATISTICS

235
PART D: HUMAN RESOURCE MANAGEMENT - Continued
Table 3.6.3 Recruitment for the period 1 April 2018 to 31 March 2019
OCCUPATIONAL BAND
MALE FEMALE TOTAL
AFRICAN COLOURED INDIAN WHITE AFRICAN COLOURED INDIAN WHITE
Top management
(15-16)
2 0 0 0 0 0 0 0 2
Senior
management
(13-14)
3 0 0 0 7 0 0 1 11
Professionally
qualified and
experienced
specialists
and mid-
management
(9-12)
11 0 1 0 7 0 1 0 20
Skilled technical
and academically
qualified
workers, junior
management,
supervisors,
foremen and
superintendents
(6-8)
15 0 0 0 27 0 0 0 42
Semi-skilled and
discretionary
decision making
(3-5)
2 0 0 0 0 0 0 0 2
Unskilled and
defined decision
making (1-2)
0 0 0 0 0 0 0 0 0
Total 33 0 1 0 41 0 1 1 77
Employees with
disabilities
0 0 0 0 0 0 0 0 0
NB: Minister and Deputy Minister included in totals (top management).
3. HUMAN RESOURCES OVERSIGHT STATISTICS

236
PART D: HUMAN RESOURCE MANAGEMENT - Continued
Table 3.6.4 Promotions for the period 1 April 2018 to 31 March 2019
OCCUPATIONAL BAND
MALE FEMALE TOTAL
AFRICAN COLOURED INDIAN WHITE AFRICAN COLOURED INDIAN WHITE
Top management
(15-16)
0 0 0 0 0 0 0 0 0
Senior
management
(13-14)
3 0 1 0 2 0 0 1 7
Professionally
qualified and
experienced
specialists
and mid-
management
(9-12)
5 0 0 1 5 0 0 0 11
Skilled technical
and academically
qualified
workers, junior
management,
supervisors,
foreman and
superintendents
(6-8)
0 0 0 0 0 0 0 0 0
Semi-skilled and
discretionary
decision making
(3-5)
0 0 0 0 0 0 0 0 0
Unskilled and
defined decision
making
(1-2)
0 0 0 0 0 0 0 0 0
Total 8 0 1 1 7 0 0 1 18
Employees with
disabilities
0 0 0 0 0 0 0 0 0
3. HUMAN RESOURCES OVERSIGHT STATISTICS
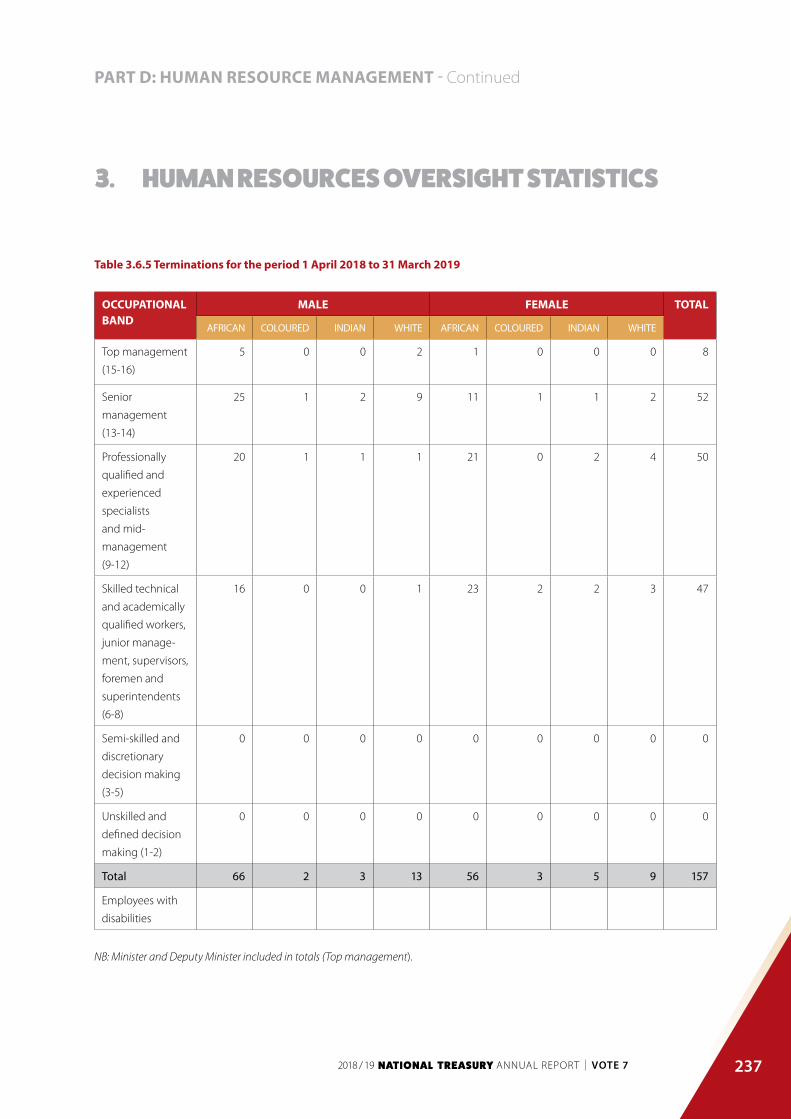
237
PART D: HUMAN RESOURCE MANAGEMENT - Continued
Table 3.6.5 Terminations for the period 1 April 2018 to 31 March 2019
OCCUPATIONAL BAND
MALE FEMALE TOTAL
AFRICAN COLOURED INDIAN WHITE AFRICAN COLOURED INDIAN WHITE
Top management
(15-16)
5 0 0 2 1 0 0 0 8
Senior
management
(13-14)
25 1 2 9 11 1 1 2 52
Professionally
qualified and
experienced
specialists
and mid-
management
(9-12)
20 1 1 1 21 0 2 4 50
Skilled technical
and academically
qualified workers,
junior manage-
ment, supervisors,
foremen and
superintendents
(6-8)
16 0 0 1 23 2 2 3 47
Semi-skilled and
discretionary
decision making
(3-5)
0 0 0 0 0 0 0 0 0
Unskilled and
defined decision
making (1-2)
0 0 0 0 0 0 0 0 0
Total 66 2 3 13 56 3 5 9 157
Employees with
disabilities
NB: Minister and Deputy Minister included in totals (Top management).
3. HUMAN RESOURCES OVERSIGHT STATISTICS

238
PART D: HUMAN RESOURCE MANAGEMENT - Continued
Table 3.6.6 Disciplinary action for the period 1 April 2018 to 31 March 2019
DISCIPLINARY ACTION
MALE FEMALE TOTAL
AFRICAN COLOURED INDIAN WHITE AFRICAN COLOURED INDIAN WHITE
3 0 0 0 1 0 0 0 4
Table 3.6.7 Skills development for the period 1 April 2018 to 31 March 2019
OCCUPATIONAL CATEGORIES
MALE FEMALE TOTAL
AFRICAN COLOURED INDIAN WHITE AFRICAN COLOURED INDIAN WHITE
Legislators, senior
officials and
managers
39 4 3 5 54 1 3 12 121
Professionals 92 0 2 9 158 5 2 7 275
Technicians
and associate
professionals
38 0 3 2 66 2 0 20 131
Clerks 74 0 0 0 97 1 9 1 182
Service and sales
workers
3 1 0 0 2 0 0 0 6
Skilled agriculture
and fishery
workers
0 0 0 0 0 0 0 0 0
Craft and related
trades workers
0 0 0 0 0 0 0 0 0
Plant and
machine
operators and
assemblers
1 0 0 0 0 0 0 0 1
Elementary
occupations
0 0 0 0 2 0 0 0 2
Total 247 5 8 16 379 9 14 40 718
Employees with
disabilities
0 2 0 0 0 0 0 0 2
NB: Minister and Deputy Minister not included in totals.
3. HUMAN RESOURCES OVERSIGHT STATISTICS
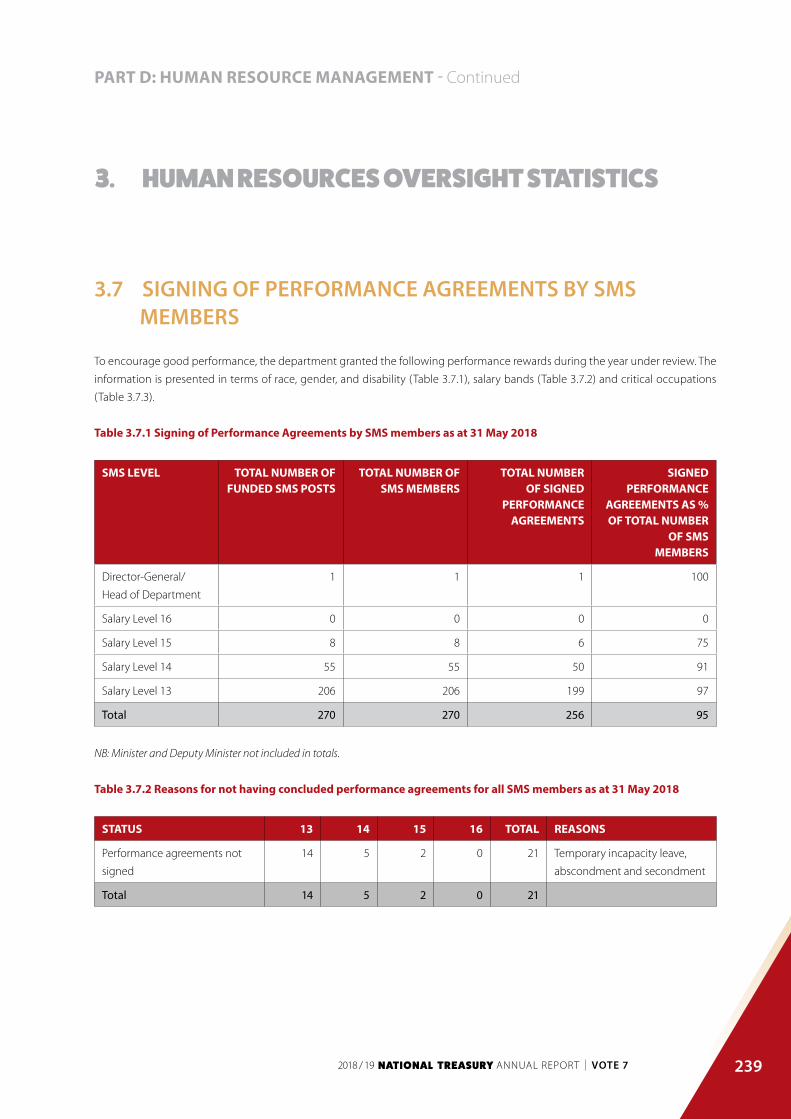
239
PART D: HUMAN RESOURCE MANAGEMENT - Continued
3.7 SIGNING OF PERFORMANCE AGREEMENTS BY SMS MEMBERS
To encourage good performance, the department granted the following performance rewards during the year under review. The
information is presented in terms of race, gender, and disability (Table 3.7.1), salary bands (Table 3.7.2) and critical occupations
(Table 3.7.3).
Table 3.7.1 Signing of Performance Agreements by SMS members as at 31 May 2018
SMS LEVEL TOTAL NUMBER OF FUNDED SMS POSTS
TOTAL NUMBER OF SMS MEMBERS
TOTAL NUMBEROF SIGNED
PERFORMANCE AGREEMENTS
SIGNED PERFORMANCE
AGREEMENTS AS % OF TOTAL NUMBER
OF SMSMEMBERS
Director-General/
Head of Department
1 1 1 100
Salary Level 16 0 0 0 0
Salary Level 15 8 8 6 75
Salary Level 14 55 55 50 91
Salary Level 13 206 206 199 97
Total 270 270 256 95
NB: Minister and Deputy Minister not included in totals.
Table 3.7.2 Reasons for not having concluded performance agreements for all SMS members as at 31 May 2018
STATUS 13 14 15 16 TOTAL REASONS
Performance agreements not
signed
14 5 2 0 21 Temporary incapacity leave,
abscondment and secondment
Total 14 5 2 0 21
3. HUMAN RESOURCES OVERSIGHT STATISTICS

240
PART D: HUMAN RESOURCE MANAGEMENT - Continued
Table 3.7.3 Disciplinary steps taken against SMS members for not having concluded performance agreements as at 31 May 2018
Warning letters were issued.
3.8 PERFORMANCE REWARDS
To encourage good performance, the department has granted the following performance rewards during the year under review.
The information is presented in terms of race, gender, disability, salary bands and critical occupations (see definition in notes below).
Table 3.8.1 Performance rewards by race, gender, and disability for the period 1 April 2017 to 31 March 2018
RACE AND GENDER
BENEFICIARY PROFILE COST
NUMBER OF BENEFICIARIES
NUMBER OF EMPLOYEES
% OF TOTAL WITHIN GROUP
COST (R’000) AVERAGE COST PER EMPLOYEE
African 659 865 76 8 520 12 974.92
Male 266 369 72 3 642 13 694.68
Female 393 496 79 4 878 12 411.12
Asian 35 48 73 629 17 970.03
Male 14 21 67 297 21 192.64
Female 21 27 78 332 15 821.62
Coloured 44 52 85 749 17 022.66
Male 22 29 76 390 17 720.23
Female 22 23 96 359 16 325.09
White 135 158 85 2 188 16 207.27
Male 55 65 85 969 17 616.24
Female 80 93 86 1 219 15 238.60
Total 873 1123 78 12 086 13 844.54
NB: Minister, Deputy Minister, Director-General (HOD) and the two Minister Special Advisors are excluded in totals.
3. HUMAN RESOURCES OVERSIGHT STATISTICS

241
PART D: HUMAN RESOURCE MANAGEMENT - Continued
Table 3.8.2 Performance rewards by salary band for personnel below Senior Management Service for the period 1 April 2017 to 31 March 2018
SALARY BAND BENEFICIARY PROFILE COST TOTAL COST AS A % OF
THE TOTAL PERSONNEL
EXPENDITURE
NUMBER OF BENEFICIARIES
NUMBER OF EMPLOYEES
% OF TOTAL WITHIN SALARY
BANDS
TOTAL COST (R’000)
AVERAGE COST PER EMPLOYEE
(R’000)
Lower skilled
(Levels 1-2)
0 0 0 0 0 0
Skilled
(Levels 3-5)
41 50 82 1 778 4 336.56 0.02
Highly skilled
production (Levels
6-8)
192 273 70 1 435 7 413.96 0.18
Highly skilled
supervision (Levels
9-12)
436 510 85 5 833 378.44 0.73
Total 669 833 80 9 046 130.05 0.93
Table 3.8.3 Performance Rewards by critical occupation for the period 1 April 2017 to 31 March 2018
No formal critical occupations were approved for the National Treasury.
Table 3.8.4 Performance related rewards (cash bonus), by salary band, for SMS for the period 1 April 2017 to 31 March 2018
SALARY BAND
BENEFICIARY PROFILE COST TOTAL COST AS A % OF
THE TOTAL PERSONNEL
EXPENDITURE
NUMBER OF BENEFICIARIES
NUMBER OF EMPLOYEES
% OF TOTAL WITHIN BANDS
TOTAL COST(R’000)
AVERAGE COST PER EMPLOYEE
Band A 156 220 71 3 287 21 070.51 0.41
Band B 42 59 71 1 175 27 976.19 0.14
Band C 6 11 55 208 36 666.67 0.03
Band D 0 0 0 0 0 0
Total 204 290 70 4 670 0 0.58
NB: Minister, Deputy Minister, Director-General (HOD) and the two Minister Special Advisors are excluded in totals.
3. HUMAN RESOURCES OVERSIGHT STATISTICS

242
PART D: HUMAN RESOURCE MANAGEMENT - Continued
3.9 FOREIGN WORKERS
Table 3.9.1 Foreign workers by salary band for the period 1 April 2018 to 31 March 2019
SALARY BANDMARCH 2018 MARCH 2019 CHANGE
NUMBER % OF TOTAL NUMBER % OF TOTAL NUMBER % CHANGE
Lower skilled (Levels
1-2)
0 0 0 0 0 0
Skilled (Levels 3-5) 0 0 0 0 0 0
Highly skilled
production (Levels 6-8)
0 0 0 0 0 0
Highly skilled
supervision (Levels
9-12)
9 43 7 44 -2 22
Senior management
(Levels13-16)
12 57 9 56 -3 25
Total 21 100 16 100 -5 24
Table 3.9.2 Foreign workers by major occupation for the period 1 April 2018 to 31 March 2019
MAJOR OCCUPATIONMARCH 2018 MARCH 2019 CHANGE
NUMBER % OF TOTAL NUMBER % OF TOTAL NUMBER % CHANGE
Senior management 12 57 9 56 -3 25
Professional qualified 9 43 7 44 -2 22
Skilled technical 0 0 0 0 0 0
Semi-skilled 0 0 0 0 0 0
Unskilled 0 0 0 0 0 0
Total 21 100 16 100 -5 24
3. HUMAN RESOURCES OVERSIGHT STATISTICS

243
PART D: HUMAN RESOURCE MANAGEMENT - Continued
3.10 LEAVE UTILISATION
Table 3.10.1 Sick leave for the period 1 January 2018 to 31 December 2018
SALARY BAND
TOTAL DAYS
% DAYS WITHMEDICAL
CERTIFICATION
NUMBER OF EMPLOYEES USING SICK
LEAVE
% OF TOTAL EMPLOYEES
USINGSICK LEAVE
AVERAGE DAYS PER
EMPLOYEE
ESTIMATED COST (R’000)
Lower skilled
(Levels 1-2)
0 0 0 0 0 0
Skilled (Levels
3-5)
300 80 43 4 7 271
Highly skilled
production
(Levels 6-8)
1 706 72 250 15 7 2 542
Highly skilled
supervision
(Levels 9-12)
2 868 72 434 15 7 8 013
Senior
management
(Levels 13-16)
1 323 72 217 16 6 5 536
Total 6 197 72 944 90 7 16 362
3. HUMAN RESOURCES OVERSIGHT STATISTICS

244
PART D: HUMAN RESOURCE MANAGEMENT - Continued
Table 3.10.2 Disability leave (temporary and permanent) for the period 1 January 2018 to 31 December 2018
SALARY BAND TOTAL DAYS
TAKEN
% DAYS WITHMEDICAL
CERTIFICATION
NUMBER OF EMPLOYEES
USING DISABILITY
LEAVE
% OF TOTAL EMPLOYEES
USING DISABILITY
LEAVE
AVERAGE DAYS PER
EMPLOYEE
ESTIMATED COST
(R’000)
Lower skilled
(Levels 1-2)
0 0 0 0 0 0
Skilled (Levels
3-5)
36 100 1 2 36 36
Highly skilled
production
(Levels 6-8)
706 100 16 36 44 1 123
Highly skilled
supervision
(Levels 9-12)
691 100 24 53 29 2 021
Senior
management
(Levels 13-16)
95 100 4 9 24 394
Total 1 528 100 45 100 34 3 574
Table 3.10.3 Annual Leave for the period 1 January 2018 to 31 December 2018
SALARY BAND TOTAL DAYSTAKEN
NUMBER OF EMPLOYEES USING
ANNUAL LEAVE
AVERAGE PER EMPLOYEE
Lower skilled (Levels 1-2) 0 0 0
Skilled (Levels 3-5) 1 074 47 23
Highly skilled production (Levels 6-8) 6 453 307 21
Highly skilled supervision (Levels 9-12) 12 204 519 24
Senior management (Levels 13-16) 6 998 309 23
Total 26 729 1 182 23
3. HUMAN RESOURCES OVERSIGHT STATISTICS
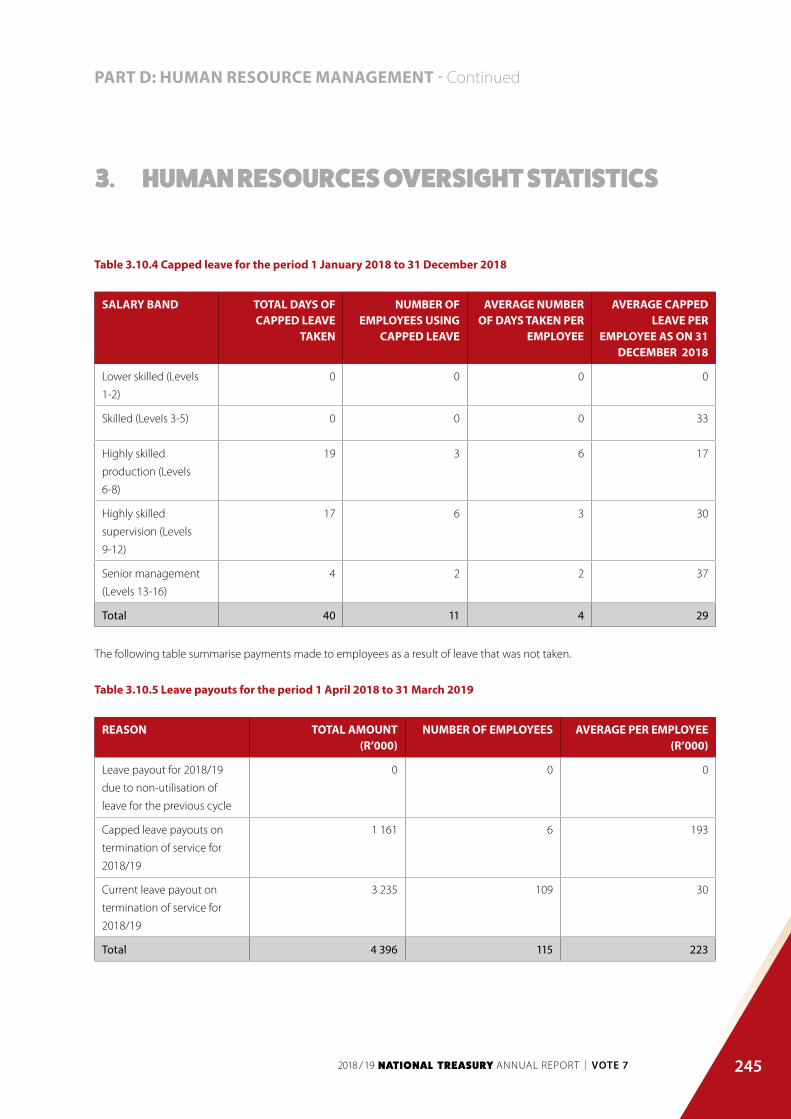
245
PART D: HUMAN RESOURCE MANAGEMENT - Continued
Table 3.10.4 Capped leave for the period 1 January 2018 to 31 December 2018
SALARY BAND TOTAL DAYS OF CAPPED LEAVE
TAKEN
NUMBER OF EMPLOYEES USING
CAPPED LEAVE
AVERAGE NUMBER OF DAYS TAKEN PER
EMPLOYEE
AVERAGE CAPPEDLEAVE PER
EMPLOYEE AS ON 31 DECEMBER 2018
Lower skilled (Levels
1-2)
0 0 0 0
Skilled (Levels 3-5) 0 0 0 33
Highly skilled
production (Levels
6-8)
19 3 6 17
Highly skilled
supervision (Levels
9-12)
17 6 3 30
Senior management
(Levels 13-16)
4 2 2 37
Total 40 11 4 29
The following table summarise payments made to employees as a result of leave that was not taken.
Table 3.10.5 Leave payouts for the period 1 April 2018 to 31 March 2019
REASON TOTAL AMOUNT(R’000)
NUMBER OF EMPLOYEES AVERAGE PER EMPLOYEE(R’000)
Leave payout for 2018/19
due to non-utilisation of
leave for the previous cycle
0 0 0
Capped leave payouts on
termination of service for
2018/19
1 161 6 193
Current leave payout on
termination of service for
2018/19
3 235 109 30
Total 4 396 115 223
3. HUMAN RESOURCES OVERSIGHT STATISTICS

246
PART D: HUMAN RESOURCE MANAGEMENT - Continued
3.11. HIV/AIDS AND HEALTH PROMOTION PROGRAMMES
Table 3.11.1 Steps taken to reduce the risk of occupational exposure
UNITS/CATEGORIES OF EMPLOYEES IDENTIFIED TO BE AT HIGH RISK OF CONTRACTING HIV & RELATED DISEASES (IF ANY)
KEY STEPS TAKEN TO REDUCE THE RISK
The National Treasury provides regular health screenings through the on-site clinic.
The highest trend of health issues noted is employees with signs of obesity and pre-
hypertension. Pre-hypertension is a blood pressure that is higher than normal but not
high enough to be deemed high blood pressure.
Employees are encouraged to follow
a work-life balance by following
exercise programmes and a healthy
diet.
Table 3.11.2 Details of health promotion and HIV/AIDS programmes
QUESTION YES NO DETAILS, IF YES
1. Has the department designated a
member of the SMS to implement
the provisions contained in Chapter
4, Part 3, Regulation 55 of the Public
Service Regulations, 2016? If so,
provide her/his name and position.
The department has appointed an SMS member to implement
the provisions contained in Chapter 4, Part 3, Regulation 55 of the
Public Service Regulations, 2016.
2. Does the department have a
dedicated unit or has it designated
specific staff members to promote
the health and well-being of your
employees? If so, indicate the
number of employees who are
involved in this task and the annual
budget that is available for this
purpose.
The Employee Health and Wellness Unit is a Sub-Directorate of
the Organisational Development Directorate within the Chief
Directorate: Human Resources Management. The EWP Unit is run
by a Wellness Specialist (Assistant Director). The unit has a budget
of R3.8 million to utilise over a period of 3 years.
3. Has the department introduced
an Employee Assistance or
Health Promotion Programme
for employees? If so, indicate the
key elements/services of this
Programme.
The National Treasury provides Employee Assistance Programmes
under its programme brand of Siyaphila. Siyaphila is a
confidential, free, 24-hour, 365-day, personal support line for the
National Treasury (NT) employees and their immediate family
members. These services include; counselling services, wellness
management, HIV/AIDS management, primary health care services
and productivity management.
3. HUMAN RESOURCES OVERSIGHT STATISTICS

247
PART D: HUMAN RESOURCE MANAGEMENT - Continued
3. HUMAN RESOURCES OVERSIGHT STATISTICS
QUESTION YES NO DETAILS, IF YES
4. Has the department established
(a) committee(s) as contemplated
in Chapter 4, Part 3, Regulation 55
of the Public Service Regulations,
2016? If so, please provide the
names of the members of the
committee and the stakeholder(s)
that they represent.
The committee consists of employees across the Department in
various divisions:
1. Neethling Francois
2. Leeuw Faith
3. Tau Alfred
4. Maupye Velencia
5. Makobe Lerato
6. Modibane Caroline
7. Molefe Lebogang
8. Malope Betty
9. Gwangwa Kelebogile
10. Majola Mmule
11. Ndzala Zalisile
12. Dodo Xolisa
13. Rudolph Judith
14. Mdzikwa Julia
15. Magoro Ditshego
16. Guma Nomvuyo
17. Kgare Reuben
18. Kruger Chris
5. Has the department reviewed its
employment policies and practices
to ensure that these do not unfairly
discriminate against employees on
the basis of their HIV status? If so, list
the employment policies/practices
so reviewed.
The HIV/AIDS and TB Management Policy has been reviewed and
approved by the Director-General.
6. Has the department introduced
measures to protect HIV-positive
employees or those perceived to be
HIV-positive from discrimination?
If so, list the key elements of these
measures.
Confidentiality clauses have been in place and are still enforced.
New infections are managed by the Primary Health Care personnel.

248
PART D: HUMAN RESOURCE MANAGEMENT - Continued
QUESTION YES NO DETAILS, IF YES
7. Does the department encourage
its employees to undergo Voluntary
Counselling and Testing? If so,
list the results that you have you
achieved.
122 employees voluntarily tested for HIV/AIDS during the financial year. The department has a clinic on-site providing primary health care services. The clinic is occupied by a nurse twice a week, for four hours on each day, and a doctor one day a week. The services are free and provide employees with an opportunity to do voluntary testing. In addition to this, the Siyaphila programme hosts wellness events where employees also have the opportunity to do voluntary counselling and testing.
8. Has the department developed
measures/ indicators to monitor and
evaluate the impact of its health
promotion programme? If so, list
these measures/indicators.
Rate of absenteeism.
Number of health-related complaints.
Voluntary HIV/AIDS reports (that do not compromise
confidentiality).
Wellness cards to continuously monitor and improve on health risk
assessments.
Quarterly and annual utilisation statistics of services (reach – one
new employee, as well as utilisation including repeat users of
numerous contact points).
3.12. LABOUR RELATIONS
Table 3.12.1 Collective agreements for the period 1 April 2018 to 31 March 2019
SUBJECT MATTER DATE
None N/A
Table 3.12.2 Misconduct and disciplinary hearings finalised for the period 1 April 2018 to 31 March 2019
OUTCOMES OF DISCIPLINARY HEARINGS NUMBER % OF TOTAL
Dismissal 3 60
Not guilty 1 20
Three (3) months suspension without pay 1 20
Total 5 100
3. HUMAN RESOURCES OVERSIGHT STATISTICS

249
PART D: HUMAN RESOURCE MANAGEMENT - Continued
3. HUMAN RESOURCES OVERSIGHT STATISTICS
Table 3.12.3 Types of misconduct addressed at disciplinary hearings for the period 1 April 2018 to 31 March 2019
TYPE OF MISCONDUCT NUMBER % OF TOTAL
Assault 1 14.3
Refusal to sign performance agreement and insubordination 1 14.3
Absenteeism 1 14.3
Submission of fraudulent documents 2 28.5
Abuse of the state vehicle 1 14.3
Poor work performance 1 14.3
Total 7 100
Table 3.12.4 Grievances lodged for the period 1 April 2018 to 31 March 2019
GRIEVANCES NUMBER % OF TOTAL
Number of grievances resolved 6 54
Number of grievances not resolved 5 46
Total number of grievances lodged 11 100
Table 3.12.5 Disputes lodged with Councils for the period 1 April 2018 to 31 March 2019
DISPUTES NUMBER % OF TOTAL
Number of disputes upheld 0 0
Number of disputes dismissed 1 11.1
Number of disputes pending 7 78
Number of disputes lodged 1 11.1
Total number of disputes lodged 9 100
Table 3.12.6 Strike actions for the period 1 April 2018 to 31 March 2019
Total number of persons working days lost 0
Total cost of working days lost 0
Amount recovered as a result of no work no pay (R’000) 0

250
PART D: HUMAN RESOURCE MANAGEMENT - Continued
Table 3.12.7 Precautionary suspensions for the period 1 April 2018 to 31 March 2019
Number of people suspended 4
Number of people whose suspension exceeded 30 days 4
Average number of days suspended 608
Cost of suspensions 1 634 964.28
3.13. SKILLS DEVELOPMENT
Table 3.13.1 Training needs identified as at 31 March 2018
OCCUPATIONAL CATEGORY
GENDER NUMBER OFEMPLOYEES
AS AT 31 MARCH
2018
TRAINING NEEDS IDENTIFIED AT START OFTHE REPORTING PERIOD
LEARNERSHIPS SKILLS PROGRAMMES
AND OTHER SHORT COURSES
OTHER FORMS OF TRAINING
TOTAL
Legislators, senior
officials and
managers
Female 137 0 67 0 67
Male 153 0 72 0 72
Professionals Female 269 13 136 0 149
Male 236 15 134 0 149
Technicians
and associated
professionals
Female 136 0 52 0 52
Male 44 0 24 0 24
Clerks Female 81 0 78 36 114
Male 29 0 38 24 62
Service and sales
workers
Female 11 0 10 0 10
Male 18 0 3 0 3
Skilled agriculture
and fishery
workers
Female 0 0 0 0 0
Male 0 0 0 0 0
Craft and related
trades workers
Female 0 0 0 0 0
Male 0 0 0 0 0
3. HUMAN RESOURCES OVERSIGHT STATISTICS

251
PART D: HUMAN RESOURCE MANAGEMENT - Continued
OCCUPATIONAL CATEGORY
GENDER NUMBER OFEMPLOYEES
AS AT 31 MARCH
2018
TRAINING NEEDS IDENTIFIED AT START OFTHE REPORTING PERIOD
LEARNERSHIPS SKILLS PROGRAMMES
AND OTHER SHORT COURSES
OTHER FORMS OF TRAINING
TOTAL
Skilled agriculture Female 0 0 0 0 0
Male 0 0 0 0 0
Craft and related
trades workers
Female 0 0 0 0 0
Male 0 0 0 0 0
Plant and
machine
operators and
assemblers
Female 0 0 0 0 0
Male 1 0 0 0 0
Elementary
occupations
Female 5 0 3 0 3
Male 8 0 0 0 0
Subtotal Female 639 13 346 36 395
Male 489 15 271 24 310
Total 1 128 28 617 60 705
** Note: Minister and Deputy Minister not included in total.
3. HUMAN RESOURCES OVERSIGHT STATISTICS
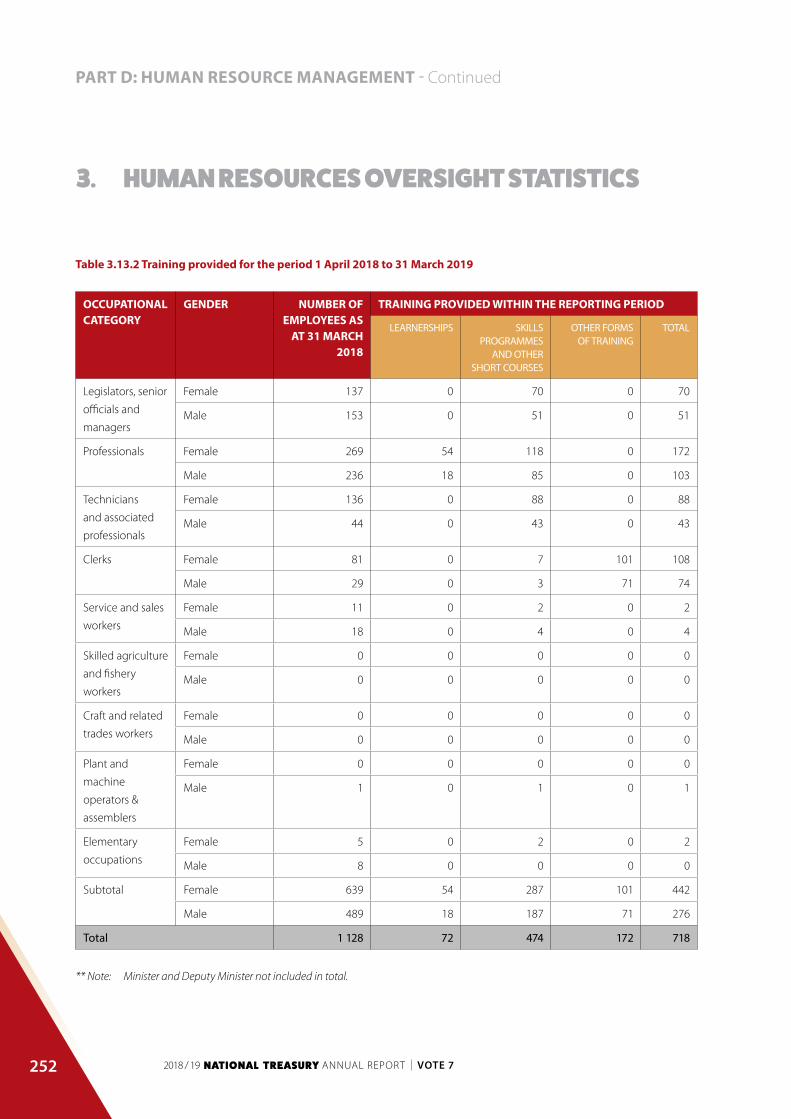
252
PART D: HUMAN RESOURCE MANAGEMENT - Continued
Table 3.13.2 Training provided for the period 1 April 2018 to 31 March 2019
OCCUPATIONAL CATEGORY
GENDER NUMBER OF EMPLOYEES AS
AT 31 MARCH 2018
TRAINING PROVIDED WITHIN THE REPORTING PERIOD
LEARNERSHIPS SKILLS PROGRAMMES
AND OTHER SHORT COURSES
OTHER FORMS OF TRAINING
TOTAL
Legislators, senior
officials and
managers
Female 137 0 70 0 70
Male 153 0 51 0 51
Professionals Female 269 54 118 0 172
Male 236 18 85 0 103
Technicians
and associated
professionals
Female 136 0 88 0 88
Male 44 0 43 0 43
Clerks Female 81 0 7 101 108
Male 29 0 3 71 74
Service and sales
workers
Female 11 0 2 0 2
Male 18 0 4 0 4
Skilled agriculture
and fishery
workers
Female 0 0 0 0 0
Male 0 0 0 0 0
Craft and related
trades workers
Female 0 0 0 0 0
Male 0 0 0 0 0
Plant and
machine
operators &
assemblers
Female 0 0 0 0 0
Male 1 0 1 0 1
Elementary
occupations
Female 5 0 2 0 2
Male 8 0 0 0 0
Subtotal Female 639 54 287 101 442
Male 489 18 187 71 276
Total 1 128 72 474 172 718
** Note: Minister and Deputy Minister not included in total.
3. HUMAN RESOURCES OVERSIGHT STATISTICS

253
PART D: HUMAN RESOURCE MANAGEMENT - Continued
3.14. INJURY ON DUTY
Table 3.14.1 Injuries on duty for the period 1 April 2018 to 31 March 2019
NATURE OF INJURY ON DUTY NUMBER % OF TOTAL
Required basic medical attention only 7 100
Temporary total disablement 0 0
Permanent disablement 0 0
Fatal 0 0
Total 7 100
3.15. UTILISATION OF CONSULTANTS
The following tables relates information on the utilisation of consultants in the department. In terms of the Public Service Regulations
“consultant’ means a natural or juristic person or a partnership who or which provides in terms of a specific contract on an ad hoc
basis any of the following professional services to a department against remuneration received from any source:
(a) The rendering of expert advice;
(b) The drafting of proposals for the execution of specific tasks; and
(c) The execution of a specific task which is of a technical or intellectual nature, but excludes an employee of a department.
3. HUMAN RESOURCES OVERSIGHT STATISTICS

254
PART D: HUMAN RESOURCE MANAGEMENT - Continued
Table 3.15.1 Report on consultant appointments using appropriated funds for the period 1 April 2018 to 31 March 2019
PROJECT TITLE TOTAL NUMBER OF CONSULTANTS THAT WORKED ON PROJECT
DURATION (WORK DAYS)
CONTRACT VALUE IN RAND
Eighty Twenty
Consulting
Not specified 3 years 487 806.00
Cool Ideas EOI005-2017: Appointment of a service provider for
the development of standard operating procedures
(SOPS) manuals; the design and development of the
training support materials for the long-term advisors
(LTA) and the technical advisors (TAS) to build financial
management capacity in municipalities for the period
of 12 months.
1 year 3 236 400.00
H&P IT Empowerment
(Pty) Ltd
RFO030-2017: Appointment of a service provider(s) for
the development of a three-day high level outcomes
based non-credit bearing asset management learning
programme on training material for the health sector
for a period of four (4) months
4 months 485 640.00
Sekela Xabiso RFQ011-2017: Appointment of a service provider to
provide support pertaining to the implementation of
chapter 13 of the MFMA
1 year 758 459.71
Deloitte & Touche RFQ011-2017: Appointment of a service provider
to provide technical support pertaining to the
implementation of chapter 13 of the MFMA
8 months Panel appointment,
only utilised on a
need basis
PricewaterhouseCoopers RFQ011-2017: Appointment of a service provider
to provide technical support pertaining to the
implementation of chapter 13 of the MFMA
11 months Panel appointment,
only utilised on a
need basis
Infinitum Software
Solutions (Pty)Ltd
NT011-2017: Appointment of a service provider for
data mining, cleaning, categorisation, integration,
visualisation, reporting tool and services to the office
of the Chief Procurement Officer, for the period of 12
months
1 year 4 200 000.00
3. HUMAN RESOURCES OVERSIGHT STATISTICS

255
PART D: HUMAN RESOURCE MANAGEMENT - Continued
Table 3.15.2 Report on consultant appointments using Donor funds for the period 1 April 2018 to 31 March 2019
PROJECT TITLE TOTAL NUMBER OF CONSULTANTS THAT WORKED ON PROJECT
DURATION (WORK DAYS)
DONOR AND CONTRACT VALUE IN RAND
Cool Ideas EOI005-2017: Appointment of a service provider for
the development of standard operating procedures
(SOPS) manuals; the design and development of the
training support materials for the long-term advisors
(LTA) and the technical advisors (TAS) to build
financial management capacity in municipalities for
the period of 12 months.
1 year 3 236 400.00
H&P IT Empowerment
(Pty) Ltd
RFO030-2017: Appointment of a service provider(s)
for the development of a three-day high-level
outcomes based non-credit bearing asset
management learning programme training on
material for the health sector for a period of four (4)
months
4 months 485 640.00
Table 3.15.3 Analysis of consultant appointments using Donor funds, in terms of Historically Disadvantaged Individuals (HDIs) for the period 1 April 2018 to 31 March 2019
PROJECT TITLE PERCENTAGE OWNERSHIP BY HDI
GROUPS
PERCENTAGE MANAGEMENT BY HDI
GROUPS
NUMBER OF CONSULTANTS FROM
HDI GROUPS THAT WORK ON
THE PROJECT
Development Co-operation
Management Information System
(DCMIS)
1 0 2
3. HUMAN RESOURCES OVERSIGHT STATISTICS

256
PART D: HUMAN RESOURCE MANAGEMENT - Continued
3.16. SEVERANCE PACKAGES
Table 3.16.1 Granting of employee-initiated severance packages for the period 1 April 2018 to 31 March 2019
SALARY BAND NUMBER OF APPLICATIONS
RECEIVED
NUMBER OF APPLICATIONS
REFERRED TO THEMPSA
NUMBER OF APPLICATIONS
SUPPORTED BY THEMPSA
NUMBER OF PACKAGES
APPROVED BY DEPARTMENT
Lower skilled (Levels
1-2)
0 0 0 0
Skilled (Levels 3-5) 0 0 0 0
Highly skilled
production (Levels 6-8)
0 0 0 0
Highly skilled
supervision (Levels
9-12)
0 0 0 0
Senior management
(Levels 13-16)
0 0 0 0
Total 0 0 0 0
3. HUMAN RESOURCES OVERSIGHT STATISTICS

NATIONAL TREASURYANNUAL REPORT
PART E:FINANCIAL INFORMATION

NATIONAL TREASURYANNUAL REPORT
TABLE OF CONTENTS
PART E:ANNUAL FINANCIAL STATEMENTS
1. REPORT OF THE AUDITOR-GENERAL TO PARLIAMENT ON VOTE NO. 7 NATIONAL TREASURY ..........................................................................................................................................................259
2. APPROPRIATION STATEMENT ...................................................................................................................268
3. NOTES TO THE APPROPRIATION STATEMENT ....................................................................................321
4. STATEMENT OF FINANCIAL PERFORMANCE ......................................................................................326
5. STATEMENT OF FINANCIAL POSITION ..................................................................................................327
6. STATEMENT OF CHANGES IN NET ASSETS ..........................................................................................328
7. CASH FLOW STATEMENT .............................................................................................................................329
8. NOTES TO THE ANNUAL FINANCIAL STATEMENTS (INCLUDING ACCOUNTING POLICIES) ..................................................................................................330
9. ANNEXURES ......................................................................................................................................................376

259
PART E: FINANCIAL INFORMATION - Continued
REPORT OF THE AUDITOR-GENERAL TO PARLIAMENT ON VOTE NO.7 NATIONAL TREASURY
REPORT ON THE AUDIT OF THE FINANCIAL STATEMENTS
OPINION
1. I have audited the financial statements of the National Treasury set out on pages 268 to 375 which comprise the appropriation
statement, the statement of financial position as at 31 March 2019, the statement of financial performance, statement of
changes in net assets and cash flow statement for the year then ended, as well as the notes to the financial statements,
including a summary of significant accounting policies.
2. In my opinion, the financial statements present fairly, in all material respects, the financial position of the National Treasury as
at 31 March 2019, and its financial performance and cash flows for the year then ended in accordance with the Modified Cash
Standard (MCS) as prescribed by the National Treasury and the requirements of the Public Finance Management Act of South
Africa, 1999 (Act No. 1 of 1999) (PFMA) and the Division of Revenue Act of South Africa, 2018 (Act No.1 of 2018) (DoRA).
BASIS FOR OPINION
3. I conducted my audit in accordance with the International Standards on Auditing (ISAs). My responsibilities under those
standards are further described in the auditor-general’s responsibilities for the audit of the financial statements section of this
auditor’s report.
4. I am independent of the department in accordance with sections 290 and 291 of the International Ethics Standards Board for
Accountants’ Code of ethics for professional accountants (IESBA code), parts 1 and 3 of the International Ethics Standards Board
for Accountants’ International Code of Ethics for Professional Accountants (including International Independence Standards)
and the ethical requirements that are relevant to my audit in South Africa. I have fulfilled my other ethical responsibilities in
accordance with these requirements and the IESBA codes.
5. I believe that the audit evidence I have obtained is sufficient and appropriate to provide a basis for my unqualified audit
opinion.
EMPHASIS OF MATTERS
6. I draw attention to the matters below. My opinion is not modified in respect of these matters.
Irregular expenditure
7. As disclosed in note 25 to the financial statements, the department incurred irregular expenditure of R466 million, as a result
of non-compliance with applicable procurement legislation.

260
Fruitless and wasteful expenditure
8. As disclosed in note 26 to the financial statements, the department incurred fruitless and wasteful expenditure of R66 million,
as payments were made for which no services were received.
Restatement of corresponding figures
9. As disclosed in note 38 to the financial statements, the corresponding figures for 31 March 2018 were restated as a result of
errors in the financial statements of the department at, and for the year ended, 31 March 2019.
OTHER MATTER
10. I draw attention to the matter below. My opinion is not modified in respect of this matter.
Unaudited supplementary schedules
11. The supplementary information set out on pages 376 to 435 does not form part of the financial statements and is presented
as additional information. I have not audited these schedules and, accordingly, I do not express an opinion on it.
RESPONSIBILITIES OF THE ACCOUNTING OFFICER FOR THE FINANCIAL STATEMENTS
12. The accounting officer is responsible for the preparation and fair presentation of the financial statements in accordance with
the MCS and the requirements of the PFMA and DoRA, and for such internal control as the accounting officer determines is
necessary to enable the preparation of financial statements that are free from material misstatement, whether due to fraud
or error.
13. In preparing the financial statements, the accounting officer is responsible for assessing the National Treasury’s ability to
continue as a going concern, disclosing, as applicable, matters relating to going concern and using the going concern basis of
accounting unless the appropriate governance structure either intends to liquidate the department or to cease operations, or
has no realistic alternative but to do so.
REPORT OF THE AUDITOR-GENERAL TO PARLIAMENT ON VOTE NO.7 NATIONAL TREASURY
PART E: FINANCIAL INFORMATION - Continued

261
AUDITOR-GENERAL’S RESPONSIBILITIES FOR THE AUDIT OF THE FINANCIAL STATEMENTS
14. My objectives are to obtain reasonable assurance about whether the financial statements as a whole are free from material
misstatement, whether due to fraud or error, and to issue an auditor’s report that includes my opinion. Reasonable assurance
is a high level of assurance, but is not a guarantee that an audit conducted in accordance with the ISAs will always detect a
material misstatement when it exists. Misstatements can arise from fraud or error and are considered material if, individually
or in aggregate, they could reasonably be expected to influence the economic decisions of users taken on the basis of these
financial statements.
15. A further description of my responsibilities for the audit of the financial statements is included in the annexure to this auditor’s
report.
REPORT ON THE AUDIT OF THE ANNUAL PERFORMANCE REPORT
INTRODUCTION AND SCOPE
16. In accordance with the Public Audit Act of South Africa, 2004 (Act No. 25 of 2004) (PAA) and the general notice issued in terms
thereof, I have a responsibility to report material findings on the reported performance information against predetermined
objectives for selected programmes presented in the annual performance report. I performed procedures to identify findings
but not to gather evidence to express assurance.
17. My procedures address the reported performance information, which must be based on the approved performance planning
documents of the department. I have not evaluated the completeness and appropriateness of the performance indicators
included in the planning documents. My procedures also did not extend to any disclosures or assertions relating to planned
performance strategies and information in respect of future periods that may be included as part of the reported performance
information. Accordingly, my findings do not extend to these matters.
18. I evaluated the usefulness and reliability of the reported performance information in accordance with the criteria developed
from the performance management and reporting framework, as defined in the general notice, for the following selected
programmes presented in the annual performance report of the department for the year ended 31 March 2019:
Programmes Pages in the Annual Performance Report
Programme 2 – Economic Policy,Tax, Financial Regulation and Research 85 – 90
Programme 8 – Technical and Management Support and Development Finance 174 – 178
REPORT OF THE AUDITOR-GENERAL TO PARLIAMENT ON VOTE NO.7 NATIONAL TREASURY
PART E: FINANCIAL INFORMATION - Continued

262
19. I performed procedures to determine whether the reported performance information was properly presented and whether
performance was consistent with the approved performance planning documents. I performed further procedures to
determine whether the indicators and related targets were measurable and relevant, and assessed the reliability of the reported
performance information to determine whether it was valid, accurate and complete.
20. The material findings in respect of the reliability of the selected programmes are as follows:
PROGRAMME 2 - ECONOMIC POLICY, TAX, FINANCIAL REGULATION AND RESEARCH
21. I was unable to obtain sufficient appropriate audit evidence for the reported achievements of these targets. This was due to limitations placed on the scope of my work to substantiate the completeness of the reported achievements of the targets. I was unable to confirm the reported achievements by alternative means. Consequently, I was unable to determine whether any
adjustments were required to the reported achievements in the annual performance report of the indicators listed below:
Indicator Target Actual
2.1.1 Number of papers published in association with academic research institutions 50 50
2.4.5 Percentage response to users’ requests for economic research and policy
analysis, and assessments of government policy proposals
100% 100%
2.4.6 Percentage response to user requests for policy and scenario modelling 100% 100%
2.4.7 Percentage response to user requests for commentaries on economic data 100% 100%
PROGRAMME 8 - TECHNICAL AND MANAGEMENT SUPPORT AND DEVELOPMENT FINANCE
8.1.5 NUMBER OF PERFORMANCE AND EXPENDITURE REVIEWS SUPPORTED
22. I was unable to obtain sufficient appropriate audit evidence for the reported achievement of 5 performance and expenditure
reviews supported. This was due to limitations placed on the scope of my work to substantiate the completeness of the
reported achievement of the target. I was unable to confirm the reported achievement by alternative means. Consequently,
I was unable to determine whether any adjustments were required to the achievement of 5 performance and expenditure
reviews supported, as reported in the annual performance report.
OTHER MATTERS
23. I draw attention to the matters below.
REPORT OF THE AUDITOR-GENERAL TO PARLIAMENT ON VOTE NO.7 NATIONAL TREASURY
PART E: FINANCIAL INFORMATION - Continued
263
ACHIEVEMENT OF PLANNED TARGETS
24. Refer to the annual performance report on pages 72 to 180 for information on the achievement of planned targets for the year
and explanations provided for the under/ over achievement of a number of targets. This information should be considered in
the context of the material findings on the usefulness and reliability of the reported performance information in paragraphs 21
and 22 of this report.
ADJUSTMENT OF MATERIAL MISSTATEMENTS
25. I identified material misstatements in the annual performance report submitted for auditing. These material misstatements
were on the reported performance information of Programme 2 - Economic Policy, Tax, Financial Regulation and Research and
Programme 8 - Technical and Management Support and Development Finance. As management subsequently corrected only
some of the misstatements, I raised material findings on the reliability of the reported performance information. Those that
were not corrected are reported in paragraph 21 and 22 above.
REPORT ON THE AUDIT OF COMPLIANCE WITH LEGISLATION
INTRODUCTION AND SCOPE
26. In accordance with the PAA and the general notice issued in terms thereof, I have a responsibility to report material findings on
the compliance of the department with specific matters in key legislation. I performed procedures to identify findings but not
to gather evidence to express assurance.
27. The material findings on compliance with specific matters in key legislation are as follows:
ANNUAL FINANCIAL STATEMENTS
28. The financial statements submitted for auditing were not prepared in accordance with the prescribed financial reporting
framework as required by section 40(1) (b) of the PFMA. Material misstatements of disclosure items identified by the auditors
in the submitted financial statements were corrected, resulting in the financial statements receiving an unqualified opinion.
PROCUREMENT AND CONTRACT MANAGEMENT
29. Some of the goods and services with a transaction value above R500 000 were procured without inviting competitive bids
and deviations were approved by the accounting officer but it was practical to invite competitive bids, as required by treasury
regulations 16A6.1 and 16A6.4. Similar non-compliance was reported in the prior year.
REPORT OF THE AUDITOR-GENERAL TO PARLIAMENT ON VOTE NO.7 NATIONAL TREASURY
PART E: FINANCIAL INFORMATION - Continued
264
30. Some of the competitive bids were adjudicated by a bid adjudication committee that was not composed in accordance
with the policies of the department, as required by treasury regulation 16A6.2 (a), (b) and (c). This non-compliance related to
transversal contracts facilitated by the department.
31. Some of the contracts were awarded to bidders based on preference points that were not allocated and/or calculated in
accordance with the requirements of the Preferential Procurement Policy Framework Act and its regulations. This non-compliance
related to transversal contracts facilitated by the department. Similar non-compliance was reported in the prior year.
32. Some of the contracts were awarded to bidders based on pre-qualification criteria that is in contravention of preferential
procurement regulation 4(1) and 4(2) of 2017. This non-compliance also relates to transversal contracts facilitated by the
department.
33. Tender requirements for some of the contracts above R30 million did not include a condition for mandatory subcontracting to
advance designated groups, as required by the preferential procurement regulation 9(1) of 2017.
34. Some contracts were extended or modified without the approval of a properly delegated official as required by section 44 of
the PFMA and treasury regulation 8.1 and 8.2.
EXPENDITURE MANAGEMENT
35. Effective and appropriate steps were not taken to prevent irregular expenditure amounting to R466 million, as disclosed in
note 25 to the annual financial statements, as required by section 38(1)(c)(ii) of the PFMA and treasury regulation 9.1.1. The
majority of the irregular expenditure was caused by non-compliance with supply chain management processes.
36. Effective steps were not taken to prevent fruitless and wasteful expenditure amounting to R66 million, as disclosed in note 26
to the annual financial statements, as required by section 38(1)(c)(ii) of the PFMA and treasury regulation 9.1.1. The fruitless and
wasteful expenditure was incurred on the Integrated Financial Management System (IFMS 2) project.
OTHER INFORMATION
37. The accounting officer is responsible for the other information. The other information comprises the information included in
the annual report. The other information does not include the financial statements, the auditor’s report and those selected
programmes presented in the annual performance report that have been specifically reported in this auditor’s report.
38. My opinion on the financial statements, findings on the reported performance information and compliance with legislation do
not cover the other information and I do not express an audit opinion or any form of assurance conclusion thereon.
REPORT OF THE AUDITOR-GENERAL TO PARLIAMENT ON VOTE NO.7 NATIONAL TREASURY
PART E: FINANCIAL INFORMATION - Continued

265
39. In connection with my audit, my responsibility is to read the other information and, in doing so, consider whether the other
information is materially inconsistent with the financial statements and the selected programmes presented in the annual
performance report, or my knowledge obtained in the audit, or otherwise appears to be materially misstated.
40. I did not receive the other information prior to the date of this auditor’s report. When I do receive and read this information,
if I conclude that there is a material misstatement therein, I am required to communicate the matter to those charged with
governance and request that the other information be corrected. If the other information is not corrected, I may have to retract
this auditor’s report and re-issue an amended report as appropriate. However, if it is corrected this will not be necessary.
INTERNAL CONTROL DEFICIENCIES
41. I considered internal control relevant to my audit of the financial statements, reported performance information and compliance
with applicable legislation; however, my objective was not to express any form of assurance on it. The matters reported below
are limited to the significant internal control deficiencies that resulted in the findings on the annual performance report and
the findings on compliance with legislation included in this report.
42. Instability in key leadership positions had a significant impact on the performance of the department and contributed towards
the decline in internal control.
43. An audit action plan was developed and a committee was established to monitor the implementation of the action plan to
address internal and external audit findings. However, repeat findings were identified in the financial statements as well as
non-compliance with applicable legislation.
44. A lack of a formal business case, proper project management and inadequate budget monitoring relating to the IFMS
programme may result in failure to deliver the overall quality solution on time and with the funds allocated. The vacancies in
key positions within the IFMS programme may also cause delays in delivering the required solution timeously.
45. Effective systems of internal control and the management thereof had not been implemented to ensure accurate and
complete financial statements. The preparation and review of the financial statements were not adequately planned, to
ensure a comprehensive review of year-end adjustments and reconciliations, resulting in errors and omissions identified by
the auditors.
46. The quality of the annual performance report requires improvement as significant audit findings were raised on the reliability
of performance indicators and targets. This was as a result of management not being able to substantiate the completeness of
the actual performance reported for a number of indicators and targets.
47. The reviewing of compliance with applicable legislation remains a challenge for the department especially in the areas of
supply chain management and the prevention of irregular and fruitless and wasteful expenditure.
REPORT OF THE AUDITOR-GENERAL TO PARLIAMENT ON VOTE NO.7 NATIONAL TREASURY
PART E: FINANCIAL INFORMATION - Continued

266
48. The internal audit unit did not respond to the needs of the department in finalising and reporting on a significant matter within
the required time and an investigation memorandum completed was not finalised with due care. The financial statements,
reviewed by the internal audit unit, contained a number of material misstatements that had not been identified.
OTHER REPORTS
49. I draw attention to the following engagements conducted by various parties that had, or could have, an impact on the matters
reported in the department’s financial statements, reported performance information, compliance with applicable legislation
and other related matters. These reports did not form part of my opinion on the financial statements or my findings on the
reported performance information or compliance with legislation.
50. The audit committee instituted a forensic investigation into IFMS 2 focusing on the procurement processes followed,
appointments of, and payments made, to service providers. The investigation was concluded and the forensic report was
shared with the audit committee. The department is in the process of implementing the outcome of the investigation.
Pretoria
07 September 2019
REPORT OF THE AUDITOR-GENERAL TO PARLIAMENT ON VOTE NO.7 NATIONAL TREASURY
PART E: FINANCIAL INFORMATION - Continued

267
ANNEXURE - AUDITOR-GENERAL'S RESPONSIBILITY FOR THE AUDIT
1. As part of an audit in accordance with the ISAs, I exercise professional judgement and maintain professional scepticism
throughout my audit of the financial statements, and the procedures performed on reported performance information for
selected programmes and on the departments’s compliance with respect to the selected subject matters.
FINANCIAL STATEMENTS
2. In addition to my responsibility for the audit of the financial statements as described in this auditor’s report, I also:
• identify and assess the risks of material misstatement of the financial statements whether due to fraud or error, design and
perform audit procedures responsive to those risks, and obtain audit evidence that is sufficient and appropriate to provide a
basis for my opinion. The risk of not detecting a material misstatement resulting from fraud is higher than for one resulting from
error, as fraud may involve collusion, forgery, intentional omissions, misrepresentations, or the override of internal control
• obtain an understanding of internal control relevant to the audit in order to design audit procedures that are appropriate in the
circumstances, but not for the purpose of expressing an opinion on the effectiveness of the departments’s internal control
• evaluate the appropriateness of accounting policies used and the reasonableness of accounting estimates and related
disclosures made by the accounting officer
• conclude on the appropriateness of the accounting officer’s use of the going concern basis of accounting in the preparation of
the financial statements. I also conclude, based on the audit evidence obtained, whether a material uncertainty exists related
to events or conditions that may cast significant doubt on the National Treasury ability to continue as a going concern. If I
conclude that a material uncertainty exists, I am required to draw attention in my auditor’s report to the related disclosures in
the financial statements about the material uncertainty or, if such disclosures are inadequate, to modify the opinion on the
financial statements. My conclusions are based on the information available to me at the date of this auditor’s report. However,
future events or conditions may cause a department to cease continuing as a going concern
• evaluate the overall presentation, structure and content of the financial statements, including the disclosures, and whether the
financial statements represent the underlying transactions and events in a manner that achieves fair presentation
COMMUNICATION WITH THOSE CHARGED WITH GOVERNANCE
1. I communicate with the accounting officer regarding, among other matters, the planned scope and timing of the audit and
significant audit findings, including any significant deficiencies in internal control that I identify during my audit.
2. I also confirm to the accounting officer that I have complied with relevant ethical requirements regarding independence, and
communicate all relationships and other matters that may reasonably be thought to have a bearing on my independence and,
where applicable, related safeguards
PART E: FINANCIAL INFORMATION - Continued

268
PART E: FINANCIAL INFORMATION - Continuedfor the year ended 31 March 2019
APPROPRIATION STATEMENT
App
ropr
iatio
n pe
r pro
gram
me
Vote
d fu
nds
2018
/19
2017
/18
Adju
sted
Ap
prop
riatio
nSh
iftin
g of
Fu
nds
Vire
men
tFi
nal
Appr
opria
tion
Actu
al
Expe
nditu
reVa
rianc
eEx
pend
iture
as
% o
f fina
l ap
prop
riatio
n
Fina
l Ap
prop
riatio
nAc
tual
Ex
pend
iture
R’00
0R’
000
R’00
0R’
000
R’00
0R’
000
%R’
000
R’00
0
PRO
GRA
MM
E
1Ad
min
istra
tion
473,
819
-(2
0,00
0)45
3,81
942
4,27
429
,545
93.5
%44
5,62
043
7,86
9
2Ec
onom
ic P
olic
y, Ta
x,
Fina
ncia
l Reg
ulat
ion
and
Rese
arch
152,
770
--
152,
770
138,
756
14,0
1490
.8%
163,
991
151,
860
3Pu
blic
Fin
ance
and
Budg
et M
anag
emen
t
298,
047
--
298,
047
295,
370
2,67
799
.1%
302,
296
288,
635
4As
set a
nd L
iabi
lity
Man
agem
ent
101,
585
--
101,
585
91,1
8510
,400
89.8
%10
,100
,312
10,0
89,7
61
5Fi
nanc
ial A
ccou
ntin
g
and
Supp
ly C
hain
Man
agem
ent S
yste
ms
1,19
4,14
8-
(92,
063)
1,10
2,08
586
9,10
423
2,98
178
.9%
1,00
0,84
688
5,83
3
6In
tern
atio
nal F
inan
cial
Rela
tions
5,54
2,77
6-
340,
345
5,88
3,12
15,
807,
686
75,4
3598
.7%
5,94
0,68
95,
469,
838
7Ci
vil a
nd M
ilita
ry
Pens
ions
, Con
trib
utio
ns
to F
unds
and
Oth
er
Bene
fits
5,16
3,79
6-
(142
,519
)5,
021,
277
5,02
0,10
01,
177
100.
0%4,
648,
202
4,61
8,08
8
8Te
chni
cal S
uppo
rt a
nd
Dev
elop
men
t Fin
ance
3,01
2,54
2-
(85,
763)
2,92
6,77
92,
235,
067
691,
712
76.4
%2,
558,
513
2,52
6,35
0
9Re
venu
e
Adm
inist
ratio
n
9,00
7,21
7-
-9,
007,
217
9,00
7,21
7-
100.
0%10
,218
,198
10,2
18,1
98
10Fi
nanc
ial I
ntel
ligen
ce
and
Stat
e Se
curit
y
4,76
3,53
3-
-4,
763,
533
4,76
3,53
3-
100.
0%5,
105,
639
5,10
5,63
9
TO
TAL
29,7
10,2
33-
-29
,710
,233
28,6
52,2
921,
057,9
4196
.4%
40,4
84,3
0639
,792
,071
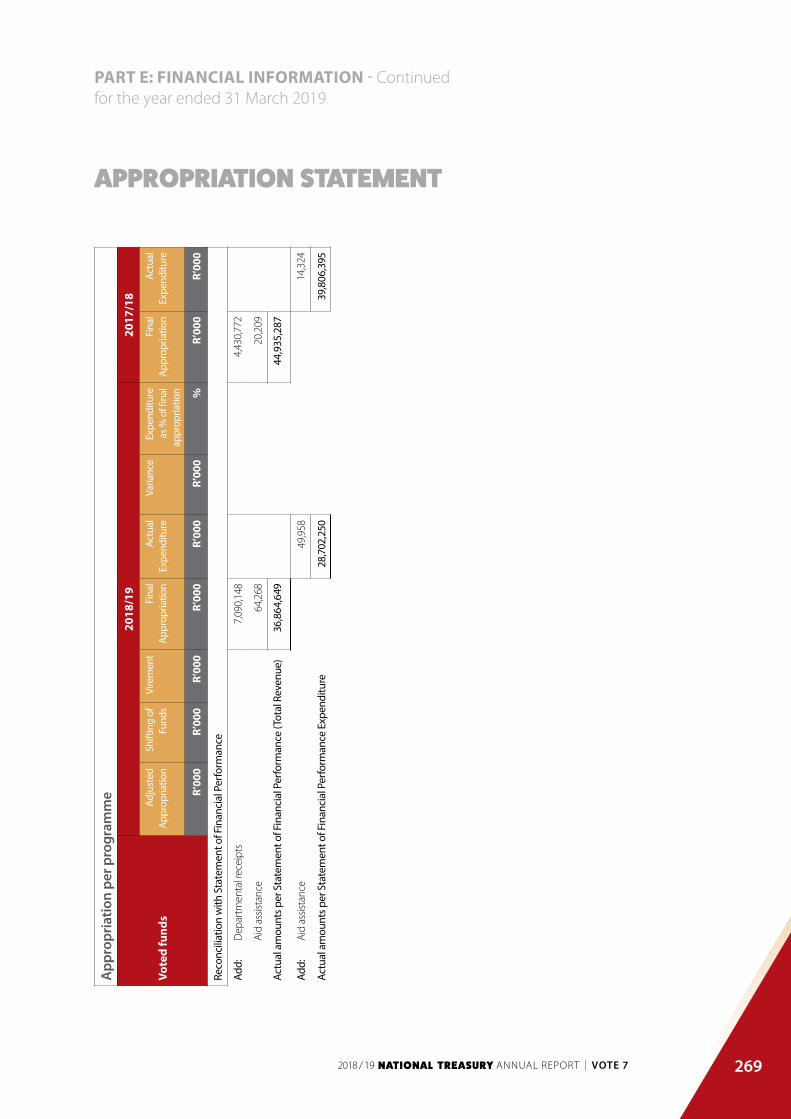
269
PART E: FINANCIAL INFORMATION - Continuedfor the year ended 31 March 2019
APPROPRIATION STATEMENT
App
ropr
iatio
n pe
r pro
gram
me
Vote
d fu
nds
2018
/19
2017
/18
Adju
sted
Ap
prop
riatio
nSh
iftin
g of
Fu
nds
Vire
men
tFi
nal
Appr
opria
tion
Actu
al
Expe
nditu
reVa
rianc
eEx
pend
iture
as
% o
f fina
l ap
prop
riatio
n
Fina
l Ap
prop
riatio
nAc
tual
Ex
pend
iture
R’00
0R’
000
R’00
0R’
000
R’00
0R’
000
%R’
000
R’00
0
Reco
ncili
atio
n w
ith S
tate
men
t of F
inan
cial
Per
form
ance
Add:
Dep
artm
enta
l rec
eipt
s
7,0
90,1
48
4,
430,
772
A
id a
ssist
ance
64,
268
20
,209
Actu
al a
mou
nts p
er S
tate
men
t of F
inan
cial
Per
form
ance
(Tot
al R
even
ue)
36,8
64,6
49
44
,935
,287
Add:
A
id a
ssist
ance
49
,958
14,3
24
Actu
al a
mou
nts p
er S
tate
men
t of F
inan
cial
Per
form
ance
Exp
endi
ture
28
,702
,250
39,8
06,3
95

270
PART E: FINANCIAL INFORMATION - Continuedfor the year ended 31 March 2019
APPROPRIATION STATEMENT
APP
ROPR
IATI
ON
PER
ECO
NO
MIC
CLA
SSIF
ICAT
ION
2018
/19
2017
/18
Adju
sted
Ap
prop
riatio
nSh
iftin
g of
Fun
dsVi
rem
ent
Fina
l Ap
prop
riatio
nAc
tual
Ex
pend
iture
Varia
nce
Expe
nditu
re
as %
of fi
nal
appr
opria
tion
Fina
l Ap
prop
riatio
nAc
tual
Ex
pend
iture
R’00
0R’
000
R’00
0R’
000
R’00
0R’
000
%R’
000
R’00
0
Cu
rren
t pay
men
ts2,
898,
466
(36,
211)
(107
,063
)2,
755,1
922,
071,
255
683,
937
75.2
%2,
097,5
001,
925,
051
Com
pens
atio
n of
em
ploy
ees
807,7
60-
-80
7,760
790,
344
17,4
1697
.8%
823,
276
803,
732
Sa
larie
s and
wag
es71
7,64
23,
547
-72
1,25
670
7,50
413
,752
98.1
%73
8,33
072
1,54
1
So
cial
con
trib
utio
ns90
,118
(3,5
47)
-86
,504
82,8
403,
664
95.7
%84
,947
82,1
92
G
oods
and
serv
ices
2,09
0,70
6(3
6,21
1)(1
07,0
63)
1,94
7,432
1,28
0,91
166
6,52
165
.8%
1,27
4,22
41,1
21,3
19
Ad
min
istra
tive
fees
6,45
31,
728
-8,
181
7,16
61,
015
87.6
%6,
776
5,90
0
Ad
vert
ising
2,41
7(4
92)
-1,
925
1,37
055
571
.3%
1,14
083
2
M
inor
ass
ets
4,80
6(4
,272
)-
534
343
191
63.9
%73
344
8
Au
dit c
osts
: Ext
erna
l15
,163
1,63
7-
16,8
0016
,113
687
95.9
%19
,008
16,3
94
Bu
rsar
ies:
Empl
oyee
s6,
997
(1,5
30)
-5,
467
4,33
01,
137
79.2
%6,
809
5,69
9
Ca
terin
g: D
epar
tmen
tal
activ
ities
2,11
3(2
42)
-1,
871
1,28
558
668
.7%
1,87
51,
099
Co
mm
unic
atio
n (G
&S)
8,44
9(1
99)
-8,
250
7,10
01,
150
86.1
%8,
566
7,75
8
Co
mpu
ter s
ervi
ces
610,
725
(15,
858)
-59
4,86
739
0,50
120
4,36
665
.6%
394,
540
380,
744
Co
nsul
tant
s: Bu
sines
s and
advi
sory
serv
ices
780,
052
(21,
381)
(93,
063)
665,
608
628,
839
36,7
6994
.5%
599,
388
482,
047
In
frast
ruct
ure
and
plan
ning
serv
ices
400,
000
80-
400,
080
7240
0,00
80.
0%65
64
Le
gal s
ervi
ces
19,3
04(3
24)
-18
,980
13,9
065,
074
73.3
%15
,959
15,2
85
Co
ntra
ctor
s15
,613
6,33
3-
21,9
4620
,880
1,06
695
.1%
14,6
2814
,466
Ag
ency
and
supp
ort /
outs
ourc
ed se
rvic
es7,
137
115
-7,
252
6,73
252
092
.8%
7,57
27,
032
En
tert
ainm
ent
517
(66)
-45
190
361
20.0
%46
884
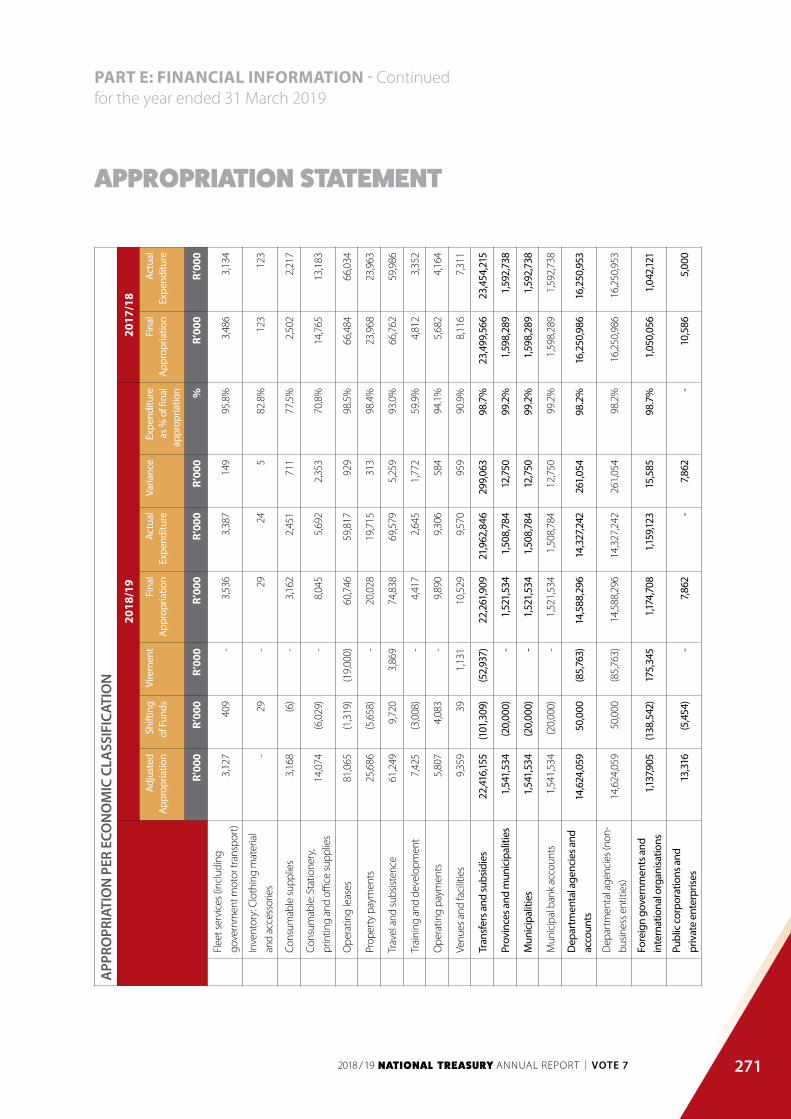
271
PART E: FINANCIAL INFORMATION - Continuedfor the year ended 31 March 2019
APPROPRIATION STATEMENT
APP
ROPR
IATI
ON
PER
ECO
NO
MIC
CLA
SSIF
ICAT
ION
2018
/19
2017
/18
Adju
sted
Ap
prop
riatio
nSh
iftin
g of
Fun
dsVi
rem
ent
Fina
l Ap
prop
riatio
nAc
tual
Ex
pend
iture
Varia
nce
Expe
nditu
re
as %
of fi
nal
appr
opria
tion
Fina
l Ap
prop
riatio
nAc
tual
Ex
pend
iture
R’00
0R’
000
R’00
0R’
000
R’00
0R’
000
%R’
000
R’00
0
Fl
eet s
ervi
ces (
incl
udin
g
gove
rnm
ent m
otor
tran
spor
t)3,
127
409
-3,
536
3,38
714
995
.8%
3,48
63,
134
In
vent
ory:
Clo
thin
g m
ater
ial
and
acce
ssor
ies
-29
-29
245
82.8
%12
312
3
Co
nsum
able
supp
lies
3,16
8(6
)-
3,16
22,
451
711
77.5
%2,
502
2,21
7
Co
nsum
able
: Sta
tione
ry,
prin
ting
and
office
supp
lies
14,0
74(6
,029
)-
8,04
55,
692
2,35
370
.8%
14,7
6513
,183
O
pera
ting
leas
es81
,065
(1,3
19)
(19,
000)
60,7
4659
,817
929
98.5
%66
,484
66,0
34
Pr
oper
ty p
aym
ents
25,6
86(5
,658
)-
20,0
2819
,715
313
98.4
%23
,968
23,9
63
Tr
avel
and
subs
isten
ce61
,249
9,72
03,
869
74,8
3869
,579
5,25
993
.0%
66,7
6259
,986
Tr
aini
ng a
nd d
evel
opm
ent
7,42
5(3
,008
)-
4,41
72,
645
1,77
259
.9%
4,81
23,
352
O
pera
ting
paym
ents
5,80
74,
083
-9,
890
9,30
658
494
.1%
5,68
24,
164
Ve
nues
and
faci
litie
s9,
359
391,
131
10,5
299,
570
959
90.9
%8,
116
7,31
1
Tr
ansf
ers a
nd su
bsid
ies
22,4
16,15
5(1
01,3
09)
(52,
937)
22,2
61,9
0921
,962
,846
299,
063
98.7
%23
,499
,566
23,4
54,2
15
Pr
ovin
ces a
nd m
unic
ipal
ities
1,54
1,53
4(2
0,00
0)-
1,52
1,53
41,
508,
784
12,7
5099
.2%
1,59
8,28
91,
592,
738
M
unic
ipal
ities
1,54
1,53
4(2
0,00
0)-
1,52
1,53
41,
508,
784
12,7
5099
.2%
1,59
8,28
91,
592,
738
M
unic
ipal
ban
k ac
coun
ts1,
541,
534
(20,
000)
-1,
521,
534
1,50
8,78
412
,750
99.2
%1,
598,
289
1,59
2,73
8
D
epar
tmen
tal a
genc
ies a
nd
acco
unts
14,6
24,0
5950
,000
(85,
763)
14,5
88,2
9614
,327
,242
261,
054
98.2
%16
,250
,986
16,2
50,9
53
D
epar
tmen
tal a
genc
ies (
non-
busin
ess e
ntiti
es)
14,6
24,0
5950
,000
(85,
763)
14,5
88,2
9614
,327
,242
261,
054
98.2
%16
,250
,986
16,2
50,9
53
Fo
reig
n go
vern
men
ts a
nd
inte
rnat
iona
l org
anisa
tions
1,137
,905
(138
,542
)17
5,34
51,1
74,7
081,1
59,12
315
,585
98.7
%1,
050,
056
1,04
2,12
1
Pu
blic
corp
orat
ions
and
pr
ivat
e en
terp
rises
13,3
16(5
,454
)-
7,862
-7,8
62-
10,5
865,
000

272
PART E: FINANCIAL INFORMATION - Continuedfor the year ended 31 March 2019
APPROPRIATION STATEMENT
APP
ROPR
IATI
ON
PER
ECO
NO
MIC
CLA
SSIF
ICAT
ION
2018
/19
2017
/18
Adju
sted
Ap
prop
riatio
nSh
iftin
g of
Fun
dsVi
rem
ent
Fina
l Ap
prop
riatio
nAc
tual
Ex
pend
iture
Varia
nce
Expe
nditu
re
as %
of fi
nal
appr
opria
tion
Fina
l Ap
prop
riatio
nAc
tual
Ex
pend
iture
R’00
0R’
000
R’00
0R’
000
R’00
0R’
000
%R’
000
R’00
0
Pr
ivat
e en
terp
rises
13,3
16(5
,454
)-
7,86
2-
7,86
2-
10,5
865,
000
O
ther
tran
sfer
s to
priv
ate
ente
rpris
es13
,316
(5,4
54)
-7,
862
-7,
862
-10
,586
5,00
0
H
ouse
hold
s5,
099,
341
12,6
87(1
42,5
19)
4,96
9,50
94,
967,6
941,
815
100.
0%4,
589,
649
4,56
3,40
3
So
cial
ben
efits
5,09
7,55
911
,384
(142
,519
)4,
966,
424
4,96
4,74
41,
680
100.
0%4,
586,
353
4,56
0,53
4
O
ther
tran
sfer
s to
hous
ehol
ds1,
782
1,30
3-
3,08
52,
950
135
95.6
%3,
296
2,86
9
Pa
ymen
ts fo
r cap
ital a
sset
s42
,605
520
-43
,125
23,4
4819
,677
54.4
%39
,824
27,0
38
M
achi
nery
and
equ
ipm
ent
31,8
484,
020
-35
,868
20,4
6615
,402
57.1%
35,2
1026
,997
Tr
ansp
ort e
quip
men
t1,
830
--
1,83
01,
733
9794
.7%
1,16
990
7
O
ther
mac
hine
ry a
nd
equi
pmen
t30
,018
4,02
0-
34,0
3818
,733
15,3
0555
.0%
34,0
4126
,090
So
ftwar
e an
d ot
her
inta
ngib
le a
sset
s10
,757
(3,5
00)
-7,
257
2,98
24,
275
41.1
%4,
614
41
Pa
ymen
t for
fina
ncia
l ass
ets
4,35
3,00
713
7,000
160,
000
4,65
0,00
74,
594,
743
55,2
6498
.8%
14,8
47,4
1714
,385
,767
T
OTA
L29
,710
,233
--
29,7
10,2
3328
,652
,292
1,05
7,941
96.4
%40
,484
,306
39,7
92,0
71

273
PART E: FINANCIAL INFORMATION - Continuedfor the year ended 31 March 2019
APPROPRIATION STATEMENT
PRO
GRA
MM
E 1:
AD
MIN
ISTR
ATIO
N P
ER S
UBP
ROG
RAM
ME
SU
BPRO
GRA
MM
E20
18/1
920
17/1
8
Adju
sted
Ap
prop
riatio
nSh
iftin
g of
Fund
s
Vire
men
tFi
nal
Appr
opria
tion
Actu
al
Expe
nditu
reVa
rianc
eEx
pend
iture
as
% o
f fina
l ap
prop
riatio
n
Fina
l Ap
prop
riatio
nAc
tual
Ex
pend
iture
R’00
0R’
000
R’00
0R’
000
R’00
0R’
000
%R’
000
R’00
0
SUBP
ROG
RAM
ME
MIN
ISTR
Y4,
859
(200
)-
4,65
93,
692
967
79.2
%4,
555
3,76
8
DEP
ARTM
ENTA
L M
ANAG
EMEN
T49
,104
3,61
0-
52,7
1451
,055
1,65
996
.9%
71,2
0170
,136
CORP
ORA
TE S
ERVI
CES
145,
771
(4,8
11)
(1,0
00)
139,
960
126,
410
13,5
5090
.3%
120,
568
117,
542
ENTE
RPRI
SE W
IDE
RISK
MAN
AGEM
ENT
31,7
5036
-31
,786
29,3
182,
468
92.2
%28
,703
28,3
01
FIN
ANCI
AL A
DM
INIS
TRAT
ION
43,6
741,
668
-45
,342
43,3
971,
945
95.7
%41
,993
41,4
90
LEG
AL S
ERVI
CES
22,5
93(6
9)-
22,5
2422
,297
227
99.0
%22
,059
22,0
35
INTE
RNAL
AU
DIT
30,8
664,
026
-34
,892
32,1
822,
710
92.2
%24
,520
24,0
50
COM
MU
NIC
ATIO
NS
11,2
29(2
69)
-10
,960
9,68
11,
279
88.3
%12
,779
12,4
57
OFF
ICE
ACCO
MM
OD
ATIO
N13
3,97
3(3
,991
)(1
9,00
0)11
0,98
210
6,24
24,
740
95.7
%11
9,24
211
8,09
0
TO
TAL
473,
819
-(2
0,00
0)45
3,81
942
4,27
429
,545
93.5
%44
5,62
043
7,869

274
PART E: FINANCIAL INFORMATION - Continuedfor the year ended 31 March 2019
APPROPRIATION STATEMENT
PRO
GRA
MM
E 1:
AD
MIN
ISTR
ATIO
N P
ER S
UBP
ROG
RAM
ME
SU
BPRO
GRA
MM
E20
18/1
920
17/1
8
Adju
sted
Ap
prop
riatio
nSh
iftin
g of
Fund
s
Vire
men
tFi
nal
Appr
opria
tion
Actu
al
Expe
nditu
reVa
rianc
eEx
pend
iture
as
% o
f fina
l ap
prop
riatio
n
Fina
l Ap
prop
riatio
nAc
tual
Ex
pend
iture
R’00
0R’
000
R’00
0R’
000
R’00
0R’
000
%R’
000
R’00
0
ECO
NO
MIC
CLA
SSIF
ICAT
ION
R’00
0R’
000
R’00
0R’
000
R’00
0R’
000
%R’
000
R’00
0
Curr
ent p
aym
ents
439,
469
(807
)(2
0,00
0)41
8,66
240
2,39
416
,268
96.1%
427,8
8042
1,119
Com
pens
atio
n of
em
ploy
ees
195,
903
-(1
,000
)19
4,90
319
0,83
74,
066
97.9
%20
7,152
203,
028
Sala
ries a
nd w
ages
173,
475
(18)
(1,0
00)
172,
524
170,
061
2,51
898
.5%
185,
745
181,
955
Soci
al c
ontr
ibut
ions
22,4
2818
-22
,379
20,7
761,
548
93.1
%21
,407
21,0
73
Goo
ds a
nd se
rvic
es24
3,56
6(8
07)
(190
00)
223,
759
211,
557
12,2
0294
.5%
220,
728
218,
091
Adm
inist
rativ
e fe
es2,
271
158
-2,
429
2,08
434
585
.8%
2,95
12,
681
Adve
rtisi
ng71
2(2
88)
-42
420
921
549
.3%
351
319
Min
or a
sset
s4,
562
(4,2
93)
-26
918
089
66.9
%19
314
9
Audi
t cos
ts: E
xter
nal
8,40
555
0-
8,95
58,
952
310
0.0%
10,0
7510
,074
Burs
arie
s: Em
ploy
ees
2,33
2(5
65)
-1,
767
1,49
727
084
.7%
1,29
01,
248
Cate
ring:
Dep
artm
enta
l act
iviti
es55
618
-57
438
918
567
.8%
571
413
Com
mun
icat
ion
(G&S
)7,
797
(276
)-
7,52
16,
636
885
88.2
%5,
677
5,45
5
Com
pute
r ser
vice
s32
,825
(2,3
77)
-30
,448
28,1
482,
300
92.4
%27
,990
27,9
45
Cons
ulta
nts:
Busin
ess a
nd a
dviso
ry
serv
ices
11,4
162,
691
-14
,107
12,3
041,
804
87.2
%7,
835
7,77
2
Infra
stru
ctur
e an
d pl
anni
ng se
rvic
es-
80-
8072
890
.0%
6564
Lega
l ser
vice
s14
,304
(744
)-
13,5
6013
,487
7399
.5%
14,3
0814
,308
Cont
ract
ors
15,4
485,
600
-21
,048
20,2
1483
496
.0%
14,4
5614
,370
Cont
ract
ors
7,03
921
3-
7,25
26,
732
520
92.8
%7,
562
7,03
2
Ente
rtai
nmen
t15
1 3
- 15
4 38
11
6 24
.7%
136
30

275
PART E: FINANCIAL INFORMATION - Continuedfor the year ended 31 March 2019
APPROPRIATION STATEMENT
PRO
GRA
MM
E 1:
AD
MIN
ISTR
ATIO
N P
ER S
UBP
ROG
RAM
ME
SU
BPRO
GRA
MM
E20
18/1
920
17/1
8
Adju
sted
Ap
prop
riatio
nSh
iftin
g of
Fund
s
Vire
men
tFi
nal
Appr
opria
tion
Actu
al
Expe
nditu
reVa
rianc
eEx
pend
iture
as
% o
f fina
l ap
prop
riatio
n
Fina
l Ap
prop
riatio
nAc
tual
Ex
pend
iture
R’00
0R’
000
R’00
0R’
000
R’00
0R’
000
%R’
000
R’00
0
Flee
t ser
vice
s (in
clud
ing
gove
rnm
ent
mot
or tr
ansp
ort)
3,08
8 40
3 -
3,49
1 3,
387
104
97.0
%3,
408
3,11
7
Inve
ntor
y: C
loth
ing
mat
eria
l and
acce
ssor
ies
- 29
-
29
24
5 82
.8%
123
123
Cons
umab
le su
pplie
s2,
481
352
- 2,
833
2,21
8 61
5 78
.3%
1,94
2 1,
869
Cons
umab
le: S
tatio
nery
, prin
ting
and
office
supp
lies
3,12
7 (1
97)
- 2,
930
1,81
5 1,
115
62.0
%2,
323
2,09
0
Ope
ratin
g le
ases
78,6
02
(1,2
82)
(19,
000)
58,3
20
57,7
02
618
98.9
%63
,759
63
,709
Prop
erty
pay
men
ts25
,686
(5
,658
)-
20,0
28
19,7
15
313
98.4
%23
,968
23
,963
Trav
el a
nd su
bsist
ence
18,3
75
6,08
3 -
24,4
58
23,5
93
865
96.5
%28
,842
28
,633
Trai
ning
and
dev
elop
men
t3,
130
(1,1
74)
- 1,
956
1,30
2 65
4 66
.6%
1,83
7 1,
729
Ope
ratin
g pa
ymen
ts99
6 (3
70)
- 62
6 45
8 16
8 73
.2%
846
779
Venu
es a
nd fa
cilit
ies
263
237
-50
040
199
80.2
%22
021
9
Tran
sfer
s and
subs
idie
s7,1
37
807
- 7,9
44
7,283
66
1 91
.6%
7,909
7,3
28
Dep
artm
enta
l age
ncie
s and
acc
ount
s2,
120
- -
2,12
0 2,
078
42
97.9
%2,
080
2,04
7
Dep
artm
enta
l age
ncie
s (no
n-bu
sines
s
entit
ies)
2,12
0-
-2,
120
2,07
545
97.9
%2,
080
2,04
7
Hou
seho
lds
5,01
780
7-
5,82
45,
208
616
89.4
%5,
829
5,28
1
Soci
al b
enefi
ts3,
235
807
-4,
042
3,55
648
688
.0%
4,02
93,
908
Oth
er tr
ansf
ers t
o ho
useh
olds
1,78
2-
-1,
782
1,65
213
092
.7%
1,80
01,
373
Paym
ents
for c
apita
l ass
ets
27,2
13-
-27
,213
13,8
8613
,327
51.0
%9,
831
9,33
3
Mac
hine
ry a
nd e
quip
men
t17
,154
--
20,6
5411
,529
9,125
55.8
%9,
541
9,32
7
Tran
spor
t equ
ipm
ent
1,83
0-
-1,
830
1,73
397
94.7
%91
090
7
Oth
er m
achi
nery
and
equ
ipm
ent
15,3
243,
500
-18
,824
9,79
69,
028
52.0
%8,
631
8,42
0

276
PART E: FINANCIAL INFORMATION - Continuedfor the year ended 31 March 2019
APPROPRIATION STATEMENT
PRO
GRA
MM
E 1:
AD
MIN
ISTR
ATIO
N P
ER S
UBP
ROG
RAM
ME
SU
BPRO
GRA
MM
E20
18/1
920
17/1
8
Adju
sted
Ap
prop
riatio
nSh
iftin
g of
Fund
s
Vire
men
tFi
nal
Appr
opria
tion
Actu
al
Expe
nditu
reVa
rianc
eEx
pend
iture
as
% o
f fina
l ap
prop
riatio
n
Fina
l Ap
prop
riatio
nAc
tual
Ex
pend
iture
R’00
0R’
000
R’00
0R’
000
R’00
0R’
000
%R’
000
R’00
0
Softw
are
and
othe
r int
angi
ble
asse
ts10
,059
(3,5
00)
-6,
559
2,35
74,
202
35.9
%29
06
Paym
ent f
or fi
nanc
ial a
sset
s-
--
-71
1(7
11)
--
89
Tota
l47
3,81
9-
(20,
000)
453,
819
424,
274
29,5
4593
.5%
445,
620
437,8
69
SUBP
ROG
RAM
ME:
1.1
: MIN
ISTR
Y
2018
/19
2017
/18
Adju
sted
Ap
prop
riatio
nSh
iftin
g of
Fund
s
Vire
men
tFi
nal
Appr
opria
tion
Actu
al
Expe
nditu
reVa
rianc
eEx
pend
iture
as
% o
f fina
l ap
prop
riatio
n
Fina
l Ap
prop
riatio
nAc
tual
Ex
pend
iture
ECO
NO
MIC
CLA
SSIF
ICAT
ION
R’
000
R’00
0R’
000
R’00
0R’
000
R’00
0%
R’00
0R’
000
Curr
ent p
aym
ents
4,85
9(2
00)
-4,
659
3,69
296
779
.2%
4,55
53,
768
Com
pens
atio
n of
em
ploy
ees
4,85
9(2
00)
-4,
659
3,69
296
779
.2%
4,55
53,
768
Tota
l 4,
859
(200
)-
4,65
93,
692
967
79.2
%4,
555
3,76
8

277
PART E: FINANCIAL INFORMATION - Continuedfor the year ended 31 March 2019
APPROPRIATION STATEMENT
SUBP
ROG
RAM
ME:
1.2
: DEP
ART
MEN
TAL
MA
NAG
EMEN
T
2018
/19
2017
/18
Adju
sted
Ap
prop
riatio
nSh
iftin
g of
Fund
s
Vire
men
tFi
nal
Appr
opria
tion
Actu
al
Expe
nditu
reVa
rianc
eEx
pend
iture
as
% o
f fina
l ap
prop
riatio
n
Fina
l Ap
prop
riatio
nAc
tual
Ex
pend
iture
ECO
NO
MIC
CLA
SSIF
ICAT
ION
R’
000
R’00
0R’
000
R’00
0R’
000
R’00
0%
R’00
0R’
000
Curr
ent p
aym
ents
43,4
613,
610
-47
,071
45,4
421,
629
96.5
%66
,079
65,0
87
Com
pens
atio
n of
em
ploy
ees
22,0
99(1
,000
)-
21,0
9920
,744
355
98.3
%34
,559
33,8
73
Goo
ds a
nd se
rvic
es21
,362
4,61
0-
25,9
7224
,698
1,27
495
.1%
31,5
2031
,214
Tran
sfer
s and
subs
idie
s3,
200
--
3,20
03,
059
141
95.6
%3,
373
3,31
7
Hou
seho
lds
3,20
0-
-3,
200
3,05
914
195
.6%
3,37
33,
317
Paym
ents
for c
apita
l ass
ets
2,44
3-
-2,
443
2,17
926
489
.2%
1,74
91,
732
Build
ings
and
oth
er fi
xed
stru
ctur
es-
--
--
--
--
Mac
hine
ry a
nd e
quip
men
t2,
443
--
2,44
32,
179
264
89.2
%1,
749
1,73
2
Paym
ent f
or fi
nanc
ial a
sset
s-
--
-37
5(3
75)
--
-
Tota
l49
,104
3,61
0-
52,7
1451
,055
1,65
996
.9%
71,2
0170
,136

278
PART E: FINANCIAL INFORMATION - Continuedfor the year ended 31 March 2019
APPROPRIATION STATEMENT
SUBP
ROG
RAM
ME:
1.3
: CO
RPO
RATE
SER
VICE
S
2018
/19
2017
/18
Adju
sted
Ap
prop
riatio
nSh
iftin
g of
Fund
s
Vire
men
tFi
nal
Appr
opria
tion
Actu
al
Expe
nditu
reVa
rianc
eEx
pend
iture
as
% o
f fina
l ap
prop
riatio
n
Fina
l Ap
prop
riatio
nAc
tual
Ex
pend
iture
ECO
NO
MIC
CLA
SSIF
ICAT
ION
R’
000
R’00
0R’
000
R’00
0R’
000
R’00
0%
R’00
0R’
000
Curr
ent p
aym
ents
120,
979
(4,9
19)
(1,0
00)
115,
060
110,
816
4,24
496
.3%
114,
387
111,
971
Com
pens
atio
n of
em
ploy
ees
80,2
38(1
,925
)(1
,000
)77
,313
75,8
931,
420
98.2
%79
,201
77,1
72
Goo
ds a
nd se
rvic
es40
,741
(2,9
94)
-37
,747
36,0
541,
693
95.5
%35
,186
34,7
99
Tran
sfer
s and
subs
idie
s3,
917
261
-4,
178
4001
177
95.7
%4,
353
3,84
1
Dep
artm
enta
l age
ncie
s and
acc
ount
s2,
100
--
2,10
02,
060
4098
.0%
2,06
12,
038
Hou
seho
lds
1,81
726
1-
2,07
81,
941
137
93.4
%2,
292
1,80
3
Paym
ents
for c
apita
l ass
ets
20,8
75(1
53)
-20
,722
10,4
6210
,260
50.5
%1,
828
1,72
5
Mac
hine
ry a
nd e
quip
men
t10
,816
3,34
7-
14,1
638,
238
9,12
535
.6%
1,82
21,
719
Softw
are
and
othe
r int
angi
ble
asse
ts10
,059
(3,5
00)
6,55
92,
224
1,13
582
.7%
66
Paym
ent f
or fi
nanc
ial a
sset
s-
--
--
--
5
Tota
l 14
5,77
1(4
,811
)(1
,000
)13
9,96
012
6,41
013
,550
90.3
%12
0,56
811
7,542
SUBP
ROG
RAM
ME:
1.4
: EN
TERP
RISE
WID
E RI
SK M
AN
AGEM
ENT
20
18/1
920
17/1
8
Adju
sted
Ap
prop
riatio
nSh
iftin
g of
Fund
s
Vire
men
tFi
nal
Appr
opria
tion
Actu
al
Expe
nditu
reVa
rianc
eEx
pend
iture
as
% o
f fina
l ap
prop
riatio
n
Fina
l Ap
prop
riatio
nAc
tual
Ex
pend
iture
ECO
NO
MIC
CLA
SSIF
ICAT
ION
R’
000
R’00
0R’
000
R’00
0R’
000
R’00
0%
R’00
0R’
000
Curr
ent p
aym
ents
29,8
3676
6-
30,6
0228
,793
1,80
994
.1%28
,664
28,2
65
Com
pens
atio
n of
em
ploy
ees
18,1
3179
0-
18,9
2118
,300
621
96.7
%18
,360
18,0
77
Goo
ds a
nd se
rvic
es11
,705
(24)
-11
,681
10,4
931,
188
89.8
%10
,304
10,1
88
Tran
sfer
s and
subs
idie
s-
30-
3030
-10
0.0%
1313
Hou
seho
lds
-30
-30
30-
100.
0%13
13
Paym
ents
for c
apita
l ass
ets
1,91
4(7
60)
-1,1
5449
565
942
.9%
2623
Mac
hine
ry a
nd e
quip
men
t1,
914
(760
)-
1,15
449
565
942
.9%
2623
Tota
l 31
,750
36-
31,7
8629
,318
2,46
892
.2%
28,7
0328
,301
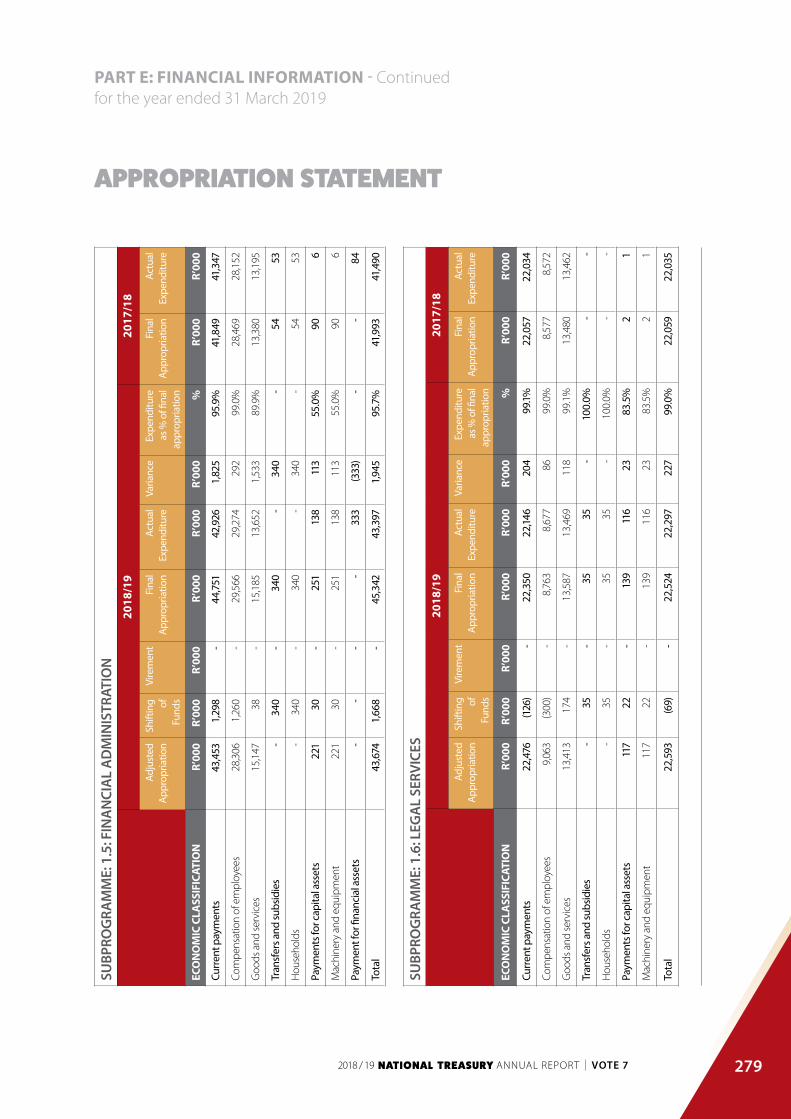
279
PART E: FINANCIAL INFORMATION - Continuedfor the year ended 31 March 2019
APPROPRIATION STATEMENT
SUBP
ROG
RAM
ME:
1.5
: FIN
AN
CIA
L A
DM
INIS
TRAT
ION
20
18/1
920
17/1
8
Adju
sted
Ap
prop
riatio
nSh
iftin
g of
Fund
s
Vire
men
tFi
nal
Appr
opria
tion
Actu
al
Expe
nditu
reVa
rianc
eEx
pend
iture
as
% o
f fina
l ap
prop
riatio
n
Fina
l Ap
prop
riatio
nAc
tual
Ex
pend
iture
ECO
NO
MIC
CLA
SSIF
ICAT
ION
R’
000
R’00
0R’
000
R’00
0R’
000
R’00
0%
R’00
0R’
000
Curr
ent p
aym
ents
43,4
531,
298
-44
,751
42,9
261,
825
95.9
%41
,849
41,3
47
Com
pens
atio
n of
em
ploy
ees
28,3
061,
260
-29
,566
29,2
7429
299
.0%
28,4
6928
,152
Goo
ds a
nd se
rvic
es15
,147
38-
15,1
8513
,652
1,53
389
.9%
13,3
8013
,195
Tran
sfer
s and
subs
idie
s-
340
-34
0-
340
-54
53
Hou
seho
lds
-34
0-
340
-34
0-
5453
Paym
ents
for c
apita
l ass
ets
221
30-
251
138
113
55.0
%90
6
Mac
hine
ry a
nd e
quip
men
t22
130
-25
113
811
355
.0%
906
Paym
ent f
or fi
nanc
ial a
sset
s-
--
-33
3(3
33)
--
84
Tota
l 43
,674
1,66
8-
45,3
4243
,397
1,94
595
.7%
41,9
9341
,490
SUBP
ROG
RAM
ME:
1.6
: LEG
AL
SERV
ICES
20
18/1
920
17/1
8
Adju
sted
Ap
prop
riatio
nSh
iftin
g of
Fund
s
Vire
men
tFi
nal
Appr
opria
tion
Actu
al
Expe
nditu
reVa
rianc
eEx
pend
iture
as
% o
f fina
l ap
prop
riatio
n
Fina
l Ap
prop
riatio
nAc
tual
Ex
pend
iture
ECO
NO
MIC
CLA
SSIF
ICAT
ION
R’
000
R’00
0R’
000
R’00
0R’
000
R’00
0%
R’00
0R’
000
Curr
ent p
aym
ents
22,4
76(1
26)
-22
,350
22,14
620
499
.1%22
,057
22,0
34
Com
pens
atio
n of
em
ploy
ees
9,06
3(3
00)
-8,
763
8,67
786
99.0
%8,
577
8,57
2
Goo
ds a
nd se
rvic
es13
,413
174
-13
,587
13,4
6911
899
.1%
13,4
8013
,462
Tran
sfer
s and
subs
idie
s-
35-
3535
-10
0.0%
--
Hou
seho
lds
-35
-35
35-
100.
0%-
-
Paym
ents
for c
apita
l ass
ets
117
22-
139
116
2383
.5%
21
Mac
hine
ry a
nd e
quip
men
t11
722
-13
911
623
83.5
%2
1
Tota
l 22
,593
(69)
-22
,524
22,2
9722
799
.0%
22,0
5922
,035

280
PART E: FINANCIAL INFORMATION - Continuedfor the year ended 31 March 2019
APPROPRIATION STATEMENT
SUBP
ROG
RAM
ME:
1.7
: IN
TERN
AL
AUD
IT
2018
/19
2017
/18
Adju
sted
Ap
prop
riatio
nSh
iftin
g of
Fund
s
Vire
men
tFi
nal
Appr
opria
tion
Actu
al
Expe
nditu
reVa
rianc
eEx
pend
iture
as
% o
f fina
l ap
prop
riatio
n
Fina
l Ap
prop
riatio
nAc
tual
Ex
pend
iture
ECO
NO
MIC
CLA
SSIF
ICAT
ION
R’
000
R’00
0R’
000
R’00
0R’
000
R’00
0%
R’00
0R’
000
Curr
ent p
aym
ents
30,6
193,
945
-34
,564
31,9
112,
653
92.3
%23
,960
23,7
76
Com
pens
atio
n of
em
ploy
ees
18,8
1151
9-
19,3
3019
,262
6899
.6%
17,5
5417
,545
Goo
ds a
nd se
rvic
es11
,808
3,42
6-
15,2
3412
,649
2,58
583
.0%
6,40
66,
231
Tran
sfer
s and
subs
idie
s-
77-
7777
-10
0.0%
3029
Hou
seho
lds
-77
-77
77-
100.
0%30
29
Paym
ents
for c
apita
l ass
ets
247
4-
251
194
5777
.3%
530
245
Mac
hine
ry a
nd e
quip
men
t24
74
-25
119
457
77.3
%24
624
5
Tota
l 30
,866
4,02
6-
34,8
9232
,182
2,71
092
.2%
24,5
2024
,050
SUBP
ROG
RAM
ME:
1.8
: CO
MM
UN
ICAT
ION
S
20
18/1
920
17/1
8
Adju
sted
Ap
prop
riatio
nSh
iftin
g of
Fund
s
Vire
men
tFi
nal
Appr
opria
tion
Actu
al
Expe
nditu
reVa
rianc
eEx
pend
iture
as
% o
f fina
l ap
prop
riatio
n
Fina
l Ap
prop
riatio
nAc
tual
Ex
pend
iture
ECO
NO
MIC
CLA
SSIF
ICAT
ION
R’
000
R’00
0R’
000
R’00
0R’
000
R’00
0%
R’00
0R’
000
Curr
ent p
aym
ents
10,9
54(6
52)
-10
,302
9,39
790
591
.2%
12,5
4512
,229
Com
pens
atio
n of
em
ploy
ees
6,22
235
2-
6,57
46,
527
4799
.3%
7,38
77,
383
Goo
ds a
nd se
rvic
es4,
732
(1,0
04)
-3,
728
2,87
085
877
.0%
5,15
84,
846
Tran
sfer
s and
subs
idie
s-
26-
2626
-10
0.0%
1918
Hou
seho
lds
-26
-26
26-
100.
0%19
18
Paym
ents
for c
apita
l ass
ets
275
357
-63
225
837
440
.8%
215
210
Mac
hine
ry a
nd e
quip
men
t27
535
7-
632
125
374
40.8
%21
521
0
Softw
are
and
othe
r int
angi
ble
asse
ts13
3(1
33)
--
-
Tota
l 11
,229
(269
)-
10,9
609,
681
1,27
988
.3%
12,7
7912
,457

281
PART E: FINANCIAL INFORMATION - Continuedfor the year ended 31 March 2019
APPROPRIATION STATEMENT
SUBP
ROG
RAM
ME:
1.9
: OFF
ICE
ACCO
MM
OD
ATIO
N
2018
/19
2017
/18
Adju
sted
Ap
prop
riatio
nSh
iftin
g of
Fund
s
Vire
men
tFi
nal
Appr
opria
tion
Actu
al
Expe
nditu
reVa
rianc
eEx
pend
iture
as
% o
f fina
l ap
prop
riatio
n
Fina
l Ap
prop
riatio
nAc
tual
Ex
pend
iture
ECO
NO
MIC
CLA
SSIF
ICAT
ION
R’
000
R’00
0R’
000
R’00
0R’
000
R’00
0%
R’00
0R’
000
Curr
ent p
aym
ents
132,
832
(4,5
29)
(19,
000)
109,
303
106,
140
3,16
397
.1%11
3,78
411
2,64
2
Com
pens
atio
n of
em
ploy
ees
8,17
450
4-
8,67
88,
468
210
97.6
%8,
490
8,48
6
Goo
ds a
nd se
rvic
es12
4,65
8(5
,033
)(1
9,00
0)10
0,62
597
,672
2,95
397
.1%
105,
294
104,
156
Tran
sfer
s and
subs
idie
s20
38-
5855
394
.8%
6757
Dep
artm
enta
l age
ncie
s and
acc
ount
s20
--
2018
290
.0%
199
Hou
seho
lds
-38
-38
371
97.4
%48
48
Paym
ents
for c
apita
l ass
ets
1,121
500
-1,
621
441,
577
2.7%
5,39
15,
391
Mac
hine
ry a
nd e
quip
men
t1,
121
500
-1,
621
441,
577
2.7%
5,39
15,
391
Paym
ent f
or fi
nanc
ial a
sset
s-
3(3
)-
-
Tota
l 13
3,97
3(3
,991
)(1
9,00
0)11
0,98
210
6,24
24,
740
95.7
%11
9,24
211
8,09
0

282
PART E: FINANCIAL INFORMATION - Continuedfor the year ended 31 March 2019
APPROPRIATION STATEMENT
PRO
GRA
MM
E 2:
ECO
NO
MIC
PO
LICY
, TAX
, FIN
AN
CIA
L RE
GU
LATI
ON
AN
D R
ESEA
RCH
2018
/19
2017
/18
Adju
sted
Ap
prop
riatio
nSh
iftin
g of
Fund
s
Vire
men
tFi
nal
Appr
opria
tion
Actu
al
Expe
nditu
reVa
rianc
eEx
pend
iture
as
% o
f fina
l ap
prop
riatio
n
Fina
l Ap
prop
riatio
nAc
tual
Ex
pend
iture
R’00
0R’
000
R’00
0R’
000
R’00
0R’
000
%R’
000
R’00
0
SUB-
PRO
GRA
MM
E
1PR
OG
RAM
ME
MAN
AGEM
ENT
FOR
ECO
NO
MIC
PO
LICY
, TAX
,
FIN
ANCI
AL R
EGU
LATI
ON
AN
D
RESE
ARCH
52,8
36(5
04)
-52
,332
44,4
177,
915
84.9
%50
,207
43,5
59
2RE
SEAR
CH-
--
--
--
10,8
2710
,827
3FI
NAN
CIAL
SEC
TOR
POLI
CY23
,607
232
-23
,839
21,5
742,
265
90.5
%27
,214
24,8
51
4TA
X PO
LICY
30,0
681,
243
-31
,311
30,9
4236
998
.8%
30,3
8128
,621
5EC
ON
OM
IC P
OLI
CY26
,376
(971
)-
25,4
0521
,940
3,46
586
.4%
26,0
8824
,727
6CO
OPE
RATI
VE B
ANKS
DEV
ELO
PMEN
T AG
ENCY
19,8
83-
-19
,883
19,8
83-
100.
0%19
,275
19,2
75
TOTA
L15
2,77
0-
-15
2,77
013
8,75
614
,014
90.8
%16
3,99
115
1,86
0
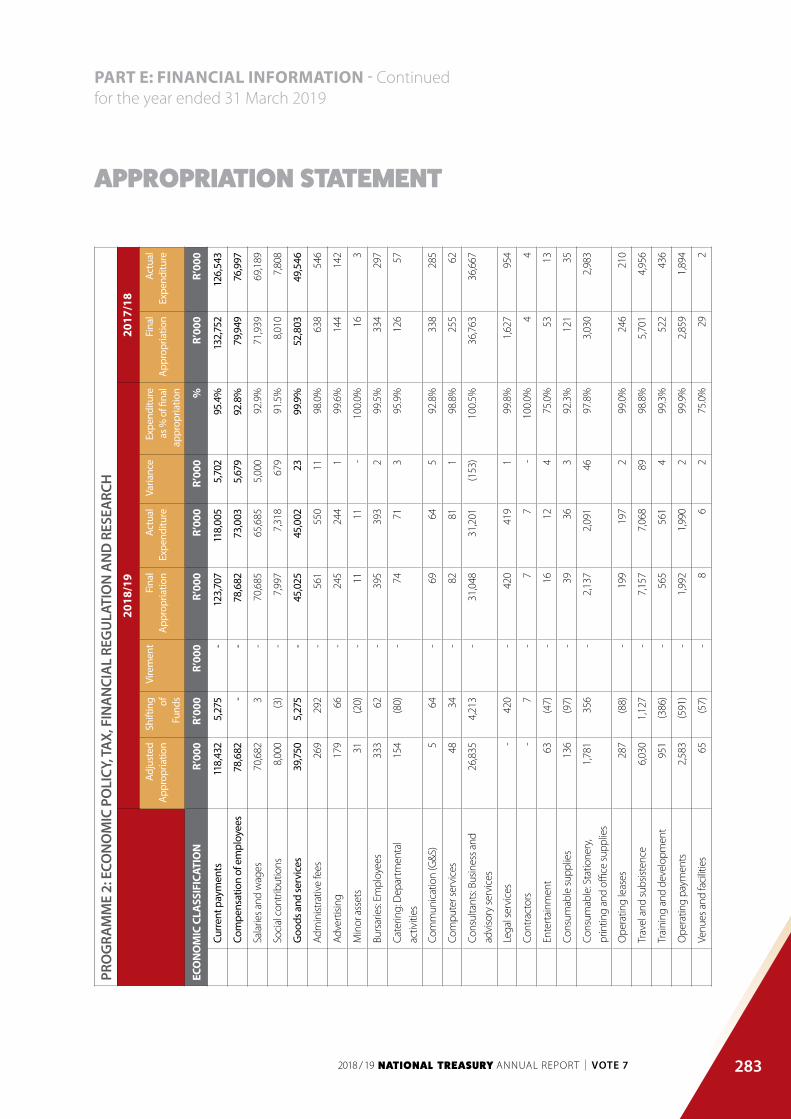
283
PART E: FINANCIAL INFORMATION - Continuedfor the year ended 31 March 2019
APPROPRIATION STATEMENT
PRO
GRA
MM
E 2:
ECO
NO
MIC
PO
LICY
, TAX
, FIN
AN
CIA
L RE
GU
LATI
ON
AN
D R
ESEA
RCH
2018
/19
2017
/18
Adju
sted
Ap
prop
riatio
nSh
iftin
g of
Fund
s
Vire
men
tFi
nal
Appr
opria
tion
Actu
al
Expe
nditu
reVa
rianc
eEx
pend
iture
as
% o
f fina
l ap
prop
riatio
n
Fina
l Ap
prop
riatio
nAc
tual
Ex
pend
iture
ECO
NO
MIC
CLA
SSIF
ICAT
ION
R’00
0R’
000
R’00
0R’
000
R’00
0R’
000
%R’
000
R’00
0
Cu
rren
t pay
men
ts11
8,43
25,
275
-12
3,70
711
8,00
55,
702
95.4
%13
2,75
212
6,54
3
Co
mpe
nsat
ion
of e
mpl
oyee
s78
,682
--
78,6
8273
,003
5,67
992
.8%
79,9
4976
,997
Sa
larie
s and
wag
es70
,682
3-
70,6
8565
,685
5,00
092
.9%
71,9
3969
,189
So
cial
con
trib
utio
ns8,
000
(3)
-7,
997
7,31
867
991
.5%
8,01
07,
808
G
oods
and
serv
ices
39,7
505,
275
-45
,025
45,0
0223
99.9
%52
,803
49,5
46
Ad
min
istra
tive
fees
269
292
-56
155
011
98.0
%63
854
6
Ad
vert
ising
179
66-
245
244
199
.6%
144
142
M
inor
ass
ets
31(2
0)-
1111
-10
0.0%
163
Bu
rsar
ies:
Empl
oyee
s33
362
-39
539
32
99.5
%33
429
7
Ca
terin
g: D
epar
tmen
tal
activ
ities
154
(80)
-74
713
95.9
%12
657
Co
mm
unic
atio
n (G
&S)
564
-69
645
92.8
%33
828
5
Co
mpu
ter s
ervi
ces
4834
-82
811
98.8
%25
562
Co
nsul
tant
s: Bu
sines
s and
advi
sory
serv
ices
26,8
354,
213
-31
,048
31,2
01(1
53)
100.
5%36
,763
36,6
67
Le
gal s
ervi
ces
-42
0-
420
419
199
.8%
1,62
795
4
Co
ntra
ctor
s-
7-
77
-10
0.0%
44
En
tert
ainm
ent
63(4
7)-
1612
475
.0%
5313
Co
nsum
able
supp
lies
136
(97)
-39
363
92.3
%12
135
Co
nsum
able
: Sta
tione
ry,
prin
ting
and
office
supp
lies
1,78
135
6-
2,13
72,
091
4697
.8%
3,03
02,
983
O
pera
ting
leas
es28
7(8
8)-
199
197
299
.0%
246
210
Tr
avel
and
subs
isten
ce6,
030
1,12
7-
7,15
77,
068
8998
.8%
5,70
14,
956
Tr
aini
ng a
nd d
evel
opm
ent
951
(386
)-
565
561
499
.3%
522
436
O
pera
ting
paym
ents
2,58
3(5
91)
-1,
992
1,99
02
99.9
%2,
859
1,89
4
Ve
nues
and
faci
litie
s65
(57)
-8
62
75.0
%29
2

284
PART E: FINANCIAL INFORMATION - Continuedfor the year ended 31 March 2019
APPROPRIATION STATEMENT
PRO
GRA
MM
E 2:
ECO
NO
MIC
PO
LICY
, TAX
, FIN
AN
CIA
L RE
GU
LATI
ON
AN
D R
ESEA
RCH
2018
/19
2017
/18
Adju
sted
Ap
prop
riatio
nSh
iftin
g of
Fund
s
Vire
men
tFi
nal
Appr
opria
tion
Actu
al
Expe
nditu
reVa
rianc
eEx
pend
iture
as
% o
f fina
l ap
prop
riatio
n
Fina
l Ap
prop
riatio
nAc
tual
Ex
pend
iture
ECO
NO
MIC
CLA
SSIF
ICAT
ION
R’00
0R’
000
R’00
0R’
000
R’00
0R’
000
%R’
000
R’00
0
In
tere
st a
nd re
nt o
n la
nd-
--
--
--
--
Tr
ansf
ers a
nd su
bsid
ies
33,4
33(5
,275
)-
28,15
820
,292
7,866
72.1%
30,2
4624
,658
D
epar
tmen
tal a
genc
ies a
nd
acco
unts
19,8
83-
-19
,883
19,8
83-
100.
0%19
,275
19,2
75
D
epar
tmen
tal a
genc
ies (
non-
busin
ess e
ntiti
es)
19,8
83-
-19
,883
19,8
83-
100.
0%19
,275
19,2
75
Pu
blic
corp
orat
ions
and
pr
ivat
e en
terp
rises
13,3
16(5
,454
)-
7,862
-7,8
62-
10,5
865,
000
Pr
ivat
e en
terp
rises
13,3
16(5
,454
)-
7,862
-7,8
62-
10,5
865,
000
O
ther
tran
sfer
s to
priv
ate
ente
rpris
es
13,3
16(5
,454
)-
7,86
2-
7,86
2-
10,5
865,
000
H
ouse
hold
s23
417
9-
413
409
499
.0%
385
383
So
cial
ben
efits
234
179
-41
340
94
99.0
%38
538
3
Pa
ymen
ts fo
r cap
ital a
sset
s90
5-
-90
545
245
349
.9%
994
659
M
achi
nery
and
equ
ipm
ent
905
--
905
452
453
49.9
%99
465
9
O
ther
mac
hine
ry a
nd
equi
pmen
t
905
--
905
452
453
49.9
%99
465
9
Pa
ymen
t for
fina
ncia
l ass
ets
--
--
7(7
)-
--
To
tal
152,
770
--
152,
770
138,
756
14,0
1490
.8%
163,
991
151,
860
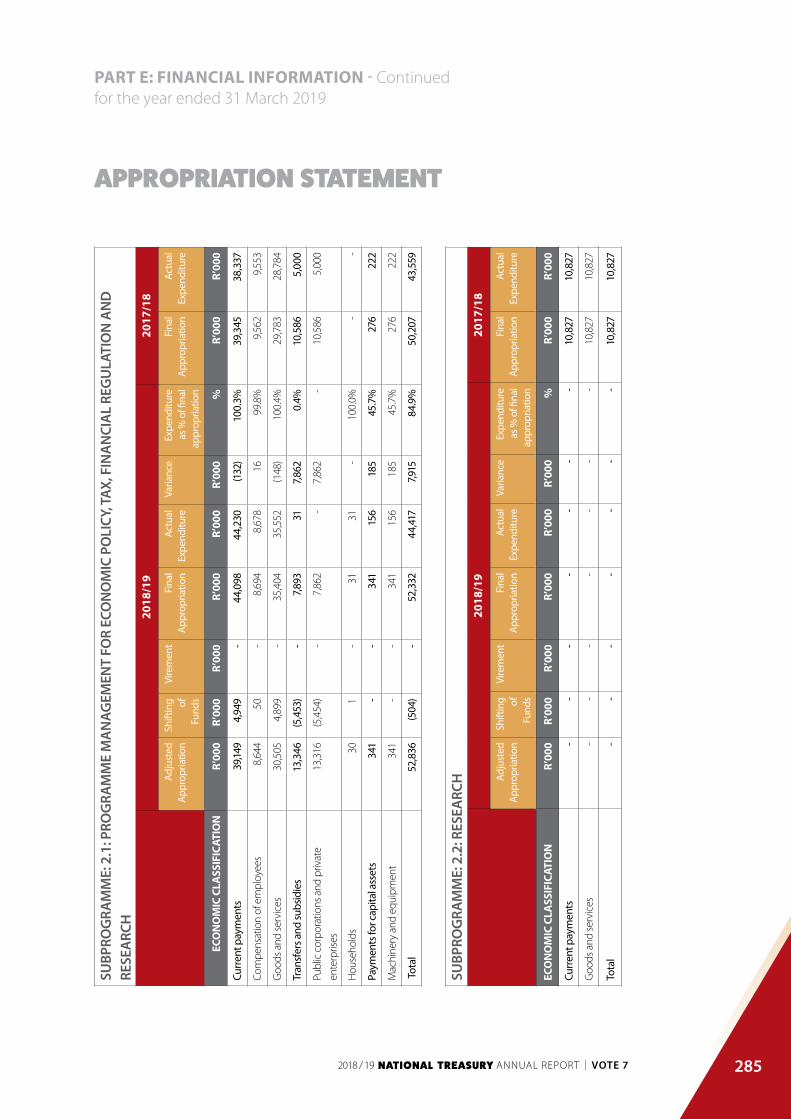
285
PART E: FINANCIAL INFORMATION - Continuedfor the year ended 31 March 2019
APPROPRIATION STATEMENT
SUBP
ROG
RAM
ME:
2.1
: PRO
GRA
MM
E M
AN
AGEM
ENT
FOR
ECO
NO
MIC
PO
LICY
, TAX
, FIN
AN
CIA
L RE
GU
LATI
ON
AN
D
RESE
ARC
H20
18/1
920
17/1
8
Adju
sted
Ap
prop
riatio
nSh
iftin
g of
Fund
s
Vire
men
tFi
nal
Appr
opria
tion
Actu
al
Expe
nditu
reVa
rianc
eEx
pend
iture
as
% o
f fina
l ap
prop
riatio
n
Fina
l Ap
prop
riatio
nAc
tual
Ex
pend
iture
ECO
NO
MIC
CLA
SSIF
ICAT
ION
R’
000
R’00
0R’
000
R’00
0R’
000
R’00
0%
R’00
0R’
000
Curr
ent p
aym
ents
39,14
94,
949
-44
,098
44,2
30(1
32)
100.
3%39
,345
38,3
37
Com
pens
atio
n of
em
ploy
ees
8,64
450
-8,
694
8,67
816
99.8
%9,
562
9,55
3
Goo
ds a
nd se
rvic
es30
,505
4,89
9-
35,4
0435
,552
(148
)10
0.4%
29,7
8328
,784
Tran
sfer
s and
subs
idie
s13
,346
(5,4
53)
-7,8
9331
7,862
0.4%
10,5
865,
000
Publ
ic c
orpo
ratio
ns a
nd p
rivat
e
ente
rpris
es
13,3
16(5
,454
)-
7,86
2-
7,86
2-
10,5
865,
000
Hou
seho
lds
301
-31
31-
100.
0%-
-
Paym
ents
for c
apita
l ass
ets
341
--
341
156
185
45.7
%27
622
2
Mac
hine
ry a
nd e
quip
men
t34
1-
-34
115
618
545
.7%
276
222
Tota
l 52
,836
(504
)-
52,3
3244
,417
7,915
84.9
%50
,207
43,5
59
SUBP
ROG
RAM
ME:
2.2
: RES
EARC
H
2018
/19
2017
/18
Adju
sted
Ap
prop
riatio
nSh
iftin
g of
Fund
s
Vire
men
tFi
nal
Appr
opria
tion
Actu
al
Expe
nditu
reVa
rianc
eEx
pend
iture
as
% o
f fina
l ap
prop
riatio
n
Fina
l Ap
prop
riatio
nAc
tual
Ex
pend
iture
ECO
NO
MIC
CLA
SSIF
ICAT
ION
R’00
0R’
000
R’00
0R’
000
R’00
0R’
000
%R’
000
R’00
0
Curr
ent p
aym
ents
--
--
--
-10
,827
10,8
27
Goo
ds a
nd se
rvic
es-
--
--
--
10,8
2710
,827
Tota
l -
--
--
--
10,8
2710
,827

286
PART E: FINANCIAL INFORMATION - Continuedfor the year ended 31 March 2019
APPROPRIATION STATEMENT
SUBP
ROG
RAM
ME
2.3
: FIN
AN
CIA
L SE
CTO
R PO
LICY
20
18/1
920
17/1
8
Adju
sted
Ap
prop
riatio
nSh
iftin
g of
Fund
s
Vire
men
tFi
nal
Appr
opria
tion
Actu
al
Expe
nditu
reVa
rianc
eEx
pend
iture
as
% o
f fina
l ap
prop
riatio
n
Fina
l Ap
prop
riatio
nAc
tual
Ex
pend
iture
ECO
NO
MIC
CLA
SSIF
ICAT
ION
R’00
0R’
000
R’00
0R’
000
R’00
0R’
000
%R’
000
R’00
0
Curr
ent p
aym
ents
23,4
7114
1-
23,6
1221
,437
2,17
590
.8%
27,10
924
,850
Com
pens
atio
n of
em
ploy
ees
21,2
36(4
3)-
21,1
9319
,064
2,12
990
.0%
21,9
8421
,043
Goo
ds a
nd se
rvic
es2,
235
184
-2,
419
2,37
346
98.1
%5,
126
3,80
7
Tran
sfer
s and
subs
idie
s46
91-
137
135
298
.5%
--
Hou
seho
lds
4691
-13
713
52
98.5
%-
-
Paym
ents
for c
apita
l ass
ets
90-
-90
-90
-10
51
Mac
hine
ry a
nd e
quip
men
t90
--
90-
90-
105
1
Paym
ent f
or fi
nanc
ial a
sset
s-
--
-2
(2)
--
Tota
l 23
,607
232
-23
,839
21,5
742,
265
90.5
%27
,214
24,8
51
SUBP
ROG
RAM
ME
2.4:
TAX
POLI
CY
2018
/19
2017
/18
Adju
sted
Ap
prop
riatio
nSh
iftin
g of
Fund
s
Vire
men
tFi
nal
Appr
opria
tion
Actu
al
Expe
nditu
reVa
rianc
eEx
pend
iture
as
% o
f fina
l ap
prop
riatio
n
Fina
l Ap
prop
riatio
nAc
tual
Ex
pend
iture
ECO
NO
MIC
CLA
SSIF
ICAT
ION
R’00
0R’
000
R’00
0R’
000
R’00
0R’
000
%R’
000
R’00
0
Curr
ent p
aym
ents
29,7
361,
237
-30
,973
30,6
2634
798
.9%
29,8
7028
,197
Com
pens
atio
n of
em
ploy
ees
26,4
91-
-26
,491
26,1
8031
198
.8%
26,7
6425
,307
Goo
ds a
nd se
rvic
es3,
245
1,23
7-
4,48
24,
446
3699
.2%
3,10
62,
890
Tran
sfer
s and
subs
idie
s99
6-
105
104
199
.0%
290
289
Hou
seho
lds
996
-10
510
41
99.0
%29
028
9
Paym
ents
for c
apita
l ass
ets
233
--
233
209
2489
.7%
222
135
Build
ings
and
oth
er fi
xed
stru
ctur
es-
--
--
--
--
Mac
hine
ry a
nd e
quip
men
t23
3-
-23
320
924
89.7
%22
213
5
Paym
ent f
or fi
nanc
ial a
sset
s-
--
-3
(3)
--
-
Tota
l 30
,068
1,24
3-
31,3
1130
,942
369
98.8
%30
,381
28,6
21
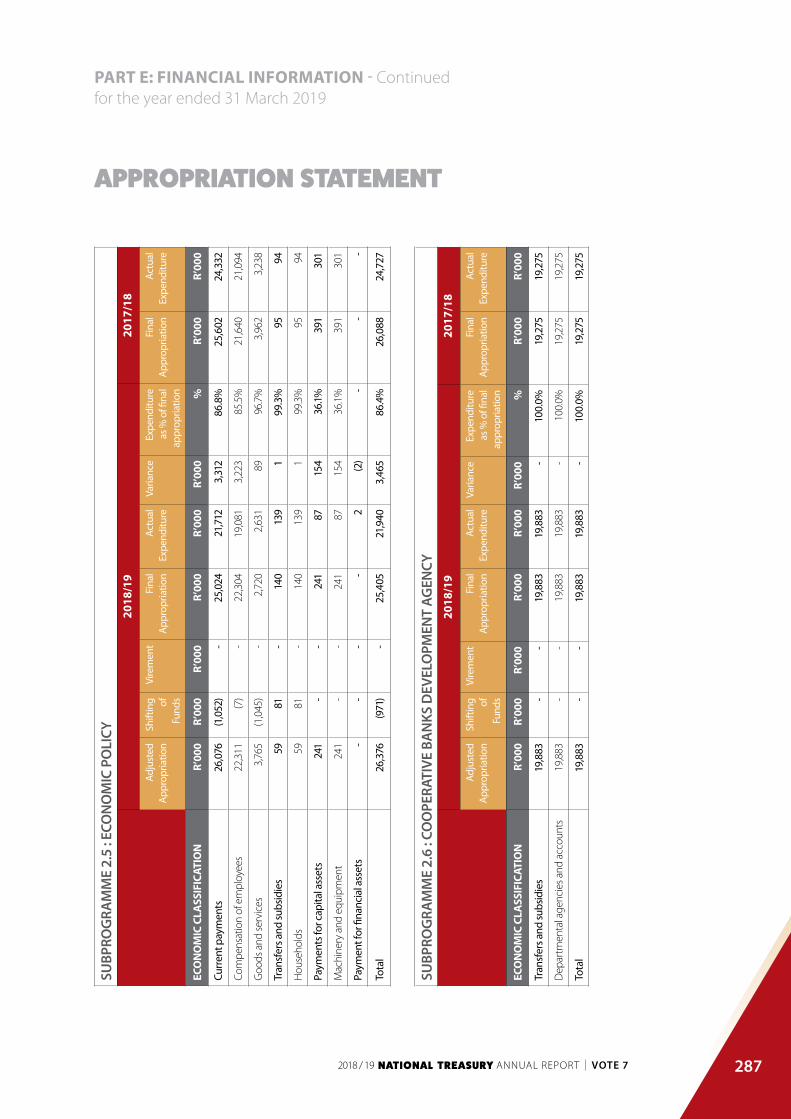
287
PART E: FINANCIAL INFORMATION - Continuedfor the year ended 31 March 2019
APPROPRIATION STATEMENT
SUBP
ROG
RAM
ME
2.5
: ECO
NO
MIC
PO
LICY
20
18/1
920
17/1
8
Adju
sted
Ap
prop
riatio
nSh
iftin
g of
Fund
s
Vire
men
tFi
nal
Appr
opria
tion
Actu
al
Expe
nditu
reVa
rianc
eEx
pend
iture
as
% o
f fina
l ap
prop
riatio
n
Fina
l Ap
prop
riatio
nAc
tual
Ex
pend
iture
ECO
NO
MIC
CLA
SSIF
ICAT
ION
R’00
0R’
000
R’00
0R’
000
R’00
0R’
000
%R’
000
R’00
0
Curr
ent p
aym
ents
26,0
76(1
,052
)-
25,0
2421
,712
3,31
286
.8%
25,6
0224
,332
Com
pens
atio
n of
em
ploy
ees
22,3
11(7
)-
22,3
0419
,081
3,22
385
.5%
21,6
4021
,094
Goo
ds a
nd se
rvic
es3,
765
(1,0
45)
-2,
720
2,63
189
96.7
%3,
962
3,23
8
Tran
sfer
s and
subs
idie
s59
81-
140
139
199
.3%
9594
Hou
seho
lds
5981
-14
013
91
99.3
%95
94
Paym
ents
for c
apita
l ass
ets
241
--
241
8715
436
.1%39
130
1
Mac
hine
ry a
nd e
quip
men
t24
1-
-24
187
154
36.1
%39
130
1
Paym
ent f
or fi
nanc
ial a
sset
s-
--
-2
(2)
--
-
Tota
l 26
,376
(971
)-
25,4
0521
,940
3,46
586
.4%
26,0
8824
,727
SUBP
ROG
RAM
ME
2.6
: CO
OPE
RATI
VE B
AN
KS D
EVEL
OPM
ENT
AGEN
CY
2018
/19
2017
/18
Adju
sted
Ap
prop
riatio
nSh
iftin
g of
Fund
s
Vire
men
tFi
nal
Appr
opria
tion
Actu
al
Expe
nditu
reVa
rianc
eEx
pend
iture
as
% o
f fina
l ap
prop
riatio
n
Fina
l Ap
prop
riatio
nAc
tual
Ex
pend
iture
ECO
NO
MIC
CLA
SSIF
ICAT
ION
R’
000
R’00
0R’
000
R’00
0R’
000
R’00
0%
R’00
0R’
000
Tran
sfer
s and
subs
idie
s19
,883
--
19,8
8319
,883
-10
0.0%
19,2
7519
,275
Dep
artm
enta
l age
ncie
s and
acc
ount
s19
,883
--
19,8
8319
,883
-10
0.0%
19,2
7519
,275
Tota
l 19
,883
--
19,8
8319
,883
-10
0.0%
19,2
7519
,275

288
PART E: FINANCIAL INFORMATION - Continuedfor the year ended 31 March 2019
APPROPRIATION STATEMENT
PRO
GRA
MM
E 3:
PU
BLIC
FIN
AN
CE A
ND
BU
DG
ET M
AN
AGEM
ENT
2018
/19
2017
/18
Adju
sted
Ap
prop
riatio
nSh
iftin
g of
Fund
s
Vire
men
tFi
nal
Appr
opria
tion
Actu
al
Expe
nditu
reVa
rianc
eEx
pend
iture
as
% o
f fina
l ap
prop
riatio
n
Fina
l Ap
prop
riatio
nAc
tual
Ex
pend
iture
R’00
0R’
000
R’00
0R’
000
R’00
0R’
000
%R’
000
R’00
0
SUBP
ROG
RAM
ME
1PR
OG
RAM
ME
MAN
AGEM
ENT
FOR
PUBL
IC F
INAN
CE A
ND
BUD
GET
MAN
AGEM
ENT
20,6
35(1
,319
)-
19,3
1619
,121
195
99.0
%24
,535
20,8
33
2PU
BLIC
FIN
ANCE
63,1
441,
562
-64
,706
64,0
3766
999
.0%
64,2
2161
,687
3BU
DG
ET O
FFIC
E AN
D
COO
RDIN
ATIO
N
62,7
56(2
,226
)-
60,5
3059
,666
864
98.6
%59
,628
57,6
63
4IN
TERG
OVE
RNM
ENTA
L
RELA
TIO
NS
99,7
301,
983
-10
1,71
310
0,76
494
999
.1%
103,
265
97,8
05
5FI
NAN
CIAL
AN
D F
ISCA
L
COM
MIS
SIO
N
51,7
82-
-51
,782
51,7
82-
100.
0%50
,647
50,6
47
T
OTA
L29
8,04
7-
-29
8,04
729
5,37
02,
677
99.1%
302,
296
288,
635

289
PART E: FINANCIAL INFORMATION - Continuedfor the year ended 31 March 2019
APPROPRIATION STATEMENT
PRO
GRA
MM
E 3:
PU
BLIC
FIN
AN
CE A
ND
BU
DG
ET M
AN
AGEM
ENT
20
18/1
920
17/1
8
Adju
sted
Ap
prop
riatio
nSh
iftin
g of
Fund
s
Vire
men
tFi
nal
Appr
opria
tion
Actu
al
Expe
nditu
reVa
rianc
eEx
pend
iture
as
% o
f fina
l ap
prop
riatio
n
Fina
l Ap
prop
riatio
nAc
tual
Ex
pend
iture
ECO
NO
MIC
CLA
SSIF
ICAT
ION
R’00
0R’
000
R’00
0R’
000
R’00
0R’
000
%R’
000
R’00
0
Cu
rren
t pay
men
ts24
3,50
2(1
,776
)-
241,
726
239,
832
1,89
499
.2%
249,
422
236,
436
Co
mpe
nsat
ion
of e
mpl
oyee
s21
4,45
5-
-21
4,45
521
3,85
460
199
.7%
218,
687
211,
693
Sa
larie
s and
wag
es18
8,27
73,
949
-19
2,22
619
1,87
435
299
.8%
195,
440
190,
319
So
cial
con
trib
utio
ns26
,178
(3,9
49)
-22
,229
21,9
8024
998
.9%
23,2
4721
,374
G
oods
and
serv
ices
29,0
47(1
,776
)-
27,2
7125
,978
1,29
395
.3%
30,7
3524
,743
Ad
min
istra
tive
fees
781
278
-1,
059
984
7592
.9%
831
644
Ad
vert
ising
249
73-
322
272
5084
.5%
103
11
M
inor
ass
ets
34(3
)-
3113
1841
.9%
879
Bu
rsar
ies:
Empl
oyee
s1,
370
(218
)-
1,15
298
316
985
.3%
1,28
999
4
Ca
terin
g: D
epar
tmen
tal
activ
ities
662
(155
)-
507
358
149
70.6
%57
933
1
Co
mm
unic
atio
n (G
&S)
1515
-30
273
90.0
%76
967
2
Co
mpu
ter s
ervi
ces
601
(88)
-51
350
94
99.2
%54
751
6
Co
nsul
tant
s: Bu
sines
s and
advi
sory
serv
ices
5,80
9(1
,131
)-
4,67
84,
627
5198
.9%
7,24
15,
078
Co
ntra
ctor
s19
(11)
-8
-8
-26
15
Ag
ency
and
supp
ort /
outs
ourc
ed se
rvic
es
38(3
8)-
--
--
--
En
tert
ainm
ent
137
--
137
2011
714
.6%
105
22
Fl
eet s
ervi
ces (
incl
udin
g
gove
rnm
ent m
otor
tran
spor
t)
3-
-3
-3
-3
-
Co
nsum
able
supp
lies
346
(190
)-
156
126
3080
.8%
276
209
Co
nsum
able
: Sta
tione
ry,
prin
ting
and
office
supp
lies
7,10
2(5
,907
)-
1,19
51,
007
188
84.3
%7,
282
6,69
4
O
pera
ting
leas
es87
6(1
3)-
863
787
7691
.2%
883
721
Tr
avel
and
subs
isten
ce9,
790
736
-10
,526
10,2
7425
297
.6%
9,78
38,
482

290
PART E: FINANCIAL INFORMATION - Continuedfor the year ended 31 March 2019
APPROPRIATION STATEMENT
PRO
GRA
MM
E 3:
PU
BLIC
FIN
AN
CE A
ND
BU
DG
ET M
AN
AGEM
ENT
20
18/1
920
17/1
8
Adju
sted
Ap
prop
riatio
nSh
iftin
g of
Fund
s
Vire
men
tFi
nal
Appr
opria
tion
Actu
al
Expe
nditu
reVa
rianc
eEx
pend
iture
as
% o
f fina
l ap
prop
riatio
n
Fina
l Ap
prop
riatio
nAc
tual
Ex
pend
iture
ECO
NO
MIC
CLA
SSIF
ICAT
ION
R’00
0R’
000
R’00
0R’
000
R’00
0R’
000
%R’
000
R’00
0
Tr
aini
ng a
nd d
evel
opm
ent
795
(545
)-
250
165
8566
.0%
603
248
O
pera
ting
paym
ents
545,
759
-5,
813
5,80
76
99.9
%13
4
Ve
nues
and
faci
litie
s36
6(3
38)
-28
199
67.9
%31
593
In
tere
st a
nd re
nt o
n la
nd-
--
--
--
--
Tr
ansf
ers a
nd su
bsid
ies
51,9
151,
776
-53
,691
53,6
838
100.
0%51
,059
51,0
46
Pr
ovin
ces a
nd m
unic
ipal
ities
--
--
--
--
-
D
epar
tmen
tal a
genc
ies a
nd
acco
unts
51,7
82-
-51
,782
51,7
82-
100.
0%50
,647
50,6
47
D
epar
tmen
tal a
genc
ies (
non-
busin
ess e
ntiti
es)
51,7
82-
-51
,782
51,7
82-
100.
0%50
,647
50,6
47
H
ouse
hold
s13
31,
776
-1,
909
1,90
18
99.6
%41
239
9
So
cial
ben
efits
133
1,77
6-
1,90
91,
901
899
.6%
412
399
Pa
ymen
ts fo
r cap
ital a
sset
s2,
630
--
2,63
01,
830
800
69.6
%1,
815
1,05
1
Bu
ildin
gs a
nd o
ther
fixe
d
stru
ctur
es
--
--
--
--
-
M
achi
nery
and
equ
ipm
ent
2,63
0-
-2,
630
1,83
080
069
.6%
1,81
51,
051
O
ther
mac
hine
ry a
nd
equi
pmen
t
2,63
0-
-2,
630
1,83
080
069
.6%
1,55
61,
051
Pa
ymen
t for
fina
ncia
l ass
ets
--
--
25(2
5)-
-10
2
Tot
al29
8,04
7-
-29
8,04
729
5,37
02,
677
99.1%
302,
296
288,
635

291
PART E: FINANCIAL INFORMATION - Continuedfor the year ended 31 March 2019
APPROPRIATION STATEMENT
SUBP
ROG
RAM
ME
3.1:
PRO
GRA
MM
E M
AN
AGEM
ENT
FOR
PUBL
IC F
INA
NCE
AN
D B
UD
GET
MA
NAG
EMEN
T
2018
/19
2017
/18
Adju
sted
Ap
prop
riatio
nSh
iftin
g of
Fund
s
Vire
men
tFi
nal
Appr
opria
tion
Actu
al
Expe
nditu
reVa
rianc
eEx
pend
iture
as
% o
f fina
l ap
prop
riatio
n
Fina
l Ap
prop
riatio
nAc
tual
Ex
pend
iture
Eco
nom
ic cl
assi
ficat
ion
R’00
0R’
000
R’00
0R’
000
R’00
0R’
000
%R’
000
R’00
0
Curr
ent p
aym
ents
20,3
41(1
,376
)-
18,9
6518
,777
188
99.0
%24
,033
20,5
06
Com
pens
atio
n of
em
ploy
ees
9,75
4(1
,130
)-
8,62
48,
553
7199
.2%
12,4
9511
,462
Goo
ds a
nd se
rvic
es10
,587
(246
)-
10,3
4110
,224
117
98.9
%11
,538
9,04
4
Tran
sfer
s and
subs
idie
s-
64-
6464
-10
0.0%
246
238
Hou
seho
lds
-64
-64
64-
100.
0%24
623
8
Paym
ents
for c
apita
l ass
ets
294
(7)
-28
727
98
97.2
%25
689
Mac
hine
ry a
nd e
quip
men
t29
4(7
)-
287
279
897
.2%
256
89
Paym
ent f
or fi
nanc
ial a
sset
s-
--
-1
(1)
--
-
Tota
l 20
,635
(1,3
19)
-19
,316
19,12
119
599
.0%
24,5
3520
,833
SUBP
ROG
RAM
ME
3.2:
PU
BLIC
FIN
AN
CE
2018
/19
2017
/18
Adju
sted
Ap
prop
riatio
nSh
iftin
g of
Fund
s
Vire
men
tFi
nal
Appr
opria
tion
Actu
al
Expe
nditu
reVa
rianc
eEx
pend
iture
as
% o
f fina
l ap
prop
riatio
n
Fina
l Ap
prop
riatio
nAc
tual
Ex
pend
iture
ECO
NO
MIC
CLA
SSIF
ICAT
ION
R’00
0R’
000
R’00
0R’
000
R’00
0R’
000
%R’
000
R’00
0
Curr
ent p
aym
ents
62,0
471,
378
-63
,425
62,8
5956
699
.1%63
,708
61,3
28
Com
pens
atio
n of
em
ploy
ees
59,0
991,
482
-60
,581
60,2
7031
199
.5%
60,1
7158
,818
Goo
ds a
nd se
rvic
es2,
948
(104
)-
2,84
42,
589
255
91.0
%3,
537
2,51
0
Tran
sfer
s and
subs
idie
s3
594
-59
759
43
99.5
%66
65
Hou
seho
lds
359
4-
597
594
399
.5%
6665
Paym
ents
for c
apita
l ass
ets
1,09
4(4
10)
-68
458
010
484
.8%
447
294
Mac
hine
ry a
nd e
quip
men
t1,
094
(410
)-
684
580
104
84.8
%44
729
4
Paym
ent f
or fi
nanc
ial a
sset
s-
--
-4
(4)
--
-
Tota
l 63
,144
1,56
2-
64,7
0664
,037
669
99.0
%64
,221
61,6
87

292
PART E: FINANCIAL INFORMATION - Continuedfor the year ended 31 March 2019
APPROPRIATION STATEMENT
SUBP
ROG
RAM
ME
3.3:
BU
DG
ET O
FFIC
E A
ND
CO
ORD
INAT
ION
20
18/1
920
17/1
8
Adju
sted
Ap
prop
riatio
nSh
iftin
g of
Fund
s
Vire
men
tFi
nal
Appr
opria
tion
Actu
al
Expe
nditu
reVa
rianc
eEx
pend
iture
as
% o
f fina
l ap
prop
riatio
n
Fina
l Ap
prop
riatio
nAc
tual
Ex
pend
iture
ECO
NO
MIC
CLA
SSIF
ICAT
ION
R’00
0R’
000
R’00
0R’
000
R’00
0R’
000
%R’
000
R’00
0
Curr
ent p
aym
ents
62,13
0(3
,110)
-59
,020
58,5
5646
499
.2%
59,15
757
,501
Com
pens
atio
n of
em
ploy
ees
59,2
45(2
,229
)-
57,0
1656
,822
194
99.7
%56
,288
55,7
04
Goo
ds a
nd se
rvic
es2,
885
(881
)-
2,00
41,
734
270
86.5
%2,
869
1,79
7
Tran
sfer
s and
subs
idie
s67
601
-66
866
53
99.6
%-
-
Hou
seho
lds
6760
1-
668
665
399
.6%
--
Paym
ents
for c
apita
l ass
ets
559
283
-84
244
539
752
.9%
471
162
Mac
hine
ry a
nd e
quip
men
t55
928
3-
842
445
397
52.9
%47
116
2
Tota
l 62
,756
(2,2
26)
-60
,530
59,6
6686
498
.6%
59,6
2857
,663
SUBP
ROG
RAM
ME
3.4:
INTE
RGO
VERN
MEN
TAL
RELA
TIO
NS
20
18/1
920
17/1
9
Adju
sted
Ap
prop
riatio
nSh
iftin
g of
Fund
s
Vire
men
tFi
nal
Appr
opria
tion
Actu
al
Expe
nditu
reVa
rianc
eEx
pend
iture
as
% o
f fina
l ap
prop
riatio
n
Fina
l Ap
prop
riatio
nAc
tual
Ex
pend
iture
ECO
NO
MIC
CLA
SSIF
ICAT
ION
R’00
0R’
000
R’00
0R’
000
R’00
0R’
000
%R’
000
R’00
0
Curr
ent p
aym
ents
98,9
841,
332
-10
0,31
699
,640
676
99.3
%10
2,52
497
,101
Com
pens
atio
n of
em
ploy
ees
86,3
571,
877
-88
,234
88,2
0925
100.
0%89
,733
85,7
09
Goo
ds a
nd se
rvic
es12
,627
(545
)-
12,0
8211
,431
651
94.6
%12
,791
11,3
92
Tran
sfer
s and
subs
idie
s63
517
-58
057
82
99.7
%10
096
Hou
seho
lds
6351
7-
580
578
299
.7%
100
96
Paym
ents
for c
apita
l ass
ets
683
134
-81
752
629
164
.4%
641
506
Mac
hine
ry a
nd e
quip
men
t68
313
4-
817
526
291
64.4
%64
150
6
Paym
ent f
or fi
nanc
ial a
sset
s-
--
-20
(20)
--
102
Tota
l 99
,730
1,98
3-
101,
713
100,
764
949
99.1%
103,
265
97,8
05

293
PART E: FINANCIAL INFORMATION - Continuedfor the year ended 31 March 2019
APPROPRIATION STATEMENT
SUBP
ROG
RAM
ME
3.5:
FIN
AN
CIA
L A
ND
FIS
CAL
COM
MIS
SIO
N
2018
/19
2017
/18
Adju
sted
Ap
prop
riatio
nSh
iftin
g of
Fund
s
Vire
men
tFi
nal
Appr
opria
tion
Actu
al
Expe
nditu
reVa
rianc
eEx
pend
iture
as
% o
f fina
l ap
prop
riatio
n
Fina
l Ap
prop
riatio
nAc
tual
Ex
pend
iture
ECO
NO
MIC
CLA
SSIF
ICAT
ION
R’00
0R’
000
R’00
0R’
000
R’00
0R’
000
%R’
000
R’00
0
Tran
sfer
s and
subs
idie
s51
,782
--
51,7
8251
,782
-10
0.0%
50,6
4750
,647
Dep
artm
enta
l age
ncie
s and
acc
ount
s51
,782
--
51,7
8251
,782
-10
0.0%
50,6
4750
,647
Tota
l 51
,782
--
51,7
8251
,782
-10
0.0%
50,6
4750
,647
PRO
GRA
MM
E 4:
ASS
ET A
ND
LIA
BILI
TY M
AN
AGEM
ENT
20
18/1
920
17/1
8
Adju
sted
Ap
prop
riatio
nSh
iftin
g of
Fund
s
Vire
men
tFi
nal
Appr
opria
tion
Actu
al
Expe
nditu
reVa
rianc
eEx
pend
iture
as
% o
f fina
l ap
prop
riatio
n
Fina
l Ap
prop
riatio
nAc
tual
Ex
pend
iture
R’00
0R’
000
R’00
0R’
000
R’00
0R’
000
%R’
000
R’00
0
SUBP
ROG
RAM
ME
1PR
OG
RAM
ME
MAN
AGEM
ENT
FOR
ASSE
T AN
D L
IABI
LITY
MAN
AGEM
ENT
12,0
25(2
06)
-11
,819
6,94
44,
875
58.8
%12
,463
6,11
0
2ST
ATE
OW
NED
EN
TITY
FIN
ANCI
AL M
ANAG
EMEN
T
AND
GO
VERN
ANCE
35,1
59(1
22)
-35
,037
31,4
523,
585
89.8
%10
,035
,025
10,0
33,6
65
3G
OVE
RNM
ENT
DEB
T
MAN
AGEM
ENT
19,6
5632
8-
19,9
8419
,539
445
97.8
%18
,735
17,9
24
4FI
NAN
CIAL
OPE
RATI
ON
S24
,677
--
24,6
7724
,227
450
98.2
%22
,393
21,9
74
5ST
RATE
GY
AND
RIS
K
MAN
AGEM
ENT
10,0
68-
-10
,068
9,02
31,
045
89.6
%11
,696
10,0
88
T
OTA
L10
1,58
5-
-10
1,58
591
,185
10,4
0089
.2%
10,10
0,31
210
,089
,761

294
PART E: FINANCIAL INFORMATION - Continuedfor the year ended 31 March 2019
APPROPRIATION STATEMENT
PRO
GRA
MM
E 4:
ASS
ET A
ND
LIA
BILI
TY M
AN
AGEM
ENT
20
18/1
920
17/1
8
Adju
sted
Ap
prop
riatio
nSh
iftin
g of
Fund
s
Vire
men
tFi
nal
Appr
opria
tion
Actu
al
Expe
nditu
reVa
rianc
eEx
pend
iture
as
% o
f fina
l ap
prop
riatio
n
Fina
l Ap
prop
riatio
nAc
tual
Ex
pend
iture
ECO
NO
MIC
CLA
SSIF
ICAT
ION
R’00
0R’
000
R’00
0R’
000
R’00
0R’
000
%R’
000
R’00
0
Cu
rren
t pay
men
ts10
1,02
9(2
,271
)-
98,7
5888
,366
10,3
9289
.5%
96,6
5688
,856
Co
mpe
nsat
ion
of e
mpl
oyee
s78
,692
--
78,6
9273
,813
4,87
993
.8%
78,5
0475
,213
Sa
larie
s and
wag
es70
,329
(357
)-
69,9
7265
,705
4,26
793
.9%
70,1
5667
,105
So
cial
con
trib
utio
ns8,
363
357
-8,
720
8,10
861
293
.0%
8,34
98,
108
G
oods
and
serv
ices
22,3
37(2
,271
)-
20,0
6614
,553
5,51
372
.5%
18,15
213
,643
Ad
min
istra
tive
fees
715
(27)
-68
843
225
662
.8%
233
190
Ad
vert
ising
170
--
170
129
4175
.9%
157
156
M
inor
ass
ets
72
-9
-9
-9
1
Au
dit c
osts
: Ext
erna
l69
130
8-
999
998
199
.9%
661
660
Bu
rsar
ies:
Empl
oyee
s82
0(1
28)
-69
236
832
453
.2%
887
680
Ca
terin
g: D
epar
tmen
tal
activ
ities
83-
-83
1766
20.5
%68
8
Co
mm
unic
atio
n (G
&S)
135
-18
117
61.1
%28
418
8
Co
mpu
ter s
ervi
ces
11,6
15(2
,173
)-
9,44
28,
452
990
89.5
%8,
107
8,04
9
Co
nsul
tant
s: Bu
sines
s and
advi
sory
serv
ices
3,42
4(5
76)
-2,
848
987
1,86
134
.7%
2,82
291
Co
ntra
ctor
s16
--
16-
16-
123
En
tert
ainm
ent
33-
-33
231
6.1%
491
Fl
eet s
ervi
ces (
incl
udin
g
gove
rnm
ent m
otor
tran
spor
t)
- -
- -
- -
- 19
-
Co
nsum
able
supp
lies
- 2
- 2
2 -
100.
0%32
32
Co
nsum
able
: Sta
tione
ry,
prin
ting
and
office
supp
lies
599
(1)
- 59
8 31
8 28
0 53
.2%
515
388
O
pera
ting
leas
es40
5 6
- 41
1 27
5 13
6 66
.9%
406
353
Tr
avel
and
subs
isten
ce3,
119
355
- 3,
474
2,37
6 1,
098
68.4
%3,
242
2,55
4
Tr
aini
ng a
nd d
evel
opm
ent
452
(64)
- 38
8 73
31
5 18
.8%
442
168

295
PART E: FINANCIAL INFORMATION - Continuedfor the year ended 31 March 2019
APPROPRIATION STATEMENT
PRO
GRA
MM
E 4:
ASS
ET A
ND
LIA
BILI
TY M
AN
AGEM
ENT
20
18/1
920
17/1
8
Adju
sted
Ap
prop
riatio
nSh
iftin
g of
Fund
s
Vire
men
tFi
nal
Appr
opria
tion
Actu
al
Expe
nditu
reVa
rianc
eEx
pend
iture
as
% o
f fina
l ap
prop
riatio
n
Fina
l Ap
prop
riatio
nAc
tual
Ex
pend
iture
ECO
NO
MIC
CLA
SSIF
ICAT
ION
R’00
0R’
000
R’00
0R’
000
R’00
0R’
000
%R’
000
R’00
0
O
pera
ting
paym
ents
85
- -
85
55
30
64.7
%83
55
Ve
nues
and
faci
litie
s90
20
-
110
58
52
52.7
%12
4 66
Tr
ansf
ers a
nd su
bsid
ies
48
2,02
3 -
2,07
1 2,
070
1 10
0.0%
356
354
H
ouse
hold
s48
2,
023
- 2,
071
2,07
0 1
100.
0%35
6 35
4
So
cial
ben
efits
48
2,02
3 -
2,07
1 2,
070
1 10
0.0%
356
354
Pa
ymen
ts fo
r cap
ital a
sset
s50
8 24
8 -
756
734
22
97.1%
3,30
0 55
0
M
achi
nery
and
equ
ipm
ent
508
248
- 75
6 73
4 22
97
.1%
680
550
O
ther
mac
hine
ry a
nd
equi
pmen
t
508
248
- 75
6 73
4 22
97
.1%
680
550
So
ftwar
e an
d ot
her i
ntan
gibl
e
asse
ts
- -
- -
- -
-2,
620
-
Pa
ymen
t for
fina
ncia
l ass
ets
- -
- -
15
(15)
- 10
,000
,000
10
,000
,001
Tota
l 10
1,58
5 -
- 10
1,58
5 91
,185
10,4
00
89.8
%10
,100,
312
10,0
89,7
61

296
PART E: FINANCIAL INFORMATION - Continuedfor the year ended 31 March 2019
APPROPRIATION STATEMENT
SUB-
PRO
GRA
MM
E 4.
1 : P
ROG
RAM
ME
MA
NAG
EMEN
T FO
R A
SSET
AN
D L
IABI
LITY
MA
NAG
EMEN
T
2018
/19
2017
/18
Adju
sted
Ap
prop
riatio
nSh
iftin
g of
Fund
s
Vire
men
tFi
nal
Appr
opria
tion
Actu
al
Expe
nditu
reVa
rianc
eEx
pend
iture
as
% o
f fina
l ap
prop
riatio
n
Fina
l Ap
prop
riatio
nAc
tual
Ex
pend
iture
ECO
NO
MIC
CLA
SSIF
ICAT
ION
R’00
0R’
000
R’00
0R’
000
R’00
0R’
000
%R’
000
R’00
0
Curr
ent p
aym
ents
11,5
17(4
53)
-11
,064
6,19
64,
868
56.0
%9,1
695,
561
Com
pens
atio
n of
em
ploy
ees
3,56
812
2-
3,69
03,
687
399
.9%
3,39
33,
382
Goo
ds a
nd se
rvic
es7,
949
(575
)-
7,37
42,
509
4,86
534
.0%
5,77
62,
179
Paym
ents
for c
apita
l ass
ets
508
247
-75
573
421
97.2
%3,
294
548
Mac
hine
ry a
nd e
quip
men
t50
824
7-
755
734
2197
.2%
674
548
Softw
are
and
othe
r int
angi
ble
asse
ts-
--
--
--
2,62
0-
Paym
ent f
or fi
nanc
ial a
sset
s-
--
-14
(14)
--
1
Tota
l 12
,025
(206
)-
11,8
196,
944
4,87
558
.8%
12,4
636,
110
SUBP
ROG
RAM
ME
4.2:
STA
TE O
WN
ED E
NTI
TY F
INA
NCI
AL
MA
NAG
EMEN
T A
ND
GO
VERN
AN
CE
2018
/19
2017
/18
Adju
sted
Ap
prop
riatio
nSh
iftin
g of
Fund
s
Vire
men
tFi
nal
Appr
opria
tion
Actu
al
Expe
nditu
reVa
rianc
eEx
pend
iture
as
% o
f fina
l ap
prop
riatio
n
Fina
l Ap
prop
riatio
nAc
tual
Ex
pend
iture
ECO
NO
MIC
CLA
SSIF
ICAT
ION
R’00
0R’
000
R’00
0R’
000
R’00
0R’
000
%R’
000
R’00
0
Curr
ent p
aym
ents
35,12
7(1
99)
-34
,928
31,3
433,
585
89.7
%34
,833
33,4
77
Com
pens
atio
n of
em
ploy
ees
33,7
81(1
22)
-33
,659
30,7
262,
933
91.3
%33
,500
32,6
07
Goo
ds a
nd se
rvic
es1,
346
(77)
-1,
269
617
652
48.6
%1,
333
870
Tran
sfer
s and
subs
idie
s32
77-
109
109
-10
0.0%
190
188
Hou
seho
lds
3277
-10
910
9-
100.
0%19
018
8
Paym
ents
for c
apita
l ass
ets
--
--
--
-2
-
Mac
hine
ry a
nd e
quip
men
t-
--
--
--
2-
Paym
ent f
or fi
nanc
ial a
sset
s-
--
--
--
10,0
00,0
0010
,000
,000
Tota
l 35
,159
(122
)-
35,0
3731
,452
3,58
589
.8%
10,0
35,0
2510
,033
,665
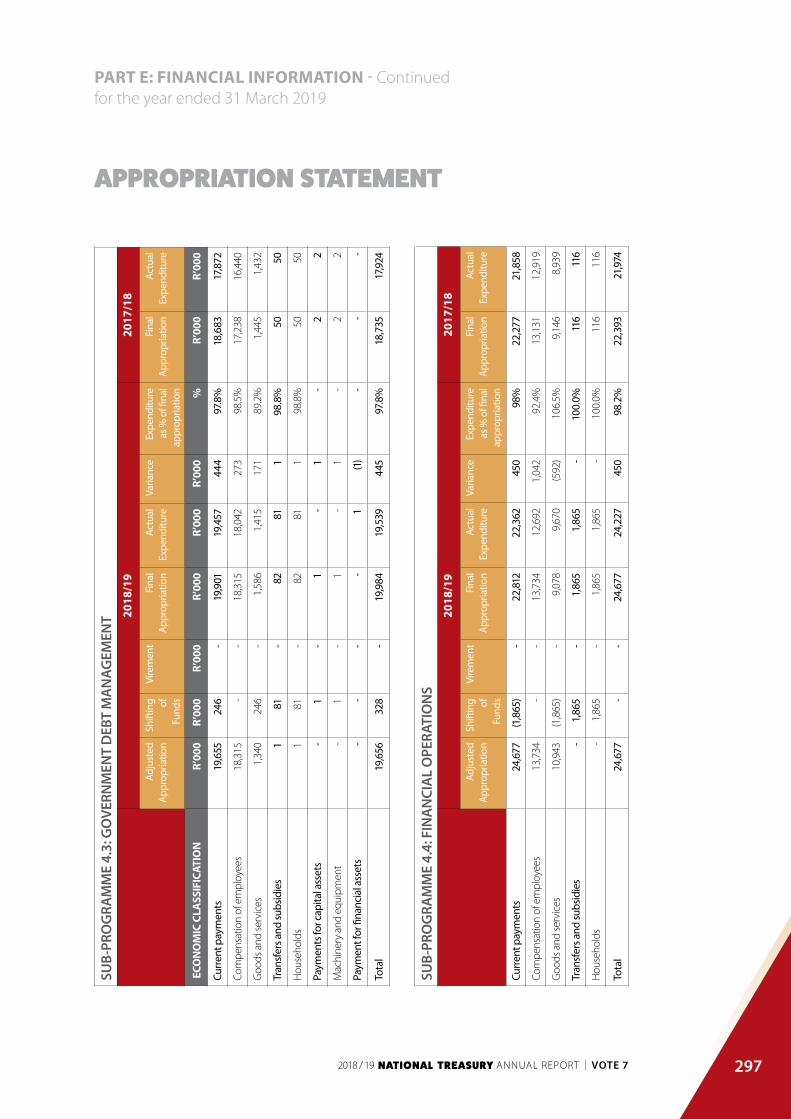
297
PART E: FINANCIAL INFORMATION - Continuedfor the year ended 31 March 2019
APPROPRIATION STATEMENT
SUB-
PRO
GRA
MM
E 4.
3: G
OVE
RNM
ENT
DEB
T M
AN
AGEM
ENT
20
18/1
920
17/1
8
Adju
sted
Ap
prop
riatio
nSh
iftin
g of
Fund
s
Vire
men
tFi
nal
Appr
opria
tion
Actu
al
Expe
nditu
reVa
rianc
eEx
pend
iture
as
% o
f fina
l ap
prop
riatio
n
Fina
l Ap
prop
riatio
nAc
tual
Ex
pend
iture
ECO
NO
MIC
CLA
SSIF
ICAT
ION
R’00
0R’
000
R’00
0R’
000
R’00
0R’
000
%R’
000
R’00
0
Curr
ent p
aym
ents
19,6
5524
6-
19,9
0119
,457
444
97.8
%18
,683
17,8
72
Com
pens
atio
n of
em
ploy
ees
18,3
15-
-18
,315
18,0
4227
398
.5%
17,2
3816
,440
Goo
ds a
nd se
rvic
es1,
340
246
-1,
586
1,41
517
189
.2%
1,44
51,
432
Tran
sfer
s and
subs
idie
s1
81-
8281
198
.8%
5050
Hou
seho
lds
181
-82
811
98.8
%50
50
Paym
ents
for c
apita
l ass
ets
-1
-1
-1
-2
2
Mac
hine
ry a
nd e
quip
men
t-
1-
1-
1-
22
Paym
ent f
or fi
nanc
ial a
sset
s-
--
-1
(1)
--
-
Tota
l 19
,656
328
-19
,984
19,5
3944
597
.8%
18,7
3517
,924
SUB-
PRO
GRA
MM
E 4.
4: F
INA
NCI
AL
OPE
RATI
ON
S
2018
/19
2017
/18
Adju
sted
Ap
prop
riatio
nSh
iftin
g of
Fund
s
Vire
men
tFi
nal
Appr
opria
tion
Actu
al
Expe
nditu
reVa
rianc
eEx
pend
iture
as
% o
f fina
l ap
prop
riatio
n
Fina
l Ap
prop
riatio
nAc
tual
Ex
pend
iture
Curr
ent p
aym
ents
24,6
77(1
,865
)-
22,8
1222
,362
450
98%
22,2
7721
,858
Com
pens
atio
n of
em
ploy
ees
13,7
34-
-13
,734
12,6
921,
042
92.4
%13
,131
12,9
19
Goo
ds a
nd se
rvic
es10
,943
(1,8
65)
-9,
078
9,67
0(5
92)
106.
5%9,
146
8,93
9
Tran
sfer
s and
subs
idie
s-
1,86
5-
1,86
51,
865
-10
0.0%
116
116
Hou
seho
lds
-1,
865
-1,
865
1,86
5-
100.
0%11
611
6
Tota
l 24
,677
--
24,6
7724
,227
450
98.2
%22
,393
21,9
74

298
PART E: FINANCIAL INFORMATION - Continuedfor the year ended 31 March 2019
APPROPRIATION STATEMENT
SUB-
PRO
GRA
MM
E 4.
5: S
TRAT
EGY
AN
D R
ISK
MA
NAG
EMEN
T
2018
/19
2017
/18
Adju
sted
Ap
prop
riatio
nSh
iftin
g of
Fund
s
Vire
men
tFi
nal
Appr
opria
tion
Actu
al
Expe
nditu
reVa
rianc
eEx
pend
iture
as
% o
f fina
l ap
prop
riatio
n
Fina
l Ap
prop
riatio
nAc
tual
Ex
pend
iture
ECO
NO
MIC
CLA
SSIF
ICAT
ION
R’00
0R’
000
R’00
0R’
000
R’00
0R’
000
%R’
000
R’00
0
Curr
ent p
aym
ents
10,0
53-
-10
,053
9,00
81,
045
89.6
%11
,694
10,0
88
Com
pens
atio
n of
em
ploy
ees
9,29
4-
-9,
294
8,66
662
893
.2%
11,2
429,
865
Goo
ds a
nd se
rvic
es75
9-
-75
934
241
745
.1%
452
223
Tran
sfer
s and
subs
idie
s15
--
1515
-10
0.0%
--
Hou
seho
lds
15-
-15
15-
100.
0%-
-
Paym
ents
for c
apita
l ass
ets
--
--
--
-2
-
Mac
hine
ry a
nd e
quip
men
t-
--
--
--
2-
Tota
l 10
,068
--
10,0
689,
023
1,04
589
.6%
11,6
9610
,088

299
PART E: FINANCIAL INFORMATION - Continuedfor the year ended 31 March 2019
APPROPRIATION STATEMENT
PRO
GRA
MM
E 5:
FIN
AN
CIA
L AC
COU
NTI
NG
AN
D S
UPP
LY C
HA
IN M
AN
AGEM
ENT
SYST
EMS
20
18/1
920
17/1
8
Adju
sted
Ap
prop
riatio
nSh
iftin
g of
Fun
dsVi
rem
ent
Fina
l Ap
prop
riatio
nAc
tual
Ex
pend
iture
Varia
nce
Expe
nditu
re
as %
of fi
nal
appr
opria
tion
Fina
l Ap
prop
riatio
nAc
tual
Ex
pend
iture
R’00
0R’
000
R’00
0R’
000
R’00
0R’
000
%R’
000
R’00
0
SUBP
ROG
RAM
ME
1PR
OG
RAM
ME
MAN
AGEM
ENT
FOR
FIN
ANCI
AL
ACCO
UN
TIN
G A
ND
SU
PPLY
CHAI
N M
ANAG
EMEN
T
SYST
EMS
195,
663
(39,
963)
(93,
063)
62,6
3750
,175
12,4
6280
.1%
100,
734
25,5
25
2O
FFIC
E O
F TH
E CH
IEF
PRO
CURE
MEN
T O
FFIC
ER
69,3
0526
51,
000
70,5
7069
,018
1,55
297
.8%
74,6
1371
,824
3FI
NAN
CIAL
SYS
TEM
S64
4,75
8(1
0,03
7)-
634,
721
419,
593
215,
128
66.1
%40
1,48
337
4,28
5
4FI
NAN
CIAL
REP
ORT
ING
FO
R
NAT
ION
AL A
CCO
UN
TS
101,
822
697
-10
2,51
910
2,04
447
599
.5%
98,2
4097
,284
5FI
NAN
CIAL
MAN
AGEM
ENT
POLI
CY A
ND
CO
MPL
IAN
CE
IMPR
OVE
MEN
T
134,
573
(962
)-
133,
611
130,
261
3,35
097
.5%
129,
225
120,
456
6AU
DIT
STA
TUTO
RY B
OD
IES
47,7
3850
,000
-97
,738
97,7
38-
100.
0%19
6,27
819
6,27
8
7SE
RVIC
E CH
ARG
ES:
COM
MER
CIAL
BAN
KS
289
--
289
275
1495
.2%
273
180
T
OTA
L1,1
94,14
8-
(92,
063)
1,102
,085
869,1
0423
2,98
178
.9%
1,00
0,84
688
5,83
3

300
PART E: FINANCIAL INFORMATION - Continuedfor the year ended 31 March 2019
APPROPRIATION STATEMENT
PRO
GRA
MM
E 5:
FIN
AN
CIA
L AC
COU
NTI
NG
AN
D S
UPP
LY C
HA
IN M
AN
AGEM
ENT
SYST
EMS
20
18/1
920
17/1
8
Adju
sted
Ap
prop
riatio
nSh
iftin
g of
Fun
dsVi
rem
ent
Fina
l Ap
prop
riatio
nAc
tual
Ex
pend
iture
Varia
nce
Expe
nditu
re
as %
of fi
nal
appr
opria
tion
Fina
l Ap
prop
riatio
nAc
tual
Ex
pend
iture
ECO
NO
MIC
CLA
SSIF
ICAT
ION
R’00
0R’
000
R’00
0R’
000
R’00
0R’
000
%R’
000
R’00
0
Cu
rren
t pay
men
ts1,
079,1
29(5
2,20
4)(9
2,06
3)93
4,86
270
6,45
722
8,40
575
.6%
726,
396
619,
094
Co
mpe
nsat
ion
of e
mpl
oyee
s20
6,59
0-
1,00
020
7,590
206,
944
646
99.7
%20
8,12
620
6,10
4
Sa
larie
s and
wag
es18
4,85
369
1,00
018
5,92
218
5,37
954
399
.7%
187,
076
185,
145
So
cial
con
trib
utio
ns21
,737
(69)
-21
,668
21,5
6510
399
.5%
21,0
5020
,959
G
oods
and
serv
ices
872,
539
(52,
204)
(93,
063)
727,2
7249
9,51
322
7,759
68.7
%51
8,27
041
2,99
0
Ad
min
istra
tive
fees
1,68
093
-1,
773
1,57
519
888
.8%
1,54
91,
309
Ad
vert
ising
978
(325
)-
653
409
244
62.6
%37
120
4
M
inor
ass
ets
145
(28)
-11
770
4759
.8%
419
283
Au
dit c
osts
: Ext
erna
l6,
067
779
-6,
846
6,16
368
390
.0%
8,27
25,
660
Bu
rsar
ies:
Empl
oyee
s1,
784
(351
)-
1,43
31,
083
350
75.6
%2,
816
2,28
9
Ca
terin
g: D
epar
tmen
tal
activ
ities
613
(25)
-58
842
816
072
.8%
490
276
Co
mm
unic
atio
n (G
&S)
619
(7)
-61
236
225
059
.2%
1,25
61,
005
Co
mpu
ter s
ervi
ces
565,
636
(11,
266)
-55
4,37
035
3,30
520
1,06
563
.7%
357,
641
344,
172
Co
nsul
tant
s: Bu
sines
s and
advi
sory
serv
ices
268,
512
(41,
076)
(93,
063)
134,
373
119,
450
14,9
2388
.9%
124,
379
41,8
40
Le
gal s
ervi
ces
5,00
0-
-5,
000
-5,
000
-24
23
Co
ntra
ctor
s10
9(7
7)-
326
2618
.8%
123
67
Ag
ency
and
supp
ort /
outs
ourc
ed se
rvic
es
--
--
--
-10
-
En
tert
ainm
ent
113
(22)
-91
1774
18.7
%10
416
Fl
eet s
ervi
ces
36-
-36
-36
-37
-
Co
nsum
able
supp
lies
159
(76)
-83
4538
54.2
%11
769

301
PART E: FINANCIAL INFORMATION - Continuedfor the year ended 31 March 2019
APPROPRIATION STATEMENT
PRO
GRA
MM
E 5:
FIN
AN
CIA
L AC
COU
NTI
NG
AN
D S
UPP
LY C
HA
IN M
AN
AGEM
ENT
SYST
EMS
20
18/1
920
17/1
8
Adju
sted
Ap
prop
riatio
nSh
iftin
g of
Fun
dsVi
rem
ent
Fina
l Ap
prop
riatio
nAc
tual
Ex
pend
iture
Varia
nce
Expe
nditu
re
as %
of fi
nal
appr
opria
tion
Fina
l Ap
prop
riatio
nAc
tual
Ex
pend
iture
ECO
NO
MIC
CLA
SSIF
ICAT
ION
R’00
0R’
000
R’00
0R’
000
R’00
0R’
000
%R’
000
R’00
0
Co
nsum
able
: Sta
tione
ry,
prin
ting
and
office
supp
lies
1,31
3(2
33)
-1,
080
428
652
39.6
%1,
460
975
O
pera
ting
leas
es78
311
-79
472
569
91.3
%82
469
7
Tr
avel
and
subs
isten
ce10
,630
1,47
1-
12,1
0110
,020
2,08
182
.8%
11,3
568,
346
Tr
aini
ng a
nd d
evel
opm
ent
1,91
7(7
83)
-1,
134
437
697
38.5
%1,
219
703
O
pera
ting
paym
ents
999
(34)
-96
559
437
161
.6%
1,16
579
1
Ve
nues
and
faci
litie
s5,
446
(255
)-
5,19
14,
396
795
84.7
%4,
638
4,26
4
Tr
ansf
ers a
nd su
bsid
ies
104,
330
51,9
80-
156,
310
156,
303
710
0.0%
251,
213
251,
210
D
epar
tmen
tal a
genc
ies
102,
666
50,0
00-
152,
666
152,
666
-10
0.0%
249,
365
249,
365
D
epar
tmen
tal a
genc
ies
102,
666
50,0
00-
152,
666
152,
666
-10
0.0%
249,
365
249,
365
H
ouse
hold
s1,
664
1,98
0-
3,64
43,
637
799
.8%
1,84
81,
845
So
cial
ben
efits
1,66
467
7-
2,34
12,
336
599
.8%
698
695
O
ther
tran
sfer
s to
hous
ehol
ds-
1,30
3-
1,30
31,
301
299
.8%
1,15
01,
150
Pa
ymen
ts fo
r cap
ital a
sset
s10
,689
224
-10
,913
6,32
44,
589
57.9
%23
,237
15,2
20
M
achi
nery
and
equ
ipm
ent
9,99
122
4-
10,2
155,
699
4,51
655
.8%
21,5
3315
,184
O
ther
mac
hine
ry a
nd
equi
pmen
t
9,99
122
4-
10,2
155,
699
4,51
655
.8%
21,5
3315
,184
So
ftwar
e an
d ot
her i
ntan
gibl
e 69
8-
-69
862
573
89.5
%1,
704
35
Pa
ymen
t for
fina
ncia
l ass
ets
--
--
20(2
0)-
-30
9
Tot
al1,1
94,14
8-
(92,
063)
1,102
,085
869,1
0423
2,98
178
.9%
1,00
0,84
688
5,83
3

302
PART E: FINANCIAL INFORMATION - Continuedfor the year ended 31 March 2019
APPROPRIATION STATEMENT
SUB-
PRO
GRA
MM
E 5.
1: P
ROG
RAM
ME
MA
NAG
EMEN
T FO
R FI
NA
NCI
AL
ACCO
UN
TIN
G A
ND
SU
PPLY
CH
AIN
M
AN
AGEM
ENT
SYST
EMS
20
18/1
920
17/1
8
Adju
sted
Ap
prop
riatio
nSh
iftin
g of
Fund
s
Vire
men
tFi
nal
Appr
opria
tion
Actu
al
Expe
nditu
reVa
rianc
eEx
pend
iture
as
% o
f fina
l ap
prop
riatio
n
Fina
l Ap
prop
riatio
nAc
tual
Ex
pend
iture
ECO
NO
MIC
CLA
SSIF
ICAT
ION
R’
000
R’00
0R’
000
R’00
0R’
000
R’00
0%
R’00
0R’
000
Curr
ent p
aym
ents
195,
510
(39,
963)
(93,
063)
62,4
8450
,175
12,3
0980
.3%
86,2
7410
,967
Com
pens
atio
n of
em
ploy
ees
6,18
637
-6,
223
6,21
76
99.9
%6,
236
5,88
1
Goo
ds a
nd se
rvic
es18
9,32
4(4
0,00
0)(9
3,06
3)56
,261
43,9
5812
,303
78.1
%80
,038
5,08
5
Tran
sfer
s and
subs
idie
s-
--
--
--
1,150
1,150
Hou
seho
lds
--
--
--
-1,
150
1,15
0
Paym
ents
for c
apita
l ass
ets
153
--
153
-15
3-
13,3
1013
,121
Mac
hine
ry a
nd e
quip
men
t15
3-
-15
3-
153
-13
,310
13,1
21
Paym
ent f
or fi
nanc
ial a
sset
s-
--
--
--
-28
7
Tota
l 19
5,66
3(3
9,96
3)(9
3,06
3)62
,637
50,17
512
,462
80.1%
100,
734
25,5
25

303
PART E: FINANCIAL INFORMATION - Continuedfor the year ended 31 March 2019
APPROPRIATION STATEMENT
SUBP
ROG
RAM
ME
5.2:
OFF
ICE
OF
THE
CHIE
F PR
OCU
REM
ENT
OFF
ICER
20
18/1
920
17/1
8
Adju
sted
Ap
prop
riatio
nSh
iftin
g of
Fund
s
Vire
men
tFi
nal
Appr
opria
tion
Actu
al
Expe
nditu
reVa
rianc
eEx
pend
iture
as
% o
f fina
l ap
prop
riatio
n
Fina
l Ap
prop
riatio
nAc
tual
Ex
pend
iture
ECO
NO
MIC
CLA
SSIF
ICAT
ION
R’
000
R’00
0R’
000
R’00
0R’
000
R’00
0%
R’00
0R’
000
Curr
ent p
aym
ents
68,2
12
(891
)1,
000
68,3
21
67,4
87
834
98.8
%72
,781
70
,723
Com
pens
atio
n of
em
ploy
ees
60,0
62
333
1,00
0 61
,395
61
,994
(5
99)
101.
0%65
,127
64
,608
Goo
ds a
nd se
rvic
es8,
150
(1,2
24)
- 6,
926
5,49
3 1,
433
79.3
%7,
654
6,11
5
Tran
sfer
s and
subs
idie
s-
994
- 99
4 99
1 3
99.7
%14
3 14
1
Hou
seho
lds
- 99
4 -
994
991
3 99
.7%
143
141
Paym
ents
for c
apita
l ass
ets
1,09
3 16
2 -
1,25
5 53
6 71
9 42
.7%
1,68
9 95
9
Mac
hine
ry a
nd e
quip
men
t1,
093
162
- 1,
255
536
719
42.7
%1,
689
959
Paym
ent f
or fi
nanc
ial a
sset
s-
--
- 4
(4)
- -
-
Tota
l 69
,305
26
5 1,
000
70,5
70
69,0
18
1,55
2 97
.8%
74,6
13
71,8
24
SUBP
ROG
RAM
ME
5.3:
FIN
AN
CIA
L SY
STEM
S
2018
/19
2017
/18
Adju
sted
Ap
prop
riatio
nSh
iftin
g of
Fund
s
Vire
men
tFi
nal
Appr
opria
tion
Actu
al
Expe
nditu
reVa
rianc
eEx
pend
iture
as
% o
f fina
l ap
prop
riatio
n
Fina
l Ap
prop
riatio
nAc
tual
Ex
pend
iture
ECO
NO
MIC
CLA
SSIF
ICAT
ION
R’
000
R’00
0R’
000
R’00
0R’
000
R’00
0%
R’00
0R’
000
Curr
ent p
aym
ents
637,1
34(1
0,03
7)-
627,0
9741
5,179
211,
918
66.2
%39
4,18
537
3,69
2
Com
pens
atio
n of
em
ploy
ees
29,6
40(3
7)-
29,6
0328
,397
1,20
695
.9%
27,0
5426
,762
Goo
ds a
nd se
rvic
es60
7,49
4(1
0,00
0)-
597,
494
386,
782
210,
712
64.7
%36
7,13
134
6,93
0
Paym
ents
for c
apita
l ass
ets
7,624
--
7,624
4,40
53,
219
57.8
%7,2
9859
3
Mac
hine
ry a
nd e
quip
men
t7,
624
--
7,62
44,
405
3,21
957
.8%
5,63
059
3
Softw
are
and
othe
r int
angi
ble
asse
ts-
--
--
--
1,66
8-
Paym
ent f
or fi
nanc
ial a
sset
s-
--
-9
(9)
--
-
Tota
l 64
4,75
8(1
0,03
7)-
634,
721
419,
593
215,1
2866
.1%40
1,48
337
4,28
5
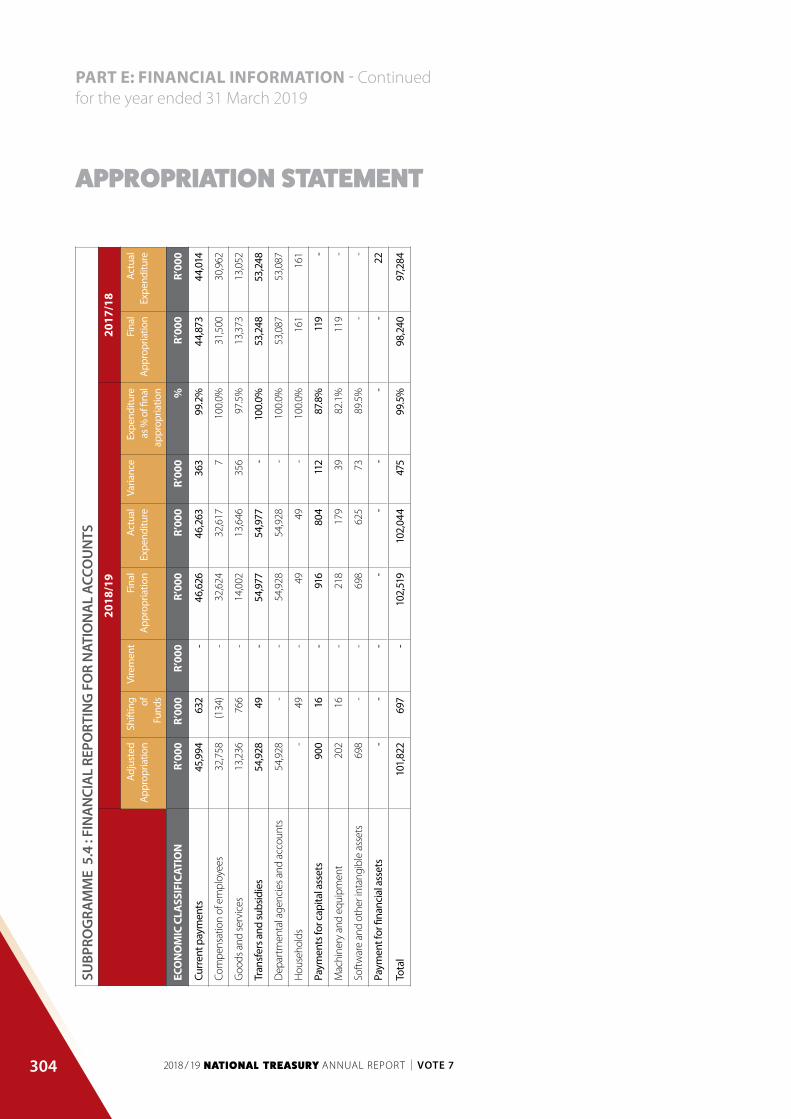
304
PART E: FINANCIAL INFORMATION - Continuedfor the year ended 31 March 2019
APPROPRIATION STATEMENT
SUBP
ROG
RAM
ME
5.4
: FI
NA
NCI
AL
REPO
RTIN
G F
OR
NAT
ION
AL
ACCO
UN
TS
2018
/19
2017
/18
Adju
sted
Ap
prop
riatio
nSh
iftin
g of
Fund
s
Vire
men
tFi
nal
Appr
opria
tion
Actu
al
Expe
nditu
reVa
rianc
eEx
pend
iture
as
% o
f fina
l ap
prop
riatio
n
Fina
l Ap
prop
riatio
nAc
tual
Ex
pend
iture
ECO
NO
MIC
CLA
SSIF
ICAT
ION
R’
000
R’00
0R’
000
R’00
0R’
000
R’00
0%
R’00
0R’
000
Curr
ent p
aym
ents
45,9
9463
2-
46,6
2646
,263
363
99.2
%44
,873
44,0
14
Com
pens
atio
n of
em
ploy
ees
32,7
58(1
34)
-32
,624
32,6
177
100.
0%31
,500
30,9
62
Goo
ds a
nd se
rvic
es13
,236
766
-14
,002
13,6
4635
697
.5%
13,3
7313
,052
Tran
sfer
s and
subs
idie
s54
,928
49-
54,9
7754
,977
-10
0.0%
53,2
4853
,248
Dep
artm
enta
l age
ncie
s and
acc
ount
s54
,928
--
54,9
2854
,928
-10
0.0%
53,0
8753
,087
Hou
seho
lds
-49
-49
49-
100.
0%16
116
1
Paym
ents
for c
apita
l ass
ets
900
16-
916
804
112
87.8
%11
9-
Mac
hine
ry a
nd e
quip
men
t20
216
-21
817
939
82.1
%11
9-
Softw
are
and
othe
r int
angi
ble
asse
ts69
8-
-69
862
573
89.5
%-
-
Paym
ent f
or fi
nanc
ial a
sset
s-
--
--
--
-22
Tota
l 10
1,82
269
7-
102,
519
102,
044
475
99.5
%98
,240
97,2
84

305
PART E: FINANCIAL INFORMATION - Continuedfor the year ended 31 March 2019
APPROPRIATION STATEMENT
SUBP
ROG
RAM
ME
5.5:
FIN
AN
CIA
L M
AN
AGEM
ENT
POLI
CY A
ND
CO
MPL
IAN
CE IM
PRO
VEM
ENT
20
18/1
920
17/1
8
Adju
sted
Ap
prop
riatio
nSh
iftin
g of
Fund
s
Vire
men
tFi
nal
Appr
opria
tion
Actu
al
Expe
nditu
reVa
rianc
eEx
pend
iture
as
% o
f fina
l ap
prop
riatio
n
Fina
l Ap
prop
riatio
nAc
tual
Ex
pend
iture
ECO
NO
MIC
CLA
SSIF
ICAT
ION
R’
000
R’00
0R’
000
R’00
0R’
000
R’00
0%
R’00
0R’
000
Curr
ent p
aym
ents
131,
990
(1,9
45)
-13
0,04
512
7,078
2,96
797
.7%
128,
010
119,
517
Com
pens
atio
n of
em
ploy
ees
77,9
44(1
99)
-77
,745
77,7
1926
100.
0%78
,209
77,8
89
Goo
ds a
nd se
rvic
es54
,046
(1,7
46)
-52
,300
49,3
592,
941
94.4
%49
,801
41,6
28
Tran
sfer
s and
subs
idie
s1,
664
937
-2,
601
2,59
74
99.8
%39
439
3
Hou
seho
lds
1,66
493
7-
2,60
12,
597
499
.8%
394
393
Paym
ents
for c
apita
l ass
ets
919
46-
965
579
386
60.0
%82
154
6
Mac
hine
ry a
nd e
quip
men
t91
946
-96
557
938
660
.0%
785
511
Softw
are
and
othe
r int
angi
ble
asse
ts-
--
--
--
3635
Paym
ent f
or fi
nanc
ial a
sset
s-
--
-7
(7)
--
-
Tota
l 13
4,57
3(9
62)
-13
3,61
113
0,26
13,
350
97.5
%12
9,22
512
0,45
6
SUBP
ROG
RAM
ME
5.6:
AU
DIT
STA
TUTO
RY B
OD
IES
20
18/1
920
17/1
8
Adju
sted
Ap
prop
riatio
nSh
iftin
g of
Fund
s
Vire
men
tFi
nal
Appr
opria
tion
Actu
al
Expe
nditu
reVa
rianc
eEx
pend
iture
as
% o
f fina
l ap
prop
riatio
n
Fina
l Ap
prop
riatio
nAc
tual
Ex
pend
iture
ECO
NO
MIC
CLA
SSIF
ICAT
ION
R’
000
R’00
0R’
000
R’00
0R’
000
R’00
0%
R’00
0R’
000
Tran
sfer
s and
subs
idie
s47
,738
50,0
00-
97,7
3897
,738
-10
0.0%
196,
278
196,
278
Dep
artm
enta
l age
ncie
s and
acc
ount
s47
,738
50,0
00-
97,7
3897
,738
-10
0.0%
196,
278
196,
278
Tota
l 47
,738
50,0
00-
97,7
3897
,738
-10
0.0%
196,
278
196,
278

306
PART E: FINANCIAL INFORMATION - Continuedfor the year ended 31 March 2019
APPROPRIATION STATEMENT
SUB-
PRO
GRA
MM
E: 5
.7: S
ERVI
CE C
HA
RGES
: CO
MM
ERCI
AL
BAN
KS
2018
/19
2017
/18
Adju
sted
Ap
prop
riatio
nSh
iftin
g of
Fund
s
Vire
men
tFi
nal
Appr
opria
tion
Actu
al
Expe
nditu
reVa
rianc
eEx
pend
iture
as
% o
f fina
l ap
prop
riatio
n
Fina
l Ap
prop
riatio
nAc
tual
Ex
pend
iture
ECO
NO
MIC
CLA
SSIF
ICAT
ION
R’
000
R’00
0R’
000
R’00
0R’
000
R’00
0%
R’00
0R’
000
Curr
ent p
aym
ents
289
--
289
275
1495
.2%
273
180
Goo
ds a
nd se
rvic
es28
9-
-28
927
514
95.2
%27
318
0
Tota
l 28
9-
-28
927
514
95.2
%27
318
0
PRO
GRA
MM
E 6:
INTE
RNAT
ION
AL
FIN
AN
CIA
L RE
LATI
ON
S
2018
/19
2017
/18
Adju
sted
Ap
prop
riatio
nSh
iftin
g of
Fun
dsVi
rem
ent
Fina
l Ap
prop
riatio
nAc
tual
Ex
pend
iture
Varia
nce
Expe
nditu
re
as %
of fi
nal
appr
opria
tion
Fina
l Ap
prop
riatio
nAc
tual
Ex
pend
iture
SU
BPRO
GRA
MM
ER’
000
R’00
0R’
000
R’00
0R’
000
R’00
0%
R’00
0R’
000
1PR
OG
RAM
ME
MAN
AGEM
ENT
FOR
INTE
RNAT
ION
AL
FIN
ANCI
AL R
ELAT
ION
S
11,7
86(1
,625
)-
10,1
619,
043
1,11
889
.0%
8,20
77,
507
2IN
TERN
ATIO
NAL
ECO
NO
MIC
COO
PERA
TIO
N
42,7
731,
625
5,00
049
,398
46,7
102,
688
94.6
%37
,576
36,2
11
3AF
RICA
N IN
TEG
RATI
ON
AN
D
SUPP
ORT
978,
774
(137
,000
)17
5,34
51,
017,
119
1,00
2,58
514
,534
98.6
%89
6,83
089
6,25
5
4IN
TERN
ATIO
NAL
DEV
ELO
PMEN
T FU
ND
ING
INST
ITU
TIO
NS
4,48
9,12
713
7,00
016
0,00
04,
786,
127
4,72
9,98
256
,145
98.8
%4,
977,
549
4,51
2,03
6
5IN
TERN
ATIO
NAL
PRO
JEC
TS20
,316
--
20,3
1619
,366
950
95.3
%20
,527
17,8
29
Tota
l 5,
542,
776
-34
0,34
55,
883,
121
5,80
7,686
75,4
3598
.7%
5,94
0,68
95,
469,
838

307
PART E: FINANCIAL INFORMATION - Continuedfor the year ended 31 March 2019
APPROPRIATION STATEMENT
PRO
GRA
MM
E 6:
INTE
RNAT
ION
AL
FIN
AN
CIA
L RE
LATI
ON
S
2018
/19
2017
/18
Adju
sted
Ap
prop
riatio
nSh
iftin
g of
Fun
dsVi
rem
ent
Fina
l Ap
prop
riatio
nAc
tual
Ex
pend
iture
Varia
nce
Expe
nditu
re
as %
of fi
nal
appr
opria
tion
Fina
l Ap
prop
riatio
nAc
tual
Ex
pend
iture
ECO
NO
MIC
CLA
SSIF
ICAT
ION
R’00
0R’
000
R’00
0R’
000
R’00
0R’
000
%R’
000
R’00
0
Cu
rren
t pay
men
ts53
,899
(12)
5,00
058
,887
55,5
633,
324
94.4
%44
,756
43,11
2
Co
mpe
nsat
ion
of e
mpl
oyee
s33
,438
--
33,4
3831
,893
1,54
595
.4%
30,8
5830
,697
Sa
larie
s and
wag
es30
,026
(154
)-
29,8
7228
,800
1,07
296
.4%
27,9
7427
,828
So
cial
con
trib
utio
ns3,
412
154
-3,
566
3,09
347
386
.7%
2,88
42,
869
G
oods
and
serv
ices
20,4
61(1
2)5,
000
25,4
4923
,670
1,77
993
.0%
13,8
9812
,415
Ad
min
istra
tive
fees
737
918
-1,
655
1,52
413
192
.1%
574
529
Ad
vert
ising
129
(18)
-11
110
92
98.2
%14
0
M
inor
ass
ets
27-
-27
-27
-9
3
Bu
rsar
ies:
Empl
oyee
s35
8(3
30)
-28
622
21.4
%19
319
2
Ca
terin
g: D
epar
tmen
tal
activ
ities
45-
-45
2223
48.9
%41
15
Co
mm
unic
atio
n (G
&S)
--
--
--
-24
215
3
Co
nsul
tant
s: Bu
sines
s and
advi
sory
serv
ices
1,05
0(7
06)
-34
4-
344
-71
070
8
Co
ntra
ctor
s21
814
-83
565
318
278
.2%
77
Ag
ency
and
supp
ort /
outs
ourc
ed se
rvic
es
60(6
0)-
--
--
--
En
tert
ainm
ent
20-
-20
119
5.0%
212
Fl
eet s
ervi
ces (
incl
udin
g
gove
rnm
ent m
otor
tran
spor
t)
-6
-6
-6
-19
17
Co
nsum
able
supp
lies
462
-48
2325
47.9
%14
3
Co
nsum
able
: Sta
tione
ry,
prin
ting
and
office
supp
lies
152
(46)
-10
633
7331
.1%
155
53
O
pera
ting
leas
es11
247
-15
913
128
82.4
%36
634
4
Tr
avel
and
subs
isten
ce13
,305
(334
)3,
869
16,8
4015
,969
871
94.8
%7,
838
7,01
5
Tr
aini
ng a
nd d
evel
opm
ent
180
(56)
-12
410
717
86.3
%18
968

308
PART E: FINANCIAL INFORMATION - Continuedfor the year ended 31 March 2019
APPROPRIATION STATEMENT
PRO
GRA
MM
E 6:
INTE
RNAT
ION
AL
FIN
AN
CIA
L RE
LATI
ON
S
2018
/19
2017
/18
Adju
sted
Ap
prop
riatio
nSh
iftin
g of
Fun
dsVi
rem
ent
Fina
l Ap
prop
riatio
nAc
tual
Ex
pend
iture
Varia
nce
Expe
nditu
re
as %
of fi
nal
appr
opria
tion
Fina
l Ap
prop
riatio
nAc
tual
Ex
pend
iture
ECO
NO
MIC
CLA
SSIF
ICAT
ION
R’00
0R’
000
R’00
0R’
000
R’00
0R’
000
%R’
000
R’00
0
O
pera
ting
paym
ents
1,09
0(6
81)
-40
940
27
98.3
%71
664
0
Ve
nues
and
faci
litie
s3,
129
432
1,13
14,
692
4,69
02
100.
0%2,
790
2,66
8
Tr
ansf
ers a
nd su
bsid
ies
1,135
,210
(136
,988
)17
5,34
51,1
73,5
671,1
57,9
8315
,584
98.7
%1,
047,8
691,
041,
246
Fo
reig
n go
vern
men
ts a
nd
inte
rnat
iona
l org
anisa
tions
1,13
5,21
0(1
37,0
00)
175,
345
1,17
3,55
51,
157,
971
15,5
8498
.7%
1,04
7,48
91,
040,
866
H
ouse
hold
s-
12-
1212
-10
0.0%
380
380
So
cial
ben
efits
-12
-12
12-
100.
0%34
34
O
ther
tran
sfer
s to
hous
ehol
ds-
--
--
--
346
346
Pa
ymen
ts fo
r cap
ital a
sset
s66
0-
-66
017
548
526
.5%
647
226
M
achi
nery
and
equ
ipm
ent
660
--
660
175
485
26.5
%64
722
6
O
ther
mac
hine
ry a
nd
equi
pmen
t
660
--
660
175
485
26.5
%64
722
6
Pa
ymen
t for
fina
ncia
l ass
ets
4,35
3,00
713
7,000
160,
000
4,65
0,00
74,
593,
965
56,0
4298
.8%
4,84
7,417
4,38
5,25
5
Tota
l 5,
542,
776
-34
0,34
55,
883,
121
5,80
7,686
75,4
3598
.7%
5,94
0,68
95,
469,
838

309
PART E: FINANCIAL INFORMATION - Continuedfor the year ended 31 March 2019
APPROPRIATION STATEMENT
SUBP
ROG
RAM
ME:
6.1
: PRO
GRA
MM
E M
AN
AGEM
ENT
FOR
INTE
RNAT
ION
AL
FIN
AN
CIA
L RE
LATI
ON
S20
18/1
920
17/1
8
Adju
sted
Ap
prop
riatio
nSh
iftin
g of
Fun
dsVi
rem
ent
Fina
l Ap
prop
riatio
nAc
tual
Ex
pend
iture
Varia
nce
Expe
nditu
re
as %
of fi
nal
appr
opria
tion
Fina
l Ap
prop
riatio
nAc
tual
Ex
pend
iture
ECO
NO
MIC
CLA
SSIF
ICAT
ION
R’
000
R’00
0R’
000
R’00
0R’
000
R’00
0%
R’00
0R’
000
Curr
ent p
aym
ents
11,5
47(1
,625
)-
9,92
29,
009
913
90.8
%7,5
927,1
61
Com
pens
atio
n of
em
ploy
ees
6,57
7(3
73)
-6,
204
5,56
264
289
.7%
3,79
03,
785
Goo
ds a
nd se
rvic
es4,
970
(1,2
52)
-3,
718
3,44
727
192
.7%
3,80
23,
376
Tran
sfer
s and
subs
idie
s-
--
--
--
346
346
Hou
seho
lds
--
--
--
-34
634
6
Paym
ents
for c
apita
l ass
ets
239
--
239
3420
514
.2%
269
-
Mac
hine
ry a
nd e
quip
men
t23
9-
-23
934
205
14.2
%26
9-
Tota
l 11
,786
(1,6
25)
-10
,161
9,04
31,1
1889
.0%
8,20
77,5
07
SUBP
ROG
RAM
ME
6.2:
INTE
RNAT
ION
AL
ECO
NO
MIC
CO
OPE
RATI
ON
20
18/1
920
17/1
8
Adju
sted
Ap
prop
riatio
nSh
iftin
g of
Fun
dsVi
rem
ent
Fina
l Ap
prop
riatio
nAc
tual
Ex
pend
iture
Varia
nce
Expe
nditu
re
as %
of fi
nal
appr
opria
tion
Fina
l Ap
prop
riatio
nAc
tual
Ex
pend
iture
ECO
NO
MIC
CLA
SSIF
ICAT
ION
R’
000
R’00
0R’
000
R’00
0R’
000
R’00
0%
R’00
0R’
000
Curr
ent p
aym
ents
42,3
521,
613
5,00
048
,965
46,5
542,
411
95.1%
37,16
435
,952
Com
pens
atio
n of
em
ploy
ees
26,8
6137
3-
27,2
3426
,331
903
96.7
%27
,068
26,9
13
Goo
ds a
nd se
rvic
es15
,491
1,24
05,
000
21,7
3120
,223
1,50
893
.1%
10,0
969,
039
Tran
sfer
s and
subs
idie
s-
12-
1212
-10
0.0%
3434
Hou
seho
lds
-12
-12
12-
100.
0%34
34
Paym
ents
for c
apita
l ass
ets
421
--
421
141
280
33.5
%37
822
6
Mac
hine
ry a
nd e
quip
men
t42
1-
-42
114
128
033
.5%
378
226
Paym
ent f
or fi
nanc
ial a
sset
s-
--
-3
(3)
--
Tota
l 42
,773
1,62
55,
000
49,3
9846
,710
2,68
894
.6%
37,5
7636
,211

310
PART E: FINANCIAL INFORMATION - Continuedfor the year ended 31 March 2019
APPROPRIATION STATEMENT
SUBP
ROG
RAM
ME
6.3:
AFR
ICA
N IN
TEG
RATI
ON
AN
D S
UPP
ORT
20
18/1
920
17/1
8
Adju
sted
Ap
prop
riatio
nSh
iftin
g of
Fun
dsVi
rem
ent
Fina
l Ap
prop
riatio
nAc
tual
Ex
pend
iture
Varia
nce
Expe
nditu
re
as %
of fi
nal
appr
opria
tion
Fina
l Ap
prop
riatio
nAc
tual
Ex
pend
iture
ECO
NO
MIC
CLA
SSIF
ICAT
ION
R’
000
R’00
0R’
000
R’00
0R’
000
R’00
0%
R’00
0R’
000
Tran
sfer
s and
subs
idie
s97
8,77
4 (1
37,0
00)
175,
345
1,01
7,119
1,
002,
585
14,5
34
98.6
%89
6,83
0 89
6,25
5
Fore
ign
gove
rnm
ents
and
inte
rnat
iona
l org
anisa
tions
978,
774
(137
,000
)17
5,34
5 1,
017,
119
1,00
2,58
5 14
,534
98
.6%
896,
830
896,
255
Tota
l 97
8,77
4 (1
37,0
00)
175,
345
1,01
7,119
1,
002,
585
14,5
34
98.6
%89
6,83
0 89
6,25
5
SUBP
ROG
RAM
ME
6.4:
INTE
RNAT
ION
AL
DEV
ELO
PMEN
T FU
ND
ING
INST
ITU
TIO
NS
20
18/1
920
17/1
8
Adju
sted
Ap
prop
riatio
nSh
iftin
g of
Fun
dsVi
rem
ent
Fina
l Ap
prop
riatio
nAc
tual
Ex
pend
iture
Varia
nce
Expe
nditu
re
as %
of fi
nal
appr
opria
tion
Fina
l Ap
prop
riatio
nAc
tual
Ex
pend
iture
ECO
NO
MIC
CLA
SSIF
ICAT
ION
R’
000
R’00
0R’
000
R’00
0R’
000
R’00
0%
R’00
0R’
000
Tran
sfer
s and
subs
idie
s13
6,12
0-
-13
6,12
013
6,02
010
099
.9%
130,
132
126,
781
Fore
ign
gove
rnm
ents
and
inte
rnat
iona
l org
anisa
tions
136,
120
--
136,
120
136,
020
100
99.9
%13
0,13
212
6,78
1
Paym
ent f
or fi
nanc
ial a
sset
s4,
353,
007
137,0
0016
0,00
04,
650,
007
4,59
3,96
256
,045
98.8
%4,
847,4
174,
385,
255
Tota
l 4,
489,1
2713
7,000
160,
000
4,78
6,12
74,
729,
982
56,14
598
.8%
4,97
7,549
4,51
2,03
6
SUBP
ROG
RAM
ME
6.5:
INTE
RNAT
ION
AL
PRO
JECT
S
2018
/19
2017
/18
Adju
sted
Ap
prop
riatio
nSh
iftin
g of
Fun
dsVi
rem
ent
Fina
l Ap
prop
riatio
nAc
tual
Ex
pend
iture
Varia
nce
Expe
nditu
re
as %
of fi
nal
appr
opria
tion
Fina
l Ap
prop
riatio
nAc
tual
Ex
pend
iture
ECO
NO
MIC
CLA
SSIF
ICAT
ION
R’
000
R’00
0R’
000
R’00
0R’
000
R’00
0%
R’00
0R’
000
Tran
sfer
s and
subs
idie
s20
,316
--
20,3
1619
,366
950
95.3
%20
,527
17,8
29
Fore
ign
gove
rnm
ents
and
inte
rnat
iona
l org
anisa
tions
20,3
16-
-20
,316
19,3
6695
095
.3%
20,5
2717
,829
Tota
l 20
,316
--
20,3
1619
,366
950
95.3
%20
,527
17,8
29

311
PART E: FINANCIAL INFORMATION - Continuedfor the year ended 31 March 2019
APPROPRIATION STATEMENT
PRO
GRA
MM
E 7:
CIV
IL A
ND
MIL
ITA
RY P
ENSI
ON
S, C
ON
TRIB
UTI
ON
S TO
FU
ND
S A
ND
OTH
ER B
ENEF
ITS
2018
/19
2017
/18
Adju
sted
Ap
prop
riatio
nSh
iftin
g of
Fund
s
Vire
men
tFi
nal
Appr
opria
tion
Actu
al
Expe
nditu
reVa
rianc
eEx
pend
iture
as
% o
f fina
l ap
prop
riatio
n
Fina
l Ap
prop
riatio
nAc
tual
Ex
pend
iture
SUBP
ROG
RAM
ME
R’00
0R’
000
R’00
0R’
000
R’00
0R’
000
%R’
000
R’00
0
1G
OVE
RNM
ENT
PEN
SIO
NS
ADM
INIS
TRAT
ION
AG
ENCY
68,8
56(4
,368
)-
64,4
8864
,488
-10
0.0%
65,1
9662
,061
2CI
VIL
PEN
SIO
NS
AND
CON
TRIB
UTI
ON
S TO
FU
ND
S
4,15
1,35
38,
875
(142
,519
)4,
017,
709
4,01
7,14
256
710
0.0%
3,63
8,82
23,
614,
441
3M
ILITA
RY P
ENSI
ON
S AN
D
OTH
ER B
ENEF
ITS
943,
587
(4,5
07)
-93
9,08
093
8,47
061
099
.9%
944,
184
941,
586
TOTA
L 5,1
63,7
96-
(142
,519
)5,
021,
277
5,02
0,10
01,1
7710
0.0%
4,64
8,20
24,
618,
088
PRO
GRA
MM
E 7:
CIV
IL A
ND
MIL
ITA
RY P
ENSI
ON
S, C
ON
TRIB
UTI
ON
S TO
FU
ND
S A
ND
OTH
ER B
ENEF
ITS
2018
/19
2017
/18
Adju
sted
Ap
prop
riatio
nSh
iftin
g of
Fund
s
Vire
men
tFi
nal
Appr
opria
tion
Actu
al
Expe
nditu
reVa
rianc
eEx
pend
iture
as
% o
f fina
l ap
prop
riatio
n
Fina
l Ap
prop
riatio
nAc
tual
Ex
pend
iture
ECO
NO
MIC
CLA
SSIF
ICAT
ION
R’00
0R’
000
R’00
0R’
000
R’00
0R’
000
%R’
000
R’00
0
Cu
rren
t pay
men
ts68
,856
(4,3
68)
-64
,488
64,4
88-
100.
0%65
,196
62,0
61
G
oods
and
serv
ices
68,8
56(4
,368
)-
64,4
8864
,488
-10
0.0%
65,19
662
,061
Co
nsul
tant
s: Bu
sines
s and
advi
sory
serv
ices
68,8
56(4
,368
)-
64,4
8864
,488
-10
0.0%
65,1
9662
,061
Tr
ansf
ers a
nd su
bsid
ies
5,09
4,94
04,
368
(142
,519
)4,
956,
789
4,95
5,61
21,1
7710
0.0%
4,58
3,00
64,
556,
016
Fo
reig
n go
vern
men
ts a
nd
inte
rnat
iona
l org
anisa
tions
2,69
5(1
,542
)-
1,15
31,
152
199
.9%
2,56
71,
255
H
ouse
hold
s5,
092,
245
5,91
0(1
42,5
19)
4,95
5,63
64,
954,
460
1,176
100.
0%4,
580,
439
4,55
4,76
1
So
cial
ben
efits
5,09
2,24
55,
910
(142
,519
)4,
955,
636
4,95
4,46
01,
176
100.
0%4,
580,
439
4,55
4,76
1
Pa
ymen
t for
fina
ncia
l ass
ets
--
--
--
--
11
To
tal
5,163
,796
-(1
42,5
19)
5,02
1,27
75,
020,
100
1,177
100.
0%4,
648,
202
4,61
8,08
8
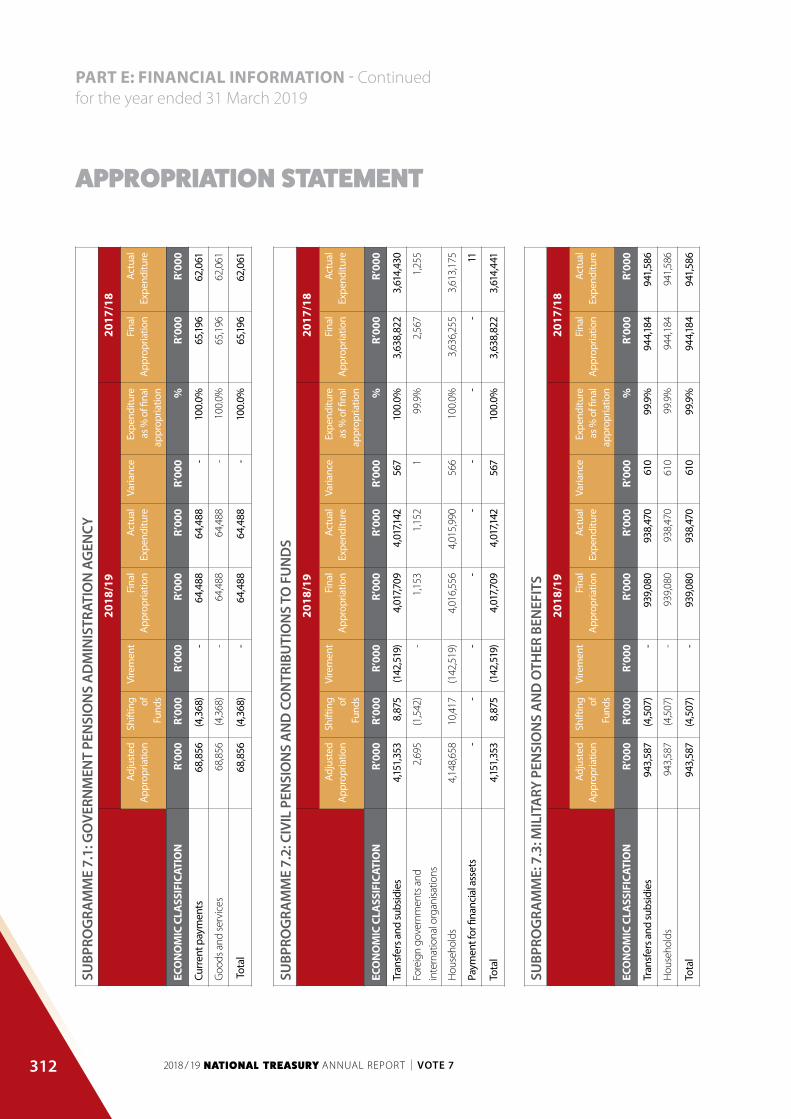
312
PART E: FINANCIAL INFORMATION - Continuedfor the year ended 31 March 2019
APPROPRIATION STATEMENT
SUBP
ROG
RAM
ME
7.1:
GO
VERN
MEN
T PE
NSI
ON
S A
DM
INIS
TRAT
ION
AG
ENCY
20
18/1
920
17/1
8
Adju
sted
Ap
prop
riatio
nSh
iftin
g of
Fund
s
Vire
men
tFi
nal
Appr
opria
tion
Actu
al
Expe
nditu
reVa
rianc
eEx
pend
iture
as
% o
f fina
l ap
prop
riatio
n
Fina
l Ap
prop
riatio
nAc
tual
Ex
pend
iture
ECO
NO
MIC
CLA
SSIF
ICAT
ION
R’
000
R’00
0R’
000
R’00
0R’
000
R’00
0%
R’00
0R’
000
Curr
ent p
aym
ents
68,8
56(4
,368
)-
64,4
8864
,488
-10
0.0%
65,19
662
,061
Goo
ds a
nd se
rvic
es68
,856
(4,3
68)
-64
,488
64,4
88-
100.
0%65
,196
62,0
61
Tota
l 68
,856
(4,3
68)
-64
,488
64,4
88-
100.
0%65
,196
62,0
61
SUBP
ROG
RAM
ME
7.2:
CIV
IL P
ENSI
ON
S A
ND
CO
NTR
IBU
TIO
NS
TO F
UN
DS
20
18/1
920
17/1
8
Adju
sted
Ap
prop
riatio
nSh
iftin
g of
Fund
s
Vire
men
tFi
nal
Appr
opria
tion
Actu
al
Expe
nditu
reVa
rianc
eEx
pend
iture
as
% o
f fina
l ap
prop
riatio
n
Fina
l Ap
prop
riatio
nAc
tual
Ex
pend
iture
ECO
NO
MIC
CLA
SSIF
ICAT
ION
R’
000
R’00
0R’
000
R’00
0R’
000
R’00
0%
R’00
0R’
000
Tran
sfer
s and
subs
idie
s4,
151,
353
8,87
5(1
42,5
19)
4,01
7,709
4,01
7,142
567
100.
0%3,
638,
822
3,61
4,43
0
Fore
ign
gove
rnm
ents
and
inte
rnat
iona
l org
anisa
tions
2,69
5(1
,542
)-
1,15
31,
152
199
.9%
2,56
71,
255
Hou
seho
lds
4,14
8,65
810
,417
(142
,519
)4,
016,
556
4,01
5,99
056
610
0.0%
3,63
6,25
53,
613,
175
Paym
ent f
or fi
nanc
ial a
sset
s-
--
--
--
-11
Tota
l 4,
151,
353
8,87
5(1
42,5
19)
4,01
7,709
4,01
7,142
567
100.
0%3,
638,
822
3,61
4,44
1
SUBP
ROG
RAM
ME:
7.3
: MIL
ITA
RY P
ENSI
ON
S A
ND
OTH
ER B
ENEF
ITS
20
18/1
920
17/1
8
Adju
sted
Ap
prop
riatio
nSh
iftin
g of
Fund
s
Vire
men
tFi
nal
Appr
opria
tion
Actu
al
Expe
nditu
reVa
rianc
eEx
pend
iture
as
% o
f fina
l ap
prop
riatio
n
Fina
l Ap
prop
riatio
nAc
tual
Ex
pend
iture
ECO
NO
MIC
CLA
SSIF
ICAT
ION
R’
000
R’00
0R’
000
R’00
0R’
000
R’00
0%
R’00
0R’
000
Tran
sfer
s and
subs
idie
s94
3,58
7(4
,507
)-
939,
080
938,
470
610
99.9
%94
4,18
494
1,58
6
Hou
seho
lds
943,
587
(4,5
07)
-93
9,08
093
8,47
061
099
.9%
944,
184
941,
586
Tota
l 94
3,58
7(4
,507
)-
939,
080
938,
470
610
99.9
%94
4,18
494
1,58
6

313
PART E: FINANCIAL INFORMATION - Continuedfor the year ended 31 March 2019
APPROPRIATION STATEMENT
PRO
GRA
MM
E 8:
TEC
HN
ICA
L SU
PPO
RT A
ND
DEV
ELO
PMEN
T FI
NA
NCE
20
18/1
920
17/1
8
Adju
sted
Ap
prop
riatio
nSh
iftin
g of
Fun
dsVi
rem
ent
Fina
l Ap
prop
riatio
nAc
tual
Ex
pend
iture
Varia
nce
Expe
nditu
re
as %
of fi
nal
appr
opria
tion
Fina
l Ap
prop
riatio
nAc
tual
Ex
pend
iture
SUBP
ROG
RAM
ME
R’00
0R’
000
R’00
0R’
000
R’00
0R’
000
%R’
000
R’00
0
1LO
CAL
GO
VERN
MEN
T
FIN
ANCI
AL M
ANAG
EMEN
T
SUPP
ORT
645,
481
--
645,
481
645,
481
-10
0.0%
627,
762
627,
762
2U
RBAN
DEV
ELO
PMEN
T AN
D
SUPP
ORT
924,
829
--
924,
829
910,
853
13,9
7698
.5%
983,
253
972,
917
3EM
PLO
YMEN
T CR
EATI
ON
FACI
LITA
TIO
N
689,
000
-(8
5,76
3)60
3,23
733
0,59
727
2,64
054
.8%
609,
990
593,
058
4G
OVE
RNM
ENT
TECH
NIC
AL
ADVI
SORY
CEN
TRE
71,8
58-
-71
,858
71,8
58-
100.
0%80
,818
80,8
18
5IN
FRAS
TRU
CTU
RE
DEV
ELO
PMEN
T SU
PPO
RT
681,
374
--
681,
374
276,
278
405,
096
40.5
%25
6,69
025
1,79
5
TO
TAL
3,01
2,54
2-
(85,
763)
2,92
6,77
92,
235,
067
691,
712
76.4
%2,
558,
513
2,52
6,35
0

314
PART E: FINANCIAL INFORMATION - Continuedfor the year ended 31 March 2019
APPROPRIATION STATEMENT
PRO
GRA
MM
E 8:
TEC
HN
ICA
L SU
PPO
RT A
ND
DEV
ELO
PMEN
T FI
NA
NCE
20
18/1
920
17/1
8
Adju
sted
Ap
prop
riatio
nSh
iftin
g of
Fun
dsVi
rem
ent
Fina
l Ap
prop
riatio
nAc
tual
Ex
pend
iture
Varia
nce
Expe
nditu
re
as %
of fi
nal
appr
opria
tion
Fina
l Ap
prop
riatio
nAc
tual
Ex
pend
iture
ECO
NO
MIC
CLA
SSIF
ICAT
ION
R’00
0R’
000
R’00
0R’
000
R’00
0R’
000
%R’
000
R’00
0
Cu
rren
t pay
men
ts79
4,15
019
,952
-81
4,10
234
9,37
841
7,952
48.7
%35
4,44
232
7,830
G
oods
and
serv
ices
794,
150
19,9
52-
814,
102
396,
150
417,9
5248
.7%
354,
442
327,8
30
Ad
min
istra
tive
fees
-16
-16
151
93.8
%-
-
M
inor
ass
ets
-70
-70
673
95.7
%-
-
Co
mpu
ter s
ervi
ces
-12
-12
66
50.0
%-
-
Co
nsul
tant
s: Bu
sines
s and
advi
sory
serv
ices
394,
150
19,5
71-
413,
721
395,
782
17,9
3995
.7%
354,
442
327,
830
In
frast
ruct
ure
and
plan
ning
serv
ices
400,
000
--
400,
000
-40
0,00
0-
--
Co
nsum
able
supp
lies
-1
-1
1-
100.
0%-
-
Tr
avel
and
subs
isten
ce-
282
-28
227
93
98.9
%-
-
Tr
ansf
ers a
nd su
bsid
ies
2,21
8,39
2(2
0,00
0)(8
5,76
3)2,
112,
629
1,83
8,87
027
3,75
987
.0%
2,20
4,07
12,
198,
520
Pr
ovin
ces a
nd m
unic
ipal
ities
1,54
1,53
4(2
0,00
0)-
1,52
1,53
41,
508,
784
12,7
5099
.2%
1,59
8,28
91,
592,
738
M
unic
ipal
ities
1,54
1,53
4(2
0,00
0)-
1,52
1,53
41,
508,
784
12,7
5099
.2%
1,59
8,28
91,
592,
738
M
unic
ipal
ban
k ac
coun
ts1,
541,
534
(20,
000)
-1,
521,
534
1,50
8,78
412
,750
99.2
%1,
598,
289
1,59
2,73
8
D
epar
tmen
tal a
genc
ies
676,
858
(85,
763)
591,
095
330,
086
261,
009
55.8
%60
5,78
260
5,78
2
D
epar
tmen
tal a
genc
ies (
non-
busin
ess e
ntiti
es)
676,
858
-(8
5,76
3)59
1,09
533
0,08
626
1,00
955
.8%
605,
782
605,
782
Pa
ymen
ts fo
r cap
ital a
sset
s-
48-
4847
197
.9%
--
M
achi
nery
and
equ
ipm
ent
-48
-48
471
97.9
%-
-
O
ther
mac
hine
ry a
nd
equi
pmen
t
-48
-48
471
97.9
%-
-
T
OTA
L3,
012,
542
-(8
5,76
3)2,
926,
779
2,23
5,06
769
1,71
276
.4%
2,55
8,51
32,
526,
350
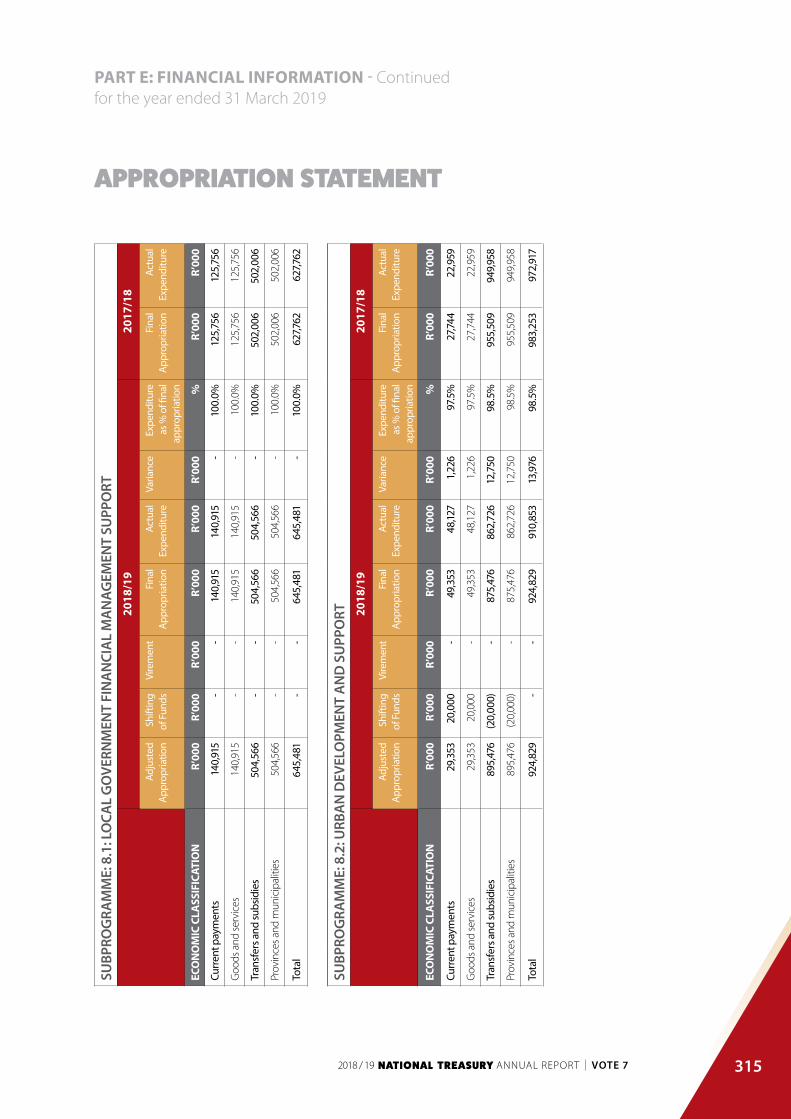
315
PART E: FINANCIAL INFORMATION - Continuedfor the year ended 31 March 2019
APPROPRIATION STATEMENT
SUBP
ROG
RAM
ME:
8.1
: LO
CAL
GO
VERN
MEN
T FI
NA
NCI
AL
MA
NAG
EMEN
T SU
PPO
RT20
18/1
920
17/1
8
Adju
sted
Ap
prop
riatio
nSh
iftin
g of
Fun
dsVi
rem
ent
Fina
l Ap
prop
riatio
nAc
tual
Ex
pend
iture
Varia
nce
Expe
nditu
re
as %
of fi
nal
appr
opria
tion
Fina
l Ap
prop
riatio
nAc
tual
Ex
pend
iture
ECO
NO
MIC
CLA
SSIF
ICAT
ION
R’
000
R’00
0R’
000
R’00
0R’
000
R’00
0%
R’00
0R’
000
Curr
ent p
aym
ents
140,
915
--
140,
915
140,
915
-10
0.0%
125,
756
125,
756
Goo
ds a
nd se
rvic
es14
0,91
5-
-14
0,91
514
0,91
5-
100.
0%12
5,75
612
5,75
6
Tran
sfer
s and
subs
idie
s50
4,56
6-
-50
4,56
650
4,56
6-
100.
0%50
2,00
650
2,00
6
Prov
ince
s and
mun
icip
aliti
es50
4,56
6-
-50
4,56
650
4,56
6-
100.
0%50
2,00
650
2,00
6
Tota
l 64
5,48
1-
-64
5,48
164
5,48
1-
100.
0%62
7,762
627,7
62
SUBP
ROG
RAM
ME:
8.2
: URB
AN
DEV
ELO
PMEN
T A
ND
SU
PPO
RT 2018
/19
2017
/18
Adju
sted
Ap
prop
riatio
nSh
iftin
g of
Fun
dsVi
rem
ent
Fina
l Ap
prop
riatio
nAc
tual
Ex
pend
iture
Varia
nce
Expe
nditu
re
as %
of fi
nal
appr
opria
tion
Fina
l Ap
prop
riatio
nAc
tual
Ex
pend
iture
ECO
NO
MIC
CLA
SSIF
ICAT
ION
R’
000
R’00
0R’
000
R’00
0R’
000
R’00
0%
R’00
0R’
000
Curr
ent p
aym
ents
29,3
5320
,000
-49
,353
48,12
71,
226
97.5
%27
,744
22,9
59
Goo
ds a
nd se
rvic
es29
,353
20,0
00-
49,3
5348
,127
1,22
697
.5%
27,7
4422
,959
Tran
sfer
s and
subs
idie
s89
5,47
6(2
0,00
0)-
875,
476
862,
726
12,7
5098
.5%
955,
509
949,
958
Prov
ince
s and
mun
icip
aliti
es89
5,47
6(2
0,00
0)-
875,
476
862,
726
12,7
5098
.5%
955,
509
949,
958
Tota
l 92
4,82
9-
-92
4,82
991
0,85
313
,976
98.5
%98
3,25
397
2,91
7

316
PART E: FINANCIAL INFORMATION - Continuedfor the year ended 31 March 2019
APPROPRIATION STATEMENT
SUBP
ROG
RAM
ME
8.3:
EM
PLO
YMEN
T CR
EATI
ON
FAC
ILIT
ATIO
N 2018
/19
2017
/18
Adju
sted
Ap
prop
riatio
nSh
iftin
g of
Fun
dsVi
rem
ent
Fina
l Ap
prop
riatio
nAc
tual
Ex
pend
iture
Varia
nce
Expe
nditu
re
as %
of fi
nal
appr
opria
tion
Fina
l Ap
prop
riatio
nAc
tual
Ex
pend
iture
ECO
NO
MIC
CLA
SSIF
ICAT
ION
R’
000
R’00
0R’
000
R’00
0R’
000
R’00
0%
R’00
0R’
000
Curr
ent p
aym
ents
84,0
00-
-84
,000
72,3
6911
,631
86.2
%85
,026
68,0
94
Goo
ds a
nd se
rvic
es84
,000
--
84,0
0072
,369
11,6
3186
.2%
85,0
2668
,094
Tran
sfer
s and
subs
idie
s60
5,00
0-
(85,
763)
519,
237
258,
228
261,
009
49.7
%52
4,96
452
4,96
4
Dep
artm
enta
l age
ncie
s and
acc
ount
s60
5,00
0-
(85,
763)
519,
237
258,
228
261,
009
49.7
%52
4,96
452
4,96
4
Tota
l 68
9,00
0-
(85,
763)
603,
237
330,
597
272,
640
54.8
%60
9,99
059
3,05
8
SUBP
ROG
RAM
ME:
8.4
: GO
VERN
MEN
T TE
CHN
ICA
L A
DVI
SORY
CEN
TRE
2018
/19
2017
/18
Adju
sted
Ap
prop
riatio
nSh
iftin
g of
Fun
dsVi
rem
ent
Fina
l Ap
prop
riatio
nAc
tual
Ex
pend
iture
Varia
nce
Expe
nditu
re
as %
of fi
nal
appr
opria
tion
Fina
l Ap
prop
riatio
nAc
tual
Ex
pend
iture
ECO
NO
MIC
CLA
SSIF
ICAT
ION
R’00
0R’
000
R’00
0R’
000
R’00
0R’
000
%R’
000
R’00
0
Tran
sfer
s and
subs
idie
s71
,858
--
71,8
5871
,858
-10
0.0%
80,8
1880
,818
Dep
artm
enta
l age
ncie
s and
acc
ount
s71
,858
--
71,8
5871
,858
-10
0.0%
80,8
1880
,818
Tota
l 71
,858
--
71,8
5871
,858
-10
0.0%
80,8
1880
,818

317
PART E: FINANCIAL INFORMATION - Continuedfor the year ended 31 March 2019
APPROPRIATION STATEMENT
SUBP
ROG
RAM
ME
8.5:
INFR
AST
RUCT
URE
DEV
ELO
PMEN
T SU
PPO
RT
2018
/19
2017
/18
Adju
sted
Ap
prop
riatio
nSh
iftin
g of
Fun
dsVi
rem
ent
Fina
l Ap
prop
riatio
nAc
tual
Ex
pend
iture
Varia
nce
Expe
nditu
re
as %
of fi
nal
appr
opria
tion
Fina
l Ap
prop
riatio
nAc
tual
Ex
pend
iture
ECO
NO
MIC
CLA
SSIF
ICAT
ION
R’00
0R’
000
R’00
0R’
000
R’00
0R’
000
%R’
000
R’00
0
Curr
ent p
aym
ents
539,
882
(48)
-53
9,83
413
4,73
940
5,09
525
.0%
115,
916
111,
021
Goo
ds a
nd se
rvic
es53
9,88
2(4
8)-
539,
834
134,
739
405,
095
25.0
%11
5,91
611
1,02
1
Tran
sfer
s and
subs
idie
s14
1,49
2-
-14
1,49
214
1,49
2-
100.
0%14
0,77
414
0,77
4
Prov
ince
s and
mun
icip
aliti
es14
1,49
2-
-14
1,49
214
1,49
2-
100.
0%14
0,77
414
0,77
4
Paym
ents
for c
apita
l ass
ets
-48
-48
471
97.9
%-
-
Mac
hine
ry a
nd e
quip
men
t-
48-
4847
197
.9%
--
Tota
l 68
1,37
4-
-68
1,37
427
6,27
840
5,09
640
.5%
256,
690
251,
795
PRO
GRA
MM
E 9:
REV
ENU
E A
DM
INIS
TRAT
ION
2018
/19
2017
/18
Adju
sted
Ap
prop
riatio
nSh
iftin
g of
Fund
s
Vire
men
tFi
nal
Appr
opria
tion
Actu
al
Expe
nditu
reVa
rianc
eEx
pend
iture
as
% o
f fina
l ap
prop
riatio
n
Fina
l Ap
prop
riatio
nAc
tual
Ex
pend
iture
SUBP
ROG
RAM
ME
R’00
0R’
000
R’00
0R’
000
R’00
0R’
000
%R’
000
R’00
0
1SO
UTH
AFR
ICAN
REV
ENU
E
SERV
ICE
9,00
7,21
7-
-9,
007,
217
9,00
7,21
7-
100.
0%10
,218
,198
10,2
18,1
98
TO
TAL
9,00
7,217
--
9,00
7,217
9,00
7,217
-10
0.0%
10,2
18,19
810
,218
,198

318
PART E: FINANCIAL INFORMATION - Continuedfor the year ended 31 March 2019
APPROPRIATION STATEMENT
PRO
GRA
MM
E 9:
REV
ENU
E A
DM
INIS
TRAT
ION
2018
/19
2017
/18
Adju
sted
Ap
prop
riatio
nSh
iftin
g of
Fund
s
Vire
men
tFi
nal
Appr
opria
tion
Actu
al
Expe
nditu
reVa
rianc
eEx
pend
iture
as
% o
f fina
l ap
prop
riatio
n
Fina
l Ap
prop
riatio
nAc
tual
Ex
pend
iture
ECO
NO
MIC
CLA
SSIF
ICAT
ION
R’00
0R’
000
R’00
0R’
000
R’00
0R’
000
%R’
000
R’00
0
Tr
ansf
ers a
nd su
bsid
ies
9,00
7,217
--
9,00
7,217
9,00
7,217
-10
0.0%
10,2
18,19
810
,218
,198
D
epar
tmen
tal a
genc
ies a
nd
acco
unts
9,00
7,217
--
9,00
7,217
9,00
7,217
-10
0.0%
10,2
18,19
810
,218
,198
D
epar
tmen
tal a
genc
ies (
non-
busin
ess e
ntiti
es)
9,00
7,21
7-
-9,
007,
217
9,00
7,21
7-
100.
0%10
,218
,198
10,2
18,1
98
Tota
l9,
007,2
17-
-9,
007,2
179,
007,2
17-
100.
0%10
,218
,198
10,2
18,19
8
SUBP
ROG
RAM
ME
9.1:
SO
UTH
AFR
ICA
N R
EVEN
UE
SERV
ICE
20
18/1
920
17/1
8
Adju
sted
Ap
prop
riatio
nSh
iftin
g of
Fund
s
Vire
men
tFi
nal
Appr
opria
tion
Actu
al
Expe
nditu
reVa
rianc
eEx
pend
iture
as
% o
f fina
l ap
prop
riatio
n
Fina
l Ap
prop
riatio
nAc
tual
Ex
pend
iture
ECO
NO
MIC
CLA
SSIF
ICAT
ION
R’
000
R’00
0R’
000
R’00
0R’
000
R’00
0%
R’00
0R’
000
Tran
sfer
s and
subs
idie
s9,
007,2
17-
-9,
007,2
179,
007,2
17-
100.
0%10
,218
,198
10,2
18,19
8
Dep
artm
enta
l age
ncie
s and
acc
ount
s9,
007,
217
--
9,00
7,21
79,
007,
217
-10
0.0%
10,2
18,1
9810
,218
,198
Tota
l 9,
007,2
17-
-9,
007,2
179,
007,2
17-
100.
0%10
,218
,198
10,2
18,19
8

319
PART E: FINANCIAL INFORMATION - Continuedfor the year ended 31 March 2019
APPROPRIATION STATEMENT
PRO
GRA
MM
E 10
: FIN
AN
CIA
L IN
TELL
IGEN
CE A
ND
STA
TE S
ECU
RITY
2018
/19
2017
/18
Adju
sted
Ap
prop
riatio
nSh
iftin
g of
Fund
s
Vire
men
tFi
nal
Appr
opria
tion
Actu
al
Expe
nditu
reVa
rianc
eEx
pend
iture
as
% o
f fina
l ap
prop
riatio
n
Fina
l Ap
prop
riatio
nAc
tual
Ex
pend
iture
SU
B-PR
OG
RAM
ME
R’00
0R’
000
R’00
0R’
000
R’00
0R’
000
%R’
000
R’00
0
1FI
NAN
CIAL
INTE
LLIG
ENCE
CEN
TRE
278,
716
- -
278,
716
278,
716
- 10
0.0%
270,
191
270,
191
2SE
CRET
SER
VICE
S4,
484,
817
- -
4,48
4,81
7 4,
484,
817
- 10
0.0%
4,83
5,44
8 4,
835,
448
Tot
al4,
763,
533
- -
4,76
3,53
3 4,
763,
533
- 10
0.0%
5,105
,639
5,1
05,6
39
PRO
GRA
MM
E 10
: FIN
AN
CIA
L IN
TELL
IGEN
CE A
ND
STA
TE S
ECU
RITY
2018
/19
2017
/18
Adju
sted
Ap
prop
riatio
nSh
iftin
g of
Fund
s
Vire
men
tFi
nal
Appr
opria
tion
Actu
al
Expe
nditu
reVa
rianc
eEx
pend
iture
as
% o
f fina
l ap
prop
riatio
n
Fina
l Ap
prop
riatio
nAc
tual
Ex
pend
iture
ECO
NO
MIC
CLA
SSIF
ICAT
ION
R'00
0R'
000
R'00
0R'
000
R'00
0R'
000
%R'
000
R'00
0
Tr
ansf
ers a
nd su
bsid
ies
4,76
3,53
3 -
- 4,
763,
533
4,76
3,53
3 -
100.
0%5,1
05,6
39
5,105
,639
D
epar
tmen
tal a
genc
ies a
nd
acco
unts
4,76
3,53
3 -
- 4,
763,
533
4,76
3,53
3 -
100.
0%5,1
05,6
39
5,105
,639
D
epar
tmen
tal a
genc
ies (
non-
busin
ess e
ntiti
es)
4,76
3,53
3 -
- 4,
763,
533
4,76
3,53
3 -
100.
0%5,
105,
639
5,10
5,63
9
Tota
l 4,
763,
533
- -
4,76
3,53
3 4,
763,
533
- 10
0.0%
5,105
,639
5,1
05,6
39

320
PART E: FINANCIAL INFORMATION - Continuedfor the year ended 31 March 2019
APPROPRIATION STATEMENT
SUBP
ROG
RAM
ME
10.1
: FIN
AN
CIA
L IN
TELL
IGEN
CE C
ENTR
E
2018
/19
2017
/18
Adju
sted
Ap
prop
riatio
nSh
iftin
g of
Fund
s
Vire
men
tFi
nal
Appr
opria
tion
Actu
al
Expe
nditu
reVa
rianc
eEx
pend
iture
as
% o
f fina
l ap
prop
riatio
n
Fina
l Ap
prop
riatio
nAc
tual
Ex
pend
iture
ECO
NO
MIC
CLA
SSIF
ICAT
ION
R’
000
R’00
0R’
000
R’00
0R’
000
R’00
0%
R’00
0R’
000
Tran
sfer
s and
subs
idie
s27
8,71
6-
-27
8,71
627
8,71
6-
100.
0%27
0,19
127
0,19
1
Dep
artm
enta
l age
ncie
s and
acc
ount
s27
8,71
6-
-27
8,71
627
8,71
6-
100.
0%27
0,19
127
0,19
1
Tota
l 27
8,71
6-
-27
8,71
627
8,71
6-
100.
0%27
0,19
127
0,19
1
SUB-
PRO
GRA
MM
E 10
.2 :
SECR
ET S
ERVI
CES
20
18/1
920
17/1
8
Adju
sted
Ap
prop
riatio
nSh
iftin
g of
Fund
s
Vire
men
tFi
nal
Appr
opria
tion
Actu
al
Expe
nditu
reVa
rianc
eEx
pend
iture
as
% o
f fina
l ap
prop
riatio
n
Fina
l Ap
prop
riatio
nAc
tual
Ex
pend
iture
ECO
NO
MIC
CLA
SSIF
ICAT
ION
R’
000
R’00
0R’
000
R’00
0R’
000
R’00
0%
R’00
0R’
000
Tran
sfer
s and
subs
idie
s4,
484,
817
--
4,48
4,81
74,
484,
817
-10
0.0%
4,83
5,44
84,
835,
448
Dep
artm
enta
l age
ncie
s and
acc
ount
s4,
484,
817
--
4,48
4,81
74,
484,
817
-10
0.0%
4,83
5,44
84,
835,
448
Tota
l 4,
484,
817
--
4,48
4,81
74,
484,
817
-10
0.0%
4,83
5,44
84,
835,
448

321
PART E: FINANCIAL INFORMATION - Continuedfor the year ended 31 March 2019
1. DETAIL OF TRANSFERS AND SUBSIDIES AS PER APPROPRIATION ACT (AFTER VIREMENT):
Detail of these transactions can be viewed in the note on Transfers and subsidies, disclosure notes and Annexure 1 (A-G) to the
Annual Financial Statements.
2. DETAIL OF SPECIFICALLY AND EXCLUSIVELY APPROPRIATED AMOUNTS VOTED (AFTER VIREMENT):
Detail of these transactions can be viewed in note 1 (Annual Appropriation) to the Annual Financial Statements.
3. DETAIL ON PAYMENTS FOR FINANCIAL ASSETS
Detail of these transactions per programme can be viewed in the note on Payments for financial assets to the Annual Financial
Statements.
4. EXPLANATIONS OF MATERIAL VARIANCES FROM AMOUNTS VOTED (AFTER VIREMENT):
4.1
Per programme:
Final Appropriation
Actual Expenditure
Variance Variance as a % of Final
Appropriation
R’000 R’000 R’000 %
Programme 1: Administration 453,819 424,274 29,545 6.5%
Underspending of R4.1 million on compensation of employees was mainly due to vacant posts not being filled. Savings of R13.3 million
on goods and services items such as computer services, consultancy services, contractors, stationary and travel costs were mainly due to
implementation of the cost containment measures. Underspending of R12.2 million on machinery and equipment mainly due to the pending
procurement of wireless infrastructure for the Centurion building as well as upgrading the current obsolete wireless infrastructure in Cape Town,
240 Madiba Street and 40 Church Buildings.
Programme 2: Economic Policy, Tax, Financial Regulation and Research
152,770 138,756 14,014 9.2%
Unspent funds of R7.7 million on transfer and subsidies was mainly due to transfer payment to the Economic Research Southern Africa (ERSA)
which did not materialise as a result of discontinuation of the research. Underspending of R5.7 million on compensation of employees was
mainly due to vacant posts not being filled. The saving of R600 000 on various items mainly due to implementation of cost containment
measures.
NOTES TO THE APPROPRIATION STATEMENT

322
PART E: FINANCIAL INFORMATION - Continuedfor the year ended 31 March 2019
NOTES TO THE APPROPRIATION STATEMENT
Programme 3: Public Finance and Budget Management 298,047 295,370 2,677 0.9%
The Underspending of R601 000 on compensation of employees was mainly due to vacant posts that haven’t been filled. Furthermore the
saving of R1.3 million on goods and services was on various items such as bursaries, catering, entertainment, travel and stationery mainly due
to implementation of cost containment measures. Underspending of R800 000 on machinery and equipment due to non-replacement of
obsolete equipment.
Programme 4: Asset and Liability Management 101,585 91,185 10,400 10.2%
Underspending of R4.9 million on compensation of employees was mainly due to vacant posts not being filled. Underspending of R5.5 million
on goods and services was mainly due delays in the appointment of a consultant to assist with the completion of the final phase of the ALM
Back Office System as well as the tender issuance process for a new support, maintenance and enhancement contract for the ALM Back Office
System.
Programme 5: Financial Accounting and Supply Chain Management Systems
1,102,085 869,104 232,981 21.1%
Underspending of R227.8 million on goods and services was mainly on the Integrated Financial Management Systems (IFMS) project relating
to the rescheduling of the procurement of various services. Underspending of R4.5 million on machinery and equipment was due to non-
replacement of system servers for transversal systems.
Programme 6: International Financial Relations 5,883,121 5,807,686 75,435 1.3%
Saving of R56 million on payment of financial assets was mainly due to saving realised on payment to New Development Bank (NDB) and
African Development Bank (AfDB) as a result of foreign exchange rate difference. Saving of R15.6 million on transfers and subsidies was mainly
on Common Monetary Area (CMA) compensation due to less than anticipated yield on the South African long term bonds. The underspending
of R1.5 million on compensation of employees was mainly due to vacant posts not being filled. Saving of R2.3 million on goods and services on
various items mainly due to implementation of the cost containment measures.
Programme 7: Civil and Military Pensions, Contributions to Funds and Other Benefits
5,021,277 5,020,100 1,177 0.0%
The expenditure on the programme was on par with the budgeted amount with immaterial variance.
Programme 8: Technical Support and Development Finance
2,926,779 2,235,067 691,712 23.6%

323
PART E: FINANCIAL INFORMATION - Continuedfor the year ended 31 March 2019
NOTES TO THE APPROPRIATION STATEMENT
Underspending of R464 million on goods and services was mainly due to R400 million on the Development Bank Southern Africa (DBSA)
Infrastructure funds which were not transferred due to pending Memorandum of Agreement and the Business case and R64 million mainly
on Jobs Fund operational expenditure which experienced delays in appointing service providers in the Job Fund operational budget. The
underspending of R226 million on transfers and subsidies was mainly on the Jobs Fund grant disbursement due to lower than projected
disbursements by the Jobs Fund Partners for the current financial year.
Programme 9: Revenue Administration 9,007,217 9,007,217 - 0.0%
The expenditure on the programme was on par with the budgeted amount.
Programme 10: Financial Intelligence and State Security 4,763,533 4,763,533 - 0.0%
The expenditure on the programme was on par with the budgeted amount.

324
PART E: FINANCIAL INFORMATION - Continuedfor the year ended 31 March 2019
NOTES TO THE APPROPRIATION STATEMENT
4.2
Per economic classification: Final Appropriation
Actual Expenditure
Variance Variance as a % of Final
Appropriation
R’000 R’000 R’000 %
Current expenditure 2,755,192 2,071,255 683,937 24.8%
Compensation of employees 807,760 790,344 17,416 2.2%
Goods and services 1,947,432 1,280,911 666,521 34.2%
Transfers and subsidies 22,261,909 21,962,846 299,063 1.3%
Provinces and municipalities 1,521,534 1,508,784 12,750 0.8%
Departmental agencies and accounts 14,588,296 14,327,242 261,054 1.8%
Public corporations and private enterprises 7,862 - 7,862 100.0%
Foreign governments and international organisations 1,174,708 1,159,123 15,585 1.3%
Households 4,969,509 4,967,694 1,815 0.0%
Payments for capital assets 43,125 23,448 19,677 45.6%
Machinery and equipment 35,868 20,466 15,402 42.9%
Software and other intangible assets 7,257 2,982 4,275 58.9%
Payments for financial assets 4,650,007 4,594,743 55,264 1.2%
Total per economic classification 29,710,233 28,652,292 1,057,941 3.6%
Underspending in compensation of employees was mainly due to longer turnaround time to fill vacant positions and on goods and services
was mainly from IFMS projects, Jobs Fund Indirect Fund and the Development Bank Southern Africa (DBSA) Infrastructure funds which
were not transferred. Material variance on transfers and subsidies was mainly on Jobs Fund grant disbursement due to lower than projected
disbursements by the Jobs Fund Partners.

325
PART E: FINANCIAL INFORMATION - Continuedfor the year ended 31 March 2019
NOTES TO THE APPROPRIATION STATEMENT
4.3
Per conditional grant Final Appropriation
Actual Expenditure
Variance Variance as a % of Final
Appropriation.
R’000 R’000 R’000 %
Financial Management grant - municipalities 504,566 504,566 - 0.0%
Infrastructure Skills Development grant - municipalities 141,492 141,492 - 0.0%
Neighbourhood Development Partnership grant 581,867 569,117 12,750 2.2%
Integrated Cities Development grant 293,609 293,609 - 0.0%
Neighbourhood Development Partnership indirect grant 49,353 48,127 1,226 2.5%
TOTAL 1,570,887 1,556,911 13,976
The underspending on the Neighbourhood Development Partnership Grants (NDPG) was due to funds that were withheld to certain
municipalities, subsequent to various issues such as procurement delays, failure to report actual spending on a regular bases and failure to
spent 80% of the transferred funds before the next tranche of funding is released.

326
PART E: FINANCIAL INFORMATION - Continuedfor the year ended 31 March 2019
2018/19 2017/18
Notes R’000 R’000
REVENUE
Annual appropriation 1 29,710,233 40,484,306
Departmental revenue 2 7,113,723 4,430,772
Aid assistance 3 64,268 20,209
TOTAL REVENUE 36,888,224 44,935,287
EXPENDITURE
Current expenditure
Compensation of employees 4 790,344 803,732
Goods and services 5 1,280,910 1,121,319
Aid assistance 3 49,958 14,324
Total current expenditure 2,121,212 1,939,375
Transfers and subsidies
Transfers and subsidies 7 21,962,844 23,454,215
Total transfers and subsidies 21,962,844 23,454,215
Expenditure for capital assets
Tangible assets 8 20,467 26,997
Intangible assets 8 2,982 41
Total expenditure for capital assets 23,449 27,038
Payments for financial assets 6 4,594,743 14,385,767
TOTAL EXPENDITURE 28,702,248 39,806,395
SURPLUS FOR THE YEAR 8,185,976 5,128,892
Reconciliation of Net Surplus for the year
Voted Funds 1,057,943 692,235
Annual appropriation 1,045,192 686,684
Conditional grants 12,751 5,551
Departmental revenue and NRF Receipts 7,113,723 4,430,772
Aid assistance 14,310 5,885
SURPLUS FOR THE YEAR 8,185,976 5,128,892
STATEMENT OF FINANCIAL PERFORMANCE

327
PART E: FINANCIAL INFORMATION - Continued
2018/19 2017/18
Notes R’000 R’000
ASSETS
Current Assets 1,109,759 705,732
Cash and cash equivalents 9 1,067,642 604,765
Prepayments and advances 10 18,485 88,829
Receivables 11 23,632 12,138
Non-Current Assets 404,756 23,433,483
Investments 12 400,956 23,409,714
Receivables 11 3,800 23,769
TOTAL ASSETS 1,514,515 24,139,215
LIABILITIES
Current Liabilities 1,112,665 728,391
Voted funds to be surrendered to the Revenue Fund 14 1,057,940 692,235
Departmental revenue and NRF Receipts to be surrendered to the
Revenue Fund 15 23,851 244
Payables 16 16,663 30,027
Aid assistance repayable 3 14,211 5,885
TOTAL LIABILITIES 1,112,665 728,391
NET ASSETS 401,850 23,410,824
Represented by:
Capitalisation reserve 400,957 23,409,714
Recoverable revenue 893 1,110
TOTAL 401,850 23,410,824
STATEMENT OF FINANCIAL POSITIONAS AT 31 MARCH 2019
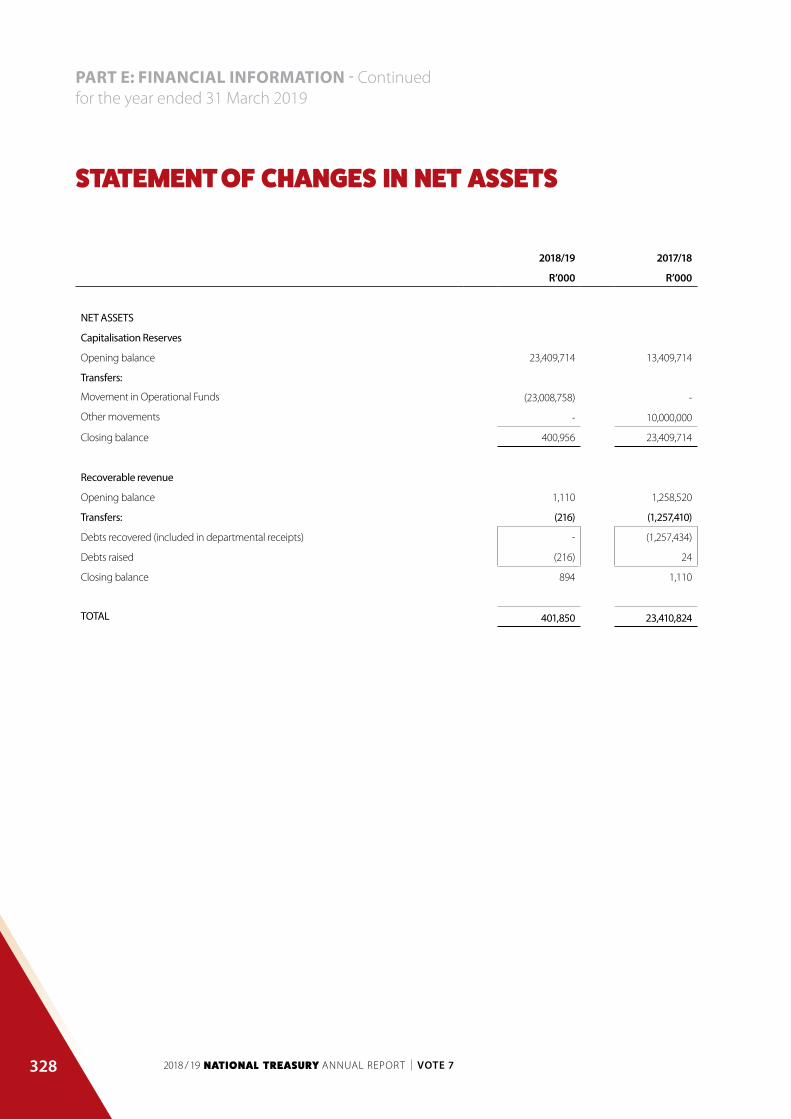
328
PART E: FINANCIAL INFORMATION - Continuedfor the year ended 31 March 2019
2018/19 2017/18
R’000 R’000
NET ASSETS
Capitalisation Reserves
Opening balance 23,409,714 13,409,714
Transfers:
Movement in Operational Funds (23,008,758) -
Other movements - 10,000,000
Closing balance 400,956 23,409,714
Recoverable revenue
Opening balance 1,110 1,258,520
Transfers: (216) (1,257,410)
Debts recovered (included in departmental receipts) - (1,257,434)
Debts raised (216) 24
Closing balance 894 1,110
TOTAL 401,850 23,410,824
STATEMENT OF CHANGES IN NET ASSETS
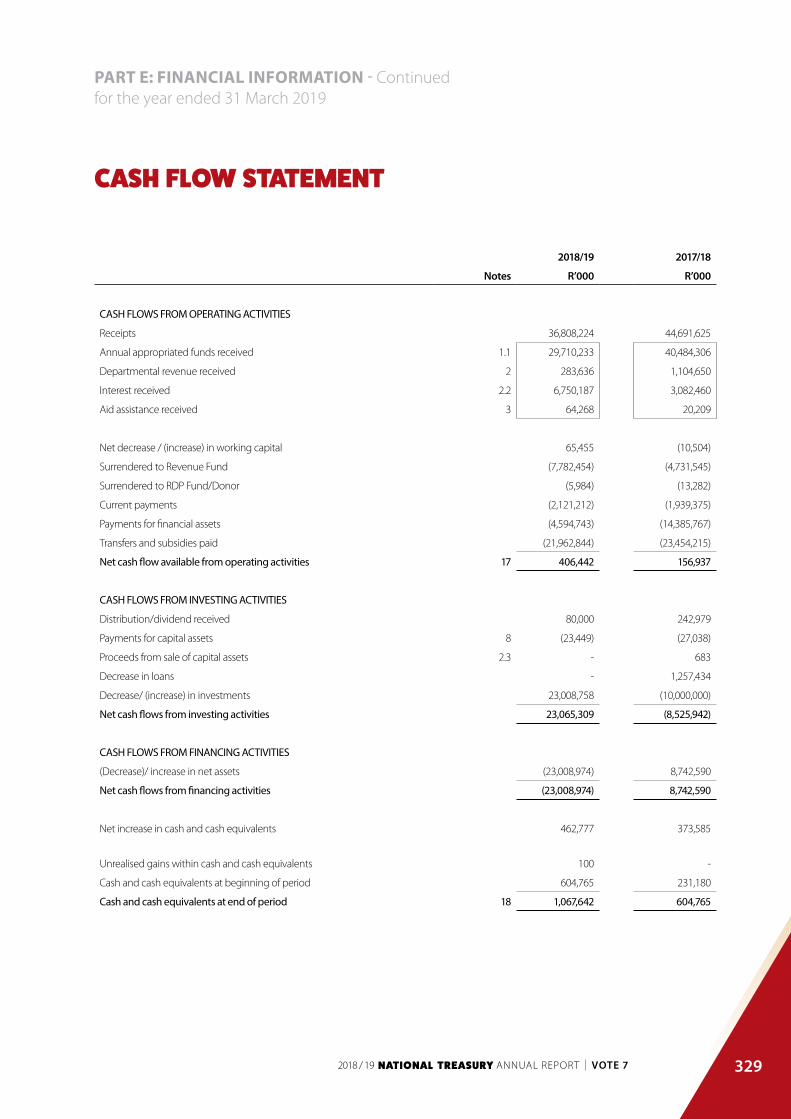
329
PART E: FINANCIAL INFORMATION - Continuedfor the year ended 31 March 2019
2018/19 2017/18
Notes R’000 R’000
CASH FLOWS FROM OPERATING ACTIVITIES
Receipts 36,808,224 44,691,625
Annual appropriated funds received 1.1 29,710,233 40,484,306
Departmental revenue received 2 283,636 1,104,650
Interest received 2.2 6,750,187 3,082,460
Aid assistance received 3 64,268 20,209
Net decrease / (increase) in working capital 65,455 (10,504)
Surrendered to Revenue Fund (7,782,454) (4,731,545)
Surrendered to RDP Fund/Donor (5,984) (13,282)
Current payments (2,121,212) (1,939,375)
Payments for financial assets (4,594,743) (14,385,767)
Transfers and subsidies paid (21,962,844) (23,454,215)
Net cash flow available from operating activities 17 406,442 156,937
CASH FLOWS FROM INVESTING ACTIVITIES
Distribution/dividend received 80,000 242,979
Payments for capital assets 8 (23,449) (27,038)
Proceeds from sale of capital assets 2.3 - 683
Decrease in loans - 1,257,434
Decrease/ (increase) in investments 23,008,758 (10,000,000)
Net cash flows from investing activities 23,065,309 (8,525,942)
CASH FLOWS FROM FINANCING ACTIVITIES
(Decrease)/ increase in net assets (23,008,974) 8,742,590
Net cash flows from financing activities (23,008,974) 8,742,590
Net increase in cash and cash equivalents 462,777 373,585
Unrealised gains within cash and cash equivalents 100 -
Cash and cash equivalents at beginning of period 604,765 231,180
Cash and cash equivalents at end of period 18 1,067,642 604,765
CASH FLOW STATEMENT

330
PART E: FINANCIAL INFORMATION - Continuedfor the year ended 31 March 2019
PART A: ACCOUNTING POLICIES
SUMMARY OF SIGNIFICANT ACCOUNTING POLICIES
The financial statements have been prepared in accordance with the following policies which have been applied consistently
in all material aspects unless otherwise indicated. Management has concluded that the financial statements present fairly the
Department’s primary and secondary information.
The historical cost convention has been used except where otherwise indicated. Management has used assessments and estimates
in preparing the annual financial statements. These are based on the best information available at the time of preparation.
Where appropriate and meaningful additional information has been disclosed to enhance the usefulness of the financial statements
and to comply with the statutory requirements of the Public Finance Management Act (PFMA) Act 1 of 1999 (as mended by Act 29
of 1999) and the Treasury Regulations issued in terms of the PFMA and the annual Division of Revenue Act.
1. BASIS OF PREPARATIONThe financial statements have been prepared in accordance with the Modified Cash Standard.
2. GOING CONCERNThe financial statements have been prepared on a going concern basis.
3. PRESENTATION CURRENCYAmounts have been presented in the currency of the South African Rand (R) which is also the functional currency of the department.
4. ROUNDINGUnless otherwise stated financial figures have been rounded to the nearest one thousand Rand (R’000).
5. FOREIGN CURRENCY TRANSLATIONCash flows arising from foreign currency transactions are translated into South African Rands using the spot exchange rates prevailing
at the date of payment/receipt and end of March 2019 for disclosure purposes.
6. COMPARATIVE INFORMATION
6.1 Prior period comparative information
Prior period comparative information has been presented in the current year’s financial statements. Where necessary figures included
in the prior period financial statements have been reclassified to ensure that the format in which the information is presented is
consistent with the format of the current year’s financial statements.
NOTES TO THE ANNUAL FINANCIAL STATEMENTS

331
PART E: FINANCIAL INFORMATION - Continuedfor the year ended 31 March 2019
NOTES TO THE ANNUAL FINANCIAL STATEMENTS
6.2 Current year comparison with budget
A comparison between the approved final budget and actual amounts for each programme and economic classification is included
in the appropriation statement.
7. REVENUE
7.1 Appropriated funds
Appropriated funds comprise of departmental allocations but exclude direct charges against the revenue fund (i.e. statutory
appropriation) which are reported and audited separately as part of the consolidated annual financial statements. This includes
extra-ordinary receipts.
Appropriated funds are recognised in the statement of financial performance on the date the appropriation becomes effective.
Adjustments made in terms of the adjustments budget process are recognised in the statement of financial performance on the
date the adjustments become effective.
The net amount of any appropriated funds due to/from the relevant revenue fund at the reporting date is recognised as a payable/
receivable in the statement of financial position.
7.2 DEPARTMENTAL REVENUEDepartmental revenue is recognised in the statement of financial performance when received and is subsequently paid into the
relevant revenue fund unless stated otherwise. Any amount owing to the relevant revenue fund at the reporting date is recognised
as a payable in the statement of financial position.
7.3 ACCRUED DEPARTMENTAL REVENUEAccruals in respect of departmental revenue (excluding tax revenue) are recorded in the notes to the financial statements when:
• It is probable that the economic benefits or service potential associated with the transaction will flow to the department;
and
• The amount of revenue can be measured reliably.
• The accrued revenue is measured at the fair value of the consideration receivable. Accrued tax revenue (and related
interest and / penalties) is measured at amounts receivable from collecting agents. Write-offs are made according to the
department’s write-off policy.
8. EXPENDITURE
8.1 Compensation of employees
8.1.1 Salaries and wages
Salaries and wages are recognised in the statement of financial performance on the date of payment.

332
PART E: FINANCIAL INFORMATION - Continuedfor the year ended 31 March 2019
NOTES TO THE ANNUAL FINANCIAL STATEMENTS
8.1.2 Social contributions
Social contributions made by the department in respect of current employees are recognised in the statement of financial
performance on the date of payment. Social contributions made by the department in respect of ex-employees are classified as
transfers to households in the statement of financial performance on the date of payment.
8.2 Other expenditure
Other expenditure (such as goods and services transfers and subsidies and payments for capital assets) is recognised in the statement
of financial performance on the date of payment. The expense is classified as a capital expense if the total consideration paid is more
than the capitalisation threshold.
8.3 Accruals and payables not recognised
Accruals and payables not recognised are recorded in the notes to the financial statements when the goods are received or in the
case of services when they are rendered to the department or in case of transfers and subsidies when they are due and payable.
Accruals and payables not recognised are measured at cost.
8.4 Leases
8.4.1 Operating leases
Operating lease payments made during the reporting period are recognised as current expenditure in the statement of financial
performance on the date of payment. The operating lease commitments are recorded in the notes to the financial statements.
Buildings and other fixed structures lease commitments are based on 12 months projection and there are no signed agreements
with Public Works; it is an on-going negotiation.
8.4.2 Finance leases
Finance lease payments made during the reporting period are recognised as capital expenditure in the statement of financial
performance on the date of payment.
The finance lease commitments are recorded in the notes to the financial statements and are not apportioned between the capital
and interest portions. Finance lease assets acquired at the end of the lease term are recorded and measured at the lower of:
• Cost being the fair value of the asset; or
• The sum of the minimum lease payments made including any payments made to acquire ownership at the end of the lease
term excluding interest.
9. AID ASSISTANCE
9.1 Aid assistance received
Aid assistance received in cash is recognised in the statement of financial performance when received. In-kind aid assistance is
recorded in the notes to the financial statements on the date of receipt and is measured at fair value.
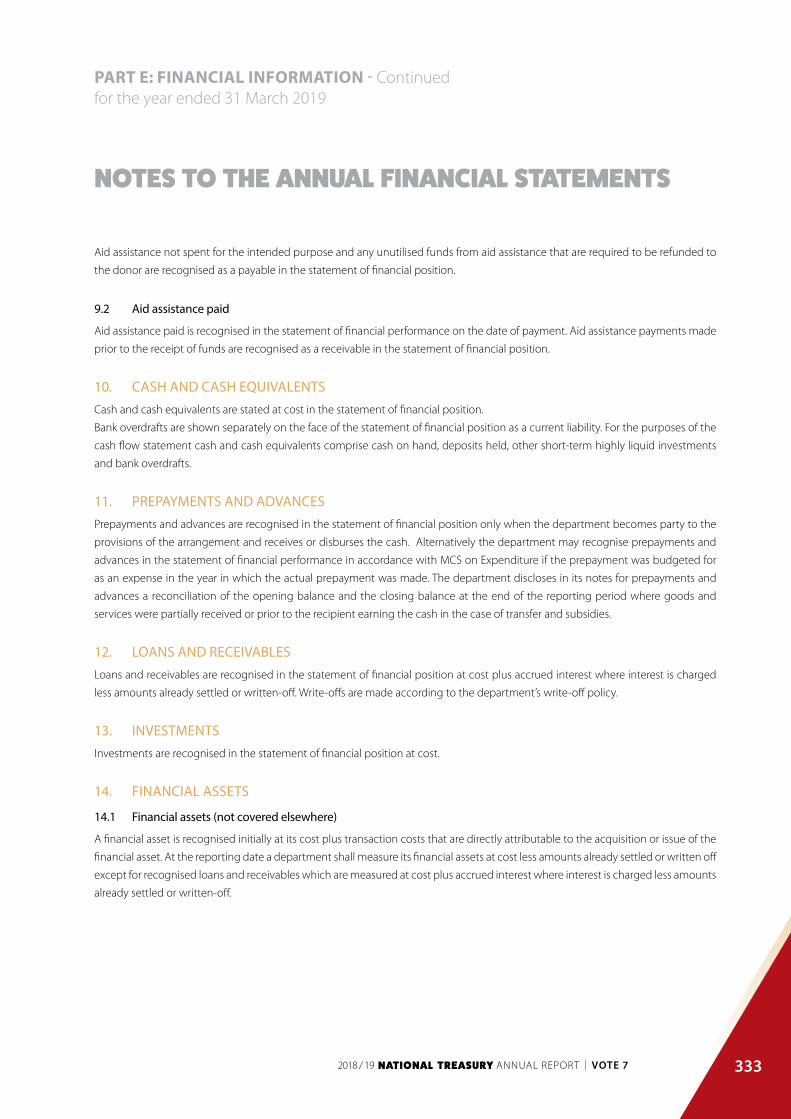
333
PART E: FINANCIAL INFORMATION - Continuedfor the year ended 31 March 2019
NOTES TO THE ANNUAL FINANCIAL STATEMENTS
Aid assistance not spent for the intended purpose and any unutilised funds from aid assistance that are required to be refunded to
the donor are recognised as a payable in the statement of financial position.
9.2 Aid assistance paid
Aid assistance paid is recognised in the statement of financial performance on the date of payment. Aid assistance payments made
prior to the receipt of funds are recognised as a receivable in the statement of financial position.
10. CASH AND CASH EQUIVALENTSCash and cash equivalents are stated at cost in the statement of financial position.
Bank overdrafts are shown separately on the face of the statement of financial position as a current liability. For the purposes of the
cash flow statement cash and cash equivalents comprise cash on hand, deposits held, other short-term highly liquid investments
and bank overdrafts.
11. PREPAYMENTS AND ADVANCESPrepayments and advances are recognised in the statement of financial position only when the department becomes party to the
provisions of the arrangement and receives or disburses the cash. Alternatively the department may recognise prepayments and
advances in the statement of financial performance in accordance with MCS on Expenditure if the prepayment was budgeted for
as an expense in the year in which the actual prepayment was made. The department discloses in its notes for prepayments and
advances a reconciliation of the opening balance and the closing balance at the end of the reporting period where goods and
services were partially received or prior to the recipient earning the cash in the case of transfer and subsidies.
12. LOANS AND RECEIVABLESLoans and receivables are recognised in the statement of financial position at cost plus accrued interest where interest is charged
less amounts already settled or written-off. Write-offs are made according to the department’s write-off policy.
13. INVESTMENTSInvestments are recognised in the statement of financial position at cost.
14. FINANCIAL ASSETS
14.1 Financial assets (not covered elsewhere)
A financial asset is recognised initially at its cost plus transaction costs that are directly attributable to the acquisition or issue of the
financial asset. At the reporting date a department shall measure its financial assets at cost less amounts already settled or written off
except for recognised loans and receivables which are measured at cost plus accrued interest where interest is charged less amounts
already settled or written-off.

334
PART E: FINANCIAL INFORMATION - Continuedfor the year ended 31 March 2019
NOTES TO THE ANNUAL FINANCIAL STATEMENTS
14.2 Impairment of financial assets
Where there is an indication of impairment of a financial asset an estimation of the reduction in the recorded carrying value to reflect
the best estimate of the amount of the future economic benefits expected to be received from that asset is recorded in the notes
to the financial statements.
15. PAYABLESLoans and payables are recognised in the statement of financial position at cost.
16. CAPITAL ASSETS
16.1 Immovable capital assets
Immovable capital assets are initially recorded in the notes to the financial statements at cost. Immovable capital assets acquired
through a non-exchange transaction is measured at fair value as at the date of acquisition.
Where the cost of immovable capital assets cannot be determined reliably the immovable capital assets are measured at cost / fair
value for recording in the asset register.
Immovable capital assets are subsequently carried at cost and are not subject to depreciation or impairment. Subsequent expenditure
that is of a capital nature is added to the cost of the asset at the end of the capital project unless the immovable asset is recorded by
another department in which case the completed project costs are transferred to that department.
16.2 Movable capital assets
Movable capital assets are initially recorded in the notes to the financial statements at cost. Movable capital assets acquired through
a non-exchange transaction is measured at fair value as at the date of acquisition. Where the cost of movable capital assets cannot
be determined reliably the movable capital assets are measured at fair value and where fair value cannot be determined the movable
assets are measured at R1. All assets acquired prior to 1 April 2002 (or a later date as approved by the OAG) are recorded at R1.
Movable capital assets are subsequently carried at cost and are not subject to depreciation or impairment. Subsequent expenditure
that is of a capital nature is added to the cost of the asset at the end of the capital project unless the movable asset is recorded by
another department/entity in which case the completed project costs are transferred to that department.
16.3 Intangible assets
Intangible assets are initially recorded in the notes to the financial statements at cost. Intangible assets acquired through a no
exchange transaction are measured at fair value as at the date of acquisition. Internally generated intangible assets are recorded
in the notes to the financial statements when the department commences the development phase of the project. Where the
cost of intangible assets cannot be determined reliably the intangible capital assets are measured at fair value and where fair
value cannot be determined; the intangible assets are measured at R1. All assets acquired prior to 1 April 2002 (or a later date as
approved by the OAG) are recorded at R1. Intangible assets are subsequently carried at cost and are not subject to depreciation or
Impairment. Subsequent expenditure that is of a capital nature is added to the cost of the asset at the end of the capital project
unless the intangible asset is recorded by another department/entity in which case the completed project costs are transferred to
that department.
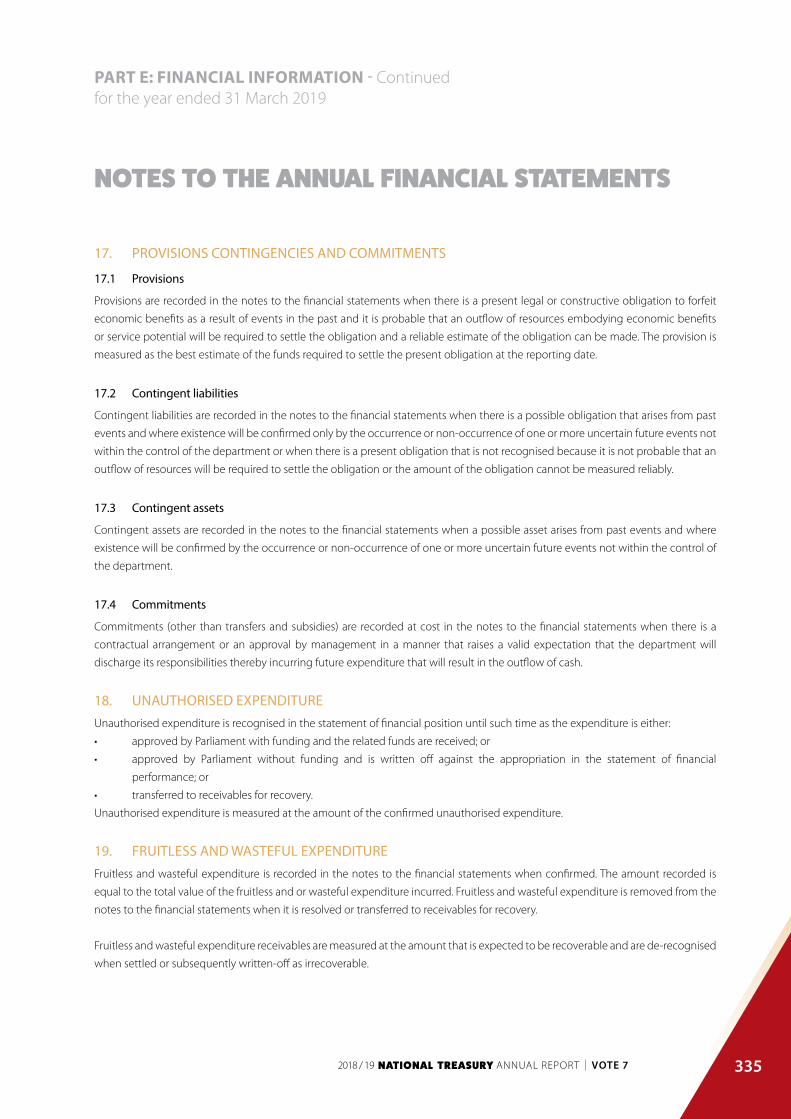
335
PART E: FINANCIAL INFORMATION - Continuedfor the year ended 31 March 2019
NOTES TO THE ANNUAL FINANCIAL STATEMENTS
17. PROVISIONS CONTINGENCIES AND COMMITMENTS
17.1 Provisions
Provisions are recorded in the notes to the financial statements when there is a present legal or constructive obligation to forfeit
economic benefits as a result of events in the past and it is probable that an outflow of resources embodying economic benefits
or service potential will be required to settle the obligation and a reliable estimate of the obligation can be made. The provision is
measured as the best estimate of the funds required to settle the present obligation at the reporting date.
17.2 Contingent liabilities
Contingent liabilities are recorded in the notes to the financial statements when there is a possible obligation that arises from past
events and where existence will be confirmed only by the occurrence or non-occurrence of one or more uncertain future events not
within the control of the department or when there is a present obligation that is not recognised because it is not probable that an
outflow of resources will be required to settle the obligation or the amount of the obligation cannot be measured reliably.
17.3 Contingent assets
Contingent assets are recorded in the notes to the financial statements when a possible asset arises from past events and where
existence will be confirmed by the occurrence or non-occurrence of one or more uncertain future events not within the control of
the department.
17.4 Commitments
Commitments (other than transfers and subsidies) are recorded at cost in the notes to the financial statements when there is a
contractual arrangement or an approval by management in a manner that raises a valid expectation that the department will
discharge its responsibilities thereby incurring future expenditure that will result in the outflow of cash.
18. UNAUTHORISED EXPENDITUREUnauthorised expenditure is recognised in the statement of financial position until such time as the expenditure is either:
• approved by Parliament with funding and the related funds are received; or
• approved by Parliament without funding and is written off against the appropriation in the statement of financial
performance; or
• transferred to receivables for recovery.
Unauthorised expenditure is measured at the amount of the confirmed unauthorised expenditure.
19. FRUITLESS AND WASTEFUL EXPENDITUREFruitless and wasteful expenditure is recorded in the notes to the financial statements when confirmed. The amount recorded is
equal to the total value of the fruitless and or wasteful expenditure incurred. Fruitless and wasteful expenditure is removed from the
notes to the financial statements when it is resolved or transferred to receivables for recovery.
Fruitless and wasteful expenditure receivables are measured at the amount that is expected to be recoverable and are de-recognised
when settled or subsequently written-off as irrecoverable.

336
PART E: FINANCIAL INFORMATION - Continuedfor the year ended 31 March 2019
NOTES TO THE ANNUAL FINANCIAL STATEMENTS
20. IRREGULAR EXPENDITUREIrregular expenditure is recorded in the notes to the financial statements when confirmed. The amount recorded is equal to the
value of the irregular expenditure incurred unless it is impracticable to determine in which case reasons therefore are provided in
the note.
Irregular expenditure is removed from the note when it is either condoned by the relevant authority transferred to receivables for
recovery or not condoned and is not recoverable.
Irregular expenditure receivables are measured at the amount that is expected to be recoverable and are de-recognised when
settled or subsequently written-off as irrecoverable.
21. CHANGES IN ACCOUNTING POLICIES ACCOUNTING ESTIMATES AND ERRORSChanges in accounting policies that are effected by management have been applied retrospectively in accordance with Modified
Cash Standard (MCS) requirements except to the extent that it is impracticable to determine the period-specific effects or the
cumulative effect of the change in policy. In such instances the department shall restate the opening balances of assets liabilities
and net assets for the earliest period for which retrospective restatement is practicable.
Changes in accounting estimates are applied prospectively in accordance with MCS requirements.
Correction of errors is applied retrospectively in the period in which the error has occurred in accordance with MCS requirements
except to the extent that it is impracticable to determine the period-specific effects or the cumulative effect of the error. In such cases
the department shall restate the opening balances of assets liabilities and net assets for the earliest period for which retrospective
restatement is practicable.
22. EVENTS AFTER THE REPORTING DATEEvents after the reporting date that are classified as adjusting events have been accounted for in the financial statements. The events
after the reporting date that are classified as non-adjusting events after the reporting date have been disclosed in the notes to the
financial statements.
23. PRINCIPAL - AGENT ARRANGEMENTSThe department is party to a principal-agent arrangement for administrative services rendered on behalf of the National Treasury
with respect to Programme 7 Civil and Military Pensions Contributions(GPAA mainly). The department is the Principal and provides
funding and other benefits to the Government Pension Administration Agency (GPAA) as well as to the Government Technical
Advisory Centre which provides technical assistance. Development Bank of Southern Africa is an agent in relation to the Cities
Support Programme. In terms of these arrangements the department is the Principal and is responsible for providing funding for
both programmes. All related revenues expenditures assets and liabilities have been recognised or recorded in terms of the relevant
policies listed herein. Additional disclosures have been provided in the notes to the financial statements where appropriate.

337
PART E: FINANCIAL INFORMATION - Continuedfor the year ended 31 March 2019
NOTES TO THE ANNUAL FINANCIAL STATEMENTS
24. CAPITALISATION RESERVEThe capitalisation reserve comprises of financial assets and/or liabilities originating in a prior reporting period but which are
recognised in the statement of financial position for the first time in the current reporting period. Amounts are recognised in the
capitalisation reserves when identified in the current period and are transferred to the National Revenue Fund when the underlying
asset is disposed and the related funds are received.
25. RECOVERABLE REVENUEAmounts are recognised as recoverable revenue when a payment made in a previous financial year becomes recoverable from a
debtor in the current financial year. Amounts are either transferred to the National Revenue Fund when recovered or are transferred
to the statement of financial performance when written-off.
26. RELATED PARTY TRANSACTIONSA related party transaction is a transfer of resources services or obligations between the reporting entity and a related party. Related
party transactions within the Minister’s portfolio are recorded in the notes to the financial statements when the transaction is not
at arm’s length.
Key management personnel are those persons having the authority and responsibility for planning directing and controlling
the activities of the department. The number of individuals and their full compensation is recorded in the notes to the financial
statements.
27. EMPLOYEE BENEFITSThe value of each major class of employee benefit obligation (accruals payables not recognised and provisions) is disclosed in the
Employee benefits note.

338
PART E: FINANCIAL INFORMATION - Continuedfor the year ended 31 March 2019
NOTES TO THE ANNUAL FINANCIAL STATEMENTS
PART B: EXPLANATORY NOTES
1. ANNUAL APPROPRIATION
1.1 Annual Appropriation
Annual Appropriation 2018/19 2017/18
Funds not
Final Actual Funds requested/ Final Appropriation
Appropriation Received not received Appropriation Received
Programmes R’000 R’000 R’000 R’000 R’000
1 Administration 453,819 453,819 - 445,620 445,620
2
Economic Policy, Tax, Financial
Regulation and Research 152,770 152,770 - 163,991 163,991
3
Public Finance and Budget
Management 298,047 298,047 - 302,296
302,296
4
Asset and Liability
Management 101,585 101,585 - 10,100,312
10,100,312
5
Financial Accounting and
Supply Chain Management
Systems 1,102,085 1,102,085 - 1,000,846
1,000,846
6
International Financial
Relations 5,883,121 5,883,121 - 5,940,689
5,940,689
7
Civil and Military Pensions,
Contributions to Funds and
Other Benefits 5,021,277 5,021,277 - 4,648,202
4,648,202
8
Technical Support and
Development Finance 2,926,779 2,926,779 - 2,558,513
2,558,513
9 Revenue Administration 9,007,217 9,007,217 - 10,218,198 10,218,198
10
Financial Intelligence and
State Security 4,763,533 4,763,533 - 5,105,639
5,105,639
Total 29,710,233 29,710,233 - 40,484,306 40,484,306

339
PART E: FINANCIAL INFORMATION - Continuedfor the year ended 31 March 2019
NOTES TO THE ANNUAL FINANCIAL STATEMENTS
2018/19 2017/18
Note R’000 R’000
1.2 Conditional grants
Conditional grants
Total grants received 39 1,576,728 1,621,385
Conditional grants are included as part of the Annual Appropriation. Refer to note 39 for more information on the conditional grants.
2. DEPARTMENTAL REVENUE
Departmental Revenue
Sales of goods and services other than capital assets 2.1 125,379 116,648
Interest, dividends and rent on land 2.2 6,830,187 3,325,439
Sales of capital assets 2.3 - 683
Transactions in financial assets and liabilities 2.4 158,157 988,002
Departmental revenue collected 7,113,723 4,430,772
2.1 Sales of goods and services other than capital assets
Sales of goods and services produced by the department 125,191 116,637
Sales by market establishment 90 99
Administrative fees 1 1
Other sales1 125,100 116,537
Sales of scrap, waste and other used current goods 188 11
Total 125,379 116,648
2.2 Interest, dividends and rent on land
Interest 6,750,187 3,082,460
Dividends 80,000 242,979
Total 6,830,187 3,325,439
The increase in interest was due to higher interest received from investments made with the South African Reserve Bank.
1 The sale of capital assets was recognised in other sales items since the sales of capital assets items on BAS system was inactive

340
PART E: FINANCIAL INFORMATION - Continuedfor the year ended 31 March 2019
NOTES TO THE ANNUAL FINANCIAL STATEMENTS
2.3 Sale of capital assets
Sales of capital assets
Machinery and equipment - 683
Total - 683
2.4 Transactions in financial assets and liabilities
Loans and advances - 840,000
Receivables 24,863 467
Other Receipts including Recoverable Revenue 133,294 147,535
Total 158,157 988,002
The decrease in loans and advances was due to a Gautrain loan which was paid-off in the previous financial year 2017/18.
2.5 Cash received not recognised – 2018/19
Name of entity Amount received
Amount paid to Revenue Fund
Balance
R’000 R’000 R’000
Funds surrendered by municipalities 458,751 (458,751) -
Total 458,751 (458,751) - Cash received not recognised – 2017/18
Name of entity Amount received
Amount paid to Revenue Fund
Balance
R’000 R’000 R’000
Funds surrendered by municipalities 169,060 (169,060) -
Total 169,060 (169,060) -
3. AID ASSISTANCE
2018/19 2017/18
R’000 R’000
Opening Balance 5,885 13,282
Prior period error
As restated 5,885 13,282

341
PART E: FINANCIAL INFORMATION - Continuedfor the year ended 31 March 2019
NOTES TO THE ANNUAL FINANCIAL STATEMENTS
Transferred from statement of financial performance 14,310 5,885
Paid during the year (5,984) (13,282)
Closing Balance 14,211 5,885
Refer to annexure 1F for more information on aid assistance.
3.2 Analysis of balance by source
Aid assistance from RDP 14,211 5,885
Closing Balance 14,211 5,885
3.3 Analysis of balance
Aid assistance repayable 14,211 5,885
Closing balance 14,211 5,885
3.2.1 Aid assistance (expensed) - 2018/19
Amount as at 1 April 2018
Add: Received in the current
year
Less: Paid back by/on 31 March
2019
Less: Current Year expenditure
Amount as at 31 March 2019
R’000 R’000 R’000 R’000 R’000
Goods and services 5,885 64,268 (5,984) (49,958) 14,211
Closing balance 5,885 64,268 (5,984) (49,958) 14,211
3.3 Aid assistance expenditure per economic classification
Current 49,958 14,324
Total aid assistance expenditure 49,958 14,324
Refer to annexure 1F for more information on Aid Assistance Received.
2018/19 2017/18
Note R’000 R’000

342
PART E: FINANCIAL INFORMATION - Continuedfor the year ended 31 March 2019
NOTES TO THE ANNUAL FINANCIAL STATEMENTS
4. COMPENSATION OF EMPLOYEES
4.1 Salaries and Wages
Basic salary 540,350 543,858
Performance award 12,309 12,364
Service Based 1,693 1,945
Compensative/circumstantial 2,617 1,668
Other non-pensionable allowances 150,534 161,706
Total 707,503 721,541
Compensative/circumstantial payments and allowances paid to employees as compensation for cost relating to operational or job
requirements relating to acting allowance. Other non-pensionable allowances refer to all other non-pensionable allowances not separately
provided for e.g. housing allowances.
4.2 Social contributions
Employer contributions
R’000 R’000
Pension 67,199 66,706
Medical 15,551 15,393
Bargaining Council 91 92
Total 82,841 82,191
Total compensation of employees 790,344 803,732
Average number of employees 1,062 1,133
2018/19 2017/18
Note R’000 R’000
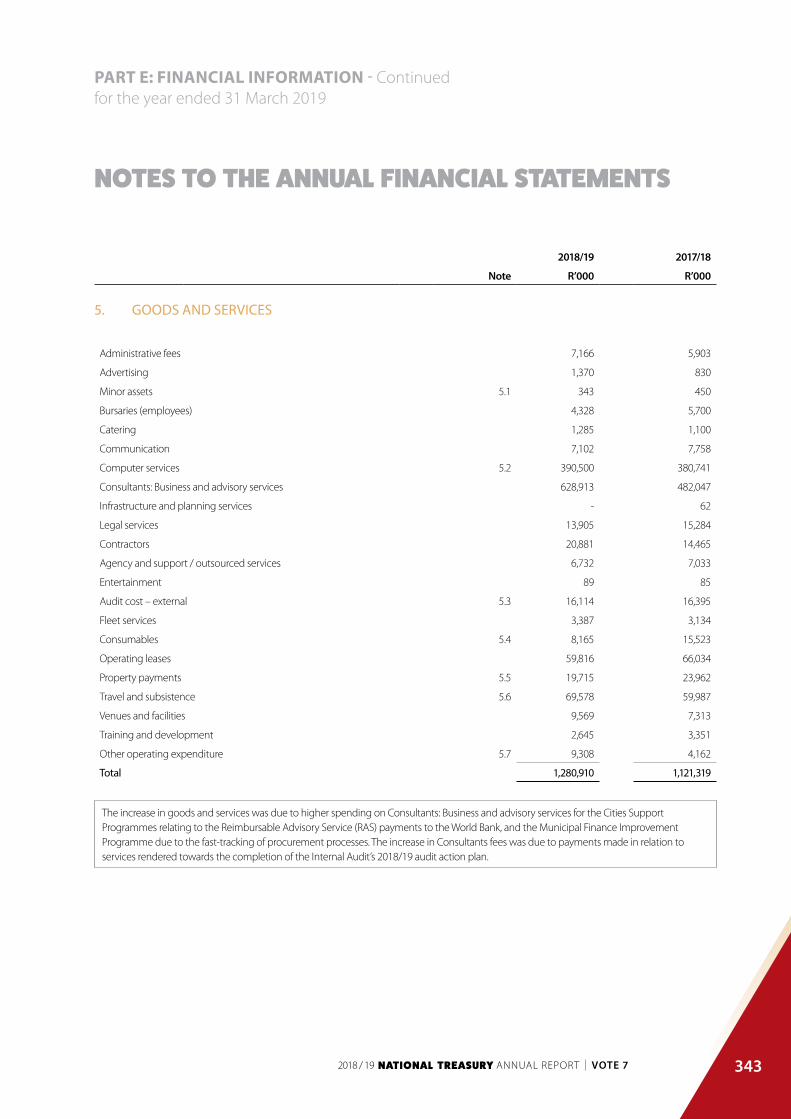
343
PART E: FINANCIAL INFORMATION - Continuedfor the year ended 31 March 2019
NOTES TO THE ANNUAL FINANCIAL STATEMENTS
5. GOODS AND SERVICES
Administrative fees 7,166 5,903
Advertising 1,370 830
Minor assets 5.1 343 450
Bursaries (employees) 4,328 5,700
Catering 1,285 1,100
Communication 7,102 7,758
Computer services 5.2 390,500 380,741
Consultants: Business and advisory services 628,913 482,047
Infrastructure and planning services - 62
Legal services 13,905 15,284
Contractors 20,881 14,465
Agency and support / outsourced services 6,732 7,033
Entertainment 89 85
Audit cost – external 5.3 16,114 16,395
Fleet services 3,387 3,134
Consumables 5.4 8,165 15,523
Operating leases 59,816 66,034
Property payments 5.5 19,715 23,962
Travel and subsistence 5.6 69,578 59,987
Venues and facilities 9,569 7,313
Training and development 2,645 3,351
Other operating expenditure 5.7 9,308 4,162
Total 1,280,910 1,121,319
The increase in goods and services was due to higher spending on Consultants: Business and advisory services for the Cities Support Programmes relating to the Reimbursable Advisory Service (RAS) payments to the World Bank, and the Municipal Finance Improvement Programme due to the fast-tracking of procurement processes. The increase in Consultants fees was due to payments made in relation to services rendered towards the completion of the Internal Audit’s 2018/19 audit action plan.
2018/19 2017/18
Note R’000 R’000

344
PART E: FINANCIAL INFORMATION - Continuedfor the year ended 31 March 2019
NOTES TO THE ANNUAL FINANCIAL STATEMENTS
5.1 Minor assets
Tangible assets
Machinery and equipment 343 450
Total 343 450
5.2 Computer services
SITA computer services 48,868 45,991
External computer service providers 341,632 334,750
Total 390,500 380,741
Increase in computer services was due to an increase in payments relating to the legacy systems’ operational support (PERSAL and LOGIS);
payments made in 2018/19 financial year were higher than payments made in the financial year 2017/18.
5.3 Audit cost – External
Regularity audits 16,114 16,395
Total 16,114 16,395
5.4 Consumables
Consumable supplies 2,472 2,306
Uniform and clothing 24 123
Household supplies 1,657 1,594
Building material and supplies 92 7
IT consumables 645 547
Other consumables 52 35
Stationery, printing and office supplies 5,693 13,217
Total 8,165 15,523
The decrease in consumable supplies was due to the implementation of cost containment measures within the department.
2018/19 2017/18
Note R’000 R’000

345
PART E: FINANCIAL INFORMATION - Continuedfor the year ended 31 March 2019
NOTES TO THE ANNUAL FINANCIAL STATEMENTS
5.5 Property payments
Municipal services 18,696 22,812
Property management fees 935 1,150
Other 84 -
Total 19,715 23,962
5.6 Travel and subsistence
Local 34,313 10,835
Foreign 35,265 49,152
Total 69,578 59,987
The increase in foreign travel was due to an increase in the number of international roads shows to attract foreign investors
5.7 Other operating expenditure
Professional bodies, membership and subscription fees 3,129 3,585
Resettlement costs 73 382
Other 6,106 195
Total 9,308 4,162
Increase in other operating expenditure relates to the printing expenditure of various budget documentation which was an erroneous
allocation and was paid under Stationery, Printing and Office Supplies in previous financial year 2017/18.
6. PAYMENTS FOR FINANCIAL ASSETS
Purchase of equity 4,593,962 14,385,255
Debts written off 6.1 781 512
Total 4,594,743 14,385,767
Purchase of equity relates to payment made to the New Development Bank (NDB) amounting to R4.2 billion for the current year (2017/18
R4.1 billion) and R312 million payment made to African Development Bank. South African Airways (SAA) was transferred to Department
of Public Enterprises, therefore there was no payment made to SAA in the current year as compared to a R10 billion payment made in
2017/18 financial year.
2018/19 2017/18
Note R’000 R’000

346
PART E: FINANCIAL INFORMATION - Continuedfor the year ended 31 March 2019
NOTES TO THE ANNUAL FINANCIAL STATEMENTS
6.1 Debts written off
Losses and damages 781 512
Total 781 512
7. TRANSFERS AND SUBSIDIES
2018/19 2017/18
R’000 R’000
Provinces and municipalities Annexure 1A 1,508,784 1,592,738
Departmental agencies and accounts Annexure 1B 14,327,245 16,250,953
Foreign governments and international organisations Annexure 1D 1,159,123 1,042,121
Public corporations and private enterprises Annexure 1C - 5,000
Households Annexure 1E 4,967,692 4,563,403
Total 21,962,844 23,454,215
The decrease in Departmental agencies and accounts was due to the reduction on transfers made to the South African Revenue Service (R1.2
billion) and the Government Technical Advisory Centre (R228.9 million), Secret Services (R350.6 million), Audit Statutory Bodies (R98.5 million)
were Adhoc payments that were lesser than prior year.
8. EXPENDITURE FOR CAPITAL ASSETS
Tangible assets 20,467 26,997
Machinery and equipment 32.1 20,467 26,997
Intangible assets 2,982 41
Software 35.1 2,982 41
Total 23,449 27,038
The decrease in machinery and equipment was due to a minimum number of replacement of redundant computer equipment and. The
increase in 2018/19 Intangible assets was due to purchase of software licences for Information and Communication Technology.
2018/19 2017/18
Note R’000 R’000

347
PART E: FINANCIAL INFORMATION - Continuedfor the year ended 31 March 2019
NOTES TO THE ANNUAL FINANCIAL STATEMENTS
8.1 Analysis of funds utilised to acquire capital assets – 2018/19
Voted Funds Aid assistance TOTAL
R’000 R’000 R’000
Tangible assets 20,467 - 20,467
Machinery and equipment 20,467 - 20,467
Intangible assets 2,982 - 2,982
Software 2,982 - 2,982
Total 23,449 - 23,449
8.2 Analysis of funds utilised to acquire capital assets – 2017/18
Voted Funds Aid assistance TOTAL
R’000 R’000 R’000
Tangible assets 26,997 - 26,997
Machinery and equipment 26,997 - 26,997
Intangible assets 41 - 41
Software 41 - 41
Total 27,038 - 27,038
8.3 Finance lease expenditure included in expenditure for capital assets
Tangible assets
Machinery and equipment 4 75
Total 4 75
2018/19 2017/18
Note R’000 R’000

348
PART E: FINANCIAL INFORMATION - Continuedfor the year ended 31 March 2019
NOTES TO THE ANNUAL FINANCIAL STATEMENTS
9. CASH AND CASH EQUIVALENTS
Consolidated Paymaster General Account 1,016,202 604,424
Cash on hand 20 20
Cash with commercial bank 51,420 321
Total 1,067,642 604,765
The increase in Consolidated Paymaster General Account is mainly due to unspent funds on IFMS projects, Jobs Fund, as well as funds which
were not transferred to Development Bank of the Southern Africa (DBSA) to support infrastructure in public sector institution.
10. PREPAYMENTS AND ADVANCES
Travel and subsistence 20 3
Prepayments (Not expensed) 10.2 18,168 88,467
Advances paid (Not expensed) 10.1 297 359
Total 18,485 88,829
Decrease in prepayments and advance was due to no prepayments made to Government Pensions Administration Agency (GPAA) as
compared to the previous financial year where payments were made on 30 March 2018 (Friday) for claims that were due for 1 April 2018
(Weekend).
2018/19 2017/18
Note R’000 R’000

349
PART E: FINANCIAL INFORMATION - Continuedfor the year ended 31 March 2019
NOTES TO THE ANNUAL FINANCIAL STATEMENTS
10.1 Advances paid (Not expensed)
2018/19
Balance as at 1 April 2018
Less: Amount expensed in current year
Add/Less: Other
Add: Current Year advances
Balance as at 31 March 2019
R’000 R’000 R’000 R’000 R’000
National departments 359 (359) - - -
Public entities - - 297 - 297
Total 359 (359) 297 - 297
Advance payment of R297 000 on Public Entities.
2017/18 Balance as at 1 April 2017
Less: Amount expensed in current year
Add/Less: Other
Add: Current Year advances
Balance as at 31 March 2018
Advances paid (Not expensed) R’000 R’000 R’000 R’000 R’000
National departments 76 (76) - 359 359
Provincial departments - - - - -
Public entities 95 (95) - - -
Other institutions - - - - -
Total 171 (171) - 359 359
Advance payment made to Department of International Relations and Cooperation (DIRCO). Refer to annexure 5A
10.2 Prepayments (Not expensed)
2018/19 Balance as at 1 April 2018
Less: Amount expensed in current year
Add/Less: Other
Add: Current Year
prepayments
Balance as at 31 March 2019
R’000 R’000 R’000 R’000 R’000
Listed by economic classification
Goods and services 18,434 (804) - - 17,630
Other 70,033 (70,033) - 538 538
Total 88,467 (70,837) - 538 18,168
2018/19 2017/18
Note R’000 R’000

350
PART E: FINANCIAL INFORMATION - Continuedfor the year ended 31 March 2019
NOTES TO THE ANNUAL FINANCIAL STATEMENTS
The decrease from 2017/18 was due to civil and military claims that were due on 1 April 2018 (Sunday) valued at R70 million but were paid on
30 March 2018 (Friday). The amount for goods and services relates to a mobilisation of IFMS fee of R19 million incurred in 2016/17 of which R804
000 was expensed in 2018/19.
2017/18 Balance as at 1 April 2017
Less: Amount expensed in current year
Add/Less: Other
Add: Current Year
prepayments
Balance as at 31 March 2018
Prepayments (Not expensed) R’000 R’000 R’000 R’000 R’000
Listed by economic classification
Goods and services 19,049 (615) - - 18,434
Other - - - 70,033 70,033
Total 19,049 (615) - 70,033 88,467
10.3 Advances paid (Expensed)
2018/19
Balance as at 1 April 2018
Add/(Less): Other
Amount expensed in the
current year
Add: Current Year advances
Amount as at 31 March 2019
R’000 R’000 R’000 R’000 R’000
GTAC - MFIP 69,110 (95,446) 140,915 114,579
Public entities - Jobs Funds 41,639 (88,411) (283,825) 330,597 -
DBSA - Cities Support Programme - - - 14,600 14,600
Total 110,749 (88,411) (379,271) 486,112 129,179
NT made advance payments to Public Entities as follows: Government Technical Advisory Centre (GTAC) R140, 915 million and R14, 6 million
was paid to the Development Bank of Southern Africa (DBSA).
2018/19 2017/18
Note R’000 R’000

351
PART E: FINANCIAL INFORMATION - Continuedfor the year ended 31 March 2019
NOTES TO THE ANNUAL FINANCIAL STATEMENTS
2017/18
Balance as at 1 April 2018
Add/(Less): Other
Less: Amount expensed in current year
Add: Current Year advances
Balance as at 31 March 2018
R’000 R’000 R’000 R’000 R’000
GTAC - MFIP 73,745 - (130,391) 125,756 69,110
Jobs Funds 473 - (551,892) 593,058 41,639
Total 74,218 - ( 682,283) 718,814 110,749
11. RECEIVABLES
2018/19 2017/18
Current Non-current Total Current Non-current Total
Note R’000 R’000 R’000 R’000 R’000 R’000
Claims recoverable 11.1 209 1,949 2,158 7,093 1,888 8,981
Recoverable expenditure 11.2 749 530 1,279 2,054 - 2,054
Staff debt 11.3 257 979 1,236 263 1,306 1,569
Other receivables 11.4 22,417 342 22,759 2,728 20,575 23,303
Total 23,632 3,800 27,432 12,138 23,769 35,907
11.1 Claims recoverable
National departments 984 7,895
Provincial departments 21 21
Foreign governments 1,153 1,065
Total 2,158 8,981
11.2 Recoverable expenditure
Disallow damages & Losses 710 728
Disallowance miscellaneous 560 1,322
Private telephones 9 4
Total 1,279 2,054
2018/19 2017/18
Note R’000 R’000

352
PART E: FINANCIAL INFORMATION - Continuedfor the year ended 31 March 2019
NOTES TO THE ANNUAL FINANCIAL STATEMENTS
11.3 Staff debts
Departmental debts 1,236 1,569
Total 1,236 1,569
11.4 Other receivables
Value added tax (SARS.) 1,348 556
Amount owed by departments - Civil and military pensions 4,060 3,851
Outstanding debts - Civil and military pensions. 32 30
Disallowance - Civil and military pensions 4,382 4,705
Disallowance - Special pensions 12,937 14,161
Total 22,759 23,303
11.5 Impairment of receivables
Estimate of impairment of receivables 8,351 7,788
Total 8,351 7,788
Irrecoverable debt owing to Civil Military Pension (GPAA) due to debtors that were discovered to have been deceased.
12. INVESTMENTS
Development Bank of Southern Africa 200,000 200,000
Public Investment Corporation Limited 1 1
Land Bank 200,955 200,955
South African Airways - 23,008,758
Total 400,956 23,409,714
The decrease on investments relates to SAA being transferred to Department of Public Enterprises in terms the Presidential announcement
that was made effective from 1 August 2018.
2018/19 2017/18
Note R’000 R’000

353
PART E: FINANCIAL INFORMATION - Continuedfor the year ended 31 March 2019
NOTES TO THE ANNUAL FINANCIAL STATEMENTS
Impairment of investments
Opening Balance 23,008,758 23,008,758
Estimate of impairment of investments (23,008,758) -
Total - 23,008,758
13. LOANS
Public corporations
- -
Total - -
Analysis of Balance
Opening balance - 1,257,434
Repayments - (1,257,434)
Closing balance - -
Gautrain loan was settled on 6 April 2017 in PMG account.
14. VOTED FUNDS TO BE SURRENDERED TO THE REVENUE FUND
2018/19 2017/18
R’000 R’000
Opening balance 692,235 271,634
Transfer from statement of financial performance 1,057,943 692,235
Paid during the year (692,238) (271,634)
Closing balance 1,057,940 692,235
The increase in voted funds to be surrendered to the revenue fund was mainly due to unspent funds on IFMS projects, Jobs Fund.
2018/19 2017/18
Note R’000 R’000

354
PART E: FINANCIAL INFORMATION - Continuedfor the year ended 31 March 2019
NOTES TO THE ANNUAL FINANCIAL STATEMENTS
15. DEPARTMENTAL REVENUE AND NRF RECEIPTS TO BE SURRENDERED TO THE REVENUE FUND
Opening balance 344 29,383
Prior period error 100
Transfer from Statement of Financial Performance 7,113,723 4,430,772
Paid during the year (7,090,216) (4,459,911)
Closing balance 23,851 344
16. PAYABLE - CURRENT
Advances received 16.1 4,068 45
Clearing accounts 16.2 183 73
Other payables 16.3 12,412 29,909
Total 16,663 30,027
16.1 Advances received
National departments Annex 5B - 33
Other institutions Annex 5B 4,068 12
Total 4,068 45
16.2 Clearing accounts
Income Tax (PAYE) 167 48
Pension Fund - 2
Government Employees Housing Scheme - 23
Salary Reversal 16 -
Total 183 73
2018/19 2017/18
Note R’000 R’000

355
PART E: FINANCIAL INFORMATION - Continuedfor the year ended 31 March 2019
NOTES TO THE ANNUAL FINANCIAL STATEMENTS
16.3 Other payables
Civil, Military and Special Pensions 12,412 29,909
Total 12,412 29,909
The decrease in 2018/19 was due to civil and military claims that were due on 1 April 2018 (Sunday), paid on 30 March 2018 (Friday).
17. NET CASH FLOW AVAILABLE FROM OPERATING ACTIVITIES
Net surplus as per Statement of Financial Performance 8,185,976 5,128,892
Add back non cash/cash movements not deemed operating activities (7,779,534) (4,971,955)
Decrease/(Increase) in receivables 8,475 (5,067)
Decrease/(Increase in prepayments and advances 70,344 (2,069)
Increase/(decrease) in payables – current (13,364) (3,368)
Proceeds from sale of capital assets (683)
Expenditure on capital assets 23,449 27,038
Surrenders to Revenue Fund (7,782,454) (4,731,545)
Surrenders to RDP Fund/Donor (5,984) (13,282)
Other non-cash items (80,000) (242,979)
Net cash flow generated by operating activities 406,442 156,937
The increase in voted funds surrendered to Revenue Fund was due to higher interest received from investments made with South African
Reserve Bank for Foreign Deposit Account and Sterilization Account.
18. RECONCILIATION OF CASH AND CASH EQUIVALENTS FOR CASH FLOW PURPOSES
Consolidated Paymaster General account 1,016,202 604,424
Cash on hand 20 20
Cash with commercial banks (Local) 51,420 321
Total 1,067,642 604,765
2018/19 2017/18
Note R’000 R’000

356
PART E: FINANCIAL INFORMATION - Continuedfor the year ended 31 March 2019
NOTES TO THE ANNUAL FINANCIAL STATEMENTS
19. CONTINGENT LIABILITIES
Other guarantees Annex 3A 5,298,419 18,923,409
Claims against the department Annex 3B 102,294,697 2,366,855
Other Annex 3B 382,308 481,788
Total 107,975,424 21,772,052
The increase of R86 billion was due to new claims in the 2018/19 financial year against the Department.
20. COMMITMENTS
Current expenditure
Approved and contracted 3,691,636 5,082,360
GTAC 139,650 171,430
Total Commitments 3.831,286 5,253,790
The decrease in commitments was due to the majority of contracts that expired by the reporting date. The approved and contracted
commitments are made up of the SCM related contract i.e. Goods and services of R1.7 billion (2017/18: R2.3 billion) and the Non-Statutory
Forces commitment of R1.986 billion (2017/18: R2.7 billion). In terms of the Municipal Financial Improvement Programme (MFIP), GTAC is an
agent of National Treasury and contracted commitments was R139 million (2017/18: R171 million).
21. ACCRUALS
Listed by economic classification 30 days 30+ days Total Total
Goods and services 72,515 12,623 85,138 89,826
Transfers and subsidies 96 - 96 130
Capital assets 12 - 12 285
GTAC 9,000 - 9,000 30,927
Total 81,623 12,623 94,246 121,168
2018/19 2017/18
Note R’000 R’000
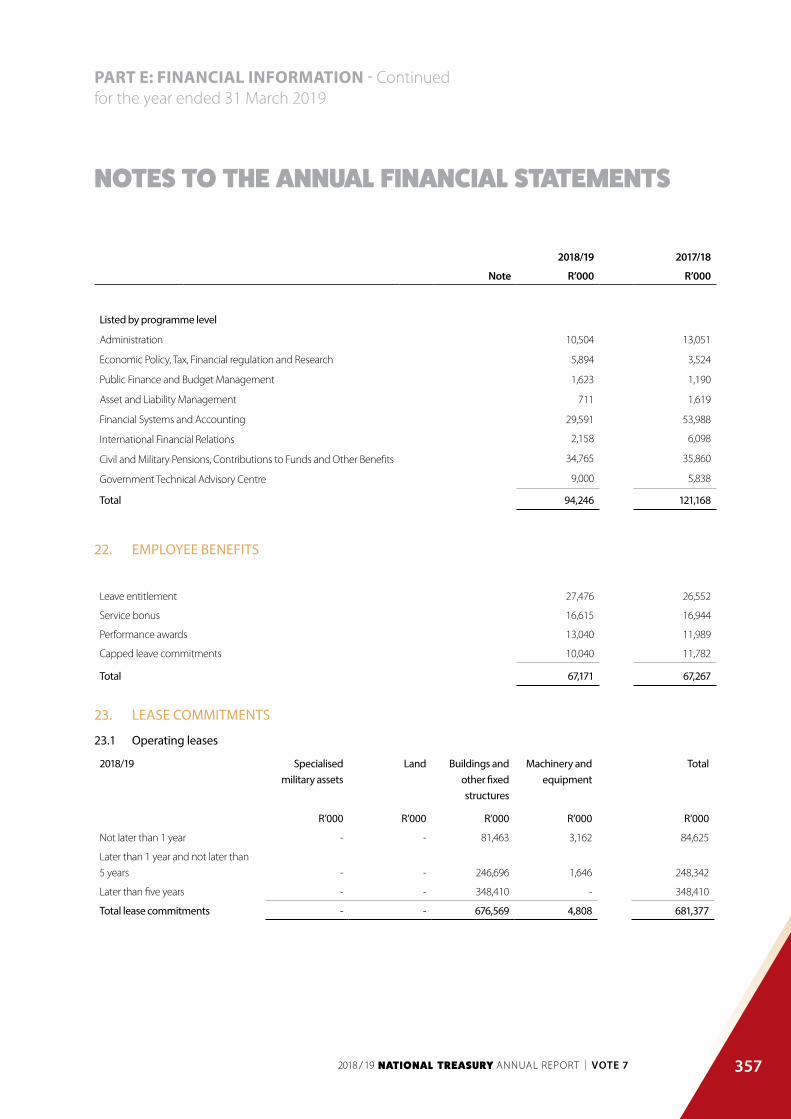
357
PART E: FINANCIAL INFORMATION - Continuedfor the year ended 31 March 2019
NOTES TO THE ANNUAL FINANCIAL STATEMENTS
Listed by programme level
Administration 10,504 13,051
Economic Policy, Tax, Financial regulation and Research 5,894 3,524
Public Finance and Budget Management 1,623 1,190
Asset and Liability Management 711 1,619
Financial Systems and Accounting 29,591 53,988
International Financial Relations 2,158 6,098
Civil and Military Pensions, Contributions to Funds and Other Benefits 34,765 35,860
Government Technical Advisory Centre 9,000 5,838
Total 94,246 121,168
22. EMPLOYEE BENEFITS
Leave entitlement 27,476 26,552
Service bonus 16,615 16,944
Performance awards 13,040 11,989
Capped leave commitments 10,040 11,782
Total 67,171 67,267
23. LEASE COMMITMENTS
23.1 Operating leases
2018/19 Specialised military assets
Land Buildings and other fixed structures
Machinery and equipment
Total
R’000 R’000 R’000 R’000 R’000
Not later than 1 year - - 81,463 3,162 84,625
Later than 1 year and not later than
5 years - - 246,696 1,646 248,342
Later than five years - - 348,410 - 348,410
Total lease commitments - - 676,569 4,808 681,377
2018/19 2017/18
Note R’000 R’000

358
PART E: FINANCIAL INFORMATION - Continuedfor the year ended 31 March 2019
NOTES TO THE ANNUAL FINANCIAL STATEMENTS
2017/18 Specialised military assets
Land Buildings and other fixed structures
Machinery and equipment
Total
R’000 R’000 R’000 R’000 R’000
Not later than 1 year - - 64,447 2,792 67,239
Later than 1 year and not later than
5 years - - 18,119 1,969 20,088
Later than five years - - - - -
Total lease commitments - - 82,566 4,761 87,327
The 240 Madiba street building contract was based on a lease renewal for 9 years and 1 months and other fixed structures lease commitments’
were based on projections.
23.2 Finance leases
2018/19 Specialised military assets
Land Buildings and other fixed structures
Machinery and equipment
Total
R’000 R’000 R’000 R’000 R’000
Not later than 1 year - - - 881 881
Later than 1 year and not later than
5 years - - - 434 434
Total lease commitments - - - 1,315 1,315
2017/18 Specialised military assets
Land Buildings and other fixed structures
Machinery and equipment
Total
R’000 R’000 R’000 R’000 R’000
Not later than 1 year - - - 1,729 1,729
Later than 1 year and not later than
5 years - - - 267 267
Total lease commitments - - - 1,996 1,996
2018/19 2017/18
Note R’000 R’000

359
PART E: FINANCIAL INFORMATION - Continuedfor the year ended 31 March 2019
NOTES TO THE ANNUAL FINANCIAL STATEMENTS
24. ACCRUED DEPARTMENTAL REVENUE
Sales of goods and services other than capital assets
Interest, dividends and rent on land
1
220,017
-
318,401
Transactions in financial assets and liabilities 346 132,873
Total 220,364 451,274
24.1 Analysis of accrued departmental revenue
Opening balance 451,274 262,136
Less: Amounts received (451,274) (262,136)
Add: Amounts recognised 220,364 451,274
Closing balance 220,364 451,274
25. IRREGULAR EXPENDITURE
25.1 Reconciliation of irregular expenditure
Opening balance 809,432 40,490
Prior period error - -
As restated 809,432 40,490
Add: Irregular expenditure - relating to prior year 61,719 444,362
Add: Irregular expenditure - relating to current year 404,227 324,852
Less: Prior year amounts condoned (687,456) (149)
Less: Current year amounts condoned (273) (123)
Irregular expenditure awaiting condonation 587,649 809,432
Analysis of awaiting condonation per age classification
Current year 404,954 768,942
Prior years 183,695 40,490
Total 587,649 809,432
2018/19 2017/18
Note R’000 R’000

360
PART E: FINANCIAL INFORMATION - Continuedfor the year ended 31 March 2019
NOTES TO THE ANNUAL FINANCIAL STATEMENTS
25.2 Details of irregular expenditure – added current year (relating to current and prior years)
2018/19
Incident Corrective steps taken R’000
ALM’s Back Office System confirmed
to be irregular through Internal Audit AssessmentInternal audit recommendation in-progress for
implementation by management 4,251
SWITF connectivity services procured without contract Under investigation by Internal Audit 631
Services rendered without obtaining quotations from Credit
Rating Agencies Under investigation by Internal Audit 1,356
Services rendered without obtaining quotations from Credit
Rating Agencies Under investigation by Internal Audit 2,537
Cleaning services were extended without testing the market Internal audit recommendation in-progress for
implementation by management 5,967
VAT panel members were appointed by deviating from the
normal procurement process
Appointment of VAT panel members was approved by the
accounting officer and expenditure condoned 273
Tax status was noncompliant at time of award Internal audit recommendation in-progress for
implementation by management 486
Splitting of quotations to avoid going through a tender
process
Internal audit recommendation in-progress for
implementation by management 600
2018/19 2017/18
Note R’000 R’000

361
PART E: FINANCIAL INFORMATION - Continuedfor the year ended 31 March 2019
NOTES TO THE ANNUAL FINANCIAL STATEMENTS
2018/19
Incident Corrective steps taken R’000
Override of controls in the procurement processes by
procuring services from second highest bidderInternal audit recommendation in-progress for
implementation by management 41
Settlement agreement due to contractual obligation with
ICT Works Review of forensic audit recommendations is in-progress 15,512
Document approved by the AO for implementation of the
Municipal Financial Management Programme could not be
located for audit purposes
Approved memo was discovered, and the expenditure was
condoned 140,915
Bid specification not based on relevant characteristic Internal audit recommendation in-progress for
implementation by management 4,001
Contract extension for transversal systems without going on
open tender
Reasons for not following competitive bidding to be
recorded for approval by AO 185,494
Bidder who failed to meet the pre-qualifying criteria was not
disqualified (NT003-2018) Under determination test by Internal Control 4,592
Goods and services with a transaction value of more than R
500 000 were not procured through a competitive bidding
process Under determination test by Internal Control 588
A bidder who failed to meet the pre-qualifying criteria was
not disqualified (NT006-2018) Under determination test by Internal Control 2,472
Expenditure incurred without prior approval by the DG and
OCPO Under determination test by Internal Control 17,866
Procurement (from Accenture) of services for the
development and enhancement of the central supplier
database (CSD) functionality that were procured in terms of
the Treasury Regulation 16A6.6 through an existing SLA and
not through a new tender process
Internal audit recommendation in-progress for
implementation by management 3,144
The Municipal Financial Improvement Programme was
outsourced to an Agent on behalf of the department and
the procurement process was found to be irregular
Assessment is in progress and corrective steps will be
recommended for approval by the accounting authority 75,220
Total 465,946

362
PART E: FINANCIAL INFORMATION - Continuedfor the year ended 31 March 2019
NOTES TO THE ANNUAL FINANCIAL STATEMENTS
25.3 Details of irregular expenditure condoned
2018/19
Incident Condoned by (Condoning authority) R’000
Services rendered without a contract Accounting Officer 273
Contracts for transversal systems were extended without
following a competitive bid Accounting authority 317,517
Override of controls in the procurement processes by
procuring services from second highest bidder Accounting authority 41
Goods & services procured without obtaining three
quotations Accounting authority 16
The appointment of GTAC to implement the MFIP project
was not approved by the Director General Accounting authority 369,883
Total 687,729
An amount of R465,9 million for current and prior year was identified as Irregular expenditure in the 2018/19 financial year
26. FRUITLESS AND WASTEFUL EXPENDITURE
26.1 Reconciliation of fruitless and wasteful expenditure
Opening balance 136,635 69,614
As restated 136,635 69,614
Fruitless and wasteful expenditure – relating to current year 67,609 67,021
Service utilised (3,066) -
Closing balance 201,178 136,635
26.2 Analysis of awaiting resolution per economic classification
Current 67,609 67,021
Total 67,609 67,021

363
PART E: FINANCIAL INFORMATION - Continuedfor the year ended 31 March 2019
NOTES TO THE ANNUAL FINANCIAL STATEMENTS
26.3 Analysis of current year’s (relating to current and prior years) fruitless and wasteful expenditure
2018/19
Incident Disciplinary steps taken/criminal proceedings R’000
Payment for technical support on perpetual
software licences relating to the IFMS project
Assessment is in progress and corrective steps will be recommended
for approval by the accounting officer
67,609
Total 67,609
27. RELATED PARTY TRANSACTIONS
27.1 Related parties falling under the Ministry of Finance Portfolio2
1. The Financial and Fiscal Commission (FFC)
2. Financial Intelligence Centre (FIC)
3. Development Bank of Southern Africa Limited (DBSA)
4. Accounting Standards Board (ASB)
5. Public Investment Corporation (PIC)
6. South African Revenue Service (SARS)
7. SASRIA Limited (SASRIA)
8. The Land and Agricultural Development Bank of South Africa (Land Bank)
9. Government Employee Pension Fund (GEPF)
10. Independent Regulatory Board for Auditors (IRBA)
11. Financial Advisory Intermediary Services (FAIS) Ombudsman
12. Office of the Pension Fund Adjudicator (OPFA)
13. The Co-Operative Banks Development Agency (CBDA)
14. Government Pensions Administration Agency (GPAA)
15. Government Technical Advisory Centre (GTAC)
16. Office of the Tax Ombud (OTO)
17. Financial Sector Conduct Authority (FSCA)
During 2018/19 financial year Financial Sector Conduct Authority (FSCA) was established and Financial Services Board was dis-established on
31 March 2018. SAA was transferred to Public Enterprises during 2018.
2018/19 2017/18
Note R’000 R’000
2 South African Airways (SAA) was transferred to the Department of Public Enterprises on 1 August 2018

364
PART E: FINANCIAL INFORMATION - Continuedfor the year ended 31 March 2019
NOTES TO THE ANNUAL FINANCIAL STATEMENTS
27.2 Related Party In-kind goods and services received / provided
RECEIVED 2018/19 2017/18
R’000 R’000
GTAC - Budget Portal (software) 3,777 -
Total 3,777 -
PROVIDED 2018/19 (Restated)
2017/18
R’000 R’000
CBDA - Office space occupied and professional services 6,197 6 799
GTAC - Office space occupied 8,475 11 716
ESAAG - Office space occupied 493 383
Total 15,166 18 898
27.3 Related Party Transactions
Payments made
Goods and services (GTAC) 260,900 247 530
Payments for financial assets (SAA) - 10 000 000
Total 260,900 10 247 530
Guarantees issued to related parties
South African Airways - 11 004 716
Land Bank 955 455 3 792 728
Development Bank of Southern Africa 4 297 600 4 018 559
Total 5 253 055 18 816 003
The decrease in 2018/19 was mainly due to the transfer of SAA to Public Enterprises and the reduced risk exposure of the Land
Bank.
2018/19 2017/18
Note R’000 R’000

365
PART E: FINANCIAL INFORMATION - Continuedfor the year ended 31 March 2019
NOTES TO THE ANNUAL FINANCIAL STATEMENTS
28 KEY MANAGEMENT PERSONNEL
No. of 2018/19 2017/18
Individuals R’000 R’000
Political office bearers 3 4,520 4,322
Officials:
Level 15 to 16 14 18,013 18,370
Level 14 66 75,372 79,545
Total 97,905 102,237
29. IMPAIRMENT (OTHER THAN RECEIVABLES, ACCRUED DEPARTMENTAL REVENUE, LOANS AND INVESTMENTS)
Other material losses 42,654 40,478
Total 42,654 40,478
Impairment of other material losses for 2018/19 amounting to R43 million relate to special pension pay-out made to 580 pensioners as a result
of misinterpretation of the Special Pensions Act which were approved for write-off annually.
30. PROVISIONS
SA Smit claims 14 14
Injury on Duty 131,107 138,202
Military Pension 13,446 16,084
Military Medical Benefits 4,522 358
Admin Expense Claim - 4,933
Special Pensions 32,786 29,507
Post-Retirements Medical Benefits 3,733 3,111
Total 185,608 192,209
2018/19 2017/18
Note R’000 R’000

366
PART E: FINANCIAL INFORMATION - Continuedfor the year ended 31 March 2019
NOTES TO THE ANNUAL FINANCIAL STATEMENTS
30.1 Reconciliation of movement in provisions – 2018/19
MILITARY & SPECIAL PENSIONS
INJURY ON DUTY
MILITARY PENSION
POST-RETIREMENT
MEDICAL BENEFITS &
CLAIM
Total provisions
R’000 R’000 R’000 R’000 R’000
Opening balance 29,865 143 135 16,084 3,125 192,209
Increase in provision 47,549 60 475 7,776 21,317 137,117
Settlement of provision (23,749) (72 503) (9,048) (20,695) (125,995)
Unused amount reversed (16,357) - (1,366) - (17,723)
Closing balance 37,308 131,107 13,446 3,747 185,608
Reconciliation of movement in provisions – 2017/18
MILITARY & SPECIAL PENSIONS
INJURY ON DUTY
MILITARY PENSION
POST-RESIREMENT
MEDICAL BENEFITS &
CLAIM
Total provisions
R’000 R’000 R’000 R’000 R’000
Opening balance 37,489 119,482 15,423 4,733 177,127
Increase in provision 30,333 83,285 29,495 25,484 168,597
Settlement of provision (18,956) (51,722) (14,711) (27,091) (112,480)
Unused amount reversed (19,002) (7,910) (14,122) - (41,034)
Closing balance 29,864 143,135 16,084 3,125 192,209
31. NON-ADJUSTING EVENTS AFTER REPORTING DATE
South African Airways (SAA) - 23,409,714
Eskom 13,500 000 -
Total 13,500,000 23,409,714
2018/19 2017/18
Note R’000 R’000

367
PART E: FINANCIAL INFORMATION - Continuedfor the year ended 31 March 2019
NOTES TO THE ANNUAL FINANCIAL STATEMENTS
SAA was transferred to Department of Public Enterprises (DPE) effective from 1st August 2018. Eskom is under the control of the DPE. However
on 2 April 2019 the Minister of Finance approved that Section 16(1) of the PFMA be invoked to transfer R17.652 million to Eskom to meet its
obligations and to avoid a call on its existing government guarantees by 30 May 2019. Transfers were made through the bank account of the
National Treasury (NT) in accordance with the cash flow requirements of Eskom. On 2 April 2019 R5 billion was transferred and on 29 April 2019
a further R8,5 billion. As at 31 May 2019 the NT transferred a total of R13.5 billion to Eskom. Details on how the DPE envisaged to manage Eskom
to remain financially viable can be obtained from the Annual report of the DPE.
32 MOVABLE TANGIBLE CAPITAL ASSETS
Opening balance
Value adjustments
Additions Disposals Closing balance
R’000 R’000 R’000 R’000 R’000
MACHINERY AND EQUIPMENT 213,545 - 20,464 (9 383) 224,625
Transport assets 5,271 - 1,733 (192) 6,811
Computer equipment 136,886 - 15,658 (8 554) 143,991
Furniture and office equipment 17,876 - 365 (511) 17,731
Other machinery and equipment 53,512 - 2,707 (126) 56,092
TOTAL MOVABLE TANGIBLE CAPITAL ASSETS 213,545 - 20,464 (9, 383) 224,625
Movable Tangible Capital Assets under investigation Number Value
R’000
Machinery and equipment 96 1,633
2018/19 2017/18
Note R’000 R’000

368
PART E: FINANCIAL INFORMATION - Continuedfor the year ended 31 March 2019
NOTES TO THE ANNUAL FINANCIAL STATEMENTS
32.1 Additions
Cash Non-cashFinance lease
payments)
Received current, not
paid (Paid current year,
received prior year Total
R’000 R’000 R’000 R’000 R’000
MACHINERY AND EQUIPMENT 20,468 - (4) - 20,464
Transport assets 1,733 - - - 1,733
Computer equipment 15,658 - - - 15,658
Furniture and office equipment 365 - - - 365
Other machinery and equipment 2,711 - (4) - 2,707
TOTAL ADDITIONS TO MOVABLE TANGIBLE CAPITAL ASSETS 20,468 - (4) - 20,464
32.2 Disposals
Sold for cash Non-cash disposal
Total disposals Cash received Actual
R’000 R’000 R’000 R’000
MACHINERY AND EQUIPMENT 6,828 2,555 9,383 162
Transport assets 192 - 192 35
Computer equipment 5,999 2,555 8,554 127
Furniture and office equipment 511 - 511 -
Other machinery and equipment 126 - 126 -
TOTAL DISPOSAL OF MOVABLE TANGIBLE CAPITAL ASSETS 6,828 2,555 9,383 162
2018/19 2017/18
Note R’000 R’000

369
PART E: FINANCIAL INFORMATION - Continuedfor the year ended 31 March 2019
NOTES TO THE ANNUAL FINANCIAL STATEMENTS
32.3 Movement for 2017/18
Opening balance
Prior period error
Additions Disposals Closing balance
R’000 R’000 R’000 R’000 R’000
MACHINERY AND EQUIPMENT 189,079 - 26,922 (2,456) 213,545
Transport assets 6,389 - 907 (2,025) 5,271
Computer equipment 117,793 - 19,367 (273) 136,886
Furniture and office equipment 17,713 - 163 - 17,876
Other machinery and equipment 47,184 - 6,485 (158) 53,512
TOTAL MOVABLE TANGIBLE CAPITAL ASSETS 189,079 - 26,922 (2,456) 213,545
33. MINOR ASSETS
MOVEMENT IN MINOR ASSETS PER THE ASSET REGISTER FOR THE YEAR ENDED 31 MARCH 2019
Specialised military assets
Intangible assets
Heritage assets Machinery and equipment
Biological assets
Total
R’000 R’000 R’000 R’000 R’000 R’000
Opening balance - - - 32,372 - 32,372
Value adjustments - - - - - -
Additions - - - 342 - 342
Disposals - - - (828) - (828)
TOTAL MINOR ASSETS - - - 31,886 - 31,886
2018/19 2017/18
Note R’000 R’000

370
PART E: FINANCIAL INFORMATION - Continuedfor the year ended 31 March 2019
NOTES TO THE ANNUAL FINANCIAL STATEMENTS
Specialised military assets
Intangible assets
Heritage assets Machinery and equipment
Biological assets
Total
Number of R1 minor
assets -
Number of minor assets
at cost - - - 20,734 - 20,734
TOTAL NUMBER OF MINOR ASSETS - - - 20,734 - 20,734
R’000
Minor Capital Assets under investigation Number Value
Machinery and equipment - -
MOVEMENT IN MINOR ASSETS PER THE ASSET REGISTER FOR THE YEAR ENDED 31 MARCH 2018
Specialised military assets
Intangible assets
Heritage assets Machinery and equipment
Biological assets
Total
R'000 R'000 R'000 R'000 R'000 R'000
Opening balance - - - 32,580 - 32,580
Prior period error - - - - - -
Additions - - - 448 - 448
Disposals - - - (656) - (656)
TOTAL MINOR ASSETS - - - 32,372 - 32,372
2018/19 2017/18
Note R’000 R’000

371
PART E: FINANCIAL INFORMATION - Continuedfor the year ended 31 March 2019
NOTES TO THE ANNUAL FINANCIAL STATEMENTS
Specialised military assets
Intangible assets Heritage assets
Machinery and equipment
Biological assets Total
R’000 R’000 R’000 R’000 R’000 R’000
Number of R1 minor
assets
Number of minor assets
at cost
- - - 20,734 - 20,734
TOTAL NUMBER OF MINOR ASSETS - - - 20,734 - 20,734
34. MOVABLE ASSETS WRITTEN OFF
Specialised military assets
Intangible assets Heritage assets
Machinery and equipment
Biological assets Total
R’000 R’000 R’000 R’000 R’000 R’000
Assets written off - - - 166 - 166
TOTAL MOVABLE ASSETS WRITTEN OFF - - - 166 - 166
MOVABLE ASSETS WRITTEN OFF FOR THE YEAR ENDED 31 MARCH 2018
Specialised military assets
Intangible assets
Heritage assets Machinery and equipment
Biological assets
Total
R’000 R’000 R’000 R’000 R’000 R’000
Assets written off - - - 905 - 905
TOTAL MOVABLE ASSETS WRITTEN OFF - - - 905 - 905
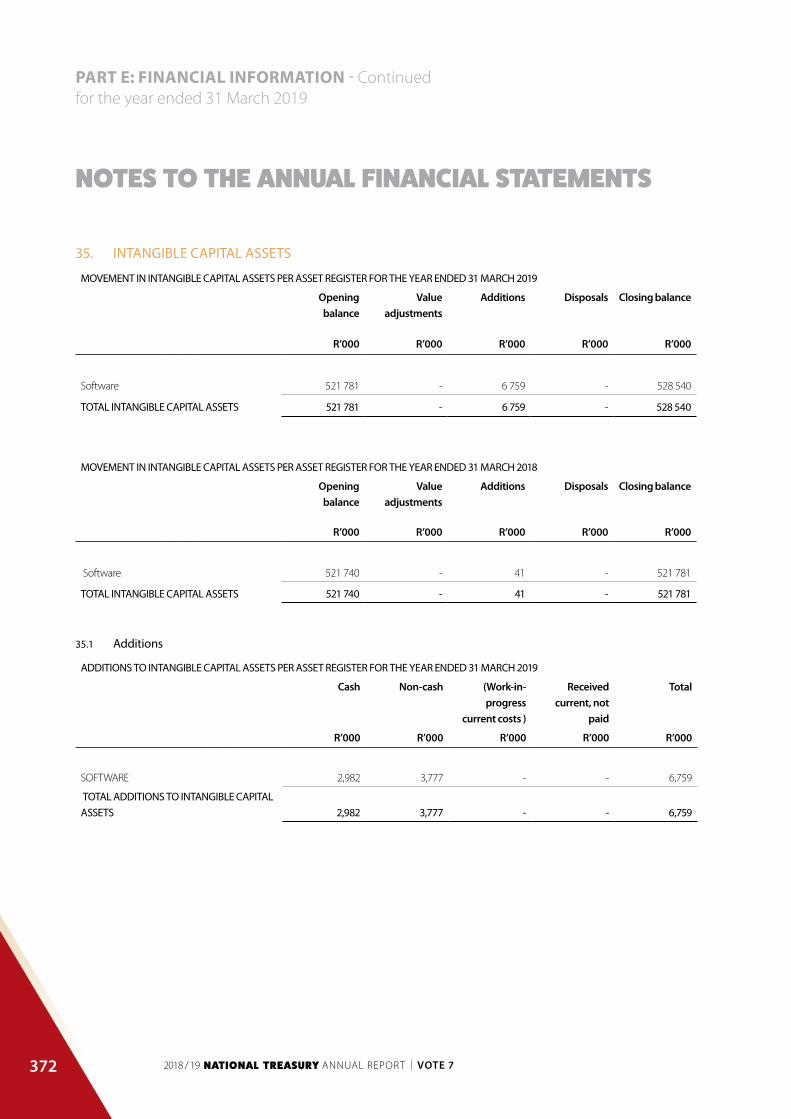
372
PART E: FINANCIAL INFORMATION - Continuedfor the year ended 31 March 2019
NOTES TO THE ANNUAL FINANCIAL STATEMENTS
35. INTANGIBLE CAPITAL ASSETS
MOVEMENT IN INTANGIBLE CAPITAL ASSETS PER ASSET REGISTER FOR THE YEAR ENDED 31 MARCH 2019
Opening balance
Value adjustments
Additions Disposals Closing balance
R’000 R’000 R’000 R’000 R’000
Software 521 781 - 6 759 - 528 540
TOTAL INTANGIBLE CAPITAL ASSETS 521 781 - 6 759 - 528 540
MOVEMENT IN INTANGIBLE CAPITAL ASSETS PER ASSET REGISTER FOR THE YEAR ENDED 31 MARCH 2018
Opening balance
Value adjustments
Additions Disposals Closing balance
R’000 R’000 R’000 R’000 R’000
Software 521 740 - 41 - 521 781
TOTAL INTANGIBLE CAPITAL ASSETS 521 740 - 41 - 521 781
35.1 Additions
ADDITIONS TO INTANGIBLE CAPITAL ASSETS PER ASSET REGISTER FOR THE YEAR ENDED 31 MARCH 2019
Cash Non-cash (Work-in-progress
current costs )
Received current, not
paid
Total
R’000 R’000 R’000 R’000 R’000
SOFTWARE 2,982 3,777 - - 6,759
TOTAL ADDITIONS TO INTANGIBLE CAPITAL ASSETS 2,982 3,777 - - 6,759

373
PART E: FINANCIAL INFORMATION - Continuedfor the year ended 31 March 2019
NOTES TO THE ANNUAL FINANCIAL STATEMENTS
36. IMMOVABLE TANGIBLE CAPITAL ASSETS
MOVEMENT IN IMMOVABLE TANGIBLE CAPITAL ASSETS PER ASSET REGISTER FOR THE YEAR ENDED 31 MARCH 2019
Opening balance
Value adjustments
Additions Disposals Closing balance
R’000 R’000 R’000 R’000 R’000
Other fixed
structures 1,062 - - - 1,062
TOTAL IMMOVABLE TANGIBLE CAPITAL ASSETS 1,062 - - - 1,062
36.1 Movement for 2017/18
MOVEMENT IN IMMOVABLE TANGIBLE CAPITAL ASSETS PER ASSET REGISTER FOR THE YEAR ENDED 31 MARCH 2018
Opening balance
Prior period error
Additions Disposals Closing balance
R’000 R’000 R’000 R’000 R’000
Other fixed structures 1,062 - - - 1,062
TOTAL IMMOVABLE TANGIBLE CAPITAL ASSETS 1,062 - - - 1,062
37. PRINCIPAL-AGENT ARRANGEMENTS
37.1 Department acting as the principal – fees paid
2018/19(Restated)
2017/18
Government Pension Administration Agency (GPAA) 63,524 61,099
Development Bank of Southern Africa (DBSA) - 22,000
Government Technical Advisory Centre (GTAC) 360 360
Total 63,884 83,459

374
PART E: FINANCIAL INFORMATION - Continuedfor the year ended 31 March 2019
NOTES TO THE ANNUAL FINANCIAL STATEMENTS
National Treasury is party to a principal-agent arrangement with the GPAA which renders administration services on behalf of the National
Treasury with respect to Post-Retirement Medical Subsidies, Military Pensions, Injury on Duty, Special Pensions and other pensions specified in
the Administration Agreement. GTAC provides technical assistance on behalf of the department. (DBSA is an agent of NT in relation to Cities
Support Programme). The department pays fees to GPAA for the administration services and there will be no possible cost implication if the
arrangements are terminated. Resources that are under the custodianship of the agents are recognised and recorded by the agents.
38. PRIOR PERIOD ERRORS
38.1 Correction of prior period errors
Related party in-kind goods and services / provided
Professional services -CBDA 27.2 4,338
Net effect 4,338
Advances paid (expensed)
Consulting services - MFIP(III) 10.3 69,110
Jobs Funds 42,015
Net effect 111,125
2018/19 2017/18
Note R’000 R’000

375
PART E: FINANCIAL INFORMATION - Continuedfor the year ended 31 March 2019
NOTES TO THE ANNUAL FINANCIAL STATEMENTS
Departmental revenue and NRF Receipts to be surrendered to the Revenue Fund
GPAA – Returned claims 15 100
Net effect 100
Principal-agent arrangement
Administration fee – GTAC 37.1 360
Net effect 360
2018/19 2017/18
Note R’000 R’000

376
PART E: FINANCIAL INFORMATION - Continuedfor the year ended 31 March 2019
ANNEXURES TO THE ANNUAL FINANCIAL STATEMENT
39.
STAT
EMEN
T O
F CO
ND
ITIO
NAL
GRA
NTS
REC
EIVE
D
NAM
E O
F G
RAN
TG
RAN
T AL
LOCA
TIO
NSP
ENT
2017
/18
Divi
sion of
Re
venu
e Ac
t/Pr
ovin
cial
Gran
ts
Roll
Ove
rsDO
RA
Adju
stm
ents
Oth
er
Adju
stm
ents
Tota
l Av
aila
ble
Amou
nt
rece
ived
by
depa
rtmen
t
Amou
nt
spen
t by
depa
rt-m
ent
Unde
r /
(ove
rspe
nd-
ing)
% o
f av
aila
ble
fund
s sp
ent b
y de
partm
ent
Divi
sion
of
Reve
nue
Act
Amou
nt
spen
t by
depa
rtmen
t
R
’000
R
’000
R
’000
R
’000
R
’000
R
’000
R
’000
R
’000
%
R
’000
R
’000
Finan
cial
Man
agem
ent
Gran
t -
mun
icipa
litie
s 50
4,56
6 -
- -
504,
566
504,
566
504,
566
- 10
0%50
2,00
6 50
2,00
6
Infra
stru
ctur
e
Skills
Dev
elop
men
t
Gran
t -
mun
icipa
litie
s 14
1,49
2 3,
141
2,70
0 -
147,
333
147,
333
141,
492
5,84
1 96
%14
1,67
7 14
1,67
7
Neig
hbou
rhoo
d
Dev
elop
men
t
Partn
ersh
ip
Gran
t 60
1,86
7 -
(20,
000)
- 58
1,86
7 58
1,86
7 56
9,11
7 12
,750
98
%65
7,83
9 65
7,83
9
Inte
grat
ed C
ities
Dev
elop
men
t
Gran
t 29
3,60
9 -
- -
293,
609
293,
609
293,
609
- 10
0%29
2,11
9 29
2,11
9
Neig
hbou
rhoo
d
Dev
elop
men
t
Partn
ersh
ip
Indi
rect
Gra
nt
29,3
53
- 20
,000
-
49,3
53
49,3
53
49,3
53
- 10
0%27
,744
25
,411
Tota
l Con
ditio
nal
Gran
ts R
ecei
ved
1,570
,887
3,1
41
2,700
-
1,576
,728
1,576
,728
1,558
,137
18,59
1 1,6
21,3
85
1,619
,052
The
Nei
ghbo
urho
od D
evel
opm
ent P
artn
ersh
ip In
dire
ct G
rant
(ND
PG) w
as re
stat
ed to
incl
ude
all c
ondi
tiona
l gra
nts
rece
ived
as
depi
cted
in th
e D
ivis
ion
of
Reve
nue
Act
. The
fund
s fo
r the
ND
PG a
re p
aid
to th
e G
TAC
ban
k ac
coun
t as
and
whe
n ne
eded
acc
ordi
ng to
the
appr
oved
pay
men
ts s
ched
ule
on g
oods
an
d se
rvic
es.
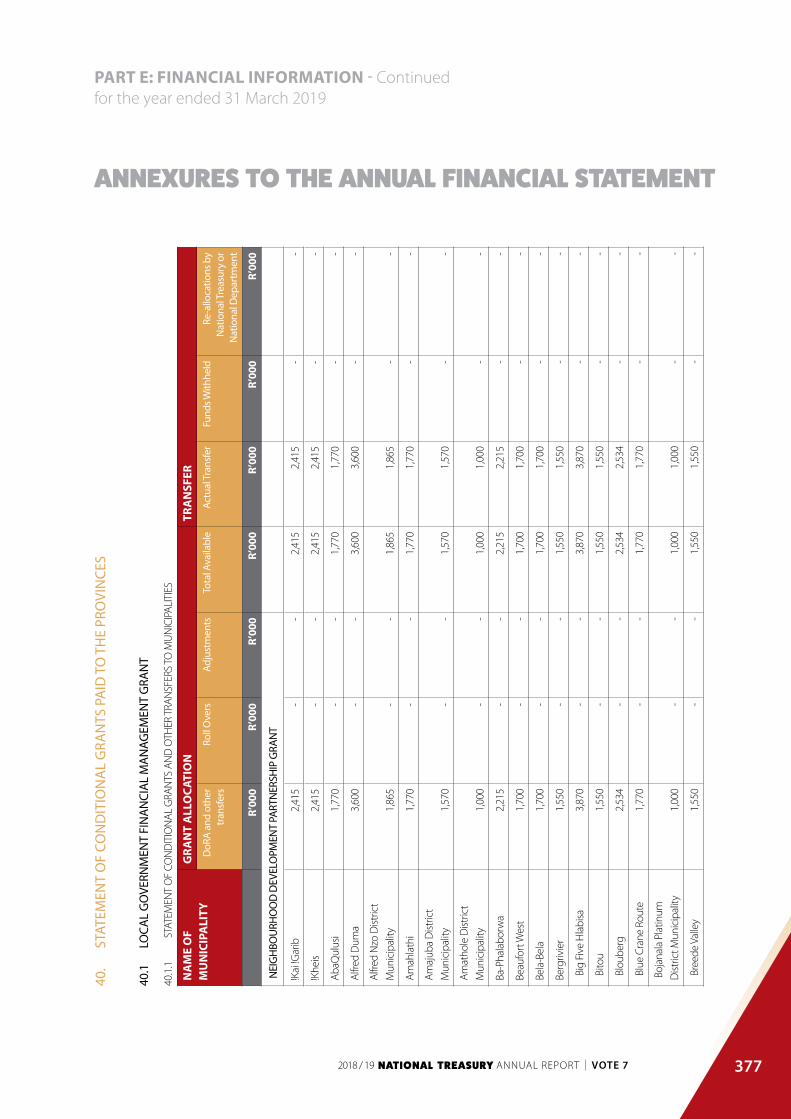
377
PART E: FINANCIAL INFORMATION - Continuedfor the year ended 31 March 2019
ANNEXURES TO THE ANNUAL FINANCIAL STATEMENT
40.
STAT
EMEN
T O
F CO
ND
ITIO
NA
L G
RAN
TS P
AID
TO
TH
E PR
OVI
NCE
S
40.1
LO
CAL
GO
VERN
MEN
T FI
NA
NCI
AL
MA
NAG
EMEN
T G
RAN
T
40.1
.1
STAT
EMEN
T O
F CO
ND
ITIO
NAL
GRA
NTS
AN
D O
THER
TRA
NSF
ERS
TO M
UN
ICIP
ALIT
IES
NA
ME
OF
MU
NIC
IPA
LITY
GRA
NT
ALL
OCA
TIO
NTR
AN
SFER
DoR
A an
d ot
her
tran
sfer
sRo
ll O
vers
Adju
stm
ents
Tota
l Ava
ilabl
eAc
tual
Tran
sfer
Fund
s With
held
Re-a
lloca
tions
by
Nat
iona
l Tre
asur
y or
N
atio
nal D
epar
tmen
t
R
’000
R
’000
R
’000
R
’000
R
’000
R
’000
R
’000
NEI
GH
BOU
RHO
OD
DEV
ELO
PMEN
T PA
RTN
ERSH
IP G
RAN
T
!Kai
!Gar
ib
2,41
5
-
- 2,
415
2,41
5 -
-
!Khe
is 2,
415
- -
2,41
5 2,
415
-
-
AbaQ
ulus
i 1,
770
- -
1,77
0 1,
770
-
-
Alfre
d D
uma
3,60
0
-
- 3,
600
3,60
0 -
-
Alfre
d N
zo D
istric
t
Mun
icip
ality
1,
865
- -
1,86
5 1,
865
-
-
Amah
lath
i 1,
770
- -
1,77
0 1,
770
-
-
Amaj
uba
Dist
rict
Mun
icip
ality
1,
570
- -
1,57
0 1,
570
-
-
Amat
hole
Dist
rict
Mun
icip
ality
1,
000
-
-
1,00
0
1,00
0
-
-
Ba-P
hala
borw
a 2,
215
- -
2,21
5 2,
215
-
-
Beau
fort
Wes
t 1,
700
- -
1,70
0 1,
700
-
-
Bela
-Bel
a 1,
700
- -
1,70
0 1,
700
-
-
Berg
rivie
r 1,
550
- -
1,55
0 1,
550
-
-
Big
Fiv
e H
labi
sa
3,87
0
-
- 3,
870
3,87
0 -
-
Bito
u 1,
550
- -
1,55
0 1,
550
-
-
Blo
uber
g
2,53
4
-
- 2,
534
2,53
4 -
-
Blu
e Cr
ane
Rout
e 1,
770
- -
1,77
0 1,
770
-
-
Boj
anal
a Pl
atin
um
Dist
rict M
unic
ipal
ity
1,00
0
-
- 1,
000
1,00
0 -
-
Bre
ede
Valle
y 1,
550
- -
1,55
0 1,
550
-
-
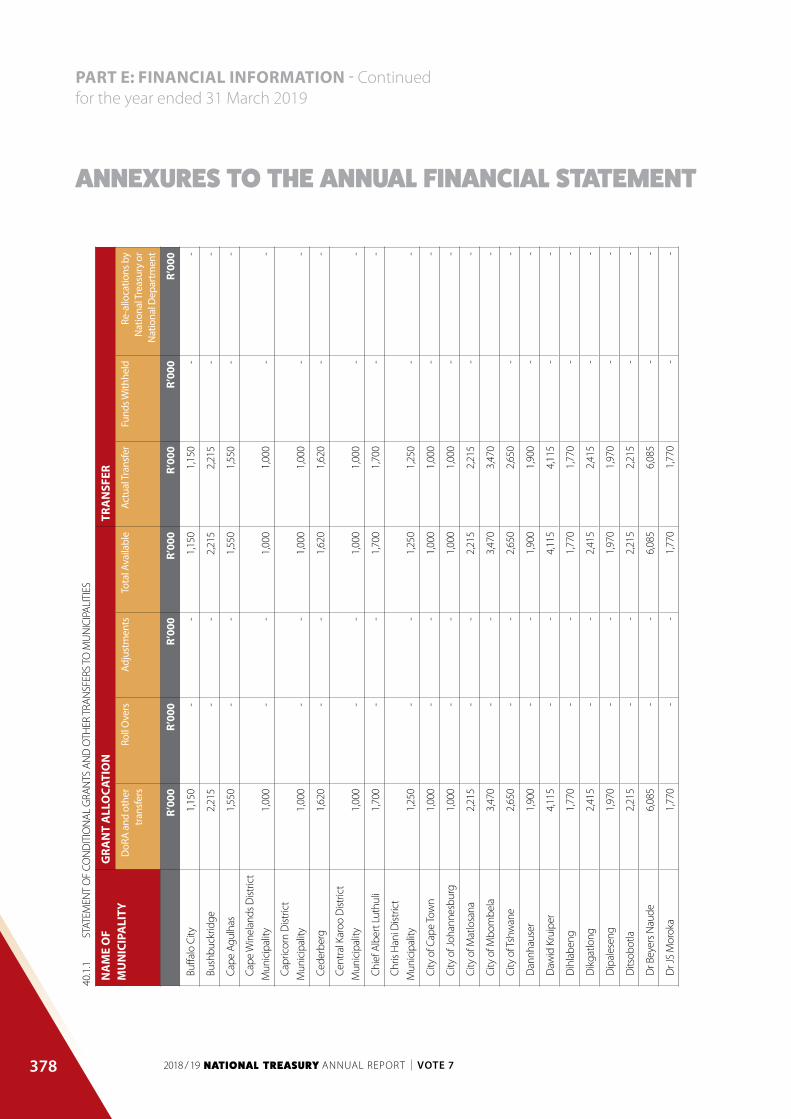
378
PART E: FINANCIAL INFORMATION - Continuedfor the year ended 31 March 2019
ANNEXURES TO THE ANNUAL FINANCIAL STATEMENT
40.1
.1
STAT
EMEN
T O
F CO
ND
ITIO
NAL
GRA
NTS
AN
D O
THER
TRA
NSF
ERS
TO M
UN
ICIP
ALIT
IES
NA
ME
OF
MU
NIC
IPA
LITY
GRA
NT
ALL
OCA
TIO
NTR
AN
SFER
DoR
A an
d ot
her
tran
sfer
sRo
ll O
vers
Adju
stm
ents
Tota
l Ava
ilabl
eAc
tual
Tran
sfer
Fund
s With
held
Re-a
lloca
tions
by
Nat
iona
l Tre
asur
y or
N
atio
nal D
epar
tmen
t
R
’000
R
’000
R
’000
R
’000
R
’000
R
’000
R
’000
Buff
alo
City
1,
150
- -
1,15
0 1,
150
-
-
Bus
hbuc
krid
ge
2,21
5
-
- 2,
215
2,21
5 -
-
Cap
e Ag
ulha
s 1,
550
- -
1,55
0 1,
550
-
-
Cap
e W
inel
ands
Dist
rict
Mun
icip
ality
1,00
0
-
-
1,00
0
1,00
0
-
-
Cap
ricor
n D
istric
t
Mun
icip
ality
1,00
0
-
-
1,00
0
1,00
0
-
-
Ced
erbe
rg
1,62
0
-
- 1,
620
1,62
0 -
-
Cen
tral K
aroo
Dist
rict
Mun
icip
ality
1,00
0
-
-
1,00
0
1,00
0
-
-
Chi
ef A
lber
t Lut
huli
1,70
0
-
- 1,
700
1,70
0 -
-
Chr
is H
ani D
istric
t
Mun
icip
ality
1,25
0
-
-
1,25
0
1,25
0
-
-
City
of C
ape
Tow
n 1,
000
- -
1,00
0 1,
000
-
-
City
of J
ohan
nesb
urg
1,00
0
-
- 1,
000
1,00
0 -
-
City
of M
atlo
sana
2,
215
- -
2,21
5 2,
215
-
-
City
of M
bom
bela
3,
470
- -
3,47
0 3,
470
-
City
of T
shw
ane
2,65
0
-
- 2,
650
2,65
0 -
-
Dan
nhau
ser
1,90
0
-
- 1,
900
1,90
0 -
-
Daw
id K
ruip
er
4,11
5
-
- 4,
115
4,11
5 -
-
Dih
labe
ng
1,77
0
-
- 1,
770
1,77
0 -
-
Dik
gatlo
ng
2,41
5
-
- 2,
415
2,41
5 -
-
Dip
ales
eng
1,97
0
-
- 1,
970
1,97
0 -
-
Dits
obot
la
2,21
5
-
- 2,
215
2,21
5 -
-
Dr B
eyer
s Nau
de
6,08
5
-
- 6,
085
6,08
5 -
-
Dr J
S M
orok
a 1,
770
- -
1,77
0 1,
770
-
-

379
PART E: FINANCIAL INFORMATION - Continuedfor the year ended 31 March 2019
ANNEXURES TO THE ANNUAL FINANCIAL STATEMENT
40.1
.1
STAT
EMEN
T O
F CO
ND
ITIO
NAL
GRA
NTS
AN
D O
THER
TRA
NSF
ERS
TO M
UN
ICIP
ALIT
IES
NA
ME
OF
MU
NIC
IPA
LITY
GRA
NT
ALL
OCA
TIO
NTR
AN
SFER
DoR
A an
d ot
her
tran
sfer
sRo
ll O
vers
Adju
stm
ents
Tota
l Ava
ilabl
eAc
tual
Tran
sfer
Fund
s With
held
Re-a
lloca
tions
by
Nat
iona
l Tre
asur
y or
N
atio
nal D
epar
tmen
t
R
’000
R
’000
R
’000
R
’000
R
’000
R
’000
R
’000
Dr K
enne
th K
aund
a
Dist
rict
Mun
icip
ality
1,00
0
-
-
1,00
0
1,00
0
-
-
Dr N
kosa
zana
Dla
min
i
Zum
a
3,87
0
-
-
3,87
0
3,87
0
-
-
Dr P
ixle
y ka
Isak
a Se
me
1,77
0
-
- 1,
770
1,77
0 -
-
Dr R
uth
Sego
mot
si
Mom
pati
Dist
rict
Mun
icip
ality
1,32
0
-
-
1,32
0
1,32
0
-
-
Dra
kens
tein
1,
550
- -
1,55
0 1,
550
-
-
Ede
n D
istric
t
Mun
icip
ality
1,00
0
-
-
1,00
0
1,00
0
-
-
eD
umbe
1,
970
- -
1,97
0 1,
970
-
-
Ehl
anze
ni D
istric
t
Mun
icip
ality
1,25
0
-
-
1,25
0
1,25
0
-
-
Eku
rhul
eni
1,00
0
-
- 1,
000
1,00
0 -
-
Elia
s Mot
soal
edi
1,77
0
-
- 1,
770
1,77
0 -
-
Elu
ndin
i 1,
700
- -
1,70
0 1,
700
-
-
eM
adla
ngen
i 1,
970
- -
1,97
0 1,
970
-
-
Em
akha
zeni
1,
970
- -
1,97
0 1,
970
-
-
Em
alah
leni
(EC
) 2,
415
- -
2,41
5 2,
415
-
-
Em
alah
leni
(MP)
2,
215
- -
2,21
5 2,
215
-
-
Em
fule
ni
1,55
0
-
- 1,
550
1,55
0 -
-
Em
than
jeni
1,
700
- -
1,70
0 1,
700
-
-
eN
dum
eni
1,77
0
-
- 1,
770
1,77
0 -
-
Eng
cobo
1,
700
- -
1,70
0 1,
700
-
-
Eno
ch M
gijim
a 6,
015
- -
6,01
5 6,
015
-
-

380
PART E: FINANCIAL INFORMATION - Continuedfor the year ended 31 March 2019
ANNEXURES TO THE ANNUAL FINANCIAL STATEMENT
40.1
.1
STAT
EMEN
T O
F CO
ND
ITIO
NAL
GRA
NTS
AN
D O
THER
TRA
NSF
ERS
TO M
UN
ICIP
ALIT
IES
NA
ME
OF
MU
NIC
IPA
LITY
GRA
NT
ALL
OCA
TIO
NTR
AN
SFER
DoR
A an
d ot
her
tran
sfer
sRo
ll O
vers
Adju
stm
ents
Tota
l Ava
ilabl
eAc
tual
Tran
sfer
Fund
s With
held
Re-a
lloca
tions
by
Nat
iona
l Tre
asur
y or
N
atio
nal D
epar
tmen
t
R
’000
R
’000
R
’000
R
’000
R
’000
R
’000
R
’000
Eph
raim
Mog
ale
2,21
5
-
- 2,
215
2,21
5 -
-
eTh
ekw
ini
1,00
0
-
- 1,
000
1,00
0 -
-
Fez
ile D
abi D
istric
t
Mun
icip
ality
1,00
0
-
-
1,00
0
1,00
0
-
-
Fra
nces
Baa
rd D
istric
t
Mun
icip
ality
1,00
0
-
-
1,00
0
1,00
0
-
-
Gam
agar
a 1,
770
- -
1,77
0 1,
770
-
-
Ga-
Sego
nyan
a 2,
215
- -
2,21
5 2,
215
-
-
Geo
rge
1,55
0
-
- 1,
550
1,55
0 -
-
Ger
t Sib
ande
Dist
rict
Mun
icip
ality
1,00
0
-
-
1,00
0
1,00
0
-
-
Gov
an M
beki
1,
770
- -
1,77
0 1,
770
-
-
Gre
at K
ei
2,41
5
-
- 2,
415
2,41
5 -
-
Gre
ater
Giy
ani
2,14
5
-
- 2,
145
2,14
5 -
-
Gre
ater
Kok
stad
1,
800
- -
1,80
0 1,
800
-
-
Gre
ater
Let
aba
2,14
5
-
- 2,
145
2,14
5 -
-
Gre
ater
Taun
g
-
- 2,
415
2,41
5 -
-
Gre
ater
Tzan
een
2,14
5
-
- 2,
145
2,14
5 -
-
Han
tam
1,
970
- -
1,97
0 1,
970
-
-
Har
ry G
wal
a D
istric
t
Mun
icip
ality
1,00
0
-
-
1,00
0
1,00
0
-
-
Hes
sequ
a 1,
550
- -
1,55
0 1,
550
-
-
iLe
mbe
Dist
rict
Mun
icip
ality
1,00
0
-
-
1,00
0
1,00
0
-
-
iM
pend
le
1,90
0
-
- 1,
900
1,90
0 -
-
iN
kosi
Lang
alib
alel
e
3,67
0
-
- 3,
670
3,67
0 -
-
Int
sika
Yeth
u 2,
215
- -
2,21
5 2,
215
-
-

381
PART E: FINANCIAL INFORMATION - Continuedfor the year ended 31 March 2019
ANNEXURES TO THE ANNUAL FINANCIAL STATEMENT
40.1
.1
STAT
EMEN
T O
F CO
ND
ITIO
NAL
GRA
NTS
AN
D O
THER
TRA
NSF
ERS
TO M
UN
ICIP
ALIT
IES
NA
ME
OF
MU
NIC
IPA
LITY
GRA
NT
ALL
OCA
TIO
NTR
AN
SFER
DoR
A an
d ot
her
tran
sfer
sRo
ll O
vers
Adju
stm
ents
Tota
l Ava
ilabl
eAc
tual
Tran
sfer
Fund
s With
held
Re-a
lloca
tions
by
Nat
iona
l Tre
asur
y or
N
atio
nal D
epar
tmen
t
R
’000
R
’000
R
’000
R
’000
R
’000
R
’000
R
’000
Inx
uba
Yeth
emba
2,
215
- -
2,21
5 2,
215
-
-
Joe
Gqa
bi D
istric
t
Mun
icip
ality
1,32
0
-
-
1,32
0
1,32
0
-
-
Joe
Mor
olon
g 2,
215
- -
2,21
5 2,
215
-
-
Joh
n Ta
olo
Gae
tsew
e
Dist
rict
Mun
icip
ality
1,00
0
-
-
1,00
0
1,00
0
-
-
Joz
ini
1,97
0
-
- 1,
970
1,97
0 -
-
Kag
isano
-Mol
opo
3,14
6
-
- 3,
146
3,14
6 -
-
Kam
iesb
erg
2,41
5
-
- 2,
415
2,41
5 -
-
Kan
nala
nd
2,21
5
-
- 2,
215
2,21
5 -
-
Kar
eebe
rg
1,97
0
-
- 1,
970
1,97
0 -
-
Kar
oo H
oogl
and
1,97
0
-
- 1,
970
1,97
0 -
-
Kga
telo
pele
2,
415
- -
2,41
5 2,
415
-
-
Kge
tleng
rivie
r 2,
415
- -
2,41
5 2,
415
-
-
Khâ
i-Ma
1,97
0
-
- 1,
970
1,97
0 -
-
Kin
g Ce
tshw
ayo
Dist
rict
Mun
icip
ality
1,00
0
-
-
1,00
0
1,00
0
-
-
Kin
g Sa
bata
Dal
indy
ebo
2,21
5
-
-
2,21
5
2,21
5
-
-
Kny
sna
1,55
0
-
- 1,
550
1,55
0 -
-
Kop
anon
g 1,
700
- -
1,70
0 1,
700
-
-
Kou
ga
1,77
0
-
- 1,
770
1,77
0 -
-
Kou
-Kam
ma
1,97
0
-
- 1,
970
1,97
0 -
-
Kw
aDuk
uza
1,80
0
-
- 1,
800
1,80
0 -
-
Lai
ngsb
urg
1,80
0
-
- 1,
800
1,80
0 -
-
Lan
gebe
rg
1,55
0
-
- 1,
550
1,55
0 -
-

382
PART E: FINANCIAL INFORMATION - Continuedfor the year ended 31 March 2019
ANNEXURES TO THE ANNUAL FINANCIAL STATEMENT
40.1
.1
STAT
EMEN
T O
F CO
ND
ITIO
NAL
GRA
NTS
AN
D O
THER
TRA
NSF
ERS
TO M
UN
ICIP
ALIT
IES
NA
ME
OF
MU
NIC
IPA
LITY
GRA
NT
ALL
OCA
TIO
NTR
AN
SFER
DoR
A an
d ot
her
tran
sfer
sRo
ll O
vers
Adju
stm
ents
Tota
l Ava
ilabl
eAc
tual
Tran
sfer
Fund
s With
held
Re-a
lloca
tions
by
Nat
iona
l Tre
asur
y or
N
atio
nal D
epar
tmen
t
R
’000
R
’000
R
’000
R
’000
R
’000
R
’000
R
’000
Lej
wel
eput
swa
Dist
rict
Mun
icip
ality
1,00
0
-
- 1,
000
1,00
0 -
-
Lek
wa
1,77
0
-
- 1,
770
1,77
0 -
-
Lek
wa-
Teem
ane
2,21
5
-
- 2,
215
2,21
5 -
-
Lep
ele-
Nku
mpi
2,
145
- -
2,14
5 2,
145
-
-
Lep
hala
le
1,70
0
-
- 1,
700
1,70
0 -
-
Les
edi
1,55
0
-
- 1,
550
1,55
0 -
-
Let
sem
eng
1,97
0
-
- 1,
970
1,97
0 -
-
LIM
345
2,
345
- -
2,34
5 2,
345
-
-
LIM
368
4,
115
- -
4,11
5 4,
115
-
-
LIM
476
4,
115
- -
4,11
5 4,
115
-
-
Mad
iben
g 1,
770
- -
1,77
0 1,
770
-
-
Mafi
keng
2,
215
- -
2,21
5 2,
215
-
-
Maf
ube
2,41
5
-
- 2,
415
2,41
5 -
-
Mag
aren
g 1,
970
- -
1,97
0 1,
970
-
-
Mak
ana
2,21
5
-
- 2,
215
2,21
5 -
-
Mak
hado
1,
700
- -
1,70
0 1,
700
-
-
Mak
hudu
tham
aga
1,77
0
-
- 1,
770
1,77
0 -
-
Mal
uti-a
-Pho
fung
2,
215
- -
2,21
5 2,
215
-
-
Mam
usa
2,41
5
-
- 2,
415
2,41
5 -
-
Man
deni
1,
900
- -
1,90
0 1,
900
-
-
Man
gaun
g
3,34
5
-
- 3,
345
3,34
5 -
-
Man
tsop
a 2,
215
- -
2,21
5 2,
215
-
-
Map
hum
ulo
1,90
0
-
- 1,
900
1,90
0 -
-
Maq
uass
i Hill
s 2,
215
- -
2,21
5 2,
215
-
-
Mar
ulen
g 1,
900
- -
1,90
0 1,
900
-
-
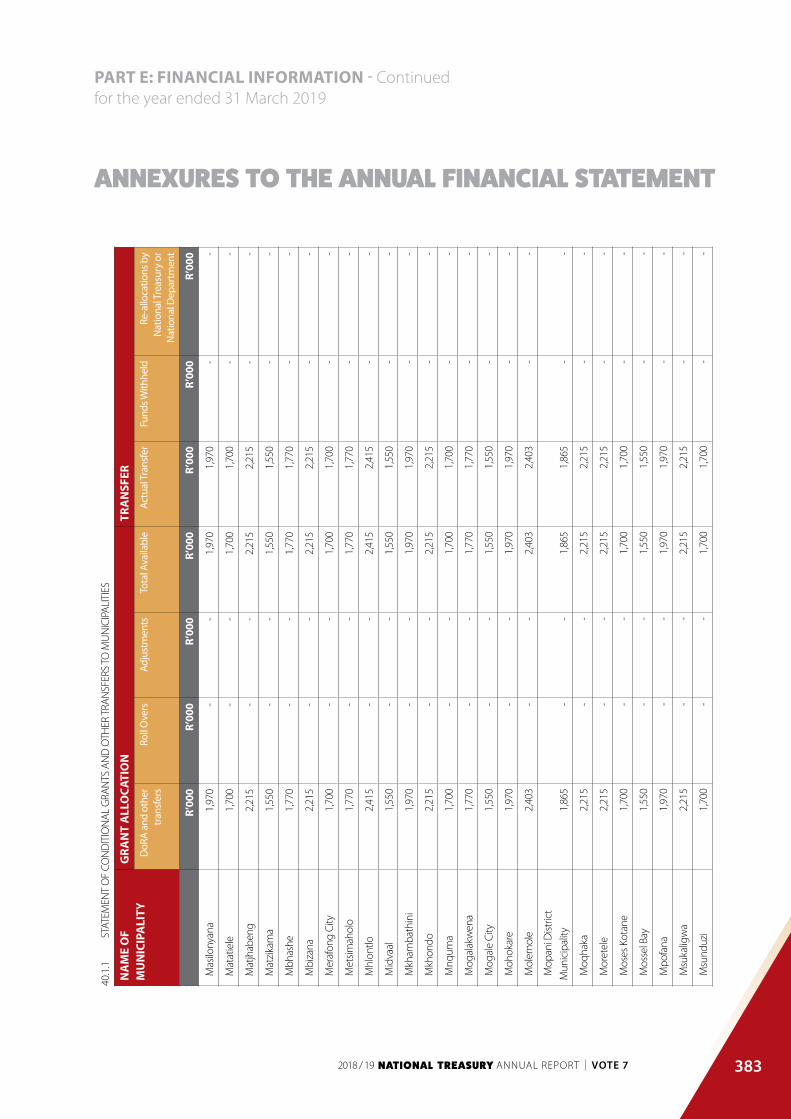
383
PART E: FINANCIAL INFORMATION - Continuedfor the year ended 31 March 2019
ANNEXURES TO THE ANNUAL FINANCIAL STATEMENT
40.1
.1
STAT
EMEN
T O
F CO
ND
ITIO
NAL
GRA
NTS
AN
D O
THER
TRA
NSF
ERS
TO M
UN
ICIP
ALIT
IES
NA
ME
OF
MU
NIC
IPA
LITY
GRA
NT
ALL
OCA
TIO
NTR
AN
SFER
DoR
A an
d ot
her
tran
sfer
sRo
ll O
vers
Adju
stm
ents
Tota
l Ava
ilabl
eAc
tual
Tran
sfer
Fund
s With
held
Re-a
lloca
tions
by
Nat
iona
l Tre
asur
y or
N
atio
nal D
epar
tmen
t
R
’000
R
’000
R
’000
R
’000
R
’000
R
’000
R
’000
Mas
ilony
ana
1,97
0
-
- 1,
970
1,97
0 -
-
Mat
atie
le
1,70
0
-
- 1,
700
1,70
0 -
-
Mat
jhab
eng
2,21
5
-
- 2,
215
2,21
5 -
-
Mat
zika
ma
1,55
0
-
- 1,
550
1,55
0 -
-
Mbh
ashe
1,
770
- -
1,77
0 1,
770
-
-
Mbi
zana
2,
215
- -
2,21
5 2,
215
-
-
Mer
afon
g Ci
ty
1,70
0
-
- 1,
700
1,70
0 -
-
Met
simah
olo
1,77
0
-
- 1,
770
1,77
0 -
-
Mhl
ontlo
2,
415
- -
2,41
5 2,
415
-
-
Mid
vaal
1,
550
- -
1,55
0 1,
550
-
-
Mkh
amba
thin
i 1,
970
- -
1,97
0 1,
970
-
-
Mkh
ondo
2,
215
- -
2,21
5 2,
215
-
-
Mnq
uma
1,70
0
-
- 1,
700
1,70
0 -
-
Mog
alak
wen
a 1,
770
- -
1,77
0 1,
770
-
-
Mog
ale
City
1,
550
- -
1,55
0 1,
550
-
-
Moh
okar
e 1,
970
- -
1,97
0 1,
970
-
-
Mol
emol
e 2,
403
- -
2,40
3 2,
403
-
-
Mop
ani D
istric
t
Mun
icip
ality
1,
865
- -
1,86
5 1,
865
-
-
Moq
haka
2,
215
- -
2,21
5 2,
215
-
-
Mor
etel
e 2,
215
- -
2,21
5 2,
215
-
-
Mos
es K
otan
e 1,
700
- -
1,70
0 1,
700
-
-
Mos
sel B
ay
1,55
0
-
- 1,
550
1,55
0 -
-
Mpo
fana
1,
970
- -
1,97
0 1,
970
-
-
Msu
kalig
wa
2,21
5
-
- 2,
215
2,21
5 -
-
Msu
nduz
i 1,
700
- -
1,70
0 1,
700
-
-

384
PART E: FINANCIAL INFORMATION - Continuedfor the year ended 31 March 2019
ANNEXURES TO THE ANNUAL FINANCIAL STATEMENT
40.1
.1
STAT
EMEN
T O
F CO
ND
ITIO
NAL
GRA
NTS
AN
D O
THER
TRA
NSF
ERS
TO M
UN
ICIP
ALIT
IES
NA
ME
OF
MU
NIC
IPA
LITY
GRA
NT
ALL
OCA
TIO
NTR
AN
SFER
DoR
A an
d ot
her
tran
sfer
sRo
ll O
vers
Adju
stm
ents
Tota
l Ava
ilabl
eAc
tual
Tran
sfer
Fund
s With
held
Re-a
lloca
tions
by
Nat
iona
l Tre
asur
y or
N
atio
nal D
epar
tmen
t
R
’000
R
’000
R
’000
R
’000
R
’000
R
’000
R
’000
Mth
onja
neni
2,
850
- -
2,85
0 2,
850
-
-
Mtu
batu
ba
1,97
0
-
- 1,
970
1,97
0 -
-
Mus
ina
1,90
0
-
- 1,
900
1,90
0 -
-
Nal
a 2,
415
- -
2,41
5 2,
415
-
-
Nal
edi
1,77
0
-
- 1,
770
1,77
0 -
-
Nam
a Kh
oi
2,21
5
-
- 2,
215
2,21
5 -
-
Nam
akw
a D
istric
t
Mun
icip
ality
1,
320
- -
1,32
0 1,
320
-
-
Ndl
ambe
1,
970
- -
1,97
0 1,
970
-
-
Ndw
edw
e 1,
970
- -
1,97
0 1,
970
-
-
Nel
son
Man
dela
Bay
1,
000
- -
1,00
0 1,
000
-
-
New
cast
le
1,70
0
-
- 1,
700
1,70
0 -
-
Nga
ka M
odiri
Mol
ema
Dist
rict
Mun
icip
ality
1,86
5
-
-
1,86
5
1,86
5
-
-
Ngq
ushw
a 2,
415
- -
2,41
5 2,
415
-
-
Ngq
uza
Hill
1,
700
- -
1,70
0 1,
700
-
-
Ngw
athe
2,
215
- -
2,21
5 2,
215
-
-
Nka
ndla
1,
970
- -
1,97
0 1,
970
-
-
Nka
ngal
a D
istric
t
Mun
icip
ality
1,00
0
-
-
1,00
0
1,00
0 -
-
Nke
toan
a 1,
770
- -
1,77
0 1,
770
-
-
Nko
maz
i 1,
770
- -
1,77
0 1,
770
-
-
Non
gom
a 1,
970
- -
1,97
0 1,
970
-
-
Nqu
thu
1,90
0
-
- 1,
900
1,90
0 -
-
Nta
bank
ulu
1,97
0
-
- 1,
970
1,97
0 -
-

385
PART E: FINANCIAL INFORMATION - Continuedfor the year ended 31 March 2019
ANNEXURES TO THE ANNUAL FINANCIAL STATEMENT
40.1
.1
STAT
EMEN
T O
F CO
ND
ITIO
NAL
GRA
NTS
AN
D O
THER
TRA
NSF
ERS
TO M
UN
ICIP
ALIT
IES
NA
ME
OF
MU
NIC
IPA
LITY
GRA
NT
ALL
OCA
TIO
NTR
AN
SFER
DoR
A an
d ot
her
tran
sfer
sRo
ll O
vers
Adju
stm
ents
Tota
l Ava
ilabl
eAc
tual
Tran
sfer
Fund
s With
held
Re-a
lloca
tions
by
Nat
iona
l Tre
asur
y or
N
atio
nal D
epar
tmen
t
R
’000
R
’000
R
’000
R
’000
R
’000
R
’000
R
’000
Nya
nden
i 1,
700
- -
1,70
0 1,
700
-
-
O.R
. Tam
bo D
istric
t
Mun
icip
ality
2,11
5
-
-
2,11
5
2,11
5 -
-
Okh
ahla
mba
1,
900
- -
1,90
0 1,
900
-
-
Oud
tsho
orn
1,62
0
-
- 1,
620
1,62
0 -
-
Ove
rber
g D
istric
t
Mun
icip
ality
1,00
0
-
-
1,00
0
1,00
0 -
-
Ove
rstra
nd
1,55
0
-
- 1,
550
1,55
0 -
-
Pho
kwan
e 2,
215
- -
2,21
5 2,
215
-
-
Phu
mel
ela
2,41
5
-
- 2,
415
2,41
5 -
-
Pix
ley
Ka S
eme
Dist
rict
Mun
icip
ality
1,32
0
-
-
1,32
0
1,32
0
-
-
Pol
okw
ane
3,
048
- -
3,04
8 3,
048
-
-
Por
t St J
ohns
1,
970
- -
1,97
0 1,
970
-
-
Prin
ce A
lber
t 1,
700
- -
1,70
0 1,
700
-
-
Ram
otsh
ere
Moi
loa
2,21
5
-
- 2,
215
2,21
5 -
-
Ran
d W
est C
ity
3,17
0
-
- 3,
170
3,17
0 -
-
Rat
lou
1,94
0
-
- 1,
940
1,94
0 -
-
Ray
Nko
nyen
i 3,
600
- -
3,60
0 3,
600
-
-
Ray
mon
d M
hlab
a 3,
870
- -
3,87
0 3,
870
-
-
Ren
oste
rber
g 2,
415
- -
2,41
5 2,
415
-
-
Ric
hmon
d 1,
900
- -
1,90
0 1,
900
-
-
Ric
hter
svel
d 1,
970
- -
1,97
0 1,
970
-
-
Rus
tenb
urg
- -
1,70
0 1,
700
-
-
Sak
hisiz
we
1,70
0
-
- 1,
700
1,70
0 -
-
Sal
danh
a Ba
y 1,
550
- -
1,55
0 1,
550
-
-

386
PART E: FINANCIAL INFORMATION - Continuedfor the year ended 31 March 2019
ANNEXURES TO THE ANNUAL FINANCIAL STATEMENT
40.1
.1
STAT
EMEN
T O
F CO
ND
ITIO
NAL
GRA
NTS
AN
D O
THER
TRA
NSF
ERS
TO M
UN
ICIP
ALIT
IES
NA
ME
OF
MU
NIC
IPA
LITY
GRA
NT
ALL
OCA
TIO
NTR
AN
SFER
DoR
A an
d ot
her
tran
sfer
sRo
ll O
vers
Adju
stm
ents
Tota
l Ava
ilabl
eAc
tual
Tran
sfer
Fund
s With
held
Re-a
lloca
tions
by
Nat
iona
l Tre
asur
y or
N
atio
nal D
epar
tmen
t
R
’000
R
’000
R
’000
R
’000
R
’000
R
’000
R
’000
Sar
ah B
aart
man
Dist
rict
Mun
icip
ality
1,
000
- -
1,00
0
1,00
0 -
-
Sed
iben
g D
istric
t
Mun
icip
ality
1,
250
- -
1,25
0
1,25
0 -
-
Sek
hukh
une
Dist
rict
Mun
icip
ality
1,
320
- -
1,32
0
1,32
0 -
-
Sen
qu
1,70
0
-
- 1,
700
1,70
0 -
-
Set
soto
1,
700
- -
1,70
0 1,
700
-
-
Siy
ancu
ma
2,41
5
-
- 2,
415
2,41
5 -
-
Siy
athe
mba
2,
415
- -
2,41
5 2,
415
-
-
Sol
Pla
atjie
1,
700
- -
1,70
0 1,
700
-
-
Ste
llenb
osch
1,
550
- -
1,55
0 1,
550
-
-
Ste
ve Ts
hwet
e 1,
700
- -
1,70
0 1,
700
-
-
Sun
days
Riv
er V
alle
y 2,
415
- -
2,41
5 2,
415
-
-
Sw
artla
nd
1,55
0
-
- 1,
550
1,55
0 -
-
Sw
elle
ndam
1,
770
- -
1,77
0 1,
770
-
-
Tha
ba C
hweu
2,
215
- -
2,21
5 2,
215
-
-
Tha
bazi
mbi
2,
215
- -
2,21
5 2,
215
-
-
Tha
bo M
ofut
sany
ana
Dist
rict
M
unic
ipal
ity
1,32
0
-
-
1,32
0
1,32
0 -
-
The
ewat
ersk
loof
1,
700
- -
1,70
0 1,
700
-
-
The
mbe
lihle
2,
415
- -
2,41
5 2,
415
-
-
The
mbi
sile
Han
i 1,
770
- -
1,77
0 1,
770
-
-
Thu
lam
ela
1,70
0
-
- 1,
700
1,70
0 -
-
Tok
olog
o 1,
970
- -
1,97
0 1,
970
-
-
Tsa
ntsa
bane
2,
415
- -
2,41
5 2,
415
-
-

387
PART E: FINANCIAL INFORMATION - Continuedfor the year ended 31 March 2019
ANNEXURES TO THE ANNUAL FINANCIAL STATEMENT
40.1
.1
STAT
EMEN
T O
F CO
ND
ITIO
NAL
GRA
NTS
AN
D O
THER
TRA
NSF
ERS
TO M
UN
ICIP
ALIT
IES
NA
ME
OF
MU
NIC
IPA
LITY
GRA
NT
ALL
OCA
TIO
NTR
AN
SFER
DoR
A an
d ot
her
tran
sfer
sRo
ll O
vers
Adju
stm
ents
Tota
l Ava
ilabl
eAc
tual
Tran
sfer
Fund
s With
held
Re-a
lloca
tions
by
Nat
iona
l Tre
asur
y or
N
atio
nal D
epar
tmen
t
R
’000
R
’000
R
’000
R
’000
R
’000
R
’000
R
’000
Tsw
aing
2,
415
- -
2,41
5 2,
415
-
-
Tsw
elop
ele
1,97
0
-
- 1,
970
1,97
0 -
-
uBu
hleb
ezw
e 1,
970
- -
1,97
0 1,
970
-
-
Ubu
ntu
1,97
0
-
- 1,
970
1,97
0 -
-
Ugu
Dist
rict
Mun
icip
ality
1,
865
- -
1,86
5 1,
865
-
-
Ulu
ndi
1,87
0
-
- 1,
870
1,87
0 -
-
uM
doni
4,
315
- -
4,31
5 4,
315
-
-
uM
folo
zi
1,90
0
-
- 1,
900
1,90
0 -
-
uM
gung
undl
ovu
Dist
rict M
unic
ipal
ity
1,00
0
-
-
1,00
0
1,00
0
-
-
uM
hlab
uyal
inga
na
1,90
0
-
- 1,
900
1,90
0 -
-
uM
hlat
huze
2,
650
- -
2,65
0 2,
650
-
-
uM
khan
yaku
de D
istric
t
Mun
icip
ality
1,00
0
-
-
1,00
0
1,00
0 -
-
uM
lala
zi
1,77
0
-
- 1,
770
1,77
0 -
-
uM
ngen
i 1,
770
- -
1,77
0 1,
770
-
-
uM
shw
athi
1,
970
- -
1,97
0 1,
970
-
-
uM
singa
1,
900
- -
1,90
0 1,
900
-
-
Um
sobo
mvu
1,
970
- -
1,97
0 1,
970
-
-
uM
uziw
aban
tu
1,90
0
-
- 1,
900
1,90
0 -
-
uM
voti
1,87
0
-
- 1,
870
1,87
0 -
-
uM
zim
khul
u 1,
900
- -
1,90
0 1,
900
-
-
Um
zim
vubu
1,
770
- -
1,77
0 1,
770
-
-
uM
ziny
athi
Dist
rict
Mun
icip
ality
1,
320
- -
1,32
0
1,32
0 -
-

388
PART E: FINANCIAL INFORMATION - Continuedfor the year ended 31 March 2019
ANNEXURES TO THE ANNUAL FINANCIAL STATEMENT
40.1
.1
STAT
EMEN
T O
F CO
ND
ITIO
NAL
GRA
NTS
AN
D O
THER
TRA
NSF
ERS
TO M
UN
ICIP
ALIT
IES
NA
ME
OF
MU
NIC
IPA
LITY
GRA
NT
ALL
OCA
TIO
NTR
AN
SFER
DoR
A an
d ot
her
tran
sfer
sRo
ll O
vers
Adju
stm
ents
Tota
l Ava
ilabl
eAc
tual
Tran
sfer
Fund
s With
held
Re-a
lloca
tions
by
Nat
iona
l Tre
asur
y or
N
atio
nal D
epar
tmen
t
R
’000
R
’000
R
’000
R
’000
R
’000
R
’000
R
’000
uM
zum
be
1,90
0
-
- 1,
900
1,90
0 -
-
uPh
ongo
lo
1,97
0
-
- 1,
970
1,97
0 -
-
uTh
ukel
a D
istric
t
Mun
icip
ality
1,54
5
-
-
1,54
5
1,54
5 -
-
Ven
ters
dorp
/Tlo
kwe
4,11
5
-
- 4,
115
4,11
5 -
-
Vhe
mbe
Dist
rict
Mun
icip
ality
1,86
5
-
-
1,86
5
1,86
5
-
-
Vic
tor K
hany
e 1,
770
- -
1,77
0 1,
770
-
-
Wal
ter S
isulu
4,
315
- -
4,31
5 4,
315
-
-
Wat
erbe
rg D
istric
t
Mun
icip
ality
1,00
0
-
-
1,00
0
1,00
0
-
-
Wes
t Coa
st D
istric
t
Mun
icip
ality
1,00
0
-
-
1,00
0
1,00
0
-
-
Wes
t Ran
d D
istric
t
Mun
icip
ality
1,00
0
-
-
1,00
0
1,00
0
-
-
Witz
enbe
rg
1,55
0
-
- 1,
550
1,55
0 -
-
Xhar
iep
Dist
rict
Mun
icip
ality
1,32
0
-
-
1,32
0
1,32
0
-
-
Z.F.
Mgc
awu
Dist
rict
Mun
icip
ality
1,00
0
-
-
1,00
0
1,00
0
-
-
Zulu
land
Dist
rict
Mun
icip
ality
1,00
0
-
-
1,00
0
1,00
0
-
-
TOTA
L
504
,566
-
-
504,
566
5
04,5
66
-
-
INFR
ASTR
UCT
URE
SKI
LLS
DEV
ELO
PMEN
T G
RAN
T
Buffa
lo C
ity
10,8
00
- -
10,8
00
10,8
00
-
-
Nel
son
Man
dela
Bay
11
,834
-
- 11
,834
11
,834
-
-
Enoc
h M
gijim
a
- -
- -
-
-

389
PART E: FINANCIAL INFORMATION - Continuedfor the year ended 31 March 2019
ANNEXURES TO THE ANNUAL FINANCIAL STATEMENT
40.1
.1
STAT
EMEN
T O
F CO
ND
ITIO
NAL
GRA
NTS
AN
D O
THER
TRA
NSF
ERS
TO M
UN
ICIP
ALIT
IES
NA
ME
OF
MU
NIC
IPA
LITY
GRA
NT
ALL
OCA
TIO
NTR
AN
SFER
DoR
A an
d ot
her
tran
sfer
sRo
ll O
vers
Adju
stm
ents
Tota
l Ava
ilabl
eAc
tual
Tran
sfer
Fund
s With
held
Re-a
lloca
tions
by
Nat
iona
l Tre
asur
y or
N
atio
nal D
epar
tmen
t
R
’000
R
’000
R
’000
R
’000
R
’000
R
’000
R
’000
King
Sab
ata
Dal
indy
ebo
6,00
0
-
- 6,
000
6,00
0 -
-
Alfre
d N
zo
5,40
0
-
- 5,
400
5,40
0 -
-
City
of J
ohan
nesb
urg
7,20
0
-
- 7,
200
7,20
0 -
-
Ran
d W
est L
ocal
Mun
icip
ality
-
-
-
-
-
-
eTh
ekw
ini
30,5
00
- 2,
700
33,2
00
33,2
00
-
-
uM
hlat
huze
5,
000
- -
5,00
0 2,
300
2,70
0
-
Aflr
ed D
uma
1,80
0
-
- 1,
800
1,80
0 -
-
Pol
okw
ane
6,50
0
-
- 6,
500
6,50
0 -
-
Thu
lam
ela
1,80
0
-
- 1,
800
1,80
0 -
-
Gov
an M
beki
22
,500
-
- 22
,500
22
,500
-
-
Ger
t Sib
ande
5,
553
- -
5,55
3 5,
553
-
-
Sol
Pla
atjie
3,
800
3
,141
-
6,94
1 3,
800
-
-
John
Taol
o G
aets
ewe
Dist
rict M
unic
ipal
ity
3,20
0
-
- 3,
200
3,20
0 -
-
City
of C
ape
Tow
n 13
,605
-
- 13
,605
13
,605
-
-
Geo
rge
6,00
0
-
- 6,
000
6,00
0 -
-
Sub
-tota
l 14
1,49
2
3,14
1 2,
700
147,3
33
141,
492
2,70
0
-
-
NEI
GH
BOU
RHO
OD
DEV
ELO
PMEN
T PA
RTN
ERSH
IP G
RAN
T
Am
atho
le
7,08
0 -
920
8,00
0 8,
000
-
-
Buff
alo
City
13
,250
-
- 13
,250
6,
000
- -
City
of C
ape
Tow
n
Met
ropo
litan
-
-
7,30
0
7,30
0
7,30
0
-
-
City
of J
ohan
nesb
urg
Met
ropo
litan
40,1
20
-
39,8
80
80,0
00
80,0
00
-
-

390
PART E: FINANCIAL INFORMATION - Continuedfor the year ended 31 March 2019
ANNEXURES TO THE ANNUAL FINANCIAL STATEMENT
40.1
.1
STAT
EMEN
T O
F CO
ND
ITIO
NAL
GRA
NTS
AN
D O
THER
TRA
NSF
ERS
TO M
UN
ICIP
ALIT
IES
NA
ME
OF
MU
NIC
IPA
LITY
GRA
NT
ALL
OCA
TIO
NTR
AN
SFER
DoR
A an
d ot
her
tran
sfer
sRo
ll O
vers
Adju
stm
ents
Tota
l Ava
ilabl
eAc
tual
Tran
sfer
Fund
s With
held
Re-a
lloca
tions
by
Nat
iona
l Tre
asur
y or
N
atio
nal D
epar
tmen
t
R
’000
R
’000
R
’000
R
’000
R
’000
R
’000
R
’000
City
of M
atlo
sana
48
,485
-
26,5
15
75,0
00
75,0
00
-
-
City
of T
shw
ane
Met
ropo
litan
7,10
5
-
-
7,10
5
3,60
5
-
-
Ekur
hule
ni M
etro
polit
an
75,2
62
- (1
5,26
2)60
,000
60
,000
-
-
Em
alah
leni
/ Witb
ank
10,6
05
- -
10,6
05
10,6
05
- -
Emfu
leni
37
,849
-
(22,
925)
14,9
24
14,9
24
-
-
eTh
ekw
ini M
etro
polit
an
25,2
20
- -
25,2
20
25,2
20
- -
Kny
sna
12,0
00
- 11
,000
23
,000
23
,000
-
-
Man
deni
10
,667
-
- 10
,667
10
,667
-
-
Man
gaun
g 13
,000
-
- 13
,000
13
,000
-
-
Mbo
mbe
la
33,5
35
- -
33,5
35
33,5
35
- -
Mog
ale
City
18
,630
-
56,7
31
75,3
61
75,3
61
-
-
Msu
nduz
i 42
,360
-
(27,
460)
14,9
00
14,9
00
-
-
Nel
son
Man
dela
Bay
-
- -
- -
-
-
New
cast
le
-
-
2,00
0 2,
000
-
-
Polo
kwan
e 35
,000
-
10,0
00
45,0
00
45,0
00
-
-
Rust
enbu
rg
-
-
5,00
0 5,
000
5,00
0 -
-
Sol P
laat
jie
171,
699
- (1
13,6
99)
58,0
00
58,0
00
-
-
Wes
t Ran
d -
- -
- -
-
-
Sub-
tota
l 60
1,86
7
-
(20,
000)
581,
867
569,1
17
-
-
INTE
GRA
TED
CIT
IES
DEV
ELO
PMEN
T G
RAN
T
Buff
alo
10,0
03
-
-
10,0
03
10,0
03
-
-

391
PART E: FINANCIAL INFORMATION - Continuedfor the year ended 31 March 2019
ANNEXURES TO THE ANNUAL FINANCIAL STATEMENT
40.1
.1
STAT
EMEN
T O
F CO
ND
ITIO
NAL
GRA
NTS
AN
D O
THER
TRA
NSF
ERS
TO M
UN
ICIP
ALIT
IES
NA
ME
OF
MU
NIC
IPA
LITY
GRA
NT
ALL
OCA
TIO
NTR
AN
SFER
DoR
A an
d ot
her
tran
sfer
sRo
ll O
vers
Adju
stm
ents
Tota
l Ava
ilabl
eAc
tual
Tran
sfer
Fund
s With
held
Re-a
lloca
tions
by
Nat
iona
l Tre
asur
y or
N
atio
nal D
epar
tmen
t
R
’000
R
’000
R
’000
R
’000
R
’000
R
’000
R
’000
Nel
son
Man
dela
Bay
12
,355
-
- 12
,355
12
,355
-
-
Man
gaun
g 7,
207
- -
7,20
7 7,
207
-
-
City
of J
ohan
nesb
urg
63,5
36
- -
63,5
36
63,5
36
-
-
City
Of T
shw
ane
45,0
13
- -
45,0
13
45,0
13
-
-
Eku
rhul
eni M
etro
45
,537
-
- 45
,537
45
,537
-
-
eTh
ekw
ini
45,5
96
- -
45,5
96
45,5
96
-
-
Cap
e To
wn
64,3
62
- -
64,3
62
64,3
62
-
-
Tota
l 29
3,60
9
-
- 29
3,60
9 29
3,60
9 -
-
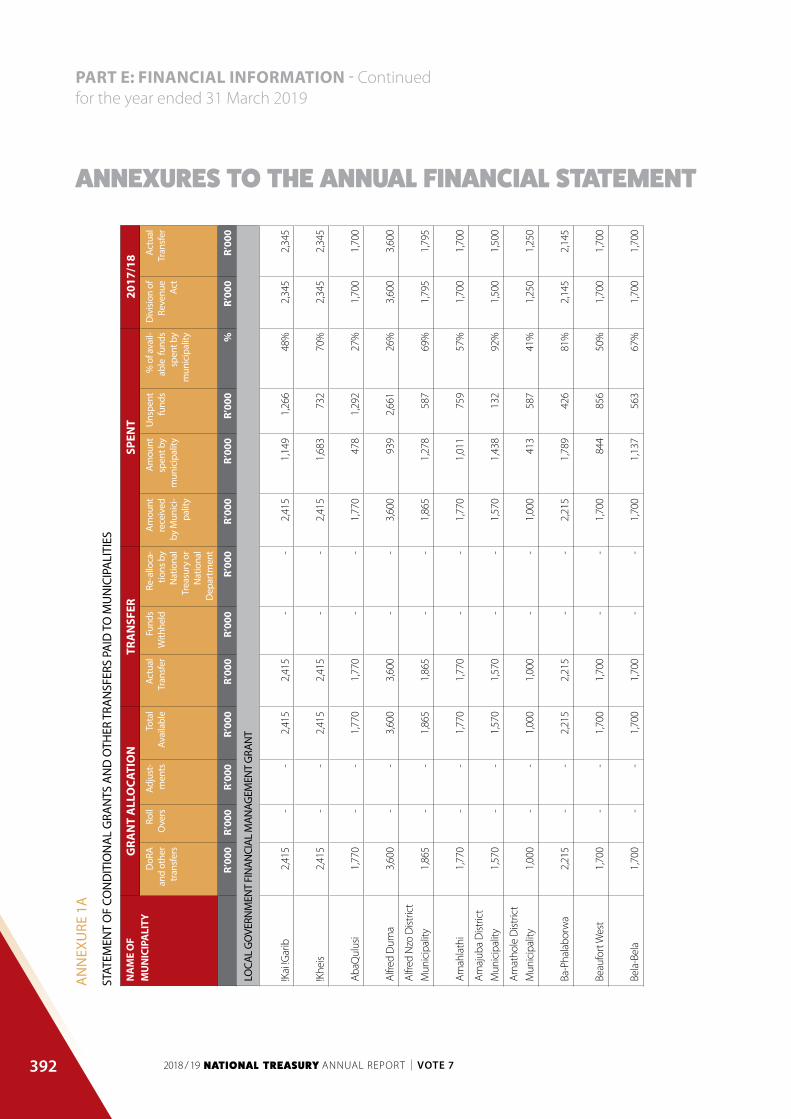
392
PART E: FINANCIAL INFORMATION - Continuedfor the year ended 31 March 2019
ANNEXURES TO THE ANNUAL FINANCIAL STATEMENT
AN
NEX
URE
1A
STAT
EMEN
T O
F CO
ND
ITIO
NA
L G
RAN
TS A
ND
OTH
ER T
RAN
SFER
S PA
ID T
O M
UN
ICIP
ALI
TIES
NA
ME
OF
MU
NIC
IPA
LITY
GRA
NT
ALL
OCA
TIO
NTR
AN
SFER
SPEN
T20
17/1
8D
oRA
an
d ot
her
tran
sfer
s
Roll
Ove
rsAd
just
-m
ents
Tota
l Av
aila
ble
Actu
al
Tran
sfer
Fund
s W
ithhe
ldRe
-allo
ca-
tions
by
Nat
iona
l Tr
easu
ry o
r N
atio
nal
Dep
artm
ent
Amou
nt
rece
ived
by
Mun
ici-
palit
y
Amou
nt
spen
t by
mun
icip
ality
Uns
pent
fu
nds
% o
f ava
il-ab
le f
unds
sp
ent b
y m
unic
ipal
ity
Div
ision
of
Reve
nue
Act
Actu
al
Tran
sfer
R
’000
R
’000
R
’000
R
’000
R
’000
R
’000
R
’000
R
’000
R
’000
R
’000
%
R
’000
R
’000
LOCA
L G
OVE
RNM
ENT
FIN
ANCI
AL M
ANAG
EMEN
T G
RAN
T
!Kai
!Gar
ib
2,41
5
-
-
2,41
5
2,41
5
-
-
2,41
5
1,14
9
1,26
6 48
%
2
,345
2
,345
!Khe
is
2,41
5
-
-
2,41
5
2,41
5
-
-
2,41
5
1,68
3
732
70%
2,3
45
2,34
5
AbaQ
ulus
i
1,77
0
-
-
1,77
0
1,77
0
-
-
1,77
0
478
1,29
2 27
%
1
,700
1
,700
Alfre
d D
uma
3,60
0
-
-
3,60
0
3,60
0
-
-
3,60
0
939
2,66
1 26
%
3,60
0
3
,600
Alfre
d N
zo D
istric
t
Mun
icip
ality
1,86
5
-
-
1,86
5
1,86
5
-
-
1,86
5
1,27
8
587
69%
1,7
95
1,79
5
Amah
lath
i
1,77
0
-
-
1,77
0
1,77
0
-
-
1,77
0
1,01
1
759
57%
1,70
0
1,70
0
Amaj
uba
Dist
rict
Mun
icip
ality
1,57
0
-
-
1,57
0
1,57
0
-
-
1,57
0
1,43
8
132
92%
1,50
0
1,50
0
Amat
hole
Dist
rict
Mun
icip
ality
1,00
0
-
-
1,00
0
1,00
0
-
-
1,00
0
413
587
41%
1,25
0
1,25
0
Ba-P
hala
borw
a
2,21
5
-
-
2,21
5
2,21
5
-
-
2,21
5
1,78
9
426
81%
2,14
5
2,14
5
Beau
fort
Wes
t
1,70
0
-
-
1,70
0
1,70
0
-
-
1,70
0
844
856
50%
1,70
0
1,70
0
Bela
-Bel
a
1,70
0
-
-
1,70
0
1,70
0
-
-
1,70
0
1,13
7
563
67%
1,70
0
1,70
0

393
PART E: FINANCIAL INFORMATION - Continuedfor the year ended 31 March 2019
ANNEXURES TO THE ANNUAL FINANCIAL STATEMENT
NA
ME
OF
MU
NIC
IPA
LITY
GRA
NT
ALL
OCA
TIO
NTR
AN
SFER
SPEN
T20
17/1
8D
oRA
an
d ot
her
tran
sfer
s
Roll
Ove
rsAd
just
-m
ents
Tota
l Av
aila
ble
Actu
al
Tran
sfer
Fund
s W
ithhe
ldRe
-allo
ca-
tions
by
Nat
iona
l Tr
easu
ry o
r N
atio
nal
Dep
artm
ent
Amou
nt
rece
ived
by
Mun
ici-
palit
y
Amou
nt
spen
t by
mun
icip
ality
Uns
pent
fu
nds
% o
f ava
il-ab
le f
unds
sp
ent b
y m
unic
ipal
ity
Div
ision
of
Reve
nue
Act
Actu
al
Tran
sfer
R
’000
R
’000
R
’000
R
’000
R
’000
R
’000
R
’000
R
’000
R
’000
R
’000
%
R
’000
R
’000
Berg
rivie
r
1,55
0
-
-
1,55
0
1,55
0
-
-
1,55
0
977
573
63%
1,55
0
1,55
0
Big
Five
Hla
bisa
3,87
0
-
-
3,87
0
3,87
0
-
-
3,87
0
2,35
7
1,51
3 61
%
3,80
0
3,80
0
Bito
u
1,55
0
-
-
1,55
0
1,55
0
-
-
1,55
0
445
1,10
5 29
%
1,55
0
1,55
0
Blou
berg
2,53
4
-
-
2,53
4
2,53
4
-
-
2,53
4
1,56
7
967
62%
2,53
3
2,53
3
Blue
Cra
ne R
oute
1,77
0
-
-
1,77
0
1,77
0
-
-
1,77
0
1,00
5
765
57%
1,70
0
1,70
0
Boja
nala
Pla
tinum
Dist
rict
Mun
icip
ality
1,00
0
-
-
1,00
0
1,00
0
-
-
1,00
0
982
18
98%
1,25
0
1,25
0
Bree
de V
alle
y
1,55
0
-
-
1,55
0
1,55
0
-
-
1,55
0
365
1,18
5 24
%
1,55
0
1,55
0
Buffa
lo C
ity
1,15
0
-
-
1,15
0
1,15
0
-
-
1,15
0
497
653
43%
1,30
0
1,30
0
Bush
buck
ridge
2,21
5
-
-
2,21
5
2,21
5
-
-
2,21
5
1,36
6
849
62%
2,14
5
2,14
5
Cape
Agu
lhas
1,55
0
-
-
1,55
0
1,55
0
-
-
1,55
0
432
1,11
8 28
%
1,55
0
1,55
0
Cape
Win
elan
ds
Dist
rict
Mun
icip
ality
1,00
0
-
-
1,00
0
1,00
0
-
-
1,00
0
803
197
80%
1,25
0
1,25
0
Capr
icor
n D
istric
t
Mun
icip
ality
1,00
0
-
-
1,00
0
1,00
0
-
-
1,00
0
790
210
79%
1,25
0
1,25
0
STAT
EMEN
T O
F CO
ND
ITIO
NA
L G
RAN
TS A
ND
OTH
ER T
RAN
SFER
S PA
ID T
O M
UN
ICIP
ALI
TIES
- co
ntin
ued

394
PART E: FINANCIAL INFORMATION - Continuedfor the year ended 31 March 2019
ANNEXURES TO THE ANNUAL FINANCIAL STATEMENT
NA
ME
OF
MU
NIC
IPA
LITY
GRA
NT
ALL
OCA
TIO
NTR
AN
SFER
SPEN
T20
17/1
8D
oRA
an
d ot
her
tran
sfer
s
Roll
Ove
rsAd
just
-m
ents
Tota
l Av
aila
ble
Actu
al
Tran
sfer
Fund
s W
ithhe
ldRe
-allo
ca-
tions
by
Nat
iona
l Tr
easu
ry o
r N
atio
nal
Dep
artm
ent
Amou
nt
rece
ived
by
Mun
ici-
palit
y
Amou
nt
spen
t by
mun
icip
ality
Uns
pent
fu
nds
% o
f ava
il-ab
le f
unds
sp
ent b
y m
unic
ipal
ity
Div
ision
of
Reve
nue
Act
Actu
al
Tran
sfer
R
’000
R
’000
R
’000
R
’000
R
’000
R
’000
R
’000
R
’000
R
’000
R
’000
%
R
’000
R
’000
Cede
rber
g
1,62
0
-
-
1,62
0
1,62
0
-
-
1,62
0
840
780
52%
1,55
0
1,55
0
Cent
ral K
aroo
Dist
rict
Mun
icip
ality
1,00
0
-
-
1,00
0
1,00
0
-
-
1,00
0
699
301
70%
1,25
0
1,25
0
Chie
f Alb
ert
Luth
uli
1,70
0
-
-
1,70
0
1,70
0
-
-
1,70
0
1,36
2
338
80%
1,70
0
1,70
0
Chris
Han
i Dist
rict
Mun
icip
ality
1,25
0
-
-
1,25
0
1,25
0
-
-
1,25
0
689
561
55%
1,50
0
1,50
0
City
of C
ape
Tow
n
1,00
0
-
-
1,00
0
1,00
0
-
-
1,00
0
814
186
81%
1,05
0
1,05
0
City
of
Joha
nnes
burg
1,00
0
-
-
1,00
0
1,00
0
-
-
1,00
0
669
331
67%
1,05
0
1,05
0
City
of M
atlo
sana
2,21
5
-
-
2,21
5
2,21
5
-
-
2,21
5
875
1,34
0 40
%
2,14
5
2,14
5
City
of M
bom
bela
3,47
0
-
-
3,47
0
3,47
0
-
-
3,47
0
2,35
2
1,11
8 68
%
3,40
0
3,40
0
City
of T
shw
ane
2,65
0
-
-
2,65
0
2,65
0
-
-
2,65
0
2,37
0
280
89%
2,65
0
2,65
0
Dan
nhau
ser
1,90
0
-
-
1,90
0
1,90
0
-
-
1,90
0
1,55
6
344
82%
1,90
0
1,90
0
Daw
id K
ruip
er
4,11
5
-
-
4,11
5
4,11
5
-
-
4,11
5
2,08
3
2,03
2 51
%
4,04
5
4,04
5
Dih
labe
ng
1,77
0
-
-
1,77
0
1,77
0
-
-
1,77
0
1,43
1
339
81%
1,70
0
1,70
0
Dik
gatlo
ng
2,41
5
-
-
2,41
5
2,41
5
-
-
2,41
5
2,25
0
165
93%
2,34
5
2,34
5
STAT
EMEN
T O
F CO
ND
ITIO
NA
L G
RAN
TS A
ND
OTH
ER T
RAN
SFER
S PA
ID T
O M
UN
ICIP
ALI
TIES
- co
ntin
ued

395
PART E: FINANCIAL INFORMATION - Continuedfor the year ended 31 March 2019
ANNEXURES TO THE ANNUAL FINANCIAL STATEMENT
NA
ME
OF
MU
NIC
IPA
LITY
GRA
NT
ALL
OCA
TIO
NTR
AN
SFER
SPEN
T20
17/1
8D
oRA
an
d ot
her
tran
sfer
s
Roll
Ove
rsAd
just
-m
ents
Tota
l Av
aila
ble
Actu
al
Tran
sfer
Fund
s W
ithhe
ldRe
-allo
ca-
tions
by
Nat
iona
l Tr
easu
ry o
r N
atio
nal
Dep
artm
ent
Amou
nt
rece
ived
by
Mun
ici-
palit
y
Amou
nt
spen
t by
mun
icip
ality
Uns
pent
fu
nds
% o
f ava
il-ab
le f
unds
sp
ent b
y m
unic
ipal
ity
Div
ision
of
Reve
nue
Act
Actu
al
Tran
sfer
R
’000
R
’000
R
’000
R
’000
R
’000
R
’000
R
’000
R
’000
R
’000
R
’000
%
R
’000
R
’000
Dip
ales
eng
1,97
0
-
-
1,97
0
1,97
0
-
-
1,97
0
1,84
7
123
94%
1,90
0
1,90
0
Dits
obot
la
2,21
5
-
-
2,21
5
2,21
5
-
-
2,21
5
461
1,75
4 21
%
2,14
5
2,14
5
Dr B
eyer
s Nau
de
6,08
5
-
-
6,08
5
6,08
5
-
-
6,08
5
2,46
6
3,61
9 41
%
5,94
5
5,94
5
Dr J
S M
orok
a
1,77
0
-
-
1,77
0
1,77
0
-
-
1,77
0
1,61
4
156
91%
1,70
0
1,70
0
Dr K
enne
th
Kaun
da D
istric
t
Mun
icip
ality
1,00
0
-
-
1,00
0
1,00
0
-
-
1,00
0
516
484
52%
1,25
0
1,25
0
Dr N
kosa
zana
Dla
min
i Zum
a
3,87
0
-
-
3,87
0
3,87
0
-
-
3,87
0
2,54
0
1,33
0 66
%
3,80
0
3,80
0
Dr P
ixle
y ka
Isak
a
Sem
e
1,77
0
-
-
1,77
0
1,77
0
-
-
1,77
0
957
813
54%
1,70
0
1,70
0
Dr R
uth
Sego
mot
si
Mom
pati
Dist
rict
Mun
icip
ality
1,32
0
-
-
1,32
0
1,32
0
-
-
1,32
0
495
825
38%
1,25
0
1,25
0
Dra
kens
tein
1,55
0
-
-
1,55
0
1,55
0
-
-
1,55
0
1,55
0
- 10
0%
1,55
0
1,55
0
Eden
Dist
rict
Mun
icip
ality
1,00
0
-
-
1,00
0
1,00
0
-
-
1,00
0
726
274
73%
1,25
0
1,25
0
eDum
be
1,97
0
-
-
1,97
0
1,97
0
-
-
1,97
0
1,24
9
721
63%
1,90
0
1,90
0
Ehla
nzen
i Dist
rict
Mun
icip
ality
1,25
0
-
-
1,25
0
1,25
0
-
-
1,25
0
850
400
68%
1,50
0
1,50
0
STAT
EMEN
T O
F CO
ND
ITIO
NA
L G
RAN
TS A
ND
OTH
ER T
RAN
SFER
S PA
ID T
O M
UN
ICIP
ALI
TIES
- co
ntin
ued

396
PART E: FINANCIAL INFORMATION - Continuedfor the year ended 31 March 2019
ANNEXURES TO THE ANNUAL FINANCIAL STATEMENT
NA
ME
OF
MU
NIC
IPA
LITY
GRA
NT
ALL
OCA
TIO
NTR
AN
SFER
SPEN
T20
17/1
8D
oRA
an
d ot
her
tran
sfer
s
Roll
Ove
rsAd
just
-m
ents
Tota
l Av
aila
ble
Actu
al
Tran
sfer
Fund
s W
ithhe
ldRe
-allo
ca-
tions
by
Nat
iona
l Tr
easu
ry o
r N
atio
nal
Dep
artm
ent
Amou
nt
rece
ived
by
Mun
ici-
palit
y
Amou
nt
spen
t by
mun
icip
ality
Uns
pent
fu
nds
% o
f ava
il-ab
le f
unds
sp
ent b
y m
unic
ipal
ity
Div
ision
of
Reve
nue
Act
Actu
al
Tran
sfer
R
’000
R
’000
R
’000
R
’000
R
’000
R
’000
R
’000
R
’000
R
’000
R
’000
%
R
’000
R
’000
Ekur
hule
ni
1,00
0
-
-
1,00
0
1,00
0
-
-
1,00
0
454
546
45%
1,05
0
1,05
0
Elia
s Mot
soal
edi
1,77
0
-
-
1,77
0
1,77
0
-
-
1,77
0
886
884
50%
1,70
0
1,70
0
Elun
dini
1,70
0
-
-
1,70
0
1,70
0
-
-
1,70
0
467
1,23
3 27
%
1,70
0
1,70
0
eMad
lang
eni
1,97
0
-
-
1,97
0
1,97
0
-
-
1,97
0
1,18
8
782
60%
1,90
0
1,90
0
Emak
haze
ni
1,97
0
-
-
1,97
0
1,97
0
-
-
1,97
0
1,93
4
36
98%
1,90
0
1,90
0
Emal
ahle
ni (E
C)
2,41
5
-
-
2,41
5
2,41
5
-
-
2,41
5
939
1,47
6 39
%
2,34
5
2,34
5
Emal
ahle
ni (M
P)
2,21
5
-
-
2,21
5
2,21
5
-
-
2,21
5
870
1,34
5 39
%
2,14
5
2,14
5
Emfu
leni
1,55
0
-
-
1,55
0
1,55
0
-
-
1,55
0
364
1,18
6 23
%
1,55
0
1,55
0
Emth
anje
ni
1,70
0
-
-
1,70
0
1,70
0
-
-
1,70
0
1,70
0
- 10
0%
1,70
0
1,70
0
eNdu
men
i
1,77
0
-
-
1,77
0
1,77
0
-
-
1,77
0
667
1,10
3 38
%
1,70
0
1,70
0
Engc
obo
1,70
0
-
-
1,70
0
1,70
0
-
-
1,70
0
1,11
4
586
66%
1,70
0
1,70
0
Enoc
h M
gijim
a
6,01
5
-
-
6,01
5
6,01
5
-
-
6,01
5
2,56
5
3,45
0 43
%
5,94
5
5,94
5
Ephr
aim
Mog
ale
2,21
5
-
-
2,21
5
2,21
5
-
-
2,21
5
1,74
7
468
79%
2,14
5
2,14
5
eThe
kwin
i
1,00
0
-
-
1,00
0
1,00
0
-
-
1,00
0
1,00
0
- 10
0%
1,05
0
1,05
0
STAT
EMEN
T O
F CO
ND
ITIO
NA
L G
RAN
TS A
ND
OTH
ER T
RAN
SFER
S PA
ID T
O M
UN
ICIP
ALI
TIES
- co
ntin
ued

397
PART E: FINANCIAL INFORMATION - Continuedfor the year ended 31 March 2019
ANNEXURES TO THE ANNUAL FINANCIAL STATEMENT
NA
ME
OF
MU
NIC
IPA
LITY
GRA
NT
ALL
OCA
TIO
NTR
AN
SFER
SPEN
T20
17/1
8D
oRA
an
d ot
her
tran
sfer
s
Roll
Ove
rsAd
just
-m
ents
Tota
l Av
aila
ble
Actu
al
Tran
sfer
Fund
s W
ithhe
ldRe
-allo
ca-
tions
by
Nat
iona
l Tr
easu
ry o
r N
atio
nal
Dep
artm
ent
Amou
nt
rece
ived
by
Mun
ici-
palit
y
Amou
nt
spen
t by
mun
icip
ality
Uns
pent
fu
nds
% o
f ava
il-ab
le f
unds
sp
ent b
y m
unic
ipal
ity
Div
ision
of
Reve
nue
Act
Actu
al
Tran
sfer
R
’000
R
’000
R
’000
R
’000
R
’000
R
’000
R
’000
R
’000
R
’000
R
’000
%
R
’000
R
’000
Fezi
le D
abi D
istric
t
Mun
icip
ality
1,00
0
-
-
1,00
0
1,00
0
-
-
1,00
0
642
358
64%
1,25
0
1,25
0
Fran
ces B
aard
Dist
rict
Mun
icip
ality
1,00
0
-
-
1,00
0
1,00
0
-
-
1,00
0
694
306
69%
1,25
0
1,25
0
Gam
agar
a
1,77
0
-
-
1,77
0
1,77
0
-
-
1,77
0
1,50
7
263
85%
1,70
0
1,70
0
Ga-
Sego
nyan
a
2,21
5
-
-
2,21
5
2,21
5
-
-
2,21
5
1,49
9
716
68%
2,14
5
2,14
5
Geo
rge
1,55
0
-
-
1,55
0
1,55
0
-
-
1,55
0
1,16
0
390
75%
1,55
0
1,55
0
Ger
t Sib
ande
Dist
rict
Mun
icip
ality
1,00
0
-
-
1,00
0
1,00
0
-
-
1,00
0
900
100
90%
1,25
0
1,25
0
Gov
an M
beki
1,77
0
-
-
1,77
0
1,77
0
-
-
1,77
0
648
1,12
2 37
%
1,70
0
1,70
0
Gre
at K
ei
2,41
5
-
-
2,41
5
2,41
5
-
-
2,41
5
1,59
9
816
66%
2,34
5
2,34
5
Gre
ater
Giy
ani
2,14
5
-
-
2,14
5
2,14
5
-
-
2,14
5
1,16
6
979
54%
2,14
5
2,14
5
Gre
ater
Kok
stad
1,80
0
-
-
1,80
0
1,80
0
-
-
1,80
0
335
1,46
5 19
%
1,80
0
1,80
0
Gre
ater
Let
aba
2,14
5
-
-
2,14
5
2,14
5
-
-
2,14
5
1,11
9
1,02
6 52
%
2,14
5
2,14
5
Gre
ater
Taun
g
2,41
5
-
-
2,41
5
2,41
5
-
-
2,41
5
772
1,64
3 32
%
2,34
5
2,34
5
Gre
ater
Tzan
een
2,14
5
-
-
2,14
5
2,14
5
-
-
2,14
5
2,01
4
131
94%
2,14
5
2,14
5
STAT
EMEN
T O
F CO
ND
ITIO
NA
L G
RAN
TS A
ND
OTH
ER T
RAN
SFER
S PA
ID T
O M
UN
ICIP
ALI
TIES
- co
ntin
ued
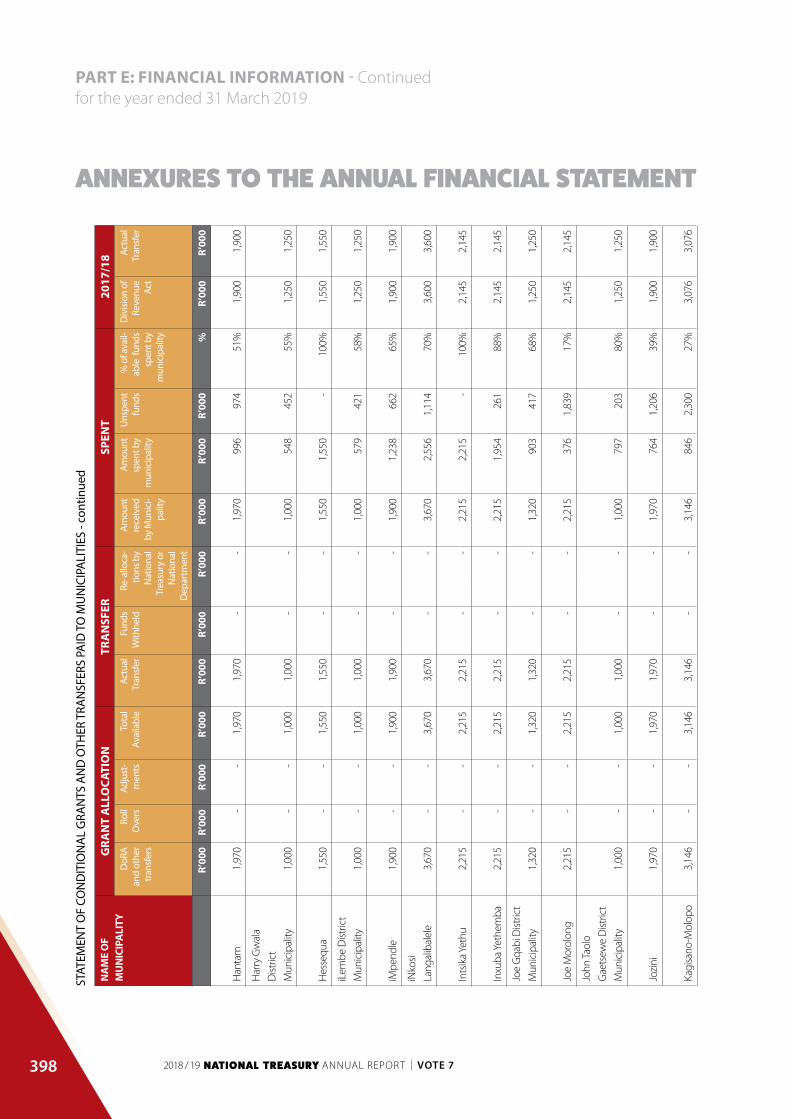
398
PART E: FINANCIAL INFORMATION - Continuedfor the year ended 31 March 2019
ANNEXURES TO THE ANNUAL FINANCIAL STATEMENT
NA
ME
OF
MU
NIC
IPA
LITY
GRA
NT
ALL
OCA
TIO
NTR
AN
SFER
SPEN
T20
17/1
8D
oRA
an
d ot
her
tran
sfer
s
Roll
Ove
rsAd
just
-m
ents
Tota
l Av
aila
ble
Actu
al
Tran
sfer
Fund
s W
ithhe
ldRe
-allo
ca-
tions
by
Nat
iona
l Tr
easu
ry o
r N
atio
nal
Dep
artm
ent
Amou
nt
rece
ived
by
Mun
ici-
palit
y
Amou
nt
spen
t by
mun
icip
ality
Uns
pent
fu
nds
% o
f ava
il-ab
le f
unds
sp
ent b
y m
unic
ipal
ity
Div
ision
of
Reve
nue
Act
Actu
al
Tran
sfer
R
’000
R
’000
R
’000
R
’000
R
’000
R
’000
R
’000
R
’000
R
’000
R
’000
%
R
’000
R
’000
Han
tam
1,97
0
-
-
1,97
0
1,97
0
-
-
1,97
0
996
974
51%
1,90
0
1,90
0
Har
ry G
wal
a
Dist
rict
Mun
icip
ality
1,00
0
-
-
1,00
0
1,00
0
-
-
1,00
0
548
452
55%
1,25
0
1,25
0
Hes
sequ
a
1,55
0
-
-
1,55
0
1,55
0
-
-
1,55
0
1,55
0
- 10
0%
1,55
0
1,55
0
iLem
be D
istric
t
Mun
icip
ality
1,00
0
-
-
1,00
0
1,00
0
-
-
1,00
0
579
421
58%
1,25
0
1,25
0
iMpe
ndle
1,90
0
-
-
1,90
0
1,90
0
-
-
1,90
0
1,23
8
662
65%
1,90
0
1,90
0
iNko
si
Lang
alib
alel
e
3,67
0
-
-
3,67
0
3,67
0
-
-
3,67
0
2,55
6
1,11
4 70
%
3,60
0
3,60
0
Ints
ika
Yeth
u
2,21
5
-
-
2,21
5
2,21
5
-
-
2,21
5
2,21
5
- 10
0%
2,14
5
2,14
5
Inxu
ba Y
ethe
mba
2,21
5
-
-
2,21
5
2,21
5
-
-
2,21
5
1,95
4
261
88%
2,14
5
2,14
5
Joe
Gqa
bi D
istric
t
Mun
icip
ality
1,32
0
-
-
1,32
0
1,32
0
-
-
1,32
0
903
417
68%
1,25
0
1,25
0
Joe
Mor
olon
g
2,21
5
-
-
2,21
5
2,21
5
-
-
2,21
5
376
1,83
9 17
%
2,14
5
2,14
5
John
Taol
o
Gae
tsew
e D
istric
t
Mun
icip
ality
1,00
0
-
-
1,00
0
1,00
0
-
-
1,00
0
797
203
80%
1,25
0
1,25
0
Jozi
ni
1,97
0
-
-
1,97
0
1,97
0
-
-
1,97
0
764
1,20
6 39
%
1,90
0
1,90
0
Kagi
sano
-Mol
opo
3,14
6
-
-
3,14
6
3,14
6
-
-
3,14
6
846
2,30
0 27
%
3,07
6
3,07
6
STAT
EMEN
T O
F CO
ND
ITIO
NA
L G
RAN
TS A
ND
OTH
ER T
RAN
SFER
S PA
ID T
O M
UN
ICIP
ALI
TIES
- co
ntin
ued

399
PART E: FINANCIAL INFORMATION - Continuedfor the year ended 31 March 2019
ANNEXURES TO THE ANNUAL FINANCIAL STATEMENT
NA
ME
OF
MU
NIC
IPA
LITY
GRA
NT
ALL
OCA
TIO
NTR
AN
SFER
SPEN
T20
17/1
8D
oRA
an
d ot
her
tran
sfer
s
Roll
Ove
rsAd
just
-m
ents
Tota
l Av
aila
ble
Actu
al
Tran
sfer
Fund
s W
ithhe
ldRe
-allo
ca-
tions
by
Nat
iona
l Tr
easu
ry o
r N
atio
nal
Dep
artm
ent
Amou
nt
rece
ived
by
Mun
ici-
palit
y
Amou
nt
spen
t by
mun
icip
ality
Uns
pent
fu
nds
% o
f ava
il-ab
le f
unds
sp
ent b
y m
unic
ipal
ity
Div
ision
of
Reve
nue
Act
Actu
al
Tran
sfer
R
’000
R
’000
R
’000
R
’000
R
’000
R
’000
R
’000
R
’000
R
’000
R
’000
%
R
’000
R
’000
Kam
iesb
erg
2,41
5
-
-
2,41
5
2,41
5
-
-
2,41
5
1,81
3
602
75%
2,34
5
2,34
5
Kann
alan
d
2,21
5
-
-
2,21
5
2,21
5
-
-
2,21
5
1,69
8
517
77%
2,14
5
2,14
5
Kare
eber
g
1,97
0
-
-
1,97
0
1,97
0
-
-
1,97
0
916
1,05
4 46
%
1,90
0
1,90
0
Karo
o H
oogl
and
1,97
0
-
-
1,97
0
1,97
0
-
-
1,97
0
1,90
6
64
97%
1,90
0
1,90
0
Kgat
elop
ele
2,41
5
-
-
2,41
5
2,41
5
-
-
2,41
5
1,67
2
743
69%
2,34
5
2,34
5
Kget
leng
rivie
r
2,41
5
-
-
2,41
5
2,41
5
-
-
2,41
5
1,31
8
1,09
7 55
%
2,34
5
2,34
5
Khâi
-Ma
1,97
0
-
-
1,97
0
1,97
0
-
-
1,97
0
1,38
5
585
70%
1,90
0
1,90
0
King
Cet
shw
ayo
Dist
rict
Mun
icip
ality
1,00
0
-
-
1,00
0
1,00
0
-
-
1,00
0
572
428
57%
1,25
0
1,25
0
King
Sab
ata
Dal
indy
ebo
2,21
5
-
-
2,21
5
2,21
5
-
-
2,21
5
890
1,32
5 40
%
2,14
5
2,14
5
Knys
na
1,55
0
-
-
1,55
0
1,55
0
-
-
1,55
0
743
807
48%
1,55
0
1,55
0
Kopa
nong
1,70
0
-
-
1,70
0
1,70
0
-
-
1,70
0
334
1,36
6 20
%
1,70
0
1,70
0
Koug
a
1,77
0
-
-
1,77
0
1,77
0
-
-
1,77
0
1,21
9
551
69%
1,70
0
1,70
0
Kou-
Kam
ma
1,97
0
-
-
1,97
0
1,97
0
-
-
1,97
0
1,19
5
775
61%
1,90
0
1,90
0
STAT
EMEN
T O
F CO
ND
ITIO
NA
L G
RAN
TS A
ND
OTH
ER T
RAN
SFER
S PA
ID T
O M
UN
ICIP
ALI
TIES
- co
ntin
ued

400
PART E: FINANCIAL INFORMATION - Continuedfor the year ended 31 March 2019
ANNEXURES TO THE ANNUAL FINANCIAL STATEMENT
NA
ME
OF
MU
NIC
IPA
LITY
GRA
NT
ALL
OCA
TIO
NTR
AN
SFER
SPEN
T20
17/1
8D
oRA
an
d ot
her
tran
sfer
s
Roll
Ove
rsAd
just
-m
ents
Tota
l Av
aila
ble
Actu
al
Tran
sfer
Fund
s W
ithhe
ldRe
-allo
ca-
tions
by
Nat
iona
l Tr
easu
ry o
r N
atio
nal
Dep
artm
ent
Amou
nt
rece
ived
by
Mun
ici-
palit
y
Amou
nt
spen
t by
mun
icip
ality
Uns
pent
fu
nds
% o
f ava
il-ab
le f
unds
sp
ent b
y m
unic
ipal
ity
Div
ision
of
Reve
nue
Act
Actu
al
Tran
sfer
R
’000
R
’000
R
’000
R
’000
R
’000
R
’000
R
’000
R
’000
R
’000
R
’000
%
R
’000
R
’000
KwaD
ukuz
a
1,80
0
-
-
1,80
0
1,80
0
-
-
1,80
0
500
1,30
0 28
%
1,80
0
1,80
0
Lain
gsbu
rg
1,80
0
-
-
1,80
0
1,80
0
-
-
1,80
0
1,18
3
617
66%
1,80
0
1,80
0
Lang
eber
g
1,55
0
-
-
1,55
0
1,55
0
-
-
1,55
0
1,39
0
160
90%
1,55
0
1,55
0
Lejw
elep
utsw
a
Dist
rict
Mun
icip
ality
1,00
0
-
-
1,00
0
1,00
0
-
-
1,00
0
529
471
53%
1,25
0
1,25
0
Lekw
a
1,77
0
-
-
1,77
0
1,77
0
-
-
1,77
0
1,31
4
456
74%
1,70
0
1,70
0
Lekw
a-Te
eman
e
2,21
5
-
-
2,21
5
2,21
5
-
-
2,21
5
-
2,21
5 0%
2,14
5
2,14
5
Lepe
le-N
kum
pi
2,14
5
-
-
2,14
5
2,14
5
-
-
2,14
5
968
1,17
7 45
%
2,14
5
2,14
5
Leph
alal
e
1,70
0
-
-
1,70
0
1,70
0
-
-
1,70
0
935
765
55%
1,70
0
1,70
0
Lese
di
1,55
0
-
-
1,55
0
1,55
0
-
-
1,55
0
1,01
2
538
65%
1,55
0
1,55
0
Lets
emen
g
1,97
0
-
-
1,97
0
1,97
0
-
-
1,97
0
1,04
5
925
53%
1,90
0
1,90
0
LIM
345
2,34
5
-
-
2,34
5
2,34
5
-
-
2,34
5
816
1,52
9 35
%
2,34
5
2,34
5
LIM
368
4,11
5
-
-
4,11
5
4,11
5
-
-
4,11
5
779
3,33
6 19
%
4,04
5
4,04
5
LIM
476
4,11
5
-
-
4,11
5
4,11
5
-
-
4,11
5
1,96
6
2,14
9 48
%
4,04
5
4,04
5
STAT
EMEN
T O
F CO
ND
ITIO
NA
L G
RAN
TS A
ND
OTH
ER T
RAN
SFER
S PA
ID T
O M
UN
ICIP
ALI
TIES
- co
ntin
ued

401
PART E: FINANCIAL INFORMATION - Continuedfor the year ended 31 March 2019
ANNEXURES TO THE ANNUAL FINANCIAL STATEMENT
NA
ME
OF
MU
NIC
IPA
LITY
GRA
NT
ALL
OCA
TIO
NTR
AN
SFER
SPEN
T20
17/1
8D
oRA
an
d ot
her
tran
sfer
s
Roll
Ove
rsAd
just
-m
ents
Tota
l Av
aila
ble
Actu
al
Tran
sfer
Fund
s W
ithhe
ldRe
-allo
ca-
tions
by
Nat
iona
l Tr
easu
ry o
r N
atio
nal
Dep
artm
ent
Amou
nt
rece
ived
by
Mun
ici-
palit
y
Amou
nt
spen
t by
mun
icip
ality
Uns
pent
fu
nds
% o
f ava
il-ab
le f
unds
sp
ent b
y m
unic
ipal
ity
Div
ision
of
Reve
nue
Act
Actu
al
Tran
sfer
R
’000
R
’000
R
’000
R
’000
R
’000
R
’000
R
’000
R
’000
R
’000
R
’000
%
R
’000
R
’000
Mad
iben
g
1,77
0
-
-
1,77
0
1,77
0
-
-
1,77
0
272
1,49
8 15
%
1,70
0
1,70
0
Mafi
keng
2,21
5
-
-
2,21
5
2,21
5
-
-
2,21
5
1,83
7
378
83%
2,14
5
2,14
5
Maf
ube
2,41
5
-
-
2,41
5
2,41
5
-
-
2,41
5
264
2,15
1 11
%
2,34
5
2,34
5
Mag
aren
g
1,97
0
-
-
1,97
0
1,97
0
-
-
1,97
0
1,22
5
745
62%
1,90
0
1,90
0
Mak
ana
2,21
5
-
-
2,21
5
2,21
5
-
-
2,21
5
1,64
1
574
74%
2,14
5
2,14
5
Mak
hado
1,70
0
-
-
1,70
0
1,70
0
-
-
1,70
0
1,20
9
491
71%
1,70
0
1,70
0
Mak
hudu
tham
aga
1,77
0
-
-
1,77
0
1,77
0
-
-
1,77
0
1,10
0
670
62%
1,70
0
1,70
0
Mal
uti-a
-Pho
fung
2,21
5
-
-
2,21
5
2,21
5
-
-
2,21
5
1,36
8
847
62%
2,14
5
2,14
5
Mam
usa
2,41
5
-
-
2,41
5
2,41
5
-
-
2,41
5
704
1,71
1 29
%
2,34
5
2,34
5
Man
deni
1,90
0
-
-
1,90
0
1,90
0
-
-
1,90
0
1,55
7
343
82%
1,90
0
1,90
0
Man
gaun
g
3,34
5
-
-
3,34
5
3,34
5
-
-
3,34
5
2,56
7
778
77%
3,64
5
3,64
5
Man
tsop
a
2,21
5
-
-
2,21
5
2,21
5
-
-
2,21
5
1,91
2
303
86%
2,14
5
2,14
5
Map
hum
ulo
1,90
0
-
-
1,90
0
1,90
0
-
-
1,90
0
974
926
51%
1,90
0
1,90
0
Maq
uass
i Hill
s
2,21
5
-
-
2,21
5
2,21
5
-
-
2,21
5
207
2,00
8 9%
2,14
5
2,14
5
STAT
EMEN
T O
F CO
ND
ITIO
NA
L G
RAN
TS A
ND
OTH
ER T
RAN
SFER
S PA
ID T
O M
UN
ICIP
ALI
TIES
- co
ntin
ued

402
PART E: FINANCIAL INFORMATION - Continuedfor the year ended 31 March 2019
ANNEXURES TO THE ANNUAL FINANCIAL STATEMENT
NA
ME
OF
MU
NIC
IPA
LITY
GRA
NT
ALL
OCA
TIO
NTR
AN
SFER
SPEN
T20
17/1
8D
oRA
an
d ot
her
tran
sfer
s
Roll
Ove
rsAd
just
-m
ents
Tota
l Av
aila
ble
Actu
al
Tran
sfer
Fund
s W
ithhe
ldRe
-allo
ca-
tions
by
Nat
iona
l Tr
easu
ry o
r N
atio
nal
Dep
artm
ent
Amou
nt
rece
ived
by
Mun
ici-
palit
y
Amou
nt
spen
t by
mun
icip
ality
Uns
pent
fu
nds
% o
f ava
il-ab
le f
unds
sp
ent b
y m
unic
ipal
ity
Div
ision
of
Reve
nue
Act
Actu
al
Tran
sfer
R
’000
R
’000
R
’000
R
’000
R
’000
R
’000
R
’000
R
’000
R
’000
R
’000
%
R
’000
R
’000
Mar
ulen
g
1,90
0
-
-
1,90
0
1,90
0
-
-
1,90
0
1,52
9
371
80%
1,90
0
1,90
0
Mas
ilony
ana
1,97
0
-
-
1,97
0
1,97
0
-
-
1,97
0
400
1,57
0 20
%
1,90
0
1,90
0
Mat
atie
le
1,70
0
-
-
1,70
0
1,70
0
-
-
1,70
0
880
820
52%
1,70
0
1,70
0
Mat
jhab
eng
2,21
5
-
-
2,21
5
2,21
5
-
-
2,21
5
2,21
5
- 10
0%
2,14
5
2,14
5
Mat
zika
ma
1,55
0
-
-
1,55
0
1,55
0
-
-
1,55
0
1,02
9
521
66%
1,55
0
1,55
0
Mbh
ashe
1,77
0
-
-
1,77
0
1,77
0
-
-
1,77
0
1,61
3
157
91%
1,70
0
1,70
0
Mbi
zana
2,21
5
-
-
2,21
5
2,21
5
-
-
2,21
5
1,28
7
928
58%
2,14
5
2,14
5
Mer
afon
g Ci
ty
1,70
0
-
-
1,70
0
1,70
0
-
-
1,70
0
538
1,16
2 32
%
1,70
0
1,70
0
Met
simah
olo
1,77
0
-
-
1,77
0
1,77
0
-
-
1,77
0
1,07
7
693
61%
1,70
0
1,70
0
Mhl
ontlo
2,41
5
-
-
2,41
5
2,41
5
-
-
2,41
5
874
1,54
1 36
%
2,34
5
2,34
5
Mid
vaal
1,55
0
-
-
1,55
0
1,55
0
-
-
1,55
0
882
668
57%
1,55
0
1,55
0
Mkh
amba
thin
i
1,97
0
-
-
1,97
0
1,97
0
-
-
1,97
0
1,49
2
478
76%
1,90
0
1,90
0
Mkh
ondo
2,21
5
-
-
2,21
5
2,21
5
-
-
2,21
5
1,19
3
1,02
2 54
%
2,14
5
2,14
5
Mnq
uma
1,70
0
-
-
1,70
0
1,70
0
-
-
1,70
0
1,61
0
90
95%
1,70
0
1,70
0
STAT
EMEN
T O
F CO
ND
ITIO
NA
L G
RAN
TS A
ND
OTH
ER T
RAN
SFER
S PA
ID T
O M
UN
ICIP
ALI
TIES
- co
ntin
ued

403
PART E: FINANCIAL INFORMATION - Continuedfor the year ended 31 March 2019
ANNEXURES TO THE ANNUAL FINANCIAL STATEMENT
NA
ME
OF
MU
NIC
IPA
LITY
GRA
NT
ALL
OCA
TIO
NTR
AN
SFER
SPEN
T20
17/1
8D
oRA
an
d ot
her
tran
sfer
s
Roll
Ove
rsAd
just
-m
ents
Tota
l Av
aila
ble
Actu
al
Tran
sfer
Fund
s W
ithhe
ldRe
-allo
ca-
tions
by
Nat
iona
l Tr
easu
ry o
r N
atio
nal
Dep
artm
ent
Amou
nt
rece
ived
by
Mun
ici-
palit
y
Amou
nt
spen
t by
mun
icip
ality
Uns
pent
fu
nds
% o
f ava
il-ab
le f
unds
sp
ent b
y m
unic
ipal
ity
Div
ision
of
Reve
nue
Act
Actu
al
Tran
sfer
R
’000
R
’000
R
’000
R
’000
R
’000
R
’000
R
’000
R
’000
R
’000
R
’000
%
R
’000
R
’000
Mog
alak
wen
a
1,77
0
-
-
1,77
0
1,77
0
-
-
1,77
0
1,21
1
559
68%
1,70
0
1,70
0
Mog
ale
City
1,55
0
-
-
1,55
0
1,55
0
-
-
1,55
0
583
967
38%
1,55
0
1,55
0
Moh
okar
e
1,97
0
-
-
1,97
0
1,97
0
-
-
1,97
0
439
1,53
1 22
%
1,90
0
1,90
0
Mol
emol
e
2,40
3
-
-
2,40
3
2,40
3
-
-
2,40
3
512
1,89
1 21
%
2,33
3
2,33
3
Mop
ani D
istric
t
Mun
icip
ality
1,86
5
-
-
1,86
5
1,86
5
-
-
1,86
5
848
1,01
7 45
%
1,79
5
1,79
5
Moq
haka
2,21
5
-
-
2,21
5
2,21
5
-
-
2,21
5
515
1,70
0 23
%
2,14
5
2,14
5
Mor
etel
e
2,21
5
-
-
2,21
5
2,21
5
-
-
2,21
5
475
1,74
0 21
%
2,14
5
2,14
5
Mos
es K
otan
e
1,70
0
-
-
1,70
0
1,70
0
-
-
1,70
0
1,41
7
283
83%
1,70
0
1,70
0
Mos
sel B
ay
1,55
0
-
-
1,55
0
1,55
0
-
-
1,55
0
400
1,15
0 26
%
1,55
0
1,55
0
Mpo
fana
1,97
0
-
-
1,97
0
1,97
0
-
-
1,97
0
455
1,51
5 23
%
1,90
0
1,90
0
Msu
kalig
wa
2,21
5
-
-
2,21
5
2,21
5
-
-
2,21
5
945
1,27
0 43
%
2,14
5
2,14
5
Msu
nduz
i
1,70
0
-
-
1,70
0
1,70
0
-
-
1,70
0
1,05
0
650
62%
1,70
0
1,70
0
Mth
onja
neni
2,85
0
-
-
2,85
0
2,85
0
-
-
2,85
0
2,51
4
336
88%
2,85
0
2,85
0
STAT
EMEN
T O
F CO
ND
ITIO
NA
L G
RAN
TS A
ND
OTH
ER T
RAN
SFER
S PA
ID T
O M
UN
ICIP
ALI
TIES
- co
ntin
ued

404
PART E: FINANCIAL INFORMATION - Continuedfor the year ended 31 March 2019
ANNEXURES TO THE ANNUAL FINANCIAL STATEMENT
NA
ME
OF
MU
NIC
IPA
LITY
GRA
NT
ALL
OCA
TIO
NTR
AN
SFER
SPEN
T20
17/1
8D
oRA
an
d ot
her
tran
sfer
s
Roll
Ove
rsAd
just
-m
ents
Tota
l Av
aila
ble
Actu
al
Tran
sfer
Fund
s W
ithhe
ldRe
-allo
ca-
tions
by
Nat
iona
l Tr
easu
ry o
r N
atio
nal
Dep
artm
ent
Amou
nt
rece
ived
by
Mun
ici-
palit
y
Amou
nt
spen
t by
mun
icip
ality
Uns
pent
fu
nds
% o
f ava
il-ab
le f
unds
sp
ent b
y m
unic
ipal
ity
Div
ision
of
Reve
nue
Act
Actu
al
Tran
sfer
R
’000
R
’000
R
’000
R
’000
R
’000
R
’000
R
’000
R
’000
R
’000
R
’000
%
R
’000
R
’000
Mtu
batu
ba
1,97
0
-
-
1,97
0
1,97
0
-
-
1,97
0
1,17
5
795
60%
1,90
0
1,90
0
Mus
ina
1,90
0
-
-
1,90
0
1,90
0
-
-
1,90
0
1,01
8
882
54%
1,90
0
1,90
0
Nal
a
2,41
5
-
-
2,41
5
2,41
5
-
-
2,41
5
1,07
6
1,33
9 45
%
2,34
5
2,34
5
Nal
edi
1,77
0
-
-
1,77
0
1,77
0
-
-
1,77
0
1,61
0
160
91%
1,70
0
1,70
0
Nam
a Kh
oi
2,21
5
-
-
2,21
5
2,21
5
-
-
2,21
5
1,39
2
823
63%
2,14
5
2,14
5
Nam
akw
a D
istric
t
Mun
icip
ality
1,32
0
-
-
1,32
0
1,32
0
-
-
1,32
0
910
410
69%
1,25
0
1,25
0
Ndl
ambe
1,97
0
-
-
1,97
0
1,97
0
-
-
1,97
0
1,44
8
522
74%
1,90
0
1,90
0
Ndw
edw
e
1,97
0
-
-
1,97
0
1,97
0
-
-
1,97
0
377
1,59
3 19
%
1,90
0
1,90
0
Nel
son
Man
dela
Bay
1,00
0
-
-
1,00
0
1,00
0
-
-
1,00
0
531
469
53%
1,05
0
1,05
0
New
cast
le
1,70
0
-
-
1,70
0
1,70
0
-
-
1,70
0
829
871
49%
1,70
0
1,70
0
Nga
ka M
odiri
Mol
ema
Dist
rict
Mun
icip
ality
1,86
5
-
-
1,86
5
1,86
5
-
-
1,86
5
924
941
50%
1,79
5
1,79
5
Ngq
ushw
a
2,41
5
-
-
2,41
5
2,41
5
-
-
2,41
5
931
1,48
4 39
%
2,34
5
2,34
5
Ngq
uza
Hill
1,70
0
-
-
1,70
0
1,70
0
-
-
1,70
0
1,21
7
483
72%
1,70
0
1,70
0
STAT
EMEN
T O
F CO
ND
ITIO
NA
L G
RAN
TS A
ND
OTH
ER T
RAN
SFER
S PA
ID T
O M
UN
ICIP
ALI
TIES
- co
ntin
ued

405
PART E: FINANCIAL INFORMATION - Continuedfor the year ended 31 March 2019
ANNEXURES TO THE ANNUAL FINANCIAL STATEMENT
NA
ME
OF
MU
NIC
IPA
LITY
GRA
NT
ALL
OCA
TIO
NTR
AN
SFER
SPEN
T20
17/1
8D
oRA
an
d ot
her
tran
sfer
s
Roll
Ove
rsAd
just
-m
ents
Tota
l Av
aila
ble
Actu
al
Tran
sfer
Fund
s W
ithhe
ldRe
-allo
ca-
tions
by
Nat
iona
l Tr
easu
ry o
r N
atio
nal
Dep
artm
ent
Amou
nt
rece
ived
by
Mun
ici-
palit
y
Amou
nt
spen
t by
mun
icip
ality
Uns
pent
fu
nds
% o
f ava
il-ab
le f
unds
sp
ent b
y m
unic
ipal
ity
Div
ision
of
Reve
nue
Act
Actu
al
Tran
sfer
R
’000
R
’000
R
’000
R
’000
R
’000
R
’000
R
’000
R
’000
R
’000
R
’000
%
R
’000
R
’000
Ngw
athe
2,21
5
-
-
2,21
5
2,21
5
-
-
2,21
5
-
2,21
5 0%
2,14
5
2,14
5
Nka
ndla
1,97
0
-
-
1,97
0
1,97
0
-
-
1,97
0
1,49
5
475
76%
1,90
0
1,90
0
Nka
ngal
a D
istric
t
Mun
icip
ality
1,00
0
-
-
1,00
0
1,00
0
-
-
1,00
0
1,00
0
- 10
0%
1,25
0
1,25
0
Nke
toan
a
1,77
0
-
-
1,77
0
1,77
0
-
-
1,77
0
1,11
5
655
63%
1,70
0
1,70
0
Nko
maz
i
1,77
0
-
-
1,77
0
1,77
0
-
-
1,77
0
1,05
2
718
59%
1,70
0
1,70
0
Non
gom
a
1,97
0
-
-
1,97
0
1,97
0
-
-
1,97
0
1,76
6
204
90%
1,90
0
1,90
0
Nqu
thu
1,90
0
-
-
1,90
0
1,90
0
-
-
1,90
0
1,58
8
312
84%
1,90
0
1,90
0
Nta
bank
ulu
1,97
0
-
-
1,97
0
1,97
0
-
-
1,97
0
1,46
3
507
74%
1,90
0
1,90
0
Nya
nden
i
1,70
0
-
-
1,70
0
1,70
0
-
-
1,70
0
1,62
1
79
95%
1,70
0
1,70
0
O.R
. Tam
bo D
istric
t
Mun
icip
ality
2,11
5
-
-
2,11
5
2,11
5
-
-
2,11
5
1,16
4
951
55%
2,04
5
2,04
5
Okh
ahla
mba
1,90
0
-
-
1,90
0
1,90
0
-
-
1,90
0
1,09
5
805
58%
1,90
0
1,90
0
Oud
tsho
orn
1,62
0
-
-
1,62
0
1,62
0
-
-
1,62
0
896
724
55%
1,55
0
1,55
0
Ove
rber
g D
istric
t
Mun
icip
ality
1,00
0
-
-
1,00
0
1,00
0
-
-
1,00
0
606
394
61%
1,25
0
1,25
0
STAT
EMEN
T O
F CO
ND
ITIO
NA
L G
RAN
TS A
ND
OTH
ER T
RAN
SFER
S PA
ID T
O M
UN
ICIP
ALI
TIES
- co
ntin
ued

406
PART E: FINANCIAL INFORMATION - Continuedfor the year ended 31 March 2019
ANNEXURES TO THE ANNUAL FINANCIAL STATEMENT
NA
ME
OF
MU
NIC
IPA
LITY
GRA
NT
ALL
OCA
TIO
NTR
AN
SFER
SPEN
T20
17/1
8D
oRA
an
d ot
her
tran
sfer
s
Roll
Ove
rsAd
just
-m
ents
Tota
l Av
aila
ble
Actu
al
Tran
sfer
Fund
s W
ithhe
ldRe
-allo
ca-
tions
by
Nat
iona
l Tr
easu
ry o
r N
atio
nal
Dep
artm
ent
Amou
nt
rece
ived
by
Mun
ici-
palit
y
Amou
nt
spen
t by
mun
icip
ality
Uns
pent
fu
nds
% o
f ava
il-ab
le f
unds
sp
ent b
y m
unic
ipal
ity
Div
ision
of
Reve
nue
Act
Actu
al
Tran
sfer
R
’000
R
’000
R
’000
R
’000
R
’000
R
’000
R
’000
R
’000
R
’000
R
’000
%
R
’000
R
’000
Ove
rstra
nd
1,55
0
-
-
1,55
0
1,55
0
-
-
1,55
0
495
1,05
5 32
%
1,55
0
1,55
0
Phok
wan
e
2,21
5
-
-
2,21
5
2,21
5
-
-
2,21
5
289
1,92
6 13
%
2,14
5
2,14
5
Phum
elel
a
2,41
5
-
-
2,41
5
2,41
5
-
-
2,41
5
1,60
1
814
66%
2,34
5
2,34
5
Pixl
ey K
a
Sem
e D
istric
t
Mun
icip
ality
1,32
0
-
-
1,32
0
1,32
0
-
-
1,32
0
893
427
68%
1,25
0
1,25
0
Polo
kwan
e
3,04
8
-
-
3,04
8
3,04
8
-
-
3,04
8
1,85
6
1,19
2 61
%
2,97
9
2,97
9
Port
St J
ohns
1,97
0
-
-
1,97
0
1,97
0
-
-
1,97
0
916
1,05
4 46
%
1,90
0
1,90
0
Prin
ce A
lber
t
1,70
0
-
-
1,70
0
1,70
0
-
-
1,70
0
1,32
7
373
78%
1,70
0
1,70
0
Ram
otsh
ere
Moi
loa
2,21
5
-
-
2,21
5
2,21
5
-
-
2,21
5
837
1,37
8 38
%
2,14
5
2,14
5
Rand
Wes
t City
3,17
0
-
-
3,17
0
3,17
0
-
-
3,17
0
1,44
3
1,72
7 46
%
3,10
0
3,10
0
Ratlo
u
1,94
0
-
-
1,94
0
1,94
0
-
-
1,94
0
1,74
3
197
90%
1,90
0
1,90
0
Ray
Nko
nyen
i
3,60
0
-
-
3,60
0
3,60
0
-
-
3,60
0
1,82
0
1,78
0 51
%
3,60
0
3,60
0
Raym
ond
Mhl
aba
3,87
0
-
-
3,87
0
3,87
0
-
-
3,87
0
1,18
8
2,68
2 31
%
3,80
0
3,80
0
Reno
ster
berg
2,41
5
-
-
2,41
5
2,41
5
-
-
2,41
5
1,55
1
864
64%
2,34
5
2,34
5
STAT
EMEN
T O
F CO
ND
ITIO
NA
L G
RAN
TS A
ND
OTH
ER T
RAN
SFER
S PA
ID T
O M
UN
ICIP
ALI
TIES
- co
ntin
ued

407
PART E: FINANCIAL INFORMATION - Continuedfor the year ended 31 March 2019
ANNEXURES TO THE ANNUAL FINANCIAL STATEMENT
NA
ME
OF
MU
NIC
IPA
LITY
GRA
NT
ALL
OCA
TIO
NTR
AN
SFER
SPEN
T20
17/1
8D
oRA
an
d ot
her
tran
sfer
s
Roll
Ove
rsAd
just
-m
ents
Tota
l Av
aila
ble
Actu
al
Tran
sfer
Fund
s W
ithhe
ldRe
-allo
ca-
tions
by
Nat
iona
l Tr
easu
ry o
r N
atio
nal
Dep
artm
ent
Amou
nt
rece
ived
by
Mun
ici-
palit
y
Amou
nt
spen
t by
mun
icip
ality
Uns
pent
fu
nds
% o
f ava
il-ab
le f
unds
sp
ent b
y m
unic
ipal
ity
Div
ision
of
Reve
nue
Act
Actu
al
Tran
sfer
R
’000
R
’000
R
’000
R
’000
R
’000
R
’000
R
’000
R
’000
R
’000
R
’000
%
R
’000
R
’000
Rich
mon
d
1,90
0
-
-
1,90
0
1,90
0
-
-
1,90
0
287
1,61
3 15
%
1,90
0
1,90
0
Rich
ters
veld
1,97
0
-
-
1,97
0
1,97
0
-
-
1,97
0
1,18
0
790
60%
1,90
0
1,90
0
Rust
enbu
rg
1,70
0
-
-
1,70
0
1,70
0
-
-
1,70
0
593
1,10
7 35
%
1,70
0
1,70
0
Sakh
isizw
e
1,70
0
-
-
1,70
0
1,70
0
-
-
1,70
0
643
1,05
7 38
%
1,70
0
1,70
0
Sald
anha
Bay
1,55
0
-
-
1,55
0
1,55
0
-
-
1,55
0
646
904
42%
1,55
0
1,55
0
Sara
h Ba
artm
an
Dist
rict
Mun
icip
ality
1,00
0
-
-
1,00
0
1,00
0
-
-
1,00
0
915
85
92%
1,25
0
1,25
0
Sedi
beng
Dist
rict
Mun
icip
ality
1,25
0
-
-
1,25
0
1,25
0
-
-
1,25
0
763
487
61%
1,25
0
1,25
0
Sekh
ukhu
ne
Dist
rict
Mun
icip
ality
1,32
0
-
-
1,32
0
1,32
0
-
-
1,32
0
515
805
39%
1,25
0
1,25
0
Senq
u
1,70
0
-
-
1,70
0
1,70
0
-
-
1,70
0
1,29
0
410
76%
1,70
0
1,70
0
Sets
oto
1,70
0
-
-
1,70
0
1,70
0
-
-
1,70
0
989
711
58%
1,70
0
1,70
0
Siya
ncum
a
2,41
5
-
-
2,41
5
2,41
5
-
-
2,41
5
1,69
6
719
70%
2,34
5
2,34
5
Siya
them
ba
2,41
5
-
-
2,41
5
2,41
5
-
-
2,41
5
1,52
3
892
63%
2,34
5
2,34
5
Sol P
laat
jie
1,70
0
-
-
1,70
0
1,70
0
-
-
1,70
0
388
1,31
2 23
%
1,70
0
1,70
0
STAT
EMEN
T O
F CO
ND
ITIO
NA
L G
RAN
TS A
ND
OTH
ER T
RAN
SFER
S PA
ID T
O M
UN
ICIP
ALI
TIES
- co
ntin
ued

408
PART E: FINANCIAL INFORMATION - Continuedfor the year ended 31 March 2019
ANNEXURES TO THE ANNUAL FINANCIAL STATEMENT
NA
ME
OF
MU
NIC
IPA
LITY
GRA
NT
ALL
OCA
TIO
NTR
AN
SFER
SPEN
T20
17/1
8D
oRA
an
d ot
her
tran
sfer
s
Roll
Ove
rsAd
just
-m
ents
Tota
l Av
aila
ble
Actu
al
Tran
sfer
Fund
s W
ithhe
ldRe
-allo
ca-
tions
by
Nat
iona
l Tr
easu
ry o
r N
atio
nal
Dep
artm
ent
Amou
nt
rece
ived
by
Mun
ici-
palit
y
Amou
nt
spen
t by
mun
icip
ality
Uns
pent
fu
nds
% o
f ava
il-ab
le f
unds
sp
ent b
y m
unic
ipal
ity
Div
ision
of
Reve
nue
Act
Actu
al
Tran
sfer
R
’000
R
’000
R
’000
R
’000
R
’000
R
’000
R
’000
R
’000
R
’000
R
’000
%
R
’000
R
’000
Stel
lenb
osch
1,55
0
-
-
1,55
0
1,55
0
-
-
1,55
0
274
1,27
6 18
%
1,55
0
1,55
0
Stev
e Ts
hwet
e
1,70
0
-
-
1,70
0
1,70
0
-
-
1,70
0
1,24
2
458
73%
1,70
0
1,70
0
Sund
ays R
iver
Valle
y
2,41
5
-
-
2,41
5
2,41
5
-
-
2,41
5
2,13
9
276
89%
2,34
5
2,34
5
Swar
tland
1,55
0
-
-
1,55
0
1,55
0
-
-
1,55
0
566
984
37%
1,55
0
1,55
0
Swel
lend
am
1,77
0
-
-
1,77
0
1,77
0
-
-
1,77
0
998
772
56%
1,70
0
1,70
0
Thab
a Ch
weu
2,21
5
-
-
2,21
5
2,21
5
-
-
2,21
5
1,58
4
631
72%
2,14
5
2,14
5
Thab
azim
bi
2,21
5
-
-
2,21
5
2,21
5
-
-
2,21
5
2,21
5
- 10
0%
2,14
5
2,14
5
Thab
o
Mof
utsa
nyan
a
Dist
rict
Mun
icip
ality
1,32
0
-
-
1,32
0
1,32
0
-
-
1,32
0
657
663
50%
1,25
0
1,25
0
Thee
wat
ersk
loof
1,70
0
-
-
1,70
0
1,70
0
-
-
1,70
0
1,08
4
616
64%
1,70
0
1,70
0
Them
belih
le
2,41
5
-
-
2,41
5
2,41
5
-
-
2,41
5
1,22
6
1,18
9 51
%
2,34
5
2,34
5
Them
bisil
e H
ani
1,77
0
-
-
1,77
0
1,77
0
-
-
1,77
0
1,10
0
670
62%
1,70
0
1,70
0
Thul
amel
a
1,70
0
-
-
1,70
0
1,70
0
-
-
1,70
0
929
771
55%
1,70
0
1,70
0
Toko
logo
1,97
0
-
-
1,97
0
1,97
0
-
-
1,97
0
1,82
7
143
93%
1,90
0
1,90
0
STAT
EMEN
T O
F CO
ND
ITIO
NA
L G
RAN
TS A
ND
OTH
ER T
RAN
SFER
S PA
ID T
O M
UN
ICIP
ALI
TIES
- co
ntin
ued

409
PART E: FINANCIAL INFORMATION - Continuedfor the year ended 31 March 2019
ANNEXURES TO THE ANNUAL FINANCIAL STATEMENT
NA
ME
OF
MU
NIC
IPA
LITY
GRA
NT
ALL
OCA
TIO
NTR
AN
SFER
SPEN
T20
17/1
8D
oRA
an
d ot
her
tran
sfer
s
Roll
Ove
rsAd
just
-m
ents
Tota
l Av
aila
ble
Actu
al
Tran
sfer
Fund
s W
ithhe
ldRe
-allo
ca-
tions
by
Nat
iona
l Tr
easu
ry o
r N
atio
nal
Dep
artm
ent
Amou
nt
rece
ived
by
Mun
ici-
palit
y
Amou
nt
spen
t by
mun
icip
ality
Uns
pent
fu
nds
% o
f ava
il-ab
le f
unds
sp
ent b
y m
unic
ipal
ity
Div
ision
of
Reve
nue
Act
Actu
al
Tran
sfer
R
’000
R
’000
R
’000
R
’000
R
’000
R
’000
R
’000
R
’000
R
’000
R
’000
%
R
’000
R
’000
Tsan
tsab
ane
2,41
5
-
-
2,41
5
2,41
5
-
-
2,41
5
1,39
0
1,02
5 58
%
2,34
5
2,34
5
Tsw
aing
2,41
5
-
-
2,41
5
2,41
5
-
-
2,41
5
196
2,21
9 8%
2,34
5
2,34
5
Tsw
elop
ele
1,97
0
-
-
1,97
0
1,97
0
-
-
1,97
0
450
1,52
0 23
%
1,90
0
1,90
0
uBuh
lebe
zwe
1,97
0
-
-
1,97
0
1,97
0
-
-
1,97
0
1,32
2
648
67%
1,90
0
1,90
0
Ubu
ntu
1,97
0
-
-
1,97
0
1,97
0
-
-
1,97
0
1,97
0
- 10
0%
1,90
0
1,90
0
Ugu
Dist
rict
Mun
icip
ality
1,86
5
-
-
1,86
5
1,86
5
-
-
1,86
5
94
1,77
1 5%
1,79
5
1,79
5
Ulu
ndi
1,87
0
-
-
1,87
0
1,87
0
-
-
1,87
0
410
1,46
0 22
%
1,80
0
1,80
0
uMdo
ni
4,31
5
-
-
4,31
5
4,31
5
-
-
4,31
5
2,44
3
1,87
2 57
%
4,24
5
4,24
5
uMfo
lozi
1,90
0
-
-
1,90
0
1,90
0
-
-
1,90
0
1,55
9
341
82%
1,90
0
1,90
0
uMgu
ngun
dlov
u
Dist
rict
Mun
icip
ality
1,00
0
-
-
1,00
0
1,00
0
-
-
1,00
0
1,00
0
- 10
0%
1,25
0
1,25
0
uMhl
abuy
alin
gana
1,90
0
-
-
1,90
0
1,90
0
-
-
1,90
0
790
1,11
0 42
%
1,90
0
1,90
0
uMhl
athu
ze
2,65
0
-
-
2,65
0
2,65
0
-
-
2,65
0
1,20
8
1,44
2 46
%
2,65
0
2,65
0
uMkh
anya
kude
Dist
rict
Mun
icip
ality
1,00
0
-
-
1,00
0
1,00
0
-
-
1,00
0
673
327
67%
1,25
0
1,25
0
STAT
EMEN
T O
F CO
ND
ITIO
NA
L G
RAN
TS A
ND
OTH
ER T
RAN
SFER
S PA
ID T
O M
UN
ICIP
ALI
TIES
- co
ntin
ued

410
PART E: FINANCIAL INFORMATION - Continuedfor the year ended 31 March 2019
ANNEXURES TO THE ANNUAL FINANCIAL STATEMENT
NA
ME
OF
MU
NIC
IPA
LITY
GRA
NT
ALL
OCA
TIO
NTR
AN
SFER
SPEN
T20
17/1
8D
oRA
an
d ot
her
tran
sfer
s
Roll
Ove
rsAd
just
-m
ents
Tota
l Av
aila
ble
Actu
al
Tran
sfer
Fund
s W
ithhe
ldRe
-allo
ca-
tions
by
Nat
iona
l Tr
easu
ry o
r N
atio
nal
Dep
artm
ent
Amou
nt
rece
ived
by
Mun
ici-
palit
y
Amou
nt
spen
t by
mun
icip
ality
Uns
pent
fu
nds
% o
f ava
il-ab
le f
unds
sp
ent b
y m
unic
ipal
ity
Div
ision
of
Reve
nue
Act
Actu
al
Tran
sfer
R
’000
R
’000
R
’000
R
’000
R
’000
R
’000
R
’000
R
’000
R
’000
R
’000
%
R
’000
R
’000
uMla
lazi
1,77
0
-
-
1,77
0
1,77
0
-
-
1,77
0
1,43
7
333
81%
1,70
0
1,70
0
uMng
eni
1,77
0
-
-
1,77
0
1,77
0
-
-
1,77
0
823
947
46%
1,70
0
1,70
0
uMsh
wat
hi
1,97
0
-
-
1,97
0
1,97
0
-
-
1,97
0
620
1,35
0 31
%
1,90
0
1,90
0
uMsin
ga
1,90
0
-
-
1,90
0
1,90
0
-
-
1,90
0
1,54
0
360
81%
1,90
0
1,90
0
Um
sobo
mvu
1,97
0
-
-
1,97
0
1,97
0
-
-
1,97
0
1,45
0
520
74%
1,90
0
1,90
0
uMuz
iwab
antu
1,90
0
-
-
1,90
0
1,90
0
-
-
1,90
0
1,55
0
350
82%
1,90
0
1,90
0
uMvo
ti
1,87
0
-
-
1,87
0
1,87
0
-
-
1,87
0
881
989
47%
1,80
0
1,80
0
uMzi
mkh
ulu
1,90
0
-
-
1,90
0
1,90
0
-
-
1,90
0
1,42
2
478
75%
1,90
0
1,90
0
Um
zim
vubu
1,77
0
-
-
1,77
0
1,77
0
-
-
1,77
0
1,72
3
47
97%
1,70
0
1,70
0
uMzi
nyat
hi D
istric
t
Mun
icip
ality
1,32
0
-
-
1,32
0
1,32
0
-
-
1,32
0
295
1,02
5 22
%
1,25
0
1,25
0
uMzu
mbe
1,90
0
-
-
1,90
0
1,90
0
-
-
1,90
0
1,52
9
371
80%
1,90
0
1,90
0
uPho
ngol
o
1,97
0
-
-
1,97
0
1,97
0
-
-
1,97
0
431
1,53
9 22
%
1,90
0
1,90
0
uThu
kela
Dist
rict
Mun
icip
ality
1,54
5
-
-
1,54
5
1,54
5
-
-
1,54
5
1,26
4
281
82%
1,79
5
1,79
5
Vent
ersd
orp/
Tlok
we
4,11
5
-
-
4,11
5
4,11
5
-
-
4,11
5
3,24
1
874
79%
4,04
5
4,04
5
STAT
EMEN
T O
F CO
ND
ITIO
NA
L G
RAN
TS A
ND
OTH
ER T
RAN
SFER
S PA
ID T
O M
UN
ICIP
ALI
TIES
- co
ntin
ued

411
PART E: FINANCIAL INFORMATION - Continuedfor the year ended 31 March 2019
ANNEXURES TO THE ANNUAL FINANCIAL STATEMENT
NA
ME
OF
MU
NIC
IPA
LITY
GRA
NT
ALL
OCA
TIO
NTR
AN
SFER
SPEN
T20
17/1
8D
oRA
an
d ot
her
tran
sfer
s
Roll
Ove
rsAd
just
-m
ents
Tota
l Av
aila
ble
Actu
al
Tran
sfer
Fund
s W
ithhe
ldRe
-allo
ca-
tions
by
Nat
iona
l Tr
easu
ry o
r N
atio
nal
Dep
artm
ent
Amou
nt
rece
ived
by
Mun
ici-
palit
y
Amou
nt
spen
t by
mun
icip
ality
Uns
pent
fu
nds
% o
f ava
il-ab
le f
unds
sp
ent b
y m
unic
ipal
ity
Div
ision
of
Reve
nue
Act
Actu
al
Tran
sfer
R
’000
R
’000
R
’000
R
’000
R
’000
R
’000
R
’000
R
’000
R
’000
R
’000
%
R
’000
R
’000
Vhem
be D
istric
t
Mun
icip
ality
1,86
5
-
-
1,86
5
1,86
5
-
-
1,86
5
17
1,84
8 1%
1,79
5
1,79
5
Vict
or K
hany
e
1,77
0
-
-
1,77
0
1,77
0
-
-
1,77
0
285
1,48
5 16
%
1,70
0
1,70
0
Wal
ter S
isulu
4,31
5
-
-
4,31
5
4,31
5
-
-
4,31
5
2,95
0
1,36
5 68
%
4,24
5
4,24
5
Wat
erbe
rg D
istric
t
Mun
icip
ality
1,00
0
-
-
1,00
0
1,00
0
-
-
1,00
0
531
469
53%
1,25
0
1,25
0
Wes
t Coa
st D
istric
t
Mun
icip
ality
1,00
0
-
-
1,00
0
1,00
0
-
-
1,00
0
666
334
67%
1,25
0
1,25
0
Wes
t Ran
d D
istric
t
Mun
icip
ality
1,00
0
-
-
1,00
0
1,00
0
-
-
1,00
0
501
499
50%
1,25
0
1,25
0
Witz
enbe
rg
1,55
0
-
-
1,55
0
1,55
0
-
-
1,55
0
717
833
46%
1,55
0
1,55
0
Xhar
iep
Dist
rict
Mun
icip
ality
1,32
0
-
-
1,32
0
1,32
0
-
-
1,32
0
342
978
26%
1,25
0
1,25
0
Z.F.
Mgc
awu
Dist
rict
Mun
icip
ality
1,00
0
-
-
1,00
0
1,00
0
-
-
1,00
0
575
425
58%
1,25
0
1,25
0
Zulu
land
Dist
rict
Mun
icip
ality
1,00
0
-
-
1,00
0
1,00
0
-
-
1,00
0
811
189
81%
1,25
0
1,25
0
TOTA
L
50
4,56
6
-
-
504
,566
50
4,56
6
-
-
50
4,56
6
285
,829
218,
737
57%
502,
006
502
,006
STAT
EMEN
T O
F CO
ND
ITIO
NA
L G
RAN
TS A
ND
OTH
ER T
RAN
SFER
S PA
ID T
O M
UN
ICIP
ALI
TIES
- co
ntin
ued

412
PART E: FINANCIAL INFORMATION - Continuedfor the year ended 31 March 2019
ANNEXURES TO THE ANNUAL FINANCIAL STATEMENT
NA
ME
OF
MU
NIC
IPA
LITY
GRA
NT
ALL
OCA
TIO
NTR
AN
SFER
SPEN
T20
17/1
8D
oRA
an
d ot
her
tran
sfer
s
Roll
Ove
rsAd
just
-m
ents
Tota
l Av
aila
ble
Actu
al
Tran
sfer
Fund
s W
ithhe
ldRe
-allo
ca-
tions
by
Nat
iona
l Tr
easu
ry o
r N
atio
nal
Dep
artm
ent
Amou
nt
rece
ived
by
Mun
ici-
palit
y
Amou
nt
spen
t by
mun
icip
ality
Uns
pent
fu
nds
% o
f ava
il-ab
le f
unds
sp
ent b
y m
unic
ipal
ity
Div
ision
of
Reve
nue
Act
Actu
al
Tran
sfer
R
’000
R
’000
R
’000
R
’000
R
’000
R
’000
R
’000
R
’000
R
’000
R
’000
%
R
’000
R
’000
INFR
ASTR
UCT
URE
SKI
LLS
DEV
ELO
PMEN
T G
RAN
T
Buffa
lo C
ity
10,8
00
-
-
10,8
00
10,8
00
-
-
10,8
00
7,36
7
3,43
3 68
%
10,
560
10,5
60
Nel
son
Man
dela
Bay
11,8
34
-
-
11,8
34
11,8
34
-
-
11,8
34
8,71
5
3,11
9 74
%
15,
394
15,3
94
Enoc
h M
gijim
a
-
-
-
-
-
-
-
-
-
1,80
0
-
King
Sab
ata
Dal
indy
ebo
6,00
0
-
-
6,00
0
6,00
0
-
-
6,00
0
5,26
9
731
88%
5,33
4
5,33
4
Alfre
d N
zo
5,40
0
-
-
5,40
0
5,40
0
-
-
5,40
0
3,82
3
1,57
7 71
%
5,39
4
5,39
4
City
of
Joha
nnes
burg
7,20
0
-
-
7,20
0
7,20
0
-
-
7,20
0
6,56
9
631
91%
8,76
0
8,76
0
Rand
Wes
t Loc
al
Mun
icip
ality
-
-
-
-
-
-
-
-
-
2,10
0
-
eThe
kwin
i
30,5
00
-
2,70
0
3
3,20
0
33,2
00
-
-
33,2
00
29,7
95
3,40
5 90
%
27
,893
30,2
93
uMhl
athu
ze
5,00
0
-
5,00
0
2,30
0
2,70
0
-
2,30
0
3,05
3
(753
)13
3%
6,50
0
6,50
0
Aflre
d D
uma
1,80
0
-
-
1,80
0
1,80
0
-
-
1,80
0
272
1,52
8 15
%
-
-
Polo
kwan
e
6,50
0
-
-
6,50
0
6,50
0
-
-
6,50
0
3,54
0
2,96
0 54
%
6,21
3
7,21
3
Thul
amel
a
1,80
0
-
-
1,80
0
1,80
0
-
-
1,80
0
531
1,26
9 30
%
Gov
an M
beki
22,5
00
-
-
22,5
00
22,5
00
-
-
22,5
00
16,7
26
5,77
4 74
%
23,0
00
23,0
00
STAT
EMEN
T O
F CO
ND
ITIO
NA
L G
RAN
TS A
ND
OTH
ER T
RAN
SFER
S PA
ID T
O M
UN
ICIP
ALI
TIES
- co
ntin
ued

413
PART E: FINANCIAL INFORMATION - Continuedfor the year ended 31 March 2019
ANNEXURES TO THE ANNUAL FINANCIAL STATEMENT
NA
ME
OF
MU
NIC
IPA
LITY
GRA
NT
ALL
OCA
TIO
NTR
AN
SFER
SPEN
T20
17/1
8D
oRA
an
d ot
her
tran
sfer
s
Roll
Ove
rsAd
just
-m
ents
Tota
l Av
aila
ble
Actu
al
Tran
sfer
Fund
s W
ithhe
ldRe
-allo
ca-
tions
by
Nat
iona
l Tr
easu
ry o
r N
atio
nal
Dep
artm
ent
Amou
nt
rece
ived
by
Mun
ici-
palit
y
Amou
nt
spen
t by
mun
icip
ality
Uns
pent
fu
nds
% o
f ava
il-ab
le f
unds
sp
ent b
y m
unic
ipal
ity
Div
ision
of
Reve
nue
Act
Actu
al
Tran
sfer
R
’000
R
’000
R
’000
R
’000
R
’000
R
’000
R
’000
R
’000
R
’000
R
’000
%
R
’000
R
’000
Ger
t Sib
ande
5,55
3
-
-
5,55
3
5,55
3
-
-
5,55
3
4,66
8
885
84%
5,50
0
5,50
0
Sol P
laat
jie
3,80
0
3,14
1
-
6,94
1
3,80
0
-
-
3,80
0
2,03
7
1,76
3 54
%
4,63
3
4,63
3
John
Taol
o
Gae
tsew
e D
istric
t
Mun
icip
ality
3,20
0
-
-
3,20
0
3,20
0
-
-
3,20
0
1,96
9
1,23
1 62
%
3,20
0
3,20
0
City
of C
ape
Tow
n
13,6
05
-
-
13,6
05
13,6
05
-
-
13,6
05
6,24
5
7,36
0 46
%
10,3
93
11,2
96
Geo
rge
6,00
0
-
-
6,00
0
6,00
0
-
-
6,00
0
3,46
8
2,53
2 58
%
4,10
0
4,60
0
Tota
l
14
1,49
2
3,
141
2,70
0
147,3
33
141,
492
2,70
0
-
14
1,49
2
10
4,04
7
37,4
45
74%
140,
774
14
1,67
7
NEI
GH
BOU
RHO
OD
DEV
ELO
PMEN
T PA
RTN
ERSH
IP G
RAN
D
Amat
hole
7,08
0
-
920
8,00
0
8,00
0
-
-
8,00
0
8,00
0
- 10
0%
15,0
80
8,00
0
Buffa
lo C
ity
13,2
50
-
-
13,2
50
6,00
0
-
-
6,00
0
6,00
0
- 45
%
10,0
00
-
City
of C
ape
Tow
n
Met
ropo
litan
-
-
7,30
0
7,30
0
7,30
0
-
-
7,30
0
7,30
0
- 10
0%
2,10
9
2,10
9
City
of
Joha
nnes
burg
Met
ropo
litan
40,1
20
-
39,8
80
80,0
00
80,0
00
-
-
80,0
00
80,0
00
- 10
0%
79,5
23
45,4
82
City
of M
atlo
sana
48,4
85
-
26,5
15
75,0
00
75,0
00
-
-
75,0
00
75,0
00
- 10
0%
75,0
00
48,7
55
STAT
EMEN
T O
F CO
ND
ITIO
NA
L G
RAN
TS A
ND
OTH
ER T
RAN
SFER
S PA
ID T
O M
UN
ICIP
ALI
TIES
- co
ntin
ued

414
PART E: FINANCIAL INFORMATION - Continuedfor the year ended 31 March 2019
ANNEXURES TO THE ANNUAL FINANCIAL STATEMENT
NA
ME
OF
MU
NIC
IPA
LITY
GRA
NT
ALL
OCA
TIO
NTR
AN
SFER
SPEN
T20
17/1
8D
oRA
an
d ot
her
tran
sfer
s
Roll
Ove
rsAd
just
-m
ents
Tota
l Av
aila
ble
Actu
al
Tran
sfer
Fund
s W
ithhe
ldRe
-allo
ca-
tions
by
Nat
iona
l Tr
easu
ry o
r N
atio
nal
Dep
artm
ent
Amou
nt
rece
ived
by
Mun
ici-
palit
y
Amou
nt
spen
t by
mun
icip
ality
Uns
pent
fu
nds
% o
f ava
il-ab
le f
unds
sp
ent b
y m
unic
ipal
ity
Div
ision
of
Reve
nue
Act
Actu
al
Tran
sfer
R
’000
R
’000
R
’000
R
’000
R
’000
R
’000
R
’000
R
’000
R
’000
R
’000
%
R
’000
R
’000
City
of T
shw
ane
Met
ropo
litan
7,10
5
-
-
7,10
5
3,60
5
-
-
3,60
5
3,60
5
- 51
%
20,0
00
20,0
00
Ekur
hule
ni
Met
ropo
litan
75,2
62
-
(15,
262)
60,0
00
60,0
00
-
-
60,0
00
60,0
00
- 10
0%
82,0
00
102,
574
Emal
ahle
ni/
Witb
ank
10,6
05
-
-
10,6
05
10,6
05
-
-
10,6
05
10,6
05
- 10
0%
25,0
00
9,50
0
Emfu
leni
37,8
49
-
(22,
925)
14,9
24
14,9
24
-
-
14,9
24
14,9
24
- 10
0%
30,0
00
9,47
4
eThe
kwin
i
Met
ropo
litan
25,2
20
-
-
25,2
20
25,2
20
-
-
25,2
20
25,2
20
- 10
0%
50,0
00
50,6
74
Knys
na
12,0
00
-
11,0
00
23,0
00
23,0
00
-
-
23,0
00
23,0
00
- 10
0%
10,0
00
8,90
9
Man
deni
10,6
67
-
-
10,6
67
10,6
67
-
-
10,6
67
10,6
67
- 10
0%
11,1
78
11,1
78
Man
gaun
g
13,0
00
-
-
13,0
00
13,0
00
-
-
13,0
00
13,0
00
- 10
0%
15,0
00
5,00
0
Mbo
mbe
la
33,5
35
-
-
33,5
35
33,5
35
-
-
33,5
35
33,5
35
- 10
0%
40,0
00
38,1
35
Mog
ale
City
18,6
30
-
56,7
31
75,3
61
75,3
61
-
-
75,3
61
75,3
61
- 10
0%
20,0
00
21,2
35
Msu
nduz
i
42,3
60
-
(27,
460)
14,9
00
14,9
00
-
-
14,9
00
14,9
00
- 10
0%
40,0
00
38,0
96
Nel
son
Man
dela
Bay
-
-
-
-
-
-
-
-
-
-
15,0
00
12,1
10
New
cast
le
-
-
2,00
0
2,00
0
-
-
- 0%
50,0
00
34,7
67
STAT
EMEN
T O
F CO
ND
ITIO
NA
L G
RAN
TS A
ND
OTH
ER T
RAN
SFER
S PA
ID T
O M
UN
ICIP
ALI
TIES
- co
ntin
ued

415
PART E: FINANCIAL INFORMATION - Continuedfor the year ended 31 March 2019
ANNEXURES TO THE ANNUAL FINANCIAL STATEMENT
NA
ME
OF
MU
NIC
IPA
LITY
GRA
NT
ALL
OCA
TIO
NTR
AN
SFER
SPEN
T20
17/1
8D
oRA
an
d ot
her
tran
sfer
s
Roll
Ove
rsAd
just
-m
ents
Tota
l Av
aila
ble
Actu
al
Tran
sfer
Fund
s W
ithhe
ldRe
-allo
ca-
tions
by
Nat
iona
l Tr
easu
ry o
r N
atio
nal
Dep
artm
ent
Amou
nt
rece
ived
by
Mun
ici-
palit
y
Amou
nt
spen
t by
mun
icip
ality
Uns
pent
fu
nds
% o
f ava
il-ab
le f
unds
sp
ent b
y m
unic
ipal
ity
Div
ision
of
Reve
nue
Act
Actu
al
Tran
sfer
R
’000
R
’000
R
’000
R
’000
R
’000
R
’000
R
’000
R
’000
R
’000
R
’000
%
R
’000
R
’000
Polo
kwan
e
35,0
00
-
10,0
00
45,0
00
45,0
00
-
-
45,0
00
45,0
00
- 10
0%
26,0
00
41,0
27
Rust
enbu
rg
-
-
5,00
0
5,00
0
5,00
0
-
-
5,00
0
5,00
0
- 10
0%
10,0
00
-
Sol P
laat
jie
171,
699
-
(113
,699)
58,0
00
58,0
00
-
-
58,0
00
58,0
00
- 10
0%
27,5
00
97,5
37
Wes
t Ran
d
-
-
-
-
-
-
10,0
00
53,2
77
Tota
l
60
1,86
7
-
(20,
000)
58
1,86
7
56
9,117
-
-
56
9,117
569,1
17
- 98
%
66
3,39
0
657,8
39
IND
IREC
T G
RAN
T
Indi
rect
Gra
nt
trans
fers
29,3
53
-
20,0
00
49,3
53
49,3
53
-
-
-
49,3
53
49,3
53
100%
27,7
44
27,7
44
Tota
l
29,3
53
-
20
,000
49,3
53
49,3
53
-
-
-
49,3
53
49
,353
10
0%
27
,744
27
,744
INTE
GRA
TED
CIT
IES
DEV
ELO
PMEN
T G
RAN
T
Buffa
lo
10,0
03
-
-
10,0
03
10,0
03
-
-
10,0
03
9,69
5
308
97%
6,95
6
6,95
6
Nel
son
Man
dela
Bay
12,3
55
-
-
12,3
55
12,3
55
-
-
12,3
55
814
11,5
41
7%
7,30
8
7,30
8
Man
gaun
g
7,20
7
-
-
7,20
7
7,20
7
-
-
7,20
7
2,50
7
4,70
0
35%
8,22
4
8,22
4
City
of
Joha
nnes
burg
63,5
36
-
-
63,5
36
63,5
36
-
-
63,5
36
10,8
46
52,6
90
17%
82,1
82
82,1
82
STAT
EMEN
T O
F CO
ND
ITIO
NA
L G
RAN
TS A
ND
OTH
ER T
RAN
SFER
S PA
ID T
O M
UN
ICIP
ALI
TIES
- co
ntin
ued

416
PART E: FINANCIAL INFORMATION - Continuedfor the year ended 31 March 2019
ANNEXURES TO THE ANNUAL FINANCIAL STATEMENT
NA
ME
OF
MU
NIC
IPA
LITY
GRA
NT
ALL
OCA
TIO
NTR
AN
SFER
SPEN
T20
17/1
8D
oRA
an
d ot
her
tran
sfer
s
Roll
Ove
rsAd
just
-m
ents
Tota
l Av
aila
ble
Actu
al
Tran
sfer
Fund
s W
ithhe
ldRe
-allo
ca-
tions
by
Nat
iona
l Tr
easu
ry o
r N
atio
nal
Dep
artm
ent
Amou
nt
rece
ived
by
Mun
ici-
palit
y
Amou
nt
spen
t by
mun
icip
ality
Uns
pent
fu
nds
% o
f ava
il-ab
le f
unds
sp
ent b
y m
unic
ipal
ity
Div
ision
of
Reve
nue
Act
Actu
al
Tran
sfer
R
’000
R
’000
R
’000
R
’000
R
’000
R
’000
R
’000
R
’000
R
’000
R
’000
%
R
’000
R
’000
City
Of T
shw
ane
45,0
13
-
-
45,0
13
45,0
13
-
-
45,0
13
21,8
65
23,1
48
49%
38,4
29
38,4
29
Ekur
hule
ni M
etro
45,5
37
-
-
45,5
37
45,5
37
-
-
45,5
37
44,6
79
858
98%
48,6
46
48,6
46
eThe
kwin
i
45,5
96
-
-
45,5
96
45,5
96
-
-
45,5
96
38,3
85
7,21
1
84%
39,1
11
39,1
11
Cape
Tow
n
64,3
62
-
-
64,3
62
64,3
62
-
-
64,3
62
30,4
64
33,8
98
47%
61,2
63
61,2
63
Tota
l 29
3,60
9-
- 29
3,60
929
3,60
9-
- 29
3,60
915
9,25
513
4,35
454
%29
2,11
929
2,11
9
Gra
nd To
tal
1,54
1,53
43,
141
(17,3
00)
1,52
7,375
1,50
8,78
42,
700
-1,
508,
784
1,118
,248
390,
536
1,59
8,28
91,
593,
641
STAT
EMEN
T O
F CO
ND
ITIO
NA
L G
RAN
TS A
ND
OTH
ER T
RAN
SFER
S PA
ID T
O M
UN
ICIP
ALI
TIES
- co
ntin
ued

417
PART E: FINANCIAL INFORMATION - Continuedfor the year ended 31 March 2019
ANNEXURES TO THE ANNUAL FINANCIAL STATEMENT
AN
NEX
URE
1B
STAT
EMEN
T O
F TR
AN
SFER
S TO
DEP
ART
MEN
TAL
AGEN
CIES
AN
D A
CCO
UN
TS
DEP
ART
MEN
T/AG
ENCY
/ACC
OU
NT
TRA
NSF
ER A
LLO
CATI
ON
TRA
NSF
ER20
17/1
8
Adj
uste
d ap
prop
riatio
nRo
ll O
vers
Adj
ustm
ents
Tota
l Av
aila
ble
Act
ual
Tran
sfer
% o
f Ava
ilabl
e fu
nds
tran
sfer
red
Fina
l A
ppro
pria
tion
R’0
00
R’0
00
R’0
00
R’0
00
R’0
00
% R
’000
Acco
untin
g St
anda
rds B
oard
14
,054
-
-
14,0
54
14
,054
10
0%13
,463
Audi
t Sta
tuto
ry B
odie
s
47,7
38
-
50,0
00
97,7
38
97,
738
100%
196,
278
Tv L
icen
ces
20
-
-
20
18
90
%19
Fina
ncia
l Int
ellig
ence
Cen
tre
278,
716
-
-
278,
716
278
,716
10
0%27
0,19
1
Gov
ernm
ent T
echn
ical
Adv
isory
Cen
tre
849,
538
(172
,680
)(8
5,76
3)59
1,09
5
33
0,08
6 56
%60
5,75
4
Inde
pend
ent R
egul
ator
y Bo
ard
for A
udito
rs
40,8
74
-
-
40,8
74
40,
874
100%
39,6
24
Sout
h Af
rican
Rev
enue
Ser
vice
9,
007,
217
-
-
9,00
7,21
7
9,00
7,21
7 10
0%10
,218
,193
Secr
et S
ervi
ces
4,
484,
817
-
-
4,48
4,81
7
4,48
4,81
7 10
0%4,
835,
448
Skill
s Dev
elop
men
t Lev
y
2,03
2 68
-
2,
100
2
,060
98
%2,
061
Coop
erat
ive
Bank
ing
Dev
elop
men
t Age
ncy
19
,883
-
-
19
,883
19,8
83
100%
19,2
75
Fina
ncia
l and
Fisc
al C
omm
issio
n
51,7
82
-
-
51,7
82
51
,782
10
0%50
,647
Tota
l 14
,796
,671
(1
72,6
12)
(35,
763)
14,5
88,2
96
14,3
27,2
45
98%
16,2
50,9
53
STAT
EMEN
T O
F CO
ND
ITIO
NA
L G
RAN
TS A
ND
OTH
ER T
RAN
SFER
S PA
ID T
O M
UN
ICIP
ALI
TIES
- co
ntin
ued

418
PART E: FINANCIAL INFORMATION - Continuedfor the year ended 31 March 2019
ANNEXURES TO THE ANNUAL FINANCIAL STATEMENT
AN
NEX
URE
1C
STAT
EMEN
T O
F TR
AN
SFER
S/SU
BSID
IES
TO P
UBL
IC C
ORP
ORA
TIO
NS
AN
D P
RIVA
TE E
NTE
RPRI
SES
NA
ME
OF
PUBL
IC
CORP
ORA
TIO
N/
PRIV
ATE
ENTE
RPRI
SE
TRA
NSF
ER A
LLO
CATI
ON
EXPE
ND
ITU
RE20
17/1
8
Adju
sted
ap
prop
riatio
n Ac
t
Roll
Ove
rsAd
just
men
tsTo
tal
Avai
labl
eAc
tual
Tr
ansf
er%
of
Avai
labl
e fu
nds
tran
sfer
red
Capi
tal
Curr
ent
Fina
l Ap
prop
riatio
n
R’0
00
R’0
00
R’0
00
R’0
00
R’0
00
% R
’000
R
’000
R
’000
Publ
ic co
rpor
atio
ns
Tran
sfer
s
1
3,31
6
-
(5,6
30)
7,68
6
-
-
-
-
1
0,58
6
Eco
nom
ic R
esea
rch
of
Sout
hern
Afri
ca
13,3
16
-
(5,6
30)
7,6
86
-
-
10,5
86
Tota
l: Pub
lic
corp
orat
ions
13,
316
-
(
5,63
0)
7,6
86
-
-
-
-
10,
586

419
PART E: FINANCIAL INFORMATION - Continuedfor the year ended 31 March 2019
ANNEXURES TO THE ANNUAL FINANCIAL STATEMENT
AN
NEX
URE
1D
STAT
EMEN
T O
F TR
AN
SFER
S TO
FO
REIG
N G
OVE
RNM
ENT
AN
D IN
TERN
ATIO
NA
L O
RGA
NIS
ATIO
NS
FORE
IGN
GO
VER
NM
ENT
/ IN
TERN
ATIO
NA
L O
RGA
NIS
ATIO
N
TRA
NSF
ER A
LLO
CATI
ON
EXPE
ND
ITU
RE20
17/1
8
Adju
sted
ap
prop
riatio
n Ac
t
Roll
Ove
rsAd
just
men
tsTo
tal A
vaila
ble
Actu
al Tr
ansf
er%
of A
vaila
ble
fund
s tr
ansf
erre
d
Fina
l Ap
prop
riatio
n
R’0
00
R’0
00
R’0
00
R’0
00
R’0
00
% R
’000
Tran
sfer
s
Com
mon
wea
lth F
und
for T
echn
ical
Coop
erat
ion
6,
423
(607
)
-
5,8
16
5
,816
10
0%6,
117
Int
erna
tiona
l Fun
ding
Fac
ility
for
Imm
unisa
tion
14,5
00
-
-
14,
500
13,
550
93%
14,4
10
Com
mon
Mon
etar
y Ar
ea
Com
pens
atio
n
973,
790
-
38,0
45
1
,011
,835
997
,833
-
891,
724
Wor
ld B
ank
Gro
up (I
nter
natio
nal
Dev
elop
men
t Ass
ocia
tion)
53,5
90
-
-
53,
590
53,5
90
-
56,6
67
Afri
can
Dev
elop
men
t Ban
k an
d Af
rican
Dev
elop
men
t Fun
d
35,4
06
47
,124
-
8
2,53
0
8
2,43
1
-
73,4
65
Afri
can
Regi
onal
Tech
nica
l Ass
istan
ce
Cent
re fo
r Sou
ther
n Af
rica
1,21
3
-
-
1,
213
1
,074
-
1,44
1
Inf
rast
ruct
ure
Cons
ortiu
m fo
r Afri
ca
-
-
-
-
-
-
-
Col
labo
rativ
e Af
rican
Bud
get R
efor
m
Initi
ativ
e
1,71
2
7
08
300
2
,720
2,56
5
94%
2,51
2
Afri
can
Inst
itute
for E
cono
mic
Dev
elop
men
t and
Pla
nnin
g
1,35
1
-
-
1,
351
1,11
2
82%
1,15
3
Afri
can
Expo
rt Im
port
Ban
k
-
-
-
-
-
-
Afri
can
Risk
Cap
acity
7,67
6
(7,6
76)
-
- -
-
-
Uni
ted
King
dom
Tax
(FIG
O)
2,69
5
(1,5
42)
1,15
3
1,1
52
100%
2,56
7
Tota
l
1,0
98,3
56
3
9,54
9
3
6,80
3 1
,174,
708
1,15
9,123
1,
050,
056

420
PART E: FINANCIAL INFORMATION - Continuedfor the year ended 31 March 2019
ANNEXURES TO THE ANNUAL FINANCIAL STATEMENT
AN
NEX
URE
1E
STAT
EMEN
T O
F TR
AN
SFER
S TO
HO
USE
HO
LDS
HO
USE
HO
LDS
TR
AN
SFER
ALL
OCA
TIO
NEX
PEN
DIT
URE
2017
/18
Adju
sted
ap
prop
riatio
n Ac
t
Roll
Ove
rsAd
just
men
tsTo
tal A
vaila
ble
Actu
al Tr
ansf
er%
of A
vaila
ble
fund
s tr
ansf
erre
d
Fina
l Ap
prop
riatio
n
R’0
00
R’0
00
R’0
00
R’0
00
R’0
00
% R
’000
Tran
sfer
s
Oth
er b
enefi
ts
116,
648
-
(1,0
62)
115,
586
116,
585
101%
-
Inju
ry o
n du
ty
652,
309
(9,0
00)
(11,
779)
63
1,53
0
640,
530
101%
1,49
6
Mili
tary
ben
efits
ex-
serv
icem
en
16,0
21
(5,0
00)
(2,2
58)
8,76
3
8,70
2 99
%
12,4
47
SA
citiz
en fo
rce
-
-
-
-
-
-
-
Spe
cial
pen
sions
953,
971
(223
,211
)
(867
,885
)
662,
875
652,
325
98%
1,37
1,73
0
Pos
t-ret
irem
ent m
edic
al sc
hem
es
cont
ribut
ion
2,61
5,99
6
240,
411
(49,
333)
2,80
6,45
2
2,80
6,45
2 10
0%
2,46
2,72
7
Soc
ial a
ssist
ance
(bur
sarie
s)
3,51
4
(94)
(335
)
3,08
5
2,94
9 96
%
1,80
0
Ser
vice
ben
efits
leav
e gr
atui
ty
-
475
2,82
1
3,29
6
2,84
9 86
%
2,14
9
Non
-sta
tuto
ry F
orce
s
737,
300
- -
737,
300
737,
300
100%
737,
300
Tota
l
5,
095,
759
3,58
1
(129
,831
)
4,
969,
509
4,96
7,692
4,
589,
649
STAT
EMEN
T O
F TR
AN
SFER
S TO
FO
REIG
N G
OVE
RNM
ENT
AN
D IN
TERN
ATIO
NA
L O
RGA
NIS
ATIO
NS
- con
tinue
d

421
PART E: FINANCIAL INFORMATION - Continuedfor the year ended 31 March 2019
ANNEXURES TO THE ANNUAL FINANCIAL STATEMENT
AN
NEX
URE
1F
STAT
EMEN
T O
F A
ID A
SSIS
TAN
CE R
ECEI
VED
NA
ME
OF
DO
NO
RPU
RPO
SEO
PEN
ING
BA
LAN
CERE
VEN
UE
EXPE
ND
I-TU
REPA
ID B
ACK
ON
/BY
31
MA
R
CLO
SIN
G
BALA
NCE
R’0
00
R’0
00
R’0
00
R’0
00
R’0
00
Euro
pean
Uni
on (M
um F
in M
an Te
ch
Assis
tanc
e)
Impr
ove
capa
city
dev
elop
men
t in
publ
ic
finan
ce m
anag
emen
t acr
oss t
he th
ree
sphe
res o
f gov
ernm
ent w
ith e
mph
asis
on
prov
inci
al a
nd m
unic
ipal
leve
ls
4
86
11,0
04
7,21
8
486
3
,786
Scho
lars
hip
Prog
ram
me
(Ga)
Belg
ian
cont
ribut
ion
tow
ards
the
com
plet
ion
of m
aste
rs a
nd p
ostg
radu
ate
degr
ees i
n de
velo
pmen
t fina
nce
(0)
-
-
1
(1)
Budg
et O
ff D
ata
Anal
y Pr
ojec
tSu
ppor
t for
bud
get d
ata
anal
ysis
for
impr
ovem
ent o
f bud
getin
g pr
oces
ses i
n th
e
publ
ic se
ctor
1,85
1
-
-
1,85
1
-
The
Belg
Tech
nica
l Coo
p (B
tc)
Belg
ian
cont
ribut
ion
tow
ards
the
rese
arch
in
deve
lopm
ent fi
nanc
e
371
3,
000
2,54
8
370
453
JICAD
CIS
Proj
ect
Esta
blish
and
ope
ratio
nalis
e a
man
agem
ent
info
rmat
ion
syst
em (k
now
ledg
e
man
agem
ent i
nfor
mat
ion
syst
em fo
r OD
A
(DCM
IS)
-
750
290
-
460
Citie
s Sup
port
Pro
gram
me
Cont
ribut
e to
the
impl
emen
tatio
n of
the
Med
ium
Term
Stra
tegi
c Fr
amew
ork
and
acco
mpa
nyin
g ou
tcom
es b
ased
app
roac
h
whi
ch a
ims t
o im
prov
e th
e co
nditi
ons o
f life
of S
outh
Afri
cans
and
hal
ving
pov
erty
and
unem
ploy
men
t.
-
35,
000
34,6
76
-
324
Capa
city
Bui
ldin
g Fo
r Pub
lic F
inan
ce
Man
agem
ent P
rogr
am
Dev
elop
pub
lic fi
nanc
e m
anag
emen
t
capa
city
of n
atio
nal p
rovi
ncia
l and
loca
l
gove
rnm
ent
(100
)
7,99
0
1,64
8
-
6
,242

422
PART E: FINANCIAL INFORMATION - Continuedfor the year ended 31 March 2019
ANNEXURES TO THE ANNUAL FINANCIAL STATEMENT
NA
ME
OF
DO
NO
RPU
RPO
SEO
PEN
ING
BA
LAN
CERE
VEN
UE
EXPE
ND
I-TU
REPA
ID B
ACK
ON
/BY
31
MA
R
CLO
SIN
G
BALA
NCE
R’0
00
R’0
00
R’0
00
R’0
00
R’0
00
Tech
nica
l and
Man
agem
ent S
uppo
rt
(TM
S)
Stre
ngth
enin
g ca
paci
ty o
f nat
iona
l and
prov
inci
al d
epar
tmen
ts a
nd a
genc
ies t
o
com
batin
g po
vert
y an
d in
equa
lity
5
5
-
-
55
-
PFM
A As
s in
Prov
PEF
A M
ETH
Afri
can
Fisc
al F
orum
(Ga)
Mea
sure
the
prog
ress
mad
e w
ith re
gard
s
to P
ublic
Fin
ance
Man
agem
ent (
PFM
)
impr
ovem
ent i
nfor
min
g an
d gu
idin
g th
e
Gov
ernm
ent’s
PFM
cap
acity
dev
elop
men
t
prog
ram
me
in c
oord
inat
ion
with
the
dono
r
com
mun
ity.
170
-
94
170
(94
)
Tech
nica
l Ass
ist F
acili
ty(G
a)St
reng
then
ing
capa
city
of n
atio
nal a
nd
prov
inci
al d
epar
tmen
ts in
Sou
th A
frica
3
,051
6,05
2
3,08
0
3,05
1
2,9
72
Mar
ket R
eadi
ness
Pro
ject
(Ga)
The
Part
ners
hip
for M
arke
t Rea
dine
ss
prov
ides
tech
nica
l ass
istan
ce to
Sou
th
Afric
a on
the
enha
ncem
ent o
f the
des
ign
of th
e ca
rbon
tax
and
deve
lopm
ent o
f the
mea
sure
men
t, re
port
ing
and
verifi
catio
n
syst
em to
ena
ble
the
impl
emen
tatio
n of
the
carb
on ta
x. S
outh
Afri
ca is
a re
cipi
ent
of fu
ndin
g (U
S$5
mill
ion
whi
ch h
as b
een
appr
oved
) for
the
Part
ners
hip
for M
arke
t
Read
ines
s (PM
R) in
itiat
ive
impl
emen
ted
by
the
Wor
ld B
ank
-
472
403
-
6
9
TOTA
L
5,
885
6
4,26
8 49
,958
5,
984
14,2
11
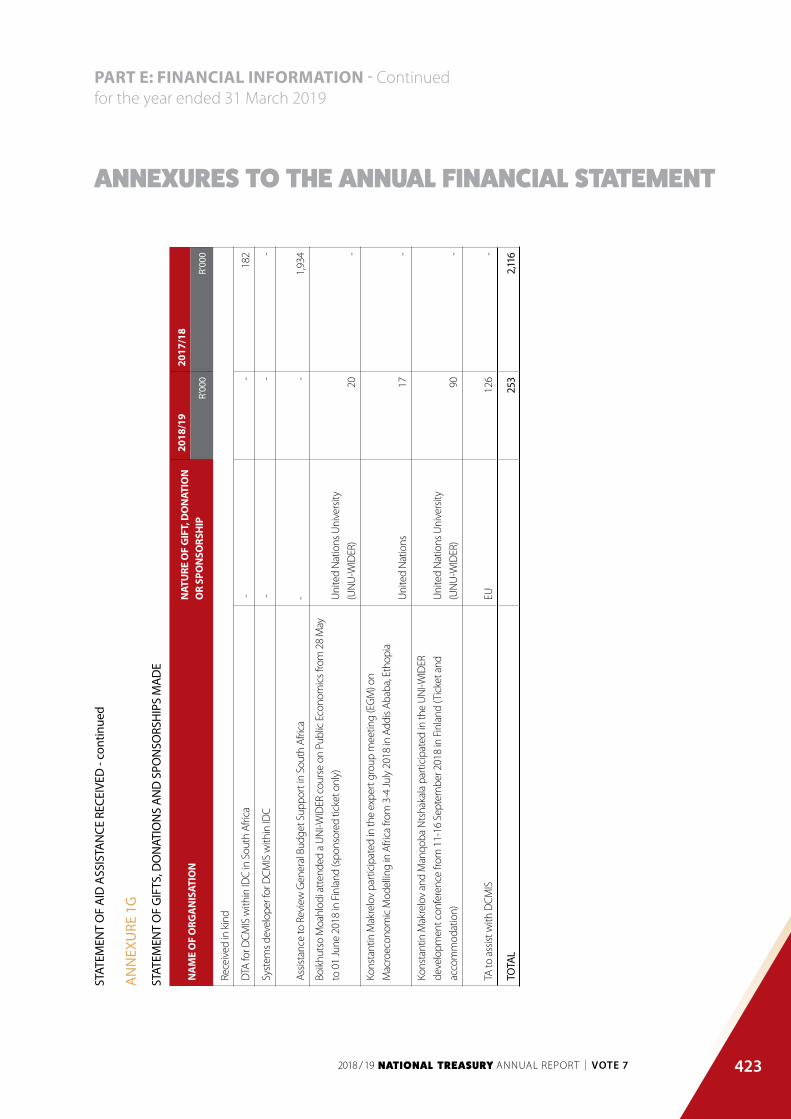
423
PART E: FINANCIAL INFORMATION - Continuedfor the year ended 31 March 2019
ANNEXURES TO THE ANNUAL FINANCIAL STATEMENT
AN
NEX
URE
1G
STAT
EMEN
T O
F G
IFTS
, DO
NAT
ION
S A
ND
SPO
NSO
RSH
IPS
MA
DE
NA
ME
OF
ORG
AN
ISAT
ION
NAT
URE
OF
GIF
T, D
ON
ATIO
N
OR
SPO
NSO
RSH
IP
201
8/19
20
17/1
8
R’0
00
R’0
00
Rece
ived
in k
ind
DTA
for D
CMIS
with
in ID
C in
Sou
th A
frica
-
-
182
Syst
ems d
evel
oper
for D
CMIS
with
in ID
C -
-
-
Assis
tanc
e to
Rev
iew
Gen
eral
Bud
get S
uppo
rt in
Sou
th A
frica
-
-
1
,934
Boik
huts
o M
oahl
odi a
tten
ded
a U
NI-W
IDER
cou
rse
on P
ublic
Eco
nom
ics f
rom
28
May
to 0
1 Ju
ne 2
018
in F
inla
nd (s
pons
ored
tick
et o
nly)
Uni
ted
Nat
ions
Uni
vers
ity
(UN
U-W
IDER
)
20
-
Kons
tant
in M
akre
lov
part
icip
ated
in th
e ex
pert
gro
up m
eetin
g (E
GM
) on
Mac
roec
onom
ic M
odel
ling
in A
frica
from
3-4
July
201
8 in
Add
is Ab
aba,
Eth
opia
Uni
ted
Nat
ions
17
-
Kons
tant
in M
akre
lov
and
Man
qoba
Nts
haka
la p
artic
ipat
ed in
the
UN
I-WID
ER
deve
lopm
ent c
onfe
renc
e fro
m 1
1-16
Sep
tem
ber 2
018
in F
inla
nd (T
icke
t and
acco
mm
odat
ion)
Uni
ted
Nat
ions
Uni
vers
ity
(UN
U-W
IDER
)
90
-
TA to
ass
ist w
ith D
CMIS
EU
126
-
TOTA
L25
3
2
,116
STAT
EMEN
T O
F A
ID A
SSIS
TAN
CE R
ECEI
VED
- co
ntin
ued

424
PART E: FINANCIAL INFORMATION - Continuedfor the year ended 31 March 2019
ANNEXURES TO THE ANNUAL FINANCIAL STATEMENT
AN
NEX
URE
2A
STAT
EMEN
T O
F IN
VEST
MEN
TS IN
AN
D A
MO
UN
TS O
WIN
G B
Y/TO
NAT
ION
AL/
PRO
VIN
CIA
L PU
BLIC
EN
TITI
ES
Nam
e of
pu
blic
ent
itySt
ate
Entit
y’s
PFM
A
Sche
dule
ty
pe (s
tate
ye
ar-e
nd
if no
t 31
Mar
ch)
% o
f sha
res h
eld
Num
ber o
f sha
res
held
Cost
of i
nves
tmen
t R’
000
Net
Ass
et V
alue
of
inve
stm
entR
’000
Profi
t/(L
oss)
for t
he
year
R’0
00Lo
sses
gu
aran
teed
2018
/19
2017
/18
201
8/19
2
017/
18
2018
/19
201
7/18
20
18/1
9 2
017/
18
2018
/19
201
7/18
Ye
s/N
o
Acco
untin
g
Stan
dard
s
Boar
dSc
hedu
le 3
A
--
-
-
-
-
-
38
-
(86)
No
Coop
erat
ive
Bank
s
Dev
elop
men
t
Agen
cySc
hedu
le 3
A
--
-
-
-
-
-
6,80
4 -
2,40
4 N
o
Dev
elop
men
t
Bank
of
Sout
hern
Afric
aSc
hedu
le 2
-10
0 -
200,
000
-
200,
000
-
31,9
71,0
63
-
2,75
8,28
9 Ye
s
FAIS
Om
buds
man
Sche
dule
3A
-
- -
-
-
- -
2,16
2 -
(6,9
72)
No
Fina
ncia
l
and
Fisc
al
Com
miss
ion
Sche
dule
1-
- -
-
-
- -
7,63
2 -
5,12
8 N
o
Fina
ncia
l
Inte
llige
nce
Cent
reSc
hedu
le 3
A
--
-
- -
-
-
98,3
52
-
15,2
32
No
Fina
ncia
l
Serv
ices
Boa
rdSc
hedu
le 3
A
--
-
- -
-
-
412,
442
-
131,
589
No
Gov
ernm
ent
Tech
nica
l
Advi
sory
Cent
reSc
hedu
le 3
A
--
-
- -
-
-
345,
021
-
(87,
247)
No

425
PART E: FINANCIAL INFORMATION - Continuedfor the year ended 31 March 2019
ANNEXURES TO THE ANNUAL FINANCIAL STATEMENT
Nam
e of
pu
blic
ent
itySt
ate
Entit
y’s
PFM
A
Sche
dule
ty
pe (s
tate
ye
ar-e
nd
if no
t 31
Mar
ch)
% o
f sha
res h
eld
Num
ber o
f sha
res
held
Cost
of i
nves
tmen
t R’
000
Net
Ass
et V
alue
of
inve
stm
entR
’000
Profi
t/(L
oss)
for t
he
year
R’0
00Lo
sses
gu
aran
teed
2018
/19
2017
/18
201
8/19
2
017/
18
2018
/19
201
7/18
20
18/1
9 2
017/
18
2018
/19
201
7/18
Ye
s/N
o
Gov
ernm
ent
Pens
ions
Adm
inist
ratio
n
Agen
cySc
hedu
le 3
A
--
-
- -
-
-
147,
307
-
-
N
o
Inde
pend
ent
Regu
lato
ry
Boar
d fo
r
Audi
tors
Sche
dule
3A
-
- -
-
-
- -
44,9
25
-
(4,6
62)
No
LAN
D B
ank
Sche
dule
2-
100
-
1
-
200,
955
-
5,22
7,07
8 -
305,
757
No
Offi
ce o
f the
Pens
ion
Fund
s
Adju
dica
tor
Sche
dule
3A
-
- -
-
-
- -
8,57
6 -
572
No
Publ
ic
Inve
stm
ent
Corp
orat
ion
Ltd
Sche
dule
3B
-10
0 -
1
-
1
-
2,25
0,77
1 -
505,
880
No
Sasr
ia S
OC
Ltd
Sche
dule
3B
-10
0 -
1
-
- -
5,
749,
629
-
532,
954
No
Sout
h Af
rican
Airw
ays S
OC
Ltd
Sche
dule
2-
100
-
13,0
08,7
58
-
13,0
08,7
58
-
(15,
795,
000)
-
(4,6
77,0
00)
Yes
Sout
h Af
rican
Reve
nue
Serv
ice
Sche
dule
3A
-
- -
10,0
00,0
00
-
- -
3,58
1,93
5 -
(623
,368
)N
o
TOTA
L-
23,2
08,7
61
- 13
,409
,714
-
34,
058,
735
- (1
,141,
530)
STAT
EMEN
T O
F IN
VEST
MEN
TS IN
AN
D A
MO
UN
TS O
WIN
G B
Y/TO
NAT
ION
AL/
PRO
VIN
CIA
L PU
BLIC
EN
TITI
ES

426
PART E: FINANCIAL INFORMATION - Continuedfor the year ended 31 March 2019
ANNEXURES TO THE ANNUAL FINANCIAL STATEMENT
AN
NEX
URE
2B
STAT
EMEN
T O
F IN
VEST
MEN
TS IN
AN
D A
MO
UN
TS O
WIN
G B
Y/TO
EN
TITI
ES
Nam
e of
pub
lic e
ntity
Nat
ure
of b
usin
ess
Cost
of i
nves
tmen
t R’
000
Net
Ass
et V
alue
of
inve
stm
ent
R’
000
Am
ount
s ow
ing
to
Entit
ies R
’000
Am
ount
s ow
ing
by
Entit
ies R
’000
201
8/19
2
017/
18
201
8/19
2
017/
18
201
8/19
2
017/
18
201
8/19
2
017/
18
Acco
untin
g St
anda
rds
Boar
d
Det
erm
ine
stan
dard
s
of g
ener
ally
reco
gnise
d
acco
untin
g pr
actic
e -
- -
38
-
69
-
338
Co-o
pera
tive
Bank
s
Dev
elop
men
t Age
ncy
Esta
blish
a re
gula
tory
fram
ewor
k fo
r co-
oper
ativ
e
bank
s -
- -
6,80
4 -
3
,806
-
1,91
6
Dev
elop
men
t Ban
k of
Sout
hern
Afri
ca
Prom
ote,
faci
litat
e by
fund
ing
mob
ilise
soci
oeco
nom
ic
deve
lopm
ent i
n So
uthe
rn
Afric
a w
hile
pro
mot
ing
effici
ency
, fai
rnes
s,
trans
pare
ncy
and
resp
onsib
ility
-
200,
000
-
31,9
71,0
63
-
121,
982
-
8
84,8
19
FAIS
Om
buds
man
Han
dlin
g co
mpl
aint
s in
term
s of t
he F
inan
cial
Advi
sory
and
Inte
rmed
iary
Serv
ices
Act
(200
2) -
- -
2,16
2 -
73
0 -
2,23
1
Fina
ncia
l and
Fisc
al
Com
miss
ion
Assis
t and
mai
ntai
n fis
cal
the
bala
nce
betw
een
fisca
l
dece
ntra
lisat
ion
and
the
unita
ry st
ate
-
- -
7,63
2 -
2
3 -
66
5
Fina
ncia
l Int
ellig
ence
Cent
re
Assis
t in
in th
e id
entifi
catio
n
of u
nlaw
ful a
ctiv
ities
, and
com
batin
g of
mon
ey
laun
derin
g ac
tiviti
es,
finan
cing
of t
erro
rism
and
rela
ted
activ
ities
-
- -
98,3
52
-
414
-
23,2
09
STAT
EMEN
T O
F IN
VEST
MEN
TS IN
AN
D A
MO
UN
TS O
WIN
G B
Y/TO
NAT
ION
AL/
PRO
VIN
CIA
L PU
BLIC
EN
TITI
ES

427
PART E: FINANCIAL INFORMATION - Continuedfor the year ended 31 March 2019
ANNEXURES TO THE ANNUAL FINANCIAL STATEMENTN
ame
of p
ublic
ent
ityN
atur
e of
bus
ines
s
Cost
of i
nves
tmen
t R’
000
Net
Ass
et V
alue
of
inve
stm
ent
R’
000
Am
ount
s ow
ing
to
Entit
ies R
’000
Am
ount
s ow
ing
by
Entit
ies R
’000
201
8/19
2
017/
18
201
8/19
2
017/
18
201
8/19
2
017/
18
201
8/19
2
017/
18
Fina
ncia
l Ser
vice
s Boa
rd
To o
vers
ee th
e So
uth
Afric
an
non-
bank
ing
finan
cial
serv
ices
indu
stry
in th
e
publ
ic in
tere
st -
- -
412,
442
-
46,
415
-
76,5
93
Gov
ernm
ent T
echn
ical
Advi
sory
Cen
tre
Assis
t org
ans o
f sta
te in
build
ing
thei
r cap
acity
for e
ffici
ent,
effec
tive
and
trans
pare
nt fi
nanc
ial
man
agem
ent.
- -
-
345,
021
-
2,4
45
-
22
3,43
6
Gov
ernm
ent P
ensio
ns
Adm
inist
ratio
n Ag
ency
Gov
ernm
ent E
mpl
oyee
s
Pens
ion
Fund
in te
rms o
f
the
Gov
ernm
ent E
mpl
oyee
s
Pens
ion
(GEP
) Act
(199
6) -
- -
147,
307
-
- -
-
Inde
pend
ent R
egul
ator
y
Boar
d fo
r Aud
itors
Regi
stra
tion
of p
ublic
acco
unta
nts a
nd a
udito
rs
and
for t
he re
gula
tion
of th
e tra
inin
g of
pub
lic
acco
unta
nts a
nd a
udito
rs -
- -
44,9
25
-
5,0
99
-
5,7
69
LAN
D B
ank
Faci
litat
e ac
cess
to
owne
rshi
p of
land
for t
he
deve
lopm
ent o
f far
min
g
ente
rpris
es a
nd a
gric
ultu
ral
proc
esse
s for
the
hist
oric
ally
disa
dvan
tage
d pe
ople
-
200,
955
-
5,22
7,07
8 -
138
,949
-
163
,998
Offi
ce o
f the
Pen
sion
Fund
s Adj
udic
ator
The
adju
dica
tor’s
offi
ce
inve
stig
ates
and
det
erm
ines
com
plai
nts o
f abu
se o
f
pow
er, m
alad
min
istra
tion,
disp
ute
of fa
ct o
r law
and
empl
oyer
der
elic
tion
of d
uty
in re
spec
t of r
etire
men
t
pens
ion
fund
s. -
- -
8,57
6 -
3
,955
-
2,60
1
STAT
EMEN
T O
F IN
VEST
MEN
TS IN
AN
D A
MO
UN
TS O
WIN
G B
Y/TO
EN
TITI
ES -
cont
inue
d

428
PART E: FINANCIAL INFORMATION - Continuedfor the year ended 31 March 2019
ANNEXURES TO THE ANNUAL FINANCIAL STATEMENT
Nam
e of
pub
lic e
ntity
Nat
ure
of b
usin
ess
Cost
of i
nves
tmen
t R’
000
Net
Ass
et V
alue
of
inve
stm
ent
R’
000
Am
ount
s ow
ing
to
Entit
ies R
’000
Am
ount
s ow
ing
by
Entit
ies R
’000
201
8/19
2
017/
18
201
8/19
2
017/
18
201
8/19
2
017/
18
201
8/19
2
017/
18
Publ
ic In
vest
men
t
Corp
orat
ion
Ltd
Inve
sts f
unds
on
beha
lf of
the
Sout
h Af
rican
pub
lic
sect
or -
1 -
2,25
0,77
1 -
561
,449
-
56
,846
Sasr
ia S
OC
Ltd
Spec
ial R
isk In
sura
nce
- -
-
5,74
9,62
9 -
273,
782
-
51,1
62
Sout
h Af
rican
Airw
ays
SOC
Ltd
Sout
h Af
rican
Airw
ays i
s
Sout
h Af
rica’s
nat
iona
l air
carri
er, w
hich
ope
rate
s a
full
serv
ice
netw
ork
in th
e
inte
rnat
iona
l reg
ion
and
dom
estic
rout
es -
13,0
08,7
58
-
15,7
95,0
00
-
6,78
0,00
0 -
9,
762,
000
Sout
h Af
rican
Rev
enue
Serv
ice
Effici
ent a
nd e
ffect
ive
colle
ctio
n of
reve
nue
- -
-
3,58
1,93
5 -
129,
513
-
6
17,5
37
TOTA
L
-
13,4
09,7
14
-
65,6
48,7
35
-
8
,068
,631
-
11,8
73,1
20
STAT
EMEN
T O
F IN
VEST
MEN
TS IN
AN
D A
MO
UN
TS O
WIN
G B
Y/TO
EN
TITI
ES -
cont
inue
d

429
PART E: FINANCIAL INFORMATION - Continuedfor the year ended 31 March 2019
ANNEXURES TO THE ANNUAL FINANCIAL STATEMENT
AN
NEX
URE
3A
STAT
EMEN
T O
F FI
NA
NCI
AL
GU
ARA
NTE
ES IS
SUED
AS
AT 3
1 M
ARC
H 2
019
– LO
CAL
GU
ARA
NTO
R IN
STIT
UTI
ON
Gua
rant
ee in
re
spec
t of
Ori
gina
l gu
aran
teed
ca
pita
l am
ount
Ope
ning
ba
lanc
e 1
Apr
il 20
18
Gua
rant
ees
draw
dow
ns
duri
ng th
e ye
ar
Gua
rant
eed
repa
ymen
ts/
canc
elle
d/
redu
ced
duri
ng th
e ye
ar
Reva
luat
ion
due
to
fore
ign
curr
ency
m
ovem
ents
Clos
ing
bala
nce
31
Mar
ch 2
019
Reva
luat
ions
du
e to
in
flatio
n ra
te
mov
emen
ts
Acc
rued
gu
aran
teed
in
tere
st fo
r ye
ar e
nded
31
Mar
ch
2019
R’0
00
R’0
00
R’0
00
R’0
00
R’0
00
R’0
00
R’0
00
R’0
00
Loca
l
Dev
elop
men
t
Bank
of
Sout
hern
Afri
ca
Form
er
Boph
utha
tsw
ana
Regi
onal
Aut
horit
y
126,
060
57,7
19
-
1,84
2 -
55,8
77
-
20,7
60
Land
and
Agric
ultu
ral
Dev
elop
men
t
Bank
of S
outh
Afric
a
Cons
olid
atio
n of
debt
100,
000
92,7
28
--
-
92,7
28
--
Land
and
Agric
ultu
ral
Dev
elop
men
t
Bank
of S
outh
Afric
a
Fina
ncia
l
sust
aina
bilit
y
1,50
0,00
0
- -
--
--
-
Land
and
Agric
ultu
ral
Dev
elop
men
t
Bank
of S
outh
Afric
a
Fina
ncia
l
sust
aina
bilit
y
2,70
0,00
0
2,70
0,00
0 -
2,70
0,00
0 -
--
-
Land
and
Agric
ultu
ral
Dev
elop
men
t
Bank
of S
outh
Afric
aRe
finan
cing
risk
3,00
0,00
0
- -
--
--
-
STAT
EMEN
T O
F IN
VEST
MEN
TS IN
AN
D A
MO
UN
TS O
WIN
G B
Y/TO
EN
TITI
ES -
cont
inue
d

430
PART E: FINANCIAL INFORMATION - Continuedfor the year ended 31 March 2019
ANNEXURES TO THE ANNUAL FINANCIAL STATEMENT
GU
ARA
NTO
R IN
STIT
UTI
ON
Gua
rant
ee in
re
spec
t of
Ori
gina
l gu
aran
teed
ca
pita
l am
ount
Ope
ning
ba
lanc
e 1
Apr
il 20
18
Gua
rant
ees
draw
dow
ns
duri
ng th
e ye
ar
Gua
rant
eed
repa
ymen
ts/
canc
elle
d/
redu
ced
duri
ng th
e ye
ar
Reva
luat
ion
due
to
fore
ign
curr
ency
m
ovem
ents
Clos
ing
bala
nce
31
Mar
ch 2
019
Reva
luat
ions
du
e to
in
flatio
n ra
te
mov
emen
ts
Acc
rued
gu
aran
teed
in
tere
st fo
r ye
ar e
nded
31
Mar
ch
2019
R’0
00
R’0
00
R’0
00
R’0
00
R’0
00
R’0
00
R’0
00
R’0
00
Sout
h Af
rican
Airw
ays1
-
Subt
otal
7,426
,060
2,
850,
447
-
14
8,60
5
- -
-20
,760
Oth
er
Dev
elop
men
t
Bank
of
Sout
hern
Afri
ca
Afric
an
Dev
elop
men
t
Bank
1,44
8,68
5
59,3
40
- 82
,106
22,7
66
-
-
-
Dev
elop
men
t
Bank
of
Sout
hern
Afri
caEu
robo
nds
8,47
0,00
0
3,17
1,55
4
323,
982
-
-
3,49
5,53
6 -
10
,875
Dev
elop
men
t
Bank
of
Sout
hern
Afri
ca
Kred
itans
talt
fur
Wie
dera
ufba
u
476,
023
213,
653
-
23,7
15
24,2
72
214,
210
-1,
083
Dev
elop
men
t
Bank
of
Sout
hern
Afri
ca
Kred
itans
talt
fur
Wie
dera
ufba
u
237,
255
143,
758
-
11,8
20
16,3
46
148,
284
-75
0
Dev
elop
men
t
Bank
of
Sout
hern
Afri
ca
Kred
itans
talt
fur
Wie
dera
ufba
u
204,
100
152,
008
-
9,89
6
17,2
95
159,
407
-80
6
Dev
elop
men
t
Bank
of
Sout
hern
Afri
ca
Kred
itans
talt
fur
Wie
dera
ufba
u
208,
118
109,
719
-
10,1
23
12,4
71
112,
067
-56
7
1 S
outh
Afri
can
Airw
ays (
SA))
appr
oved
gua
rant
ees o
f R19
.1 b
illio
n w
ith a
corre
spon
ding
exp
osur
e of
R11
.0 b
illio
n as
at 1
Apr
il 20
18 w
ere
trans
ferre
d to
Dep
artm
ent o
f Pub
lic E
nter
prise
s.

431
PART E: FINANCIAL INFORMATION - Continuedfor the year ended 31 March 2019
ANNEXURES TO THE ANNUAL FINANCIAL STATEMENTG
UA
RAN
TOR
INST
ITU
TIO
N
Gua
rant
ee in
re
spec
t of
Ori
gina
l gu
aran
teed
ca
pita
l am
ount
Ope
ning
ba
lanc
e 1
Apr
il 20
18
Gua
rant
ees
draw
dow
ns
duri
ng th
e ye
ar
Gua
rant
eed
repa
ymen
ts/
canc
elle
d/
redu
ced
duri
ng th
e ye
ar
Reva
luat
ion
due
to
fore
ign
curr
ency
m
ovem
ents
Clos
ing
bala
nce
31
Mar
ch 2
019
Reva
luat
ions
du
e to
in
flatio
n ra
te
mov
emen
ts
Acc
rued
gu
aran
teed
in
tere
st fo
r ye
ar e
nded
31
Mar
ch
2019
R’0
00
R’0
00
R’0
00
R’0
00
R’0
00
R’0
00
R’0
00
R’0
00
Dev
elop
men
t
Bank
of
Sout
hern
Afri
ca
Kred
itans
talt
fur
Wie
dera
ufba
u
224,
438
110,
808
-
11,1
81
12,5
92
112,
219
-56
8
Land
and
Agric
ultu
ral
Dev
elop
men
t
Bank
of S
outh
Afric
a
Afric
an
Dev
elop
men
t
Bank
1,00
0,00
0
1,00
0,00
0 -
227,
273
-
772,
727
-9,
995
Land
and
Agric
ultu
ral
Dev
elop
men
t
of S
outh
Afri
caW
orld
Ban
k
1,30
0,00
0
-
90,0
00
-
-
90,0
00
-
-
Subt
otal
13,5
68,6
19
4,96
0,84
0 41
3,98
2 37
6,11
4 10
5,74
2 5,1
04,4
50
24,6
04
-
Tota
l
20
,994
,679
7,8
11,2
87
413,
982
3,07
7,956
10
5,74
2 5,
253,
055
245
,364
-
AN
NEX
URE
3B
STAT
EMEN
T O
F CO
NTI
NG
ENT
LIA
BILI
TIES
AS
AT 3
1 M
ARC
H 2
019
NAT
URE
OF
LIA
BILI
TY
Ope
ning
bal
ance
1
Apr
il 20
18Li
abili
ties i
ncur
red
duri
ng th
e ye
arLi
abili
ties p
aid/
ca
ncel
led/
redu
ced
duri
ng th
e ye
ar
Liab
ilitie
s re
cove
rabl
e (P
rovi
de
deta
ils h
ereu
nder
)
Clos
ing
bala
nce
31
Mar
ch 2
019
R’0
00
R’0
00
R’0
00
R’0
00
R’0
00
Clai
ms a
gain
st th
e de
part
men
t
Cont
ract
can
cella
tion
clai
ms
4,5
00
--
-
4,
500
2 T
he c
losin
g ba
lanc
e fig
ure
at 3
1 M
arch
201
9 pl
us th
e re
valu
atio
n du
e to
infla
tion
rate
mov
emen
ts fi
gure
is n
ote
19 u
nder
cont
inge
nt li
abili
ties.
STAT
EMEN
T O
F FI
NA
NCI
AL
GU
ARA
NTE
ES IS
SUED
AS
AT 3
1 M
ARC
H 2
019
– LO
CAL

432
PART E: FINANCIAL INFORMATION - Continuedfor the year ended 31 March 2019
ANNEXURES TO THE ANNUAL FINANCIAL STATEMENT
NAT
URE
OF
LIA
BILI
TY
Ope
ning
bal
ance
1
Apr
il 20
18Li
abili
ties i
ncur
red
duri
ng th
e ye
arLi
abili
ties p
aid/
ca
ncel
led/
redu
ced
duri
ng th
e ye
ar
Liab
ilitie
s re
cove
rabl
e (P
rovi
de
deta
ils h
ereu
nder
)
Clos
ing
bala
nce
31
Mar
ch 2
019
R’0
00
R’0
00
R’0
00
R’0
00
R’0
00
Unl
awfu
l use
of p
hoto
grap
h cl
aim
5
00
-
5
00
-
-
Xia
Xu c
laim
2
84
-
2
84
-
-
Callc
om c
laim
2,4
00
-
-
2,
400
VMA
Cour
t Rec
ords
cla
im
19
0 -
19
0 -
-
Stol
en c
hequ
e cl
aim
67
--
-
67
Med
ihel
p cl
aim
9,9
97
--
-
9,
997
Tran
snet
Sec
ond
Bene
fit F
und
clai
m
1,
963,
000
--
-
1,9
63,0
00
Gra
tuity
pay
men
t cla
im
479
-
--
4
79
Inju
ry o
n du
ty c
laim
2
33
-
2
33
-
-
Serv
ices
rend
ered
cla
im
33
,134
-
- -
3
3,13
4
Fort
eite
d m
oney
cla
im
1,1
00
--
-
1
,100
ML
Ceza
3
35
--
-
335
City
of T
shw
ane
Met
ropo
litan
Mun
icip
ality
171,
815
--
-
171
,815
Talk
ing
Trad
e (P
ty) L
td
286
-
--
2
86
Mat
ola
Zong
ezile
59
--
-
59
Vinc
ent M
atom
e
1,00
0 -
- -
1,0
00
Eng
Chun
Liu
1,
250
- -
-
1
,250
Swire
Exp
ress
(Pty
) Ltd
1,10
1 -
- -
1,
101
Flyf
ofa
Airw
ays (
Pty)
Ltd
3
2,66
8 -
- -
3
2,66
8
Flyf
ofa
Airw
ays (
Pty)
Ltd
17,5
00
- -
-
17,
500
Roel
itta
cc t/
a RV
R Co
nsul
ting
1,
730
-
1,7
30
-
-
Dav
id C
hauk
e-
9
8,00
0,00
0 -
-
9
8,00
0,00
0
Cand
ice
Jean
van
der
Mer
we
-
1
,000
,000
-
-
1,0
00,0
00
Gid
eon
Nap
oleo
n SA
M o
bo S
A Re
d Cr
oss
-
5
4,00
6 -
-
54,
006
Gar
y W
alte
r van
der
Mer
we
-
1
,000
,000
-
-
1,0
00,0
00
Subt
otal
2
,243
,628
100,
054,
006
2
,937
-
10
2,29
4,69
7
STAT
EMEN
T O
F FI
NA
NCI
AL
GU
ARA
NTE
ES IS
SUED
AS
AT 3
1 M
ARC
H 2
019
– LO
CAL

433
PART E: FINANCIAL INFORMATION - Continuedfor the year ended 31 March 2019
ANNEXURES TO THE ANNUAL FINANCIAL STATEMENT
NAT
URE
OF
LIA
BILI
TY
Ope
ning
bal
ance
1
Apr
il 20
18Li
abili
ties i
ncur
red
duri
ng th
e ye
arLi
abili
ties p
aid/
ca
ncel
led/
redu
ced
duri
ng th
e ye
ar
Liab
ilitie
s re
cove
rabl
e (P
rovi
de
deta
ils h
ereu
nder
)
Clos
ing
bala
nce
31
Mar
ch 2
019
R’0
00
R’0
00
R’0
00
R’0
00
R’0
00
Oth
er
Mili
tary
Pen
sion
35
8,90
5
3
0,46
9
9
6,80
9 -
292
,565
Inju
ry o
n du
ty
24,
583
7,
036
22
,154
-
9,46
5
Spec
ial P
ensio
n
98,
300
18,
558
36,
580
80,
278
Subt
otal
48
1,78
8
5
6,06
3
15
5,54
3
-
382
,308
TOTA
L
2,7
25,4
16
100
,110,
069
158,
480
-
102,
677,0
05
AN
NEX
URE
4
CLA
IMS
RECO
VERA
BLE
GO
VER
NM
ENT
ENTI
TY
Con
firm
ed b
alan
ce
outs
tand
ing
Unc
onfir
med
bal
ance
ou
tsta
ndin
g To
tal
Cas
h in
tran
sit a
t yea
r end
20
18/1
9*
31/
03/2
019
31/
03/2
018
31/
03/2
019
31/
03/2
018
31/
03/2
019
31/
03/2
018
Rec
eipt
dat
e up
to
six
(6) w
orki
ng
days
aft
er y
ear
end
Am
ount
R’0
00
R’0
00
R’0
00
R’0
00
R’0
00
R’0
00
R’
000
DEP
ARTM
ENTS
Wes
tern
Cap
e-
- 21
21
21
21
Nat
iona
l
Dep
artm
ents
5
5,83
4
979
2,06
1
984
7,89
5
Fore
ign
gove
rnm
ent
- -
1,15
3
1,06
5
1,15
3
1,06
5
Gau
teng
- -
- -
- -
Tota
l5
5,83
4 2,
153
3,14
7 2,
158
8,98
1
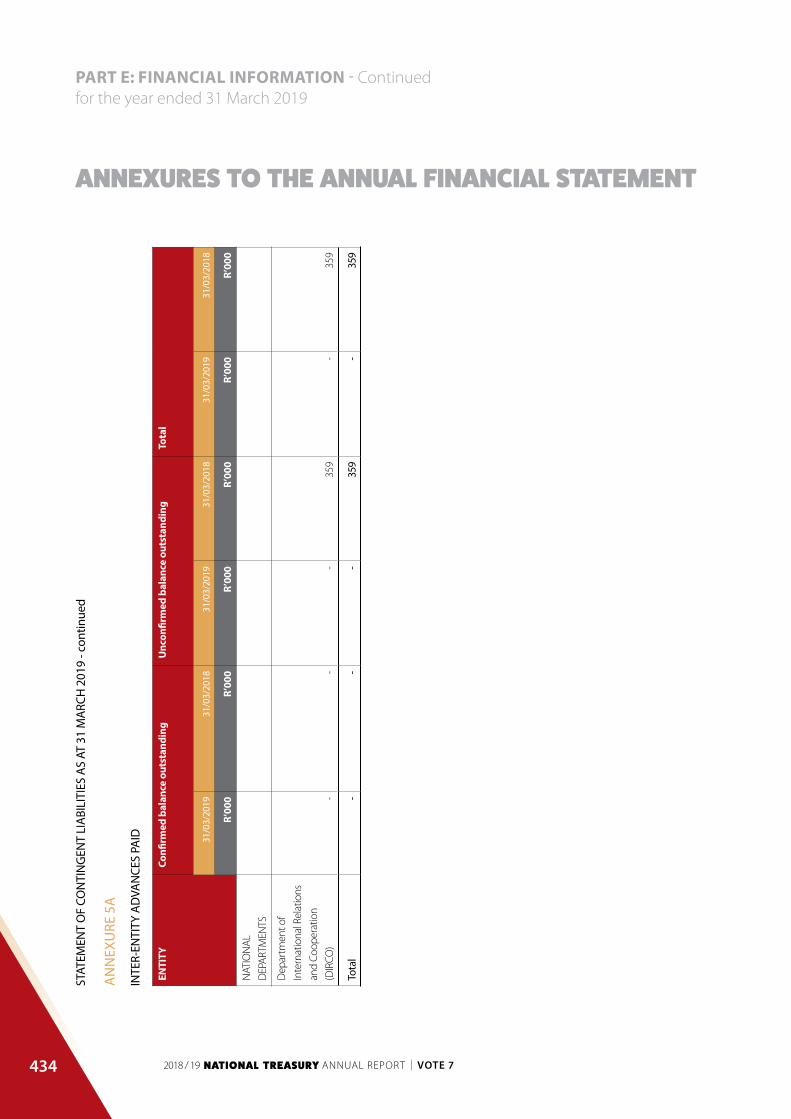
434
PART E: FINANCIAL INFORMATION - Continuedfor the year ended 31 March 2019
ANNEXURES TO THE ANNUAL FINANCIAL STATEMENT
AN
NEX
URE
5A
INTE
R-EN
TITY
AD
VAN
CES
PAID
ENTI
TY
Con
firm
ed b
alan
ce o
utst
andi
ng
Unc
onfir
med
bal
ance
out
stan
ding
To
tal
31/0
3/20
1931
/03/
2018
31/0
3/20
1931
/03/
2018
31/0
3/20
1931
/03/
2018
R’00
0R’
000
R’00
0R’
000
R’00
0R’
000
NAT
ION
AL
DEP
ARTM
ENTS
Dep
artm
ent o
f
Inte
rnat
iona
l Rel
atio
ns
and
Coop
erat
ion
(DIR
CO)
- -
-
359
-
35
9
Tota
l-
-
-
35
9
-
35
9
STAT
EMEN
T O
F CO
NTI
NG
ENT
LIA
BILI
TIES
AS
AT 3
1 M
ARC
H 2
019
- con
tinue
d
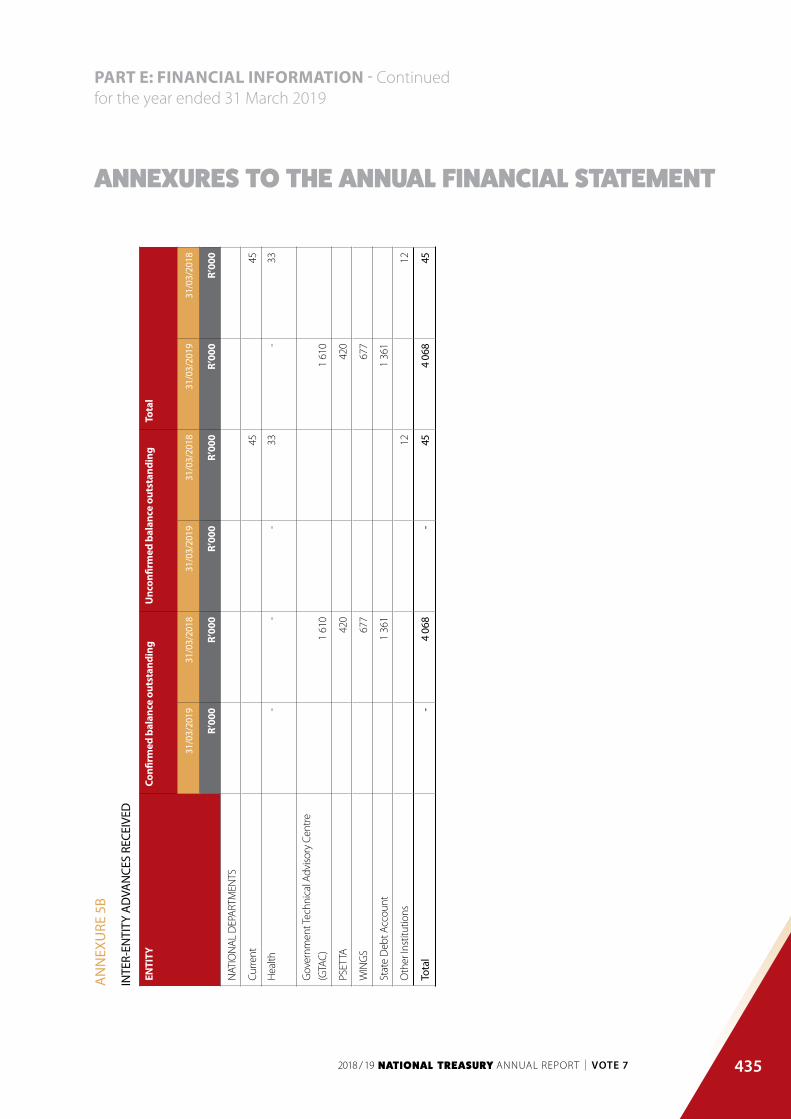
435
PART E: FINANCIAL INFORMATION - Continuedfor the year ended 31 March 2019
ANNEXURES TO THE ANNUAL FINANCIAL STATEMENT
AN
NEX
URE
5B
INTE
R-EN
TITY
AD
VAN
CES
RECE
IVED
ENTI
TY
Con
firm
ed b
alan
ce o
utst
andi
ng
Unc
onfir
med
bal
ance
out
stan
ding
To
tal
31/0
3/20
1931
/03/
2018
31/0
3/20
1931
/03/
2018
31/0
3/20
1931
/03/
2018
R’00
0R’
000
R’00
0R’
000
R’00
0R’
000
NAT
ION
AL D
EPAR
TMEN
TS
Curre
nt45
45
Hea
lth-
- -
33
- 33
Gov
ernm
ent T
echn
ical
Adv
isory
Cen
tre
(GTA
C)
1 61
01
610
PSET
TA42
042
0
WIN
GS
677
677
Stat
e D
ebt A
ccou
nt1
361
1 36
1
Oth
er In
stitu
tions
1212
Tota
l
-
4
068
-
45
4 0
68
45

NOTES

NOTES

NOTES

NATIONAL TREASURYANNUAL REPORT
VOTE 7
40 Church Square, Pretoria, 0002
Private Bag X115, Pretoria, 0001
T +27 (0)12 315 5757, F +27 (0)12 406 9055