National Survey of College and University Parent Programs · National Survey of College and...
44
National Survey of College and University Parent Programs Survey Conducted Spring 2015 Marjorie Savage University of Minnesota Chelsea Petree Rochester Institute of Technology Send questions or comments on this survey to Marjorie Savage at [email protected] or Chelsea Petree at [email protected]
-
Upload
trinhhuong -
Category
Documents
-
view
219 -
download
2
Transcript of National Survey of College and University Parent Programs · National Survey of College and...

National Survey of
College and University Parent Programs Survey Conducted Spring 2015
Marjorie Savage
University of Minnesota
Chelsea Petree
Rochester Institute of Technology
Send questions or comments on this survey to Marjorie Savage at
[email protected] or Chelsea Petree at [email protected]

Table of Contents
Abstract ......................................................................................................................................... 2
Executive Summary ...................................................................................................................... 3
Introduction ................................................................................................................................... 4
Method .......................................................................................................................................... 6
Results ........................................................................................................................................... 8
Organizational Structure ................................................................................................... 8
Program Demographics .................................................................................................... 9
Staffing Parent/Family Offices ....................................................................................... 11
Services and Programming ............................................................................................. 13
Self-Identified Most/Least Successful Services .............................................................. 20
Program Budget .............................................................................................................. 23
Professional Advice and General Comments ................................................................. 24
Discussion ................................................................................................................................... 26
Further Research/Additional Questions .......................................................................... 28
Appendix I: Survey Questions .................................................................................................... 29
Appendix 2: Parent/Family Weekend Collaborators .................................................................. 39

2015 National Survey of College and University Parent Programs 2
Abstract
This report, summarizing the seventh national survey by the University of Minnesota Parent
Program, builds on longitudinal information about parent/family services provided by colleges
and universities. The surveys have been conducted biennially to track best practices in services
and programming, changes and developments in the field, costs for providing parent/family
services, and experience levels of the professionals who work with parents and families of
college students.

2015 National Survey of College and University Parent Programs 3
Executive Summary
Since 2003, the University of Minnesota Parent Program has conducted biennial surveys of
college and university parent/family programs to track the development of parent/family
relations in higher education. This year’s survey, in addition to continuing the longitudinal
exploration of parent/family programs, takes into account several new concerns that
professionals in the field have been addressing. As admissions offices, student services, and
financial aid priorities in recent years have increasingly focused on specific student populations,
parent/family programs have also sought to identify practices where parent/family programs
intersect with some of these populations. Consequently, this year’s survey included questions
about communication with international families and parents whose first language is not English,
as well as services for students who are themselves parents.
Parent/family program staff, like many professionals in higher education, are increasingly asked
to do more with less. In order to accommodate pressures on time and resources, they are looking
for best practices, collaborations, and creative programming to address those pressures. This
year’s survey sought more detail about the structure and staffing of events for parents, frequency
of communications sent to parents and family members, and collaborations with offices and
partners across campus.
Even as more and more institutions are consolidating parent/family services into a dedicated
office (more than 23% of survey respondents indicated their program was established between
2010 and the first three months of 2015), we are seeing that parent/family contacts are dispersed
campus-wide, and parent/family staff consider themselves as close collaborators with multiple
offices on campus that work in some capacity with parents and families.
Indeed, there are examples of institutions with more than one office dedicated to a major
responsibility for parent/family relations. A student affairs unit might provide outreach and
communication about the student experience, while staff within the advancement/foundation
office or alumni affairs might focus on developing family affiliation and fundraising capacity.
The optimal reporting structure for parent/family programs continues to be illusive, as noted in
the survey results.
This year’s survey identified a continuing trend of communication with parents through the use
of technology and social networking, especially Facebook, and a decrease of parental
engagement through parent associations or councils. Most notable was a decrease in institutions
providing parents with membership in a non-advisory parents association, with a reduction from
69.2% in 2013 to 57.7% in 2015.

2015 National Survey of College and University Parent Programs 4
Introduction
When this survey was first conducted in 2003, parent/family services were a hot topic and highly
controversial in higher education. Many student affairs professionals at the time were worried
that providing communication and services for parents was detrimental to student development
and autonomy. Additional concerns included the dedication of scarce resources toward family
members, potentially drawing from time and funding that should be directed to students, and that
the beneficiaries of parent/family services were the privileged, to the detriment of lower
socioeconomic students and their families.
At the same time, however, higher education professional conferences (e.g., NASPA, ACPA,
NODA, CASE, NACADA, NACAC)1 were dedicating considerable time and research to the
topic of parents. Admissions offices were tweaking their publications and tours to address
parents’ questions and concerns, and orientation offices were scheduling parent/family
orientation sessions to supplement student orientation programs. Advancement offices were
looking at parents as one of the last untapped resources for fundraising. Annual campus events
for parents and families, which had been standard activities in the 1940s, ‘50s, and into the
1960s, were returning to campus, renamed from Mom’s and Dad’s weekends to Parent and
Family Weekend. Despite the concerns of many in higher education, programming and
messaging for parents was becoming standard.
A good number of skeptics continue to believe the only appropriate institutional response to
parents is a closed door, but much has changed. Traditional student development theory, focused
on fostering individuation and separation from family, has been challenged by research into
under-served populations, and it has become increasingly clear that normative student
development is affected by a student’s gender, ethnicity, social capital, and ability. Family theory
has entered the picture, with recognition that what is happening in a student’s family has a strong
effect on the student’s capacity to focus on academics or manage his/her daily affairs. Evidence
has emerged that students can be more successful when they have the support of their parents,
and lack of family support can be a barrier to college completion.
Over time, the field of parent/family relations has developed as its own professional area in
higher education. NASPA features a Parent and Family Relations Knowledge Community;
NODA has a Parent and Family Network. CASE offers annual parent fundraising programming.
1 NASPA (Student Affairs Professionals in Higher Education); ACPA (College Student Educators International); NODA
(Association for Orientation, Transition, and Retention in Higher Education); CASE (Council for Advancement and Support of
Education); NACADA (National Academic Advising Association); NACAC (National Association for College Admission
Counseling)

2015 National Survey of College and University Parent Programs 5
A dedicated professional organization, Association of Higher Education Parent/Family Program
Professionals (AHEPPP), has been formed with membership representing more than 150
colleges and universities. An independent Parent Fundraising Conference is held each summer.
Since 2011, parent/family programs has been a functional area within the Council for the
Advancement of Standards (CAS).
The purpose of this longitudinal, national survey is to track the development of parent/family
services over time. The results continue to illustrate significant change and growth in the field.
The goals of the survey remain much the same as in 2003, as we attempt to identify
best practices among college parent/family programs
emerging trends related to services and program structure
the influence of departmental placement within the institution on services provided
any discernible trends in the qualifications, experience, and pay scale of parent/family
staff

2015 National Survey of College and University Parent Programs 6
Method
An online survey of college and university parent/family programs from across the United States,
as well as Canada, was conducted over a three-month period. Invitations were issued through a
message to members of AHEPPP, through the LinkedIn account of the Summer Parent
Fundraising Conference, and to a list of email addresses identified as active accounts of college
and university parent/family programs. Approximately 500 colleges and universities were invited
to participate, and 223 responses were received (about 44 %).
The responses to this survey have been compared with data from previous national surveys
(2003, 2005, 2007, 2009, 2011, and 2013). Several additions and alterations were made to
questions this year to collect more accurate and useful data. A number of these changes were
made in response to emerging issues among parent/family programs within the past few years.
1. A new question was added, “Has the reporting structure for parent/family services
changed within the past two years?” with responses of yes, no, and unaware. A follow-up
question was open-ended, asking responders to identify how the structure was changed.
This question came from observations that restructuring of divisions, particularly within
student services offices, was altering the reporting structure, size of staff, or focus of
parent/family programs.
2. In a list of services and events provided to parents/families, a few changes were made. A
new item was added, asking if the institution provided communication with non-English
speakers/international parents. For those who provided communication in non-English
languages, follow-up questions asked who does the translation and what languages are
used. This stemmed from questions shared among parent/family programs in recent years
seeking ideas for improving communication with these populations of parents. The list of
services also clarified the provision of non-advisory parent/family associations and
advisory parent groups. For those with advisory groups, questions were asked about
whether membership includes an expected donation from the parent and, if so, what the
expected donation is. Dropped from the list of services was “webinars and chat rooms,”
which received few responses in past surveys.
3. Detailed information was requested relating to several programs and services, again due
to questions from parent/family staff in recent years. Frequency of print and email
newsletters was asked, and a question addressed about how many people receive those
newsletters. A question was asked about how offices obtain parents’ email addresses. We
asked respondents to estimate an average number of emails and phone calls they receive
from parents weekly. New questions about websites included who manages the
program’s website and how decisions are made about what is posted on the website. In-
depth questions were asked about parent/family weekend, including number of attendees,

2015 National Survey of College and University Parent Programs 7
registration costs, activities included in the weekend schedule, parent staff’s
responsibility for planning and implementing the weekend, and offices that collaborate on
planning and implementation.
4. Due to increased attention nationally to students who are themselves parents, we wanted
to know if parent/family programs are being asked to provide services for these students.
Two new questions addressed this issue: “Does your institution provide dedicated
services for students who are parents themselves?” (answer options were “Yes, in my
office,” “Yes, in another office,” “No,” and “I’m not aware”) and “Does your office
provide communication and services for the children, spouses, or partners of these
student-parents?”
5. To determine what professionals consider to be best practices in the work they do, we
have asked in the past for respondents to identify the program or service they are most
proud of. This year the wording was changed to ask what program or service they feel is
“the most successful in meeting program goals.”
6. Finally, we asked for details on programs’ role in crisis management. A question was
added asking if the parent program is represented on the institution’s crisis response
team, and we asked if the office distributes information to parents related to campus
emergencies.
The survey report does not include tabulations for statistical significance.

2015 National Survey of College and University Parent Programs 8
Results
The purpose of this longitudinal survey has been to collect information on the changing scope
and developing trends in services over time as parent/family programs have emerged on college
and university campuses. The focus of this survey was:
Organizational structure
Program demographics
Staffing parent/family program offices
Services and programming
Self-identified most/least successful services
Program budget
Advice and general comments from the professionals who are working with parents and
family members
Organizational Structure
An ongoing question related to parent/family programs in higher education is where the program
should be located within the institutional hierarchy. Since the survey has been conducted, the
most common options have been an office for student affairs or an advancement, foundation, or
alumni office. In 2015, slightly more than half (52.8 %) of programs responding were housed in
student affairs, strikingly similar to the first survey’s results when 52.3% of respondents said
their office was in student affairs. In that initial survey, more than a third (37.8%) were part of
advancement/foundation, alumni offices, and that percentage has decreased over time. In 2015,
29.2% of parent/family programs were in an advancement/foundation/ alumni office (Table 1).
Table 1: Placement of Parent/Family Services; 2003-2015
Office/Department 2003 2005 2007 2009 2011 2013 2015
Student affairs 52.4% 52.2% 54.7% 61.4% 58.3% 53.2% 52.8%
Advancement/foundation/
alumni
37.8% 31.5% 31.8% 17.8% 24.1% 26.3% 29.2%
Academic affairs 4.9% 2.2% 1.6% 7.3% 5.7% 6.5% 2.8%
Enrollment management n/a 3.8% 4.7% 5.4% 4.3% 5.9% 5.1%
University/college relations 2.4% 5.4% 4.2% 1.5% 2.4% 3.8% 4.5%
Other 2.4% 4.9% 3.0% 6.6% 5.2% 4.3% 5.6%
Where a parent/family office was located within the institutional structure was impacted by the
institution’s classification as public or private. Student affairs offices have always been the most
frequent reporting structure for parent/family programs at public institutions (Table 2).

2015 National Survey of College and University Parent Programs 9
Table 2: Placement of Parent/Family Services for Public Institutions: 2007- 2015
Office/Department 2007 2009 2011 2013 2015
Student affairs 73.6% 71.6% 74.1% 71.6% 78.7%
Advancement/foundation/alumni 15.4% 3.4% 8.1% 8.4% 8.0%
Academic affairs 2.2% 8.8% 6.3% 1.1% 2.7%
University/college relations 2.2% 0.7% 2.7% 8.4% 2.7%
Enrollment management 5.5% 6.8% 6.3% 1.1% 5.3%
Other 1.1% 5.4% 2.7% 4.2% 2.7%
For private institutions, placement was more commonly within advancement/foundation/alumni
offices, followed by student affairs offices (Table 3).
Table 3: Placement of Parent/Family Services for Private Institutions; 2007-2015
Office/Department 2007 2009 2011 2013 2015
Student affairs 34.5% 46.8% 42.1% 34.8% 32.4%
Advancement/foundation/alumni 50.5% 35.1% 43.2% 37.1% 46.4%
Academic affairs 0.0% 3.2% 5.3% 6.7% 0.0%
University/college relations 6.9% 3.2% 1.1% 4.5% 8.5%
Enrollment management 3.5% 3.2% 1.1% 5.6% 7.0%
Other 4.6% 8.5% 7.4% 7.9% 5.6%
Respondents were asked if there had been any changes in the reporting structure for
parent/family services at their institution in the past two years; 23.0% reported that there had
been changes. These changes included where or to whom the parent/family office reports, as well
as that the program itself was new, or additional staff had been hired to work with parents and
families.
Program Demographics
Parent/family programs, as they are now structured, are relatively new to higher education. Few
institutions among those responding to the 2015 survey (2.3%) reported having a parent/family
program prior to 1970. Periods of most notable growth were in the 1990s (12.5%), between
2000-2009 (29.6%) and between 2010-2015 (23.3%; Table 4).

2015 National Survey of College and University Parent Programs 10
Table 4: When Schools Started Parent/Family Services
Year Percent of Respondents
Before 1970 2.3%
1970-1979 7.4%
1980-1989 5.7%
1990-1999 12.5%
2000-2009 29.6%
2010-2015 23.3%
Slightly more programs represented public institutions (51.4%), compared to private institutions
(48.6%). Most were from four-year institutions (69.2%), with 28.8% designated as graduate or
professional institutions, and only 2.1% represented two-year institutions. When asked about the
size of the institution, 30.8% of respondents indicated they were from a small school; 40.4%
were from a mid-sized school, and 28.8% were from a large school. Self-described small schools
were more likely to be private (91.1%) while mid-sized and large schools were more likely to be
public (52.5% and 95.2%, respectively).
The survey asked respondents to report their state or province, and we assigned them to one of
the seven regions designated by NASPA (Table 5). As in previous surveys, institutions were
heavily weighted toward the eastern and middle portions of the nation, which include NASPA
Regions II, III, and IV-E.
Table 5: Region
Region2 Percent
Region I 4.9%
Region II 16.8%
Region III 25.9%
Region IV-E 28.7%
Region IV-W 8.4%
Region V 6.3%
Region VI 9.1%
2 NASPA Regions: Region I: Connecticut, Maine, Massachusetts, New Hampshire, Rhode Island, Vermont, Quebec, New
Brunswick, Newfoundland and Labrador, Nova Scotia, Prince Edward Island. Region II: Delaware, Maryland, New Jersey, New
York, Pennsylvania, Washington, D.C., West Virginia, the Bahamas, Puerto Rico, the Virgin Islands. Region III: Alabama,
Florida, Georgia, Kentucky, Louisiana, Mississippi, North Carolina, South Carolina, Tennessee, Texas, Virginia. Region IV-E:
Illinois, Indiana, Iowa, Michigan, Minnesota, Ohio, Wisconsin, Ontario. Region IV-W: Arkansas, Colorado, Kansas, Missouri,
Nebraska, New Mexico, North Dakota, Oklahoma, South Dakota, Wyoming, Manitoba, Saskatchewan. Region V: Alaska, Idaho,
Montana, Nevada, Oregon, Utah, Washington, Alberta, British Columbia. Region VI: Arizona, California, Hawaii.

2015 National Survey of College and University Parent Programs 11
Staffing Parent/Family Offices
We asked respondents if they were the primary contact person responsible for managing
parent/family services at their institution. Most respondents (84.7%) indicated that they were the
primary contact; this number was significantly lower than in the previous survey, when 94.0%
said they were the primary contact for families.
The percentage of respondents who worked full-time in parent/family services has increased to
38.2% in 2015. While this is not a major increase since the 2013 survey when 36.3% indicated
they worked full-time, it does show steady and significant increase over the years. The percent of
full-time parent/family staff was 30.3% in 2011 and 22.9% in 2009. The number of respondents
who worked half-time or less on parent/family services has been decreasing steadily over that
same timeframe. In 2015, 41.6% of respondents worked half-time or less on parent/family
services, compared with 44.5% in 2013, 53.1% in 2011, and 61.8% in 2009. The percentage of
respondents working more than half-time but less than full-time on parent/family services has
remained fairly consistent at 20.3%.
The person responsible for parent/family services was addressed by a variety of titles. The most
common was director (42.7%) followed by associate or assistant director (20.2%), and
coordinator (11.2%). Other titles included senior or executive director; parent liaison; and vice
president or assistant vice president. A relatively new designation, program manager, has begun
to show up.
As the field of parent/family services gains ground, longevity is becoming a factor among
professionals. Only 16.6% of respondents reported working in the field for less than one year;
38.6% for 1-5 years; 26.9% for 6-10 years, and 17.9% for more than 11 years.
The educational level of respondents has not changed dramatically over the past several years. In
2015, 34.5% had a bachelor’s degree or less, while 65.6% had an advanced degree (Table 6).
Table 6: Educational Background
Highest Degree
Earned
2003 2005 2007 2009 2011 2013 2015
High school 0.0% 3.6% 1.7% 1.2% 1.4% 1.6% 1.4%
Associate 0.0% 0.6% 1.7% 1.7% 0.0% 3.2% 0.7%
Bachelor’s 31.3% 37.1% 36.6% 24.0% 32.5% 28.7% 32.4%
Master’s 60.0% 49.1% 52.0% 59.5% 56.5% 55.3% 56.6%
Doctorate or
equivalent
8.8% 9.6% 8.0% 13.6% 9.6% 11.2% 9.0%

2015 National Survey of College and University Parent Programs 12
We asked participants to describe their career goals for the next five years. Nearly half (43.0%)
had no definite plans, which was a large increase from previous surveys. The remaining
respondents planned to retire from their position (16.2%), move to a different position in the
same institution (12.0%), move to a different position at a different institution (7.7%), leave
higher education (4.2%), or move to a similar position at a different institution (2.8%). Other
responses included staying in their current position and growing the program or working towards
a higher degree.
In 2015, the salaries of parent/family program staff ranged from less than $30,000 to $100,000 or
more, with 70% earning between $40,000 and $79,000. Only 2.9% earned less than $30,000, and
5.0% earned $100,000 or more. Overall, salaries increased slightly since 2013 (Table 7).
Table 7: Parent/Family Program Staff Salaries
Salary Range 2005 2007 2009 2011 2013 2015
Less than $30,000 9.9% 5.2% 3.4% 3.4% 2.2% 2.9%
$30,000-$39,000 21.2% 16.3% 13.6% 20.0% 15.6% 7.9%
$40,000-$49,000 19.3% 24.4% 26.8% 23.9% 28.3% 19.3%
$50,000-$59,000 22.4% 21.5% 17.4% 13.7% 18.9% 18.6%
$60,000-$69,000 11.2% 12.2% 9.4% 12.7% 11.7% 20.0%
$70,000-$79,000 5.0% 9.3% 10.2% 9.8% 8.9% 12.1%
$80,000-$89,000 5.0% 7.6% 7.2% 7.8% 3.9% 8.6%
$90,000-$99,000 2.5% 1.7% 3.4% 4.9% 2.2% 5.7%
$100,000 or more 3.7% 1.7% 8.5% 3.9% 8.3% 5.0%
In 2015, the median income for respondents with a bachelor’s degree was $60,000-$69,000;
those with a master’s degree, however, reported a salary of $50,000-$59,000. Respondents with a
doctorate or equivalent degree earned more, with a median income of $70,000-$79,000. As
Table 8 notes, the median for holders of a master’s degree has not shown improvement over
time, and those with doctorates have lost ground in the past few years.
A possible reason for the discrepancy in salary may be reporting structure. Staff in student affairs
offices had higher levels of education, but generally had lower salaries than staff working in
advancement and fundraising. Significantly more respondents had a master’s degree or higher if
they reported to a student affairs office (80.2%), compared to those that reported to an
advancement/foundation office (42.4%). Respondents from a student affairs office reported a
median salary of $50,000-$59,000, while those from an advancement/foundation office reported
a median salary of $60,000-$69,000.

2015 National Survey of College and University Parent Programs 13
Table 8: Median Salary by Educational Level
Highest
Degree
Earned
2007 2009 2011 2013 2015
Bachelor’s $40,000-
$49,000
$40,000-
$49,000
$40,000-
$59,000
$50,000-
$59,000
$60,000-
$69,000
Master’s $50,000-
$59,000
$50,000-
$59,000
$40,000-
$49,000
$50,000-
$59,000
$50,000-
$59,000
Doctorate or
equivalent
$60,000-
$69,000
$80,000-
$89,000
$80,000-
$99,000
$70,000-
$79,000
$70,000-
$79,000
A professional’s title reflected differences in salary as well. The median salary for a director was
$60,000-$69,000. Those whose title was assistant or associate director had a median salary of
$40,000-$49,000, and a coordinator or program manager reported a median salary of $40,000-
$49,000.
Of those who specified their major at the bachelor’s degree level, most reported degrees in the
fields of communication, languages, psychology and other social sciences, and
business/marketing. At the master’s level, most respondents who specified a major named a
degree in higher education administration or student affairs, education, or counseling. Nearly all
who specified a major at the doctorate/professional level named a degree in higher education
administration.
Services and Programming
Colleges and universities offered a variety of services for parents and family members. The most
common services in 2015 included parent website (100%); email response to parent questions
(100%); phone response to parent questions (98.3%); parent/family orientation (98.2%);
parent/family weekend (94.7%); email newsletter (94.7%); and social media, primarily through
Facebook (88.1%). Respondents were asked to indicate which parent services were provided
solely by the parent/family office, solely by another office on campus, or in collaboration with
the parent/family office and another office. This breakdown creates a clearer picture of the
complexity regarding how institutions provided parent/family services (Table 9).

2015 National Survey of College and University Parent Programs 14
Table 9: Services Provided by Parent/Family Office, Another Office, or in Collaboration
Service Provided Solely
Parent/Family
Office
Collaboration Solely Another
Office
Parent/family weekend 49.1% 39.1% 6.5%
Parent/family orientation 21.8% 55.9% 20.6%
Sibling weekends 3.0% 3.0% 11.5%
Move-in reception 27.3% 35.8% 8.5%
Other events 43.0% 24.4% 3.5%
Parent/family website 76.9% 21.9% 1.2%
Print newsletter 18.2% 5.5% 0.0%
Email newsletter 71.6% 20.7% 2.4%
Communications for non-English
speakers/international parents
10.4% 12.8% 12.8%
Facebook 70.2% 10.7% 7.1%
Twitter 34.5% 7.9% 6.7%
Pinterest 11.0% 2.5% 6.1%
Other social networking sites 21.1% 0.9% 4.4%
Phone response to questions 67.3% 29.2% 1.8%
Email response to questions 75.0% 23.8% 1.2%
Text response to questions 21.6% 9.6% 1.2%
Parent handbook 48.2% 22.2% 7.2%
Parent/family association/
organization (non-advisory)
47.0% 10.7% 4.2%
Parent advisory board or council 51.8% 9.6% 5.4%
Fundraising 25.0% 31.7% 26.2%
Gift/care packages; birthday cake or
other deliveries for students
13.7% 17.9% 42.3%
Parent/family calendar 43.7% 19.8% 3.6%
Along with the services listed above, respondents identified several additional services that were
provided by their office. These included events (summer send offs; regional events), social
networking sites (LinkedIn; Instagram), and parent involvement (ambassador programs;
volunteering).
Overall, the number of services that programs offer continues to be high, but there have been
decreases in several areas since 2013 (Table 10). It should be noted, though, that in the 2013
survey respondents reported very large increases in nearly all services; portfolios are generally
remaining steady after a surge of new programming between 2011 and 2013.

2015 National Survey of College and University Parent Programs 15
Table 10: Differences in Parent/Family Services; 2013-2015
Service Provided 2013-2015 differences
Parent/family weekend -2.6%
Parent/family orientation -0.2%
Parent website +1.0%
Print newsletter -1.6%
Email newsletter -0.9%
Facebook +13.8%
Phone response to parent questions -2.4%
Email response to parent questions -0.7%
Parent handbook +2.0%
Parent advisory board or council -4.7%
Parent/family association/
organization (non-advisory)
-11.5%
Fundraising +0.5%
Looking longitudinally across the past 12 years, the number of programs offering specific
services has generally been on the rise or fluctuated slightly. The only significant decrease since
2003 has been in the number of institutions that offer a print newsletter. Facebook continued to
climb as a common service for parents, as did Twitter (Table 11).
Table 11: Parent/Family Services: 2003-2015 (at institution; not specifically in parent office)
Service Provided 2003 2005 2007 2009 2011 2013 2015
Parent/family weekend 74.4% 96.0% 94.9% 89.8% 91.4% 97.3% 94.7%
Parent/family orientation 61.0% 97.0% 95.2% 97.1% 96.2% 98.4% 98.2%
Parent website 8.5% 89.0% 95.8% 94.3% 95.2% 99.0% 100%
Print newsletter 54.9% 56.0% 54.3% 41.1% 35.6% 25.2% 23.6%
Email newsletter -- 65.0% 73.0% 78.2% 90.3% 95.6% 94.7%
Facebook -- -- -- -- 56.6% 74.3% 88.1%
Twitter -- -- -- -- -- 35.7% 42.4%
Parent handbook 12.2% 75.0% 78.6% 76.1% 76.0% 75.8% 77.8%
Parent/family association/
organization (non-advisory)
-- -- -- 57.7% 62.1% 69.2% 57.7%
Parent advisory board or
council
36.6% 60.0% 65.4% 52.5% 62.4% 66.1% 61.4%
Fundraising 43.9% 84.0% 85.2% 74.8% 82.5% 82.4% 82.9%
2015 National Survey of College and University Parent Programs 16
When an institution develops a new parent/family program, the advice is to start with a limited
number of services, evaluate, and gradually add to the program’s portfolio. Therefore, the
expectation may logically be that long-term programs would be providing more services because
they have had time to establish comprehensive portfolios. That is not necessarily the case. In
some institutions, a parent/family office evolves out of services provided by other offices. For
example, parent/family orientation may be provided by a first-year programs office, and the need
for serving families beyond the first year later results in development of a full-fledged parent/
family program. Parent/family orientation, though, will likely stay with the first-year program
office. In time, more services may be developed by the new office or transferred in from other
units, or as demands on the new parent/family office become more clear, some services might be
transferred out for efficiency purposes or dropped altogether. To see how programs are evolving,
we compared services offered by the timeframe when the program was initiated (Table 12).
Table 12: Services by When Parent/Family Programs Were Established
Service Provided 1990s 2000s 2010-2015
Parent/family weekend 84.6% 96.9% 76.2%
Parent/family orientation 76.9% 87.5% 85.7%
Sibling weekend 7.7% 6.7% 11.1%
Move-in reception 53.8% 56.3% 57.9%
Other events 87.5% 40.0% 70.0%
Parent/family website 100% 100% 95.2%
Print newsletter 38.5% 12.5% 26.3%
Email newsletter 92.3% 93.8% 90.5%
Communications for non-English
speakers/international parents
23.1% 34.4% 26.3%
Facebook 92.3% 84.4% 85.0%
Twitter 53.8% 53.1% 31.6%
Pinterest 30.8% 9.4% 27.8%
Other social networking sites 27.3% 20.7% 13.3%
Phone response to questions 100% 96.9% 90.5%
Email response to questions 100% 100% 95.2%
Text response to questions 23.1% 40.6% 14.3%
Parent handbook 92.3% 77.4% 71.4%
Parent/family association/organization (non-advisory) 84.6% 59.4% 47.6%
Parent advisory board or council 38.5% 64.5% 61.9%
Fundraising 53.8% 51.6% 45.0%
Gift/care packages; birthday cake or other deliveries
for students
30.8% 31.3% 23.8%
Parent/family calendar 69.2% 59.4% 71.4%

2015 National Survey of College and University Parent Programs 17
While some of the differences in services offered were likely to be related to how long the
program has been in existence and growth over time, there also may be some services that were
surviving among older programs because of tradition or custom. A parent handbook, for
example, is much more likely to be produced (either online or in print) by a program that
developed in the 1990s. Similarly a non-advisory parent association is much more likely to be
found in a long-established program. Newer programs are likely to start up with services that
draw on the skills of the professional staff, and a young professional might have more experience
and expertise in web design and social media, making those a natural first step in programming.
It can’t be said, though, that older programs are not continuing to evolve. They are routinely
using technology in the form of email responses to parent questions and social networking.
The 2015 survey included more detailed questions than past surveys and yielded more in-depth
insights about parent/family services:
Parent newsletters and websites. Respondents who reported communicating by print and email
newsletters were asked how often these publications were sent and how many parents received
them. Nearly one-quarter (23.5%) reported sending a print newsletter more than once a semester,
while 38.2% sent the print newsletter once a semester and an equal number sent the print
newsletter once a year. The number of households that received the print newsletter ranged from
less than 50 to 40,000, with an average of about 9,000 households.
While a few respondents sent an email newsletter daily or weekly (2.7%), most sent it out
biweekly (12.4%), monthly (57.5%), or 2-3 times a semester (13.7%). Few sent it out just once a
semester (6.5%), 2-3 times a year (5.9%), or once a year (1.3%). The number of parents who
received the email newsletter ranged from 50 to 46,000, with an average of about 9,600 parents.
Institutions collected parent email addresses in a variety of ways. One-third (33.3%) received
addresses from an admissions office, 15.0% from an orientation office, 9.2% from a
foundation/fundraising office, and 28.1% have an opt-in system. Other collection methods
included during orientation and through a combination of offices.
Nearly three-fourths of survey respondents indicated that their institutions had a link for parents
on the front page of the college or university website (72.6%). While this number has increased
from some of our earlier surveys, it has been consistent since 2013. Of those who had a website
for parents, 87.8% said that the parent/family program office managed the website. Respondents
developed content for their parent/family website in collaboration with offices and departments
from across campus, as well as determining content themselves. Additionally, respondents
developed website content based on parent questions and feedback, as well as by looking at other
parent/family programs content and best practices in the field.

2015 National Survey of College and University Parent Programs 18
The front page of parent websites included a variety of information, the most frequently cited
being a welcome message; a mission statement; contact information; a calendar and event
information; links to campus resources and social media sites; articles, news stories, or timely
issues; involvement and giving opportunities; and emergency information.
Parent/family weekend. Parent/family weekends included a variety of events: sporting event
(65.7%); campus tours (48.9%); educational workshops (44.9%); cultural event (43.3%);
faculty/staff meet and greet (41.6%); art event (37.6%); featured speaker (24.7%); community
tours (16.3%); and service project (14.6%). Other events included 5k races, sibling events,
concerts, and tailgating parties.
Attendance at parent/family weekend events ranged from 50 individuals to more than 9,000,
although respondents reported that numbers were difficult to estimate. Institutions charged for
parent/family weekends in several ways. While some institutions developed a “menu” of options
and expenses for participants to choose from, others charged one overall fee, and some provided
a weekend that is free of charge. Of those who required a registration fee, charges were as low as
$10/family and as high as $130/individual.
Respondents were asked which offices they collaborated with in the planning and execution of
parent/family weekend (see Appendix 2). Most named multiple offices across campus. The most
commonly cited collaborators were student activities/organizations (including Greek Life and
ROTC); academic offices (including career planning, advising, and learning abroad); athletics;
and residential life (including housing, dining, and catering).
The majority of respondents said they were the primary coordinators of all parent/family
weekend events. Others were the lead coordinator but had the help of others. Some parent/family
program professionals did not lead the planning, but were part of a committee or had a
supporting role in the event, while others were only responsible for specific events during the
weekend.
Communications for non-English speakers/international parents. Of the 36% of respondents
who reported providing materials for non-English speakers/international parents, 47.2% offered
translated information. Materials were translated by faculty and staff from the institution’s
language departments, or translation was done under the guidance of the parent/family office by
students or by professional translators. Materials were primarily translated into Spanish and
Chinese.
Parent advisory boards. As noted above, 61.4% of respondents reported having a parent
advisory board or council. Of these, slightly more than half (51.6%) replied that there was a
required or expected donation for membership to the council. The majority of those with an
2015 National Survey of College and University Parent Programs 19
expected fee did not request a specific amount (27.7%). The others ranged in fee amount: under
$500 (19.1%); $1000-$1500 (21.3%); $2500 (14.9%); and $5000 or more (17.0%).
Student-parents. Few respondents (7.7%) provided services for students who are parents
themselves directly from their office. Another 30.3% reported that these services were provided
by another office, while 37.4% reported that these services were not provided and 24.5% were
unaware of such services. Only three programs that offered services for students who are parents
provided communications to spouses or partners of these students.
Emergencies. While fewer than half of the respondents said that their parent/family program
was represented on their institution’s emergency response team (45.9%), more than half reported
that their office distributed information related to campus emergencies (57.3%). Of those who
distributed information, most indicated using an electronic format, such as email (84.8%), a
social networking site (62.8%), or website updates (60.5%). Other respondents reported using
phone calls (12.8%) or text messaging (32.5%)
Resources and tracking. Respondents were asked what resources they used to guide their work
with parents. The top resources in 2015 were a mission statement (51.7%), assessments or
surveys of parents/families (42.1%), and input from a parent board/council (42.1%; Table 13).
The use of assessments and surveys has decreased significantly from 60.7% in 2013.
Table 13: Methods Used to Guide Work with Parents/Families
Guide ‘Yes’ responses
Assessments or survey of parents/families 42.1%
Mission statement 51.7%
Input from parent board or council 42.1%
Parent development/learning outcomes 21.3%
Student development/learning outcomes 21.9%
Vision statement 19.1%
Input from students 16.3%
In addition to what respondents were using to guide work with parents, we asked what kinds of
tracking, assessments, evaluations, or surveys were routinely conducted by the respondent. The
most commonly used was a participant survey following specific events (56.7%). Other methods
included website analytics (38.8%), surveys measuring satisfaction with communication and
programming (38.2%), logs of email and phone questions (35.4%), assessments determining how
parents use information (25.3%), and assessments to determine positive impacts of parental
involvement (11.2%).

2015 National Survey of College and University Parent Programs 20
Self-Identified Most/Least Successful Services
In previous surveys, parent/family program professionals were asked what service they were
most proud of and which service was the weakest. The wording was altered in 2015 to reflect the
wording of most and least successful service in meeting program goals. The greatest number of
respondents said their most successful service was parent/family orientation (34.7%), followed
by email newsletter (19.3%) and parent/family weekend (10.0%). When asked why they chose a
response as their most successful service, most respondents said it was because the service
provided pertinent information or introduced parents to campus resources. Further, respondents
felt services were successful because they reached the highest number of parents, encouraged
parental involvement, and provided interactions with other parents, staff, and faculty.
The services that respondents chose as their least successful were more dispersed among all
categories than the services that were chosen as the most successful. While the most successful
services were clear, with 64% of all responses falling into the three services mentioned above,
and nine services not selected by any respondents, the least successful services were spread out
across all options, with only 37% of responses falling into three services. The greatest number of
respondents said their least successful service was Twitter (15.2%), followed by a parent website
(10.9%), and Facebook (10.9%). When asked why they chose a response as the least successful
service, most respondents said it was because there was a low attendance or following by
parents. Further, respondents felt services were not as successful because they were not utilized
well, they were too difficult to maintain, and they were not impactful or relevant to program
goals (Table 14).

2015 National Survey of College and University Parent Programs 21
Table 14: Comparison of Most Successful/Least Successful Practices 2015
Service Provided Most
Successful
Least
Successful
Parent/family weekend 10.0% 6.5%
Parent/family orientation 34.7% 2.2%
Sibling weekend 0.0% 0.7%
Move-in reception 2.7% 5.1%
Other events 6.7% 2.2%
Parent/family website 3.3% 10.9%
Print newsletter 0.7% 3.6%
Email newsletter 19.3% 2.9%
Communications for non-English speakers/international
parents
0.0% 2.2%
Facebook 0.7% 10.9%
Twitter 0.0% 15.2%
Pinterest 0.0% 3.6%
Other social networking sites 0.0% 2.2%
Phone response to questions 3.3% 0.0%
Email response to questions 2.0% 0.0%
Text response to questions 0.0% 2.2%
Parent handbook 0.0% 2.9%
Parent/family association/organization (non-advisory) 0.0% 5.1%
Parent advisory board or council 6.0% 2.9%
Fundraising 4.0% 2.2%
Gift/care packages; birthday cake or other deliveries for
students
0.0% 6.5%
Parent/family calendar 2.0% 2.9%
Other 4.7% 7.2%
It is reasonable to consider that what is deemed successful might depend on the priorities of the
office to which a parent/family program reports. What is most valued in a student affairs
reporting structure (the most common reporting office for parent/family programs in public
institutions) may not be the same as what is most important to an advancement office (the most
significant reporting structure for parent/family programs in private institutions). A breakdown
of data shows that parent/family orientation was much more likely to be considered highly
successful in public institutions; email newsletters were also more highly ranked in public
colleges and universities. Among private institutions, the most successful programs were
identified as “other events,” which included summer send-offs and regional events; advisory
boards and councils; and fundraising activities (Tables 15 and 16).

2015 National Survey of College and University Parent Programs 22
Table 15: Most Successful Services 2015 for Public and Private Institutions
Service Provided Public Private
Parent/family weekend 9.3% 11.3%
Parent/family orientation 44.0% 25.4%
Sibling weekend 0.0% 0.0%
Move-in reception 0.0% 5.6%
Other events 4.0% 9.9%
Parent/family website 4.0% 2.8%
Print newsletter 1.3% 0.0%
Email newsletter 21.3% 16.9%
Communications for non-English speakers/international parents 0.0% 0.0%
Facebook 0.0% 1.4%
Twitter 0.0% 0.0%
Pinterest 0.0% 0.0%
Other social networking sites 0.0% 0.0%
Phone response to questions 1.3% 5.6%
Email response to questions 2.7% 1.4%
Text response to questions 0.0% 0.0%
Parent handbook 0.0% 0.0%
Parent/family association/organization (non-advisory) 0.0% 0.0%
Parent advisory board or council 1.3% 9.9%
Fundraising 1.3% 5.6%
Gift/care packages; birthday cake or other deliveries for
students
0.0% 0.0%
Parent/family calendar 1.3% 2.8%
Other 8.0% 1.4%

2015 National Survey of College and University Parent Programs 23
Table 16: Least Successful Services 2015 for Public and Private Institutions
Service Provided Public Private
Parent/family weekend 5.7% 7.7%
Parent/family orientation 1.4% 1.5%
Sibling weekend 0.0% 1.5%
Move-in reception 8.6% 1.5%
Other events 2.9% 1.5%
Parent/family website 4.3% 18.5%
Print newsletter 1.4% 6.2%
Email newsletter 4.3% 1.5%
Communications for non-English speakers/international
parents
1.4% 3.1%
Facebook 8.6% 13.8%
Twitter 15.7% 13.8%
Pinterest 4.3% 3.1%
Other social networking sites 2.9% 1.5%
Phone response to questions 0.0% 0.0%
Email response to questions 0.0% 0.0%
Text response to questions 2.9% 1.5%
Parent handbook 1.4% 4.6%
Parent/family association/organization (non-advisory) 5.7% 4.6%
Parent advisory board or council 2.9% 3.1%
Fundraising 2.9% 1.5%
Gift/care packages; birthday cake or other deliveries for
students
8.6% 4.6%
Parent/family calendar 4.3% 1.5%
Other 10.0% 3.1%
Program Budget
When asked about their annual budget, excluding salary and benefits, the most common response
from parent/family program professionals was that their program had no formal budget (27.1%).
Parent/family program budgets have shifted in 2015. Programs with a budget under $25,000
decreased from 34.1% in 2013 to 23.6% in 2015. On the other hand, programs with a budget
between $25,001-$100,000 increased from 16.5% in 2013 to 43.3% in 2015. Programs with a
budget of more than $100,001 decreased from 21.2% in 2013 to 12.5% in 2015 (Table 17). As
may be expected, the majority of schools with big budgets (more than $100,000) are designated
as large universities, which tend to be public institutions.

2015 National Survey of College and University Parent Programs 24
Table 17: 2015 Annual Budget
Just under three-fourths (62.9%) of respondents reported that their funding came from
college/university allocation. Other funding sources included funds from events (21.9%),
donations and gifts (17.4%), and parent/family memberships (11.8%). Institutions with a bigger
budget (more than $100,000) used additional sources of funding at a higher frequency, while
institutions with a lower budget tended to rely on college/university allocation.
Fewer than 15% of respondents reported that the parent/family program at their institution
required a membership fee from parents; 11.3% required a fee for some services, while 3.3%
required a fee for all services. This fee varied greatly by institution. Some charged a one-time
fee, which ranged from $55 to $150, while others charged an annual fee that ranged from $20 to
$200.
Professional Advice and General Comments
When asked why they chose the parent/family field as their profession, several respondents said
they enjoy working with families of college students and see the value in parental involvement.
Several others said that it was not their choice, and the field “found them” or that working with
parents was part of their larger job description. Yet others work in the field because it was the
next logical step in their career or they saw it as an opportunity to advance and learn a new part
of higher education.
When asked what professional organizations they belonged to, 38.2% of the respondents named
AHEPPP. Another 24.7% named NASPA. CASE was named by 15.2% of the respondents and
NODA was named by 11.2%.
Responses to a question about which professional conferences respondents attended were similar
to the above: AHEPPP (31.5%); NASPA (15.2%); CASE (10.1%); and NODA (9.6%); with an
additional 5.1% naming the Parent Fundraising Conference.
Budget Percentage
No formal budget 27.1%
Less than $10,000 11.1%
$10,001-$25,000 12.5%
$25,001-$50,000 17.4%
$50,001-$100,000 19.4%
$100,001-$250,000 8.3%
More than $250,000 4.2%

2015 National Survey of College and University Parent Programs 25
To learn more about professional organization membership and conference attendance, we asked
what factors influenced the decision to join an organization and attend a conference. The most
important factor to join a professional organization was access to professional conferences or
other educational opportunities (48.9%), followed by opportunities for involvement or
professional development (41.0%), institutional support of organization (40.4%), cost of
membership (39.9%), access to other professionals or listservs of professionals (37.6%), ongoing
communication (32.6%), resources available to members (32.0%), and access to a professional
journal (12.9%).
The most important factor to respondents when choosing to attend a conference was cost
(55.1%), followed by timing of the conference (51.7%), details about program sessions (51.1%),
location (46.1%), and the keynote speaker (11.2).

2015 National Survey of College and University Parent Programs 26
Discussion
Colleges and universities are continuing to develop parent/family offices and expand programs
and services for parents and family members. Just as the environment of higher education has
changed in recent years, the portfolio of services for parents and families is also changing.
Technology has influenced the methods and frequency of parent/family communication, with
more reliance on online media and a decrease in print. At the same time, in-person contact for
family members has increased as parent/family orientation, parent/family weekend, and other
events have become popular.
With a growing reliance on technology, the use of social media and online communication for
parents has blossomed. When the survey was conducted in 2007, Facebook group pages had not
yet been introduced. At that time, Facebook was strictly for individuals, and it was
overwhelmingly a youth-oriented media. Since 2009, the number of institutions hosting social
media sites for parents and families has grown from about half to more than 80%.
Parent/family pages on institutional websites have become widespread. This year, 100% of
respondents said that their college or university hosts parent information websites, and in
growing numbers, the responsibility for parent sites are falling to the parent/family program.
Technology, however, remains a significant challenge for the staff running parent/family
programs. Technology-based services ranked least successful among respondents, including
parent websites, Facebook, and Twitter. Respondents said that websites can be difficult to
update, Twitter appears not to be appealing to parents, and Facebook creates online communities
that can become problematic. It is notable that a handful of respondents mentioned difficulties
with having a Facebook group, as opposed to a Facebook page. Facebook defines a page as a
public presence, similar to an individual profile, that is visible to the public and should be the
official representation of the business or organization that is using the page. A group, on the
other hand, is a place for small groups of people to share common interests and opinions,
specifically around a common cause, an activity, or an issue. Concerns with Facebook groups
include being unable to control the content, parents using the space to complain, and parents
violating FERPA and student privacy through postings. In future surveys, we will look more
deeply into the differences between the benefits and challenges of Facebook pages and groups.
Another area of concern relates to how parent/family programs are assessing their work. A large
decline in the use of surveys and assessments was noted this year. In the 2013 report, just slightly
more than 60% of respondents indicated they used surveys and assessments to guide their
program; this year, only 42% said they are using these methods. At a higher education institution
decisions about budgets and priorities are often based on data, and parent/family programs
should be prepared to show evidence of how their programs are used and how not only parents

2015 National Survey of College and University Parent Programs 27
but students benefit from the services provided. Tracking parent questions and comments allows
staff to identify topics of major concern and respond to changing trends. For example, while
previous data may have indicated that the top issue for families two years ago was career
preparation, this year’s parents might be more focused on campus safety. By maintaining
updated assessment strategies, staff can adjust to the current needs of families, proactively
communicate on trending topics, and use resources most effectively.
Moreover, assessment allows parent/family programs to focus on those programs and services
that are used most effectively. As an example, a program may decide to communicate through a
Twitter account because other offices on campus are having success with it, but parents may not
have or use Twitter accounts.
As the field of parent/family relations matures, we continue to look for indications of
predictability on where parent/family programs are housed within higher education institutions.
To date, that has not happened. The split continues between student affairs and
fundraising/advancement reporting structures, with programs also being assigned to enrollment
management, academic affairs, and other offices.
We note that a pattern may be developing indicating that parent/family programs and services are
increasingly assigned to multiple offices at the same institution. This year’s survey seems to
show that responsibility for parents and families is either shared among offices through
collaboration, or specific services for parents and families are handled by separate units.
We used somewhat different language in the 2013 and 2015 surveys that complicates the
interpretation of these results. In 2013, the question was worded as “What parent services do
your office/does your institution provide for parents?” followed by a list of parent/family
services and events, and possible responses for each item on the list indicating “by my office,”
“by another office,” or “not provided.” Respondents to the 2013 survey indicated that the choices
offered meant they were unable to note that some services were provided in collaboration with
other offices on campus. In 2015, the question remained “What parent/family services does your
office/your institution provide?” with possible responses being that the services were offered
“solely my office,” “in collaboration,” and “another office.”
Collaboration emerged as a major factor in provision of services and events. As an example,
2013, 74.7% said parent/family weekend was provided by their office and 22.6% said it was
provided by another office. In this year’s survey, however, 49.1% said parent/family weekend
was solely the responsibility of their office, and 39.1% said it was a collaboration, with 6.5%
saying it was provided solely by another office. This will warrant further examination in future
surveys to determine whether responsibilities are shifting to or away from the parent/family
program, or if collaboration increases.

2015 National Survey of College and University Parent Programs 28
Further Research/Additional Questions
With recent attention being given to job classification and job family studies in higher education,
it appears that job titles and reporting lines of parent/family staff are changing. In future surveys,
it will be necessary to include “program manager” as a position title to reflect the tendency, and
more detailed questions might be added to explore reporting structures and responsibilities more
deeply.
In response to questions from parent/family professionals, we asked for detailed information on
parent/family weekend planning and implementation. The same level of detail can be sought
regarding parent/family orientation programming, which appears to draw upon significant
collaboration with offices other than parent/family programs.
It will be important to look more closely at the use of Facebook, as the most commonly used
form of social media, and explore the differences between the types of pages used by
parent/family programs. As programs create online communities, are they taking responsibility
for how those communities function?
The question on assessment requires more specific inquiry on how programs are assessing their
work. Without data, how do programs determine what programming and services to provide?
What might make it easier for parent/family staff to conduct and use assessment?
In our past surveys, we have asked what programming and services are provided. Questions
could be included to seek information on what respondents see as needs or wishes. What would
they like to provide, but can’t? What restricts them from turning new ideas into action?

2015 National Survey of College and University Parent Programs 29
Appendix 1: Survey Questions
1. Are you the primary contact person who most closely manages parent/family services at your
college/university?
Yes
No
2. What is your title?
Director
Associate director
Assistant director
Coordinator
Program manager
Dean
Associate dean
Assistant dean
Other (open)
3. What percentage of a 40-hour work week are you dedicated specifically to parent/family
services?
Half-time or less
More than half-time but less than three-fourths
More than three-fourths but less than full-time
Full-time
4. If your position includes duties besides parent/family services, what other responsibilities do
you have? (open)
5. What area or department do you report to at your institution?
Student affairs/student life or equivalent
Foundation/advancement/fund development
Alumni association
Academic affairs
University/college relations
Enrollment management
Other [please specify]

2015 National Survey of College and University Parent Programs 30
6a. Has the reporting structure for parent/family services changed within the past two years?
Yes
No
Unaware
6b. [if6a=yes] How has the reporting structure changed? (open)
7. Please indicate the number of full-time, part-time, and student staff working on parent/family
services in your office, including yourself (matrix)
8. When was your parent/family program established? Some institutions had a parent/family
program historically, but discontinued it for a period of time. Please answer based on your
current parent/family program.
Before 1970
1970-1979
1980-1989
1990-1995
1995-1999
2000-2005
2006-2010
2011
2012
2013
2014
2015
Don’t know
9. What parent/family services does your office/your institution provide? (indicate whether each
service is offered solely by the parent/family office, a collaboration between the parent/family
office and another office on campus, solely by another office on campus, or is not provided)
Parent/family orientation
Parent/family weekend
Sibling weekend
Move-in reception
Other events (list below)
Website for parents/families
Print newsletter
Email newsletter
Communications with non-English speakers/international parents

2015 National Survey of College and University Parent Programs 31
Phone response to parent/family questions
Email response to parent/family questions
Texting response to parent/family questions
Parent/family handbook or parent guide
Parent/family association/organization (non-advisory)
Parent advisory board or council
Fundraising from parents
Gift/care packages; birthday cake or other deliveries for students
Parent/family calendar
10. Are there any other parent/family services or events offered by your office? (open)
11a. [if print newsletter was selected in 9] Approximately how often do you send out your
PRINT newsletter?
More than once a semester
Once a semester
Once a year
11b. [if print newsletter was selected in 9] Approximately how many parents receive your
PRINT newsletter? (open)
12a. [if email newsletter was selected in 9] Approximately how often do you send out your
EMAIL newsletter?
Daily
Weekly
Biweekly
Monthly
2-3 times a semester
Once a semester
2-3 times a year
Once a year
12b. [if email newsletter was selected in 9] Approximately how many parents receive your
EMAIL newsletter? (open)
12c. [if email newsletter was selected in 9] How do you obtain parent email addresses?
From the admissions office
From the orientation office

2015 National Survey of College and University Parent Programs 32
From the foundation/fundraising office
Parents must opt in and send me their email addresses
Other
13a. [if website was selected in 9] Does your parent/family program office manage the parent
website?
Yes
No
Unaware
13b. [if 13a=yes] How do you choose/obtain content for your website? (open?)
13c. [if website was selected in 9] What types of information do you have on the FRONT PAGE
of your parent website? (open)
13d. [if website was selected in 9] On the front page of your institution's website, is there a link
designated for parents/families?
Yes
No
14a. [if parent/family weekend (collaboration) was selected in 9] What offices do you collaborate
with on parent/family weekend? (open)
14b. [if parent/family weekend was selected in 9] What is your role in the planning and
execution of parent/family weekend? (open)
14c. [if parent/family weekend was selected in 9] Which of the following events did you have at
your most recent parent/family weekend (select all that apply):
Educational workshops/courses
Art event
Cultural event
Sporting event
Campus tours
Community tours
Service projects
Featured speaker(s)
Faculty/staff meet and greet
Other (open)

2015 National Survey of College and University Parent Programs 33
14d. [if parent/family weekend was selected in 9] Approximately how many individuals attended
your most recent parent/family weekend? (open)
14e. [if parent/family weekend was selected in 9] How much did you charge for your last
parent/family weekend (please indicate cost per family or participant; open)
15a. [if Communications with non-English speakers/international parents was selected in 9] Do
you translate materials for non-English speakers?
Yes
No
15b [if 15a was yes] How do you translate materials? (who helps you translate materials?) (open)
15c [if 15a was yes] Into what language(s) do you translate materials? (open)
16a. [if parent advisory board was selected in 9] Is there a required or expected donation for
membership in your parent advisory board?
Yes
No
Unaware
16b. [if yes was selected in 16a] How much is the required or expected donation? (open)
17a. Does your institution provide dedicated services for students who are parents themselves?
Yes, in my office
Yes, in another office
No
Unaware
17b [if 17a=yes] Does your office provide communication and services for the children, spouses,
or partners of these student-parents?
Yes
No
Unaware
18. Of the services your institution provides to parents/families, what service is the MOST
successful in meeting your program goals?
Parent/family orientation
Parent/family weekend
Sibling weekend

2015 National Survey of College and University Parent Programs 34
Move-in reception
Other events (list below)
Website for parents/families
Print newsletter
Email newsletter
Communications with non-English speakers/international parents
Phone response to parent/family questions
Email response to parent/family questions
Texting response to parent/family questions
Parent/family handbook or parent guide
Parent/family association/organization (non-advisory)
Parent advisory board or council
Fundraising from parents
Gift/care packages; birthday cake or other deliveries for students
Parent/family calendar
19. Why is this service the most successful? (open)
20. Of the services your institution provides to parents/families, what service do you feel is the
LEAST successful in meeting your program goals?
Parent/family orientation
Parent/family weekend
Sibling weekend
Move-in reception
Other events (list below)
Website for parents/families
Print newsletter
Email newsletter
Communications with non-English speakers/international parents
Phone response to parent/family questions
Email response to parent/family questions
Texting response to parent/family questions
Parent/family handbook or parent guide
Parent/family association/organization (non-advisory)

2015 National Survey of College and University Parent Programs 35
Parent advisory board or council
Fundraising from parents
Gift/care packages; birthday cake or other deliveries for students
Parent/family calendar
21. Why is this service the least successful? (open)
22a. Does your parent program require a membership fee from parents?
No, all services are free
Yes, for some services
Yes, for all services
22b. [if 20=yes] What is the fee? (please indicate if this is an annual or one-time fee; open)
23. On average, how many phone calls or emails do you receive from parents each week? (open)
24. Is the parent/family program represented on your institution’s crisis response team?
Yes
No
25a. Does your office distribute information related to campus emergencies?
Yes
No
25b. [if 25a is yes] How do you distribute campus emergency information? [check all that apply]
Website
Social networking sites (Facebook; Twitter; Pinterest)
Text messaging
Phone calls
Other________
26. What kinds of tracking, assessments, evaluations, or surveys do you routinely conduct?
(check all that apply)
Logs of email and phone questions
Participant surveys following a specific event
Satisfaction surveys, measuring parent/family satisfaction with communications, events,
and activities
Assessments to determine how parents/families use information provided through
communications, events, and activities

2015 National Survey of College and University Parent Programs 36
Assessments to determine effect of parental/family involvement on student success,
retention, graduation
Website analytics to track which pages get the most traffic
Other (please describe)
27. Do you routinely guide your work with parents/families using (check all that apply)
A vision statement for parent/family services
A mission statement for parent/family services
Student development or learning outcomes
Development or learning outcomes specific to parents/families
Assessments or surveys of parents and family members
Input from a parent board or council
Input from students
Other (please describe)
28. For what type of institution do you work?
Public college/university
Private college/university
29. What is the scope of your institution?
Two-year
Four-year
Graduate- or professional-degree granting
30. How does your institution describe itself related to size?
Small school
Mid-sized school
Large school
31. In what state or province are you located? (open)
32. Excluding salary and benefits, what is your annual budget for providing parent/family
services?
No formal budget
Less than $10,000
$10,001-$25,000
$25,000-$50,000
$50,001-$100,000
$100,000-$250,000
Over $250,000

2015 National Survey of College and University Parent Programs 37
33. Where does your funding come from? (Check all that apply)
College/university allocation
Generate funds from donations and gifts
Generate funds from parent/family memberships
Generate funds from events
Other
34. How long have you worked with parent/family services?
Fewer than six months
Six months to one year
One year
Two years
Three years
Four years
Five years
Six to ten years
Eleven to 20 years
21 or more years
35. What is your educational background - highest degree received?
High school
Associate degree
Bachelor’s degree
Master’s degree
Doctorate or equivalent
36. What was your educational major? (open-ended question; respondents are asked to indicate
major at the associate, bachelor, master, and doctorate/professional levels)
37. What is your salary range? (Notation about anonymity)
Less than $30,000
$30,000 to $39,000
$40,000 to $49,000
$50,000 to $59,000
$60,000 to $69,000
$70,000 to $79,000
$80,000 to $89,000
$90,000 to $99,000
$100,000 or above
38. Why did you choose to work in parent/family services? (open)

2015 National Survey of College and University Parent Programs 38
39. Please describe your career goals for the next five years.
I plan to move to a different position at my current institution
I plan to move to a similar position at another institution
I plan to move to a different position at a different institution
I plan to leave higher education
I plan to retire from my position
No definite plans
Other [open-ended]
40. What professional organizations do you belong to, and what conferences/workshops do you
attend? (open)
41. What factors influence your decision to join a professional organization? (Check all that
apply)
Cost of membership
Institutional support of organization
Access to journal(s)
Access to professional conferences or other educational opportunities
Opportunities for involvement or professional development
Ongoing communication (e.g., e-newsletter)
Access to other professionals or listservs of professionals
Resources available to members (survey reports; support for research; scholarships or
grants)
Other
42. What factors influence your decision to attend a professional development conference?
(Check all that apply)
Location
Keynote speaker
Cost
Details about program sessions
Timing of conference
Other
43. Please include any other comments you may have. (open)

2015 National Survey of College and University Parent Programs 39
Appendix 2: Parent/Family Weekend Collaborators
Most schools/colleges and departments on campus.
First Year Experience, Student Activities, Alumni (our parent weekend and alumni
weekend are the same weekend so we work together)
Academy
Events
About 40 other offices across campus
Residence Life, Student Life, Athletics, Alumni, Advising, Off Campus Student Services
Music Department; Food Service; Academics; Athletics
Athletics, Music, Faculty, Dining Services, President's Office, Slater International,
Museum, Religious Life, career center
Alumni Relations
It is a university event - we collaborate with the Moms and Dads Associations, which are
not part of the university
Student Life
All academic units, residential life, student services, student life, etc.
Student Diversity and Inclusion, Dean of Students Office, Residence Life, Academic
Affairs, Campus Life, Study Abroad, Athletics - additionally we have an
interdepartmental planning team including Auxiliary Services and Campus Safety
University Events, Union programming
Office of Student Activities, Athletic (But they are all Student Affairs)
Career Center, Alumni Association, Campus Recreation, ROTC, Library, Housing,
Dining, Campus Ministries, Public Affairs, Athletics
Schools & colleges, libraries, museums, student organizations, athletics
Catering, academic affairs, student activities programming board, Chancellor's Office,
Alumni Office, Advancement Office
Orientation, Arts & Sciences, Multicultural Affairs, Student Leadership & Involvement,
Disability Resources for Students, Residence Life, First Scholars, Alumni, Athletics
Housing, Union, Alumni Association, Business Improvement District, University
Relations, University Bookstore, Schools and Colleges
Student Involvement
Student organization office, Alumni Relations, Athletics, Catering
Arkansas Alumni Association, Advising within colleges, Athletics, Arkansas Union,
Admissions, Center for Community Engagement, Campus Dining, Associated Student
Government
Academic affairs
Division of Student Affairs lead initiative involving most of the Division for Academic
Departments as well as University Administration., and Athletics

2015 National Survey of College and University Parent Programs 40
Office of Alumni Relations (we combine with Homecoming)
Several: Career development, athletics, academic units, student performers, catering,
student programming council
Dean of Students, Career Planning
Student programming board
All in Student Affairs (they volunteer to help with check-in) and orientation
Orientation, Admissions
N/A
We lead the planning, but Alumni Relations holds Reunion Weekend at the same time, so
we have developed a collaborative event along with our Student Life Office.
Recreation services, university housing, academic affairs, rotc, athletics
Provost, First Year Experience, Residence Life, Alumni Association, Community
Tourism Board
Alumni Relations (we have Homecoming & Family Weekend) and Campus Events
Academic departments, theater, student life, career development, actually all
departments. We put out a general call, and see who responds.
Student Activities, Provost Office, Athletics
Academic departments, campus recreation, campus dining, mail center, libraries,
multicultural, fraternity and sorority life- 51 different campus partners
Student activities, athletics, president's office, admission, residence life
Varies
Many provide components of it such as: Academic Colleges, Dean of Students Office,
Library, Academic Success Center, Recreation, Visitors Center, PNC Bank, Dining,
Career Center, Redfern Health Center, LGBTQ Office, Athletics, Connections
(undergraduate mentoring group), Fraternity and Sorority Life
College offices for receptions, music department, student organizations, activities office,
medical clinic, off-campus vendors
(This is an evening, not a weekend) President, Career Services, Advising, Deans/Schools
Office of campus life, office of development, dean of students, housing and dining, career
services departments
2 or 3
SGA, Res life, student groups
Student Life
About everyone...Academic Departments, President's Office, Athletics, many offices in
Student Life, First Year Experience, etc., etc.
the six colleges and international office
The Office of Student Activities & Greek Life
Educational outreach and student services office
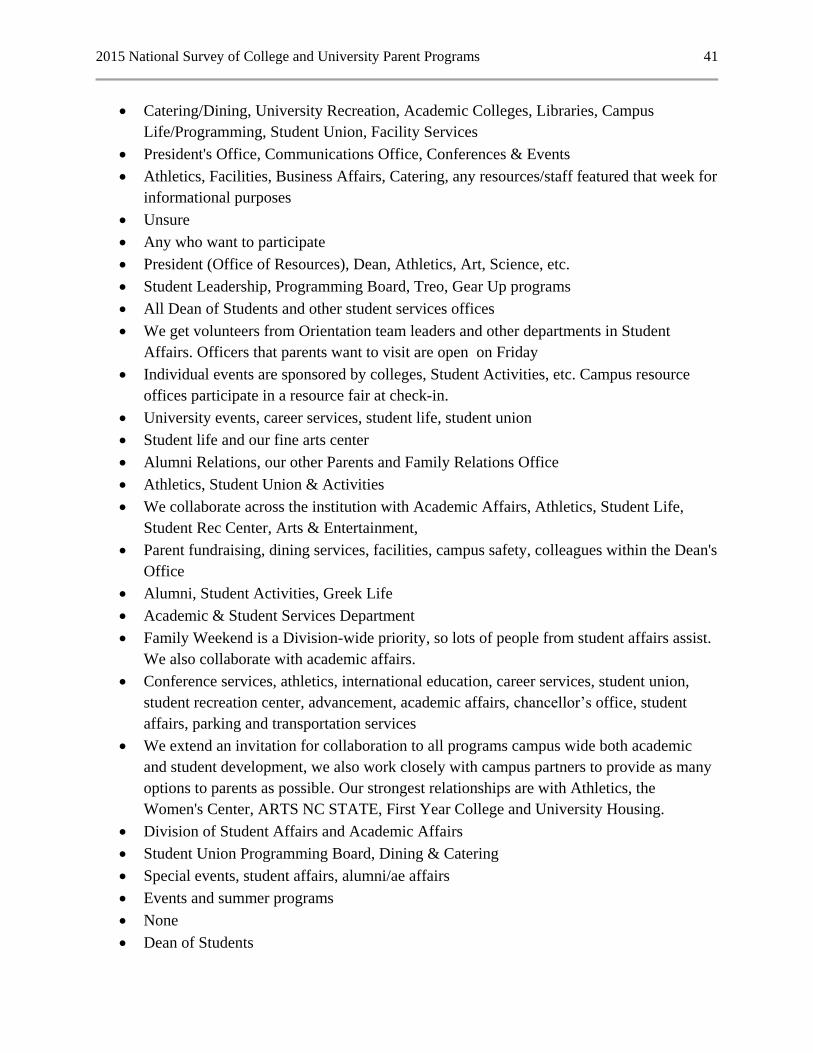
2015 National Survey of College and University Parent Programs 41
Catering/Dining, University Recreation, Academic Colleges, Libraries, Campus
Life/Programming, Student Union, Facility Services
President's Office, Communications Office, Conferences & Events
Athletics, Facilities, Business Affairs, Catering, any resources/staff featured that week for
informational purposes
Unsure
Any who want to participate
President (Office of Resources), Dean, Athletics, Art, Science, etc.
Student Leadership, Programming Board, Treo, Gear Up programs
All Dean of Students and other student services offices
We get volunteers from Orientation team leaders and other departments in Student
Affairs. Officers that parents want to visit are open on Friday
Individual events are sponsored by colleges, Student Activities, etc. Campus resource
offices participate in a resource fair at check-in.
University events, career services, student life, student union
Student life and our fine arts center
Alumni Relations, our other Parents and Family Relations Office
Athletics, Student Union & Activities
We collaborate across the institution with Academic Affairs, Athletics, Student Life,
Student Rec Center, Arts & Entertainment,
Parent fundraising, dining services, facilities, campus safety, colleagues within the Dean's
Office
Alumni, Student Activities, Greek Life
Academic & Student Services Department
Family Weekend is a Division-wide priority, so lots of people from student affairs assist.
We also collaborate with academic affairs.
Conference services, athletics, international education, career services, student union,
student recreation center, advancement, academic affairs, chancellor’s office, student
affairs, parking and transportation services
We extend an invitation for collaboration to all programs campus wide both academic
and student development, we also work closely with campus partners to provide as many
options to parents as possible. Our strongest relationships are with Athletics, the
Women's Center, ARTS NC STATE, First Year College and University Housing.
Division of Student Affairs and Academic Affairs
Student Union Programming Board, Dining & Catering
Special events, student affairs, alumni/ae affairs
Events and summer programs
None
Dean of Students

2015 National Survey of College and University Parent Programs 42
Student orientation, academic affairs, parking and traffic, University bookstore,
Chancellor's cabinet, community service office, local town offices, restaurants and
businesses, food services, Library, SGA
Dining, Athletics, Student Center, Residential Colleges
Athletics, Parking Services, University Bookstore, Fine Arts, our local chamber for a
Wine Walk in the city
Athletics
Residence life and our office.
Academics, Rec Sports, Student Organizations
Alumni Relations - we do Homecoming and Family Weekend as a joint event
Alumni, academic offices, student government
Major programs and events office, community service office, athletics, local museum
All! Athletics, Music & Fine Arts, Student Activities, Career Development, Res Life,
President's Office, Workshop, Admissions, Campus Store, Ministry...
Student Activities
Primarily student life and alumni/advancement, but also with many other offices who
provide either events/programming or support services.
Alumni relations, advancement, student life, student affairs, athletics -- we coincide with
homecoming
Athletics, theatre, faculty, student services departments
Multicultural Center, Greek Life, Student Organizations, Residence Life, Student
Volunteerism, Wellness Center, Athletics
Student Government events
Student Life, Dining Services, Music, Athletics, Health and Wellness, Residence Life
Development and Alumni Relations
Campus Recreation, Student Activities, Alumni, Academic Colleges
Student Involvement and Leadership, New Student Orientation & Support Programs,
Dean of Student Affairs, Transportation, Campus Dining, Athletics, Alumni Relations,
Student Communications
University Relations, Student Leadership and Activities, Alumni/Development
Financial Aid, Outreach, Housing
Alumni Office, Parent Giving Office
Advising, colleges, career centers, learning abroad, health service, athletics, dining
services, concerts and events
Student Affairs, University Ministry and Service, University Events
Student Orientation, Food Services, Academic Affairs, Parking & traffic, Arts & Cultural
programs, Chancellor's office, Athletics
Facilities, student activities, athletics, President's office
Student Affairs

2015 National Survey of College and University Parent Programs 43
New Student office
Campus event services, admissions, enrollment services
None - all events are planned independently
Athletics, music, catering, admissions, student life, student activities council, and any
others that request
All student affairs.
New Student and Family Services
Dining Services, Facilities Services, Media Services, Marketing, Development,
University Press, University Post Office, Music Department
Academic, deans, athletics, student activities, dining services, development, career
services, security...ALL
Student Life
Student Affairs and College Events
Student Activities, University Ministry, and Athletics
Outdoor Rec, Student Services, Admissions, Advancement, Athletics
Alumni Relations
Recruitment Office and Resident Enrollment staff
Student Life
Student Life, Housing, Admissions
A student organization called Student Foundation
All across campus
All of campus- family weekend is also homecoming
Institutional Advancement and Student Activities
Special Events & Protocol
Student Activities