National Statement of Housing Supply and Demand … Housing Agency wishes to acknowledge the...
48
National Statement of Housing Supply and Demand 2016 and Outlook for 2017-18 February 2017
Transcript of National Statement of Housing Supply and Demand … Housing Agency wishes to acknowledge the...

National Statement of Housing Supply and Demand 2016 and Outlook for 2017-18
February 2017

Published by: Housing Agency.
Publication date: February 2017
ISBN: 978-1-903848-39-5
Contact Details Housing Agency,53 Mount Street Upper,Dublin 2D02 KT73
01 656 [email protected] www.housingagency.ie@HousingAgencyIE

Chairman’s Foreword 3
Executive Summary 4
Chapter 1: Introduction 7
Chapter 2: Housing Supply 8
2.1 Completions 8
2.2 Residential sales trends 9
2.3 Rental trends 12
2.4 Indicators of Future Housing Supply 13
Chapter 3: Current and future housing demand 16
3.1 Population and household formation 16
3.2 Housing stock 19
3.3 Tenure 22
3.4 Minimum Future Housing Requirements 24
3.5 Social Housing Requirements 26
Chapter 4: Affordability 29
4.1 Housing costs as a percentage of income 29
4.2 Employment and household income 34
4.3 Mortgage arrears and repossessions 36
Appendix I Policy Developments 38
Housing legislation 38
Taxation 40
Mortgage Lending 42
Social housing delivery mechanisms 43
Contents
The Housing Agency is a statutory body set up to work with and support local authorities, approved housing bodies and the Department of Housing, Planning, Community and Local Government in the delivery of housing and housing services. It also serves as the interim Regulator of Approved Housing Bodies. It brings together a wealth of practical, research and technical expertise to offer a broad base of services. The Agency’s vision is to enable everyone to live in good quality, affordable homes in sustainable communities. The Agency understands that housing plays a key role in people’s quality of life and life chances.
The Housing Agency wishes to acknowledge the assistance of Future Analytics in the preparation of this report.
1National Statement of Housing Supply and Demand 2016 and Outlook for 2017-18
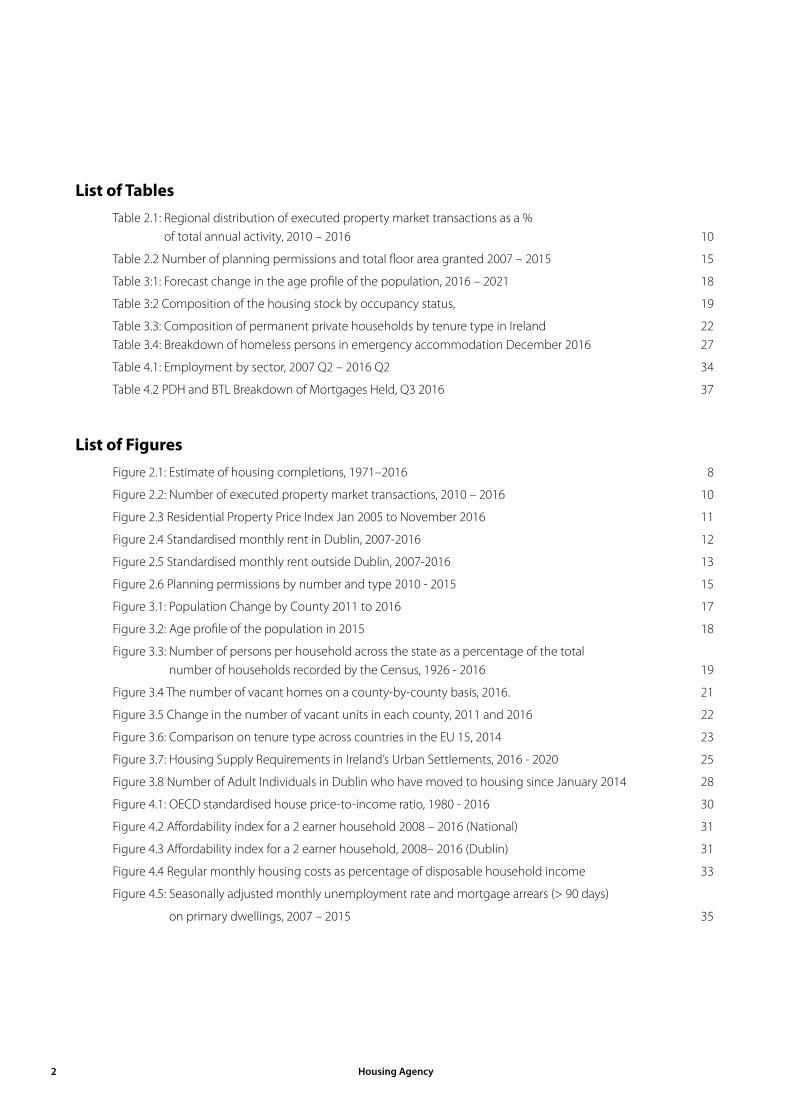
List of Tables Table 2.1: Regional distribution of executed property market transactions as a %
of total annual activity, 2010 – 2016 10
Table 2.2 Number of planning permissions and total floor area granted 2007 – 2015 15
Table 3:1: Forecast change in the age profile of the population, 2016 – 2021 18
Table 3:2 Composition of the housing stock by occupancy status, 19
Table 3.3: Composition of permanent private households by tenure type in Ireland 22 Table 3.4: Breakdown of homeless persons in emergency accommodation December 2016 27
Table 4.1: Employment by sector, 2007 Q2 – 2016 Q2 34
Table 4.2 PDH and BTL Breakdown of Mortgages Held, Q3 2016 37
List of Figures Figure 2.1: Estimate of housing completions, 1971–2016 8
Figure 2.2: Number of executed property market transactions, 2010 – 2016 10
Figure 2.3 Residential Property Price Index Jan 2005 to November 2016 11
Figure 2.4 Standardised monthly rent in Dublin, 2007-2016 12
Figure 2.5 Standardised monthly rent outside Dublin, 2007-2016 13
Figure 2.6 Planning permissions by number and type 2010 - 2015 15
Figure 3.1: Population Change by County 2011 to 2016 17
Figure 3.2: Age profile of the population in 2015 18
Figure 3.3: Number of persons per household across the state as a percentage of the total number of households recorded by the Census, 1926 - 2016 19
Figure 3.4 The number of vacant homes on a county-by-county basis, 2016. 21
Figure 3.5 Change in the number of vacant units in each county, 2011 and 2016 22
Figure 3.6: Comparison on tenure type across countries in the EU 15, 2014 23
Figure 3.7: Housing Supply Requirements in Ireland’s Urban Settlements, 2016 - 2020 25
Figure 3.8 Number of Adult Individuals in Dublin who have moved to housing since January 2014 28
Figure 4.1: OECD standardised house price-to-income ratio, 1980 - 2016 30
Figure 4.2 Affordability index for a 2 earner household 2008 – 2016 (National) 31
Figure 4.3 Affordability index for a 2 earner household, 2008– 2016 (Dublin) 31
Figure 4.4 Regular monthly housing costs as percentage of disposable household income 33
Figure 4.5: Seasonally adjusted monthly unemployment rate and mortgage arrears (> 90 days)
on primary dwellings, 2007 – 2015 35
Housing Agency 2

The Housing Agency’s vision is to enable everyone to live in good quality, affordable homes in sustainable communities. We have come to realise that housing in Ireland consists of many parts, and successful policies and actions need to be well co-ordinated.
We see from recent years that a shortage of affordable market housing in some areas has quickly transferred into pressure in other sectors, particularly the private and social rental sectors, while in other areas housing remains vacant for long periods.
This is why the Statement of Housing Supply and Demand is so important – it brings together information about the many strands that make up our housing system and deepens our understanding.
A house is many things, ranging from the deeply personal and emotional issues surrounding the word ‘home’ - to practical considerations of a house as a financial asset that also involves complex building and planning regulations. Housing costs are a substantial proportion of most people’s monthly expenditure, and the lack of housing affordability has been highlighted as a key risk to our national competitiveness.
We would very much welcome your feedback on the Statement and any suggestions you may have regarding additional data or information which would enhance future editions.
Conor Skehan Chair, Housing Agency
February 2017
Chairman’s Foreword
3National Statement of Housing Supply and Demand 2016 and Outlook for 2017-18

Housing Supply
Construction statistics indicate sufficient development land, a growth in construction activity and further progress in the completion of unfinished estates. Preliminary figures for 2016 indicate that close to 15,000 completions were recorded last year, an increase of 18% on the previous year. Residential sales had increased year-on-year for the four years to 2015, but fell back in 2016; prices continued to rise, but at a slower pace. In the private rented sector, new rents in Dublin reached a new high, while rents in other parts of the country continued to rise.
Current and Future Housing Demand
A growing population and smaller household sizes have implications for the number, type and location of housing needed, as does our current age profile (above EU average number of children) and projected growth in the numbers aged over 75. The number of households is increasing, but they are smaller in size. Based on Census 2016, a minimum of 81,118 homes are needed over the five-year period 2016 – 2020 to meet demand in our urban areas. Vacant homes offer potential to respond to this demand.
The latest Summary of Social Housing Assessments identified 91,600 households assessed as qualified and in need of social housing support. While the number of homeless has increased over the last two years, reaching over 7,000 people by the end of 2016, over that period over 5,000 sustainable exits from homelessness were recorded.
Affordability
Both international and domestic analysis of affordability show that this is a problem in particular parts of the country – urban areas and the East. Renters tend to pay a higher proportion of their income on accommodation. While the number of mortgages in arrears continues to drop, almost 50,000 mortgages are in arrears of over two years and 147,000 have been restructured.
Policy Developments
A key feature of the last two years has been the substantial policy and legislative changes introduced aimed to improve planning, encourage development and stabilise the residential rental sector. See Appendix 1.
This is the second edition of the National Statement of Housing Supply and Demand. It brings together up-to-date information on housing trends in 2015 and 2016 and looks ahead to future demand.
The Statement reports that while housing completions continue to rise, the rate of increase is still below supply requirements, particularly in urban areas, where affordability is also most problematic.
Executive Summary
Housing Agency 4
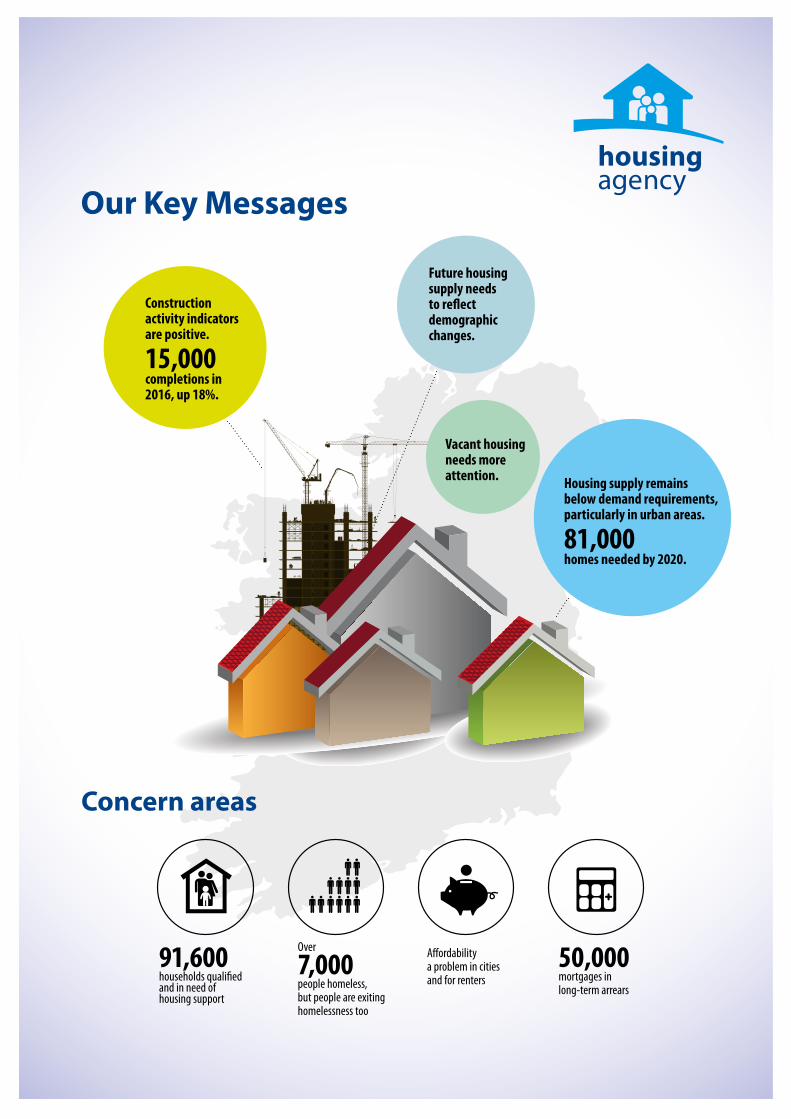
Constructionactivity indicatorsare positive.
15,000completions in 2016, up 18%.
Future housingsupply needs to re�ectdemographic changes.
Vacant housingneeds moreattention.
Our Key Messages
Concern areas
Housing supply remains below demand requirements, particularly in urban areas.
81,000 homes needed by 2020.
91,600households quali�edand in need ofhousing support
50,000mortgages inlong-term arrears
Over
7,000people homeless,but people are exitinghomelessness too
A�ordabilitya problem in citiesand for renters

Housing Agency 6

This Statement comes at a time when our economy shows continued signs of recovery. Growth rates remain positive and unemployment continues to fall. This is positive news, but a strong and sustainable housing system is an important component of maintaining competitiveness. It is also vital to our quality of life.
Chapter 2 of the Statement examines current housing supply – official statistics on house construction activity, rental and sales data.
Chapter 3 then focuses on current and likely future demand. This Chapter draws on information from the recent Census.
Chapter 4 concentrates on the key issue of affordability and brings together different measures of affordability and also information on mortgage arrears.
Over the last two years there has been considerable housing related legislative and policy developments. These are summarised in an Appendix to this Statement.
Chapter 1
This report is the second edition of the National Statement of Housing Supply and Demand. It provides information relating to 2015-2016 with an outlook to 2020. It shows continued modest growth in housing output, but still not to the levels required to match demand.
Introduction
7National Statement of Housing Supply and Demand 2016 and Outlook for 2017-18
2.1 Completions
All housing sectors
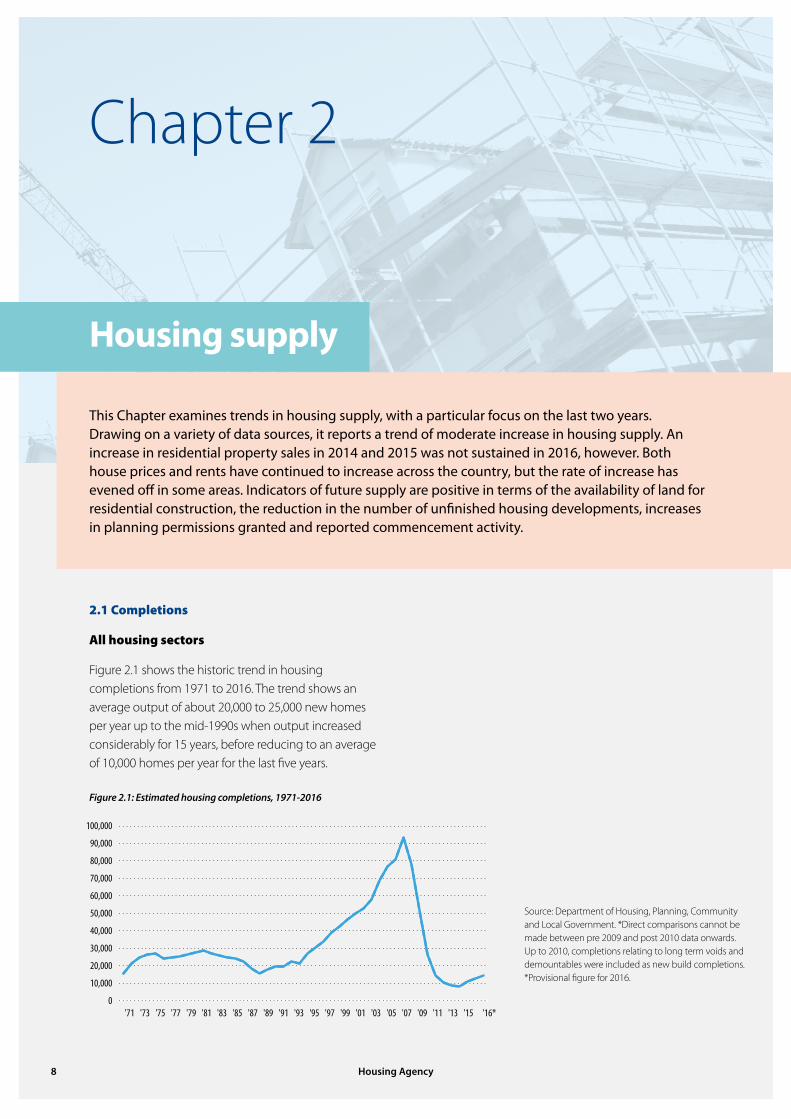
Figure 2.1 shows the historic trend in housing completions from 1971 to 2016. The trend shows an average output of about 20,000 to 25,000 new homes per year up to the mid-1990s when output increased considerably for 15 years, before reducing to an average of 10,000 homes per year for the last five years.
Figure 2.1: Estimated housing completions, 1971-2016
Source: Department of Housing, Planning, Community and Local Government. *Direct comparisons cannot be made between pre 2009 and post 2010 data onwards. Up to 2010, completions relating to long term voids and demountables were included as new build completions. *Provisional figure for 2016.
Chapter 2
This Chapter examines trends in housing supply, with a particular focus on the last two years. Drawing on a variety of data sources, it reports a trend of moderate increase in housing supply. An increase in residential property sales in 2014 and 2015 was not sustained in 2016, however. Both house prices and rents have continued to increase across the country, but the rate of increase has evened off in some areas. Indicators of future supply are positive in terms of the availability of land for residential construction, the reduction in the number of unfinished housing developments, increases in planning permissions granted and reported commencement activity.
0
10,000
20,000
30,000
40,000
50,000
60,000
70,000
80,000
90,000
100,000
'71 '73 '75 '77 '79 '81 '83 '85 '87 '89 '91 '93 '95 '97 '99 '01 '03 '05 '07 '09 '11 '13 '15 '16*
Housing supply
Housing Agency 8

1 | http://www.cso.ie/px/pxeirestat/Statire/SelectVarVal/Define.asp?Maintable=HSA01&Planguage=0
2 | Department of Housing, Planning, Community and Local Government– Construction Activity Statistics (http://www.housing.gov.ie/housing/social-housing/social-housing-output-2015)
3 | Morgenroth, E. (2014a). ‘Modelling the Impact of Fundamentals on County Housing Markets in Ireland’, MPRA Paper No.57665
4 | Social Housing Output in 2015 (http://www.environ.ie/housing/social-housing/social-housing-output-2015)
5 | This includes units acquired under Part V, Planning and Development Act 2000-2008 for local authority rental purposes.
6 | Formerly known as the Social Housing Leasing Initiative
7 | http://www.housing.gov.ie/housing/social-housing/social-and-affordble/overall-social-housing-provision
This completion data is based on the number of dwellings connected to the ESB networks over the period, and is therefore an estimate. In 2015, 12,666 such new housing units were recorded, an increase of 15 per cent on 2014. The majority of these homes were private housing units, with 465 social houses.1 Preliminary figures for 2016, indicate that 14,932 completions were recorded last year, an increase of 18% on the previous year.
In both 2015 and 2016, the largest category of new homes was detached houses, followed by scheme houses/group developments and then apartments.2 In 2015, a little over one-fifth (23%) of recorded completions were located in Dublin, while in 2016 this had increased to 28%. The demand for housing is particularly acute in Dublin. It has been estimated that 60 per cent of the additional housing will be needed in Dublin and the remaining Dublin commuter belt, Cork and Galway.3
Social housing completions
2015 was the first full year of implementation of the government’s Social Housing Strategy. Exchequer Funding for Social Housing in 2015 was €800 million, an increase of €210 million on 2014. In that year, approximately 1,000 homes were acquired or constructed by local authorities, and a further 350 were provided by Approved Housing Bodies under the Capital Assistance Scheme, 2,700 vacant social housing dwellings were also returned to use and close to 9,000 extra units were provided through the current expenditure programme, including 5,680 homes provided through the new Housing Assistance Payment.4 In addition, by the end of December 2015, NAMA had facilitated the delivery of over 2,000 social housing properties.
While end of year figures are not yet available for 2016, by the middle of 2016, local authorities and Approved Housing Bodies had built or bought over 660 housing units.5 By the end of the third quarter of 2016 there were 13,607 active Housing Assistance Payment (HAP) tenancies. A further 929 households transferred from Rent Supplement to the Rental Accommodation Scheme (RAS) during the first three quarters of 2016. Under the Social Housing Current Expenditure Programme (SHCEP)6 delivery of social housing is supported by providing financial support to local authorities and Approved Housing Bodies for the long term leasing of houses and apartments from private owners and developers. 638 housing units were supported by SHCEP during the first three quarters of 2016.7
2.2 Residential sales trends
Stock on the market
Coming from a low base, 2015 represented the fourth successive year where the annual number of residential sales transactions increased compared to the activity recorded in the previous twelve months (see Figure 2.2). The total number of market-based annual property transactions across the State in 2015 was three times greater than the level of completed sales recorded over the course of 2011, a low point in terms of property market activity. The recovery in activity from 2011 to 2015 was broad based, with all regions experiencing an increase in the number of market sales (see Table 2.1).
The months to November 2016, however, saw a decline in the total number of market-based residential property transactions completed - down
9National Statement of Housing Supply and Demand 2016 and Outlook for 2017-18

2,463 (-6.5%) compared to the opening 11 months of 2015. A decline in the number of transactions occurred in every region over this period. The 1,271 (-10.2%) fall in transactions across Dublin in 2016 relative to the preceding year is notable, as sales in the Dublin region typically account for around one-third of the annual number of transactions across the country—see table 2.1 for details.
The decrease in market activity may, in part, be due to a decline in the supply of residential properties for sale. The most recent Daft.ie House Price Report8 for the fourth quarter of 2016 shows a decrease in the supply of properties advertised for sale in the market and reports that this is the lowest recorded since January 2007.
Table 2.1: Regional distribution of executed property market transactions as a % of total annual activity, 2010 – 2016
‘10 ‘11 ‘12 ‘13 ‘14 ‘15 ‘16
Dublin 38 35 37 36 32 30 32
South-West 13 14 14 13 14 15 14
Mid-East 14 13 13 14 14 14 13
South-East 8 9 9 9 9 9 9
West 7 8 8 9 9 10 9
Mid-West 8 9 8 8 8 9 9
Border 6 7 6 7 7 8 8
Midland 5 5 5 5 6 6 6
Source: Central Statistics Office, 2016 HPM02
House price trends
Residential property prices continued to increase over the last two years. Figure 2.3 shows trends in property prices since 2005. At a national level it demonstrates the peak in 2007, the decline to mid-2012 and the increase since then. Following a steep fall, residential property prices began to increase in Dublin over the second half of 2012, with a price recovery apparent in the regions outside Dublin from the second quarter of 2013 onward. In the early stages of the rebound, the rate of increase in prices in Dublin was considerably higher compared to areas outside of the capital. However, for much of the past two years, price growth has generally slowed in Dublin while outside of Dublin has experienced double digit year-on-year price growth. Meath, Galway, Kildare, Clare and Louth have experienced particularly high rates of price rises over this period.10
The CSO Residential Property Price Index reported that, in the year to November 2016, residential property prices at national level increased by 8.6%. This compares with an increase of 6.9% in the year to October and an increase of 4.2% in the twelve months to November 2015.
0
10,000
‘10 ‘11 ‘12 ‘13 ‘14 ‘15 ‘16*
20,000
30,000
40,000
50,000
Figure 2.2: Number of executed property market transactions, 2010 – 20169
8 | http://www.daft.ie/report/q4-2016-daft-house-price-report-2016.pdf
9 | Central Statistics Office, 2016 HPM02
10 | myhome.ie Property Report Q4 2015 Pg 3 (http://media.myhome.ie/content/propertyreport/MyHome-Property-Report-Q4-2015.pdf )
Source: Central Statistics Office, 2016 HPM06
Housing Agency 10

In Dublin, residential property prices increased below the national average - 5.9% in the year to November. Dublin house prices increased 5.6%. Whereas apartments increased 9.6% in the same period. Residential property prices in the Rest of Ireland (i.e. excluding Dublin) were 12.8% higher in the year to November. Overall, the national index is approximately one-third (31.5%) lower than its highest level in 2007.11
The average (mean) residential property sale price across all counties for executed marked based transactions was €244,874 in November 2016—an increase of €22,903 (10.3%) compared to the same month in 2015. The most recent data for November 2016 indicates average prices are highest in Dublin (€393,649) and the mid-east, particularly Wicklow and Kildare (€284,868 and €250,839 respectively). Over the same period, average prices in Dublin were 4.6 times greater than the mean sale price in Longford (the county with the lowest average sale price).
11 | http://www.cso.ie/en/releasesandpublications/ep/p-rppi/residentialpropertypriceindexnovember2016/
Source: CSO, Residential Property Price Index HPM06 (Chart covers the opening eleven months of 2016).
Figure 2.3: Residential Property Price Index Jan 2005 to November 2016
2005 2006 2007 2008 2009 2010 2011 2012 2013 2014 2015 2016
40
50
60
70
80
90
100
110
120Max=135
130
140
National
Dublin
National excluding Dublin
Max=129.3
Min=55.2 Min=56.2
11National Statement of Housing Supply and Demand 2016 and Outlook for 2017-18

2.3 Rental trends
The private rental sector has an increasingly important role to play in accommodating a diverse range of households. Since 1991, the number of households living in rented accommodation has increased from 17.9% to just under 28% by 2011.12
The Residential Tenancies Board Rent Index (see figure 2.4 and 2.5) shows the movement in standardised, mix adjusted, rents since 2007. Rents for houses and apartments fell considerably across all regions from 2007 to 2010. The decline in prices was particularly sharp in Dublin during this time. However, the period of decline in monthly rents was shorter lived in the capital; prices started to increase in Dublin mid-way through 2011, with prices outside Dublin continuing to fall until the end of 2012. The latest data from the Rent Index (Q3 2016) shows that rents in Dublin are now 5 per cent above their previous peak at the end of 2007, while outside Dublin rents are 7.3 per cent below peak levels.
12 | Norris, M (2013) Social Housing, Disadvantage and Neighbourhood Liveability
Source: RTB Rent Index, Quarter 3, 2016
Figure 2.4 Standardised monthly rent in Dublin, 2007-2016
0
250
500
750
1,000
1,250
1,500
2007 2008 2009 2010 2011 2012 2013 2014 2015 2016
€
Aggregate
Apartments
Houses
Housing Agency 12

Year-on-year, rents nationally were 8.6% higher in Q3 2016 compared to Q3, 2015; up from €897 to €973. Nationally, rents for houses were 7.4% higher over the period, while apartment rents were 9.9% higher than in the same quarter of 2015. Annual growth in the Dublin market was 7.1% between Q3 2015 and Q3 2016 – apartment rents increased by 9.6%, while house rents were up by 3.3%.
The Daft.ie rental report for Q3 2016 highlighted the issue of the lack of supply of rental properties – with less than 3,700 advertised on 1st October 2016 – 12% fewer than 12 months earlier.13 The number of tenancies registered with the RTB, however, has not witnessed this downward trend. Over the last 6 years approximately 100,000 new tenancies were registered by the RTB each year and by Q3 2016 (end August 2016) 75,116 new tenancies had been registered by the Board. The total number of tenancies registered now stands at 324,222, representing 174,158 landlords and 705,183 occupants.
There have been a number of recent policy and legal developments in relation to the private rented sector, which are summarised in the Appendix.
2.4 Indicators of Future Housing Supply
Residential land availability
The Residential Land Availability Survey 2014 was published in February 2015, and provides data in respect of residentially zoned land available for housing nationally as of 31st March 2014.14 The survey examined the land in two stages.
Stage 1 are undeveloped residentially zoned lands, regardless of the sequence of the development of those lands or phasing under local authority development plan core strategies.
Stage 2 are the lands identified in stage 1 that are potentially available for development in relation to the order of priority or phasing indicated under the relevant Development plan or Local Area Plan period.
The Survey identified 27,363 hectares with the potential for 611,302 dwellings at stage 1 and a further 17,435 hectares with the potential for 414,712 dwellings at stage 2.
13 | Daft.ie Rental Report Q3 2016
14 | http://www.housing.gov.ie/planning/residential-land-availability/residential-land-availability-survey
Source: RTB Rent Index, Quarter 3, 2016
Figure 2.5 Standardised monthly rent outside Dublin, 2007-2016
€
0
250
500
750
1,000
1,250
1,500
2007 2008 2009 2010 2011 2012 2013 2014 2015 2016
Aggregate
Apartments
Houses
13National Statement of Housing Supply and Demand 2016 and Outlook for 2017-18

Dublin Housing Supply Coordination Taskforce
The Dublin Housing Supply Coordination Taskforce (DHSCT), which was established to focus on addressing housing supply-related issues reported that at the end of 2015, there were planning permissions in place for 29,770 houses and apartments in developments of ten or more units in the four Dublin local authority areas (Fingal, Dublin City Council, South County Dublin and Dun-Laoghaire Rathdown). This was made up of 13,670 houses and 16,100 apartments.
The most recent data supplied by local authorities to the Dublin Housing Supply Coordination Taskforce shows the cumulative total of sites with planning permission granted, stood at 36,959 units by the third quarter of 2016, covering 17,651 houses and 19,308 apartments.15
Unfinished housing
The Government’s Action Programme on Unfinished Housing Developments was published in 2010 with a commitment to publish a yearly progress report. The 2015 Annual Progress Report on Actions to Address Unfinished Housing Developments, published in December 2015, contains the results of a survey carried out in 2015 on unfinished developments.16 By end 2015, the number of unfinished developments stood at 668, down from 3,000 in 2010. In 2015 there were 324 housing developments removed from the list as they were substantially complete.
Within the unfinished 668 developments there were:
19,118 dwellings which were complete and occupied
2,542 dwellings which were complete and vacant
8,105 units which were in various stages of completion
18,376 units which had not been started.
Planning permissions granted
Data gathered by the Central Statistics Office show that there were a total of 4,269 planning permissions granted for a total of 13,044 dwelling units in 2015. This was an increase of 76% on the number of dwelling units granted permission in 2014 (7,411).17 Based on data for the first three quarters of 2016, the trend would appear to be continuing upwards. By end September 2016, planning permissions were granted for a total of 12,046 new housing units, compared to 9,027 granted for the same period of 2015.18
The data in Figure 2.6 shows planning permissions by housing type over the last six years. It shows a steady increase, over the last four years, in the number of planning permissions for houses in group developments, and a substantial increase in the last year in the number for apartments, while the number of planning permissions for one-off houses is more steady at about 3,000 per year.
15 | http://www.housing.gov.ie/sites/default/files/publications/files/housing_supply_coordination_task_force_returns_q3_2016.pdf
16 | Resolving Unfinished Housing Developments Annual Progress Report on Actions to Address Unfinished Housing Developments (Dec 2015) (https://www.housing.ie/getattachment/Our-Services/Unfinished-Housing-Developments/2015-National-Housing-Survey/Progress-Report-on-UHDs-Dec-2015-%28final%29.pdf )
17 | Table A Summary of Planning Permissions granted for New Dwelling Units( http://cso.ie/en/releasesandpublications/er/pp/planningpermissionsquarter42015/)
18 | CSO Q1, Q2,Q3 2016 – Planning Permission Statistical Releases
Housing Agency 14
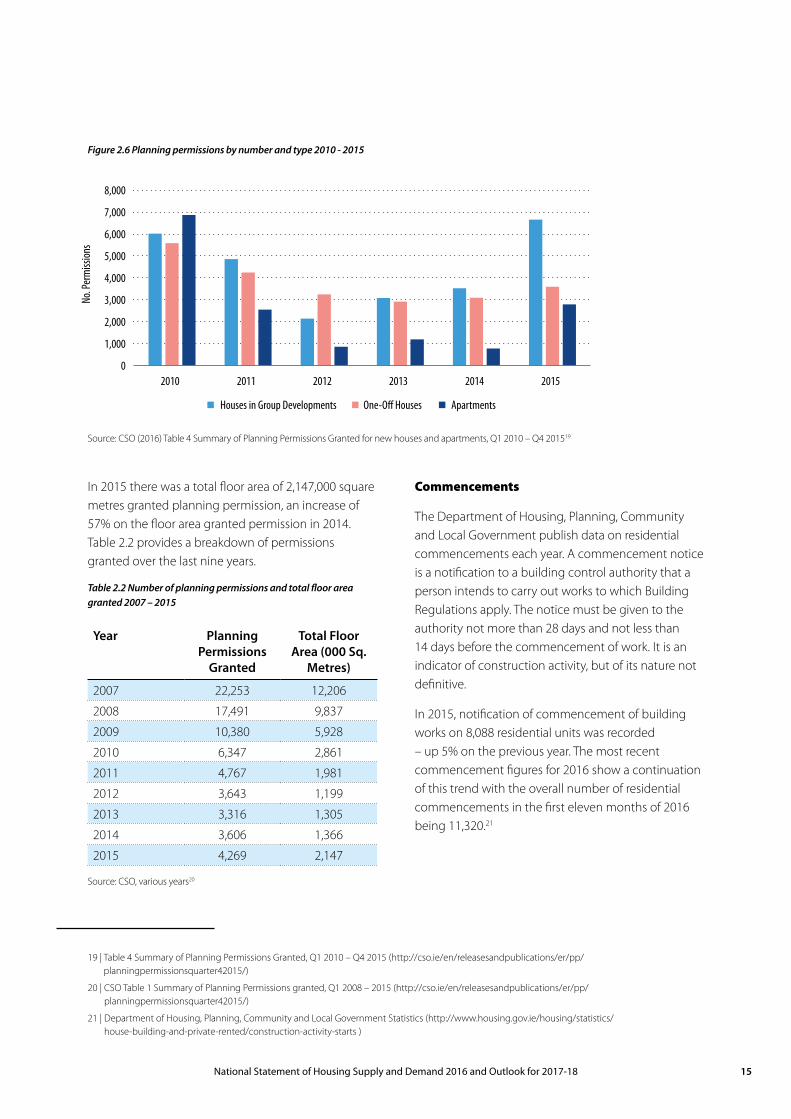
In 2015 there was a total floor area of 2,147,000 square metres granted planning permission, an increase of 57% on the floor area granted permission in 2014. Table 2.2 provides a breakdown of permissions granted over the last nine years.
Table 2.2 Number of planning permissions and total floor area granted 2007 – 2015
Year Planning Permissions
Granted
Total Floor Area (000 Sq.
Metres)
2007 22,253 12,206
2008 17,491 9,837
2009 10,380 5,928
2010 6,347 2,861
2011 4,767 1,981
2012 3,643 1,199
2013 3,316 1,305
2014 3,606 1,366
2015 4,269 2,147
Source: CSO, various years20
Commencements
The Department of Housing, Planning, Community and Local Government publish data on residential commencements each year. A commencement notice is a notification to a building control authority that a person intends to carry out works to which Building Regulations apply. The notice must be given to the authority not more than 28 days and not less than 14 days before the commencement of work. It is an indicator of construction activity, but of its nature not definitive.
In 2015, notification of commencement of building works on 8,088 residential units was recorded – up 5% on the previous year. The most recent commencement figures for 2016 show a continuation of this trend with the overall number of residential commencements in the first eleven months of 2016 being 11,320.21
19 | Table 4 Summary of Planning Permissions Granted, Q1 2010 – Q4 2015 (http://cso.ie/en/releasesandpublications/er/pp/planningpermissionsquarter42015/)
20 | CSO Table 1 Summary of Planning Permissions granted, Q1 2008 – 2015 (http://cso.ie/en/releasesandpublications/er/pp/planningpermissionsquarter42015/)
21 | Department of Housing, Planning, Community and Local Government Statistics (http://www.housing.gov.ie/housing/statistics/house-building-and-private-rented/construction-activity-starts )
Source: CSO (2016) Table 4 Summary of Planning Permissions Granted for new houses and apartments, Q1 2010 – Q4 201519
Figure 2.6 Planning permissions by number and type 2010 - 2015
0
1,000
2,000
3,000
4,000
5,000
6,000
7,000
8,000
2010 2011 2012 2013 2014 2015
No. P
erm
ission
s
Houses in Group Developments One-O� Houses Apartments
15National Statement of Housing Supply and Demand 2016 and Outlook for 2017-18

3.1 Population and household formation
There are 4.76 million people living in Ireland, with initial figures from Census 2016 showing an increase of 169,724 people (3.7%) residing in the country over the last five years. Population change across the country varied widely in the five-year period between the Census 2011 and Census 2016. Dublin, the commuter belt counties of Meath, Kildare and Laois, and the cities of Cork and Galway were among the fastest growing areas in the state. Over the same period counties in the West, Mid-West and Border regions had the highest level of estimated net outward migration as a proportion of the total population in each area—Donegal lost just over 8 people per 1,000 of the population to net migration, for instance—and experienced the lowest level of overall population growth.
The population change by county over the last five years illustrated by the map in Figure 3.1 shows population growth in the east of the county and decline in parts of the midlands, counties along the border, and the west—with the exception of Cork and areas close to Galway city. This pattern is consistent with a longer-term trend decline in the share of the population living in the counties in the Border and West regions and a larger share of people living in Dublin and the Mid-East.
These broad population trends have important implications for current and future housing demand.
Chapter 3
This Chapter focuses on the underlying causes of housing demand. Using information from Census 2016, it shows population growth around our major cities and age profile changes – all of which have implications for the location and type of housing needed. Other changes, such as the increase in the number of households renting and statistics on vacant properties are presented. It is estimated that a minimum of 81,118 homes are needed (45,000 of these are needed in the five major urban centres) in the five-year period 2016 – 2020 to meet demand in our urban areas. This Chapter concludes by reporting on trends in social housing need, and draws particular attention to the rise in the number of homeless households.
Current and future housing demand
Housing Agency 16

Compared to many other countries in Western Europe, Ireland has a relatively young population. Figure 3.2 divides the total population into five age groups, comparing the age profile of Ireland’s population in 2015 to the average age profile across the EU 15 countries weighted by each country’s share of the overall population in the bloc. As is evident from the Figure, Ireland has a higher proportion of younger people (individuals aged 19 years old or less) compared
to the EU 15 average. Approximately 28.2% of the population in Ireland is under the age of 19, compared to a weighted average of 21% in this age cohort across the EU 15 countries. The share of people in the 20-34 age group and those between 35-55 years old is marginally higher in Ireland relative to the average age profile across the same group of countries.
<-10%
-10% to 0%
0% to 5%
5% to 10%
>10%
Source: Central Statistics Office (2016) Preliminary Results from Census 2016. Map taken from the All Island Research Observatory
Figure 3.1: Population Change by County 2011 to 2016
17National Statement of Housing Supply and Demand 2016 and Outlook for 2017-18

At the other end of the lifecycle, Ireland has a smaller proportion of people aged 75 or over compared to the EU 15 average – approximately 5.4% of the population in Ireland are in this age group compared to an average of 9.5% across the comparator countries in Europe. However, the coming years will see an increasing proportion of the population in Ireland move into the 55 and over age group. Approximately 55,000 more people in Ireland are forecast to be over 75 years of age by 2021, a 20.9% increase on the estimated 260,900 people currently in this age group. The CSO forecast the number of people aged 55 years or older will be the fastest growing age group by 2021 – see Table 3.1
Figure 3.2: Age profile of the population in 2015 – Ireland & the weighted average across the EU 15
Source: European Commission (2016) Population and Labour Force Projections 2016-2046
Table 3:1: Forecast change in the age profile of the population, 2016 – 2021
2016 2021 Change (No)
Change (%)
0-19 1,348.5 1,414.8 66.32 4.92
20-34 870.2 873.7 3.47 0.40
35-54 1,357.4 1,404.1 46.70 3.44
55+ 1,127.9 1,294.2 166.30 14.74
Of which 75+
260.9 315.5 54.64 20.94
Source: CSO (2013) Population and Labour Force Projections 2016-2046
The tendency to form new households, along with trends in the size of households impacts on the number and type of homes required to meet demand. The process of household formation is linked to, among other things, the age profile of the population, the degree of choice offered by the existing housing stock and the affordability of meeting housing costs. Ireland has traditionally experienced lower rates of household formation than is seen in the UK and the rest of Northern and Western Europe; however, the number of households in the State has increased in each Census period since 1926 and this trend is expected to continue. From 2006 to 2011 the number of households in the country increased by 187,112. However, more recently, household formation has fallen behind population growth—from 2011 to 2016 the number of households increased by just 3%, while the population increased by 3.7%.22
Average household size has decreased steadily since 1966, though the number of persons per household in Ireland tends to be greater than the average household size in many of the countries in Europe. Figures from Census 2011, show approximately 7 out of every 10 households in the state contain 3 people or less. Data from the Quarterly National Household Survey for the second quarter of 2016 indicates the proportion of households with 3 people or less remains at approximately 70% of all households, a significant shift from the 1980s when just over half of
22 | Census of the Population 2016 – Preliminary Results
00-19 20-34 35-54 55-74 75+
10
20
30
40
EUIreland
Housing Agency 18

all households in the state at that time contained 3 or fewer individuals. It is expected that the number of smaller households will increase as a proportion of all household composition types over the coming five years. This increase in the proportion of smaller households in towns and villages across the country is behind much of the need for new homes over the coming years and is discussed later in this chapter.
3.2 Housing stock
Preliminary results from Census 2016 record 2,022,895 dwellings in the state, an increase of just under 1% in the total stock of homes compared to the figures recorded in Census 2011. The total number of occupied households increased by 2.9% over the same period, with the number of vacant dwellings falling by 31,698, a 13.7% decrease, over the five-year period (see Table 3.2).
2011 2016 Change 2011 - 2016 (No)
Change 2011 - 2016 (%)
Occupied households 1,669,180 1,718,465 49,285 2.95
Other vacant dwellings 230,056 198,358 -31,698 -13.78
Temporarily absent 45,283 44,868 -415 -0.92
Vacant holiday homes 59,395 61,204 1,809 3.05
Total 2,003,914 2,022,895 18,981 0.95
Source: CSO (2013) Private Permanent Households (Number) by Census Year, Number of Persons and Province County or City. Figures for 2016 taken from QNHS, Q2 2016, CNA29
Figure 3.3: Number of persons per household across the state as a percentage of the total number of households recorded by the Census, 1986 - 2016
Table 3:2 Composition of the housing stock by occupancy status, Census 2011 and Census 2016
0
5
10
15
20
25
30
35
40
1986 1991 1996 2002 2006 2011 2016
%
1 person 2 persons3 persons 4 persons
5 or more persons
19National Statement of Housing Supply and Demand 2016 and Outlook for 2017-18

A considerable proportion of the overall housing stock is reasonably new; more than one in four occupied dwellings in Ireland were built in the decade leading up to Census 2011. Over two-thirds of housing was built in the 40 years between 1971 and 2011. Just over a third of the occupied housing stock (567,602 homes) is based in-or-around the five main urban areas in the country. The number of people living in rural areas in Ireland is higher than in most EU 15 countries with 29% of occupied dwellings in parts of the country where there is less than 50 inhabited houses in the local area. That a relatively large share of the total number of houses in the state is located in rural areas may help explain why the number of rooms per person in homes in Ireland is, on average, greater than in many other countries in Europe and may partly account for the strong growth in owner-occupied housing in Ireland up to the 1990s.
Vacant homes
A certain level of vacant properties is normal in a healthy housing market, with houses often being temporarily vacant between tenancies and when being renovated. However, long-term vacant housing can have negative impacts on local areas and communities and represents an inefficient use of valuable resources. Preliminary results from Census 2016 records the number of vacant dwellings at 198,358 (excluding holiday homes), a decrease of 31,698 vacant units compared to the figures from Census 2011. This is almost one-tenth of the total stock.
Figure 3.4 presents both the number of vacant units in each county and the proportion of the stock these units represent in each area, known as the vacancy rate. Many of the counties with the highest vacancy rates are in areas around the western and border regions that have experienced some of the highest levels of net outward migration over the past five years (see map 3.1). However, the issue of vacant homes goes beyond oversupply of housing in particular parts of the country. While a degree of vacant stock is to be expected at a given point in time due to, among other things, transactions or refurbishments taking place, the vacancy rate is above what is expected in areas around major urban centres of high demand.23 Pillar Five of the Action Plan for Housing and Homelessness establishes a goal of using the existing housing stock to the maximum degree possible and will be launched in the coming months.
23 | In England, for example, the vacancy rate is 2.5%.
Housing Agency 20
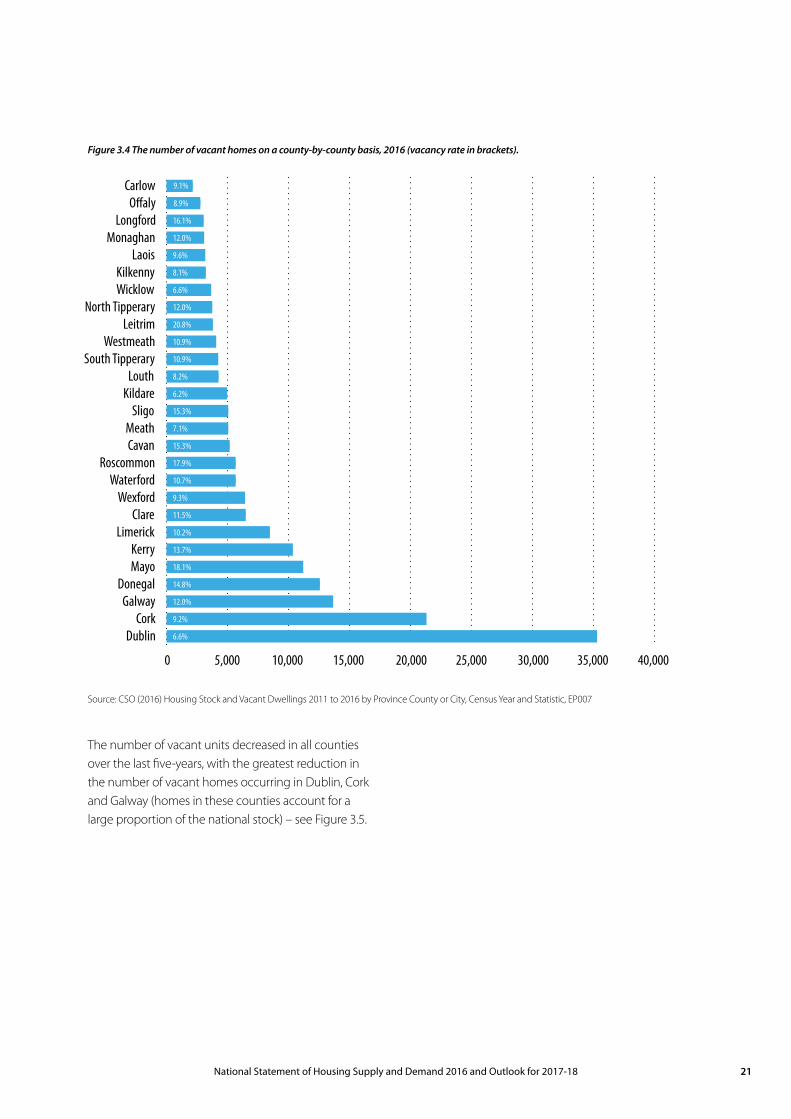
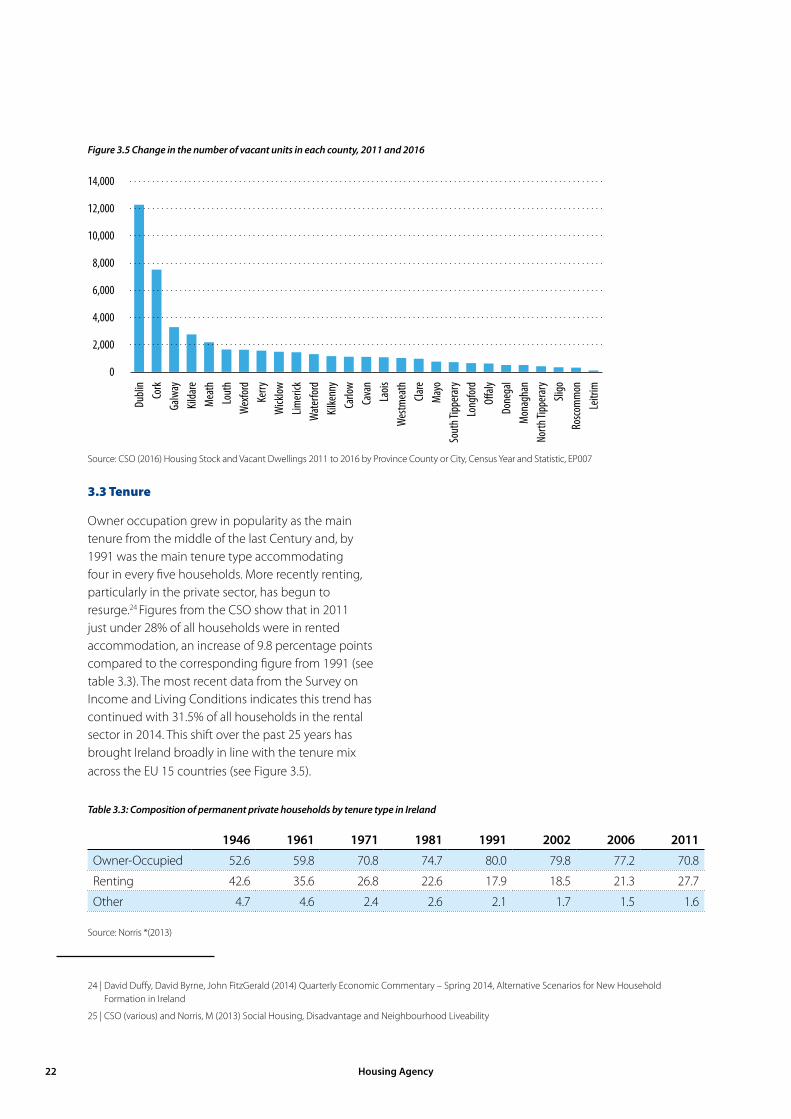
The number of vacant units decreased in all counties over the last five-years, with the greatest reduction in the number of vacant homes occurring in Dublin, Cork and Galway (homes in these counties account for a large proportion of the national stock) – see Figure 3.5.
Source: CSO (2016) Housing Stock and Vacant Dwellings 2011 to 2016 by Province County or City, Census Year and Statistic, EP007
Figure 3.4 The number of vacant homes on a county-by-county basis, 2016 (vacancy rate in brackets).
0 5,000 10,000 15,000 20,000 25,000 30,000 35,000 40,000
DublinCork
GalwayDonegal
MayoKerry
LimerickClare
WexfordWaterford
RoscommonCavanMeath
SligoKildare
LouthSouth Tipperary
WestmeathLeitrim
North TipperaryWicklowKilkenny
LaoisMonaghan
LongfordO�aly
Carlow
9.1%
8.9%
16.1%
12.0%
9.6%
8.1%
6.6%
12.0%
20.8%
10.9%
10.9%
8.2%
6.2%
15.3%
7.1%
15.3%
17.9%
10.7%
9.3%
11.5%
10.2%
13.7%
18.1%
14.8%
12.0%
9.2%
6.6%
21National Statement of Housing Supply and Demand 2016 and Outlook for 2017-18
3.3 Tenure
Owner occupation grew in popularity as the main tenure from the middle of the last Century and, by 1991 was the main tenure type accommodating four in every five households. More recently renting, particularly in the private sector, has begun to resurge.24 Figures from the CSO show that in 2011 just under 28% of all households were in rented accommodation, an increase of 9.8 percentage points compared to the corresponding figure from 1991 (see table 3.3). The most recent data from the Survey on Income and Living Conditions indicates this trend has continued with 31.5% of all households in the rental sector in 2014. This shift over the past 25 years has brought Ireland broadly in line with the tenure mix across the EU 15 countries (see Figure 3.5).
24 | David Duffy, David Byrne, John FitzGerald (2014) Quarterly Economic Commentary – Spring 2014, Alternative Scenarios for New Household Formation in Ireland
25 | CSO (various) and Norris, M (2013) Social Housing, Disadvantage and Neighbourhood Liveability
Source: CSO (2016) Housing Stock and Vacant Dwellings 2011 to 2016 by Province County or City, Census Year and Statistic, EP007
Source: Norris *(2013)
Figure 3.5 Change in the number of vacant units in each county, 2011 and 2016
0
2,000
4,000
6,000
8,000
10,000
12,000
14,000
Dubli
nCo
rkGa
lway
Kilda
reM
eath
Lout
hW
exfo
rdKe
rryW
icklow
Limer
ickW
ater
ford
Kilke
nny
Carlo
wCa
van
Laois
Wes
tmea
thCla
reM
ayo
Sout
h Tipp
erar
yLo
ngfo
rdO�
alyDo
nega
lM
onag
han
North
Tipp
erar
ySli
goRo
scom
mon
Leitr
im
1946 1961 1971 1981 1991 2002 2006 2011
Owner-Occupied 52.6 59.8 70.8 74.7 80.0 79.8 77.2 70.8
Renting 42.6 35.6 26.8 22.6 17.9 18.5 21.3 27.7
Other 4.7 4.6 2.4 2.6 2.1 1.7 1.5 1.6
Table 3.3: Composition of permanent private households by tenure type in Ireland
Housing Agency 22

The tenure mix has been relatively stable in rural areas since the 1970s. Much of the overall shift towards renting is being driven by a significant increase in the proportion of households renting in the main urban areas of the counties—Dublin, Cork, Galway and Limerick. In Dublin city, for instance, roughly 48% of those living in the area are renting. With this in mind, it is possible that only half of any new stock added in the capital will be purchased and lived in by owner-occupiers with the remaining 50% rented either privately or with state-support.
A significant change in the tenure mix is underway and appears likely to continue over the coming years. This change may be felt most acutely by those seeking to live near centres of employment opportunity. Part of the growth in the rented sector is also due to the increasing role it plays in accommodating households requiring state support with their housing costs. Approximately half of households in the private rented sector receive some state support with their rent, at an annual cost to the Exchequer of approximately €500 million.27
26 | European Commission, Eurostat, Survey on Income and Living Conditions 2014
27 | Social Housing Strategy 2020 Support, Supply and Reform (http://www.merrionstreet.ie/en/ImageLibrary/Social_Strategy_Document_20141126.pdf )
28 | Future Analytics (2016) Housing Supply Requirements in Ireland’s Urban Settlements 2016 – 2020.
Source: European Commission, Eurostat, Survey on Income and Living Conditions 2014
Figure 3.6: Comparison on tenure type across countries in the EU 15, 2014 26
0
20
40
60
80
100
ES PT EL FI IT LU BE SE IE NL FR UK DK AT DE
Owner Rented
23National Statement of Housing Supply and Demand 2016 and Outlook for 2017-18

3.4 Minimum Future Housing Requirements
Research recently carried out for the Housing Agency on the projected demand for housing in urban settlements (500 people or more) resulted in an estimate of a minimum requirement of 81,118 homes between 2016 – 2020.28 This estimated demand of new homes is based on the existing housing supply, current stock availability and demographic trends. The model factors in expected changes in each of these areas over the coming five-years to produce estimates of minimum need in settlements with a resident population of 500 persons or more. In total, 445 areas across Ireland were assessed, with previous housing demand projections updated on the basis of the preliminary Census 2016 data released by the CSO in July last year.
The study estimates 44,902, homes are needed in the five major urban centres, accounting for 55.4% of the overall number of dwellings needed over the five-year period. There is a pronounced minimum requirement of 33,109 homes in Dublin City and the surrounding suburbs during this time, or an average annual requirement of 6,622 homes. While demand is concentrated in the main urban areas of the county, the report identifies 10 towns outside the major cities facing a minimum requirement of at least 800 homes from 2016 to 2021; and over 30 towns with a minimum requirement of more than 300 homes each (see Figure 3.7 for more details).
It is important to note that while this research models for housing supply, it does not consider the full extent of housing delivery or ‘pent-up demand’. Identified minimum housing requirements are based on projections of natural population growth and migration utilising the cohort component model methodology in addition to an assessment of trends in person-household size and changes in housing stock informed by Census 2016 data. Other studies have estimated the level of future demand for housing on the basis of household formation rates and project that structural demand for housing is likely to increase at a steady rate in the coming years before reaching approximately 30,000 units per annum by 2024.29
A primary driver of the need for new homes comes from the projection that smaller households will continue to make up an increasing share of the total occupancy composition in towns and cities across the country. While the profile of occupancy shift varies between each urban settlement, with some of those identified showing strong shifts to one and two-person households, whereas others show a resurgence in three-person households, an overall move towards a reduction in the number of larger households and an increase in the number of homes containing one and two-persons is expected to continue. This dynamic is occurring incrementally in many towns and villages across the county, and over an extended period it can result in a considerable change in the housing type needed to satisfy demand.
29 | Duffy, D. et al (2016) “Demographic Change, Long-Run Housing Demand and the Related Challenges for the Irish Banking Sector” in Ireland’s Economic Outlook: Perspectives and Policy Challenges
Housing Agency 24

Figure 3.7: Housing Supply Requirements in Ireland’s Urban Settlements, 2016 - 2020
0.87k 0.99k 1.07k 1.15k 1.25k
1.1k
0.0k
0.5k
1.0k
1.5k
2.0k
2016 2017 2018 2019 2020
Cork City & Suburbs Minimum Requirement, 2016-2020
Minimum Housing Requirement (MHR)
Annual Average MHR
Map Key
Urban Settlements
Local Authorities
Supply Requirements: Urban Settlements
Dublin CityRegion
Cork CityRegion
EnnisShortfall of 1,443 Homes
Galway City& SuburbsShortfall of 2,316 Homes
SligoShortfall of 1,111 Homes
LetterkennyShortfall of 1,622 Homes
Limerick City & SuburbsShortfall of 3,436 Homes
Shortfall of 8,434 Homes
Shortfall of 35,242 Homes
Shortfall of 713 Homes
TraleeWaterford City & Suburbs
Shortfall of 1,491 Homes
Dublin City & Suburbs Minimum Requirement, 2016-2020
Minimum Housing Requirement (MHR)
Annual Average MHR
5.7k6.3k 6.7k 7.0k 7.5k
6.6k
0k
2k
4k
6k
8k
10k
2016 2017 2018 2019 2020
25National Statement of Housing Supply and Demand 2016 and Outlook for 2017-18

3.5 Social Housing Requirements
The Summary of Social Housing Assessments brings together information provided by local authorities on households in their functional area qualified for social housing support whose social housing need is not being met.30
The Summary of Social Housing Assessments 2016, identified 91,600 households assessed as qualified and in need of housing support as of 21 September 2016. The 2016 figure is an increase of 1,728 (+1.9%) from the 89,872 qualified households recorded in the previous social housing assessment in 2013. A total of 35,572 households that qualified for social housing support were in one of the four Dublin local authorities.
Of the households assessed as qualified and in need of housing support, two-thirds (67%) were dependent on social welfare as their only source of income, while 13.3% had income from employment only. The top three reasons for basis of need for social housing support were: dependent on rent supplement (43%), unsuitable accommodation due to particular household circumstances (23%) and involuntary sharing (13%).31
Homelessness
Figures for the numbers of people presenting as homeless increased over 2015 and into 2016 official data from the Department of Housing, Planning, Community and Local Government is produced by local authorities through the Pathway Accommodation and Support System (PASS) and captures details of individuals in state-funded emergency accommodation, arrangements that are overseen by local authorities. The total number of people in emergency accommodation at the end of December 2016 was 7,148 individuals, with 2,505 (35%) of these individuals under 18 years of age.
The number of families accessing emergency accommodation rose from 884 in January 2016 to 1,205 in December 2016 and the number of children in emergency accommodation increased from 1,830 to 2,505 over this period.32
Table 3.4 provides a breakdown of the 4,643 adults (aged 18+) in emergency accommodation during the week 19th to 25th December 2016, by gender and age. Though all regions have experienced an increase in the number of adults presenting as homeless in the recent months, the problem is concentrated in Dublin. There were 3,162 adults, 68% of the total number of homeless persons over 18 years of age across the state, living in the capital towards the end of December of this year. Over the same week Cork and Limerick had the next highest incidences of adults in emergency accommodation with 258 and 257 adults respectively.
The majority of people in local authority managed emergency accommodation are aged between 25 years and 44 years. In the week ending 25th December 2016, 2,829 (61%) adults in emergency accommodation were in this age bracket. There were 2,687 men and 1,956 women accessing emergency accommodation in December. Women made up 42% of the homeless adult numbers in December.
The breakdown by type of accommodation accessed in the week 19th to 25th December is split into 2,268 in Private Emergency Accommodation (PEA) which includes hotels and B&Bs and other residential facilities used on an emergency basis, 2,205 in Supported Temporary Accommodation (STA), which includes hostels and onsite professional support and 202 in Temporary Emergency Accommodation (TEA), which is emergency accommodation with no (or minimal) support.
30 | https://www.housingagency.ie/Housing/media/Media/Publications/Summary-of-Social-Housing-Assessment-Needs-2016.pdf
31 | https://www.housingagency.ie/Housing/media/Media/Publications/Summary-of-Social-Housing-Assessment-Needs-2016.pdf
32 | http://www.housing.gov.ie/sites/default/files/publications/files/homeless_report_-_december_2016.pdf
Housing Agency 26

Source: Department of Housing, Planning, Community and Local Government – Homelessness Report December 2016
Region Total Homeless in region
Gender Age groups
N. Male Female 18 - 24 25 - 44 45 - 64 65+
Dublin 3,162 1,713 1,449 533 1,987 599 43
Mid-East 210 123 87 28 127 48 7
Midlands 59 32 27 17 28 13 1
Mid-West 288 183 105 43 164 73 8
North-East 116 72 44 20 68 23 5
North-West 36 26 10 5 19 12 0
South-East 293 201 92 56 156 69 12
South-West 296 206 90 34 184 71 7
West 183 131 52 29 96 57 1
Total 4,643 2,687 1,956 765 2,829 965 84
Table 3.4: Breakdown of homeless persons (aged 18+) in emergency accommodation December 2016
The Dublin Region Homeless Executive carries out official counts on rough sleeping every six months. The street count confirms a minimum number of people who are sleeping rough on the night in question. A count of rough sleepers in the Dublin Region took place on the night of 22nd November 2016. There was a total of 142 individuals recorded sleeping rough. This is a 15.5% decrease on the high point figure of 168 persons recorded as sleeping rough in the winter of 2014.33
During the course of 2015, housing authorities assisted in 2,322 sustainable exits from homelessness into independent social housing or supported private rented tenancies. In the first three quarters of 2016, over 2,000 such exits were recorded and estimates for the full year are for 2,700 sustainable exits from homelessness.34 Funding for homeless services increased to €70 million in 2016, a rise of over €5 million on the 2015 exchequer
figure of €64.77 million, which was a 32% increase on the amount provided in 2014.35
A number of government departments and voluntary bodies are working to enhance supports to individuals experiencing homelessness or those at risk of becoming homeless. For instance, the Department of Social Protection exercises discretion on a case-by-case basis for Rent Supplement clients that are at risk of homelessness due to increasing rents. There were 4,500 households supported to remain in their own homes in 2015 and a total of 6,000 households since the protection of rent supplement tenancies began in 2014.36 The Tenancy Protection Service operated by Threshold provides advice and support to individuals, couples and families, living in either the Dublin or Cork areas living in private rented accommodation experiencing tenancy problems and whose tenancy is at risk.37 The service was contacted
33 | http://www.homelessdublin.ie/rough-sleeping-count
34 | http://www.housing.gov.ie/sites/default/files/publications/files/homeless_report_-_december_2016.pdf
35 | Social Housing Output 2015 (http://www.environ.ie/housing/social-housing/social-housing-output-2015)
36 | Social Housing Output 2015 (http://www.environ.ie/housing/social-housing/social-housing-output-2015)
37 | http://www.threshold.ie/housing-supports/dublin.html
27National Statement of Housing Supply and Demand 2016 and Outlook for 2017-18
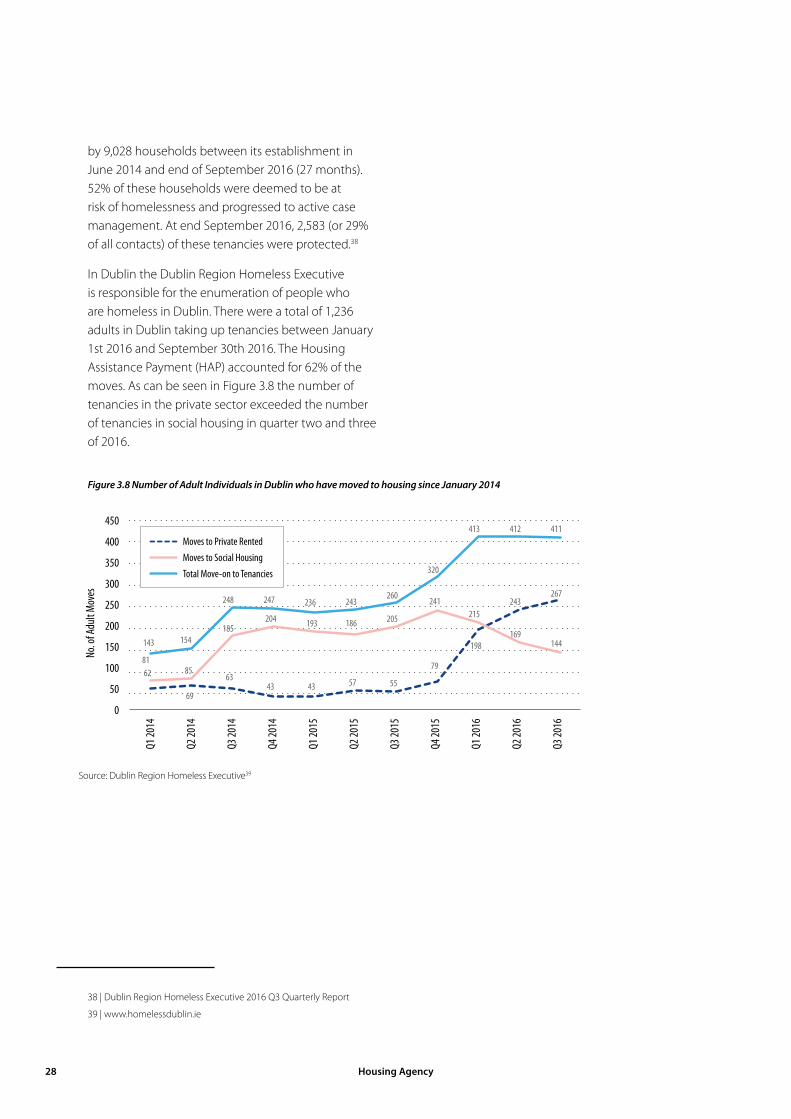
Source: Dublin Region Homeless Executive39
by 9,028 households between its establishment in June 2014 and end of September 2016 (27 months). 52% of these households were deemed to be at risk of homelessness and progressed to active case management. At end September 2016, 2,583 (or 29% of all contacts) of these tenancies were protected.38
In Dublin the Dublin Region Homeless Executive is responsible for the enumeration of people who are homeless in Dublin. There were a total of 1,236 adults in Dublin taking up tenancies between January 1st 2016 and September 30th 2016. The Housing Assistance Payment (HAP) accounted for 62% of the moves. As can be seen in Figure 3.8 the number of tenancies in the private sector exceeded the number of tenancies in social housing in quarter two and three of 2016.
38 | Dublin Region Homeless Executive 2016 Q3 Quarterly Report
39 | www.homelessdublin.ie
Figure 3.8 Number of Adult Individuals in Dublin who have moved to housing since January 2014
62
69
6343 43 57 55
79
198
243267
8185
185204 193 186 205
241215
169144143 154
248 247 236 243260
320
413 412 411
0
50
100
150
200
250
300
350
400
450
Q1 20
14
Q2 20
14
Q3 20
14
Q4 20
14
Q1 20
15
Q2 20
15
Q3 20
15
Q4 20
15
Q1 20
16
Q2 20
16
Q3 20
16
No. o
f Adu
lt M
oves
Moves to Private Rented
Moves to Social Housing
Total Move-on to Tenancies
Housing Agency 28

4.1 Housing costs as a percentage of income
There is an obvious link between the amount of income a household has and its likelihood of being able to afford its accommodation. Using income-to-expenditure ratios is a well-established method of interpreting the financial challenge facing families in meeting the cost of housing.
This ratio approach can be used to assess challenges facing households looking to purchase a home and to describe the financial burden involved in meeting the ongoing costs of renting or repaying a mortgage. However, there is no universally accepted level of housing cost relative to household income. In part, this
is due to the somewhat subjective nature of housing need and difficulties associated with determining a level of housing cost that is sustainable for a household based on the level and degree of security of annual income, accumulated wealth and the household composition.
Turning first to home ownership, ratios of household income to house prices capture an element of the affordability challenge facing individuals looking to buy. Based on transaction price data, the annual Demographia survey rates middle-income housing affordability using the ‘Median Multiple’—the ratio of the median house price to median gross
Chapter 4
The First National Statement of Housing Supply and Demand highlighted the issue of affordability as key to achieving a more balanced and sustainable housing system. This Chapter brings together a number of indicators of affordability, some international and others based on domestic data. International measures of home ownership affordability suggest that, with the exception of Dublin, house prices in Ireland are, at worst, moderately unaffordable. This is borne out by domestic data on average sales prices and net incomes and the proportion of disposable income used for housing costs. This latter data shows that renters tend to have less disposable income and are more likely to experience affordability problems. This Chapter also reports recent trends in relation to mortgage arrears – while there has been a continuing reduction in the number of mortgages in arrears, almost 50,000 mortgages are in arrears of over two years and 147,000 have been restructured (principal dwelling and buy-to-lets combined).
Affordability
40 | Demographia (2017) 13th Annual Demographia International Housing Affordability Survey: Rating Middle-Income Housing Affordability, Q3 2016 http://www.demographia.com/dhi.pdf
29National Statement of Housing Supply and Demand 2016 and Outlook for 2017-18

annual household income.40 The survey covers 367 metropolitan markets with the ‘Median Multiple’ ratio allowing comparisons of this indicator of housing affordability over time and across different urban areas.
According to this measure, house prices in Ireland were ranked as moderately unaffordable with the median house price 3.4 times the median gross annual household income. The aggregate score masks important regional differences; in Dublin the median house price is estimated to be 4.7 times gross annual income— a level categorised as seriously unaffordable. Cork (3.5) and Galway (3.4) were ranked as moderately unaffordable while Waterford (2.6) and Limerick (2.5) as affordable.
The OECD’s standardised price-to-income ratio compares house prices to disposable income per person using the long-run (35 year) average as the benchmark. It is a gauge of the affordability of house purchase for the average buyer and is commonly used to assess housing market conditions across OECD
countries. When the ratio moves above its long-run average over a sustained period, as happened at the turn of the millennium, house prices are less likely to be affordable.
As shown in Figure 4.1, the OECD measure of house price to income ratio was at its long-run average in 2015. This suggests that, at a national level, house prices in Ireland were generally affordable by this measure.
Source: OECD, 2016, Main Economic Indicators Database
Figure 4.1: OECD standardised house price-to-income ratio, 1980 - 2016
Long-run average=100
0
20
40
60
80
100
120
140
160
180
'80 '82 '84 '86 '88 '90 '92 '94 '96 '98 '00 '02 '04 '06 '08 '10 '12 '14 '16
Housing Agency 30

Based on the average sale price of a new house, the Department of Housing, Planning, Community and Local Government tracks purchase repayment affordability for a jointly assessed couple on the mean wage. Acknowledging that not all households contain dual earners with average wages, Figures 4.2 and 4.3 show the proportion of annual after-tax income (excluding any social welfare payments) consumed by mortgage repayments for this type of household. In both cases the amount of disposable income accounted for by mortgage repayments increased from 2012 to 2016, though the cost of ownership never exceeds the 30% of joint after-tax income.
Figure 4.2 Affordability index for a 2 earner household with a 30-year mortgage, 2008 – 2016 (National)
Source: Data supplied by the Department of Housing, Planning, Community and Local Government and updated for 2016 by the Housing Agency
Figure 4.3 Affordability index for a 2 earner household with a 30-year mortgage, 2008– 2016 (Dublin)
Source: Data supplied by the Department of Housing, Planning, Community and Local Government and updated for 2016 by the Housing Agency
While a commonly applied rule of thumb is that households spending more than 30% of disposable household income on their accommodation are at greater risk of facing affordability problems, this approach is not universally accepted. Mortgage underwriting criteria and disposable, after-tax, household income give a different perspective of what households looking to buy can achieve in the market. The indicator presented below focuses on the continuous cost of repaying a mortgage, or covering monthly rent, as a proportion of the disposable household income and estimates how the affordability of basic housing costs varied across the country.
The Central Bank Household Credit Market report identifies an average loan-to-value ratio of 79%, a mean repayment term of 27 years and a standard variable rate of 3.76% on new mortgages for a primary dwelling.41
These terms are applied to the average transaction price, taken from the PSRA Property Transaction Register, in each county to calculate a monthly mortgage repayment. Average monthly rent figures for each county are taken from the Residential Tenancies
24.9
20.5
15.5 16.4 15.6
18.820.4 20.5 21.7
0
5
10
15
20
25
30
2008 2010 2012 2014 2016
30.3
20.517.1
20.718.8
24.7
27.6 29.5 29.6
0
5
10
15
20
25
30
35
2008 2010 2012 2014 2016
41 | Household Credit Market Report, H1 2016, Central Bank of Ireland
31National Statement of Housing Supply and Demand 2016 and Outlook for 2017-18

Board (RTB). It is important to note that the PSRA transaction register and county level rent costs from the RTB do not account for how properties in each county vary in terms of the attributes of the unit—in terms of floor space and number of rooms, for example. Inter-county comparisons should be considered with this in mind. Mean disposable household income is taken from the Survey on Income and Living Conditions (2014), increased by 1.5%.
The results presented in Figure 4.4 should be viewed as broadly indicative and point towards the greatest affordability challenges facing those living in the greater Dublin Area, even when accounting for generally higher levels of disposable household income in these counties. The level of house price dispersion across counties should also be noted.42 In Longford, the most affordable county, repayments consume 24.9 percentage points less of disposable income than in Dublin, where repayments account for 33% of net income. Limerick is identified as the most affordable of the four main urban centres— Cork, Dublin, Galway and Limerick—supporting the results of the Demographia survey based on the ‘Median Multiple’.
Figure 4.4 also shows that, as a proportion of disposable household income, on-going housing costs are higher for those renting privately in every county, except Wicklow where renting is marginally cheaper than being an owner-occupier. The analysis also confirms renters pay a higher proportion of their disposable income on their accommodation, compared to owners. Households in the private rented sector tend to have a lower level of annual disposable household income than owner-occupiers. The national average annual disposable income for holdholds renting privately is €37,819 - approximately 81% of the equivalent average for owner occupiers, €46,617.43 This also leaves private sector renters with less disposable income to meet other living costs.
42 | Edgar Morgenroth (2016) Housing Supply and House Price Trends at the County Level https://www.esri.ie/publications/housing-supply-and-house-price-trends-at-the-county-level/
43 | Survey on Income and Living Conditions 2014 adjusted upward by 1.5%
Housing Agency 32

Source: OECD, 2016, Main Economic Indicators Database
Figure 4.4 Regular monthly housing costs as percentage of disposable household income (excluding cost of utilities and essential maintenance) — January-June, 2016
0 10 20 30 40 50
DublinWicklow
KildareMeath
ClareCork
GalwayKilkenny
LouthKerry
WexfordCarlow
WaterfordMonaghan
DonegalLaois
WestmeathO�aly
TipperaryLimerick
MayoCavanSligo
RoscommonLeitrim
Longford
%
Monthly repayment aspercentage of monthlydisposable income, Renter
Monthly repayment aspercentage of monthlydisposable income, Owner
These ratio measures are commonly used to track changes in affordability across tenures and regions. They are, of course, sensitive to the proportions used and do not account for households’ personal situations such as: household composition, the absolute level of household income and household wealth. Income from employment is a crucial component of household disposable income and opportunities in the labour market are an important driver of the cost of housing. The next section examines recent changes in the labour market and points to ways these developments may be influencing the affordability of housing.
33National Statement of Housing Supply and Demand 2016 and Outlook for 2017-18

Source: Central Statistics Office (2016)
Table 4.1: Employment by sector, 2007 Q2 – 2016 Q2
4.2 Employment and household income
Income and earnings underpin the ratios used to describe various aspects of the affordability of housing costs. Households meet their costs through a number of channels, but work, wages and the level of take-home pay plays a central role in allowing people to meet ongoing expenses. Employment is crucial as households—particularly owner occupiers with a mortgage or renters in the private market—deprived of work are likely to have difficulty meeting their housing costs even if the ratio of income to expense is below the 30% standard derived from the affordability ratios.
The breakdown of employment by sector presented in Table 4.1 gives an idea of the shifts that have occurred in the job market over the past eight years. Notably, despite recent job creation in the sector, employment in construction related activities has roughly halved since 2007. In terms of the overall level of employment, an increase in the number of people in information and communication, health, and education have helped offset reductions in other sectors.
2007 2016 Change (%)
Wholesale & retail trade, repair of motor vehicles & motorcycles 303.5 275.4 -9.26
Human health & social work activities 212.2 251.4 18.47
Industry 302.7 257.3 -15.00
Education 140 149.8 7.00
Accommodation & food service activities 134.1 145.8 8.72
Construction 276.2 136.4 -50.62
Professional, scientific & technical activities 111.5 115.6 3.68
Agriculture, forestry & fishing 109.5 114.8 4.84
Other economic activities 98.9 106 7.18
Financial, insurance & real estate activities 101.9 101.7 -0.20
Public administration & defense, compulsory social security 102.6 104.6 1.95
Transportation & storage 94.1 94.2 0.11
Information & communication 70.2 84.9 20.94
Administrative & support service activities 79.2 70.6 -10.86
Housing Agency 34
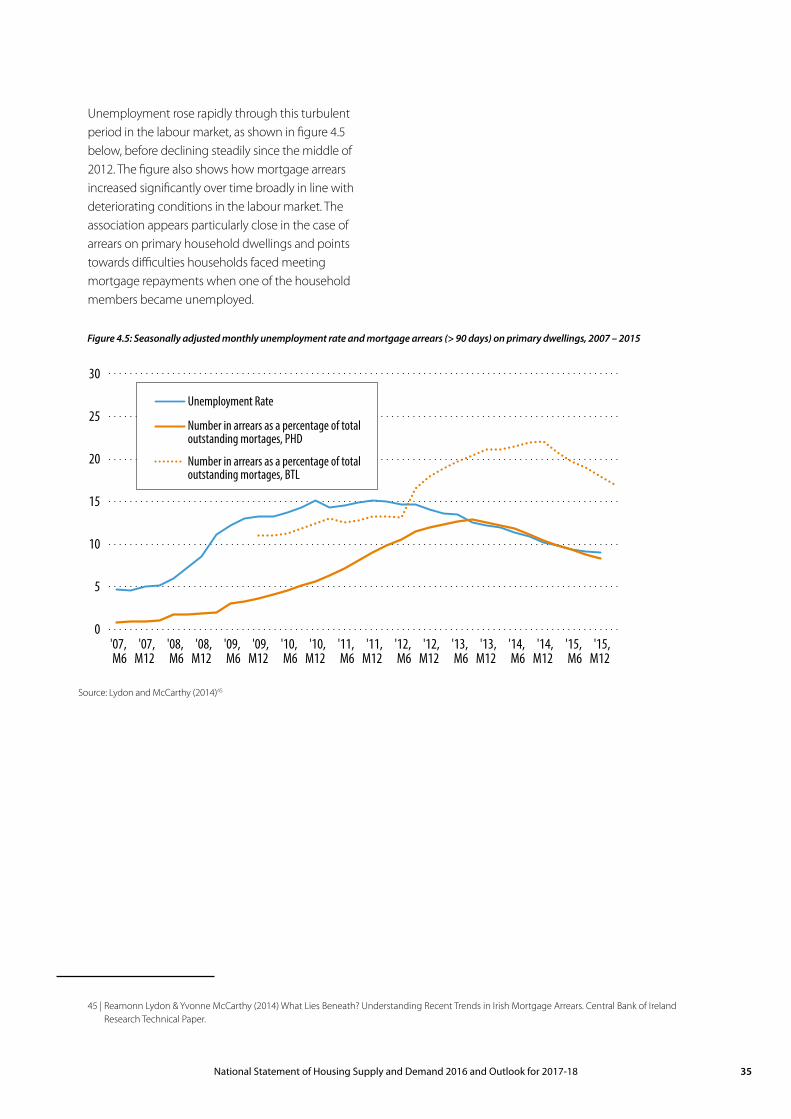
Unemployment rose rapidly through this turbulent period in the labour market, as shown in figure 4.5 below, before declining steadily since the middle of 2012. The figure also shows how mortgage arrears increased significantly over time broadly in line with deteriorating conditions in the labour market. The association appears particularly close in the case of arrears on primary household dwellings and points towards difficulties households faced meeting mortgage repayments when one of the household members became unemployed.
Source: Lydon and McCarthy (2014)45
Figure 4.5: Seasonally adjusted monthly unemployment rate and mortgage arrears (> 90 days) on primary dwellings, 2007 – 2015
0
5
10
15
20
25
30
'07,M6
'07,M12
'08,M6
'08,M12
'09,M6
'09,M12
'10,M6
'10,M12
'11,M6
'11,M12
'12,M6
'12,M12
'13,M6
'13,M12
'14,M6
'14,M12
'15,M6
'15,M12
%
Unemployment Rate
Number in arrears as a percentage of totaloutstanding mortages, PHD
Number in arrears as a percentage of totaloutstanding mortages, BTL
45 | Reamonn Lydon & Yvonne McCarthy (2014) What Lies Beneath? Understanding Recent Trends in Irish Mortgage Arrears. Central Bank of Ireland Research Technical Paper.
35National Statement of Housing Supply and Demand 2016 and Outlook for 2017-18

Those in employment also experienced difficulties making mortgage payments. Results from a survey commissioned by the Central Bank and carried out between May 2013 and February 2014 showed the head of the household was currently employed in three-quarters of the arrears cases included in the sample.46 Over half (52%) of borrowers in arrears, however, reported a significant fall in their household income over the year, compared to one-third (34%) of non-arrears cases.
Households renting are generally not exposed to the same level of personal debt, though they have experienced a sustained increase in monthly rent during a period where the conditions in the labour market have improved significantly, but remain challenging labour market conditions have improved signficantly, but remain challenging in a number of sectors . Households living in rented accommodation, paying market rate or below, tend to have a lower level of disposable income than owner-occupiers. Much of the difference in income can be traced to household composition and type of work undertaken by the head of the household; renters are generally younger than owner occupiers and are more likely to be engaged in work classified as semi-skilled or manual.
4.3 Mortgage arrears and repossessions
Principal dwelling houses arrears
The Central Bank released its third quarter 2016 Mortgage Arrears and Repossession Statistics in early December 2016. Mortgage accounts for Principal Dwelling Houses (PDH) in arrears continued to fall in Q3 2016, the thirteenth consecutive quarter of decline.
A total of 738,506 private residential mortgage accounts were held in the Republic of Ireland by end-September 2016, see Table 4.2. Approximately 11% of these mortgages, (79,562 accounts) were in arrears, a 13.8 per cent reduction since Q3 2015. There were 56,350 accounts (8.0% of the total number of all outstanding residential mortgage loan accounts) in arrears of more than 90 days, with an outstanding balance of €11.3 billion, in September 2016.
There were 121,140 principal dwelling houses mortgage accounts categorised as restructured by the end of the third quarter of the year, the highest number since this series began in 2010. Arrears capitalisations and permanent split mortgages showed the most significant increases and continued to account for the largest shares of restructured accounts at 31 per cent and 22 per cent, respectively, at end of September.
Of these restructured accounts 78% were deemed to be meeting the terms of their current restructure arrangement. Not all restructure types represent longer-term sustainable solutions as defined within the Mortgage Arrears Resolution Targets; however, data for the first half of the year indicates a fall in the reliance on short-term arrangements, such as time-limited interest only restructures.47
Buy-to-let arrears
By the end of September 2016, there were 132,571 residential mortgage accounts for buy-to-let (BTL) properties held in the Republic of Ireland, to a value of €24.6 billion. Just over 26,000 of these mortgages were in arrears, down 14% since Q3 2015. However, over half of these mortgages are in arrears of over two years (14,518), with an outstanding balance of €4.3 billion (equivalent to 18 per cent of the total outstanding balance on all buy-to-let mortgage accounts). An additional 26,151 buy-to-let mortgages were recorded as restructured.
46 | Reamonn Lydon & Yvonne McCarthy (2014) What Lies Beneath? Understanding Recent Trends in Irish Mortgage Arrears. Central Bank of Ireland Research Technical Paper.
47 | http://www.centralbank.ie/polstats/stats/mortgagearrears/Documents/2016q3_ie_mortgage_arrears_statistics.pdf
Housing Agency 36
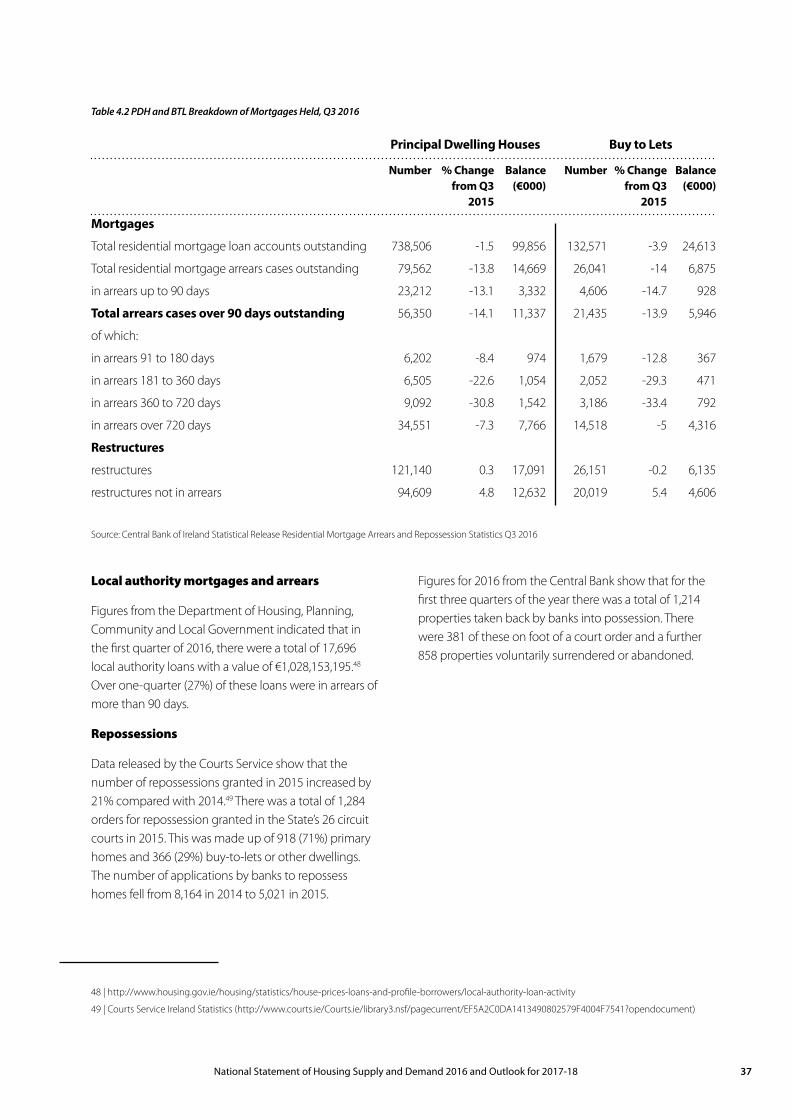
Source: Central Bank of Ireland Statistical Release Residential Mortgage Arrears and Repossession Statistics Q3 2016
Table 4.2 PDH and BTL Breakdown of Mortgages Held, Q3 2016
Principal Dwelling Houses Buy to Lets
Number % Change Balance Number % Change Balance from Q3 (€000) from Q3 (€000) 2015 2015
Mortgages
Total residential mortgage loan accounts outstanding 738,506 -1.5 99,856 132,571 -3.9 24,613
Total residential mortgage arrears cases outstanding 79,562 -13.8 14,669 26,041 -14 6,875
in arrears up to 90 days 23,212 -13.1 3,332 4,606 -14.7 928
Total arrears cases over 90 days outstanding 56,350 -14.1 11,337 21,435 -13.9 5,946
of which:
in arrears 91 to 180 days 6,202 -8.4 974 1,679 -12.8 367
in arrears 181 to 360 days 6,505 -22.6 1,054 2,052 -29.3 471
in arrears 360 to 720 days 9,092 -30.8 1,542 3,186 -33.4 792
in arrears over 720 days 34,551 -7.3 7,766 14,518 -5 4,316
Restructures
restructures 121,140 0.3 17,091 26,151 -0.2 6,135
restructures not in arrears 94,609 4.8 12,632 20,019 5.4 4,606
Local authority mortgages and arrears
Figures from the Department of Housing, Planning, Community and Local Government indicated that in the first quarter of 2016, there were a total of 17,696 local authority loans with a value of €1,028,153,195.48 Over one-quarter (27%) of these loans were in arrears of more than 90 days.
Repossessions
Data released by the Courts Service show that the number of repossessions granted in 2015 increased by 21% compared with 2014.49 There was a total of 1,284 orders for repossession granted in the State’s 26 circuit courts in 2015. This was made up of 918 (71%) primary homes and 366 (29%) buy-to-lets or other dwellings. The number of applications by banks to repossess homes fell from 8,164 in 2014 to 5,021 in 2015.
Figures for 2016 from the Central Bank show that for the first three quarters of the year there was a total of 1,214 properties taken back by banks into possession. There were 381 of these on foot of a court order and a further 858 properties voluntarily surrendered or abandoned.
48 | http://www.housing.gov.ie/housing/statistics/house-prices-loans-and-profile-borrowers/local-authority-loan-activity
49 | Courts Service Ireland Statistics (http://www.courts.ie/Courts.ie/library3.nsf/pagecurrent/EF5A2C0DA1413490802579F4004F7541?opendocument)
37National Statement of Housing Supply and Demand 2016 and Outlook for 2017-18

Housing LegistlationRebuilding Ireland –
Action Plan for Housing and Homelessness 2016
www.rebuildingireland.ie
The Action Plan for Housing and Homelessness sets out proposed legislative changes:
To fast-track planning approval procedures for large-scale residential developments (100+ homes) through direct applications to An Bord Pleanála.
To review the Part 8 process to provide revised and streamlined timelines for decision making on local authority development proposals, which will include social housing, roads, community facilities and libraries.
To amend the Residential Tenancies Act to provide measures to prevent large number of residents in a single development having their tenancies served with termination notices simultaneously. It is proposed that where a landlord proposes to sell 10 or more units within a single development that the sale will be subject to existing tenants remaining in situ, other than in exceptional circumstances.
To consider potential legislation on mortgage arrears.
New Repair & Leasing Scheme - €6m to kick-start in 2017 - €140M to 2021 - suitable vacant properties are brought back into use for social leasing purposes and repair and improvement works are funded to bring them up to the standard for rented accommodation and the cost of the works is then deducted from lease payments over an agreed lease term. This is currently being piloted in Waterford and Carlow local authority areas and is due to be rolled out nationally by April 2017.
Appendix 1
During 2015 and 2016 a substantial volume of legislative changes and Government initiatives were introduced in response to housing issues in Ireland. The following table sets out the key measures grouped under four headings: housing legislation, taxation changes, changes to rules on mortgage lending and the changes made to housing delivery channels.
Policy Developments
Housing Agency 38

New Buy and Renew initiative - €25m in 2017 rising up to €50m in 2018 - facilitates local authorities and AHBs to purchase and renew housing units in need of remediation and make them available for social housing.
Rebuilding Ireland
Strategy for the Rental Sector
http://www.housing.gov.ie/sites/default/files/publications/files/strategy_for_the_rental_sector_final.pdf
http://www.oireachtas.ie/viewdoc.asp?DocID=33811&&CatID=59
The Rental Strategy puts forward an integrated range of complementary measures across the areas of security, supply, standards and services.
The Rent Predictability measure, introduced in the Strategy, was legislated for in the Planning and Development (Housing) and Residential Tenancies Act 2016 and came into effect the day after enactment on Friday 23rd of December 2016.
The Rent Predictability measure applies to areas where annual rent inflation has reached or exceeded 7% in four of the last six quarters and the average rent in the most recent quarter has exceeded the national average rent.
Areas, as recommended by the Housing Agency (following consultation with local authorities) and confirmed by the Residential Tenancy Board may be designated by the Minister as Rent Pressure Zones (RPZ).
In RPZs annual rent increases will be no greater than 4% for a maximum of three years.
Dublin (i.e. the administrative areas of the 4 Dublin local authorities) and Cork city (the Cork City Council administrative area) were designed as RPZs in December 2016 and a further 12 areas were designed in January 2017.
The Urban Regeneration and Housing Act, 2015
http://www.irishstatutebook.ie/eli/2015/act/33/enacted/en/html?q=Urban&years=2015 &search_type=all
Amends Part V of the Planning and Development Act, 2000, which deals with social and affordable housing with a requirement for up to 10% social housing in developments in excess of 9 units. The making of cash payments in lieu of social housing is to be discontinued.
Introduces a vacant site levy to incentivise urban regeneration and the provision of housing in central urban areas. This will come into effect from 2019 (backdated to 2018), at which time local authorities will be able to apply a vacant site levy of 3% of market value in certain circumstances.
Revises development contributions schemes for local authorities. Developers will be enabled to avail of lower development contribution rates for certain residential developments.
The Residential Tenancies (Amendment) Act, 2015
http://www.irishstatutebook.ie/eli/2015/act/42/
enacted/en/html?q=Residential+&search_type=all
Extends the duration between rent reviews from 12 months to 24 months.
Extends the period of notice of a new rent from 28 days to 90 days.
Changes the notice period required to be given when terminating a tenancy.
Limits rent reviews to once every two years.
Renamed the Private Residential Tenancies Board as the Residential Tenancies Board (RTB).
Introduces a free mediation service from the RTB to resolve disputes between landlords and tenants.
Extends registration to tenants of Approved Housing Bodies.
Introduces additional protections for tenants if the landlords wants to terminate a tenancy.
39National Statement of Housing Supply and Demand 2016 and Outlook for 2017-18

Simplifies the process for landlords to deal with problem tenants through the RTB and District Court as opposed to the more costly procedure of the Circuit Court.
Provides a legal base for a deposit protection scheme, where deposits are lodged with the RTB rather than the landlord.
The Planning and Development (Amendment) Act, 2015
http://www.irishstatutebook.ie/ eli/2015/act/63/enacted/en/html?q=planning+and+ development&years =2015&search_type=actshtml?q=planning+ and+development&years= 2015&search_type=acts
Changes to Ministerial Planning Guidelines: Planning authorities shall have regard to Ministerial guidelines in the performance of their planning functions, such as in the adoption of development plans and the determination of planning applications.
The Minister may expressly state specific planning policy requirements to be applied by planning authorities, or An Bord Pleanála.
Streamlines the assessment of applications seeking modifications to existing planning permissions in respect of multi-unit housing developments (primarily apartment block and duplex type developments) on foot of the issuing of new or revised apartment standard guidelines by the Minister.
Changes were made to the planning process for strategic development zones (SDZs). If when appealed to An Bord Pleanála modifications of a material nature are deemed necessary the whole SDZ planning scheme process does not need to start from the beginning. This has led to significant delays in the past.
The new provisions in section 6 will allow a planning authority, on its own behalf where it is promoting an SDZ scheme, or on behalf of a development agency promoting an SDZ planning scheme, to make an application to An Bord Pleanála for an amendment to a previously approved SDZ scheme which may be in the course of being developed.
Revised apartment guidelines entitled – Sustainable Urban Housing: Design Standards for New Apartments, Guidelines for Planning Authorities were issued by the Minister in December 2015. These guidelines update the Sustainable Urban Housing: Design Standards for New Apartments published by the Department in 2007.
TaxationBudget 2017
www.budget.gov.ie
Help-to-buy Incentive. A tax rebate of up to €20,000 to assist first-time buyers with the deposit for a new home.
Mortgage Interest Relief Extension. Extension of relief beyond 2017 to improve the affordability of mortgage repayments for existing recipients.
CAT Tax-Free Threshold Increase for individuals from €280,000 to €310,000.
Rent-A-Room Relief. Higher tax ceiling of €14,000 on rental income to encourage homeowners to rent out a vacant room.
Mortgage Increase Relief Deductibility for Landlords. An increase in interest deductibility from 75% to 80% to support investment in residential rental property.
Housing Agency 40

Budget 2016 Home Renovation Incentive extended until 31st December 2016.
Capital Acquisitions Tax (CAT) increased from €225,000 to €280,000 for gifts and inheritances from parents to their children.
Finance Act 2015
http://www.irishstatutebook.ie/ eli/2015/act/37/enacted/en/html?q=Finance+Act+&years= 2015&search_type=acts
Tax relief measures were introduced in the Finance (Miscellaneous Provisions) Act 2015 to allow landlords leasing to tenants in receipt of social housing supports (rent supplement, HAP or RAS) to claim 100% relief on their mortgage interest, as an expense against rental income. The accommodation must be available for three years and must be registered with the Residential Tenancies Board.
Finance Act 2012.
Section 604A
http://www.irishstatutebook.ie/ eli/2012/act/9/section/64 /enacted/en/html?q title= Finance+Act+&q=604A&years =2012&search_type=acts
Capital gains tax relief on properties purchased after 7th December 2011 discontinued
Budget 2015
www.budget.gov.ie
Capital Gains Tax. Provisions introduced in 2009 and which applied an 80% rate of tax to gains from disposals of land (where those gains are attributable to a relevant planning decision by a planning authority) were abolished in the case of disposals made on or after 1 January 2015. Such land disposals will instead be liable to a lower 33% standard rate of Capital Gains Tax.50
First-Time Buyers Deposit Interest (DIRT). A relief from DIRT on savings used by first-time house buyers towards the deposit on a home.
Windfall tax provisions introduced in 2009 applying an 80% rate of tax to certain profits or gains from land disposals or land development, where these profits or gains are attributable to a relevant planning decision by a planning authority abolished from 1st January 2015.
Living City Initiative. Extension of initiative to landlords to support investment in the rental market.
Support for new investment in student accommodation – Ireland Strategic Investment Fund (ISIF)
ISIF supported fund for the development of a new fund for the delivery of mixed-tenure residential developments.
ISIF infrastructure fund to support large scale priority development.
Home Innovation Incentive Extension of a tax credit for house repair or renovation extended until 2018.
50 | Summary of 2015 Budget Measures Policy Changes (http://www.budget.gov.ie/Budgets/2015/Documents/2%20Summary%20of%202015%20Budget%20Measures%2014%20Oct%2000.09.pdf accessed 29/3/16)
41National Statement of Housing Supply and Demand 2016 and Outlook for 2017-18

51 | Central Bank of Ireland (https://www.centralbank.ie/press-area/press-releases/Pages/CentralBankannouncesnewregulationsonresidentialmortgagelending.aspx)
52 | https://www.centralbank.ie/stability/MacroprudentialPol/Pages/LoantoValueLoantoIncome.aspx
Mortgage LendingCentral Bank Mortgage Measures
1st January 2015
New Central Bank Mortgage Measures
1st January 2017
New regulations announced by The Central Bank of Ireland Regulations in January 2015 came into effect applying proportionate limits to mortgage lending by regulated financial services providers in the Irish market.51
Primary Dwelling Home (PDH) mortgages for non-first time buyers are subject to a limit of 80 % LTV.
For First Time Buyers (FTBs) of properties valued up to €220,000, a maximum LTV of 90 % will apply. For FTBs of properties over €220,000 a 90 % limit will apply on the first €220,000 value of a property and an 80 % limit will apply on any excess value over this amount. The cumulative monetary value of loans for principal dwelling purposes which breach either of these limits should not exceed 15 % of the euro value of all PDH loans on an annual basis.
Buy to Let (BTL) mortgages are subject to a limit of 70 % LTV. The limit can only be exceeded by no more than 10 % of the euro value of all housing loans for non-PDH purposes during an annual period.
PDH mortgage loans are subject to a limit of 3.5 times loan to gross income (LTI). This limit should not be exceeded by more than 20 % of the euro value of all housing loans for PDH purposes during an annual period.
First Time Buyers mortgages are capped at 3.5 times income (LTI) and a 10% deposit is required. (20% of all mortgages can be above cap). LTV limits for FTBs set at 90%.
For second and subsequent buyers, mortgages are capped at 3.5 times income and a 20% deposit is required. (20% of all mortgages can be above cap). LTV limits for subsequent buyer set at 80%.
Buy to Lets no changes (still require a 30% deposit). LTV limits for BTLs set at 70%.52
Housing Agency 42

53 | http://www.irishstatutebook.ie/eli/2016/si/40/made/en/pdf
Social housing delivery mechanismsHousing Assistance Payments (HAP)
The Housing Assistance Payments Regulations 2014 came into operation following the enactment of the Housing (Miscellaneous Provisions) Act 2014. This payment was introduced to allow people eligible for social housing, with a long-term housing need, to live in private rental accommodation and will replace Rent Supplement for those with a long-term housing need.
Under the HAP (Amendment) Regulations 2016 maximum monthly rent limits are set for each of the local authorities. Since the 1st of July 2016 the prescribed maximum rent limits for all local authorities operating HAP have been significantly enhanced. This along with the extension of 20% flexibility above the prescribed maximum rent limits to all local authorities has facilitated an increase in the number of tenancies secured under HAP.
New incremental tenant purchase scheme
On the 18th November 2015 a new tenant purchase scheme was announced for tenants to purchase local authority houses and apartments. The scheme became effective on the 1st January 2016. The new scheme enables tenants to purchase homes earlier than under previous such schemes. The scheme involves a discount for a purchaser of 60%, 50% or 40% off the purchase price of their home and an incremental charge equivalent to the discount. This charge reduces to nil over a period of years in annual increments of 2% of the total value of the house, unless the tenant purchaser resells the house or fails to comply with sale conditions during the charged period. In the event of a resale within the charged period, the tenant purchaser will be required to pay to the local authority the outstanding incremental charge on the house from any resale profits.
Social Housing Allocation (Amendment) Regulations 2016
Choice Based Letting. A housing authority must incorporate the choice-based letting procedure when allocating dwellings under their allocation system.
43National Statement of Housing Supply and Demand 2016 and Outlook for 2017-18

Notes
Housing Agency 44


www.housingagency.ie