National Skills Development Strategy Implementation Report ...€¦ · to present the second...
89
National Skills National Skills Development Strategy Development Strategy Implementation Report Implementation Report April 2002 – March 2003 April 2002 – March 2003 i Department of Labour Text Employment and Skills Development Services / Human Resources Development Branch Department of Labour Editing, Layout and Design, and Distribution Media Production Unit Chief Directorate of Communication Department of Labour Publisher Department of Labour Private Bag X117 Pretoria 0001 South Africa Printer Formeset, Cape Town for Government Printer ISBN: 0-621-34952-6 Website: www.labour.gov.za
Transcript of National Skills Development Strategy Implementation Report ...€¦ · to present the second...

National SkillsNational SkillsDevelopment StrategyDevelopment StrategyImplementation Report Implementation Report April 2002 – March 2003April 2002 – March 2003
i
Department of Labour
TextEmployment and Skills Development Services /
Human Resources Development BranchDepartment of Labour
Editing, Layout and Design, and DistributionMedia Production Unit
Chief Directorate of CommunicationDepartment of Labour
PublisherDepartment of Labour
Private Bag X117Pretoria 0001South Africa
PrinterFormeset, Cape Town for Government Printer
ISBN: 0-621-34952-6
Website: www.labour.gov.za

ii

Foreword by the Foreword by the Minister of LabourMinister of Labour
When launching the National Skills Development Strategy in February 2001, I promised toreport annually on progress in achieving the objectives of the strategy. I am therefore pleasedto present the second National Skills Development Strategy Implementation Report for theperiod April 2002 to March 2003.
Since the National Skills Conference in October 2002, we have witnessed a number of keydevelopments that augur well for our country. Most of the Sector Education and TrainingAuthorities have matured and taken on board the challenges I posed to them last year.Learnership programmes are now available in all sectors, thousands of learners have enteredlearnership agreements, National Skills Fund strategic projects have started, many of whichhave begun to bear fruit for the beneficiaries concerned. The Provincial Offices of theDepartment of Labour have facilitated training for many more persons compared to last year.
Quite a few challenges remain. We still see important challenges in achieving the equity targetsof the National Strategy. A few Sector Education and Training Authorities have not performedas expected. In such cases, we have been quick to respond. Firstly, we secured thecommitment of social partners to build the capacity of ‘their’ Sector Education and TrainingAuthorities at the Growth and Development Summit that was held on 7 June 2003. Secondly, Ihave submitted to Parliament proposed amendments to the Skills Development Act to enableme to intervene with respect to poorly performing Sector Education and Training Authorities.The signing of the Growth and Development Summit Agreement in June 2003 has, of course,given rise to additional challenges, particularly in respect of targets on learners. This issomething we will have to bear in mind as we go forward from this conference.
The National Skills Development Strategy is no longer just an ambitious vision of the future, itis now a reality for more and more ordinary South Africans. These achievements will be erodedif we do not confront the challenges we still face and find ways of achieving the ‘hard to reach’targets that we have agreed upon. In this regard, it is important to take into account that thecurrent National Skills Development Strategy will come to an end in March 2005. We need tomobilise for the achievement of the outstanding objectives and ensure that the targets we setfor ourselves are met. I trust that this Report will provide a useful basis for deliberating onprogress and crafting the way forward.
Thank you for your hard work and continued contributions to date.
MMS Mdladlana MPMinister of Labour
iii

iv

Contents Contents Page
List of acronyms viiList of SETAs vii
Chapter 1 Introduction 1
1.1 Background to the NSDS 11.2 NSDS objectives and success indicators 11.3 NSDS implementing agents 31.4 Monitoring and evaluation of the Skills Development Strategy 3
Chapter 2 Labour market and policy context for skills development 5
2.1 Labour market and skills development 52.1.1 Labour market and employment trends 52.1.2 Employment and occupations 92.1.3 Qualification levels of the unemployed 92.1.4 Labour market and unemployment 11
2.2 Policy content 12
Chapter 3 Developing a culture of high quality lifelong learning 15
3.1 Setting the scene 153.2 Success Indicator 1.1 15
3.2.1 Review of 2001/02 findings 153.2.2 Progress made during 2002/03 16
3.3 Success Indicator 1.2 173.3.1 Review of 2001/02 findings 173.3.2 Progress made during 2002/03 18
3.4 Success Indicator 1.3 203.4.1 Review of 2001/02 findings 213.4.2 Progress made during 2002/03 21
3.5 Achievements and challenges 22
Chapter 4 Fostering skills development in the formal economy for productivity and employment growth 23
4.1 Setting the scene 234.2 Success Indicator 2.1 23
4.2.1 Review of 2001/02 findings 234.2.2 Progress made during 2002/03 24
4.3 Success Indicator 2.2 244.3.1 Review of 2001/02 findings 244.3.2 Progress made during 2002/03 24
4.4 Success Indicator 2.3 264.4.1 Review of 2001/02 findings 264.4.2 Progress made during 2002/03 26
4.5 Success Indicator 2.4 274.5.1 Review of 2001/02 findings 274.5.2 Progress made during 2002/03 27
4.6 Achievements and challenges 27
v

Chapter 5 Stimulating and supporting skills development in small businesses 29
5.1 Setting the scene 295.2 Success Indicator 3.1 29
5.2.1 Review of 2001/02 findings 295.2.2 Progress made during 2002/03 30
5.2.2.1 SMME participation in WSP grant system 305.2.2.2 SETA discretionary grants and SMMEs 305.2.2.3 NSF projects to support SMMEs 32
5.3 Achievements and challenges 34
Chapter 6 Promoting skills development for employability and sustainablelivelihoods through social development initiatives 35
6.1 Setting the scene 356.2 Success Indicator 4.1 35
6.2.1 Review of 2001/02 findings 356.2.2 Progress made during 2002/03 36
6.3 Success Indicator 4.2 416.3.1 Review of 2001/02 findings 416.3.2 Progress made during 2002/03 41
6.4 Achievements and challenges 43
Chapter 7 Assisting new entrants into employment 44
7.1 Setting the scene 447.2 Success Indicator 5.1 44
7.2.1 Review of 2001/02 findings 447.2.2 Progress made during 2002/03 44
7.3 Success Indicator 5.2 467.3.1 Review of 2001/02 findings 467.3.2 Progress made during 2002/03 46
7.4 Bursaries 467.5 Achievements and challenges 47
Chapter 8 Progress on equity targets across all NSDS objectives 48
8.1 Background 488.2 Objective One 48
8.2.1 Success Indicator 1.1 488.2.2 Success Indicator 1.2 49
8.3 Objective Four 498.3.1 Success Indicator 4.1 49
8.4 Objective Five 518.4.1 Success Indicator 5.1 51
8.5 Achievements and challenges 52
Chapter 9 Way forward 53
Appendix 1 – Investors in People 55Appendix 2 – Registered Learnerships by SETAs 59
vi

List of acronymsList of acronyms
DOL - Department of LabourSETA - Sector Education and Training AuthorityNSDS - National Skills Development StrategyNQF - National Qualifications FrameworkABET - Adult Basic Education and TrainingSDF - Skills Development FacilitatorRPL - Recognition of Prior LearningSQMR - SETA Quarterly Monitoring ReportWSP - Workplace Skills PlanWSIR - Workplace Skills Implementation Report
List of SETList of SET AsAs
Financial and Accounting Services FASSETBanking Sector Education and Training Authority BANKSETAChemical Industries Education and Training Authority CHIETAClothing, Textile, Footwear and Leather Sector Education and Training Authority CTFLConstruction Education and Training Authority CETADiplomacy, Intelligence, Defence and Trade & Industry Sector Education and Training Authority DIDTETAEducation, Training and Development Practices Sector Education and Training Authority ETDPSETAEnergy Sector Education and Training Authority ESETAFood And Beverages Manufacturing Industry Sector Education and Training Authority FOODBEVForest Industries Sector Education and Training Authority FIETAHealth And Welfare Sector Education and Training Authority HWSETAInformation Systems, Electronics and Telecommunication Technologies ISETTInsurance Sector Education and Training Authority INSETALocal Government, Water and Related Services Sector Education and Training Authority LGWSETAMedia, Advertising, Publishing, Printing and Packaging MAPPPMining Qualifications Authority MQAManufacturing, Engineering and Related Services Education And Training Authority MERSETAPolice, Private Security, Legal and Correctional Services Sector Education and Training Authority POSLECSETAPrimary Agriculture Education and Training Authority PAETAPublic Services Sector Education and Training Authority PSETASecondary Agriculture Sector Education and Training Authority SETASAServices Sector Education and Training Authority SERVICESTourism And Hospitality Education and Training Authority THETATransport Education and Training Authority TETAWholesale And Retail Sector Education and Training Authority W&RSETA
vii

viii

1
Chapter 1
IntroductionIntroduction
1.1 Background to the NSDS
The Skills Development Act of 1998 and Skills Development Levies Act of 1999 aim to establisha cost effective and high quality skills development system, which supports economic growth,employment creation, social development and is responsive to national and individual needs.Through these Acts the National Skills Authority has been established which represents allstakeholders to the Skills Development Act. The National Skills Authority (NSA) advises theMinister of Labour on the National Skills Development Strategy.
The National Skills Development Strategy (NSDS) was drafted by the Department of Labourunder the direction of the NSA. It was born out of extensive research, debate and consultationwith key stakeholders. The overall vision of the NSDS is “Skills for Productive Citizenship forAll”. Productive citizenship refers to the right of people, not only to vote and participate in ourdemocracy, but also to contribute to, and make decisions about, their own work life. The NSDSis aimed at addressing the structural problems of the labour market inherited from the past, andtransforming the South African labour market from one with a low skills base to onecharacterised by rising skills and a commitment to lifelong learning. The NSDS also seeks toensure that through responsive education and training the labour market is better able tosupport social development to reverse the challenges inherited from the past, such as poverty,inequality, disease and unemployment. The NSDS is an inclusive strategy that addressesnational, provincial, sectoral and individual needs.
1.2 NSDS objectives and success indicators
The NSDS takes forward the broad objectives of the Skills Development Act by providing clearand focused objectives and success indicators for achievement by March 2005. The NSDS hasfive objectives, twelve success indicators and three equity targets. It is believed that theachievement of these objectives and targets will move the country forward significantly towardsthe overall objectives of the skills development legislation. These objectives and successindicators are listed as follows:

2
National Skills Development Strategy
The equity targets span across all five objectives and state that the beneficiaries of thestrategy should be 85% black, 54% female and 4% people with disabilities.
Objective Success Indicator1. Developing a culture ofhigh quality lifelonglearning.
1.1 By March 2005, 70 % of workers will have at least a level onequalification on the National Qualification Framework.1.2 By March 2005, a minimum of 15 % of workers to haveembarked on a structured learning programme, of whom at least50 % have completed their programme satisfactorily.1.3 By March 2005, an average of 20 enterprises per sector, (toinclude large, medium and small enterprises), and at least fivenational government departments, to be committed to, or haveachieved, an agreed national standard for enterprise-based peopledevelopment.
2. Fostering skillsdevelopment in the formaleconomy for productivityand employment growth.
2.1 By March 2005, at least 75 % of enterprises with more than150 workers are receiving skills development grants and thecontributions towards productivity and employer and employeebenefits are measured.2.2 By March 2005, at least 40 % of enterprises employingbetween 50 and 150 workers are receiving skills developmentgrants and the contributions towards productivity and employer andemployee benefits are measured. 2.3 By March 2005, learnerships are available to workers in everysector. (Precise targets will be agreed with each Sector Educationand Training Authority.). 2.4 By March 2005, all government departments assess and reporton budgeted expenditure for skills development relevant to PublicService, sector and departmental priorities.
3. Stimulating andsupporting skillsdevelopment in smallbusinesses.
3.1 By March 2005, at least 20 % of new and existing registeredsmall businesses to be supported in skills development initiativesand the impact of such support to be measured.
4. Promoting skillsdevelopment foremployability andsustainable livelihoodsthrough socialdevelopment initiatives.
4.1. By March 2003, 100% of the National Skills Fundapportionment to social development is spent on viabledevelopment projects.4.2. By March 2005, the impact of the National Skills Fund ismeasured by project type and duration, including details ofplacement rates, which shall be at least 70%.
5. Assisting new entrantsinto employment.
5.1 By March 2005, a minimum of 80 000 people under the age of30 have entered learnerships.5.2. By March 2005, a minimum of 50% of those who havecompleted learnerships, within six months of completion areemployed (e.g. have a job or are self-employed), in full-time studyor further training, or are in a social development programme.

1 The Public Services SETA is funded differently as they receive a budget allocation through the Department ofPublic Service and Administration (DPSA).
3
1.3 NSDS implementing agents
The implementation of the NSDS is the responsibility of the National Skills Fund (NSF), theProvincial Offices of the Department of Labour and the Sector Education and TrainingAuthorities (SETAs):
1. National Skills Fund - The National Skills Fund (NSF) is managed by the Department ofLabour and guided by advice from the National Skills Authority. It is funded through receiving aportion of the levies paid by employers. All employers are required by the Skills DevelopmentLevies Act to pay 1% of their payroll to the South African Revenue Service. From this levy, 80%is transferred directly to the SETA with which each employer is registered. The remaining 20%is transferred to the NSF. The NSF was created to provide funding to address issues ofnational importance including unemployment, small business development and specialassistance to women, youth, rural people and people with disabilities. The Department ofLabour’s Provincial Offices and Labour Centres, SETAs as well as other disbursing agenciescan draw on funding from the NSF for specific projects that meet the objectives of the NSF.
2. Provincial Offices – Provincial Offices and their Labour Centres primarily assistunemployed people with skills development. Every four years, they develop Provincial SkillsPlans. These are strategic documents that analyse economic and social development prioritiesin the province as well as provide an analysis of skills requirements. On the basis of identifiedskills development priorities, Provincial Offices assist unemployed people to be trained inincome-generating or social development projects in order to gain skills so that they can beplaced in sustainable employment. The training is funded from the National Skills Fund.
3. SETAs – Twenty-five SETAs have been established by the Minister of Labour under theSkills Development Act. They are responsible for developing sector skills plans, approving,registering and promoting learnerships and quality assuring training, and administering leviesand grants. They are funded through the 1% levy paid by employers, of which they receive80% (10% of which is spent on administration)1. SETAs disburse mandatory grants (equal to60% of the levy paid by individual employers), on the receipt of workplace skills plans andimplementation reports from employers. In addition they disburse “discretionary grants” forprojects that address specific sectoral needs identified in their sector skills plans. SETAs arealso currently the implementing agents for NSF funded strategic projects.
1.4 Monitoring and evaluating the National Skills Development Strategy
This report represents the culmination of the efforts by the Department to monitor theimplementation of the National Skills Development Strategy.
Much of the monitoring and evaluation takes place through the formal relationship establishedbetween SETAs and the Department of Labour. This is managed through memoranda ofunderstanding between the Department and each SETA. Each SETA commits to certaintargets towards the achievement of the overall targets and success indicators of thestrategy. These memoranda of understanding also commit the SETAs to submitting quarterlymonitoring reports, which are based on workplace skills plans submitted by employers as wellas sectoral projects managed by the SETAs. The Department produces a synthesis report,which aggregates the quarterly monitoring reports, and includes information from the differentimplementing agencies.

4
The National Skills Fund is monitored through a similar process – with the implementingagents submitting quarterly monitoring reports which are synthesised and consolidated for thepurposes of the implementation report.
Provinces are also required to collect information on the progress and outcomes of theirsocial development programmes against the National Skills Development Strategy targets.
These three sources of information are therefore used to inform the NSDSimplementation report. This monitoring system does suffer from deficiencies which continueto result in discrepancies in the figures. This applies particularly to the information collected bySETAs and reported to the Department. Every effort has been taken to correct and verify asmuch of the information contained in this report as possible. There is, however, likely to besome degree of error, particularly in relation to Objective One and Two. It is very difficult tocount individual beneficiaries of training within a one-year period, without some double counting– that is, where one person attends more than one course within a year. Similarly, in relation toObjective Two, it has been necessary to use proxies to calculate the number of companiespaying levies by employment size categories.
To minimize errors, the use the quarterly monitoring information has been supplemented by theuse of SETA Annual Reports and final confirmations of figures from SETAs. Where relevant, thereport indicates the source that has been used.
In addition to monitoring the NSDS, the Department commissions a number of research studiesover the year to investigate specific issues with regard to the impact of the NSDS. These arehighlighted in the body of the report when reporting the progress on the achievement of targets.
This is the second report outlining progress on the achievement of the objectives and successindicators of the NSDS. In this report, a brief section has been included dealing with the labourmarket and skills development. As in the last report, progress is reported against each objectiveand success indicator. The contributions of the SETAs, Provincial Offices and the NSF projectsare all included. However, it is important to note that this report does not provide acomprehensive picture of the state of training in South Africa.
Each section of the report provides a brief background to the objective, summarises thefindings of the last report, details the progress made in 2002/03 and highlights achievementsand challenges for each of the objectives.

2 Labour Force Survey, September 2002. Statistical release PO210, Statistics SA, 25 March 20033 Labour Force Survey, ibid.4 The Labour Force Survey of September 2002 only reports on African and Other. Other includes whites, coloureds
and Asians.
5
Chapter 2
Labour market and policyLabour market and policycontext for skills developmentcontext for skills development
2.1 Labour market and skills development
2.1.1 Labour market and employment trends
During 2002/03, South Africa had a working population of 27.98 million2, of which:
● 15.86 million were economically active● 11 million were employed● 4.8 million were unemployed.
Out of the 12 million who were economically inactive:
● 4.9 million were full-time scholars● 1.1 million were full-time home-makers● 1.2 million were people with disabilities or chronically ill● 0.2 million were retired persons.
The employment situation improved slightly during the early part of 2002, increasing from 10.8million in September 2001 to 11.3 million in February 2002. By September 2002 employmentdecreased to 11 million. According to Statistics South Africa, the number of people employeddecreases around September each year, due largely to changes in seasonal employmentpatterns in subsistence agriculture and the informal sector3. Changes in the number ofeconomically active persons, employment and unemployment levels between 1997 and 2002 isshown in Figure 1 . Employment increased between 1997 and 2001, but has fluctuated since2001. Figure 2 shows the employed by population group and gender4.
Until about 1999, the community services sector (which includes government) was the largestemployer. Since then, the wholesale and retail trade sector has grown to become the sectorconcentrating the largest number of workers, although employment has declined in this sectorbetween 2001 and 2002. A reason for this decline could be the large number of informal tradingbusinesses that experience instability. It is also worth noting that the wholesale and retail tradesector concentrates the largest number of temporary workers – apart from private householdswhere many domestic workers are in temporary employment. The mining and manufacturingsectors have continued to decline in employment numbers.

6
8.7
9.3
10.3
11.7 11.811.4
2.5
3.2 3.2
4.0 4.2
4.8
10.0
12.6
13.6
15.8 16.0 15.9
2
4
6
8
10
12
14
16
Total employed in millions
Total unemployed in millions
Total economically active population
Mill
ions
1997 1998 1999 2000 2001 2002
EmployedOther
Females
EmployedOther Males
EmployedAfrican
Females
EmployedAfricanMales
TotalEmployedFemales
TotalEmployed
Males
0
1 000
2 000
3 000
4 000
5 000
6 000
7 000
Figure 1: Economically active, employed and unemployed in South Africa1997 - 2002
Figure 2: Employed by population group and gender, 2002

7
1997 1998 1999 2000 2001 20020%
20%
40%
60%
80%
100%
989 771 967 1 205 1 099 1 159
1 777 1 848 1 984 1 994 2 000 2 020
704 855 931 928 985 1 033
524 552 539 551 554 556
1 532 1 787 2 079 2 426 2 916 2 305
509 548 567 639 589 544
112 113 78 82 93 85
1 499 1 385 1 498 1 576 1 627 1 614
435 476 531 504 482
717 935 1 099 1 694 1 394 1 539
Private Households
Community Services
Business Services
Transport
Trade
Construction
Electricity
Manufacturing
Mining
Agricultural
Figure 3: Distribution of Employed in Economic Sectors
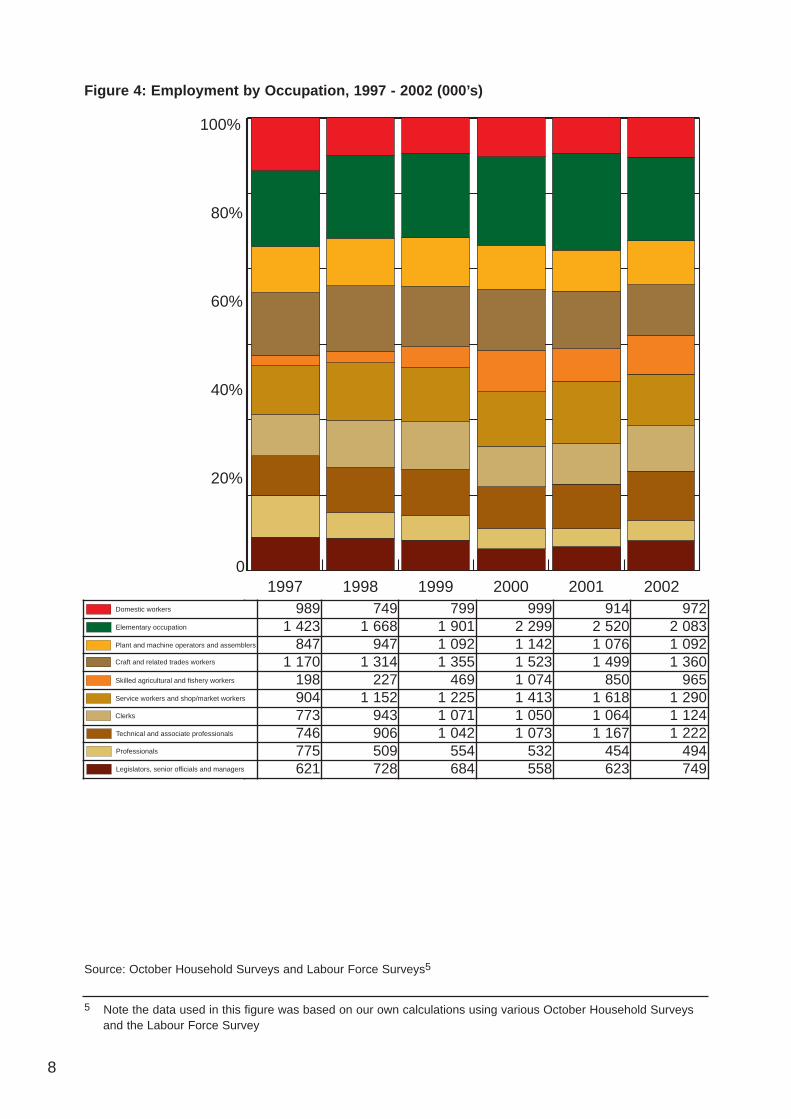
Figure 4: Employment by Occupation, 1997 - 2002 (000’s)
Source: October Household Surveys and Labour Force Surveys5
8
1997 1998 1999 2000 2001 20020
20%
40%
60%
80%
100%
Legislators, senior officials and managers
Professionals
Technical and associate professionals
Clerks
Service workers and shop/market workers
Skilled agricultural and fishery workers
Craft and related trades workers
Plant and machine operators and assemblers
Elementary occupation
Domestic workers
989 749 799 999 914 9721 423 1 668 1 901 2 299 2 520 2 083
847 947 1 092 1 142 1 076 1 0921 170 1 314 1 355 1 523 1 499 1 360
198 227 469 1 074 850 965904 1 152 1 225 1 413 1 618 1 290773 943 1 071 1 050 1 064 1 124746 906 1 042 1 073 1 167 1 222775 509 554 532 454 494621 728 684 558 623 749
Domestic workers
Elementary occupation
Plant and machine operators and assemblers
Craft and related trades workers
Skilled agricultural and fishery workers
Service workers and shop/market workers
Clerks
Technical and associate professionals
Professionals
Legislators, senior officials and managers
5 Note the data used in this figure was based on our own calculations using various October Household Surveysand the Labour Force Survey

9
6 The other population category includes Asians, Coloureds and Whites.
2.1.2 Employment and occupations
Changes in employment by occupation are also an important labour market indicator. Thesechanges are shown in Figure 4 . Researchers use occupations as a proxy for measuring thedemand for skills. By tracing shifts over time it is possible to identify which occupations aregrowing in their share of employment and, therefore, where demand exists for certainoccupations. Overall, in South Africa there has been a significant shift in occupational patterns,especially with regard to the growth in employment in middle level occupations, such astechnical and associate professionals, clerical workers and craft workers. An unexpected trendis the decline in the number of professionals employed between 1997 and 2001. Employmentof professionals increased slightly in the early part of 2002. Given the evidence of shortages ofmany categories of professionals in the labour market, this decline may be affected by thenumber of persons emigrating or it may be due to survey or statistical changes or errors. Theincrease in elementary occupations is also worth noting, although the trend is unlikely tosuggest a reversion to the dominance of this occupational grouping in the labour market.The distribution of the unemployed by economic sector is shown in percentage terms inFigure 3 .
2.1.3 Qualification levels of the employed
The qualification levels of the employed workforce provide a direct measure of South Africa’sskills base. The data in Table 1 shows that 6% of females and 7% of males have noqualifications. However, if the qualification levels of the employed are analysed by populationgroup the legacy of apartheid is still apparent. For example, 9% of employed Africans have noqualification compared to 1 percentage of those in the other population category6. Moreover,29% of African workers have achieved a Grade 12/Std 10 level qualification or highercompared with 64%, of those workers in the Other category. The National Skills DevelopmentStrategy places heavy emphasis on achieving equity in the formal labour market and in theacquisition of skills by all South Africans.
Table 1: Educational qualifications by race and sex (‘000”)
* Figures may not add up to Total due to rounding and other statistical manipulationsSource: Labour Force Survey, September 2003
Figure 5 shows change in employment by gender and educational levels. Trends in thepercentage of the employed by educational qualifications and gender reveal the following:
African Other TotalMale
TotalFemale
TotalMale Female Total Male Female Total
Total* 4 028 3 208 7 236 2 156 1 632 3 788 6 184 4 840 11 024
None 343 337 680 41 20 61 384 357 741
Less thanmatric
2 521 1 932 4 453 745 528 1 273 3 266 2 460 5 726
Matric orequivalent
785 512 1 297 808 657 1 465 1 593 1 169 2 762
Post matric 326 404 730 539 412 951 865 816 1 681

10
7 Note the data used in figure 5 was based on our own calculations using various October Household Surveys andthe Labour Force Survey
● The proportion of men and women in employment with qualifications lower than a Grade 12(matric) has fallen slightly over the past five years
● The number of men and women with a Grade 12 (matric) or higher qualification inemployment has increased between 1997 and 2002. The increase in the number of womenis very small, however.
Figure 5: Percentage of Employed by Educational Qualifications and Gender
Source: various October Household Surveys and Labour Force Surveys7
The number of African workers with a Grade 12 (matric) has increased steadily from 880 000 in1997 to 1.2 million in 2002. The number of Africans in employment with post matric or tertiaryqualifications has also increased to 837 000 in 2002. Whites, Asians and Coloureds with postmatric qualifications in the workforce have also increased in number. In general, it could be saidthat the educational profile of the South African workforce has been steadily improving and thateducation has become a very important factor in relation to labour market access. This trendsupports the claim that work is becoming more skill and knowledge intensive. It also serves toemphasise the importance, not only of education in general, but of ongoing work based
1997 1998 1999 2000 2001 20020
10
20
30
40
50
60
Employed men with qualificationsless than matric
Employed men with no qualifications
9 9 7.2 6.7 6.6 6.2
53 54 53.2 56 54.4 51.7
38 37 37.2 36.2 37.8 40.9
7.8 8.8 7.1 8.1 8 7.8
50.8 48.6 49.7 54.8 54 50.9
40.4 42.2 41.2 36.1 37.2 40.5
Employed men with no qualifications
Employed men with qualificationsless than matric
Employed men with matric or higherqualification
Employed women with no qualifications
Employed women with qualificationsless than matric
Employed women with matric

11
education and training.
2.1.4 Labour market and unemployment
Unemployment has increased since 1997 to reach a high of 4.8 million in September 2002 (seeFigure 1 ). The unemployed are those who did not work during the seven days prior to beinginterviewed for the Labour Force Survey, who want to work and who could start work within oneweek of being interviewed and who have taken active steps to look for work. Most unemployedpeople live in Gauteng, followed by KwaZulu-Natal. Unemployed people are concentrated inthe urban areas although there has been a faster increase in the number of unemployedpersons living in non-urban areas since 20008.
Figure 7: Official definition of unemployed by age, gender and population groups
71%
15-34
19%
35-44
8%
45-54
2%
55+
15-34
35-44
45-54
55+
Total Africans Total others Total female Total male
0%
20%
40%
60%
80%
100%
Figure 6: Unemployment by age group
71 20 60 31
316 75 207 183
784 118 399 504
3 042 411 1 593 1 859
55+
45-54
35-44
15-34
8 Labour Force Survey, ibid., page viii

12
It is important to note that youth unemployment continues to be a striking feature of the SouthAfrican labour market. Those in the 15 to 34 year age group make up the vast majority of theunemployed - the chances of being unemployed are three times higher for this age group (seeFigure 6 ). In relation to population group and age, most of the unemployed in 2002 wereAfricans between the age of 25 to 34 (see Figure 7 ).
An important issue for skills development is the educational level of the unemployed. Knowingthe educational level of unemployed persons helps to target public and private sector skillsdevelopment initiatives aimed at assisting the unemployed to gain access to economic activity.Educational levels could also indicate what levels of qualifications are most likely to helpaccess employment. Table 2 shows the proportion of unemployed persons by educational levelin South Africa in 2002. Although not analyzed in this report, it is also important to note thatthere are more unemployed Africans with post-school qualifications compared to persons in theother population groups. This could indicate that discrimination continues to operate as abarrier to entry in the South African labour market.
Table 2: Educational profile of the unemployed by population group and gender (‘000)
* Figures may not add up to total due to rounding and other statistical manipulationsSource: Labour Force Survey, March 2003
2.2 Policy context
The Government’s vision for the future of South Africa is for a nation with a fast-growing andcompetitive economy that creates sufficient jobs for all workers. It is for a country thatembraces willingly redistribution of income and opportunities in favour of the poor. TheGovernment seeks to build a society in which sound health, education and other services areavailable to all in an environment in which homes are secure and places of work areproductive. The vision and the policies designed to make it a reality recognise that economicgrowth and social inclusion go together, hand-in-hand. As the Minister of Finance said in hisBudget speech in February 2003 the Government’s overall economic strategy“.embodies a setof policies aimed at pushing back the frontiers of poverty whilst supporting growth. It seeks toempower people by expanding their capabilities”.
The Government’s strategy has nine substantive priorities. These are being used to guide theallocation of State resources, both in the determination of programmes and the scale offinancial support given to them. Briefly described, eight of these priority areas are:
● Progressive broadening of the income security net, rejuvenated health services and targetedinitiatives designed to reduce poverty
● Redistribution and restitution of land, coupled with investment in rural development and
African Other Totalmale
Totalfemale
TotalMale Female Total Male Female Total
Total* 1 965 2 248 4 213 294 329 623 2 259 2 577 4 836
None 80 88 168 - - - 83 94 77
Less thanmatric
1 312 1 417 2 729 165 177 342 1 490 1 618 3 108
Matric orequivalent
494 608 1 102 93 104 197 591 715 1 306
Post matric 70 122 192 - - - 81 136 217

13
agricultural support services● Reformation of public administration, based on respect for citizens’ rights; effective, efficient
and courteous service delivery; honest and accountable governance structures and themodernization of procedures and systems to support sustained change
● Investment in roads and other infrastructure; technological advancement and industrialexpansion, in partnership with the private sector
● Strengthening the fight against crime and corruption● Widening access to financial services; the greater integration of small businesses into the
formal economy and further relaxation of tax burdens on low and middle-income households● A sustainable, broad-based and transparent approach to black economic empowerment● Deepening of democratic values; the promotion of peace and security; expanding
investment and trade as principles of international cooperation and a commitment to theNew Partnership for Africa’s Development.
The ninth priority set by the Government refers to a national skills development strategy,focused on productivity enhancement and learning opportunities for the unemployed. Thebuilding of national skills, and creating opportunities for individual women and men to realisetheir capabilities lie at the heart of the achievement of other Government goals. Better healthservices, improved public services, industrial expansion and black economic empowerment aredependent on people with knowledge and skills.
The President coined the phrase ‘A Nation at Work for a Better Life for All’. Improved livingstandards for all and a more equitable distribution of income depend on accelerated economicgrowth and the creation of jobs. But success in a more complex and globally interdependenteconomic environment requires consistent and integrated policies. The Government – and itsmachinery of interdepartmental working and partnerships with the private sector and the widercommunity - seek to provide this stable policy and implementation framework.
It is clear that the National Skills Development Strategy is located firmly within the vision andpolicy priorities of Government. This vision and the central nature of skills development werereaffirmed at the Growth and Development Summit held in June 2003. During the summit avision for growth and development was adopted by Government, Organised Labour, OrganisedBusiness and the Community Constituency. There was also a specific emphasis on skills

development in general and learnerships in particular, as well as the importance of enhancingthe role and capacity of SETA boards and governance structures.
Within this context, this report will now discuss the progress and achievements of the NationalSkills Development Strategy.
14

15
Chapter 3
Progress on Objective One
Developing a culture of highDeveloping a culture of highquality lifelong learningquality lifelong learning
3.1 Setting the scene
The objective of “Developing a culture of high quality lifelong learning”, is aimed at ensuringthat individuals have access to learning opportunities throughout their lives. The implementationof the National Skills Development Strategy is expected to improve both the quality andquantity of the education and training available to employers and workers. Therefore, thesuccess indicators for this objective cover access to level one qualifications on the NationalQualifications Framework (NQF), as these will provide the first step for many workers to accessongoing education and skills. Measures are also in place to ensure that workers embark on andachieve structured learning. This marks a departure from previous training that focused onmore ad-hoc learning opportunities. Lastly, measures are in place to ensure that employers areworking towards an internationally recognised standard for good people development practice.
The National Skills Development Strategy sets out to measure success in relation to thisobjective through three success indicators. They are:
Success Indicator 1.1 : By March 2005, 70% of all workers have at least a level onequalification on the National Qualifications Framework.Success Indicator 1.2 : By March 2005, a minimum of 15% of workers to have embarked on astructured learning programme, of whom, at least 50% have completed their programmessatisfactorily.Success Indicator 1.3 : By March 2005, an average of 20 enterprises per sector (to includelarge, medium and small enterprises), and at least five national government departments, to becommitted to, or have achieved, an agreed national standard for enterprise-based peopledevelopment.
3.2 Success Indicator 1.1
By March 2005, 70% of all workers have at least a level one qualification on the NationalQualifications Framework
As reflected in the previous NSDS implementation report, the Department of Labour is workingoff a baseline employment figure of 9,3 million workers who are covered by the 25 SETAs.Seventy percent of this figure is 6 524 154 workers who, according to the target, should havereceived a level one qualification by March 2005. The Labour Force survey of February 2001indicated that 5 619 161 (or 60%) workers then had the equivalent of an NQF level onequalification. This leaves a target of 904 993 (6 524 154 minus 5 619 161) workers requiring anNQF level one qualification in order to achieve the success indicator of 70%.
3.2.1 Review of 2001/02 findings
By March 2002, 5 079 workers had achieved an NQF level one qualification. This represents0.5% of the target for this indicator. Thus for 2002/03 it was seen as a significant challenge toall implementation partners to increase these numbers.

16
9 Some learners captured in this figure could still be participating in NQF level one learning programmes, asopposed to having completed their programme, but it mainly reflects completions.
3.2.2 Progress made during 2002/03
Significant progress has been made towards the March 2005 target for Success Indicator 1.1.This is reflected in Table 3:
Table 3: Numbers of workers having completed NQF level one – training Department ofLabour Synthesis Report – March 2003
During 2002/03, 111 367 learners completed NQF level one learning programmes. Since March2001, a total of 116 4469 people have actually achieved (or completed) a level one qualification.This represents 12,8% of the target of 904 993. Most learners achieved their qualification in2002/03 (111 367) and many more have already embarked on training. The graph belowillustrates the contribution of the sectors to this number, showing the three SETAs with thelargest number of learners completing NQF level one programmes.
Figure 8 : The contribution of SETAs to NQF level one figures – Department of LabourSynthesis Report – March 2003
In addition the NSF is planning to contribute another 9 167 learners who have embarked onAdult Basic Education and Training (ABET) or level one programmes (see Table 4 ). DuringMay 2002, the Minister of Labour approved 19 strategic projects funded through the NSF,which are being implemented over a three-year period. SETAs are the disbursing agents forthese projects. The following ABET/NQF level one programmes are being offered through theseprojects:
Baseline Information
NSDS Target
Estimatedworkers to be
trained toachieve theNSDS target
Completion oflearning
programmesSETA affiliatedemployment
Labour forcesurvey February2001 - Estimates
of employeeswith NQF Level
One
9 320 220workers estimated
5 619 161 =60.3% of
estimated workershad an NQF level
qualification inFebruary 2001
70% of estimatedworkers =6 524 154
904 993 (ie.6 524 154 -
5 619 161
2001/02
5 079 completed
2002/03111 367
completed
11%
HWSETA
19%
CHIETA
29%
LGWSETA
41%
Other

17
Table 4: Beneficiaries of NSF projects on ABET or NQF level one training
3.3 Success Indicator 1.2
By March 2005, a minimum of 15 % of workers to have embarked on a structuredlearning programme, of whom, at least 50 % have completed their programmessatisfactorily.
3.3.1 Review of 2001/02 findings
The target for this success indicator is for 1 398 033 workers to be engaged in structuredlearning by March 2005 and for 699 016 to have completed this training. In the previousimplementation report it was reported that 315 836 workers had embarked on structuredlearning programmes. Of these workers, 50 683 had completed the learning programmes (i.e.
SETA Nature of intervention No. of beneficiaries
FASSET1. Maths and Accounting
School clinics1. 3 200 learners have
completed training
CHIETA
1. ABET Training for SMMEsin Chemical operations(NQF level one)
2. ABET Training for theunemployed in Chemicaloperations (NQF level one)
1. 60 learners in training2. 2 000 to receive training
MQA1. Bursaries awarded2. Training of ex-mineworkers
1. 136 learners in training2. 400 mineworkers in training
MERSETA1. Special training programmes
aimed at ABET and NQFlevel one training
1. 2 585 learners to be trained
PAETA 1. ABET training1. 400 learners to receive
training
TETA 1. ABET training 1. 386 completed training

18
16% of those participating).
However, further reports received from SETAs after the 2001/02 report was published (thesewere partly based on late submissions of workplace skills plan implementation reports), indicatethat in fact 760 916 workers had participated in structured learning programmes by March2002. This represents a 54.4% achievement of the target for this success indicator. Of thisnumber, 570 615 were reported to have completed a learning programme. This represents a75% completion rate for those participating in training.
3.3.2 Progress made during 2002/03
Table 5: Workers enrolled on and completing structured learning programmes –Department of Labour Synthesis Report – March 2003
There was enormous growth in the number of workers on structured learning programmes in2002/03. With 1 398 461 learners participating in structured learning programmes, the target forthis success indicator has been exceeded by 428 learners. This means that 15% of all workers(the 9 320 220 workers in the economy as a whole) covered by all 25 SETAs are alreadyenrolled on structured training programmes.
In addition the NSF has contributed another 6 099 learners to structured learning programmes.Table 6 provides a breakdown of the beneficiaries provided with structured learning through theNSF strategic projects:
Baseline InformationNSDS completion
rate target forthose on learning
programmes
Progress to dateparticipating in
structuredlearning
programmes
Progress to datelearners who
completedstructuredlearning
programmes
SETA affiliatedemployment
NSDS target toembark on
learningprogrammes
9 320 220workers
estimated
15% = 1 398 033workers estimated
50% (1 398 033) =699 017 workers
estimated
2001/02 2001/02
760 916 570 615
2002/03 2002/03
1 398 461 330 192
Driving Certificate Programme
Ashlaam has every reason to be proud - he is one of the first 10 drivers in South Africa to earn a NationalCertificate in Professional Driving. The credit for this watershed event in transport education went to the SPARgroup, whose training drive, entitled ‘Reach for the skies’, has made it possible for drivers like Ashlaam to developtheir careers.
Says SPAR Academy of Learning head and TETA vice-chairperson, Brad Jacklin: “Given the carnage on SouthAfrican roads - much through incompetence - it has become a priority to provide drivers with skills and theopportunity to improve their performance. We are thrilled to be the first company in the country to achieve such amilestone.”
Handing over the certificates, Piet Bothma (TETA CEO) commented that the 10 recipients could now claim to beamong the very best drivers in the country. Larry Vertue, transport manager for SPAR Western Cape, is happythat the time (even over weekends) and effort put into the programme by the drivers has paid off so handsomely.“What is exceptional is that all our permanent drivers have achieved this national qualification,” he says.
Source: “On the Move” TETA Newsletter, Summer 2002

19
Table 6: NSF projects for Success Indicator 1.2
Of the workers entering structured learning programmes, 23,6% have achieved the qualificationor completed a course satisfactorily. There was a reported drop in the number completingstructured learning programmes during 2002/03 compared to the previous year. Although thiscould well reflect late reporting as for 2001/02.
Approximately 2 913 learners completed structured learning through the NSF StrategicProjects during 2003 as indicated in Table 6.
In addition, structured training has been conducted through the National Skills Fund’s SkillsSupport Programme incentive grants. This is a partnership with the Department of Trade andIndustry’s (DTI) Investment Incentive Programmes launched during mid 2000, which isavailable to enterprises that invest in South Africa or to local businesses that expand, thereby
SETA Nature of intervention No. of beneficiaries
FASSET1. Maths and Accounting School clinics 1. 440 Maths and 370 Accounting
teachers successfully completedtraining.
CTFL
1. HIV/AIDS awareness training2. Master stewards training3. Bursaries awarded
1. 1 069 shop stewards trained2. 116 sucessfully completed training3.1 42 in textile technology3.2 25 learners in Education Training
Development Practitioner Training3.3 254 (18.2) learners for assessor
training
CETA 1. SDF Skills Programme Training 1. 102 SDFs completed training
MQA1. Training of ex-mineworkers 1. 30 ABET educators completed
training
PAETA1. Citrus growers 1. 200 citrus workers and community
members in skills programmesSETASA 1. Assessor training 1. 186 completed training
SERVICES1. Assessor training 1. 134 learners (non domestic)
completed training
THETA
1. Customer service training in thehospitality industry sector
2. Learners placed on Theta NLRDSystem
3. Training in the hospitality sector
4. Tourist guiding5. Conservation management
1. 400 learners graduated
2. 320 learners
3.1 66 learners trained3.2 2 262 in training 4. 50 learners in training5. 33 in training
Domestic Worker’s Qualification
The Services’ SETA has initiated a project aimed at providing training for domestic workers. A level onequalification for domestic workers is being registered. This qualification covers literacy, numeracy and life skills.There are elective components in cooking, cleaning and SME skills. In time the standards generating body willadd further electives on early childhood development, frail care and ancillary health care.
The SETA intends to train 3 000 domestic workers, of whom 600 will be currently unemployed learners, on a fulllearnership.
Service’s SETA Newsletter “Update” Winter 2003.

20
contributing to economic growth and job creation. The NSF has embarked on a joint venturewith DTI around the Skills Support Programme. The programme was implemented during early2002 and the first applications were received by mid 2002. During the 2002/03-financial year,710 workers embarked on structured learning programmes and completed the trainingprogrammes satisfactorily through this programme.
3.4 Success Indicator 1.3
By March 2005, an average of 20 enterprises per sector, (to include large, medium andsmall enterprises), and at least five national government departments, to be committedto, or have achieved, an agreed national standard for enterprise-based peopledevelopment.
The Investors in People standard is an international standard to benchmark good practice inskills development. The standard is comprised of 12 indicators dealing with good peopledevelopment practices. These are divided into four principles: the commitment principle, theplanning principle, the action principle and the evaluation principle. Each principle has anumber of indicators aligned to it, as illustrated in the diagram below:
Investor in People Standard
Commitment
Indicator 1:The organisation is committed to supporting thedevelopment of its people.
Indicator 2:People are encouraged to improve their own andother people’s performance
Indicator 3:People believe their contribution to theorganisation is recognised.
Indicator 4:The organisation is committed to ensuring equalityof opportunity in its development of its people.
Planning
Indicator 5:The organisation has a plan with clear aims andobjectives, which are understood by everyone.
Indicator 6:The development of people is in line with theorganisations aims and objectives.
Indicator 7:People understand how they contribute toachieving the organisation’s aims and objectives.
Evaluation
Indicator 10: The development of people improves theperformance of the organisation, teams andindividuals.
Indicator 11: People understand the impact of the developmentof people on the performance of the organisation,teams and individuals.
Indicator 12:The organisation gets better at developing itspeople.
Action
Indicator 8:Managers are effective in supporting thedevelopment of people.
Indicator 9:People learn and develop effectively.
21
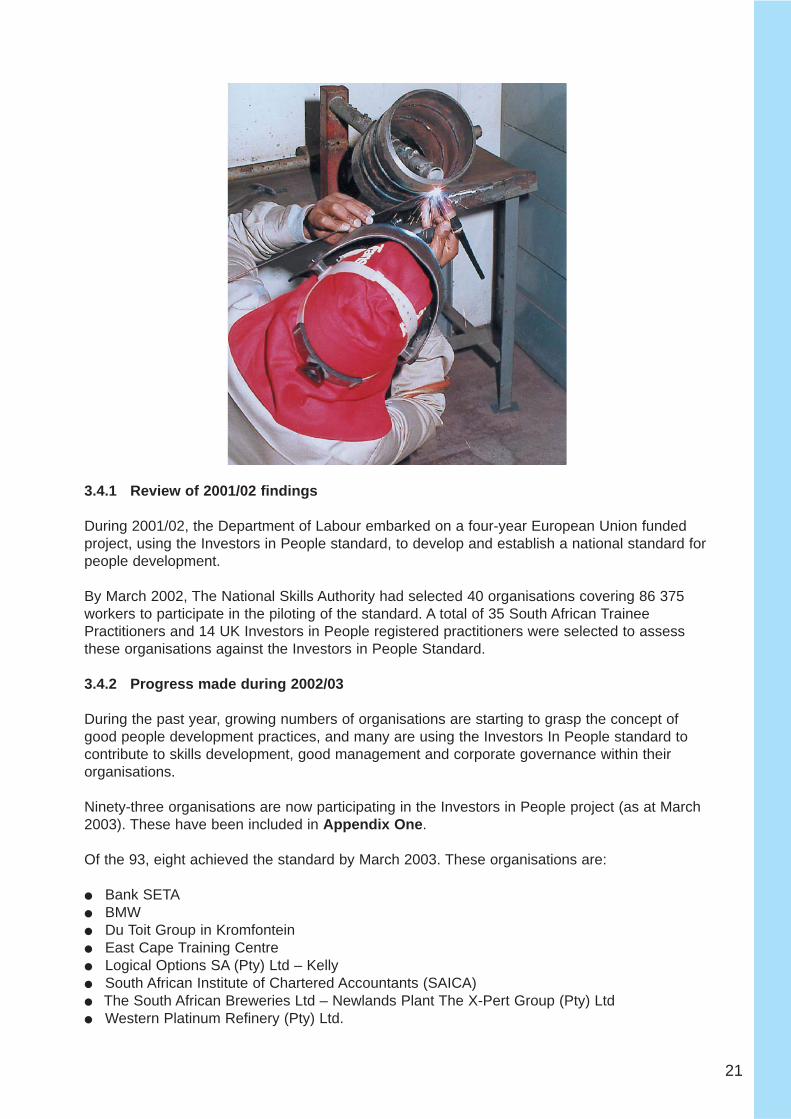
3.4.1 Review of 2001/02 findings
During 2001/02, the Department of Labour embarked on a four-year European Union fundedproject, using the Investors in People standard, to develop and establish a national standard forpeople development.
By March 2002, The National Skills Authority had selected 40 organisations covering 86 375workers to participate in the piloting of the standard. A total of 35 South African TraineePractitioners and 14 UK Investors in People registered practitioners were selected to assessthese organisations against the Investors in People Standard.
3.4.2 Progress made during 2002/03
During the past year, growing numbers of organisations are starting to grasp the concept ofgood people development practices, and many are using the Investors In People standard tocontribute to skills development, good management and corporate governance within theirorganisations.
Ninety-three organisations are now participating in the Investors in People project (as at March2003). These have been included in Appendix One .
Of the 93, eight achieved the standard by March 2003. These organisations are:
● Bank SETA● BMW● Du Toit Group in Kromfontein● East Cape Training Centre● Logical Options SA (Pty) Ltd – Kelly● South African Institute of Chartered Accountants (SAICA)● The South African Breweries Ltd – Newlands Plant The X-Pert Group (Pty) Ltd● Western Platinum Refinery (Pty) Ltd.
22
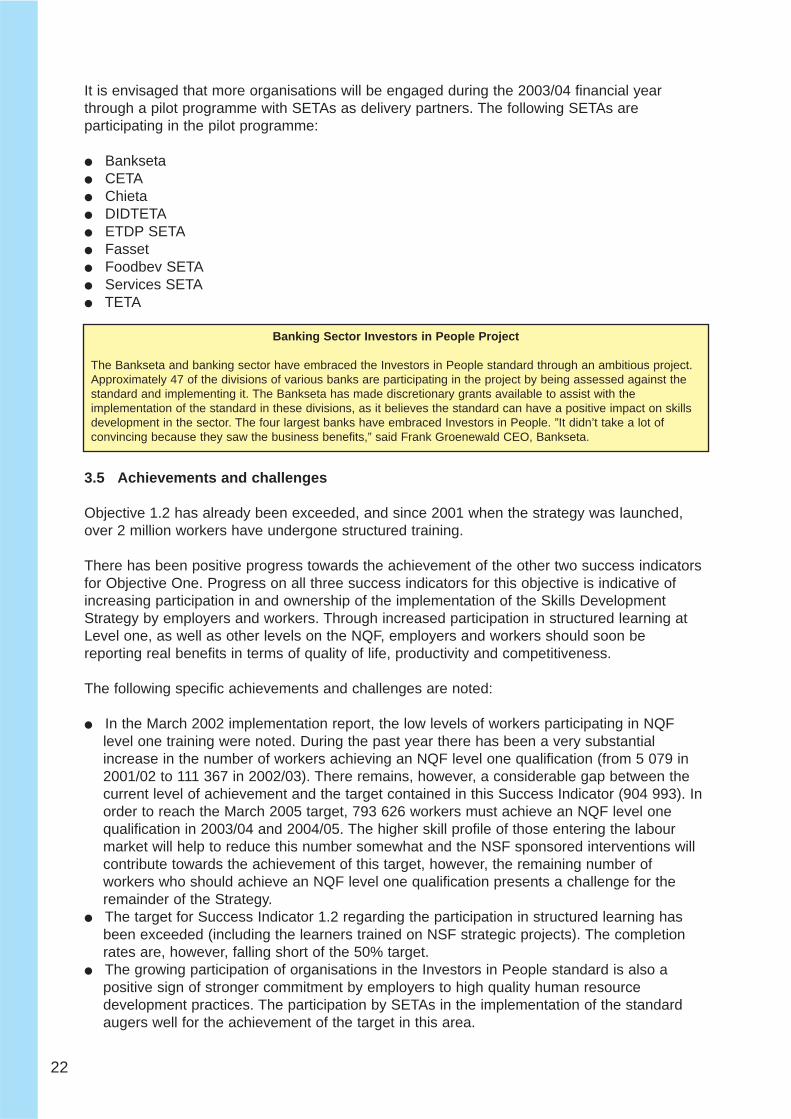
It is envisaged that more organisations will be engaged during the 2003/04 financial yearthrough a pilot programme with SETAs as delivery partners. The following SETAs areparticipating in the pilot programme:
● Bankseta● CETA● Chieta● DIDTETA● ETDP SETA● Fasset● Foodbev SETA● Services SETA● TETA
3.5 Achievements and challenges
Objective 1.2 has already been exceeded, and since 2001 when the strategy was launched,over 2 million workers have undergone structured training.
There has been positive progress towards the achievement of the other two success indicatorsfor Objective One. Progress on all three success indicators for this objective is indicative ofincreasing participation in and ownership of the implementation of the Skills DevelopmentStrategy by employers and workers. Through increased participation in structured learning atLevel one, as well as other levels on the NQF, employers and workers should soon bereporting real benefits in terms of quality of life, productivity and competitiveness.
The following specific achievements and challenges are noted:
● In the March 2002 implementation report, the low levels of workers participating in NQFlevel one training were noted. During the past year there has been a very substantialincrease in the number of workers achieving an NQF level one qualification (from 5 079 in2001/02 to 111 367 in 2002/03). There remains, however, a considerable gap between thecurrent level of achievement and the target contained in this Success Indicator (904 993). Inorder to reach the March 2005 target, 793 626 workers must achieve an NQF level onequalification in 2003/04 and 2004/05. The higher skill profile of those entering the labourmarket will help to reduce this number somewhat and the NSF sponsored interventions willcontribute towards the achievement of this target, however, the remaining number ofworkers who should achieve an NQF level one qualification presents a challenge for theremainder of the Strategy.
● The target for Success Indicator 1.2 regarding the participation in structured learning hasbeen exceeded (including the learners trained on NSF strategic projects). The completionrates are, however, falling short of the 50% target.
● The growing participation of organisations in the Investors in People standard is also apositive sign of stronger commitment by employers to high quality human resourcedevelopment practices. The participation by SETAs in the implementation of the standardaugers well for the achievement of the target in this area.
Banking Sector Investors in People Project
The Bankseta and banking sector have embraced the Investors in People standard through an ambitious project.Approximately 47 of the divisions of various banks are participating in the project by being assessed against thestandard and implementing it. The Bankseta has made discretionary grants available to assist with theimplementation of the standard in these divisions, as it believes the standard can have a positive impact on skillsdevelopment in the sector. The four largest banks have embraced Investors in People. ”It didn’t take a lot ofconvincing because they saw the business benefits,” said Frank Groenewald CEO, Bankseta.

23
Chapter 4Progress on Objective Two
Fostering skills development inFostering skills development inthe formal economy forthe formal economy forproductivity and employmentproductivity and employmentgrowth growth
4.1 Setting the scene
‘Fostering skills development in the formal economy for productivity and employment growth’addresses the need for improved education and training in order to support economic growthand improved competitiveness. Consequently targets have been set to ensure that large andmedium sized employers as well as government departments are engaged in increasing levelsof training. The targets also include, very importantly, that the benefits of these traininginterventions be measured to ensure their contribution to improving the competitiveness ofpublic and private sector employers, as well as to enhancing the lives of workers. In addition,the targets deal with the numbers of learnerships being implemented. Learnerships arestructured learning programmes that include workplace practise and formal education andtraining and result in the learner achieving a nationally recognised qualification that isregistered on the National Qualifications Framework. These programmes provide the idealvehicle to integrate classroom and workplace experience, in order for learners to achievemeaningful and relevant skills which contribute to their own development as well as toimproved productivity in the workplace.
Success in relation to this objective is measured through four success indicators, namely:
Success Indicator 2.1 : By March 2005, 75% of enterprises with more than 150 workers arereceiving skills development grants and the contributions towards productivity and employerand employee benefits are measured.Success Indicator 2.2 : By March 2005, at least 40% of enterprises employing between 50and 150 workers are receiving skills development grants and the contributions towardsproductivity and employer and employee benefits are measured.Success Indicator 2.3 : By March 2005, learnerships are available in all sectors.Success Indicator 2.4 : By March 2005, all government departments assess and report onbudgeted skills expenditure for skills development relevant to Public Service, Sector andDepartmental priorities.
4.2 Success Indicator 2.1
By March 2005, 75% of enterprises with more than 150 workers are receiving skillsdevelopment grants and the contributions towards productivity and employer and employeebenefits are measured.
4.2.1 Review of 2001/02 findings
The Workplace Skills Grant is seen as a mechanism to incentivise increased levels ofeducation and training in the workplace. Employers can claim grants from their SETA bysubmitting a workplace skills plan, which outlines their training plans for the year, and also on

24
10 The measure of grant claims is taken in relation to the WSP grant only, the first of the two mandatory grants.Due to different time schedules for the disbursements of the mandatory grants by SETAs, it is most reliable to onlyuse one grant in any financial year. The quarterly NSDS Synthesis reports published by the Department of Labourcontain information on all grants disbursed.
submission of an implementation report where they report on the implementation of theirworkplace skills plan.10
In March 2002, it was reported that 67% of employers employing more than 150 workers hadreceived grants from their SETAs during the year. However, only 2 964 employers were payingthe levy at this time.
4.2.2 Progress made during 2002/03
There was a slight increase in the number of enterprises with more than 150 workers that paidtheir levies during 2002/03, when compared to 2001/02 (an increase of 625 employers). Thenumber of those claiming grants increased by approximately the same number as the increasein levy paying firms, that is, 604. However, the percentage of those claiming grants (as apercentage of those paying levies) increased by almost 5% from 66,94% in 2001/02, to 72,19%in 2002/03. At this rate of increase in the number of employers receiving skills developmentgrants, the 2005 target should easily be met.
Table 7: Employers (employing over 150 workers) paying levies and claiming grants.
Source: SQMR
4.3 Success Indicator 2.2
By March 2005, at least 40% of enterprises employing between 50 and 150 workers arereceiving skill development grants and the contributions towards productivity andemployer and employee benefits are measured.
4.3.1 Review of 2001/02 findings
In March 2002, it was reported that 38% of employers employing between 50 and 150 workerswere receiving skills development grants. However, this figure applies to a small base of 6 571levy paying employers.
4.3.2 Progress made during 2002/03
The target for this objective has already been exceeded, as shown in Table 8:
SETA As at the end of March 2002 As at the end of March 2003Active
employerspaying levy
Employersclaiminggrants
% of activeemployersclaiminggrants
Activeemployerspaying levy
Employersclaiminggrants
% of activeemployersclaiminggrants
All SETAs 2 964 1 984 67 3 589 2 591 72.19

25
Table 8: Employers (employing between 50 and 150 workers) paying levies and claiminggrants
Source: SQMR
The number of enterprises employing between 50 and 150 workers and paying leviesincreased by over 800 between 2001/02 and 2002/03. The number of those claiming grantsincreased by 1 133 from 2 591 to 3 724, during the same period, pushing the percentageclaiming to just over 50% - well past the 40% target.
The structured training offered through the NSF for Skills Development Facilitators (SDFs) andassessor training, as reported in Objective 1.2, also contributes to the attainment of bothObjectives 2.1 and 2.2, by increasing the capacity of small and medium enterprises to engagewith the National Skills Development Strategy. Higher levels of engagement are likely to lead tobetter uptake of skills development grants.
The Department of Labour has commissioned the following studies, which will assess theimpact of skills development initiatives in both medium and large enterprises:● A skills development firms survey will be completed by December 2003. This survey will
provide information on the current state of skills development in companies in South Africa.● A study to develop a methodology for monitoring the impact of skills development on
productivity and employer and employee benefits in future.
The outcome of these studies will be reported in October 2004, but will also help to informdiscussions on the new NSDS objectives.
SETA As at the end of March 2002 As at the end of March 2003Active
employerspaying levy
Employersclaiminggrants
% of activeemployersclaiminggrants
Activeemployerspaying levy
Employersclaiminggrants
% of activeemployersclaiminggrants
All SETAs 6 571 2 591 39.43 7 379 3 724 50.47

26
4.4 Success Indicator 2.3
By March 2005, learnerships are available in all sectors.
4.4.1 Review of 2001/02 findings
By March 2002, 262 learnership programmes had been registered by 23 SETAs with theDepartment of Labour. Approximately 8% of these were being piloted and 3 203 individuallearnership agreements had been signed between employers, training providers and learners.
4.4.2 Progress made during 2002/03
The number of learnerships registered with the Department of Labour has almost doubled sinceMarch 2002 and there are nine times as many active learnerships, as indicated in Table 9.
Table 9: Learnerships registered and active.
Source: Synthesis Quarterly Monitoring Report
This indicator has therefore been achieved, as the registration and implementation oflearnerships has occurred across all sectors.
Appendix 2 provides a list of registered learnerships.11
SETA As at the end of March 2002 As at the end of March 2003
AllSETAs
Number oflearnershipsregistered
Number ofregisteredlearnershipsthat areactive
% ofregisteredlearnershipsthat areactiveagainstthose not
Number oflearnershipsregistered
Number ofregisteredlearnershipsthat areactive
% ofregisteredlearnershipsthat areactiveagainstthose not
207 16 7.73 478 136 28.45
Aerospace Chamber Learnership
Behind every successful air traffic controller is a skilled technician or two. From now on, many of thesetechnicians will be acquiring their skills through the learnership for engineering technicians on NQF level six,registered in October 2002 by the Aerospace Chamber of the Transport Education and Training Authority.
The learnership will help to meet the constant demand for skilled technicians in this highly specialised engineeringfield, says chamber executive officer, Johan de Beer. “Air traffic and navigation services are dependent onintricate and complex radio and radar equipment,” he says. “The technicians are responsible for maintaining,servicing and repairing the equipment and, therefore, have a crucial role to play in the efficiency and safety of airtraffic control.” The learnership, which was identified as key by the chamber and its stakeholders, and is subject todiscretionary funding, will combine skills related to equipment such as antenna and voice communication systemswith life, computer, and occupational health and safety skills, to ensure career flexibility. The learners will completetheir training through a technikon and the Aviation Training Academy.
Source: “On the Move” TETA Newsletter, Summer 2002
11 Note that the learnership list provided in the Annex has been taken close to the date of going to print. The totalnumber of registered learnerships may, therefore, differ from the 478 cited above.

27
4.5 Success Indicator 2.4
By March 2005, all government departments assess and report on budgeted skillsexpenditure for skills development relevant to Public Service, Sector and departmentalpriorities.
4.5.1 Review of 2001/02 findings
Government departments do not pay the skills levy but are required to budget for skillsdevelopment and may contribute administration expenses to their SETA. The March 2002Implementation Report stated that 71 of the 140 national and provincial departments hadsubmitted workplace skills plans.
4.5.2 Progress made during 2002/03
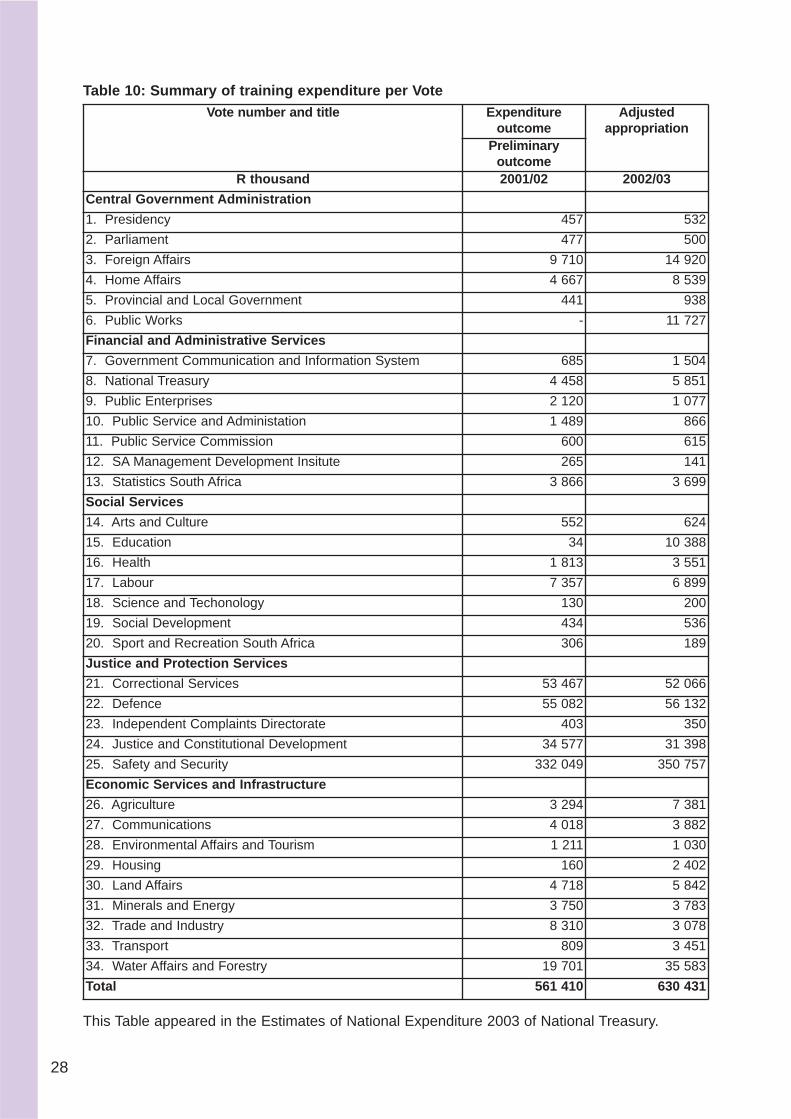
Table 10 indicates progress on this success indicator. It shows that national governmentdepartments alone spent over R630 million on training last year, as compared to R561 millionthe years before.
As part of the skills development firms survey, an investigation into training practices ingovernment is to be undertaken to give a clearer view of progress in skills development in thepublic sector. The outcome of this should also be available in December 2003.
4.6 Achievements and challenges
The reported achievements for Objective Two for 2002/03 highlight positive growth as well assome challenges:
● Progress has been made on the numbers of large employers paying grants as well as thenumbers claiming grants. The target of 75% should be achievable by March 2005
● The target of 40% for medium size enterprises to receive grants was exceeded during theyear. There was steady growth in both the number of medium sized enterprises paying thelevy and claiming WSP grants. This is a significant achievement which should be sustainedthrough to the end of the current NSDS
● The Department of Labour is in the process of determining the contribution of skillsdevelopment towards productivity and employer and employee benefits (for SuccessIndicators 2.1 and 2.2) through a donor funded study. This will be reported on in 2004
● Learnerships have been registered across all sectors of the economy and approximately28% of these are currently running through all the SETAs
● Government departments are reporting on significant levels of expenditure on training.
28
Table 10: Summary of training expenditure per Vote
This Table appeared in the Estimates of National Expenditure 2003 of National Treasury.
Vote number and title Expenditureoutcome
Adjustedappropriation
Preliminaryoutcome
R thousand 2001/02 2002/03
Central Government Administration
1. Presidency 457 532
2. Parliament 477 500
3. Foreign Affairs 9 710 14 920
4. Home Affairs 4 667 8 539
5. Provincial and Local Government 441 938
6. Public Works - 11 727
Financial and Administrative Services
7. Government Communication and Information System 685 1 504
8. National Treasury 4 458 5 851
9. Public Enterprises 2 120 1 077
10. Public Service and Administation 1 489 866
11. Public Service Commission 600 615
12. SA Management Development Insitute 265 141
13. Statistics South Africa 3 866 3 699
Social Services
14. Arts and Culture 552 624
15. Education 34 10 388
16. Health 1 813 3 551
17. Labour 7 357 6 899
18. Science and Techonology 130 200
19. Social Development 434 536
20. Sport and Recreation South Africa 306 189
Justice and Protection Services
21. Correctional Services 53 467 52 066
22. Defence 55 082 56 132
23. Independent Complaints Directorate 403 350
24. Justice and Constitutional Development 34 577 31 398
25. Safety and Security 332 049 350 757
Economic Services and Infrastructure
26. Agriculture 3 294 7 381
27. Communications 4 018 3 882
28. Environmental Affairs and Tourism 1 211 1 030
29. Housing 160 2 402
30. Land Affairs 4 718 5 842
31. Minerals and Energy 3 750 3 783
32. Trade and Industry 8 310 3 078
33. Transport 809 3 451
34. Water Affairs and Forestry 19 701 35 583
Total 561 410 630 431

29
Chapter 5
Progress on Objective Three
Stimulating and supporting skillsStimulating and supporting skillsdevelopment in smalldevelopment in smallbusinesses businesses
5.1 Setting the scene
Small businesses provide a focus for development in the National Skills Development Strategybecause they are seen as key drivers of economic growth and employment. Given the largenumber of small businesses that characterise the South African economy, stimulating skillsdevelopment in these companies is critical to support productivity and value addition for higherlevels of employment. The targets for this objective relate to supporting small businesses toimplement the skills development strategy. There are three ways in which training isencouraged in this traditionally hard to reach segment:
1. By encouraging small business to submit workplace skills plans and implementation reports.2. Through providing discretionary grants or implementing sector projects through the SETAs.3. Through engaging them in NSF strategic projects.
This objective has one success indicator:
Success Indicator 3.1 : By March 2005, at least 20% of new and existing registered smallbusinesses to be supported in skills development initiatives and the impact of such support tobe measured.
5.2 Success Indicator 3.1
By March 2005, at least 20% of new and existing registered small businesses to besupported in skills development initiatives and the impact of such support to bemeasured.
5.2.1 Review of 2001/02 findings
In March 2002, it was estimated that roughly 7% of levy paying small businesses had receiveda grant for the submission of workplace skills plans. At the time there were also 11 SETAs whohad developed specific initiatives to support small businesses in their sectors.
Project Rave
The W&R SETA has embarked on a project called “Retrenchees and Victory to Entrepreneurs” (RAVE). Throughthis project the SETA aims to enable 5 000 SMMEs to improve their businesses and 5 000 retrenchees orunemployed people to start their own businesses. They are training 25 retrenchees and 25 existing SMMEs duringthe piloting of the project in May 2003.
Source: Project RAVE Special Publication W+RSETA

30
5.2.2 Progress made in 2002/03
5.2.2.1 SMME participation in WSP grant system
Ten percent of levy paying SMMEs are now claiming grants from their SETAs. This is halfwaytowards the achievement of Success Indicator 3.1. Table 11 indicates progress to March 2003.
Table 11: Numbers of small businesses paying and receiving levies. Source: SQMR
Table 11 shows that 13 162 small businesses claimed the WSP grant from their SETA during2002/03.
5.2.2.2 SETA discretionary grants and SMMEs
Some specific SETA projects aimed at SMMEs are captured in Table 12 .
SETA As at the end of March 2002 As at the end of March 2003
Employerspayin levy
Employersclaiminggrants
% ofEmployersclaiminggrants
Employerspaying levy
Employersclaiminggrants
% ofemployersclaiminggrants
All SETAs 101 365 8 801 8.68 135 328 13 162 9.72
Molopo Motors
Molopo Motors is a small company employing nine people situated in a town called Bray nearly 230 km north ofVryburg. They are registered with and have been paying their levies to the MERSETA. During grant year three,they ran a number of training programmes in order to implement their workplace skills plans. These included HIVtraining as well as a programme entitled DINKWE TSA MABALA, which focuses on personal as well as companysafety and security. They also provided accredited computer training to some members of their staff in an effort todevelop more sophisticated operating systems in the company.
Case Study provided by MERSETA
PAETA SHEEP SHEARING PROJECT
In association with the National Wool Growers Association, the Primary Agriculture SETA has launched an NSFproject to improve the skills of sheep shearers in rural communities. In rural areas where there is a high incidenceof communal farmers, sheep are still shorn by untrained locals resulting in injured sheep, great damage to wooland difficulties regarding wool sorting. The low quality of wool negatively impacts on the income of these farmers.
A "before and after" study was done by the National Wool Growers Association, which indicated that a smallcommunity's income can increase by as much as ten-fold if wool is harvested, handled and marketed correctly. Ina specific case a community was earning only R25 000 for its wool as a result of incorrect harvesting and selling itin bulk to a freelance agent. After training unemployed people in the community in shearing, handling andclassing, and by sending the wool directly to the wool market in Port Elizabeth, the community’s income rose toR200 000.
Case Study from PAETA.

31
Table 12: SETA initiatives aimed at SMMEs
SETA Initiatives to support small businesses
BANKSETA The BANKSETA supports SMMEs in developing Workplace Skills Plans, accessing sector grants,and establishing credit ratings.
CHIETA CHIETA is implementing a small business development strategy which aims to develop a group ofSkills Development Facilitators from designated groups so that they can support SMMEs in theirgrant applications and thereby increase grant disbursements to small businesses.403 companies are being assisted and are receiving grants.
CTFL SETA The Clothing, Textile, Footwear and Leather SETA is implementing a cluster pilot project in Durbanand Cape Town. 77 companies are assisted.
ETDP SETA ETDP SETA offers provider accreditation and learnerships for SMMEs.
FASSET FASSET offers briefings to SMMEs on issues such as the 2003 budget, tax updates and the SETAfacilitates continuing professional education for small businesses.
FIETA FIETA offers training in furniture making for SMMEs and is also funding an SMME charcoal project.
FOODBEV The FOODBEV SETA conducts road shows for SMMEs, supports the submission of WorkplaceSkills Plans and funds SMME projects as well as SDF and moderator training.
HWSETA HWSETA trains SDFs to support SMMEs.
INSETA INSETA runs discretionary grant projects aimed at SMMEs 130 unemeployed individuals have been trained to date.
ISETT ISETT has a number of SMME projects, including business skills training, electronics procurementand rural telecommunication.
LGWSETA The LGWSETA is involved with the Mvula Trust Community Water and Sanitation Project (Maru APula) and NCWSTI Community Training and Development Programmes (Skills Programmes) both ofwhich target small businesses. The NCWSTI completed training of 96 learners in the five skillsprogrammes for community and sanitation workers at the end of June 2003. They all came from thePolokwane area.
MAPPP MAPPP holds information and training sessions for SMMEs to support them to complete WorkplaceSkills Plans, claiming grants and facilitating skills development.322 companies assisted.
MERSETA Merseta has facilitated the training of 7 984 learners in 300 SMMEs.
MQA The MQA provides assistance to SMMEs in jewellery manufacture and gemstone processing (344companies) and small scale farming (330 companies)
PAETA The Primary Agriculture Sector mainly comprises SMMEs, therefore, most of the work done byPAETA focuses on small business. Some examples are:Goodhouse – 55 small scale farmers on learnerships and 100 workers on skills programmes.Sheep Shearing – communal sheep shearing teams are in the process of being trained. All areself employed on completion. 50 trained by end of 2002/03Lwamondo : 35 vegetable farmers and 85 fruit farmers (land reform) trained in range of skillsprogrammes for export purposes.Small scale cotton farmers : 55 farmers completed training. All are self-employed.Fire fighting : 300 workers trained of whom at least 80% (240) are from farms with less than50 workers.Learnerships : 56 unemployed trained of whom 50 found self-employment on own farms (mainlyland reform).PAETA supports projects in medicinal plant nurseries, floristry, hydroponics and export flowerincubators.
POSLEC POSLEC supports candidate attorney learnerships
SERVICES The Services SETA supports SME ISO programmes, skills development support and continuedprofessional development workshops
SETASA 250 companies on mentorship programme850 companies to be trained on entreprenial skillsThree SDF’s appointed AMME’s in completing WSP’sOne emerging small company trained on technical skills
TETA TETA provides SMME skills development support
THETA THETA supports tourism learnerships and the recognition of prior learning of tour guides
W&RSETA W&R SETA contracts SDFs to support SMMEs

32
Through the initiatives outlined in the above table, approximately 56 633 persons have beentrained through projects funded by the SETAs.
5.2.2.3 NSF projects to support SMMEs
Many of the NSF strategic projects being implemented are also specifically targeting smallbusinesses. These are included in Table 13 .
Table 13: NSF Projects targeting SMMEsSETA Nature of intervention Beneficiaries targeted or reached
BANKSETA Training of Micro-finance institutions aswell as individual and SMME borrowers.
● 1 200 micro-lenders● 1 200 SMME borrower clients● 6 000 individual borrower clients
CETA Learnership for construction contractors ● 40 learners in training
PAETA 1. Training of small cotton growers2. Increased hectares planted3. Improved in quality of harvest4. Job creation5. Thimbali Flower project6. Paprika Project7. Sugar Cane Growers8. Citrus Growers
● 43 learners completed training● hectares increased from 100 to 542● 64% increase in the quality of
harvested grades ● 14% increase in permanent workers
and 200% increase in seasonalworkers
● 50 flower farmers in learnershipsand 100 workers in skillsprogrammes
● 24 farmers in paprika learnerships,50% females
● 1 200 small cane growers in skillsprogrammes
● 55 citrus grower farmers inlearnerships.
SETASA SMME support programme ● 49 SMME learners completedtraining
THETA SMME development in the touristindustry
● 111 in training.
TETA Training of SMMEs involved in smallboat fishing
● 1 824 SMMEs completed skillsprogrammes.
FIETA 1. Learnerships & Skills programmesfurniture SMME manufacturers
2. Business development support forSMME furniture manufacturing
700 learners in training.
550 SMMEs.
W & R-SETA
1. Business management training forW & R Industry SMMEs
2. Entrepreneurial training for W & RIndustry retrenchees.
5 000 SMMEs.
5 000 retrenchees.

Table 13 indicates that 16 956 learners from small businesses have benefited or are likely tobenefit from training on NSF projects.
The National Skills Survey, which has been commissioned by the Department of Labour, willhave a focus on small business and will provide information on the impact of support providedby SETAs to SMMEs. This report will be available at the end of December 2003.
During 2002/03, in excess of 13 000 grants have been disbursed to SMMEs for their trainingactivities. More than 1 600 SMMEs have been assisted through special SETA initiatives on thebasis of discretionary grants and NSF funded projects. Overall, approximately 73 589 learnersin SMMEs have benefited from skills development through SETA and NSF initiatives. Thesefigures are a rough indication of what is in reality a very significant amount of support beingdelivered to the small business sector to boost skills amongst employers and workers in theseenterprises.
33
Limpopo Sakhasonke Contractor Development Programme
The Sakhasonke Contractor Development programme is a project of the Limpopo Department of Public WorksEducational and Training project which assists contractors in the province to develop their own enterprises tocompete, survive and prosper in the construction sector.
This project is linked to the CETA (Construction SETA) NSF project to support and develop small, medium andmicro enterprises.
During 2002/03 40 candidates were selected (22 women and 18 men) from 260 applicants. 43% of learners areunder 30. They are learning practical and entrepreneurial skills which help to build their own contractingbusinesses. In turn these businesses will create jobs for others.
The first phase of the learnership programme involves classroom training in areas such as starting and running abusiness, tendering for contracts, understanding and applying business finances. From there training moves toactual construction sites where learners receive workplace experience in technical and hands on aspects ofconstruction.
For Limpopo the project brings rewards in terms of development and jobs. The Limpopo Department of PublicWorks has earmarked a number of capital projects valued at more than R50 million on which the learners will beworking.
Source:CETA Brochure

5.3 Achievements and challenges
When looking at the support provided to SMMEs through the workplace skills grants, SETAsare showing progress towards meeting this objective. There has been substantial improvementon last year’s progress. Given that the NSDS has been in place for two years, and will berunning for another two years, the overall success indicator seems achievable if the currentmomentum is maintained. A total of 56 633 learners from SMMEs are benefiting from SETAprojects using their discretionary funds. In addition the support provided through NSF projectsto SMMEs will add a further 16 956 learners from SMMEs who are being trained or supportedthrough skills development initiatives.
34

35
Chapter 6
Progress on Objective Four
Promoting skills developmentPromoting skills developmentfor employability andfor employability andsustainable livelihoods throughsustainable livelihoods throughsocial development initiativessocial development initiatives
6.1 Setting the scene
The NSDS seeks to assist unemployed adults to improve their livelihoods through skillsdevelopment for participation in social development initiatives. Social development projects aregovernment or community driven initiatives for the delivery of basic services, products andpublic infrastructure that can also provide employment for local communities. Through thisobjective, the strategy also aims to promote sustainable livelihoods for the poor. This goesbeyond simply earning an income to include opportunities for self-employment and non-marketservices such as community based care and community housing schemes. It can also includemore intangible benefits such as the acquisition of life skills. This objective requirescooperation between national, provincial and local governments. For example, the Departmentof Labour is currently responsible for co-ordinating skills development on the nodal projects,which have been identified through the Integrated Sustainable Rural Development Programme(ISRDP) and Urban Renewal Programme (URP) that are managed by the Department ofProvincial and Local Government. The funding source for this objective is the National SkillsFund, which sets aside a proportion of its income for funding social development projects viathe provincial offices of the Department of Labour. Targets have been set to ensure NSFfunding is spent on viable development programmes and that the impact of spending ismeasured for this objective.
Specific success indicators for this objective are:
Success Indicator 4.1 : By March 2003, 100% of National Skills Fund apportionment to socialdevelopment is spent on viable development projects.Success Indicator 4.2 : By March 2005, the impact of the National Skills Fund is measured byproject and duration, including details of placement rates, which shall be at least 70%.
6.2 Success Indicator 4.1
By March 2003, 100% of National Skills Fund apportionment to social development is spent onviable development projects.
6.2.1 Review of 2001/02 findings
By March 2002, 76% of the funds allocated for training in social development projects had beenspent. During 2001/02, 40 432 people had participated in training through the provinces, 98%of whom had completed their training.

36
6.2.2 Progress made in 2002/03
Most of the NSF funding has been allocated and spent over three quarters of the year.Table 14 shows that 94% of NSF funding was allocated, and 77% (of the 100% target) wasspent by March 2003.
Table 14: NSF Provincial allocations and utilization rate for social development projects.
Source: National Skills Fund Information System
Figure 9 shows the breakdown of beneficiaries trained up to March 2003 across the provinces.From April 2002 to March 2003, there were 94 173 people trained from the social developmentwindow of the NSF. This is a significant increase on the numbers given in the last report.
Novel Garments Project – Atlantis, Western Cape
The Provincial Office in the Western Cape has been able to support Novel Garments in training women andyoung industrial sewing machinists for a new factory in Atlantis. Training commenced in July 2002 through acontractor, SITS, and 1 183 persons have received training. The Department of Labour’s sponsored trainingwill be followed by intensive training at the factory, after which trainees will be guaranteed placement at thefactory.
Provinces Totalbudget
% of thetotal budget
Allocated toprojects
% allocated Spent % utilised
WesternCape
12 833 960 5.37 11 317 860 88.19 8 477 667 74.91
EasternCape
66 064 196 27.67 65 160 495 98.63 54 405 340 83.49
NorthernCape
7 598 374 3.18 7 282 795 95.85 4 126 148 56.66
Free State 18 189 021 7.62 16 523 982 90.85 13 152 081 79.59
KwaZulu-Natal
33 084 970 13.86 27 563 083 83.31 21 690 642 78.69
North West 26 011 425 10.89 23 846 865 91.68 20 600 379 86.39
GautengSouth
23 214 482 9.72 22 281 925 95.98 17 982 741 80.71
GautengNorth
18 781 941 7.87 17 424 790 92.77 12 846 235 73.72
Mpumalanga 18 836 431 7.89 18 315 454 97.23 9 585 600 52.34
Limpopo 14 167 713 5.93 13 927 126 98.3 9 754 289 70.04
Total 238 782 513 100 223 644 375 93.66 172 621 122 77.19

37
Figure 9: Beneficiaries of training funded by the Social Development Window of the NSFApril 2002 – March 2003
By far the greatest number of people were trained in the Eastern Cape during 2002/03.
The following examples provide an overview of some success stories from provincial projectsbeing implemented through the NSF:
4 789
38 168
2 244
8 4707 609
9 672
6 5887 275
3 309
6 049
WesternCape
EasternCape
NorthernCape
FreeState
KwaZulu-Natal
NorthWest
GautengSouth
GautengNorth
Mpumalanga
Limpopo
0
5 000
10 000
15 000
20 000
25 000
30 000
35 000
40 000

38
Eastern Cape Best Practice Case Study
Project description
The Coega Industrial Development Zone is divided into a deepwater port and an industrialdevelopment zone (IDZ) covering 12 000 hectares. The deepwater port is being developed atthe mouth of the Coega River.
There is the potential for 10 000 full time jobs over the next 30 years. To date, there have been6 000 workers on site (currently 4 800) and the potential for 20 000 workers during thedevelopment stages. The unemployment rate in Port Elizabeth is about 40% and in theMotherwell area (next to the CDC IDZ) it is close to 60%. COEGA is a huge IndustrialDevelopment Zone (IDZ) intended to attract foreign investment into the area through thedevelopment of a deep-water port and industrial zone. CDC distributed approximately 600 000registration forms to people living in the local community. About 50 000 people registered andwere captured in the CDC database, and the majority of these individuals reside in the localarea. It is from this pool of individuals that the CDC identifies potential trainees and/or workers.
Profile and background
Name of project: COEGA Deep Water Port and Industrial Development ZoneLocation: Nelson Mandela Metropolitan Municipality (Port Elizabeth)Funding partner(s): Department of Labour/Coega Development Corporation
(CDC)/Construction SETATraining: Mostly civil construction for the land site and the port site and some
SMMENumber trained to date: 1 698Number placed to date: 1 028

39
KwaZulu-Natal best practice case study
Project description
uShaka Island is a large construction project situated on Durban’s South Beach. thatcommenced in 2002 and is set to be completed by the end of March 2004. It will accommodatethe South African Association for Marine Biological Research (SAAMBR) and its Sea World, aswell as shops, restaurants and other tourist attractions. The development is being managed bya Joint Venture of Stocks and Stocks, Concor, JT Ross, Stefinotti and eight smaller contractors.uShaka Island is part of Durban’s “Golden Triangle”, the other two points on the triangle beingthe Casino and the International Convention Centre (ICC).
Company profile and background
Name of project; uShaka IslandLocation: South Beach, DurbanFunding partner(s): City of Durban, DBSA, and Citi Bank—US $700mBeneficiaries Unemployed individuals from the local community and mostly black
males.Training: Mostly civil construction skills, including concrete reinforcing, electrical
cable laying, brick laying, carpentry, plumbing, shuttering, plastering, painting and first aid.
Number trained to date: 510Number placed to date: 200 on the site and another 40 were placed by another contractor on
another project.

40
Free State Best Practice Case Study
Project description
Twenty-six females and six males from the Meloding Township near Virginia in the Matjhabengmunicipality formed the Ithabeleng Poultry Association. These people were unemployed andwere confronted by poverty. The group decided to raise funds for a self-employment incomegenerating activity and identified poultry farming as the common group interest. They thenapproached the Department of Agriculture for advice and help on how to start the project andfinancial assistance selection of beneficiaries.
The site was obtained from the Meloding Commonage, which is within walking distance of thetownship.
The aim of the business was to establish structures that had 6 000 caged layers and wouldbecome one of the largest egg producers in the country.
The Department of Agriculture funded the project by providing R431 600 towards infrastructureand equipment. Eskom donated the electricity and Meloding Commonage also made donations. The Land Bank also contributed R37 340 towards the project. The implementing agent isDPLG/ Local Council.
Company profile and background
Name of project: Ithabeleng Layer ProjectLocation: Virginia LED Farms, Matjhabeng MunicipalityFunding partner(s): Department of Agriculture, Municipality of Matjhabeng, Department of
LabourBeneficiaries: Unemployed adults from MelodingTraining: Business Orientation, Business Skills for SA (Rural), Poultry Assistant,
Egg Production, Selling SkillsNumber trained to date: 32 (26 female and 6 male)Number placed to date: 32

41
6.3 Success Indicator 4.2
By March 2005, the impact of the National Skills Fund is measured by project andduration, including details of placement rates, which shall be at least 70%.
6.3.1 Review of 2001/02 findings
The average estimated placement rate for social development projects during 2002 was foundto be 36%. Tools to measure the impact of the National Skills Fund, including a more thoroughassessment of placement, through social development projects are to be developed during2003.
6.3.2 Progress made in 2002/03
A pilot impact study has been conducted in the Gauteng South Provincial Office of theDepartment of Labour. This study was contracted by the Department of Labour to undertakeprimary research into the effectiveness of training provided in 2000 and 2001. Issuesaddressed by this study included:
● An evaluation of the impact of training on trainees ● Developing a workable definition of sustainable livelihoods● An assessment of the effectiveness of the Provincial Office in reaching out to its clients.
Figure 10 illustrates the placement of learners (a total of 521 were interviewed for the study)before and after training was conducted. Before the training, 45% of these people wereunemployed. After the training, 73% of the unemployed trainees were able to find jobs or inself-employment. The majority of beneficiaries were absorbed into formal employment andsocial development projects. The high percentage employed in formal employment confirmsthat skills acquired are seen as useful by the private sector. However, the high level ofcontinued employment on social development projects indicates a need to support beneficiariesto apply their skills outside these projects, perhaps in self-employment ventures.

Figure10: Economic activity of beneficiaries before and after training in Gauteng South
Source: Report prepared by KNC & Associates, March 2003
In addition, this study showed that the proportion of beneficiaries not earning an income fellfrom 56% to 23% after training. Those earning a monthly income over R2 000 a monthincreased from 3% to 23% after training had occurred. The majority of beneficiaries earningover R2 000 were employed in printing, mechanical engineering, driver training, draughting andcomputer programming. Beneficiaries were also asked to comment on improvements instandards of living as a result of the training received. Standard of living was measured on thebasis of education and training, financial benefits and access to health facilities. Some 78% ofbeneficiaries indicated an improvement in their standard of living after the training. Another 45of the beneficiaries were able to open a bank account after the training occurred.
The Department has also completed a donor-funded research exercise to determine the impactof training funded under the National Skills Fund social development funding window (SDFW)The findings of the national verification study found placements in a randomly selected sampleof projects to be as high as 75%. A total of 223 projects were researched, where training wasfunded during the year and up to August 2003. The following is a breakdown of placementfigures per province that was determined during this recent research initiative.
42
16%
27%
4%
24%
12%
16%
8%9%
8%
45%
Casualemployment
Formalemployment
Student SocialDevelopment
Project
Unemployed0
5
10
15
20
25
30
35
40
45
After
Before

Figure 11: Placement statistics per province from 2003 research verification exercise
It is foreseen that the results of this research study will provide vital information on the successachieved in terms of the social development projects for the final NSDS 2005 evaluation report.
6.4 Achievements and challenges
The target for placements was 70%, and 75% has been achieved. This is a great success.However, spending at 76% falls short of the 100% target that was to have been achieved byMarch 2003. The trend in provincial expenditure of social development funding has increasedand pressure to meet the objective will be maintained in 2003/04. The number of personsbenefiting from social development training has increased significantly during the year.Following the initial pilot study, conducted for Gauteng South and the subsequent nationalimpact study, a process is being developed for all the provinces to collect information on theimpact of training on individual learners as well as on the local economy. More information willbe reported on this in the next year. This report has indicated early signs that training is havingthe desired impact on the placement of learners, as well as on some quality of life indicatorsand increased earnings.
The expansion of Public Works Programmes envisaged in the agreements reached at theGrowth and Development Summit will also impact on this objective in the next year. Many ofthese initiatives will be mainstream infrastructure projects with a strong labour-basedconstruction component. They will need to be supported by skills development initiatives at aprovincial and local level. The Department of Labour is expected to support training for theexpansion of public works programmes. The role of SETAs in the implementation of theseprogrammes will also need to be enhanced as there is pressure for training on all projects to beregistered on the NQF, and hence quality assured.
43
Tota
lWCECNCFSKZNNWMPLMGSGN
74.87%
101.95%
78.43%
59.89%
45.09%
80.00%
49.78%
69.87%
60.58%
81.82%
39.13%
0
20%
40%
60%
80%
100%
120%

44
Chapter 7
Progress on Objective Five
Assisting new entrants intoAssisting new entrants intoemploymentemployment
7.1 Setting the scene
Young unemployed people are a vulnerable group in South Africa and are thus a special targetof the National Skills Development Strategy. The intention is to target young people with andwithout school leaving and other qualifications who cannot find jobs. Learnerships are seen asa particularly useful mechanism to provide relevant training opportunities to ensure a better fitbetween the skills young people have and those required in the workplace.
The targets set for this objective are:
Success Indicator 5.1 : By March 2005, a minimum of 80 000 people under the age of 30 haveentered into learnerships.Success Indicator 5.2 : By March 2005, a minimum of 50% of those who have completedlearnerships are, within six months of completion, employed in full time study or further trainingor are in a social development programme.
7.2 Success Indicator 5.1
By March 2005, a minimum of 80 000 people under the age of 30 have enteredlearnerships.
7.2.1 Review of 2001/02 findings
In March 2002, there were 3 203 learners in learnerships and by July 2002 this had alreadyincreased to 7 703. At that time 9,6% of the target of 80 000 had been achieved. Howeverthese figures included all learners as the information collection system did not allowdifferentiation between those previously employed and unemployed.
7.2.2 Progress made in 2002/03
There are now almost four times as many learnership agreements signed, and over 4 000individuals who have completed learnerships (see Table 15 ). The information has now been
MERSETA Air Conditioning and Refrigeration Project
The first group of students in the air-conditioning and refrigeration industry have graduated after completing alearnership programme.
Some 34 learners successfully completed the requirements for NQF level two and three learnerships.
One of the pupils who graduated, Kwazi Ditsela, said “I was so excited to be chosen for the learnership, but I wasnot sure what lay ahead. I have learnt a lot and I am more confident in my work. Previously I had a job, now Ihave a career.”
Source: Sunday World
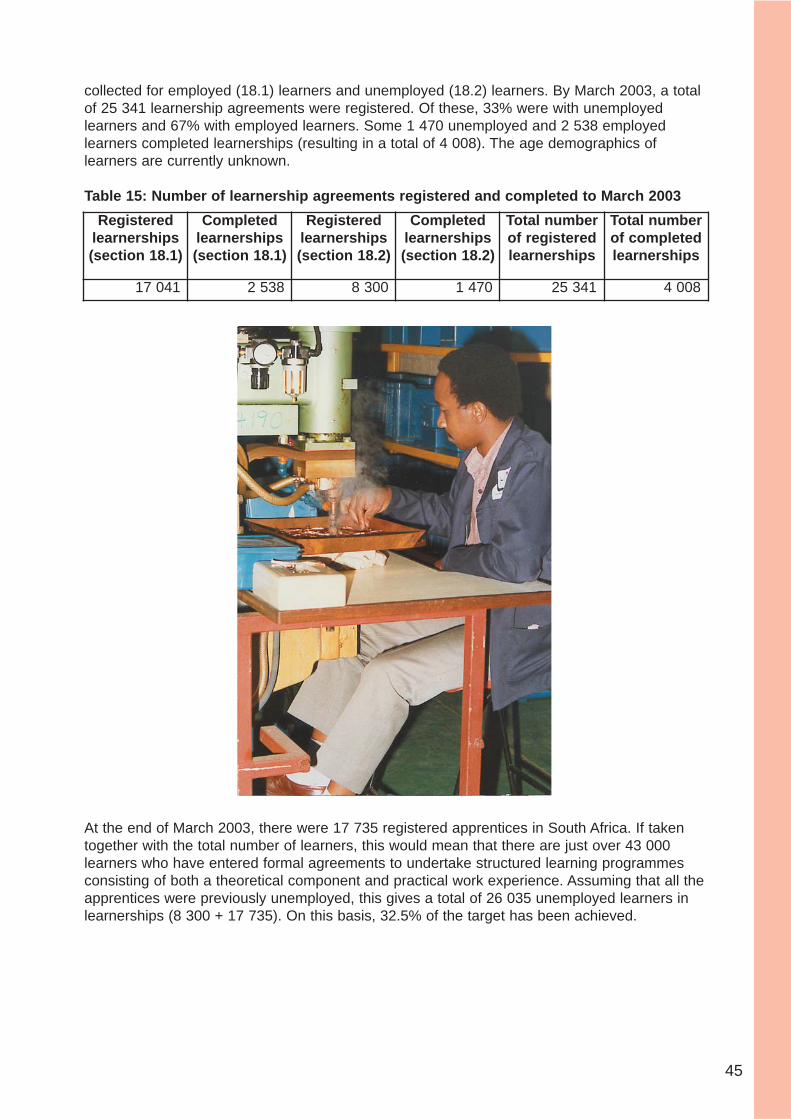
45
collected for employed (18.1) learners and unemployed (18.2) learners. By March 2003, a totalof 25 341 learnership agreements were registered. Of these, 33% were with unemployedlearners and 67% with employed learners. Some 1 470 unemployed and 2 538 employedlearners completed learnerships (resulting in a total of 4 008). The age demographics oflearners are currently unknown.
Table 15: Number of learnership agreements registered and completed to March 2003
At the end of March 2003, there were 17 735 registered apprentices in South Africa. If takentogether with the total number of learners, this would mean that there are just over 43 000learners who have entered formal agreements to undertake structured learning programmesconsisting of both a theoretical component and practical work experience. Assuming that all theapprentices were previously unemployed, this gives a total of 26 035 unemployed learners inlearnerships (8 300 + 17 735). On this basis, 32.5% of the target has been achieved.
Registeredlearnerships(section 18.1)
Completedlearnerships(section 18.1)
Registeredlearnerships(section 18.2)
Completedlearnerships(section 18.2)
Total numberof registeredlearnerships
Total numberof completedlearnerships
17 041 2 538 8 300 1 470 25 341 4 008

46
7.3 Success Indicator 5.2
By March 2005, a minimum of 50% of those who have completed learnerships are, within6 months of completion, employed, in full time study or further training, or are in asocial development programme.
7.3.1 Review of 2001/02 findings
In March 2002, it was reported that it was too early to make any definite comments onplacement rates for learners completing learnerships.
7.3.2 Progress made in 2002/03
A study evaluating learnerships is currently underway and will be completed by May 2004. Thisstudy will provide information on:
● The efficiency and effectiveness of learnerships and their impact on the labour market● Models for future evaluation of learnerships● Beneficiary perspectives of learnerships.
7.4 Bursaries
Whilst this Success Indicator envisages assisting young people to enter the labour marketthrough learnerships, demand has required that the response be broadened to include formalstudy through traditional routes. Funds from the NSF have therefore been allocated tobursaries in scarce skills areas.
The National Research Foundation administers postgraduate bursaries and the NationalStudents Financial Assistance Scheme (NSFAS) administers undergraduate bursaries. During2002/03, 577 students were awarded postgraduate bursaries. Areas of study included,accounting, auditing, actuarial sciences, bioinformatics, biotechnology, chemistry, computerscience, demography, engineering, financial management, geology, information systems,mathematical sciences, microbiology, physics, statistics, tourism as well as transportationstudies.
Another 2 688 students were awarded undergraduate bursaries in the areas of, Commerce,engineering, administration, computer science, marketing, science, information systems,business, librarianship, nursing, tourism management, law, arts, dentistry, education (primary)and fine art.
A number of bursaries are also offered by SETAs. These are funded by using both SETAsdiscretionary funds as well as the National Skills Fund Strategic Projects.
The following bursaries have been offered through the NSF funding to the SETAs:
FASSET: Undergraduate bursaries in accounting.Clothing, Textiles and Footwear: Bursaries in textile technology.Mining Qualifications Authority: Bursaries in mining, chemistry and jewellery.SETASA: Bursaries offered in scarce skills in sugar, milling and
tobacco.MERSETA: Bursaries offered for 100 applicants in higher education.
70% to be awarded to technikon applicants and 30% to university applicants.

47
Finally, the Department of Labour awarded 189 bursaries to students with disabilities betweenJanuary and December 2002.
7.5 Achievements and challenges
The number of learners enrolled in learnerships increased dramatically from March 2002 toMarch 2003 - from 3 203 to 25 341. This represents a major achievement in a short period oftime. However it is imperative that focus continues to be placed on learnership implementationin order to reach the target of 80 000. This will be supported in 2003/04 by the agreementsreached at the Growth and Development Summit, where business and government committedto registering at least 72 000 unemployed learners in learnerships by May 2004.
There will need to be ongoing monitoring and evaluation of learnerships to assess placementand ongoing impact both for the individual learners and the economy more broadly. The studycommissioned by the Department is currently underway and will provide some of thesefindings. The SETAs also need to ensure that they are monitoring the implementation oflearnerships in their sectors.
Two further initiatives are underway to support this target. A project is underway to assistwould-be learners to select from available learnership opportunities and an Exit Strategy isbeing devised. The Exit Strategy is in line with the GDS agreement to assist learnershipgraduates to progress to self-employment through New Venture Creation learnerships.

48
Chapter 8
Progress on equity targetsProgress on equity targetsacross all NSDS objectivesacross all NSDS objectives
8.1 Background
As stated in the introduction to this report, equity targets underpin every objective of the NSDS.These targets state that the beneficiaries of the strategy should be 85% black, 54% female and4% people with disabilities. This is a very important aspect of the strategy and is seen asfundamental to its overall success. Equity is an essential principle for the transformation ofeconomic relations broadly, and education and training more specifically, and for ensuring thatthe legacy of apartheid is addressed. Ensuring equity in skills development is also critical toaddressing the skills constraints that are faced by the South African economy. This chapter will provide an overview of progress on equity targets for the NSDS objectives 1, 4and 5, which deal with learner beneficiary numbers.12
8.2 Objective One
8.2.1 Success Indicator 1.1
By March 2005, 70% of all workers have at least a level one qualification on the NationalQualifications Framework.
Table 16 illustrates the breakdown of workers who have achieved NQF level 1 qualifications inrelation to the equity targets. As can be seen, progress was more advanced in relation to thetarget of 85% of black people receiving training, with a 78% achievement during 2002/03. As apercentage of total, the number of women and people with disabilities achieving NQF level oneis still significantly under target.
12 The figures represented in this chapter are shown as percentages only due to a lack of correspondence withthose used in Chapter 3. Different sources have been used and this chapter therefore gives an indication of progressagainst Objective One of the NSDS and a more accurate account with regard to Objective Four.

49
Table 16: Racial, gender and disability breakdown of workers achieving NQF level onequalifications against NSDS equity target
8.2.2 Success Indicator 1.2
By March 2005, a minimum of 15% of workers to have embarked on a structured learningprogramme, of whom at least 50 % have completed their programmes satisfactorily.
Progress in achieving equity amongst the beneficiaries of all structured learning programmesdemonstrates poor performance in relation to population group and disability, but improvementin relation to gender. The participation of blacks in all workplace training is lower whencompared to NQF level one training. On the one hand, this is to be expected as black workersmake up the vast majority of those with lower educational attainment in the workforce as awhole and workers at this level seem to be getting less than those higher up. On the otherhand, black workers should be more strongly represented in training programmes if they are tobe supported in effective skill acquisition to support their chances of upward mobility.
Table 17 indicates that there is still some lagging behind on the equity targets for those whohave completed structured training, when considering percentages of total. Total figures arepresented for 2002/03, with 54.49% of the workers who completed structured learning beingblack, 40.54% being women and 0.08% being disabled.
Table 17: Racial, gender and disability breakdown of workers participating in structuredlearning programmes against NSDS equity target
8.3 Objective Four
8.3.1 Success Indicator 4.1
By March 2003, 100% of National Skills Fund apportionment to social development is spent onviable development projects
As stated in Chapter 6, 94 173 learners were trained using funds from the social developmentwindow of the NSF by March 2003. The graphs below show the equity breakdown for thisnumber:
EquityTarget
Black 85% Women 54%People with disabilities
4%
Progress 54.49 40.54 0.08
EquityTarget
Black 85% Women 54%People with disabilities
4%
Progress 77.54 20.43 0.04

50
Figure 12: Percentage of women trained on social development projects.
The equity target of 54% has been met at a national level for social development projects. TheWestern Cape, Northern Cape, KwaZulu-Natal and Gauteng South are slightly under target, butall the other provinces are over target.
Figure 13: Percentage of black people trained on social development projects
99.3% 99.6% 99.4% 99.8% 99.6% 99.0% 98.8%
90.4%
99.1% 99.5% 98.7%
WC EC NC FS KZN NW GS GN MP LP RSA0
10
20
30
40
50
60
70
80
90
100
WC EC NC FS KZN NW GS GN MP LP RSA0
10
20
30
40
50
60
70
44.2%
64.3%
52.7%
60.2%
52.2%
61.1%
52.1%
56.6%54.9%
69.0%
59.9%

51
The equity targets for race have been met and exceeded by all provinces and at a nationallevel for social development projects.
Figure 14: Percentage of people with disabilities trained on social development projects
The disability equity targets have been met in six of the 10 provinces (Gauteng is divided intoGauteng South and Gauteng North).
8.4 Objective Five
8.4.1 Success Indicator 5.1
By March 2005, a minimum of 80 000 people under the age of 30 have enteredlearnerships.
Equity figures are not currently available for learnerships, but are available for the apprenticeswho started their programmes during 2003. The equity profile of these apprentices are shownin Table 18 .
Table 18: Equity profile of apprentices commencing programmes during 2003.
Of the 577 bursaries offered for postgraduate study in 2002/03 with NSF funds, 67% ofbeneficiaries were black and 40% were women. Of the 2 688 bursaries offered forundergraduate study, 47.7% went to women.
EquityTarget
Black 85% Women 54%People with disabilities
4%
Progress 70 6.6 1.3
1.04%0.70%
4.90%
0.70%0.39%
7.26%
4.33%4.03%
6.10%
10.71%
2.81%
WC EC NC FS KZN NW GS GN MP LP RSA0
2
4
6
8
10
12

52
The Department of Labour bursaries for students with disabilities were awarded on the basis of76% black beneficiaries and 30% women.
8.5 Achievements and challenges
Achieving equity targets continues to be a challenge for the implementers of the NSDS. Inparticular none of the disability targets are currently being met, except in six of the provinces.Targets are also not being met in areas where black people have historically beendisadvantaged (e.g. in structured learning opportunities and completion of apprenticeships) andsimilarly women are also still excluded from apprenticeship and, to some extent, other learningopportunities.
To meet these targets the following areas require particular focus:
● Women and people with disabilities achieving NQF level one qualifications● Black people, women and people with disabilities’ access to structured learning● People with disabilities’ access to social development projects● People with disabilities and women’s access to apprenticeships.
The last implementation report called for closer alignment between employment equity plansand workplace skills plans. SETAs and provinces will need to play a much greater role infacilitating and promoting this in order to achieve these targets. SETAs should also be placingmore emphasis on equity when determining discretionary funded projects for their sectors.
Agreements reached at the Growth and Development Summit in June 2003 also emphasise theneed for strengthening the role of SETAs and skills development in promoting and supportingemployment equity and support for the NSDS targets on learnerships.
Amasondo Esibindi - Wheels of Courage
Amasondo Esibindi is a project that is the brainchild of three key organisations, Services SETA, The QuadriplegicAssociation of South Africa (QASA) and the Centre for Skills Development & Technology Transfer (CSDTT).Together these three organisations have developed and are implementing a learnership with a difference. Thefocus of the Amasondo Esibindi team is to empower people with mobility impairment to create, develop andsuccessfully manage their own businesses. Learners embarking on this learnership have the opportunity toestablish and sustain their own business, thereby empowering themselves and making a contribution to theeconomy of South Africa.
Source: Services SETA website

53
Chapter 9
The way forwardThe way forward
This report shows that we have made good progress on the road to achieving the targets of theNational Skills Development Strategy for March 2005. But it is not yet time to rest, as there isstill a long way to go.
We have remarkably already achieved or exceeded, two years ahead of schedule, our 2005targets in the following four areas:
● 15% of workers in structured learning programmes (target 1.2)● 40% of medium sized firms receiving skills grants (target 2.2)● Availability of learnerships in all sectors of the economy (2.3)● Placement rates for learners in social development projects (4.2).
Government departments are reporting on their training expenditure to the National Treasury,and hence it can be said that target 2.4 has also been achieved. Over R620 million was spenton training last year by national government alone, as compared to R561 million the yearbefore, and government officials report rising awareness of training since the launch of theStrategy.
We are within reach of our 2005 targets in the following areas, assuming work continues toimprove at the current rates:
● National standard for people development in the workplace (1.3)● Levies and grants for large employers (target 2.1)

54
● Assistance to small and emerging firms (target 3.1).
We are doing much better than in 2001/02 in the following area, but the target is still somedistance away:
● Achievement of NQF level one qualifications by workers (1.1)● Unemployed learners (and apprentices) in learnerships and apprenticeships (5.1).
In relation to the spending on training for social development projects (target 4.1) we did well,but did not achieve the target of 100% spending by March 2003 as set. The Minister of Labourhas brought the timeframe for this target into line with others – to be achieved by March 2005,and so there is more time to stretch towards the goal.
The areas where we must still do a lot of work if we want to achieve the targets by March 2005are:
● The equity targets – especially for women and people with disabilities
The impact targets – which in some cases are linked to other targets (such as for 2.1, 2.2 and3.1) – and which in some cases are stated separately (5.2) still need to be reported on. Studieshave been commissioned in each of these areas and reports will be tabled next year.
Taken together there has been remarkable progress over a very short period and governmenttogether with its social partners can take pride in this report. The National Skills DevelopmentStrategy is no longer just a vision of the future, but is fast becoming a reality for many SouthAfricans. We must use this report to craft the way forward and to ensure that the targets we setfor ourselves are met.

55
Appendix 1
Investors in PeopleInvestors in People
Channel 1: Pilot Programme (39 organisations)
Name oforganisation
Size oforganisation
Committed -working towards
the Standard
Recognised asan Investor in
Peopleorganisation
Sector Educationand Training
Authorityaffiliated with
Agricultural ResearchCouncil (ARC)
3 100 ✓ SETASA
Banking SectorEducation andTraining Authority
13 ✓ Services SETA
BMW (South Africa)Pty Ltd
2 983 ✓ MERSETA
Chemicals IndustriesSector Education andTraining Authority
25 ✓ ETDP SETA
Comparex Africa (Pty)Ltd
3 766 ✓ ISETT
Compass Group ofSouthern Africa (Pty)Ltd
6 810 ✓ THETA
Construction SectorEducation andTraining Authority
30 ✓
Corporate CollegeInternational
9 ✓ ETDP SETA
Crawford Schools, aDivision of AdvtechEducation (Pty) Ltd
1 200 ✓ ETDP SETA
DCD-Dorbyl Marine(Pty) Ltd
214 ✓ MERSETA
Department of Labour 6 102 ✓ PSETA
Department of PublicService andAdministration
233 ✓ PSETA
Department of Tradeand Industry
1 200 ✓ DIDTETA
Dutoit Group -Kromfontein
296 ✓ PAETA
Eastcape TrainingCentre
68 ✓ ETDP SETA
Education, Trainingand DevelopmentPractices SectorEducation andTraining Authroity
28 ✓
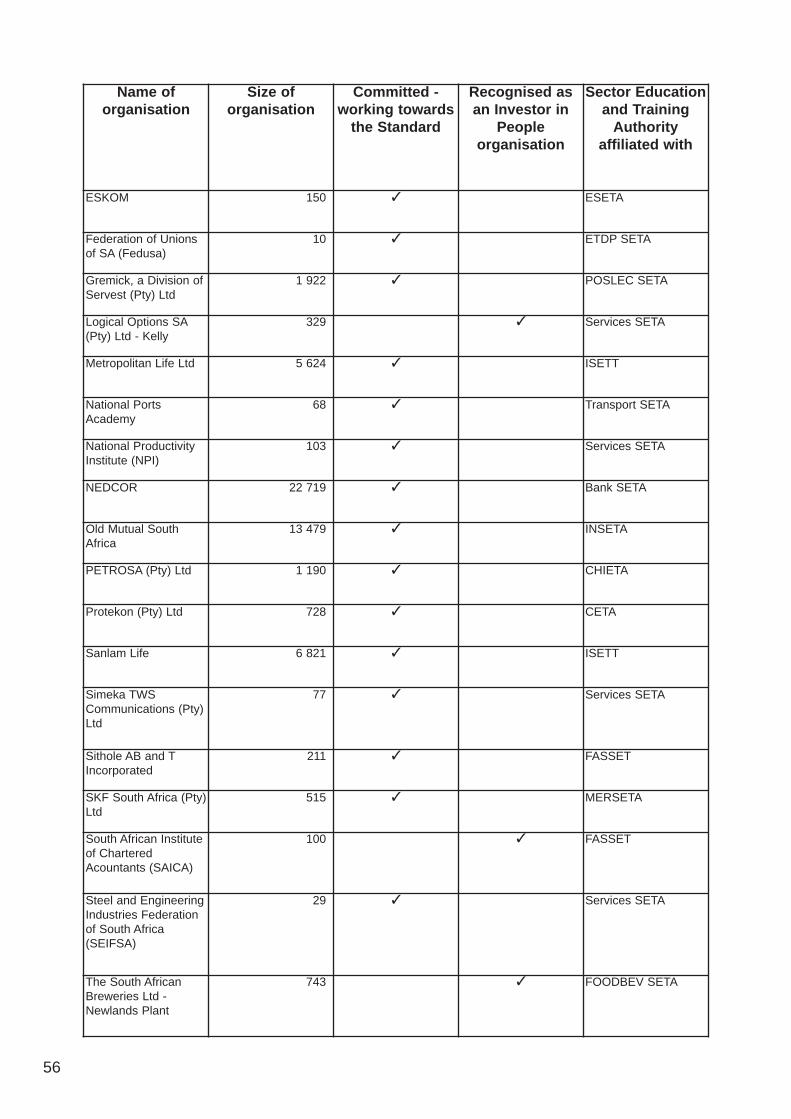
56
Name oforganisation
Size oforganisation
Committed -working towards
the Standard
Recognised asan Investor in
Peopleorganisation
Sector Educationand Training
Authorityaffiliated with
ESKOM 150 ✓ ESETA
Federation of Unionsof SA (Fedusa)
10 ✓ ETDP SETA
Gremick, a Division ofServest (Pty) Ltd
1 922 ✓ POSLEC SETA
Logical Options SA(Pty) Ltd - Kelly
329 ✓ Services SETA
Metropolitan Life Ltd 5 624 ✓ ISETT
National PortsAcademy
68 ✓ Transport SETA
National ProductivityInstitute (NPI)
103 ✓ Services SETA
NEDCOR 22 719 ✓ Bank SETA
Old Mutual SouthAfrica
13 479 ✓ INSETA
PETROSA (Pty) Ltd 1 190 ✓ CHIETA
Protekon (Pty) Ltd 728 ✓ CETA
Sanlam Life 6 821 ✓ ISETT
Simeka TWSCommunications (Pty)Ltd
77 ✓ Services SETA
Sithole AB and TIncorporated
211 ✓ FASSET
SKF South Africa (Pty)Ltd
515 ✓ MERSETA
South African Instituteof CharteredAcountants (SAICA)
100 ✓ FASSET
Steel and EngineeringIndustries Federationof South Africa(SEIFSA)
29 ✓ Services SETA
The South AfricanBreweries Ltd -Newlands Plant
743 ✓ FOODBEV SETA

57
Channel 2: Investors in People UK route (47 business units)
Name oforganisation
Size oforganisation
Committed -working towards
the Standard
Recognised asan Investor in
Peopleorganisation
Sector Educationand Training
Authorityaffiliated with
The South AfricanQualificationsAuthority
86 ✓ ETDP SETA
The X-Pert Group(Pty) Ltd
102 ✓ Services SETA
Transport SectorEducation andTraining Authority
49 ✓ PSETA
Volkswagen of SouthAfrica
4 972 ✓ MERSETA
Western PlatinumRefinery (Pty) Ltd
271 ✓ MQA
Total 86 375 31 8
Name oforganisation
Size oforganisation
Committed -working towards
the Standard
Recognised asan Investor in
Peopleorganisation
Sector Educationand Training
Authorityaffiliated with
The South AfricanBreweries Ltd -KwaZulu-Natal - Salesand Distribution
339 ✓ FOODBEV SETA
The South AfricanBreweries Ltd -Business Unit: Salesand Distribution:Northern region
297 ✓ FOODBEV SETA
The South AfricanBreweries Ltd -Business Unit: Salesand Distribution -Central region
253 ✓ FOODBEV SETA
ABSA - 14 businessunits
17 188 ✓ BANK SETA
African Bank 4 537 ✓ BANK SETA
BDB Data 150 ✓ BANK SETA
Development BankSA
431 ✓ BANK SETA
FNB - 13 businessunits
23 150 ✓ BANK SETA
HLGC 38 ✓ BANK SETA
Mercantile 550 ✓ BANK SETA

58
Channel 4: SETAs as Delivery Partners (4 SETAs)
Name oforganisation
Size oforganisation
Committed -working towards
the Standard
Recognised asan Investor in
Peopleorganisation
Sector Educationand Training
Authorityaffiliated with
Rennies Bank 398 ✓ BANK SETA
Reserve Bank SA 2 154 ✓ BANK SETA
Standard Bank - 8business units
7 813 ✓ BANK SETA
Servcon 175 ✓ BANK SETA
Teba Bank 550 ✓ BANK SETA
Total 51 332 50 units 0
Name oforganisation
Size oforganisation
Committed -working towards
the Standard
Recognised asan Investor in
Peopleorganisation
Sector Educationand Training
Authorityaffiliated with
SERVICES SectorEducation andTraining Authority
146 ✓
Food and BeverageManufacturingIndustry SectorEducation andTraining Authority
14 ✓
Diplomacy,Intelligence, Defenceand Trade andIndustry SectorEducation andTraining Authority
15 ✓
Financial andAccounting ServicesSector Education andTraining Authority
10 ✓
Total 185 4 0

59
Appendix 2
Registered Learnerships byRegistered Learnerships bySETSETAsAs
01 FASSET
RegNo NQF Status Learnership Title
01 Q 010005 00 780 7 7 R ACCA Learnership Level 7
01 Q 010004 00 240 5 5 R Associate Accounting Technician Level 5
01 Q 010003 00 360 6 6 R Associate General Accountant Level 6
01 Q 010016 00 120 5 5 R Certificate in Business Accounting Level 5
01 Q 010013 00 390 5 5 R Certified Accounting Technician Level 5
01 Q 010001 00 480 7 7 R Chartered Accountant: Audit Specialism Level 7
01 Q 010002 00 480 7 7 R Chartered Accountant: Financial Management Specialism Level 7
01 Q 010012 00 930 7 7 R Chartered Management Accountant Level 7
01 Q 010007 00 480 7 7 R Commercial and Financial Accountant: Commerce and Industry
Specialism Level 7
01 Q 010008 00 480 7 7 R Commercial and Financial Accountant: Public Practice
Specialism Level 7
01 Q 010017 00 240 6 6 R Diploma in Management Accounting Level 6
01 Q 010018 00 241 5 5 R GAP - Accounting Technician Level 5
01 Q 010010 00 120 4 4 R National Certificate in Business Adminisration Level 4
01 Q 010009 00 120 3 3 R National Certificate in Business Administration Level 3
01 Q 010019 00 120 4 4 R National Certificate in Public Sector Accounting Level 4
01 Q 010020 00 240 5 5 R National Diploma in Public Sector Accounting Level 5
01 Q 010014 00 120 3 3 R Registered Accounting Clerk Level 3
01 Q 010015 00 120 4 4 R Registered Bookkeeper Level 4
18Total: 18of which registered:
02 BANKSETA
RegNo NQF Status Learnership Title
02 Q 020008 29 120 4 4 R Asset Based Finance Learnership Level 4
02 Q 020014 00 120 5 5 R CML Learnership Level 5
02 Q 020010 00 240 5 5 R Credit Learnership Level 5
02 Q 020002 48 120 3 3 R Entry Level Banking Learnership Level 3
02 Q 020009 00 120 5 5 R Financial Services Co-operatives Banking Learnership Level 5
02 Q 020004 00 180 5 5 R Information Technology in Banking Level 5
02 Q 020011 00 120 6 6 R Internal Audit Technician Learnership Level 6
02 Q 020012 30 120 3 3 R Micro Lending Front Line Service Learnership Level 3
02 Q 020005 14 181 4 4 R Retail Banking - Credit Level 4
02 Q 020013 24 155 4 4 R Retail Foreign Exchange Banking Learnership Level 4
02 Q 020007 00 120 5 5 R Treasury Learnership Programme Level 5
11Total: 11of which registered:
Page 1Last updated: 30 September 2003
D: Draft P: Pending R: Registered DR: De-Registered W: Withdrawn RR: Re-Registered A:
Application Acknowledged

60
03 CHIETA
RegNo NQF Status Learnership Title
03 Q 030010 25 158 2 2 R Chemical Boilermaker (Pipe Assembly and Structural Steel)
Level 2
03 Q 030023 00 120 3 3 R Chemical Boilermaker (Pipe and Plate Fabrication) Level 3
03 Q 030024 00 120 4 4 R Chemical Boilermaker Level 4
03 Q 030011 25 183 2 2 R Chemical Electrician (First Line Maintenance/Installation
Electrician) Level 2
03 Q 030028 00 120 3 3 R Chemical Electrician (Maintenance and Installation) Level 3
03 Q 030029 00 120 4 4 R Chemical Electrician Level 4
03 Q 030015 39 198 2 2 R Chemical Fitter (First Line Maintenance) Level 2
03 Q 030025 00 120 3 3 R Chemical Fitter (General Maintenance) Level 3
03 Q 030026 00 120 4 4 R Chemical Fitter Level 4
03 Q 030027 00 120 3 3 R Chemical Instrument Mechanic (Field Maintenance) Level 3
03 Q 030037 00 120 4 4 R Chemical Instrument Mechanician Level 4
03 Q 030013 27 230 2 2 R Chemical Operations (Glass Container Former) Level 2
03 Q 030040 28 120 1 1 R Chemical Operator Level 1
03 Q 030041 14 126 2 2 R Chemical Operator Level 2
03 Q 030042 19 122 3 3 R Chemical Operator Level 3
03 Q 030033 00 120 3 3 R Chemical Rigger (Limited to 110 Ton Truck Mount Crane and 10
000Kg Load) Level 3
03 Q 030016 27 141 2 2 R Chemical Rigger (Limited to 30 Ton Center Mount Crane and
5000 Kilogram Load) Level 2
03 Q 030034 00 120 4 4 R Chemical Rigger Level 4
03 Q 030035 00 120 3 3 R Chemical Turner (Centre Lathe and Milling Machine) Level 3
03 Q 030012 26 197 2 2 R Chemical Turner (Centre Lathe) Level 2
03 Q 030036 00 120 4 4 R Chemical Turner Level 4
03 Q 030031 00 120 3 3 R Chemical Welder (Coded Pipe and Plate Welder Limited to
Carbon Steel) Level 3
03 Q 030021 24 136 2 2 R Chemical Welder (Structural Coded Welder) Level 2
03 Q 030032 00 120 4 4 R Chemical Welder Level 4
03 Q 030047 00 120 8 8 R Engineer: Electrical Engineering Level 8
03 Q 030044 00 120 8 8 R Engineer: Mechanical Engineering Level 8
03 Q 030014 27 165 2 2 R First Line Chemical Instrument Mechanic Level 2
03 Q 030019 17 142 2 2 R Glass Container Former Level 2
03 Q 030020 18 154 2 2 R Glass Container Product Line Controller Level 2
03 Q 030030 00 120 1 1 R Indzululwazi Yaba Dala (Science for Adults) Level 1
03 Q 030022 00 122 5 5 R Medical (Sales) Representative Level 5
03 Q 030038 00 360 6 6 R Technician: Analytical Chemistry Level 6
03 Q 030039 00 360 6 6 R Technician: Chemical Engineering Level 6
03 Q 030045 00 360 6 6 R Technician: Electrical Engineering Level 6
03 Q 030043 00 360 6 6 R Technician: Mechanical Engineering Level 6
Page 2Last updated: 30 September 2003
D: Draft P: Pending R: Registered DR: De-Registered W: Withdrawn RR: Re-Registered A:
Application Acknowledged

61
03 CHIETA
RegNo NQF Status Learnership Title
03 Q 030046 00 480 7 7 R Technologist: Electrical Engineering Level 7
36Total: 36of which registered:
04 CTFL
RegNo NQF Status Learnership Title
04 Q 040046 09 120 2 2 R Bottom Stock Level 2
04 Q 040035 17 120 2 2 R Buff Manufacturing Process Level 2
04 Q 040048 16 125 5 5 R Business Management Development Programme Level 5
04 Q 040023 17 120 2 2 R Carpet Manufacture: Spool Gripper Weaving Level 2
04 Q 040040 09 120 2 2 R Clicking Level 2
04 Q 040041 09 120 2 2 R Closing Level 2
04 Q 040033 17 120 2 2 R Colouration Process Level 2
04 Q 040034 17 120 2 2 R Continuous: Dyeing Level 2
04 Q 040051 09 120 2 2 R Curing Level 2
04 Q 040052 09 120 2 2 R Cutting Level 2
04 Q 040039 17 120 2 2 R Discontinuous: Dyeing Level 2
04 Q 040038 17 120 2 2 R Dyeing Preparation Level 2
04 Q 040017 17 120 2 2 R Fabric Inspection Process Level 2
04 Q 040016 17 120 2 2 R Fabric Preparation (Batch) Level 2
04 Q 040047 09 120 2 2 R Finishing (Footwear) Level 2
04 Q 040036 17 120 2 2 R Finishing (General Textiles) Level 2
04 Q 040050 09 120 2 2 R Finishing (Leather) Level 2
04 Q 040010 09 120 2 2 R Footwear Design Level 2
04 Q 040013 09 120 2 2 R Footwear Making Level 2
04 Q 040037 17 120 2 2 R Fully Fashioned Knitting Process Level 2
04 Q 040031 17 120 2 2 R Hose and Half-hose Knitting Level 2
04 Q 040006 09 120 2 2 R Machinist / Garment Constructor Level 2
04 Q 040045 09 120 2 2 R Making - Direct Bottom Level 2
04 Q 040044 09 120 2 2 R Making - Force Lasted Level 2
04 Q 040043 09 120 2 2 R Making - Stitchdown Level 2
04 Q 040042 09 120 2 2 R Making - Welted Level 2
04 Q 040030 19 120 2 2 R Man-Made Manufacture: Wind Up Level 2
04 Q 040025 19 120 2 2 R Man-made Manufacture: Melt Extrusion Level 2
04 Q 040049 17 122 6 6 R Management Development Programme Level 6
04 Q 040005 09 120 2 2 R Mechanic Level 2
04 Q 040004 09 120 4 4 R Mechanic Level 4
04 Q 040008 16 120 2 2 R Non Woven Processes Level 2
04 Q 040026 17 120 2 2 R Non-Woven: Use of Waste Level 2
Page 3Last updated: 30 September 2003
D: Draft P: Pending R: Registered DR: De-Registered W: Withdrawn RR: Re-Registered A:
Application Acknowledged

62
04 CTFL
RegNo NQF Status Learnership Title
04 Q 040007 09 120 2 2 R Pattern Maker Level 2
04 Q 040014 09 120 4 4 R Pattern Maker Level 4
04 Q 040053 09 120 2 2 R Retanning Level 2
04 Q 040027 17 120 2 2 R Rotary: Printing Level 2
04 Q 040018 17 120 2 2 R Spinning Preparation Level 2
04 Q 040019 17 120 2 2 R Spinning Process Level 2
04 Q 040012 09 120 2 2 R Tanning Level 2
04 Q 040015 00 120 4 4 R Textile Mechanician: Hose and Half Hose Level 4
04 Q 040009 10 120 4 4 R Textile Processor Level 4
04 Q 040032 17 120 2 2 R Textile Testing Techniques Level 2
04 Q 040028 17 120 2 2 R Warp Knitting Process Level 2
04 Q 040020 17 120 2 2 R Weaving Preparation Level 2
04 Q 040021 17 120 2 2 R Weaving Process Level 2
04 Q 040022 17 120 2 2 R Weaving: Narrow Fabrics Level 2
04 Q 040029 17 120 2 2 R Weft Knitting Process Level 2
04 Q 040024 17 120 2 2 R Wool Processing: Scouring / Carbonising and Neutralising
Level 2
49Total: 49of which registered:
05 CETA
RegNo NQF Status Learnership Title
05 Q 050021 36 153 4 4 R Assistant Engineering Surveyor Level 4
05 Q 050023 36 145 4 4 R Assistant Hydrographic Surveyor Level 4
05 Q 050020 29 141 4 4 R Assistant Photogrammetrist Level 4
05 Q 050022 49 134 4 4 R Assistant Surveyor (Geomatics) Level 4
05 Q 050050 27 170 2 2 R Community House Builder Level 2
05 Q 050031 21 122 3 3 R Construction Carpenter (Formwork) Level 3
05 Q 050030 21 122 3 3 R Construction Carpenter (Manufacturing Products from Wood)
Level 3
05 Q 050032 22 122 3 3 R Construction Carpenter (Shopfitter) Level 3
05 Q 050011 18 193 2 2 R Construction Contractor Level 2
05 Q 050048 18 120 1 1 R Construction Floor Coverer (Carpentry) Level 1
05 Q 050047 16 120 1 1 R Construction Floor Coverer (Carpeting) Level 1
05 Q 050049 20 120 1 1 R Construction Floor Coverer (Vinyl) Level 1
05 Q 050018 18 122 3 3 R Construction Mason (Face Brick Laying) Level 3
05 Q 050016 20 124 3 3 R Construction Mason (Paving) Level 3
05 Q 050017 20 142 3 3 R Construction Mason (Plastering) Level 3
05 Q 050019 19 122 3 3 R Construction Mason (Tiling) Level 3
Page 4Last updated: 30 September 2003
D: Draft P: Pending R: Registered DR: De-Registered W: Withdrawn RR: Re-Registered A:
Application Acknowledged

63
05 CETA
RegNo NQF Status Learnership Title
05 Q 050059 24 167 4 4 R Construction Material Tester (Soils and Aggregates) Level 4
05 Q 050014 14 140 3 3 R Construction Painter Level 3
05 Q 050013 13 147 3 3 R Construction Plasterer Level 3
05 Q 050015 20 159 3 3 R Construction Plumber Level 3
05 Q 050034 41 120 1 1 R Construction Roadworker (Construction) Level 1
05 Q 050037 42 120 2 2 R Construction Roadworker (Construction) Level 2
05 Q 050040 43 160 3 3 R Construction Roadworker (Construction) Level 3
05 Q 050036 40 120 1 1 R Construction Roadworker (Road Reserve Maintenance) Level 1
05 Q 050039 43 120 2 2 R Construction Roadworker (Road Reserve Maintenance) Level 2
05 Q 050042 37 160 3 3 R Construction Roadworker (Road Reserve Maintenance) Level 3
05 Q 050035 37 120 1 1 R Construction Roadworker (Road Surface Maintenance) Level 1
05 Q 050038 41 120 2 2 R Construction Roadworker (Road Surface Maintenance) Level 2
05 Q 050041 35 160 3 3 R Construction Roadworker (Road Surface Maintenance) Level 3
05 Q 050058 30 198 4 4 R Construction Supervisor (Building) Level 4
05 Q 050053 35 233 4 4 R Construction Supervisor (Labour Intensive Construction -
Roads and Stormwater) Level 4
05 Q 050051 33 233 4 4 R Construction Supervisor (Labour Intensive Construction -
Structures) Level 4
05 Q 050052 33 233 4 4 R Construction Supervisor (Labour Intensive Construction -
Water and Sanitation) Level 4
05 Q 050055 38 261 4 4 R Construction Supervisor (Roadworks Bitumenious) Level 4
05 Q 050056 38 261 4 4 R Construction Supervisor (Roadworks Cementitious) Level 4
05 Q 050057 41 261 4 4 R Construction Supervisor (Roadworks Maintenance) Level 4
05 Q 050054 40 276 4 4 R Construction Supervisor (Water and Waste Water) Level 4
05 Q 050012 13 149 3 3 R Construction Tiler Level 3
05 Q 050043 31 204 5 5 R Manager (Building Construction) Level 5
05 Q 050046 36 267 5 5 R Manager (Civil Construction - Railworks) Level 5
05 Q 050044 34 267 5 5 R Manager (Civil Construction - Roadworks) Level 5
05 Q 050045 35 267 5 5 R Manager (Civil Construction - Structural) Level 5
05 Q 050029 26 128 2 2 R Refractories Installer (Site Assistance) Level 2
05 Q 050028 24 130 2 2 R Refractories Installer (Transport) Level 2
05 Q 050026 20 134 3 3 R Refractories Mason (Functional) Level 3
05 Q 050027 21 132 3 3 R Refractories Mason (Supervisory) Level 3
05 Q 050025 20 249 5 5 R Survey Technician (Engineering) Level 5
05 Q 050024 30 253 5 5 R Survey Technician (Hydrographic) Level 5
05 Q 050033 00 360 6 6 R Technician (Civil Engineering) Level 6
49Total: 49of which registered:
Page 5Last updated: 30 September 2003
D: Draft P: Pending R: Registered DR: De-Registered W: Withdrawn RR: Re-Registered A:
Application Acknowledged

64
06 DIDTETA
RegNo NQF Status Learnership Title
06 Q 060020 00 360 5 5 R National Certificate: Aircraft Electrician Level 5
06 Q 060019 00 360 5 5 R National Certificate: Aircraft Instruments Worker Level 5
06 Q 060016 00 360 5 5 R National Certificate: Aircraft Mechanic Level 5
06 Q 060018 00 360 5 5 R National Certificate: Aircraft Radiotrician Level 5
06 Q 060017 00 360 5 5 R National Certificate: Aircraft Structures Worker Level 5
06 Q 060005 XX 160 5 5 R National Diploma in Intellectual Property Level 5
6Total: 6of which registered:
07 ETDP SETA
RegNo NQF Status Learnership Title
07 Q 070016 28 120 4 4 R L4 - Learnership for ECD Practitioners Level 4
07 Q 070017 21 240 5 5 R L5 - Learnership for ECD Trainers Level 5
07 Q 070013 00 480 6 6 R Level 6 ETDP Learnership for Educators in Schooling: B. Sec.
Ed
07 Q 070014 00 480 6 6 R Level Six ETDP Learnership for Educators in Schooling: B.
Prim. Ed
07 Q 070015 00 120 6 6 R Level Six ETDP Learnership for Educators in Schooling: HED
07 Q 070004 12 120 4 4 R National Certificate in ABET Practice (ETD: Adult Learning,
ABET Specialisation) Level 4
07 Q 070002 15 240 5 5 R National Diploma in ABET Practice (ETD:Adult Learning ABET
Specialisation) Level 5
07 Q 070003 15 133 5 5 R Occupationally directed ETD Practitioner Certificate Level 5
07 Q 070012 00 240 5 5 R Upgrading of Under-qualified Educuators Level 5
9Total: 9of which registered:
08 ESETA
RegNo NQF Status Learnership Title
08 Q 080004 48 129 1 1 R General Education and Training Certificate in Basic Technical
Practice (Energy) Level 1
08 Q 080003 33 122 2 2 R National Certificate in Electrical Engineering Level 2
08 Q 080002 33 173 3 3 R National Certificate in Electrical Engineering Level 3
08 Q 080001 27 122 4 4 R National Certificate in Electrical Engineering Level 4
08 Q 080017 36 157 3 3 R National Certificate in Fossil Power Plant Auxiliary Systems
Operation Level 3
08 Q 080016 35 183 4 4 R National Certificate in Fossil Power Plant Operation Level 4
Page 6Last updated: 30 September 2003
D: Draft P: Pending R: Registered DR: De-Registered W: Withdrawn RR: Re-Registered A:
Application Acknowledged
65
08 ESETA
RegNo NQF Status Learnership Title
08 Q 080018 29 122 3 3 R National Certificate in Hydro Power Plant Auxiliary Systems
Operation Level 3
08 Q 080014 36 150 4 4 R National Certificate in Hydro Power Plant Operation Level 4
08 Q 080015 48 239 4 4 R National Certificate in Nuclear Power PLant Operation Level 4
08 Q 080019 37 133 3 3 R National Certificate in Nuclear Power Plant Auxiliary Systems
Operation Level 3
08 Q 080011 45 248 5 5 R National Diploma in Fossil Power Plant Process Control Level
5
08 Q 080013 37 240 5 5 R National Diploma in Hydro Power Plant Process Control Level 5
08 Q 080012 40 278 5 5 R National Diploma in Nuclear Power Plant Process Control Level
5
13Total: 13of which registered:
09 FOODBEV
RegNo NQF Status Learnership Title
09 Q 090034 15 130 3 3 R Brewing Processing Level 3
09 Q 090043 17 130 4 4 R Butter and Butter Related Spread Technology Level 4
09 Q 090025 25 120 3 3 R Cereals, Snacks, Pasta, Condiments and Culinary Processing
Level 3
09 Q 090027 31 135 3 3 R Confectionery Processing Level 3
09 Q 090049 20 130 4 4 R Cottage Cheese Technology Level 4
09 Q 090052 18 130 3 3 R Craft Bread Baking Level 3
09 Q 090050 19 120 2 2 R Craft Bread and Flour Confectionery Baking Level 2
09 Q 090031 41 130 3 3 R Dairy Laboratory Analysis Level 3
09 Q 090032 26 130 3 3 R Dairy Primary Processing Level 3
09 Q 090030 32 120 2 2 R Dairy Raw Material Receiving and Storing Level 2
09 Q 090048 20 150 4 4 R Dried Dairy Products Technology Level 4
09 Q 090047 17 120 4 4 R Fermented Dairy Products Technology Level 4
09 Q 090022 33 130 3 3 R Fish and Seafood Processing Level 3
09 Q 090053 18 135 3 3 R Flour Confectionery Baking Level 3
09 Q 090008 18 143 5 5 R Food and Beverage Manufacturing First Line Management Level 5
09 Q 090006 36 257 6 6 R Food and Beverage Manufacturing Management Level 6
09 Q 090036 23 120 3 3 R Food and Beverages Packaging Level 3
09 Q 090046 21 130 4 4 R Frozen Ice Cream and Frozen Ice Cream Related Products
Technology Level 4
09 Q 090040 36 140 3 3 R Fruit and Vegetable Processing Level 3
09 Q 090045 21 130 4 4 R Liquid Long Life Dairy Products Technology Level 4
09 Q 090035 12 127 3 3 R Malting Processing Level 3
Page 7Last updated: 30 September 2003
D: Draft P: Pending R: Registered DR: De-Registered W: Withdrawn RR: Re-Registered A:
Application Acknowledged

66
09 FOODBEV
RegNo NQF Status Learnership Title
09 Q 090024 35 140 3 3 R Meat Processing Level 3
09 Q 090028 22 140 3 3 R Oil Milling Processing Level 3
09 Q 090023 21 140 3 3 R Oil Refining Level 3
09 Q 090026 22 120 3 3 R Oil and Fat Based Products Processing Level 3
09 Q 090051 26 120 2 2 R Plant Baking Processing Level 2
09 Q 090054 20 120 3 3 R Plant Baking Processing Level 3
09 Q 090044 17 130 4 4 R Processed Cheese Technology Level 4
09 Q 090042 22 130 4 4 R Ripened Cheese Technology Level 4
09 Q 090037 14 122 3 3 R Soft Drinks Processing Level 3
09 Q 090038 19 137 3 3 R Spirits Processing Level 3
09 Q 090029 16 140 4 4 R Spray Dried Food Products Technology Level 4
09 Q 090041 19 130 4 4 R Sweetened Condensed Milk Products Technology Level 4
09 Q 090039 19 157 3 3 R Wine Processing Level 3
34Total: 34of which registered:
10 FIETA
RegNo NQF Status Learnership Title
10 Q 100029 00 136 3 3 R National Certifcate in Furniture Production: Wood Finishing
Level 3
10 Q 100019 00 123 1 1 R National Certificate in Furniture Production Level 1
10 Q 100023 00 136 3 3 R National Certificate in Furniture Production: Cabinet Making
Level 3
10 Q 100024 00 139 4 4 R National Certificate in Furniture Production: Cabinet Making
Level 4
10 Q 100025 00 133 2 2 R National Certificate in Furniture Production: Upholstery
Level 2
10 Q 100026 00 136 3 3 R National Certificate in Furniture Production: Upholstery
Level 3
10 Q 100027 00 148 4 4 R National Certificate in Furniture Production: Upholstery
Level 4
10 Q 100028 00 133 2 2 R National Certificate in Furniture Production: Wood Finishing
Level 2
10 Q 100030 00 162 4 4 R National Certificate in Furniture Production: Wood Finishing
Level 4
10 Q 100020 00 136 3 3 R National Certificate in Furniture Production: Wood Machining
Level 3
10 Q 100021 00 154 4 4 R National Certificate in Furniture Production: Wood Machining
Level 4
Page 8Last updated: 30 September 2003
D: Draft P: Pending R: Registered DR: De-Registered W: Withdrawn RR: Re-Registered A:
Application Acknowledged

67
10 FIETA
RegNo NQF Status Learnership Title
10 Q 100022 00 137 2 2 R National Certificate in Furniture Production: Wood Machining
and Cabinet Making Level 2
10 Q 100035 32 146 1 1 R National Certificate in Wood Technology: Lumber Milling (Dry
Lumber Processing) Level 1
10 Q 100036 33 130 2 2 R National Certificate in Wood Technology: Lumber Milling (Dry
Lumber Processing) Level 2
10 Q 100037 39 144 3 3 R National Certificate in Wood Technology: Lumber Milling (Dry
Lumber Processing) Level 3
10 Q 100038 24 121 4 4 R National Certificate in Wood Technology: Lumber Milling (Dry
Lumber Processing) Level 4
10 Q 100015 16 146 1 1 R National Certificate in Wood Technology: Lumber Milling
(Green Timber Processing) Level 1
10 Q 100016 18 120 2 2 R National Certificate in Wood Technology: Lumber Milling
(Green Timber Processing) Level 2
10 Q 100017 25 135 3 3 R National Certificate in Wood Technology: Lumber Milling
(Green Timber Processing) Level 3
10 Q 100018 16 121 4 4 R National Certificate in Wood Technology: Lumber Milling
(Green Timber Processing) Level 4
10 Q 100031 34 146 1 1 R National Certificate in Wood Technology: Lumber Milling
(Lumber Drying) Level 1
10 Q 100032 33 122 2 2 R National Certificate in Wood Technology: Lumber Milling
(Lumber Drying) Level 2
10 Q 100033 27 124 3 3 R National Certificate in Wood Technology: Lumber Milling
(Lumber Drying) Level 3
10 Q 100034 23 121 4 4 R National Certificate in Wood Technology: Lumber Milling
(Lumber Drying) Level 4
10 Q 100013 17 141 1 1 R National Certificate in Wood Technology: Lumber Milling (Saw
Doctoring) Level 1
10 Q 100011 26 125 2 2 R National Certificate in Wood Technology: Lumber Milling (Saw
Doctoring) Level 2
10 Q 100014 29 136 3 3 R National Certificate in Wood Technology: Lumber Milling (Saw
Doctoring) Level 3
10 Q 100012 21 131 4 4 R National Certificate in Wood Technology: Lumber Milling (Saw
Doctoring) Level 4
28Total: 28of which registered:
Page 9Last updated: 30 September 2003
D: Draft P: Pending R: Registered DR: De-Registered W: Withdrawn RR: Re-Registered A:
Application Acknowledged

68
11 HWSETA
RegNo NQF Status Learnership Title
11 Q 110002 13 120 3 3 R Certificate Pharmacists Assistant Basic Level 3
11 Q 110008 20 132 4 4 R Certificate in General Nursing (Auxiliary) Level 4
11 Q 110003 00 132 4 4 R Certificate in General Nursing (Enrolled) Level 4
11 Q 110013 00 360 6 6 R Diagnostic Radiography Level 6
11 Q 110004 00 256 5 5 R Diploma in General Nursing (Bridging) Level 5
11 Q 110009 23 360 6 6 R Diploma in Primary Health Care (Post Basic) Level 6
11 Q 110012 00 180 4 4 R FET Certificate in Social Auxiliary Work Level 4
11 Q 110011 31 125 1 1 R GET Certificate in Ancillary Health Care Level 1
11 Q 110010 17 360 6 6 R Post Basic Diploma in Medical/Surgical Nursing (Elective:
Critical Care/Operating Theater Nursing) Level 6
11 Q 110001 08 120 4 4 R Post Basic Pharmacist Assistant Learnership Level 4
10Total: 10of which registered:
12 ISETT
RegNo NQF Status Learnership Title
12 Q 120004 07 120 5 5 R Advanced Diploma Electronic and Computing System Level 5
12 Q 120008 08 120 5 5 R Advanced Diploma Programming Level 5
12 Q 120005 09 120 4 4 R Certificate Computer Programming Level 4
12 Q 120002 07 120 4 4 R Certificate Electronic and Computing System Level 4
12 Q 120001 10 120 4 4 R Certificate IT Technician Level 4
12 Q 120006 08 120 4 4 R Certificate Programming Level 4
12 Q 120003 07 120 5 5 R Diploma Electronic and Computing System Level 5
12 Q 120007 08 120 5 5 R Diploma Programming Level 5
12 Q 120017 37 181 4 4 R National Certificate in Information Technology: Systems
Development Level 4
12 Q 120016 45 175 4 4 R National Certificate in Information Technology: Technical
Support Level 4
12 Q 120015 00 120 5 5 R Solutions Development/Programming Level 5
12 Q 120014 00 120 5 5 R Systems Support (Desktop) Level 5
12 Q 120011 00 120 5 5 R Systems Support Engineer Level 5
12 Q 120012 00 136 4 4 R Telecommunications Practitioner Level 4
12 Q 120013 00 279 5 5 R Telecommunications Technician Level 5
15Total: 15of which registered:
Page 10Last updated: 30 September 2003
D: Draft P: Pending R: Registered DR: De-Registered W: Withdrawn RR: Re-Registered A:
Application Acknowledged

69
13 INSETA
RegNo NQF Status Learnership Title
13 Q 130013 00 240 5 5 R Group Retirement Benefit: Fund Administrator Level 5
13 Q 130003 43 160 4 4 R Healthcare Benefits Administration Claims Assessor Level 4
13 Q 130002 44 160 3 3 R Insurance Administrator Level 3
13 Q 130001 34 160 2 2 R Junior Administrator Level 2
13 Q 130005 50 120 4 4 R Long Term Claims Assessor Level 4
13 Q 130012 68 120 4 4 R Long Term Insurance / Investment Call Centre Operator Level
4
13 Q 130009 68 120 4 4 R Long Term Insurance / Investment Administrator Level 4
13 Q 130008 68 120 4 4 R Long Term Insurance / Investment Product Developer Level 4
13 Q 130011 45 120 4 4 R Long Term Underwriter Level 4
13 Q 130014 65 120 4 4 R Retirement Fund Administrator Level 4
13 Q 130015 42 120 4 4 R Short Term Insurance: Commercial / Industrial Underwriter
Level 4
13 Q 130017 42 120 4 4 R Short Term Insurance: Personal / Domestic Call Centre
Operator Level 4
13 Q 130016 43 120 4 4 R Short Term Insurance: Personal / Domestic Claims Negotiator
Level 4
13 Q 130018 43 120 4 4 R Short Term Insurance: Personal / Domestic Underwriter Level 4
13 Q 130004 40 160 4 4 R Unit Trust Investment Level4
15Total: 15of which registered:
14 LGWSETA
RegNo NQF Status Learnership Title
14 Q 140013 00 360 7 7 R Advanced Level: Local Government Finance and Accounting Level
7
14 Q 140011 00 180 5 5 R Basic Level: Local Government Finance and Accounting Level 5
14 Q 140012 00 240 6 6 R Intermediate Level: Local Government Finance and Accounting
Level 6
3Total: 3of which registered:
Page 11Last updated: 30 September 2003
D: Draft P: Pending R: Registered DR: De-Registered W: Withdrawn RR: Re-Registered A:
Application Acknowledged

70
15 MAPPP
RegNo NQF Status Learnership Title
15 Q 150022 00 237 4 4 R National Craft Certificate: Bookbinding Craft/Cutting Level 4
15 Q 150011 00 238 4 4 R National Craft Certificate: Corrugated Board Manufacturing
Machine Minding Level 4
15 Q 150026 00 230 4 4 R National Craft Certificate: Corrugated Board Printing and
Finishing Machine Minding Level 4
15 Q 150023 00 239 4 4 R National Craft Certificate: End Making Level 4
15 Q 150004 00 229 4 4 R National Craft Certificate: Letterpress Machine Minding Level
4
15 Q 150013 00 239 4 4 R National Craft Certificate: Paper Sack Making Level 4
15 Q 150027 00 225 4 4 R National Craft Certificate: Printing and Packaging Quality
Assurance Level 4
15 Q 150009 00 234 4 4 R National Craft Certificate: Rotary Printing and Re-Reeliing -
Flexography Level 4
15 Q 150007 00 214 4 4 R National Craft Certificate: Screen Printing Level 4
15 Q 150025 00 237 4 4 R National Craft Certificate: Stationery and Envelope Machine
Adjuster Level 4
15 Q 150010 00 237 4 4 R National Craft Certificate:Rotary Printing and Re-Reeling -
Gravure Level 4
15 Q 150032 00 264 5 5 R National Craft Diploma in: Lithography (Metal Decorating)
Level 5
15 Q 150024 00 246 5 5 R National Craft Diploma: Bag Making Level 5
15 Q 150014 00 249 5 5 R National Craft Diploma: Bookbinding Mechanised/Cutting Level
5
15 Q 150029 00 260 5 5 R National Craft Diploma: Can Making Level 5
15 Q 150008 00 287 5 5 R National Craft Diploma: Carton Making Level 5
15 Q 150028 00 253 5 5 R National Craft Diploma: Commercial Printing and Packaging
Level 5
15 Q 150002 00 254 5 5 R National Craft Diploma: Continuous Stationery Machine Minding
Level 5
15 Q 150017 00 259 5 5 R National Craft Diploma: Electronic Composition Level 5
15 Q 150018 00 274 5 5 R National Craft Diploma: Electronic Origination Level 5
15 Q 150003 00 247 5 5 R National Craft Diploma: Gravure Machine Minding Level 5
15 Q 150012 00 247 5 5 R National Craft Diploma: Laminating Level 5
15 Q 150001 00 264 5 5 R National Craft Diploma: Lithography (Paper Section) Level 5
15 Q 150021 00 284 5 5 R National Craft Diploma: Photo-Gravure Cylinder Processing
Level 5
15 Q 150019 00 249 5 5 R National Craft Diploma: Photo-Lithography Level 5
15 Q 150020 00 254 5 5 R National Craft Diploma: Process Engraving Level 5
15 Q 150005 00 249 5 5 R National Craft Diploma: Roll Label Machine MInding Level 5
15 Q 150006 00 274 5 5 R National Craft Diploma: Rotary Offset Machine minding Level 5
Page 12Last updated: 30 September 2003
D: Draft P: Pending R: Registered DR: De-Registered W: Withdrawn RR: Re-Registered A:
Application Acknowledged

71
15 MAPPP
RegNo NQF Status Learnership Title
15 Q 150015 00 264 5 5 R National Craft Diploma: Ruling/Cutting Level 5
15 Q 150030 00 395 5 5 R National Diploma in Integrated Marketing Communication Level
5
15 Q 150031 00 360 5 5 R National Diploma in Visual Communication Level 5
15 Q 150016 00 309 5 5 R National Diploma: Copywriting Level 5
32Total: 32of which registered:
16 MQA
RegNo NQF Status Learnership Title
16 Q 160046 55 146 2 2 R Diamond Processing - Operator Bottom Makeable Level 2
16 Q 160045 55 146 2 2 R Diamond Processing - Operator Bottom Sawn Level 2
16 Q 160047 60 163 2 2 R Diamond Processing - Operator Top Makeable Level 2
16 Q 160044 55 138 2 2 R Diamond Processing - Operator Top Sawn Level 2
16 Q 160052 00 146 3 3 R Diesel Mechanic (Open Cast) Level 3
16 Q 160012 00 162 3 3 R Diesel Mechanic - Coal Level 3
16 Q 160013 00 149 3 3 R Diesel Mechanic - Metalliferous Level 3
16 Q 160014 00 137 3 3 R Diesel Mechanic - Surface Diamonds Level 3
16 Q 160011 00 130 3 3 R Diesel Mechanic - Underground Diamonds Level 3
16 Q 160041 00 340 4 4 R Electrical (Metalliferous) Level 4
16 Q 160040 00 329 4 4 R Electrical (Open Cast) Level 4
16 Q 160039 00 344 4 4 R Electrical (Surface Coal) Level 4
16 Q 160042 00 301 4 4 R Electrical (Surface Diamonds) Level 4
16 Q 160038 00 349 4 4 R Electrical (Underground Coal) Level 4
16 Q 160037 00 313 4 4 R Electrical (Underground Diamonds) Level 4
16 Q 160048 50 162 2 2 R Engineering Maintenance for Underground Hard Rock
(Metalliferous) - Horizontal Transport Level 2
16 Q 160050 61 192 2 2 R Engineering Maintenance for Underground Hard Rock
(Metalliferous) - Horizontal Transport Services Level 2
16 Q 160049 59 173 2 2 R Engineering Maintenance for Underground Hard Rock
(Metalliferous) - Stoping and Developing Level 2
16 Q 160053 00 146 3 3 R Fitting (Including Machining) (Open Cast) Level 3
16 Q 160026 00 244 3 3 R Fitting (Including Machining): Hardrock Metalliferous Level 3
16 Q 160025 00 128 3 3 R Fitting (Including Machining): Surface Coal Level 3
16 Q 160027 00 120 3 3 R Fitting (Including Machining): Surface Diamonds Level 3
16 Q 160024 00 153 3 3 R Fitting (Including Machining): Underground Coal Level 3
16 Q 160023 00 127 3 3 R Fitting (Including Machining): Underground Diamonds Level 3
16 Q 160035 00 276 3 3 R Fitting and Turning (Metalliferous) Level 3
16 Q 160034 00 146 3 3 R Fitting and Turning (Open Cast Coal) Level 3
Page 13Last updated: 30 September 2003
D: Draft P: Pending R: Registered DR: De-Registered W: Withdrawn RR: Re-Registered A:
Application Acknowledged

72
16 MQA
RegNo NQF Status Learnership Title
16 Q 160054 00 146 3 3 R Fitting and Turning (Open Cast) Level 3
16 Q 160036 00 140 3 3 R Fitting and Turning (Surface Diamonds) Level 3
16 Q 160033 00 185 3 3 R Fitting and Turning (Underground Coal) Level 3
16 Q 160032 00 159 3 3 R Fitting and Turning (Underground Diamonds) Level 3
16 Q 160008 00 176 4 4 R Instrumentation Mechanician Level 4
16 Q 160043 27 159 3 3 R Jewellery Manufacture in a Production Environment Level 3
16 Q 160029 00 409 4 4 R Millwright (Coal) Level 4
16 Q 160028 00 339 4 4 R Millwright (Diamond) Level 4
16 Q 160030 00 444 4 4 R Millwright (Metalliferous) Level 4
16 Q 160031 00 381 4 4 R Millwright (Open Cast) Level 4
16 Q 160051 00 146 3 3 R Plater / Welder (Open Cast) Level 3
16 Q 160020 00 134 3 3 R Plater Boilermaker (Coal) Level 3
16 Q 160022 00 149 3 3 R Plater Boilermaker (Diamond Opencast) Level 3
16 Q 160021 00 173 3 3 R Plater Boilermaker (Metalliferous) Level 3
16 Q 160019 00 132 3 3 R Plater Boilermaker (Opencast) Level 3
16 Q 160016 00 133 3 3 R Plater Welder (Coal) Level 3
16 Q 160017 00 177 3 3 R Plater Welder (Metalliferous) Level 3
16 Q 160018 00 152 3 3 R Plater Welder (Open Cast Diamonds) Level 3
16 Q 160015 00 168 3 3 R Plater Welder (Underground Diamonds) Level 3
16 Q 160009 00 127 3 3 R Rigging Ropesman (Generalist) Level 3
16 Q 160010 00 127 3 3 R Rigging Ropesman (Open - Cast) Level 3
47Total: 47of which registered:
17 MERSETA
RegNo NQF Status Learnership Title
17 Q 170009 39 182 3 3 R National Certificate in Air-conditioning, Refrigeration and
Ventilation Level 3
17 Q 170010 22 147 4 4 R National Certificate in Air-conditioning, Refrigeration and
Ventilation Level 4
17 Q 170008 19 144 2 2 R National Certificate in Air-conditioning, Refrigiration and
Ventilation Level 2
17 Q 170024 00 128 2 2 R National Certificate in Autotronics Level 2
17 Q 170030 00 141 3 3 R National Certificate in Autotronics Level 3
17 Q 170031 13 135 4 4 R National Certificate in Autotronics Level 4
17 Q 170032 14 125 5 5 R National Certificate in Autotronics Level 5
17 Q 170057 00 159 2 2 R National Certificate in Engineering Fabrication (Boilermaker)
Level 2
17 Q 170058 00 151 3 3 R National Certificate in Engineering Fabrication (Heavy)
Page 14Last updated: 30 September 2003
D: Draft P: Pending R: Registered DR: De-Registered W: Withdrawn RR: Re-Registered A:
Application Acknowledged

73
17 MERSETA
RegNo NQF Status Learnership Title
(Boilermaker) Level 3
17 Q 170059 00 153 4 4 R National Certificate in Engineering Fabrication (Heavy)
(Boilermaker) Level 4
17 Q 170038 00 153 4 4 R National Certificate in Engineering Fabrication (Light or
Heavy) (Vehicle Body Builder) Level 4
17 Q 170034 00 151 3 3 R National Certificate in Engineering Fabrication (Light)
(Sheetmetal Worker) Level 3
17 Q 170035 00 153 4 4 R National Certificate in Engineering Fabrication (Light)
(Sheetmetal Worker) Level 4
17 Q 170033 00 159 2 2 R National Certificate in Engineering Fabrication (Sheetmetal
Worker) Level 2
17 Q 170036 00 159 2 2 R National Certificate in Engineering Fabrication (Vehicle Body
Builder) Level 2
17 Q 170037 00 151 3 3 R National Certificate in Engineering Fabricatrion (Light or
Heavy) (Vehicle Body Builder) Level 3
17 Q 170069 40 124 1 1 R National Certificate in Manufacturing and Engineering Level 1
17 Q 170039 34 185 2 2 R National Certificate in Mechanical Engineering (Fitting &
Machining) (Fitter and Turner) Level 2
17 Q 170040 17 174 3 3 R National Certificate in Mechanical Engineering (Fitting &
Machining) (Fitter and Turner) Level 3
17 Q 170041 31 179 4 4 R National Certificate in Mechanical Engineering (Fitting &
Machining) (Fitter and Turner) Level 4
17 Q 170042 35 138 2 2 R National Certificate in Mechanical Engineering (Fitting)
(Fitter) Level 2
17 Q 170043 29 133 3 3 R National Certificate in Mechanical Engineering (Fitting)
(Fitter) Level 3
17 Q 170048 31 151 2 2 R National Certificate in Mechanical Engineering (Machining) (
Turner) Level 2
17 Q 170045 31 151 2 2 R National Certificate in Mechanical Engineering (Machining)
(Plastic Mould Maker) Level 2
17 Q 170051 31 151 2 2 R National Certificate in Mechanical Engineering (Machining)
(Roll Turner) Level 2
17 Q 170052 21 126 3 3 R National Certificate in Mechanical Engineering (Machining)
(Roll Turner) Level 3
17 Q 170053 21 129 4 4 R National Certificate in Mechanical Engineering (Machining)
(Roll Turner) Level 4
17 Q 170054 31 151 2 2 R National Certificate in Mechanical Engineering (Machining)
(Tool, Jig an Die Maker) Level 2
17 Q 170049 21 126 3 3 R National Certificate in Mechanical Engineering (Machining)
(Turner) Level 3
Page 15Last updated: 30 September 2003
D: Draft P: Pending R: Registered DR: De-Registered W: Withdrawn RR: Re-Registered A:
Application Acknowledged

74
17 MERSETA
RegNo NQF Status Learnership Title
17 Q 170050 21 129 4 4 R National Certificate in Mechanical Engineering (Machining)
(Turner) Level 4
17 Q 170046 24 169 3 3 R National Certificate in Mechanical Engineering (Tooling
Manufacture) (Plastic Mould Maker) Level 3
17 Q 170047 24 183 4 4 R National Certificate in Mechanical Engineering (Tooling
Manufacture) (Plastic Mould Maker) Level 4
17 Q 170055 24 169 3 3 R National Certificate in Mechanical Engineering (Tooling
Manufacture) (Tool, Jig and Die Maker) Level 3
17 Q 170056 24 183 4 4 R National Certificate in Mechanical Engineering (Tooling
Manufacture) (Tool, Jig and Die Maker) Level 4
17 Q 170044 21 135 4 4 R National Certificate in Mechanical Engineering: (Fitting)
(Fitter) Level 4
17 Q 170027 23 140 2 2 R National Certificate in Mechatronics Level 2
17 Q 170028 21 145 3 3 R National Certificate in Mechatronics Level 3
17 Q 170029 16 146 4 4 R National Certificate in Mechatronics Level 4
17 Q 170025 13 125 5 5 R National Certificate in Mechatronics Level 5
17 Q 170001 19 121 2 2 R National Certificate in Plastics Manufacturing Level 2
17 Q 170002 30 122 3 3 R National Certificate in Plastics Manufacturing Level 3
17 Q 170003 22 135 4 4 R National Certificate in Plastics Manufacturing Level 4
17 Q 170004 20 138 5 5 R National Certificate in Plastics Manufacturing Level 5
17 Q 170074 32 132 2 2 R National Certificate in Polymer Composite Fabrication Level 2
17 Q 170075 30 130 3 3 R National Certificate in Polymer Composite Fabrication Level 3
17 Q 170076 20 154 4 4 R National Certificate in Polymer Composite Fabrication Level 4
17 Q 170005 19 128 2 2 R National Certificate in Power and Telecommunication Cable
Manufacturing Level 2
17 Q 170006 22 144 3 3 R National Certificate in Power and Telecommunication Cable
Manufacturing Level 3
17 Q 170007 15 142 4 4 R National Certificate in Power and Telecommunication Cable
Manufacturing Level 4
17 Q 170073 14 239 5 5 R National Certificate in Rubber Technologist Manufacturing
Level 5
17 Q 170070 35 121 2 2 R National Certificate in Thermoplastic Fabrication Level 2
17 Q 170071 33 126 3 3 R National Certificate in Thermoplastic Fabrication Level 3
17 Q 170072 17 137 4 4 R National Certificate in Thermoplastic Fabrication Level 4
17 Q 170068 27 140 3 3 R National Certificate in Vehicle Maintenance (Commercial
Vehicles) Level 3
17 Q 170065 27 139 3 3 R National Certificate in Vehicle Maintenance (Earthmoving
Equipment) Level 3
17 Q 170067 27 140 3 3 R National Certificate in Vehicle Maintenance (Passenger and
Light Delivery Vehicles) Level 3
Page 16Last updated: 30 September 2003
D: Draft P: Pending R: Registered DR: De-Registered W: Withdrawn RR: Re-Registered A:
Application Acknowledged

75
17 MERSETA
RegNo NQF Status Learnership Title
17 Q 170078 29 140 2 2 R National Certificate in Vehicle Service (Commercial Vehicles)
Level 2
17 Q 170064 27 139 2 2 R National Certificate in Vehicle Service (Earthmoving
Equipment) Level 2
17 Q 170077 29 140 2 2 R National Certificate in Vehicle Service (Passenger, Light
Delivery) Level 2
17 Q 170015 22 136 2 2 R National Certificate: Automotive Component Manufacturing and
Assembly Level 2
17 Q 170016 23 142 3 3 R National Certificate: Automotive Component Manufacturing and
Assembly Level 3
17 Q 170017 14 133 4 4 R National Certificate: Automotive Component Manufacturing and
Assembly Level 4
17 Q 170018 19 134 5 5 R National Certificate: Automotive Component Manufacturing and
Assembly Level 5
17 Q 170012 18 122 2 2 R National Certificate: Iron and Steel Manufacturing Level 2
17 Q 170013 23 122 3 3 R National Certificate: Iron and Steel Manufacturing Level 3
17 Q 170014 15 135 4 4 R National Certificate: Iron and Steel Manufacturing Level 4
17 Q 170019 24 122 2 2 R National Certificate: Metal and Engineering Manufacturing
Level 2
17 Q 170020 27 122 3 3 R National Certificate: Metal and Engineering Manufacturing
Level 3
17 Q 170021 16 135 4 4 R National Certificate: Metal and Engineering Manufacturing
Level 4
17 Q 170062 42 145 4 4 R National Certificate: Motor Sales and Support Services (Parts
and Accessories Sales) Level 4
17 Q 170061 42 145 4 4 R National Certificate: Motor Sales and Support Services
(Service and Repair Sales) Level 4
17 Q 170063 42 145 4 4 R National Certificate: Motor Sales and Support Services (Tyre
Sales) Level 4
17 Q 170060 42 145 4 4 R National Certificate: Motor Sales and Support Services
(Vehicle Sales) Level 4
17 Q 170011 32 240 5 5 R National Diploma in Air-conditioning, Refrigeration and
Ventilation Level 5
74Total: 74of which registered:
Page 17Last updated: 30 September 2003
D: Draft P: Pending R: Registered DR: De-Registered W: Withdrawn RR: Re-Registered A:
Application Acknowledged

76
19 POSLECSETA
RegNo NQF Status Learnership Title
19 Q 190011 29 240 5 5 R Advanced Electronic Security Technician Level 5
19 Q 190008 29 146 5 5 R Basic Policing Training Level 5
19 Q 190009 00 240 7 7 R Candidate Attorney Learnership Level 7 (L)
19 Q 190010 XX 120 4 4 R Electronic Security Technician Level 4
19 Q 190005 29 274 3 3 R General Security Officer's Learnership Level 3 (L)
19 Q 190012 00 120 7 7 R Postgraduate Certificate: Trade Mark Practice Level 7
19 Q 190001 00 240 7 7 R Postgraduate Diploma: Trade Mark Practice Level 7
7Total: 7of which registered:
20 PAETA
RegNo NQF Status Learnership Title
20 Q 200009 00 120 1 1 R Farm Owner: Agronomy Level 1
20 Q 200008 00 120 1 1 R Farm Owner: Animal Husbandry Level 1
20 Q 200007 XX 120 1 1 R Farm Owner: Horticulture Level 1
20 Q 200011 25 120 2 2 R Farm Worker / Owner Level 2
20 Q 200001 00 120 1 1 R Farm Worker: Agronomy Level 1
20 Q 200003 00 120 1 1 R Farm Worker: Animal Husbandry Level 1
20 Q 200002 00 120 1 1 R Farm Worker: Horticulture Level 1
20 Q 200005 XX 120 4 4 R Junior Farm Manager Level 4
8Total: 8of which registered:
21 PSETA
RegNo NQF Status Learnership Title
21 Q 210003 36 188 4 4 R Accounting and Financial Management Level 4
21 Q 210004 31 136 4 4 R Customer Management Level 4
21 Q 210002 28 146 4 4 R Human Resource Management Level 4
21 Q 210005 46 170 4 4 R National Certificate in Local Employment and Skills
Development Practices Level 4
21 Q 210006 37 130 2 2 R Office Administration Assistant Level 2
21 Q 210001 32 166 4 4 R Project Management Level 4
6Total: 6of which registered:
Page 18Last updated: 30 September 2003
D: Draft P: Pending R: Registered DR: De-Registered W: Withdrawn RR: Re-Registered A:
Application Acknowledged

77
22 SETASA
RegNo NQF Status Learnership Title
22 Q 220012 00 163 5 5 R Certificate in Practical Management Level 5
22 Q 220001 19 178 4 4 R Learnership in Agri Sales and Services Level 4
22 Q 220006 21 166 5 5 R Learnership in Grain Handling Management Level 5
22 Q 220008 20 128 2 2 R Learnership in Grain Handling Processes Level 2
22 Q 220009 21 258 5 5 R Learnership in Specialist Agricultural Machinery Technician
Level 5
22 Q 220007 20 160 2 2 R Learnership: Agricultural Machinery Technician Level 2
22 Q 220011 39 128 2 2 R Sugar Industry Technical Maintenance Worker Level 2
7Total: 7of which registered:
23 SERVICES
RegNo NQF Status Learnership Title
23 Q 230004 17 120 4 4 R Afro -Hairdressing Level 4
23 Q 230014 22 247 5 5 R Brand Leadership Level 5
23 Q 230023 19 241 5 5 R Contact Centre Management Level 5
23 Q 230022 14 145 4 4 R Contact Centre Operations Level 4
23 Q 230021 15 128 2 2 R Contact Centre Suppport Level 2
23 Q 230016 21 243 5 5 R Customer Management Level 5
23 Q 230009 62 141 1 1 R Domestic Services Level 1
23 Q 230001 21 120 4 4 R Field Marketing Research Level 4
23 Q 230033 34 152 5 5 R First Line Manager Level 5
23 Q 230020 24 241 5 5 R Funeral Directing Level 5
23 Q 230018 20 123 3 3 R Funeral Services Practitioner Level 3
23 Q 230019 17 121 4 4 R Funeral Services Practitioner Level 4
23 Q 230008 20 120 4 4 R Generic Multi-sector Project Management Level 4
23 Q 230003 XX 120 1 1 R Hygiene and Cleaning: Commercial Level 1
23 Q 230024 31 120 1 1 R Hygiene and Cleaning: Laundry and Dry Cleaning Level 1
23 Q 230029 00 120 5 5 R Information Administration Level 5
23 Q 230005 17 120 4 4 R Ladies Hairdressing Level 4
23 Q 230015 24 134 4 4 R Marketing Communications Level 4
23 Q 230017 21 134 4 4 R Marketing and Sales Level 4
23 Q 230030 29 150 4 4 R National Certificate in Computer Aided Drawing Office
Practice Level 4
23 Q 230013 27 142 4 4 R National Certificate in New Venture Creation (SMME) Level 4
23 Q 230031 26 153 4 4 R Payroll Administration Level 4
23 Q 230036 24 240 5 5 R Payroll Administration Level 5
23 Q 230035 30 145 4 4 R Property Practitioner Level 4
23 Q 230034 30 145 4 4 R Property Technician Level 4
Page 19Last updated: 30 September 2003
D: Draft P: Pending R: Registered DR: De-Registered W: Withdrawn RR: Re-Registered A:
Application Acknowledged
78
23 SERVICES
RegNo NQF Status Learnership Title
23 Q 230037 27 137 5 5 R Real Estate Practitioner Level 5
23 Q 230006 24 120 4 4 R Recruitment Consultancy Level 4
23 Q 230025 39 159 2 2 R Secretarial / Administration Services Level 2
23 Q 230026 46 130 3 3 R Secretarial / Administration Services Level 3
23 Q 230032 54 140 4 4 R Secretarial Administration Level 4
23 Q 230028 56 140 4 4 R Supervisor Level 4
23 Q 230027 37 120 3 3 R Team Leader Level 3
32Total: 32of which registered:
25 THETA
RegNo NQF Status Learnership Title
25 Q 250014 XX 147 5 5 R Certificate In General Travel Level 5
25 Q 250009 56 120 2 2 R Certificate in: Accommodation Services Level 2
25 Q 250010 59 120 3 3 R Certificate in: Fast Food Services (NQF Level 3)
25 Q 250011 57 133 4 4 R Certificate in: Food and Beverage Services Level 4
25 Q 250012 49 126 4 4 R Certificate in: Hospitality Reception Level 4
25 Q 250013 66 162 4 4 R Certificate in: Professional Cookery Level 4
25 Q 250002 28 121 2 2 R National Certificate in Conservation Level 2
25 Q 250003 33 198 5 5 R National Certificate in Conservation: Fisheries Resource
Management Level 5
25 Q 250004 34 188 5 5 R National Certificate in Conservation: Terrestrial Resource
Management Level 5
25 Q 250017 XX 140 3 3 R National Certificate in Dealing Level 3
25 Q 250018 00 125 5 5 R National Certificate in Fitness Level 5
25 Q 250015 XX 120 3 3 R National Certificate in Gaming - Cashiering Level 3
25 Q 250028 27 120 3 3 R National Certificate in Gaming - Slots Operations Level 3
25 Q 250016 XX 134 3 3 R National Certificate in Gaming - Surveillance Level 3
25 Q 250020 00 120 4 4 R National Certificate in Sport, Recreation and Fitness
Leadership Level 4
25 Q 250001 24 122 4 4 R National Certificate in Tourism: Car Rental Level 4
25 Q 250005 22 126 4 4 R National Certificate in Tourism: Event Support Level 4
25 Q 250006 39 133 2 2 R National Certificate in Tourism: Guiding Level 2
25 Q 250007 42 141 4 4 R National Certificate in Tourism: Guiding Level 4
25 Q 250008 36 132 4 4 R National Certificate in Tourism: Reception Level 4
25 Q 250029 72 240 5 5 R National Diploma in Gaming Service Management Level 5
25 Q 250021 XX 140 5 5 R National Diploma in Retail Travel Level 5
25 Q 250022 XX 240 5 5 R National Diploma in Wholesale Travel Level 5
Page 20Last updated: 30 September 2003
D: Draft P: Pending R: Registered DR: De-Registered W: Withdrawn RR: Re-Registered A:
Application Acknowledged

79
26 TETA
RegNo NQF Status Learnership Title
26 Q 260018 73 140 4 4 R Advanced National Certificate - Aeronautical Engineering:
Electrical Level 4
26 Q 260017 73 140 4 4 R Advanced National Certificate - Aeronautical Engineering:
Mechanical Level 4
26 Q 260001 21 120 3 3 R Freight Handling Specialist Level 3
26 Q 260013 00 360 6 6 R Learnership for Engineering Technicians Level 6
26 Q 260019 00 120 5 5 R Learnership in Airline Contact Centre Management Level 5
26 Q 260011 15 240 5 5 R Learnership in Freight Handling Logistics Level 5
26 Q 260012 18 123 3 3 R Learnership in Professional Driving: Commuter/Coach/Freight
Services Level 3
26 Q 260014 26 120 3 3 R Learnership in Rail Operations (Functional Yard Operations)
Level 3
26 Q 260015 14 126 4 4 R Learnership in Rail Operations (Train Control) Level 4
26 Q 260016 32 120 1 1 R Learnership in Transport Level 1
26 Q 260009 21 205 3 3 R National Certificate Professional Driving Level 3
26 Q 260008 32 135 3 3 R National Certificate in Freight Forwarding Level 3
12Total: 12of which registered:
27 W&RSETA
RegNo NQF Status Learnership Title
27 Q 270004 15 240 5 5 R Certifcate in Retail Operations Management Level 5
27 Q 270002 11 168 2 2 R Retail Processes for Informal Businesses Level 2
27 Q 270001 16 168 2 2 R Wholesale and Retail Generalist Level 2
27 Q 270003 10 120 4 4 R Wholesale and Retail Sales and Services for Informal Business
Level 4
27 Q 270005 15 144 4 4 R Wholesale and Retail Specialist Level 4
5Total: 5of which registered:
549Total Number of Learnerships
549of which registered
Page 21Last updated: 30 September 2003
D: Draft P: Pending R: Registered DR: De-Registered W: Withdrawn RR: Re-Registered A:
Application Acknowledged

80

81