National Risk Sustainability Index (NRSI) A Paradigm ... · retirement, both on a broad national...
29
1 National Risk Sustainability Index (NRSI) A Paradigm Change to Measuring Retirement Preparedness By The Janet & Mark L. Goldenson Center for Actuarial Research, University of Connecticut December, 2016
Transcript of National Risk Sustainability Index (NRSI) A Paradigm ... · retirement, both on a broad national...

1
National Risk Sustainability Index (NRSI)
A Paradigm Change to Measuring Retirement Preparedness
By
The Janet & Mark L. Goldenson Center for Actuarial Research,
University of Connecticut
December, 2016

2
Table of Contents
Acknowledgements ......................................................................................................................... 3
Introduction .................................................................................................................................. 4
Executive Summary ........................................................................................................................ 5
Economic Drivers of NRSI............................................................................................................. 10
Interpretation of the NRSI............................................................................................................. 11
Non-economic Drivers of NRSI ...................................................................................................... 12
NRSI by State .............................................................................................................................. 18
Summary of Results...................................................................................................................... 20
Conclusion................................................................................................................................... 24
Appendix of Modelling Assumptions............................................................................................... 26
About the Goldenson Center .......................................................................................................... 29

3
Acknowledgements
The first Goldenson Center National Retirement Sustainability Index (NRSI) research project has been more than a 30 month long endeavour that has involved various teams of students, some of
whom have since graduated, a faculty advisory group, and several colleagues of mine when I worked for Towers Watson. The inspiration to take on this research project came from Mark Hug, Chief Marketing Office of Prudential and a member of the Goldenson Center Advisory Board. After one of
our annual meetings, Mark, who has always been a strong advocate of the work being done at the Goldenson Center, challenged me to take on this totally out-of-the-box research project to develop a
retirement index which is more holistic and captures both economic and non-economic drivers of retirement preparedness. This initial discussion led to this long voyage of discovery to come up with an Index that is more complete and holistic, yet objective and rigorous, and which carries an
important message that retirement preparedness can be managed and controlled by individual and societal actions. This heroic task could not have been accomplished without the collective efforts of
everyone on the team. The second NRSI report has taken less time to complete compared to the first publication in
November 2014, but is has come with its own set of challenges as well. In this new report, we have incorporated NRSI calculations by individual state using the same philosophy and methodology for
the aggregate NRSI. This has necessitated additional assumptions and approximations which are outlined in detail in the report, but the overall message is consistent with the aggregate NRSI.
The success of any ambitious endeavour requires the collective efforts of several team members. However, the one individual who has managed the second NRSI report in its entirety is Huili
(Shirley) Tang, my PhD student. Without Shirley’s management of the project and development of all the models to determine the NRSI calculations for each state, this project would never have been completed. Shirley was assisted initially by graduate students Saleh Almohana and Trevor Herzig,
and the report was completed with the assistance of Tae Park, a senior actuarial student at UConn.
Last but not least, I would like to thank Janet and Mark Goldenson who are the funding sponsors of the Goldenson Center. Every project, including the NRSI, bearing the Goldenson Center name, could not have come about without their generous funding of the Center 9 years ago. In particular, Mark
Goldenson came up with the creative name, Goldenson Center National Retirement Sustainability Index which I hope will become a byword for measuring retirement preparedness in the future.

4
Introduction
The concept of a Retirement Index is not new. There are several measures of financial readiness for
retirement, both on a broad national level as well as at a more segmented level. Some well-known
national indices include the National Retirement Risk Index by Boston College, the International
Retirement Security Survey by AARP, and the Retirement Confidence Survey by the Employee
Benefit Research Institute. Retirement indices focusing on more specific segments of the population
include New York Life’s Across Generations Retirement Income Survey, the Retirement
Preparedness Survey by Merrill Lynch, and the Fidelity Retirement Index by Fidelity.
While these are only a sample of retirement indices currently available, all these measures have some
of the following limitations:
They are not based on national US data
They only capture the pure economics in tracking retirement quality and do not capture non-
economic factors like the impact of improved health, job flexibility and job quality, retirement
planning and level of adaptability at retirement. As a consequence, these retirement indices
are directly correlated with the current state of the economy and tend to portray a negative
image of retirement readiness during adverse economic times which could be misleading.
Updates are done relatively infrequently
The Goldenson Center’s National Retirement Sustainability Index or NRSI attempts to overcome
the limitations of current retirement indices by incorporating the following attributes:
It captures both economic and non-economic drivers of retirement preparedness into a single
measure which ranges from 0 to 100, where the higher the measure, the greater the
sustainability at retirement.
It will be updated annually
It is based on publicly available US Census data and other nationally recognized data sources
It provides logical and consistent values and it is academically rigorous
It is simple to describe and interpret and make comparisons of retirement sustainability
between different sectors of the population and over time

5
Unlike current indices, the NRSI can be controlled, managed and improved by individual
actions, thus allowing opportunities for providers of retirement products and services to
proactively help individuals and the community as a whole achieve retirement sustainability
in the future.
For the 2015 report, the NRSI has been determined in aggregate as well as by individual state. The
results by state are consistent with the aggregate NRSI message.
Executive Summary
The baseline NRSI follows a similar logic to current indices. It is based on economic assets available at retirement and compared to future obligations or liabilities that need to be fulfilled throughout
one’s retirement life. Assets and liabilities are accumulated and discounted using typical interest rate assumptions and actuarial survival rates. The net equity (assets less liabilities) is then normalized to range from 0 to 100 by comparing the net equity to a benchmark equity which reflects the standard of
living enjoyed just prior to retirement. For example, an NRSI of 50% means that to achieve retirement sustainability or readiness, one’s standard of living at retirement should be reduced to half
of what it used to be just prior to retirement. The higher the NRSI, the closer retirement living standards are relative to living standards prior to retirement. The NRSI value is best understood by comparing the NRSI between groups at a given time period or for the same group across time. For
example, an increase in the NRSI between two successive time periods from 50 to 55 should be interpreted as a 10% improvement in the level of retirement living standards over the two time
periods. The baseline NRSI is then adjusted to include various non-economic drivers of retirement
sustainability. They are: Health status at retirement
Level of job satisfaction
Level of financial planning
Level of adaptability
All these non-economic drivers are quantified in an objective, logical and academically rigorous
manner and have been calculated using publicly availably US Census data and other nationally recognized data sources.
The main results are shown in the tables below for 2015 and 2013.

6
National Retirement
Sustainability Index 2013
Working
Population Retiree
Population Overall
1. Baseline Index 42% 59% 43%
2. Plus Job Satisfaction 46% 59% 47%
3. Plus Health Improvement 46% 59% 47%
4. Plus Financial Planning 56% 59% 56%
5. Plus Adaptability 81% 77% 81%
6. Final Index 81% 77% 81%
National Retirement Sustainability Index
2015
Working Population
Retiree Population Overall
1. Baseline Index 44% 57% 45%
2. Plus Job Satisfaction 47% 57% 48%
3. Plus Health Improvement 47% 57% 48%
4. Plus Financial Planning 54% 57% 54%
5. Plus Adaptability 80% 78% 80%
6. Final Index 80% 78% 80%

7
The table below shows 2015 baseline NRS I values and the final NRS I values and ranking by
state.
State 2015 Rank Final NRSI Baseline NRSI State
2015 Rank
Final NRSI
Baseline NRSI
Virginia 1 85.1% 47.2% Pennsylvania 27 73.5% 42.7%
Connecticut 2 84.5% 45.4% Rhode Island 28 73.4% 38.7% District of Columbia 3 84.5% 45.4% Wisconsin 29 72.7% 43.4%
Massachusetts 4 83.8% 44.9% South Dakota 30 72.7% 44.4%
Colorado 5 83.6% 45.8% Vermont 31 72.5% 35.3%
New York 6 82.8% 44.8% Missouri 32 71.9% 43.5%
Minnesota 7 82.1% 46.1% Ohio 33 71.3% 43.8%
New Jersey 8 81.8% 43.4% Indiana 34 70.9% 45.4%
Delaware 9 81.6% 48.1% Louisiana 35 70.7% 46.1%
Illinois 10 81.3% 46.6% Michigan 36 70.4% 42.6%
Maryland 11 80.6% 42.5% Tennessee 37 69.9% 44.0%
Washington 12 80.5% 45.4% Arizona 38 68.9% 40.4%
North Dakota 13 80.2% 48.3% Oklahoma 39 68.9% 43.6%
Nebraska 14 78.5% 46.9% Florida 40 67.9% 39.5%
Kansas 15 78.3% 45.7% Nevada 41 67.3% 42.5%
Wyoming 16 77.8% 49.2% Idaho 42 67.2% 41.0% New Hampshire 17 77.8% 41.0% Montana 43 67.0% 37.1%
Alaska 18 76.9% 45.4% New Mexico 44 65.7% 38.5%
Texas 19 76.8% 47.3% Kentucky 45 65.1% 41.6%
Utah 20 76.5% 44.6% Alabama 46 64.9% 40.8%
Oregon 21 75.9% 42.7% Mississippi 47 64.5% 41.2%
California 22 75.4% 41.7% South Carolina 48 64.4% 37.7%
Iowa 23 74.9% 46.0% Maine 49 64.4% 34.1%
North Carolina 24 74.0% 44.4% Arkansas 50 63.3% 39.9%
Hawaii 25 73.9% 40.7% West Virginia 51 58.9% 35.2%
Georgia 26 73.6% 43.9%
We can make the following observations:
Both the baseline NRSI in 2013 and 2015 are only 43% and 45% respectively, but after
incorporating the non-economic factors, they increase to 81% and 80% respectively. This
means that non-economic factors are capable of raising the retirement standard of living
relative to the standard of living prior to retirement by as much as 38 and 35 percentage
points in 2013 and 2015.

8
The baseline NRSI reflects the economic conditions of the calendar year being modelled,
and this is similar to current retirement indices. For example, the baseline NRSI for 2015 is
45%, which is higher than the baseline NRSI for 2013 of 43%. This means that economic
assets at retirement could sustain about 45% of the living standards enjoyed prior to
retirement in 2015. And this is a little better than 2013, which reflects that between 2013
and 2015, the economic conditions have improved slightly.
The non-economic drivers of NRSI collectively have a significant impact on the overall
NRSI value and are not impacted by the economic conditions of the time. For both 2013
and 2015, the final NRSI values are 81% and 80% respectively which is significantly higher
that the corresponding baseline NRSI values of 43% and 45%.
The baseline NRSI for the retiree population is larger than the working population, but the
impact of the non-economic factors is greater for the working than retiree population,
resulting in a final NRSI value that is close for both segments of the population.
The non-economic factors demonstrate that retiree adaptability has the greatest NRSI
impact. This non-economic driver can be controlled and managed by individual actions.
This means that any external or individually generated interventions in education and
training during working life can have a profound impact on one’s retirement sustainability.
Retirement financial planning is the second most important non-economic factor impacting
the overall NRSI. For financial institutions that specialize in providing retirement products
and services to individuals, this is an important message that should be stressed to their
clients.
Various sensitivity tests on these non-economic factors show that relatively small
improvements in these factors can play an important role is ensuring a high level of
retirement sustainability even under adverse economic conditions.
For 2015, the NRSI was calculated for each state using a methodology similar to the determination of
the aggregate NRSI.
The baseline NRSI by state is a reflection of the combination of income, expenses and gross
product per capita (GSP) at the state level. The NRSI increase due to financial planning in
each state is assumed to be proportional to the state’s GSP per capita. Also, the NRSI
increase due to job adaptability in each state is positively related to the average education

9
level for college or higher in that state. Virginia, Connecticut, District of Columbia,
Massachusetts and Colorado have the highest final NRSI, while West Virginia, Arkansas,
Maine, South Carolina and Mississippi have the lowest final NRSI.
Because the baseline index is a reflection of the net equity (i.e. assets less liabilities) of the
state, a high GSP doesn’t necessarily result in a high baseline index. For example,
Massachusetts ranks 7th in GSP, but ranks 18th in the baseline index. This is because the
expense ratio is high in Massachusetts, which reduces the actual net equity and baseline
index in Massachusetts. While Texas ranks 15th in GSP, it ranks 4th in baseline index,
because the expense ratio is low in Texas. This increases the actual net equity and baseline
index in Texas.
A high state GSP relative to the US as a whole does impact the non-economic financial
planning factor which is estimated as being proportional to the state’s GSP. Alaska and
Delaware with high GSP’s relative to the national GSP show a significant increase to the
baseline NRSI due to financial planning, while the opposite is true for Arkansas and
Arizona which have lower GSP’s relative to the national GSP.
Similar to the aggregate NRSI, the adaptability non-economic factor generates the greatest
increase to the baseline NRSI. Our model has approximated the adaptability non-economic
factor by state by comparing the state’s average level of education (college and higher)
against the national average. Using this criteria, Massachusetts and Maryland with high
education levels compared to the national average, show a significant increase in NRSI due
to adaptability. In contrast, Louisiana and Kentucky with low education levels relative to
the national average, show a lower increase in NRSI due to adaptability.
Due to lack of data, the impact on the NRSI by state for the job satisfaction and health non-
economic factor is not modelled and set equal to the aggregate NRSI increase for these two
factors.
From the NRSI table by state, the final index for Virginia is the highest at 85.1%, while the
final index for West Virginia is the lowest at 58.9%.
The improvements in retirement sustainability by non-economic factors range from 23.3%
to 39.1% in all the 50 states and Washington DC. This means that these non-economic
factors are important for any state independent of the economic level of the state.

10
The above conclusions lead to the most important message that the NRSI is hoping to convey: Retirement preparedness or sustainability is not a manifest destiny driven entirely by current
economic conditions. Instead, it should be viewed as a state of affairs that can be controlled and managed by individual actions, government intervention and the appropriate utilization of retirement products and services offered by financial institutions.
The remainder of the report explains the NRSI calculation methodology for the baseline index and
for each of the non-economic drivers, the interpretation of the NRSI, and more details on how the NRSI calculations were done by state.
Economic Drivers of NRSI
The economic drivers of NRSI are similar to current indices. The primary data sources are the 2010
US Bureau of Statistics and the 2014 Health & Retirement Study (HRS). For the working population,
net assets are accumulated using interest-only assumptions from the current age to the anticipated age
at retirement. Liabilities at retirement capture future living and health care expenses and they are
discounted to the anticipated age at retirement using actuarial discounting based on both interest and
survivorship. The difference between estimated assets at retirement and estimated liabilities at
retirement is denoted as the actual equity at retirement for the working population.
For the retiree population, current assets are estimated from the HRS database and they include
existing assets as well as future sources of income from private pensions, social security and life
annuities which are discounted using interest and survivorship. Estimated liabilities at retirement are
calculated in a manner similar to the working population and they reflect the actuarial discounted
value of future living and health care expenses. The difference between current assets at retirement
and estimated liabilities at retirement is denoted as the actual equity at retirement for the retiree
population.
At this stage, the NRSI calculation methodology starts to diverge from current indices. In order to
develop a normalized index value ranging from 0 to 100, we have developed a concept of
“benchmark equity” for both the working and retiree population. The concept is based on the
fundamental philosophy that any lack of readiness, preparedness or sustainability at retirement is
generated from making the transition from working life to retirement life.
In order to calculate the benchmark equity for the working population, we have estimated assets and
liabilities to reflect the standard of living enjoyed just prior to retirement. This requires projecting

11
future assets and liabilities under the assumption that the individual continues working. The
difference between assets and liabilities at a given age assuming continued employment is then the
benchmark equity.
The calculation is similar for the retiree population. Assets and liabilities are projected from the date
of retirement assuming retirement did not occur and using the last available income earned prior to
retirement from the HRS database to project continued employment. The benchmark equity for the
retiree population is the difference between these projected assets and liabilities measured at the
current age of the retiree.
The benchmark equity for both the working and retiree population reflects the standard of living
enjoyed by both segments of the population just prior to retirement. The actual equity is then
measured against the benchmark equity to develop the NRSI separately for the working population
and retiree population and then combined for an overall index value. To ensure the NRSI ranges
between 0 and 100, the actual equity is floored at zero and capped at the benchmark equity. An actual
equity close to the benchmark equity (i.e. NRSI close to 100) would imply that the standard of living
enjoyed at retirement is close to the standard of living enjoyed just prior to retirement.
Interpretation of the NRSI
The higher the NRSI, the closer retirement living standards are relative to living standards prior to
retirement. For example, an NRSI of 50% means that to achieve retirement sustainability or
readiness, one’s standard of living at retirement should be reduced to half of what it used to be just
prior to retirement. The NRSI value is best understood by comparing the NRSI between groups at a
given time period or for the same group across time. For example, an increase in the NRSI between
two successive time periods from 50 to 55 should be interpreted as a 10% improvement in the level
of retirement living standards over the two time periods.

12
Non-economic Drivers of NRSI
The inclusion of non-economic drivers of retirement sustainability is the key difference between the
NRSI and current indices. While this provides a more holistic measure of retirement readiness and
allows individuals greater control of their retirement destiny, it does introduce some complexities in
the modelling process. Economic or financial drivers of retirement readiness are more objective and
can be readily quantified. When non-economic drivers are incorporated, it brings in an element of
subjectivity to measuring retirement readiness and quantifying these drivers is not as obvious.
We have tried to follow some principles in identifying and modelling these non-economic factors:
Every non-economic factor we have incorporated does have an impact on retirement readiness
and sustainability and is within the control of the individual during either the working or
retirement phases in life.
Every non-economic factor we have included has been transformed and quantified in order to
be incorporated into our actual equity calculation.
The non-economic factors have no impact on the benchmark equity value and only affect the
actual equity calculation.
The quantification of these non-economic factors is logical and consistent with commonly
held beliefs about retirement sustainability.
The set of non-economic factors we have incorporated is not exhaustive. Some other non-
economic factors have been ignored because they are either too subjective or they cannot be
easily quantified in terms of their impact on actual equity.
In general, because of the subjective nature of these non-economic factors, conservative
assumptions have been adopted in quantifying these factors to dampen the impact on the pure
economically driven NRSI value.
The four non-economic factors we have incorporated into the NRSI measure have a
significant impact on the purely economically driven NRSI value
The four non-economic factors we have incorporated into our NRSI calculation are as follows:
Health status at retirement

13
Level of job satisfaction
Level of financial planning
Level of adaptability of the retiree
We will describe each of these four non-economic factors in turn and explain the logical assumptions
we have made in order to incorporate these factors into our actual equity calculation.
Health Status
The quantification of the health status non-economic factor stems from the fact that the healthier you
are during retirement, the lower your health care expenses. Lower health care expenses during
retirement translates to lower future liabilities at retirement, an increase in actual equity and a higher
NRSI value.
Health status has a positive impact on the NRSI for both the working population and the retiree
population. The quantification of health status is a multiple-step process. The Health & Retirement
Study (HRS) is the main data source that has been used in our analysis.
1. Use the HRS data to develop a multiple regression equation which regresses annual
healthcare expenses against age and level of health. The HRS measures healthcare scores for
retirees on a scale of 1 to 5 with 1 being the best level of health. The graph below shows
annual expenses during retirement by age and healthcare score.

14
As expected, the poorer the state of health, the higher the healthcare expenses, and for a given
state of health, healthcare expenses increase by age.
2. Based on the HRS data over different calendar year cohorts, there is no strong evidence of
any improvements in the level of health over time. Hence based on existing data, the health
status non-economic factor has no impact on the NRSI
3. The multiple regression equation in (1) can be used to estimate future healthcare expenses
under sensitivity tests of improved health levels.
For the retiree population, the improved health levels are projected from the current
actual healthcare scores of retirees available in the HRS database.
For the working population, the annual improvement factor is compounded from the
current age of the worker to the estimated age at retirement and applied to the average
healthcare score at that retirement age from the HRS database. This is the estimated
healthcare score for the working population at retirement. Future healthcare expenses
are then projected using the multiple regression equation in (1) and using the
“improved” healthcare score of the working population at retirement.
4. Any sensitivity tests of improvements in health levels reduces future healthcare expenses at
retirement which results in lower retirement liabilities and higher actual equity at retirement.
15
Level of Job Satisfaction
Level of job satisfaction is perhaps the most difficult non-economic driver of retirement sustainability
to measure and quantify. The hypothesis that we had to test in our analysis is that individuals who are
very satisfied in their work tend to retire at a later age. This raises two related issues:
What is a logical proxy for job satisfaction?
Is the hypothesis true based on the retirement age distribution of current retirees?
Since job satisfaction is naturally a highly subjective measure and could incorporate many factors, we
did not attempt to directly model job satisfaction. Instead, we used the most recent Wall Street
Journal (WSJ) occupation rankings as a proxy for job satisfaction. The higher the occupation ranking,
the lower the level of job satisfaction.
Next, we had to develop average occupation rankings for each of the job groupings in the HRS
database. This was a two-step process which involved some judgement on the part of the researchers.
1. We first had to identify the various occupations associated with the HRS job groupings using
the Bureau of Labor Statistics (BLS) job groupings and associated occupations within each
job grouping.
2. We then had to map the Wall Street Journal occupation ranks to the associated occupations in
the HRS job groupings to come up with an average job ranking for each of the HRS job
groupings. Since the BLS and WSJ occupation listings were not identical, some judgement
had to be used to match WSJ occupation ranks with the BLS occupations.
Once the average occupation rankings were developed for each of the HRS job groupings, a
regression line was constructed which plotted age at retirement (y-variable) against average
occupation ranking in the job group. The regression line shows that the lower the average occupation
ranking (i.e. the greater the job satisfaction), the later the age at retirement.
We next had to estimate the weighted average occupation ranking for the working population using
the BLS job groupings and the associated occupations within each job grouping which were then
mapped to the WSJ occupation rankings. The estimated weighted average occupation ranking for the
working population is 76.5 which is lower (i.e. greater job satisfaction) than the average occupation
ranking for the retiree population which is 77.7. The rate of decrease in job ranking between the

16
working population and the retiree population was used to calculate the corresponding increase in the
average retirement age for the working population relative to the retiree population. The estimated
delay in the average retirement age for the working population due to greater job satisfaction is
approximately one year.
Note that this delay in retirement age for the working population is not driven by financial needs but
simply a willingness to stay longer on the job because of increased job satisfaction. This a macro
phenomenon that we have observed from our analysis and it clearly does not hold for every working
individual.
The impact of job satisfaction on the NRSI calculation only affects the working population. Relative
to the baseline NRSI, a delay in retirement age for the working population increases actual equity
since the accumulated assets at retirement are larger because of the one year delay in retirement, and
retirement liabilities are lower because of the shorter retirement period. The NRSI value for the
working population is hence increased if job satisfaction is incorporated, while the NRSI value for
the retiree population stays unchanged, thus increasing the overall NRSI value.
Level of Adaptability
Adaptability of an individual retiree is a reflection of the ability to generate additional or part-time
income while retired. The adaptability factor captures the potential of a retiree to generate part-time
income and is not a measure of the actual part-time income earned by retirees. For example, a retired
professor in good health has the potential to pick up some part-time teaching duties to supplement her
retirement assets, and our adaptability measure attempts to estimate this potential income and its
impact on retirement sustainability and does not care if she actually does part-time teaching during
retirement.
In order to model this potential part-time income at retirement, we use the HRS database to model
retirees who indicated earning part-time income. We developed a multiple regression model from this
subset of the HRS database to regress part-time income (dependent variable) by two independent
variables, attained age and level of education, where level of education is measured by number of
years of education. The regression equation demonstrates that for a given education level, part-time
income decreases by attained age and for a given attained age, the level of part-time income
increases as the level of education increases. The graph below plots the level of part-time income by
attained age and level of education. In line with our overall philosophy to be conservative with our

17
assumptions for non-economic drivers of retirement sustainability, we do not allow for any part-time
income beyond age 75.
In order to model adaptability for the working population, we have to first estimate the projected
education level prior to retirement for the working population. Using the HRS database, we can
estimate the annual improvement factor in the level of education by calculating the average years of
education achieved over different calendar year cohorts of retirees. Between calendar years 2000 and
2010, average educational levels have increased by 0.03% per year for retirees. We apply this annual
improvement factor in education to the working age population in order to estimate the projected
weighted average education level for the working population at retirement age. We then use the
regression model for part-time income regressed by age and education level to estimate the potential
part-time income that could be earned by today’s working population at retirement.
The impact of job adaptability is to increase actual assets at retirement without any accompanying
increase in retirement liabilities for both the retiree and working population. This increases actual
equity and by consequence, the NRSI value for both the working and retiree population.
Level of Financial Planning
From the HRS database, regressing level of accumulated assets (dependent variable) against level of
retirement planning (independent variable) shows that higher levels of financial planning generate
higher levels of accumulated assets. Since this is already reflected in the actual equity for retirees, we
assume no impact of financial planning on the retiree population. However, by analysing different

18
calendar year cohorts of the HRS database, we observe an annual improvement trend in the level of
retirement planning for more recent compared to earlier retirees. The annual improvement in level of
retirement planning is estimated at 1.11%.
From the regression equation which plots the level of accumulated assets against level of retirement
planning, we can translate higher levels of retirement planning into a higher earnings rate on assets.
We apply this higher earnings rate to calculate the accumulated assets at retirement for the working
population to reflect the impact of retirement planning. Since retirement liabilities remain unchanged,
actual equity increases for the working population, thus increasing the NRSI for the working
population and hence the overall NRSI.
NRS I by S tate
To capture the baseline state index, we adjusted the national baseline NRSI by comparing the state’s
assets and liabilities against the national baseline assets and liabilities. The state’s GSP relative to the
aggregate GSP was used to approximate the state’s assets, while the state’s cost-of-living index
relative to the national index was used to approximate the state’s liabilities. The resultant state
baseline equity relative to the aggregate baseline equity was then used to approximate the state
baseline NRSI.
Approximating the non-economic drivers of NRSI by state required some additional simplifying, but
reasonable assumptions. In general, instead of directly calculating these non-economic factors by
state, we adjusted the aggregate NRSI increase due to these non-economic factors by comparing a
reasonable state indicator of the non-economic factor relative to the national indicator. For financial
planning, we made an assumption that the higher the level of wealth, the greater the level of financial
planning. The increase in the NRSI due to financial planning in the aggregate index was adjusted by
state in proportion to the state’s GSP relative to the national average, with a reasonable cap in order
to be conservative.
For the adaptability non-economic factor by state, we adjusted the increase in the NRSI due to
adaptability in the aggregate index by comparing the average education level of the state (college and
higher) against the national average education level. Since adaptability in the aggregate NRSI is
captured by measuring the level of part-time income that potentially could be earned during
retirement due to higher levels of education, the ratio of the state to national education level had to be
19
reflected in terms of its impact on potential part-time at retirement. In this way, we could reasonably
approximate the adaptability non-economic factor by state.
The approximation methodology for the financial planning and adaptability non-economic factor by
state ensures the following consistent and reasonable patterns:
For states with higher GSP relative to the national average, the increase in the NRSI due to
the financial planning non-economic factor is greater than the corresponding increase in the
aggregate NRSI
For states with higher education levels relative to the national average, the increase in the
NRSI due to the adaptability non-economic factor is greater than the corresponding increase
in the aggregate NRSI
No adjustment was made by state to reflect the health and job satisfaction non-economic factors because there was no data available on a state-by-state basis to approximate these non-economic
factors.
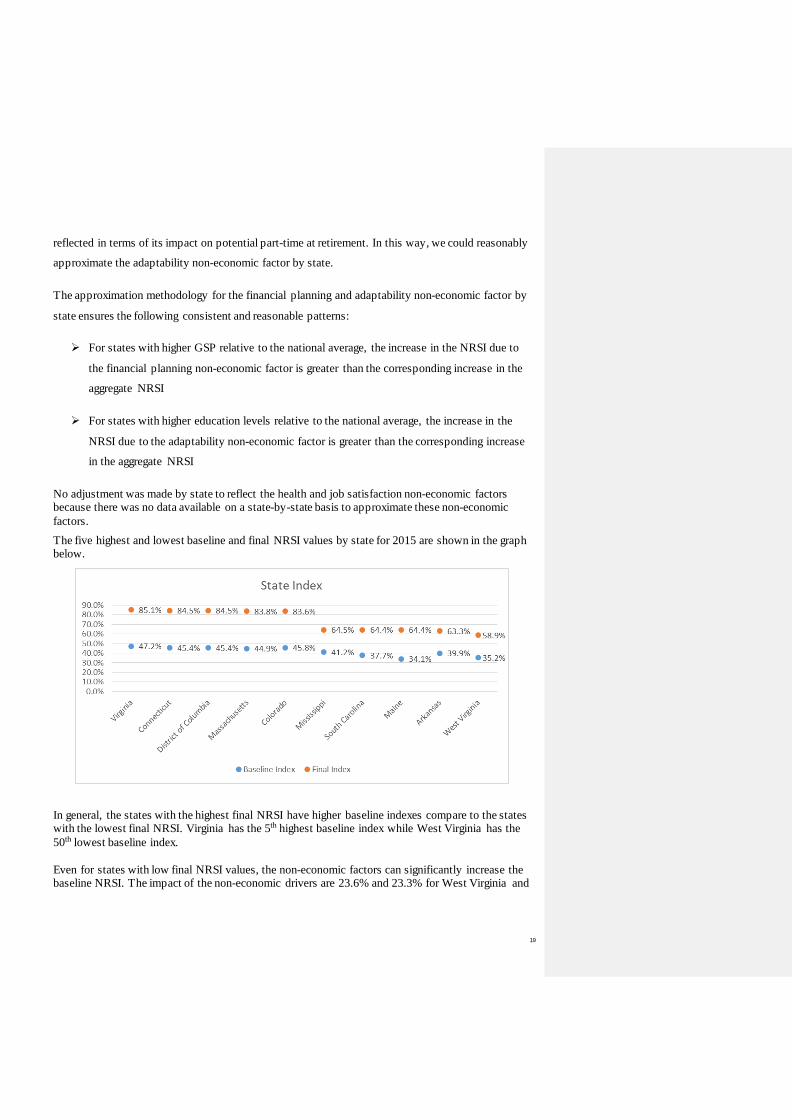
The five highest and lowest baseline and final NRSI values by state for 2015 are shown in the graph below.
In general, the states with the highest final NRSI have higher baseline indexes compare to the states with the lowest final NRSI. Virginia has the 5th highest baseline index while West Virginia has the
50th lowest baseline index.
Even for states with low final NRSI values, the non-economic factors can significantly increase the baseline NRSI. The impact of the non-economic drivers are 23.6% and 23.3% for West Virginia and

20
Arkansas, respectively. This implies that the non-economic factors are important in order to prepare for a better retirement regardless of the economic status of each state.
Summary of Results
The main results are shown in the tables below for the current year, 2015, and the last report in 2013.
The 2015 state NRSI results are listed as well.
National Retirement Sustainability Index
2013
Working
Population
Retiree
Population Overall
1. Baseline Index 42% 59% 43%
2. Plus Job Satisfaction 46% 59% 47%
3. Plus Health Improvement 46% 59% 47%
4. Plus Financial Planning 56% 59% 56%
5. Plus Adaptability 81% 77% 81%
6. Final Index 81% 77% 81%
National Retirement
Sustainability Index 2015
Working Population
Retiree Population Overall
1. Baseline Index 44% 57% 45%
2. Plus Job Satisfaction 47% 57% 48%
3. Plus Health Improvement 47% 57% 48%
4. Plus Financial Planning 54% 57% 54%
5. Plus Adaptability 80% 78% 80%
6. Final Index 80% 78% 80%

21
State 2015 Rank Final NRSI Baseline NRSI State
2015 Rank
Final NRSI
Baseline NRSI
Virginia 1 85.1% 47.2% Pennsylvania 27 73.5% 42.7%
Connecticut 2 84.5% 45.4% Rhode Island 28 73.4% 38.7% District of Columbia 3 84.5% 45.4% Wisconsin 29 72.7% 43.4%
Massachusetts 4 83.8% 44.9% South Dakota 30 72.7% 44.4%
Colorado 5 83.6% 45.8% Vermont 31 72.5% 35.3%
New York 6 82.8% 44.8% Missouri 32 71.9% 43.5%
Minnesota 7 82.1% 46.1% Ohio 33 71.3% 43.8%
New Jersey 8 81.8% 43.4% Indiana 34 70.9% 45.4%
Delaware 9 81.6% 48.1% Louisiana 35 70.7% 46.1%
Illinois 10 81.3% 46.6% Michigan 36 70.4% 42.6%
Maryland 11 80.6% 42.5% Tennessee 37 69.9% 44.0%
Washington 12 80.5% 45.4% Arizona 38 68.9% 40.4%
North Dakota 13 80.2% 48.3% Oklahoma 39 68.9% 43.6%
Nebraska 14 78.5% 46.9% Florida 40 67.9% 39.5%
Kansas 15 78.3% 45.7% Nevada 41 67.3% 42.5%
Wyoming 16 77.8% 49.2% Idaho 42 67.2% 41.0% New Hampshire 17 77.8% 41.0% Montana 43 67.0% 37.1%
Alaska 18 76.9% 45.4% New Mexico 44 65.7% 38.5%
Texas 19 76.8% 47.3% Kentucky 45 65.1% 41.6%
Utah 20 76.5% 44.6% Alabama 46 64.9% 40.8%
Oregon 21 75.9% 42.7% Mississippi 47 64.5% 41.2%
California 22 75.4% 41.7% South Carolina 48 64.4% 37.7%
Iowa 23 74.9% 46.0% Maine 49 64.4% 34.1%
North Carolina 24 74.0% 44.4% Arkansas 50 63.3% 39.9%
Hawaii 25 73.9% 40.7% West Virginia 51 58.9% 35.2%
Georgia 26 73.6% 43.9%
We can make the following observations:
Both the baseline NRSI in 2013 and 2015 are only 43% and 45% respectively, but after
incorporating the non-economic factors, they increase to 81% and 80% respectively. This
means that non-economic factors are capable of raising the retirement standard of living
relative to the standard of living prior to retirement by as much as 38 and 35 percentage
points in 2013 and 2015.
The baseline NRSI reflects the economic conditions of the calendar year being modelled,
and this is similar to current retirement indices. For example, the baseline NRSI for 2015 is
45%, which is higher than the baseline NRSI for 2013 of 43%. This means that economic
assets at retirement could sustain about 45% of the living standards enjoyed prior to
Commented [VJ1]: Can we add the Final NRSI as an additional column after Baseline NRSI in the table above as
well as in table in page 7 in the Executive Summary?

22
retirement in 2015. And this is a little better than 2013, which reflects that between 2013
and 2015, the economic conditions have improved slightly.
The non-economic drivers of NRSI collectively have a significant impact on the overall
NRSI value and are not impacted by the economic conditions of the time. For both 2013
and 2015, the final NRSI values are 81% and 80% respectively which is significantly higher
that the corresponding baseline NRSI values of 43% and 45%.
The baseline NRSI for the retiree population is larger than the working population, but the
impact of the non-economic factors is greater for the working than retiree population,
resulting in a final NRSI value that is close for both segments of the population.
The non-economic factors demonstrate that retiree adaptability has the greatest NRSI
impact. This non-economic driver can be controlled and managed by individual actions.
This means that any external or individually generated interventions in education and
training during working life can have a profound impact on one’s retirement sustainability.
Retirement financial planning is the second most important non-economic factor impacting
the overall NRSI. For financial institutions that specialize in providing retirement products
and services to individuals, this is an important message that should be stressed to their
clients.
Various sensitivity tests on these non-economic factors show that relatively small
improvements in these factors can play an important role is ensuring a high level of
retirement sustainability even under adverse economic conditions.
For 2015, the NRSI was calculated for each state using a methodology similar to the determination of
the aggregate NRSI.
The baseline NRSI by state is a reflection of the combination of income, cost and gross
product per capita (GSP) at the state level. The increase in financial planning in each state is
proportional to the state’s GSP per capita. Also, the increase in job adaptability in each state
is positively related to the average education level for college or higher in that state.
Virginia, Connecticut, District of Columbia, Massachusetts and Colorado have the highest
final NRSI, while West Virginia, Arkansas, Maine, South Carolina and Mississippi have the
lowest final NRSI.

23
Because the baseline index is a reflection of the net equity (i.e. assets less liabilities) of the
state, a high GSP doesn’t necessarily result in a high baseline index. For example,
Massachusetts ranks 7th in GSP, but ranks 18th in the baseline index. This is because the
expense ratio is high in Massachusetts, which reduces the actual net equity and baseline
index in Massachusetts. While Texas ranks 15th in GSP, it ranks 4th in baseline index,
because the expense ratio is low in Texas. This increases the actual net equity and baseline
index in Texas.
A high state GSP relative to the US as a whole does impact the non-economic financial
planning factor which is estimated as being proportional to the state’s GSP. Alaska and
Delaware with high GSP’s relative to the national GSP show a significant increase to the
baseline NRSI due to financial planning, while the opposite is true for Arkansas and
Arizona which have lower GSP’s relative to the national GSP.
Similar to the aggregate NRSI, the adaptability non-economic factor generates the greatest
increase to the baseline NRSI. Our model has approximated the adaptability non-economic
factor by state by comparing the state’s average level of education (college and higher)
against the national average. Using this criteria, Massachusetts and Maryland with high
education levels compared to the national average show a significant increase in NRSI due
to adaptability. In contrast, Louisiana and Kentucky with low education levels relative to
the national average show a lower increase in NRSI due to adaptability.
From the NRSI table by state, the final index for Virginia is the highest at 85.1%, while the
final index for West Virginia is the lowest at 58.9%.
The improvements in retirement sustainability by non-economic factors range from 23.3%
to 39.1% in all the 50 states and Washington DC. This means that these non-economic
factors are important for any state independent of the economic level of the state.
The above conclusions lead to the most important message that the NRSI is hoping to convey:
Retirement preparedness or sustainability is not a manifest destiny driven entirely by current
economic conditions. Instead, it should be viewed as a state of affairs that can be controlled and
managed by individual actions, government intervention and the appropriate utilization of retirement
products and services offered by financial institutions.

24
Conclusion
The National Retirement Sustainability Index is the first time any research institution has attempted
to provide a more holistic evaluation of retirement sustainability by incorporating both economic and
non-economic drivers that impact retirement preparedness. While recognizing that some judgement is
needed to model these non-economic drivers of retirement sustainability, we have attempted to be
rigorous, logical and conservative in our assumptions in order to avoid any positive bias in our
analysis. We have also chosen to avoid incorporating non-economic measures that could have an
impact but cannot be objectively quantified.
Based on the various non-economic drivers of retirement sustainability that we have analysed, we can
make the following conclusions:
These non-economic drivers collectively have a significant impact on the overall NRSI
value and the NRSI values by state.
Retirement preparedness or sustainability is not a manifest destiny driven entirely by
current economic conditions. Instead, it should be viewed as a state of affairs that can be
controlled and managed by individual actions, government intervention and the appropriate
utilization of retirement products and services offered by financial institutions.
Based on the techniques we have developed, a cost-benefit analysis of any external
intervention or investment in wellness, education and training can be modelled and its
impact on retirement sustainability can be measured.
For financial institutions that specialize in providing retirement products and services to
individuals, it may be helpful to enhance current individual financial planning models to
incorporate these non-economic drivers we have included in our NRSI calculation.
In these days of economic uncertainty, preparing for a sustainable life at retirement is everyone’s
individual responsibility. With increased flexibility in the workplace environment and the ability to
take advantage of technological advances in order to be independent of one’s physical location, there
are new and unlimited opportunities today and in the future that could help offset this economic
uncertainty. From the analysis we have done, we have shown that individuals in good health, with a
high level of education and training, and who have done the appropriate financial planning
throughout their working life, can enjoy a long and sustainable retirement life with the option of

25
generating additional income as needed to supplement any financial shortfalls during retirement. This
is reflected in the national NRSI as well as the NRSI by state.
The Goldenson Center will update the NRSI annually and enhance some of our modelling techniques
as necessary. We hope that this holistic approach to measuring retirement preparedness will stimulate
similar research by other research institutions and suggest further refinements to our modelling
assumptions. More importantly, we hope that our findings will generate the right behaviour by
individuals, government and financial institutions to ensure that a long and sustainable retirement life
can be achieved by everyone.
Jeyaraj (Jay) Vadiveloo, PhD, FSA, MAAA, CFA Professor & Director
Janet & Mark L. Goldenson Center for Actuarial Research University of Connecticut [email protected]
www.goldensoncenter.uconn.edu

26
Appendix of Modelling Assumptions
A. S ources of Data
Health & Retirement Study (September, 2014)
US Census Bureau of Statistics ( 2010)
Wall Street Journal Occupation Rankings (January 5, 2010)
http://online.wsj.com/public/resources/documents/st_BESTJOBS2010_20100105.html
B. Interest Rate Assumptions
Investment 4.36%
Wage 3.51%
Living expenses 3.07%
Healthcare expenses 5.81%
Discount 3.93%
Return on Existing Investments: Rate derived from taking the weighted average of years 1950
to 2012 based on Federal Reserve Data
Wage Growth: Rate derived from taking the weighted average of years 1950 to 2012 based on
Federal Reserve Data
Living Expense Growth: Rate derived from taking the weighted average of years 1950 to
2012 based on Federal Reserve Data
Health Expense Growth: Rate derived from taking the weighted average of years 1950 to
2011 based on Federal Reserve Data
Post-retirement Discount Rate: Rate derived from taking the weighted average of years 1950
to 2012 based on Federal Reserve Data

27
C. Mortality Assumptions
Source: The RP-2000 Mortality Tables https://www.soa.org/research/experience-study/pension/research-rp-2000-mortality-tables.aspx
Age # of deaths per 1000
Age # of deaths per 1000
Male Female Male Female
50 2.14 1.68 79 57.93 41.51
51 2.45 1.85 80 64.37 45.88
52 2.67 2.02 81 72.04 50.78
53 2.92 2.21 82 80.49 56.29
54 3.2 2.42 83 89.72 62.51
55 3.62 2.72 84 99.78 69.52
56 4.2 3.09 85 110.76 77.45
57 4.69 3.48 86 122.8 86.38
58 5.27 3.92 87 136.04 96.34
59 5.95 4.44 88 150.59 107.3
60 6.75 5.06 89 166.42 119.15
61 7.68 5.81 90 183.41 131.68
62 8.76 6.66 91 199.77 144.6
63 10.01 7.65 92 216.61 157.62
64 11.28 8.62 93 233.66 170.43
65 12.74 9.71 94 250.69 182.8
66 14.41 10.95 95 267.49 194.51
67 16.08 12.16 96 283.91 205.38
68 17.87 13.45 97 299.85 215.24
69 19.8 14.86 98 315.3 223.95
70 22.21 16.74 99 330.21 231.39
71 24.57 18.58 100 344.56 237.47
72 27.28 20.67 101 358.63 244.83
73 30.39 22.97 102 371.69 254.5
74 33.9 25.46 103 383.04 266.04
75 37.83 28.11 104 392 279.06
76 42.17 30.97 105 397.89 293.12
77 46.91 34.11 106 400 307.81
78 52.12 37.6

28
D. Other Assumptions
Average retirement age for baseline NRSI is 63
(Average value from Health & Retirement Study (September, 2014))
Average retirement age with the job satisfaction calculation is 64
(Derived from Wall Street Journal Occupation Rankings (January 5, 2010), US
Census Bureau of Statistics (2010), and Health & Retirement Study (September,
2014))
No part-time income beyond 75 for adaptability

29
About the Goldenson Center
The Goldenson Center for Actuarial Research at the University of Connecticut (UConn) offers clients
a unique combination of academic rigor and industry knowledge.
As part of the university community, the Goldenson Center is able to partner top actuarial students and faculty with industry professionals to provide high-quality applied research at cost effective rates. With students and faculty from UConn’s acclaimed actuarial science program, the Center is able to
provide innovative research projects designed to help industry professionals better understand and manage actuarial issues and challenges.
The result of this distinctive collaboration between academia and industry is an exceptional research center that provides industry professionals with leading research while supplying actuarial students
with an invaluable experiential education.
Our Leadership
Dr Jay Vadiveloo Professor & Director Goldenson Center for Actuarial Research
University of Connecticut
As Professor & Director of the Janet & Mark L. Goldenson Center for Actuarial Research at the
University of Connecticut, Dr. Jay Vadiveloo works on applied actuarial research projects using teams of academicians, students and industry
professionals. Dr. Vadiveloo has a doctorate in statistics from the University of California,
Berkeley, is a Fellow of the Society of Actuaries, a Member of the American Academy of Actuaries, and a Chartered Financial
Analyst. He has over 25 years of experience working in senior level management positions in
the life insurance industry and more than 20 years of experience with UConn’s actuarial science program.
In addition to publishing articles in the actuarial literature and speaking at actuarial conferences,
Dr. Vadiveloo recently patented a new algorithm (Replicated Stratified Sampling or RSS) for risk
modelling that exponentially reduces processing time at a pre-determined accuracy level for any complex actuarial modelling. Dr. Vadiveloo is
also editor and co-author of a new text by the Society of Actuaries on Enterprise Risk
Management for Small and Medium-Sized Enterprises.