National Results, 2014 -15 - Council for Aid to...
21
National Results, 2014 -15 cae | 215 Lexington Avenue, Floor 16 | New York, NY 10016 | [email protected] | (212) 217-0700 | @cwra_beat Copyright © 2016 Council for Aid to Education
Transcript of National Results, 2014 -15 - Council for Aid to...

National Results, 2014 -15
cae | 215 Lexington Avenue, Floor 16 | New York, NY 10016 | [email protected] | (212) 217-0700 | @cwra_beat
Copyright © 2016 Council for Aid to Education

CWRA+ NATIONAL RESULTS, 2014-15
1
Contents INTRODUCTION ................................................................................................................................................... 2
METHODOLOGY .................................................................................................................................................. 2
THE INSTRUMENT ......................................................................................................................................... 2
INSTITUTIONAL AND STUDENT SAMPLE .................................................................................................. 3
GROWTH ESTIMATES .................................................................................................................................... 4
2014-15 CWRA+ RESULTS ................................................................................................................................ 4
INSTITUTION-LEVEL CWRA+ SCORES ....................................................................................................... 4
STUDENT-LEVEL CWRA+ SCORES ............................................................................................................. 5
MASTERY LEVELS .......................................................................................................................................... 6
SUBSCORES ................................................................................................................................................... 7
EFFECT SIZES ................................................................................................................................................ 8
CONCLUSION ....................................................................................................................................................... 9
REFERENCES .................................................................................................................................................... 12
APPENDIX A: LIST OF PARTICIPATING INSTITUTIONS, 2014-15 ................................................................. 13
APPENDIX B: CWRA+ MASTERY LEVELS ....................................................................................................... 15
APPENDIX C: CWRA+ PERFORMANCE TASK RUBRIC .................................................................................. 17
CWRA+ NATIONAL RESULTS, 2014-15
2
INTRODUCTION The College and Work Readiness Assessment (CWRA) was launched in 2006 as a high school version of the Collegiate Learning Assessment (CLA), a major initiative of CAE (the Council for Aid to Education). Since then, the CLA and CWRA have offered institutions a valuable measure of their contributions—or value added—to students’ attainment of higher-order thinking skills. The assessment requires students to analyze, evaluate, and synthesize information as they demonstrate their ability to think critically and solve problems. To date, hundreds of institutions and hundreds of thousands of students have participated in these testing programs. In 2013, CAE introduced CWRA+, an enhanced version of the assessment that includes new subscores, criterion-referenced Mastery Levels, and reliable information about performance at the student and institutional levels. Advancing beyond a growth-centered model, CWRA+ is designed to measure critical thinking and written communication—key higher-order skills that are valued by both secondary and higher educational institutions, as well as by employers. CWRA+ provides students with reliable evidence that they possess these skills and to what degree.
Higher-order skills are a necessity for navigating and excelling in today’s complex, new Knowledge Economy. Employers overwhelmingly report valuing employees who exhibit strong critical-thinking and written-communication skills (Hart Research Associates, 2013). Correspondingly, students who excel in the areas measured by CWRA+ have been shown to experience greater success in their immediate post-college careers (Arum & Roksa, 2014). CWRA+ enables schools to identify areas of strength and weakness so they can improve their teaching and learning processes and ultimately graduate students who are prepared to succeed in the collegiate arena. Concurrently, CWRA+ provides graduating students with the tools to stand out in a competitive college application market by highlighting key skills for academic and professional success. This report summarizes the performance of the 144 secondary institutions and 14,791 students who participated in the 2014-2015 academic year of the CWRA+.
METHODOLOGY THE INSTRUMENT CWRA+ includes two major components: the Performance Task (PT) and the Selected-Response Question (SRQ) section. The Performance Task presents students with a real-world scenario that requires a purposeful written response. Students are asked to address an issue, propose a solution to a problem, or recommend a course of action to resolve a conflict. Students are instructed to support their responses by using information provided in the CWRA+ Document Library. This repository contains a variety of reference materials, such as technical reports, data tables, newspaper articles, office memoranda, and emails. A full PT includes four to nine documents in its Document Library. Students have 60 minutes to complete this constructed-response task. Student responses to the PT are scored in three skill areas: Analysis and Problem Solving, Writing Effectiveness, and Writing Mechanics. Students receive subscores based on the CWRA+ rubric, which
range from 1 to 6, for each skill category based on key characteristics of their written responses. These characteristics are described in detail within the PT rubric, which is available on CAE’s website at www.cae.org/cwraptrubric. In the second section of the examination, students are asked to answer 25 Selected-Response Questions. Like the PT, the 25 SRQs require students to draw information from provided materials. Students have 30 minutes to complete this section of the assessment. SRQs are scored based on the number of correct responses that a student provides. Each of three question sets represents a skill area: Scientific and Quantitative Reasoning (10 questions), Critical Reading and Evaluation (10 questions), and Critique an Argument (5 questions). Because some question sets may be more difficult than others, the subscores for each category are adjusted to account for these differences and are reported on a common

CWRA+ NATIONAL RESULTS, 2014-15
3
scale. Score values range from approximately 200 to 800 for each SRQ section. To convert raw PT and SRQ scores to scale scores, CAE uses a linear transformation. This process creates a scaled-distribution of CWRA+ scores for students that have the same mean and standard deviation as the combined SAT Math and Critical
Reading scores (or converted ACT) of CWRA+ freshmen. This allows for clearer comparisons between test results as well as more efficient CWRA+ test results interpretation. In addition to receiving scores for each of the two sections of the assessment, students receive total scores, which are simply the average of the scaled section scores.
INSTITUTIONAL AND STUDENT SAMPLEParticipating schools are individually responsible for student sampling and recruitment. Guidance is available from CAE on strategies for achieving a representative sample. Schools are recommended to test at least 100 students, or 25% to 50% of the population size for each class level tested. Smaller high schools typically use a census sampling approach. Student-level demographic data suggest that schools are fairly successful at recruiting representative samples. In terms of self-reported race and ethnicity, CWRA+ students are representative of their peers nationally in terms of race/ethnicity (see Table 1A).
At the institutional level, the sample of participating institutions is more heavily represented by private schools (50%) than is the nation as a whole (24%). The high schools comprising the CWRA+ sample are, however, fairly representative of institutions within sectors. Exceptions to this representation include the percentage of the CWRA+ population of public schools that are eligible for Title I funding, which is less than half that of the national population of public high schools (18% and 38%, respectively), and school type; nearly all participating CWRA+ institutions (92% of both public and private schools) are regular schools, compared to 74% of public high schools and 79% of private high schools nationally. CWRA+ schools are also significantly larger, on average, than high schools nationally.
Table 1A. Student Sample Representativeness by Race/Ethnicity
NATION CWRA+
SCHOOL CHARACTERISTIC PUBLIC PRIVATE PUBLIC PRIVATE
ALL INSTITUTIONS 93% (100%) 7% (100%) 56% (100%) 44% (100%)
RACE/ ETHNICITY
American Indian / Alaska Native / Indigenous
1% (1%) 0% (0%) 1% (2%) 1% (<1%)
Asian (including Indian subcontinent and Philippines)
5% (5%) 0% (6%) 3% (6%) 6% (14%)
Native Hawaiian or other Pacific Islander
0% (0%) 0% (1%) <1% (<1%) <1% (<1%)
African-American / Black (including African and Caribbean), non-Hispanic
15% (16%) 1% (9%) 11% (19%) 3% (7%)
Hispanic or Latino 21% (23%) 1% (10%) 6% (11%) 2% (5%)
White (including Middle Eastern), non-Hispanic
49% (53%) 5% (71%) 30% (53%) 28% (64%)
Other / Decline to State 2% (2%) 0% (3%) 5% (9%) 4% (9%)
Percentages within sector are presented in parentheses. All other percentages are across all secondary students. Sources: The Elementary/Secondary Information System (ELSi), an NCES application that provides data from the Common Core of Data (CCD) and Private School Survey (PSS). Data in this table only include schools serving at least grades 9-12. Accessed April 8, 2015.

CWRA+ NATIONAL RESULTS, 2014-15
4
Table 1B. School Characteristics of the CWRA+ Institutional Sample
NATION CWRA+
SCHOOL CHARACTERISTIC PUBLIC PRIVATE PUBLIC PRIVATE
ALL INSTITUTIONS 76% (100%) 24% (100%) 50% (100%) 50% (100%)
CHARTER 6% (8%) -- 3% (7%) --
MAGNET 2% (3%) -- 4% (7%) --
TITLE I ELIGIBLE 38% (51%) -- 18% (36%) --
RELIGIOUS AFFILIATION
Non-Sectarian -- 7% (27%) -- 33% (65%)
Catholic -- 3% (14%) -- 3% (5%)
Other -- 14% (59%) -- 16% (32%)
SCHOOL TYPE
Regular 56% (74%) 19% (79%) 45% (92%) 46% (92%)
Career/Technical/Vocational 3% (4%) 0% (0%) 0% (0%) 0% (0%)
Montessori -- 0% (1%) -- 1% (2%)
Special Education 4% (5%) 2% (10%) 0% (0%) 0% (0%)
Special Program Emphasis -- 1% (3%) -- 2% (3%)
Alternative/Other 13% (18%) 2% (7%) 3% (6%) 1% (2%)
MEDIAN ENROLLMENT (GRADES 9–12) 222 42 795 313
MEAN PUPIL-TO-TEACHER RATIO 15:1 10:1 16:1 9:1
MEAN PERCENTAGE NON-WHITE STUDENTS 43% 29% 40% 26%
Percentages within sector are presented in parentheses. All other percentages are across all institutions. Sources: The Elementary/Secondary Information System (ELSi), an NCES application that provides data from the Common Core of Data (CCD) and Private School Survey (PSS). Data in this table only include schools serving at least grades 9-12. Because all schools did not report on every measure in the table, the averages and percentages may be based on slightly different denominators. Accessed January 3, 2014. GROWTH ESTIMATES To estimate growth in critical-thinking and written-communication skills across high school, CAE calculates effect sizes for participating schools. Effect sizes characterize the amount of growth in CWRA+ scores that is evident across classes. This is done by relating the performance of the freshman
class to that of the sophomore, junior, and senior classes. Effect sizes are calculated by subtracting the mean scores of the freshmen from the mean scores of the seniors, and dividing the result by the standard deviation of the freshmen scores. Effect sizes are reported in standard deviation units.

CWRA+ NATIONAL RESULTS, 2014-15
5
2014-15 CWRA+ RESULTS INSTITUTION-LEVEL CWRA+ SCORES The average institutional CWRA+ score for public schools that tested their freshmen in fall 2014 was 865, indicating basic mastery of the skills measured by CWRA+. Public schools testing seniors scored, on average, almost 60 points higher (922), with more than twice as many exiting students (24%) as entering students (10%) demonstrating accomplished mastery level performance in critical thinking and written communication.
Private institutions using CWRA+ tend to have more affluent students coming from well-educated families; advantages are apparent in the private institutions’ CWRA+ scores. The average institutional CWRA+ score for private schools testing their freshmen in fall 2014 was 1025, indicating proficient mastery of the skills measured by CWRA+. Private schools testing seniors scored, on average, 81 points higher (1106), with fewer than 20% of their graduating seniors lacking proficiency in critical-thinking and written-communication skills.
Geographically, CWRA+ public schools in the Northeast have slightly higher-performing freshmen and CWRA+ private schools in the Midwest have slightly higher-performing seniors than in other regions; though statistically significant, the differences in public school mean scores between the Northeast and other regions are not large (no
more than 51 points, on average). Alternatively, there is even less variation between regions in the private sector, with no significant differences and a mean difference of 11 between the Midwest and other regions. Table 2 summarizes differences in average institutional score by each of the previously discussed institutional characteristics.
TABLE 2. Average Senior CWRA+ Performance by Sector and School Characteristic, 2014-15 PUBLIC HIGH SCHOOLS PRIVATE HIGH SCHOOLS INSTITUTIONAL CHARACTERISTIC N Mean Score SD N Mean Score SD All Institutions a 49 922 105 63 1106 64 Region
(Northeast) b 2 1019 58 15 1114 64 Midwest 8 1013 91 5 1116 28 South 33 878 84 22 1098 46 West 6 1012 96 20 1103 86
a Table excludes one international high school for which relevant data were not available. b Reference categories in parentheses.
1025 1106
865 922
400
600
800
1000
1200
1400
1600
FRESHMEN SENIORS
CW
RA
+ S
CO
RE
Private High Schools
Public High Schools
FIGURE 1. Change in Average Institutional CWRA+ Score from Freshman to Senior Year, by Sector

CWRA+ NATIONAL RESULTS, 2014-15
6
STUDENT-LEVEL CWRA+ SCORES The average freshman who tested in the fall 2014 to spring 2015 administrative year had a CWRA+ score of 993, while the average senior scored 75 points higher (1068). As with the distribution of institutional scores, there is substantial variation in performance across students by certain demographic characteristics (see Table 3). While there does not appear to be any statistically significant difference between the average CWRA+ performance of males and females in public schools, there does appear to be a significant difference between the performance of males and females within the private sector (which appears to be about 20 points higher on average for females). Seniors whose primary language is English score higher within the public sector (on average, 13 points higher than those for whom English is not their primary
language), and that gap persists (64 points) within the sample of seniors taking CWRA+. CWRA+ results show an even larger performance gap across racial and ethnic groups. African American students scored on average nearly a full standard deviation below their White peers in both the public (880 and 1006) and private sectors (1057 and 1124). However, the difference between these groups is not statistically significant within the private sector. Parental education levels are similarly associated with CWRA+ performance. Each additional level of education attained by a student’s parents is reflected by an associated increase of about 50 points in the average scores in both the public and private sectors.
TABLE 3. Senior CWRA+ Performance by Sector and Demographic Characteristic, 2014-15 PUBLIC HIGH SCHOOLS PRIVATE HIGH SCHOOLS DEMOGRAPHIC CHARACTERISTIC* N Mean Score SD N Mean Score SD All Seniors 2,179 992 183 4,154 1108 160 Transfer Status
Transfer Student 113 1007 183 363 1062 162 (Non-Transfer Student)a 2,066 991 183 3,791 1113 159
Gender Male 990 976 186 1,988 1100 165 (Female) 1,110 1008 178 1,989 1120 152 Decline to State 71 975 187 173 1065 167
Primary Language (English) 1,904 994 184 3,612 1117 157 Other 267 981 173 538 1053 170
Race/Ethnicity American Indian / Alaska Native /
Indigenous 24 930 152 39 1022 172
Asian [Including Indian Subcontinent and Philippines]
118 1127 168 561 1095 161
Native Hawaiian or Other Pacific Islander
1 1029 - 28 1002 168
African-American / Black [Including African and Caribbean], Non-Hispanic
237 880 156 245 1058 143
Hispanic or Latino 306 976 166 205 1100 152 (White [Including Middle Eastern], Non-
Hispanic) 1,324 1006 180 2,661 1124 156
Other 70 943 207 151 1048 196 Decline to State 91 1024 184 260 1090 162
Parent Education Less Than High School 167 879 141 47 961 192 High School 444 902 159 233 1009 168 Some College 461 964 164 292 1062 151 Bachelor’s Degree 514 1028 172 1,301 1097 155 (Graduate or Post-Graduate Degree) 530 1101 171 2,229 1137 153
a Reference categories in parentheses. * Table includes observations with missing demographic information.

CWRA+ NATIONAL RESULTS, 2014-15
7
MASTERY LEVELS CWRA+ Mastery Levels contextualize CWRA+ scores by interpreting test results in relation to the qualities exhibited by examinees. Each Mastery Level corresponds to specific evidence of critical-thinking and written-communication skills (see Appendix B for detailed information about each Mastery Level). The 2014-2015 academic year is the first administrative CWRA+ year in which five mastery levels have been implemented: Below Basic, Basic, Proficient, Accomplished, and Advanced. The newest Mastery Level, Accomplished, was added to further distinguish levels of proficiency; the Accomplished Mastery Level highlights students who are highly proficient but not quite at the Advanced level in terms of skills measured by the CWRA+. The full standard-setting report can be found at http://cae.org/images/uploads/pdf/cwra_ss.pdf. More than a third (42%) of the exiting public high school students tested during the 2014-2015 academic year were non-proficient in CWRA+ skills—scoring at or below the Basic Mastery Level. Another 19% scored at the Proficient Mastery Level, with only 4% of public school seniors exhibiting Advanced Mastery of critical-thinking and written-communication skills, as measured by CWRA+. The average exiting public school senior (with a mean score of 992) exhibits Accomplished Level Mastery of CWRA+ skills. In order to score at the Basic Mastery Level, students must make a reasonable attempt to analyze the details of the Performance Task and demonstrate that they are able to communicate in a manner that is understandable to the reader. Students with Basic Mastery also show some judgment about the quality of evidence provided in the Document Library.
In addition, students scoring at the Basic Mastery Level know the difference between correlation and causality, and they can read and interpret a bar graph—but not necessarily a scatterplot or regression analysis. Tables may be out of reach for Basic Mastery Level students, as well. Across private school seniors testing in 2014-15, more than half (71%) were proficient in CWRA+ skills—scoring either at the Proficient or Advanced Mastery Level. A total of 18% scored at the Basic Mastery Level, while only 1% of seniors scored at the Below Basic Mastery Level. The average exiting private school senior (with a mean score of 1108) exhibits Accomplished Level Mastery of CWRA+ skills. Students scoring at the Proficient Mastery Level have shown that they are able to extract the major relevant pieces of evidence provided in the Document Library and develop a cohesive argument and analysis of the Performance Task. Proficient Mastery Level students are able to distinguish the quality of evidence in these documents and express the appropriate level of conviction in their conclusion given the provided evidence. Additionally, Proficient Mastery Level students are able to suggest additional research or consider counterarguments. Students at this level can correctly identify logical fallacies, accurately interpret quantitative evidence, and distinguish the validity of evidence and its purpose. Likewise, they have the ability to determine the truth and validity of an argument. Students at this level also recognize when a graph or table is applicable to an argument.

CWRA+ NATIONAL RESULTS, 2014-15
8
SUBSCORES Student responses to the Performance Task (PT) are scored in three skill areas: Analysis and Problem Solving, Writing Effectiveness, and Writing Mechanics. These subscores are assigned values ranging from 1 to 6, with those values determined according to specific response characteristics outlined in the CWRA+ Scoring Rubric (see Appendix C). Subscores for the Selected-Response Question (SRQ) section represent three additional skill areas: Scientific and Quantitative Reasoning (10 questions), Critical Reading and Evaluation (10 questions), and Critique an Argument (5 questions). Because some question sets may be more difficult than others, the subscores for each category are adjusted to account for these differences and reported on a common scale. Score values range from approximately 200 to 800 for each SRQ section.
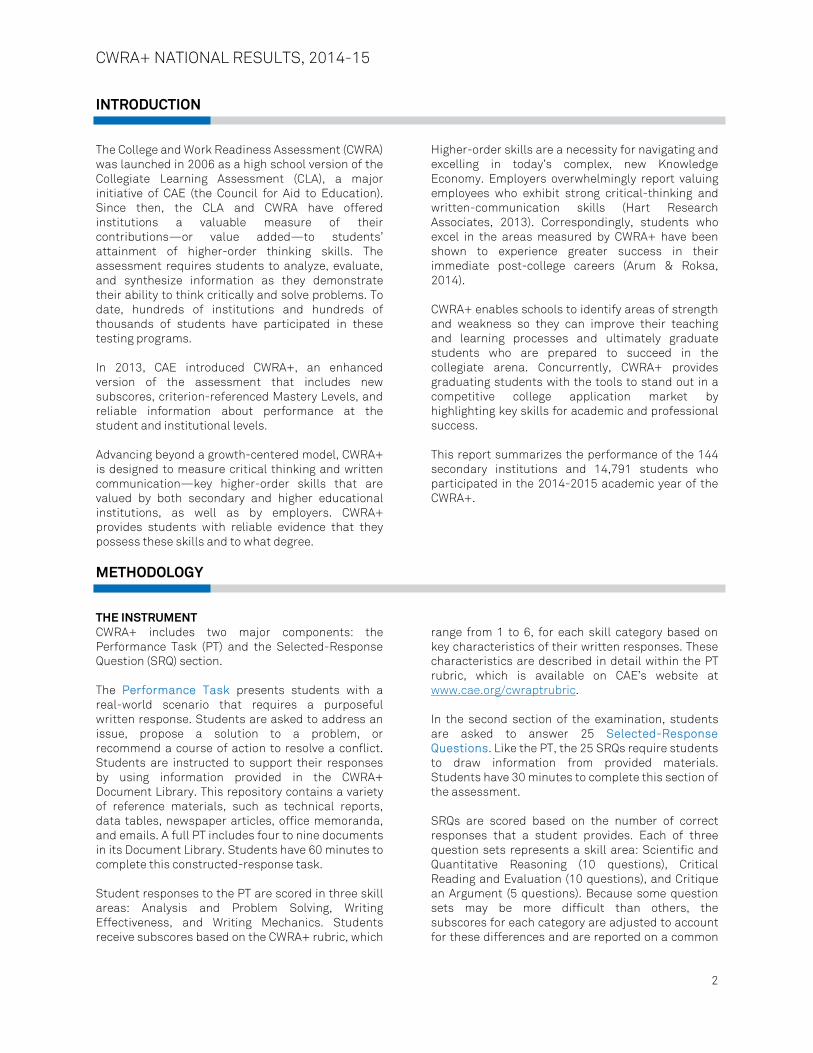
For the PT, the average institution testing freshmen received a score of 3 for Analysis and Problem Solving, 3.1 for Writing Effectiveness, and 3.4 for Writing Mechanics. Some improvement is observed when considering the average subscores across institutions testing seniors, though these average scores fail to exceed more than three-tenths of a point above those of the average institutional freshman subscores. On the SRQs, institutions testing freshmen averaged scores of 501 across each of the three subscore categories, with scores improving to 545, 539, and 536, respectively, for Scientific and Quantitative Reasoning, Critical Reading and Evaluation, and Critique an Argument.
6%
36%
46%
1%
18%
78%
0%
20%
40%
60%
80%
100%
Below Basic Basic Proficient or Higher
FIGURE 2. Senior Distribution of CWRA+ Mastery Levels
Public High Schools
Private High Schools

CWRA+ NATIONAL RESULTS, 2014-15
9
Effect Sizes EFFECT SIZES Effect sizes characterize the amount of growth in CWRA+ scores that is evident across classes, in standard deviation units. The effect size for the average CWRA+ institution in 2014-15 was 0.55, which represents approximately 0.55 standard deviations of improvement from freshman to senior
year. These scores are normally distributed, though there are a handful of institutions with exceptionally high effect sizes. The typical institution exhibited an effect size between 0.08 and 1.02, which indicates fairly wide variation in the amount of growth seen across these schools in 2014-15 (see Figure 4).
476 476 471 494 501 496
200
300
400
500
600
700
800
Scientific &Quantitative Reasoning
Critical Reading& Evaluation
Critique an Argument
ME
AN
SU
BS
CO
RE
VA
LUE
SELECTED-RESPONSE QUESTIONS
3.0 3.0 3.4 3.2 3.3
3.6
1
2
3
4
5
6
Analysis &Problem Solving
WritingEffectiveness
WritingMechanics
ME
AN
SU
BS
CO
RE
VA
LUE
PERFORMANCE TASK
Freshmen Seniors
FIGURE 3. Average CWRA+ Subscores Across Institutions

CWRA+ NATIONAL RESULTS, 2014-15
10
CONCLUSION The comparison between private and public institutions of secondary education shows that the current sector demographics of CWRA+ institutions are not representative of the national sector demographics. While public schools make up 76% of the nation’s institutions of secondary education, 50% of the current CWRA+ institution sector demographic is made up of public schools. Where the national percentage of private schools falls near
24%, the current CWRA+ institution sector demographic consists of 50% private schools. However, while the results of this summary report may not necessarily be indicative of what CWRA+ results may look like across the entire nation, as the institution population grows, keeping track of and publishing the results only lends to paint a clearer picture of where secondary institutions lie within the
0
5
10
15
20
25
-0.75 -0.25 0.25 0.75 1.25 1.75 2.25 2.75
FR
EQ
UE
NC
Y
EFFECT SIZE
FIGURE 4. Distribution of Institutional Effect Sizes

CWRA+ NATIONAL RESULTS, 2014-15
11
United States in terms of students’ critical-thinking abilities. Within the current CWRA+ sample there are clear and distinct differences both across all institutions and within sectors. Also, within each sector, when broken down into different groups, there are comparisons that can be made which also lend insights into where there are areas of weakness and strength in terms of critical-thinking ability. By using our calculated estimates of growth, we also see that a majority of institutions across all sectors have demonstrated growth in this area over time and that
some groups have shown more or less growth than others. Despite differences between schools, the overwhelming majority of the current national sample shows that the average student in American institutions of secondary education displays a proficient to accomplished mastery of critical-thinking skills from the time the student enters to the time he or she leaves. This highlights not only the effectiveness of secondary education but also how crucial it is for developing these skills.

CWRA+ NATIONAL RESULTS, 2014-15
12
REFERENCES Arum, R. and J. Roksa (2014). Aspiring adults adrift: Tentative transitions of college graduates. Chicago, IL, The University of Chicago Press.

CWRA+ NATIONAL RESULTS, 2014-15
13
APPENDIX A: LIST OF PARTICIPATING INSTITUTIONS, 2014-15 The schools listed below in alphabetical order constitute the sample of institutions testing CWRA+ students that have agreed to be listed. To view a list of currently participating schools, please visit www.cae.org/cwraparticipants. CWRA+ Schools
Abington Friends School Academy of Global Studies at Winton Woods High School Alexander Dawson School All Saints' Academy American Canyon High School Anson New Technology High School Areté Preparatory Academy Asheville School Barrie School Bayside High School Bishop Brady High School Bosque School Brimmer and May School Brooks School Catalina Foothills High School City of Medicine Academy Collegiate School Colorado Academy Colorado Rocky Mountain School Cross County High School Crystal Springs Uplands School Culver Academies Currey Ingram Academy Da Vinci Charter Academy Drew Charter School Drew School Eagle Rock School Eagle Tech Academy Emma Willard Emmetsburg High School First Colonial High School Floyd Kellam High School Fort Dodge Senior High School Fountain Valley School of Colorado Frank W. Cox High School Friends School of Baltimore Gilmour Academy GRAD Academy Memphis Green Run High School Greensboro Day School Hebron Academy Heritage Hall Hillside New Tech High School Holland Hall Illinois Mathematics and Science Academy Jefferson Forest High School Kempsville High School Kimball Union Academy Kirtland High School Lakeview Academy Landstown High School

CWRA+ NATIONAL RESULTS, 2014-15
14
Le Jardin Academy Liberty High School Logan View Public Schools Los Angeles School of Global Studies Maryknoll School Math, Engineering, Technology, and Science Academy McKinley Academy Mead High School Menlo School Meridian Early College High School Metairie Park Country Day School Mid-Pacific Institute Millennium Brooklyn High School Moorestown Friends School Moses Brown School Mount Vernon Presbyterian School Mt. Spokane High School Napa High School New Tech at Ruston New Technology High School North Shore Country Day School Ocean Lakes High School Palisades High School Parish Episcopal School Princess Anne High School Ramsey High School Reading Memorial High School Renaissance Academy Rising Tide Charter Public School Riverdale Country School Riverpoint Academy Roland Park Country School Sacramento New Technology High School Sacred Hearts Academy Saint Peter High School Salem Academy Sandia Preparatory School Seacrest Country Day School Severn School Shady Side Academy Sioux Falls New Technology High School Sonoma Academy South Hamilton High School St. Andrew's School St. Anne's Belfield School St. Christopher's School St. George's Independent School St. George's School St. Gregory College Preparatory School St. Luke's School St. Margaret's Episcopal School St. Mark's School Staunton River High School Stevenson School Stuart Country Day School Tallwood High School Tarbut V'Torah Tech Valley High School Tesseract School

CWRA+ NATIONAL RESULTS, 2014-15
15
The Bishop Strachan School The Chapin School The Colorado Springs School The Haverford School The Hotchkiss School The Hun School of Princeton The Lawrenceville School The Lovett School The Salisbury School The Taft School The Webb School Tilton School Traverse Bay Area Intermediate School District Trinity School of Durham and Chapel Hill Trinity School of Midland Upper Arlington High School Viking New Tech Vintage High School Wardlaw-Hartridge School Warren New Tech High School Warrior Tech Academy Warwick Valley High School West Bend Mallard High School Westminster School Westtown School Wildwood School Windward School Worcester Academy York School APPENDIX B: CWRA+ MASTERY LEVELS SETTING STANDARDS FOR CWRA+ Following the creation of CWRA+, a standard-setting study was conducted to establish fair and defensible levels of mastery for the new and improved assessment. This formal study was held at CAE headquarters in New York City on December 13, 2013. Fifteen distinguished panelists, representing a variety of K-12 and higher education sectors, were invited to participate. The table below lists each panelist. During the standard-setting study, panelists defined descriptions of three mastery levels: Basic, Proficient, and Advanced. Panelists returned in November 2014 to define a fourth level of mastery—Accomplished—using the same methods. Their discussions were based on the CWRA+ scoring rubric
as well as the knowledge, skills, and abilities required to perform well on CWRA+. The purpose of this activity was to develop consensus among the judges regarding each Mastery Level and to create a narrative profile of the knowledge, skills, and abilities necessary for CWRA+ students. During subsequent rating activities, panelists relied on these consensus profiles to make item performance estimates. Judges broke into three groups of four, and each group evaluated characteristics related to one Mastery Level. The groups then reconvened and reported their findings to the group at large so they could form final consensus on student performance at each of the three Mastery Levels.
CWRA+ Standard-Setting Study Participant List and Institutional Affiliation
PARTICIPANT INSTITUTION
Mark Battersby Capilano University (Canada)
Ray Bryant Warwick Valley School District
Paul Carney Minnesota State Technical and Community College

CWRA+ NATIONAL RESULTS, 2014-15
16
Peter Gow Beaver Country Day School
John Gulla E.E. Ford Foundation
Bonnie Hain Baltimore County School District
Jonathan Martin Independent Consultant
Syna Morgan Douglas County School District
Andrew Niblock Greenwich Country Day School
Dominic Randolph Riverdale Country School
Drew Schrader New Tech Network
Tyler Thigpen Mount Vernon Presbyterian School
Amada Torres National Association of Independent Schools
Todd Wirt Wake County School District
Doug Wren Virginia Beach School District CWRA+ MASTERY LEVELS CAE uses outcomes from the 2013 standard-setting study to distinguish between CWRA+ students with varying knowledge, skills, and abilities as measured by the assessment. On individual reports, Mastery Levels are determined by students’ Total CWRA+ scores. On institutional reports, they are determined by each class level’s mean Total CWRA+ score.
Institutions should not use mastery levels for purposes other than the interpretation of test results. If an institution wishes to use the attainment of CWRA+ mastery levels as part of a graduation requirement or the basis for college entrance decisions, the institution should conduct a separate standard-setting study with this specific purpose in mind.
The following table summarizes each level of mastery and provides a description of students below the Basic level of mastery.
Student Levels of Mastery Profiles
LEVEL OF MASTERY PROFILE
BELOW BASIC Students who are below basic make severe errors that are frequent and often interfere with meaning. Students write simple sentences and some non-sentences.
BASIC Students at the basic level create responses that state or imply a decision, conclusion, or position and provide some analysis that may be minimal, inaccurate, or irrelevant. A basic student would provide an argument with some supporting information from sources and an attempt to cohesively organize that argument. Yet, the elaboration is limited and the organization lacks sufficient cohesion and clarity. For the basic student, severe errors are infrequent, but there are minor errors that sometimes interfere with meaning. The basic student also writes sentences that are similar in structure and length, with an overreliance on sentences with simple structure. The basic student draws obvious inferences from sources, rarely recognizes relevant information, and takes all information at face value.
Analysis and Problem Solving and Writing Effectiveness are more important than Writing Mechanics in making the cut score decision.
PROFICIENT Students at the proficient level have the ability to make inferences from the document and provide some support for their position but may omit some evidence.

CWRA+ NATIONAL RESULTS, 2014-15
17
They address most elements of the task although sometimes tangentially. Students make a few accurate claims about the quality of evidence while citing the evidence provided in the documents. However, their responses may have a few misinterpretations of the information and evidence provided in the documents. The students at this level are writing generally understandable sentences with minor errors and use the conventions of standard written English. The student responses are communicated in a way that is readily comprehensible. There is an evaluation the relative value of common logical strategies (e.g., bad cause and effect). They extract meaningful information and recognize utility from basic graphs and are able to draw conclusions from them. There is an understanding of correlation versus causality as well as a basic understanding of the design of the experiment. Proficient students will know what makes a credible scientific claim and provide an appropriate critical evaluation of sources.
ACCOMPLISHED Students at the accomplished level of mastery have the ability to make inferences from the document and provide sufficient evidence (based on multiple sources) to support their claim. This would include generating accurate interpretations of the document library, developing coherent arguments using much of the information provided in the documents, and potentially identifying, but not fully developing, potential future steps and the need for additional research. They are also able to identify and address bias when making inferences or drawing conclusions, assess the relevancy of the qualitative and quantitative data (e.g., read and understand a graph and identify limitations and shortcomings; demonstrate an understanding that correlation does not necessarily imply causality), distinguish credible versus non-credible sources of information, and generate counter-claims. Accomplished students state a decision/recommendation/position and develop their argument based upon the identified information; however, they fall short of using evidence to fully support and leverage their argument. They have the ability to identify and extend the impact of the supporting versus counter-evidence and their broader implications. Accomplished students write responses that are cohesive, organized, and elaborated effectively. The student recognizes the correct audience and writes in a way that demonstrates understanding of the intended audience. The sources (documents) of evidence in support of students’ claims can be identified. The student’s intent is clear, and the organization or the argument and understanding it represents is accurate and logical. There may be some minor spelling and syntax errors, but the sentences are generally well constructed, with varying and sometimes advanced vocabulary and structure, communicating a level of sophistication in the response.
ADVANCED Students at the advanced level discern the merit of information and evaluate the strength of arguments, including identifying bias. They demonstrate a thorough evaluation of the evidence by making connections between the information found in the documents, potentially identifying patterns, and if applicable, refuting false or weak claims, which ultimately informs one’s response. They clarify potential further steps, either a next step moving forward or additional research that is needed or would be helpful. In order to strengthen their own arguments, students at the advanced level also address counter-arguments and demonstrate the weaknesses of the counter-arguments and/or the ways in which they are less compelling. Advanced students provide a decision/recommendation with thorough support of the argument articulated in an effective way. The evidence is thoroughly examined, including addressing and navigating contradictory responses, and the interpretation of the documents is comprehensive. They fully respond to the prompt.

CWRA+ NATIONAL RESULTS, 2014-15
18
Student writing is precise, purposeful, uses a varied vocabulary, sentence structure and length, and is free—or almost entirely free—from mechanical error. Their responses are organized in a fluid, coherent, and engaging way. It is easy to follow the student’s argument, which also has the correct audience in mind and appropriately addresses them. They use the correct genre to deliver the response, whether it is a blog response, report, memo, speech, etc. Students should be able to consistently reason analytically and solve problems and be able to understand the nuances when integrating information across multiple sources.

CWRA+ NATIONAL RESULTS, 2014-15
19
APPENDIX C: CWRA+ PERFORMANCE TASK RUBRIC
SCALE DESCRIPTION 1 2
ANALYSIS AND PROBLEM SOLVING
Making a logical decision or conclusion (or taking a position) and supporting it by utilizing appropriate information (facts, ideas, computed values, or salient features) from the Document Library
May state or imply a decision/conclusion/position
Provides minimal analysis as support (e.g., briefly addresses only one idea from one document) or analysis is entirely inaccurate, illogical, unreliable, or unconnected to the decision/conclusion/position
States or implies a decision/conclusion/position
Provides analysis that addresses a few ideas as support, some of which are inaccurate, illogical, unreliable, or unconnected to the decision/conclusion/position
WRITING EFFECTIVENESS
Constructing organized and logically cohesive arguments. Strengthening the writer's position by providing elaboration on facts or ideas (e.g., explaining how evidence bears on the problem, providing examples, and emphasizing especially convincing evidence)
Does not develop convincing arguments; writing may be disorganized and confusing
Does not provide elaboration on facts or ideas
Provides limited, invalid, over-stated, or very unclear arguments; may present information in a disorganized fashion or undermine own points
Any elaboration on facts or ideas tends to be vague, irrelevant, inaccurate, or unreliable (e.g., based entirely on writer's opinion); sources of information are often unclear
WRITING MECHANICS
Demonstrating facility with the conventions of standard written English (agreement, tense, capitalization, punctuation, and spelling) and control of the English language, including syntax (sentence structure) and diction (word choice and usage)
Demonstrates minimal control of grammatical conventions with many errors that make the response difficult to read or provides insufficient evidence to judge
Writes sentences that are repetitive or incomplete, and some are difficult to understand
Uses simple vocabulary, and some vocabulary is used inaccurately or in a way that makes meaning unclear
Demonstrates poor control of grammatical conventions with frequent minor errors and some severe errors
Consistently writes sentences with similar structure and length, and some may be difficult to understand
Uses simple vocabulary, and some vocabulary may be used inaccurately or in a way that makes meaning unclear

CWRA+ NATIONAL RESULTS, 2014-15
20
3 4 5 6 States or implies a
decision/conclusion/position Provides some valid support,
but omits or misrepresents critical information, suggesting only superficial analysis and partial comprehension of the documents
May not account for contradictory information (if applicable)
States an explicit decision/conclusion/position
Provides valid support that addresses multiple pieces of relevant and credible information in a manner that demonstrates adequate analysis and comprehension of the documents; some information is omitted
May attempt to address contradictory information or alternative decisions/conclusions/positions (if applicable)
States an explicit decision/conclusion/position
Provides strong support that addresses much of the relevant and credible information, in a manner that demonstrates very good analysis and comprehension of the documents
Refutes contradictory information or alternative decisions/conclusions/positions (if applicable)
States an explicit decision/conclusion/position
Provides comprehensive support, including nearly all the relevant and credible information, in a manner that demonstrates outstanding analysis and comprehension of the documents
Thoroughly refutes contradictory evidence or alternative decisions/conclusions/positions (if applicable)
Provides limited or somewhat unclear arguments. Presents relevant information in each response, but that information is not woven into arguments
Provides elaboration on facts or ideas a few times, some of which is valid; sources of information are sometimes unclear
Organizes response in a way that makes the writer's arguments and logic of those arguments apparent but not obvious
Provides valid elaboration on facts or ideas several times and cites sources of information
Organizes response in a logically cohesive way that makes it fairly easy to follow the writer's arguments
Provides valid elaboration on facts or ideas related to each argument and cites sources of information
Organizes response in a logically cohesive way that makes it very easy to follow the writer's arguments
Provides valid and comprehensive elaboration on facts or ideas related to each argument and clearly cites sources of information
Demonstrates fair control of grammatical conventions with frequent minor errors
Writes sentences that read naturally but tend to have similar structure and length
Uses vocabulary that communicates ideas adequately but lacks variety
Demonstrates good control of grammatical conventions with few errors
Writes well-constructed sentences with some varied structure and length
Uses vocabulary that clearly communicates ideas but lacks variety
Demonstrates very good control of grammatical conventions
Consistently writes well-constructed sentences with varied structure and length
Uses varied and sometimes advanced vocabulary that effectively communicates ideas
Demonstrates outstanding control of grammatical conventions
Consistently writes well-constructed complex sentences with varied structure and length
Displays adept use of vocabulary that is precise, advanced, and varied