
National Report on Human Exposure to Environmental Chemicals · Toxicology and Health-Risk...
72
National Report on Human Exposure to Environmental Chemicals Centers for Disease Control and Prevention Atlanta, Georgia March 2001 TM
Transcript of National Report on Human Exposure to Environmental Chemicals · Toxicology and Health-Risk...

National Report on Human Exposureto Environmental Chemicals
Centers for Disease Control and Prevention
Atlanta, Georgia
March 2001
TM

National Report on Human Exposureto Environmental Chemicals
Centers for Disease Control and Prevention
March 2001
Contents
Executive Summary . . . . . . . . . . . . . . . . . . . . . . . . . . . . . . . . . . . . . . . . . . . . . . . . . . . . . . . . . . . . . i-viii
Introduction . . . . . . . . . . . . . . . . . . . . . . . . . . . . . . . . . . . . . . . . . . . . . . . . . . . . . . . . . . . . . . . . . . . . . . 1
Data Sources . . . . . . . . . . . . . . . . . . . . . . . . . . . . . . . . . . . . . . . . . . . . . . . . . . . . . . . . . . . . . . . . . . . . . 5
Major Findings . . . . . . . . . . . . . . . . . . . . . . . . . . . . . . . . . . . . . . . . . . . . . . . . . . . . . . . . . . . . . . . . . . . 7
Toxicology and Health-Risk Information . . . . . . . . . . . . . . . . . . . . . . . . . . . . . . . . . . . . . . . . . . . . . . . 11
Results By Chemical Group . . . . . . . . . . . . . . . . . . . . . . . . . . . . . . . . . . . . . . . . . . . . . . . . . . . . . . . . . 15Metals . . . . . . . . . . . . . . . . . . . . . . . . . . . . . . . . . . . . . . . . . . . . . . . . . . . . . . . . . . . . . . . . . . . . . 15
Lead . . . . . . . . . . . . . . . . . . . . . . . . . . . . . . . . . . . . . . . . . . . . . . . . . . . . . . . . . . . . . . . . . . . . 15Mercury . . . . . . . . . . . . . . . . . . . . . . . . . . . . . . . . . . . . . . . . . . . . . . . . . . . . . . . . . . . . . . . . . 17Cadmium . . . . . . . . . . . . . . . . . . . . . . . . . . . . . . . . . . . . . . . . . . . . . . . . . . . . . . . . . . . . . . . . 19Cobalt . . . . . . . . . . . . . . . . . . . . . . . . . . . . . . . . . . . . . . . . . . . . . . . . . . . . . . . . . . . . . . . . . . . 21Uranium . . . . . . . . . . . . . . . . . . . . . . . . . . . . . . . . . . . . . . . . . . . . . . . . . . . . . . . . . . . . . . . . . 22Antimony . . . . . . . . . . . . . . . . . . . . . . . . . . . . . . . . . . . . . . . . . . . . . . . . . . . . . . . . . . . . . . . . 23Barium . . . . . . . . . . . . . . . . . . . . . . . . . . . . . . . . . . . . . . . . . . . . . . . . . . . . . . . . . . . . . . . . . . 24Beryllium . . . . . . . . . . . . . . . . . . . . . . . . . . . . . . . . . . . . . . . . . . . . . . . . . . . . . . . . . . . . . . . . 25Cesium . . . . . . . . . . . . . . . . . . . . . . . . . . . . . . . . . . . . . . . . . . . . . . . . . . . . . . . . . . . . . . . . . . 26Molybdenum . . . . . . . . . . . . . . . . . . . . . . . . . . . . . . . . . . . . . . . . . . . . . . . . . . . . . . . . . . . . . . 27Platinum . . . . . . . . . . . . . . . . . . . . . . . . . . . . . . . . . . . . . . . . . . . . . . . . . . . . . . . . . . . . . . . . 28Thallium . . . . . . . . . . . . . . . . . . . . . . . . . . . . . . . . . . . . . . . . . . . . . . . . . . . . . . . . . . . . . . . . 29Tungsten . . . . . . . . . . . . . . . . . . . . . . . . . . . . . . . . . . . . . . . . . . . . . . . . . . . . . . . . . . . . . . . . . 30
Tobacco Smoke . . . . . . . . . . . . . . . . . . . . . . . . . . . . . . . . . . . . . . . . . . . . . . . . . . . . . . . . . . . . . . 33Cotinine . . . . . . . . . . . . . . . . . . . . . . . . . . . . . . . . . . . . . . . . . . . . . . . . . . . . . . . . . . . . . . . . . 33
Organophosphate Pesticides . . . . . . . . . . . . . . . . . . . . . . . . . . . . . . . . . . . . . . . . . . . . . . . . . . . . 35Dimethylphosphate . . . . . . . . . . . . . . . . . . . . . . . . . . . . . . . . . . . . . . . . . . . . . . . . . . . . . . . . . 37Dimethylthiophosphate . . . . . . . . . . . . . . . . . . . . . . . . . . . . . . . . . . . . . . . . . . . . . . . . . . . . . . 38Dimethyldithiophosphate . . . . . . . . . . . . . . . . . . . . . . . . . . . . . . . . . . . . . . . . . . . . . . . . . . . . 38Diethylphosphate . . . . . . . . . . . . . . . . . . . . . . . . . . . . . . . . . . . . . . . . . . . . . . . . . . . . . . . . . . . 39Diethylthiophosphate . . . . . . . . . . . . . . . . . . . . . . . . . . . . . . . . . . . . . . . . . . . . . . . . . . . . . . . . 39Diethyldithiophosphate . . . . . . . . . . . . . . . . . . . . . . . . . . . . . . . . . . . . . . . . . . . . . . . . . . . . . . 40
Phthalates . . . . . . . . . . . . . . . . . . . . . . . . . . . . . . . . . . . . . . . . . . . . . . . . . . . . . . . . . . . . . . . . . . 41Mono-ethyl Phthalate . . . . . . . . . . . . . . . . . . . . . . . . . . . . . . . . . . . . . . . . . . . . . . . . . . . . . . . 42Mono-butyl Phthalate . . . . . . . . . . . . . . . . . . . . . . . . . . . . . . . . . . . . . . . . . . . . . . . . . . . . . . . 42Mono-benzyl Phthalate . . . . . . . . . . . . . . . . . . . . . . . . . . . . . . . . . . . . . . . . . . . . . . . . . . . . . . 43Mono-cyclohexyl Phthalate . . . . . . . . . . . . . . . . . . . . . . . . . . . . . . . . . . . . . . . . . . . . . . . . . . . 44Mono-2-ethylhexyl Phthalate . . . . . . . . . . . . . . . . . . . . . . . . . . . . . . . . . . . . . . . . . . . . . . . . . 44Mono-n-octyl Phthalate . . . . . . . . . . . . . . . . . . . . . . . . . . . . . . . . . . . . . . . . . . . . . . . . . . . . . 45Mono-isononyl Phthalate . . . . . . . . . . . . . . . . . . . . . . . . . . . . . . . . . . . . . . . . . . . . . . . 46
References . . . . . . . . . . . . . . . . . . . . . . . . . . . . . . . . . . . . . . . . . . . . . . . . . . . . . . . . . . . . . . . . . . . . . . 47References for Analytical Methods . . . . . . . . . . . . . . . . . . . . . . . . . . . . . . . . . . . . . . . . . . . . . . . . . . . . 49
Glossary . . . . . . . . . . . . . . . . . . . . . . . . . . . . . . . . . . . . . . . . . . . . . . . . . . . . . . . . . . . . . . . . . . . . . . . 51

Executive Summary
Introduction
The National Report on Human Exposure to Environmental Chemicals is a new publication thatprovides an ongoing assessment of the exposure of the U.S. population to environmentalchemicals using biomonitoring. For this Report, an environmental chemical means a chemicalcompound or chemical element present in air, water, soil, dust, food, or other environmentalmedia. Biomonitoring is the assessment of human exposure to chemicals by measuring thechemicals or their metabolites (i.e., breakdown products) in human specimens, such as blood orurine.
The Report provides exposure information about people participating in an ongoing nationalsurvey of the general U.S. population— the National Health and Nutrition Examination Survey(NHANES). The survey is conducted by the National Center for Health Statistics of the Centersfor Disease Control and Prevention (CDC). This survey is unique in its ability to examine publichealth issues that can best be addressed through physical and laboratory examinations of the U.S.population. The first release of the Report is restricted to general U.S. population data for theyear 1999 from NHANES.
This first Report provides information about levels of 27 environmental chemicals measured in theU.S. population. These chemicals include metals, such as lead, mercury, and uranium;organophosphate pesticide metabolites; phthalate metabolites; and cotinine, a marker of exposureto tobacco smoke. Tables on the following pages summarize results of CDC’s EnvironmentalHealth Laboratory measurements.
Public Health Uses of the Report
The overall purpose of the Report is to provide unique exposure information to scientists,physicians, and health officials to help prevent disease that results from exposure to environmentalchemicals. Specific uses of information contained in the Report are discussed elsewhere in thisdocument.
Interpreting Data Contained in the Report
This first report presents data for the general U.S. population for 1999 from CDC’s NHANES.Because the sample size in any one year of NHANES is relatively small and for 1999 the surveywas conducted in only 12 locations across the country, and because most analyses wereconducted in subsamples of the population, more data will be needed to confirm these findingsand to allow more detailed analysis to describe exposure levels in population subgroups.
Just because people have an environmental chemical in their blood or urine does not mean that thechemical causes disease. Advances in analytical methods allow us to measure low levels ofenvironmental chemicals in people, but studies of varying exposure levels and health effects areneeded to determine which blood or urine levels result in disease. These studies must also

ii
consider other factors such as duration of exposure.
The Report will contain new data each year. Next year, CDC will combine the 1999 and 2000data from NHANES to provide updated national estimates. In the future, the Report will alsoinclude data from other large exposure studies and studies of exposure of special-populationgroups within the United States.
Major Findings of the Report
First-time information about exposure levels for the U.S. populationThe 1999 Report provides measures of exposure for levels of 27 chemicals in the U.S. populationthat are based on blood and urine samples obtained from people participating in NHANES 1999.For three chemicals— lead, cadmium, and cotinine— CDC has previously assessed thepopulation’s exposure through NHANES, and this Report provides new data for the 1999calendar year. The Report provides information for the first time about the U.S. population’sexposure to 24 additional environmental chemicals (metals, organophosphate pesticides, andphthalates). Because the sample size in one year of NHANES is relatively small and because the1999 survey was conducted only in 12 locations across the country, data from additional years ofthe survey will be needed to confirm these findings.
Reference range values for physicians and health researchersPhysicians use “normal”ranges for laboratory results to determine whether their patients have highor low values that would indicate a health problem. These ranges are obtained from people whoare generally healthy. In the Report, CDC determined reference ranges for 24 environmentalchemicals from a group of people not known to have any specific exposure to the chemicalsbeyond that experienced in the general population. Sometimes these reference ranges are referredto as “background-exposure levels.”
Reference ranges are extremely helpful to physicians and health researchers because levels abovethe reference range usually indicate exposure to a particular source. For example, if a physicianwas concerned about a patient’s potential exposure to cadmium and measured a cadmium level inthe patient’s urine, the results could be compared with the population reference range in theReport. A cadmium level similar to those found in the Report would indicate exposure nodifferent from those levels found in the general population, and a level much higher than thosefound in the Report would indicate that there may have been an unusual exposure to cadmiumworthy of further investigation.
Decline in blood lead levels among children since 1991-1994Since 1976, CDC has measured blood lead levels as part of NHANES. Results presented in theReport for 1999 show that the geometric mean blood lead level for children aged 1-5 years hasdecreased to 2.0 micrograms per deciliter (µg/dL), from 2.7µg/dL, the geometric mean for theperiod 1991-1994. This decrease documents that blood lead levels continue to decline amongU.S. children when considered as a group, highlighting the success of public health efforts todecrease the exposure of children to lead. However, special populations of children at high risk
iii
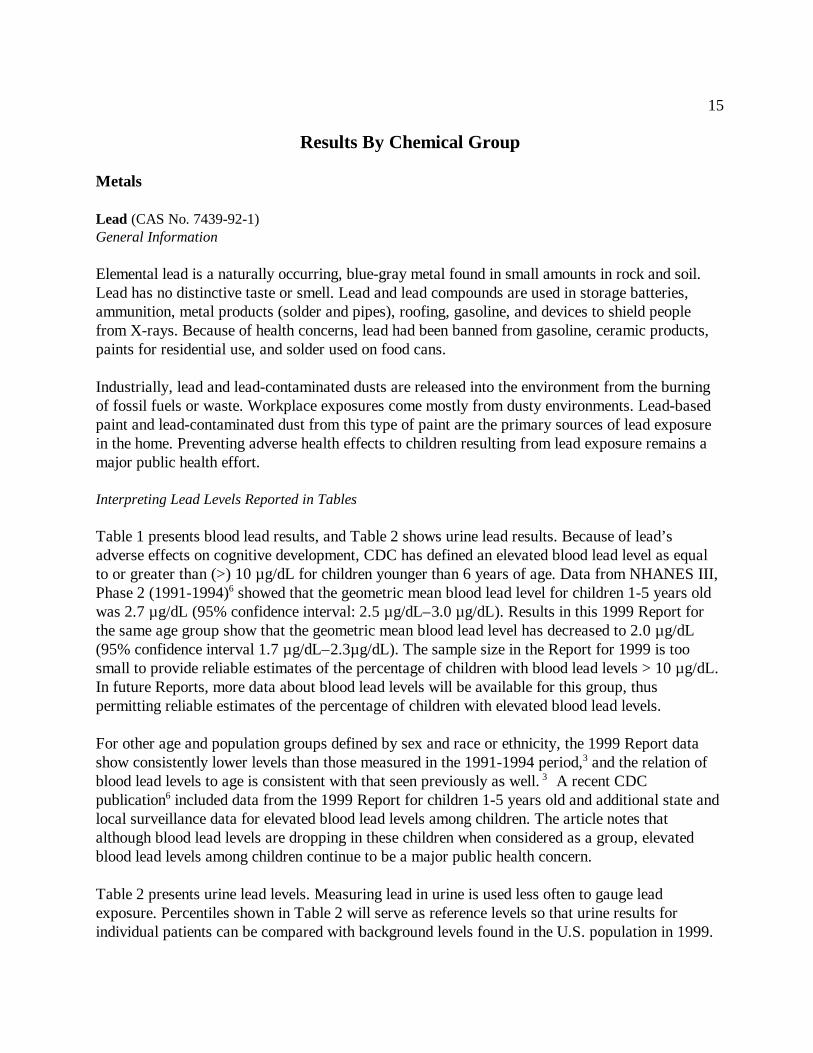
for lead exposure (e.g., those living in homes containing lead-based paint or lead-contaminateddust) remain a public health concern.
Reduced exposure of the U.S. population to environmental tobacco smokeCotinine is a metabolite of nicotine that tracks exposure to environmental tobacco smoke (ETS)among nonsmokers. Higher cotinine levels reflect more exposure to ETS, which has beenidentified as a known human carcinogen. From 1988 through 1991, as part of NHANES III, CDCdetermined that the median level (50th percentile) of cotinine among nonsmokers in the UnitedStates was 0.20 nanograms per milliliter (ng/mL). Results from the 1999 Report showed that themedian cotinine level among people aged 3 years and older has decreased to less than 0.050ng/mL— more than a 75% decrease. This reduction in cotinine levels objectively documents adramatic reduction in exposure of the general population to ETS since 1988-1991. However,since more than half of American youth are still exposed, ETS remains a major public healthconcern.
Better assessment of children’s and women’s exposure to mercuryThe 1999 Report provides important new data about blood mercury levels among children aged1-5 years and among women of childbearing age (16-49 years old). The geometric mean of bloodmercury levels among children (0.3µg/L) was about 25% of the geometric mean of blood mercurylevels among women of childbearing age (1.2µg/L). Compared with an adult, the fetus and childare usually more vulnerable to the effects of metals. Consequently, when addressing mercuryexposures, health officials are particularly careful to protect the fetus and child. The Reportprovides data for children and levels for women of childbearing age that reflect levels of mercuryto which the fetus is exposed. Scientists will use these new data to better estimate health risks forthe fetus, children, and women of childbearing age from potential sources of mercury exposure.
Setting priorities for research on phthalatesPhthalates are compounds commonly used in consumer products such as soap, shampoo, hairspray, and many types of nail polish. Some phthalates are used in flexible plastics such as bloodbags and tubing. Animal research has focused on evaluating reproductive effects of phthalates.For the 1999 Report, CDC scientists measured metabolites of seven major phthalates. Di-2-ethylhexyl phthalate (DEHP) and di-isononyl phthalate (DINP) are the two phthalates produced ingreatest quantity, with diethyl phthalate (DEP) and dibutyl phthalate(DBP) produced in muchlower quantities. However, data from the Report showed that levels of metabolites of DEP andDBP were much higher in the population than levels of metabolites of either DEHP or DINP.
These new data have prompted CDC to conduct additional studies to explain these findings byexamining the pathways by which these phthalates get into people’s bodies. The data also indicatethat health research needs to focus on DEP and DBP, given that levels of their metabolites aremuch higher in the general population than metabolite levels of phthalates produced in the largestquantities.

iv
Future Plans
The National Report on Human Exposure to Environmental Chemicals will be updated each yearwith new data for the general population. Next year, CDC will combine the 1999 and 2000 datafrom NHANES to provide updated national estimates. For the general population, current plansare for the Report to continue to measure these 27 chemicals and gradually expand the numberuntil approximately 100 environmental chemicals are measured each year. Chemicals underconsideration for future Reports include volatile organic compounds, polyaromatic hydrocarbons,dioxins, furans, polychlorinated biphenyls, trihalomethanes, haloacetic acids, carbamate pesticides,and organochlorine pesticides.
Future editions of the Report will provide more detailed assessments of exposure levels amongdifferent population groups defined by sex, race or ethnicity, age, urban or rural residence,education levels, income, and other characteristics. In addition, over time CDC will be able totrack trends in exposure levels. Future reports will also include exposure information for special-exposure populations from studies of people exposed from localized or point-source exposures(e.g., people who eat mercury-contaminated fish from a polluted river) and studies of adversehealth effects resulting from exposure to varying levels of environmental chemicals.
Data provided in future reports will help us answer the following questions:
# Are exposure levels increasing or decreasing over time?# Are public health efforts to reduce exposure working?# Do certain groups of people have higher levels of exposure than others?

v
Table 1. Selected percentiles and geometric means of blood and urine levels of environmental chemicals (or metabolites), National Health and Nutrition Examination Survey,United States, 1999
Samplesize
Units Geometricmean(95%
confidenceinterval)
Selected percentiles (95% confidence interval)
10th 25th 50th 75th 90th
Metals1
Cadmium 3,189 µg/L *
< LOD < LOD 0.3(0.2-0.3)
0.5(0.4-0.6)
0.9(0.7-1.1)
Lead 3,189 µg/dL 1.6(1.4-1.8)
0.7(0.6-0.7)
1.0(0.9-1.1)
1.5(1.4-1.7)
2.3(2.2-2.6)
3.7(3.2-4.3)
Mercury Children 1-5 years
Females, 16-49 years
248
679
µg/L
µg/L
0.3(0.2-0.4)
1.2(0.9-1.6)
< LOD
0.2(0.1-0.3)
< LOD
0.5(0.4-0.7)
0.2(0.2-0.3)
1.2(0.8-1.6)
0.5(0.4-0.8)
2.7(1.8-4.5)
1.42
(0.7-4.8)
6.2(4.7-7.9)
Metals3
Antimony 912 µg/L 0.1(0.09-0.12)
< LOD 0.05(0.03-0.07)
0.1(0.09-0.12)
0.19(0.16-0.21)
0.29(0.27-0.34)
Barium 779 µg/L 1.6
(1.5-1.7)0.3
(0.3-0.4)0.8
(0.7-0.9)1.7
(1.5-1.9)2.9
(2.7-3.3)5.5
(4.2-6.2)
Beryllium 1,007 µg/L * < LOD < LOD < LOD < LOD < LOD
Cadmium 1,007 µg/L 0.32
(0.30-0.33)0.10
(0.08-0.12)0.18
(0.15-0.19)0.33
(0.29-0.35)0.57
(0.52-0.62)0.95
(0.85-1.04)
Cesium 1,006 µg/L 4.7
(4.2-5.2)1.8
(1.4-2.2)3.3
(2.9-3.6)5.3
(4.7-5.8)7.2
(6.7-8.0)9.6
(8.5-11.6)
Cobalt 1,007 µg/L 0.36(0.32-0.40)
0.11(0.08-0.14)
0.23(0.19-0.26)
0.40(0.35-0.41)
0.60(0.54-0.68)
0.89(0.79-1.10)
Lead 1,007 µg/L 0.80(0.68-0.91)
0.21(0.15-0.26)
0.42(0.34-0.51)
0.80(0.72-0.88)
1.36(1.17-1.69)
2.21(1.89-2.72)
Molybdenum 904 µg/L 48.4(43.6-53.2)
13.1(10.8-17.3)
27.6(23.4-32.8)
53.3(47.3-61.5)
86.6(78.6-97.5)
140(120-174)
Platinum 1,007 µg/L * < LOD < LOD < LOD < LOD < LOD
Thallium 974 µg/L 0.19
(0.17-0.20)0.07
(0.06-0.07)0.12
(0.10-0.13)0.21
(0.19-0.23)0.30
(0.28-0.33)0.42
(0.39-0.45)

Samplesize
Units Geometricmean(95%
confidenceinterval)
Selected percentiles (95% confidence interval)
10th 25th 50th 75th 90th
vi
Tungsten 892 µg/L 0.10
(0.09-0.12)< LOD 0.05
(0.03-0.06)0.10
(0.08-0.11)0.18
(0.16-0.22)0.32
(0.27-0.45)
Uranium 1,006 µg/L 0.008(0.006-0.011)
< LOD < LOD 0.007(0.004-0.010)
0.014(0.009-0.030)
0.034(0.022-0.053)
< LOD means below the limit of detection of the analytical method.*Not calculated. Proportion of results below the limit of detection was too high to provide a valid result.1 Lead and cadmium are measured in blood among people aged 1 year and older; mercury is measured in bloodamong age groups specified above. Blood levels by selected demographic groups are available elsewhere in thisdocument and at www.cdc.gov/nceh/dls/report2 Estimate meets minimum standards of reliability but should be interpreted with caution.3 Measured in urine in a subset of people aged 6 years and older.

vii
Table 2. Selected percentiles and geometric means of blood and urine levels of environmentalchemicals (or metabolites), National Health and Nutrition Examination Survey, United States, 1999
Samplesize
Units Geometricmean(95%
confidenceinterval)
Selected percentiles (95% confidence interval)
10th 25th 50th 75th 90th
OrganophosphatePesticide Metabolites1
Dimethyl-phosphate
703 µg/L 1.84(1.10-2.59)
< LOD 0.80(0.36-1.11)
1.67(1.04-2.86)
3.79(2.38-7.46)
7.43(5.43-17.3)
Diethyl-phosphate
703 µg/L 2.55
(1.33-3.78)0.78
(0.70-0.90)1.09
(0.93-1.31)1.85
(1.19-4.11)4.87
(2.58-14.0)10.62
(6.29)
Dimethylthio-phosphate
703 µg/L 2.61
(1.77-3.45)< LOD 0.72
(0.13-1.73)3.80
(2.93-4.53)9.00
(7.35-12.3)22.9
(18.7-30.7)
Diethylthio-phosphate
703 µg/L 0.81
(0.69-0.94)0.51
(0.41-0.53)0.58
(0.55-0.59)0.70
(0.64-0.78)0.98
(0.78-1.45)1.52
(1.16-2.91)
Dimethyldithio-phosphate
703 µg/L 0.51
(0.39-0.62)< LOD < LOD 0.60
(0.39- 0.78)2.05
(1.65-2.42)5.43
(3.16-10.3)
Diethyldithio-phosphate
703 µg/L 0.19
(0.14-0.23)0.08
(0.07-0.08)0.09
(0.09-0.09)0.14
(0.09-0.26)0.30
(0.25-0.39)0.54
(0.44-0.86)
Phthalate Metabolites1
Mono-benzylphthalate
1,029 µg/L 17.4(14.1-20.7)
3.5(2.2-4.5)
8.0(5.9-9.8)
18.5(15.4-22.6)
38.6(31.5-48.7)
82.3(64.0-101)
Mono-butylphthalate
1,029 µg/L 26.7(23.9-29.4)
5.9(4.6-7.3)
13.2(10.5-15.4)
27.5(24.6-31.5)
53.8(51.2-59.7)
98.6(89.1-122)
Mono-cyclohexylphthalate
1,029 µg/L * < LOD < LOD < LOD < LOD < LOD
Mono-ethylphthalate
1,029 µg/L 176.0(132-220)
27.7(17.5-38.3)
61.5(43.1-80.0)
171(121-226)
424(362-563)
1,160(971-1,350)
Mono-2-ethylhexylphthalate
1,029 µg/L 3.5(3.0-4.0)
< LOD 1.5(0.8-1.9)
3.3(3.0-3.8)
7.7(6.1-9.6)
13.6(11.2-17.3)
Mono-isononylphthalate
1,029 µg/L * < LOD < LOD < LOD < LOD 4.3
(0.6-22.3)
Mono-n-octylphthalate
1,029 µg/L *
< LOD < LOD < LOD < LOD 1.9(1.2-3.5)

Samplesize
Units Geometricmean(95%
confidenceinterval)
Selected percentiles (95% confidence interval)
10th 25th 50th 75th 90th
viii
Cotinine3 2,263 ng/mL * < LOD < LOD < LOD 0.15
(0.11-0.23)0.52
(0.38-1.01)
< LOD means below the limit of detection of the analytical method.*Not calculated. Proportion of results below the limit of detection was too high to provide a valid result.1Organophosphate pesticide metabolites are measured in urine in a subset of people aged 6 to 59 years. Phthalatemetabolites are measured in urine in a subset of people aged 6 years and older.2 Upper end of the 95% confidence interval cannot be estimated reliably.3 Measured in serum among nonsmokers aged 3 years and older. Serum levels of cotinine for selecteddemographic groups are available elsewhere in this document and at www.cdc.gov/nceh/dls/report

1
Introduction
The National Report on Human Exposure to Environmental Chemicals is a new publication thatprovides an ongoing assessment of the U.S. population’s exposure to environmental chemicalsusing biomonitoring. For this Report, an environmental chemical means a chemical compound orchemical element present in air, water, soil, dust, or other environmental media. Biomonitoring isthe assessment of human exposure to chemicals by measuring the chemicals or their metabolites inhuman specimens, such as blood or urine. This report presents data for the noninstitutionalized,civilian U.S. population for 1999 from CDC’s National Health and Nutrition Examination Survey(NHANES). NHANES is a series of surveys designed to collect data on the health and nutritionalstatus of the U.S. population.
Currently, the Report includes data for exposure of the general population to these 27environmental chemicals:
# Metals• Lead • Mercury • Cadmium • Cobalt• Uranium • Antimony • Barium • Beryllium• Cesium • Molybdenum • Platinum • Thallium• Tungsten
# Tobacco smoke• Cotinine (a metabolite of nicotine)
# Organophosphate pesticides: urine metabolites of 28 pesticides, including chlorpyrifos,diazinon, fenthion, malathion, parathion, disulfoton, phosmet, phorate, temephos, and methylparathion:
•Dimethylphosphate• Dimethylthiophosphate• Dimethyldithiophosphate• Diethylphosphate• Diethylthiophosphate• Diethyldithiophosphate
# Phthalates: urine metabolites of seven phthalates:• Mono-ethyl phthalate • Mono-isononyl phthalate• Mono-butyl phthalate • Mono-cyclohexyl phthalate• Mono-2-ethylhexyl phthalate • Mono-benzyl phthalate• Mono-n-octyl phthalate

2
Data Presented for Each Environmental Chemical
The Report presents descriptive statistics on the distribution of blood or urine levels for eachenvironmental chemical. Statistics include geometric means and percentiles with confidenceintervals. Geometric means are calculated by taking the log of each concentration, then calculatingthe mean of those log values, and finally taking the antilog of that mean (the calculation can bedone using log base e or log base 10). A geometric mean provides a better estimate of centraltendency for data that are distributed with a long tail at the upper end of the distribution. This typeof distribution is common when measuring environmental chemicals in blood or urine. Thegeometric mean is less influenced by high values than is the arithmetic mean. Percentiles (10th, 25th,50th, 75th, and 90th ) are given to provide additional information about the shape of the distribution.For urine measurements, data are shown for both the concentration in urine and the concentrationcorrected for urine-creatinine level.
When sample sizes are adequate, the Report also presents data for the population and populationsubgroups defined by demographic variables such as age, sex, and race or ethnicity.
First-Time Information
The Report is a new publication that provides information to scientists, public health officials, andthe public about exposure to environmental chemicals in the U.S. population. For 24 of the 27environmental chemicals listed in the Report, this is the first time this type of exposure informationhas been available for the general U.S. population. CDC has previously assessed the population’sexposure to three chemicals (lead, cadmium, and cotinine),1-5 and this Report provides new dataabout these chemicals for the 1999 calendar year.
Interpreting Report Exposure Data: Important Factors
Research studies, separate from the Report, are required to determine which blood or urine levels are safe and which cause disease.
The measurement of an environmental chemical in a person’s blood or urine does not by itselfmean that the chemical causes disease. Advances in analytical methods allow us to measure lowlevels of environmental chemicals in people, but studies of varying exposure levels and healtheffects are needed to determine which blood or urine levels result in disease. These studies mustalso consider other factors such as duration of exposure. The Report does not present new data onhealth risks from different exposures.
For some environmental chemicals, such as lead, research studies have given us a goodunderstanding of the health risks associated with different blood lead levels. However, for manyenvironmental chemicals, we need more research to assess health risks from different blood orurine levels of a chemical. The results shown in the Report should help prioritize and fosterresearch on human health risks that result from exposure to environmental chemicals. See thesection titled “Toxicology and Health-Risk Information,” which lists Internet sites providing health

3
information about environmental chemicals. Each environmental chemical can be searched indatabases at these Web sites using the chemical name or the chemical’s Chemical Abstract Service(CAS) number, which is provided in the Report. If available for the chemical of interest, theAgency for Toxic Substances and Disease Registry (ATSDR) ToxFAQs provide a good summaryof the chemical’s toxicology, as well as answers to common questions about exposure and healtheffects.
Blood and urine levels of a chemical should not be confused with levels of the chemical in air, water, soil, dust or food.
Concentrations of environmental chemicals in blood or urine are not the same as those in air,water, soil, dust, or food. For example, a chemical concentration of 10 micrograms per liter (µg/L)in water does not produce a level of 10 µg/L in blood or urine. In fact, blood or urine levels mayresult from exposure to chemicals in more than one environmental medium. Blood lead levelsreflect exposure from lead in air, water, soil, dust, and food. The blood and urine levels shown inthe Report cannot be quantitatively extrapolated to specific air, water, soil, dust, or food levels.
The 1999 Report results are for the general U.S. population. Future Reports will include data for both the general population and populations in special-exposure situations.
The 1999 Report data are for the general U.S. population and should not be interpreted asrepresenting groups of people in special-exposure situations. Future releases of the Report willinclude data from CDC studies of special-exposure populations. The 1999 Report contains resultsfrom a sample of people representing the civilian, noninstitutionalized U.S. population. Groups ofpeople in special-exposure situations (e.g., pesticide applicators, people living near hazardouswaste sites, people working in lead smelters) are not targeted in this set of results. For example,people working in lead smelters likely have a different distribution of blood lead levels than peoplein the general population. A specific study of people working in lead smelters would be needed todescribe the distribution of blood lead levels in that group.
The 1999 Report Results are based on 1 year of NHANES data.
Because the sample size in any one year of NHANES is relatively small and for 1999 the surveywas conducted in only 12 locations across the country, and because most analyses were conductedin subsamples of the population, more data will be needed to confirm these findings and to allowmore detailed analysis to describe exposure levels in population subgroups. Data from additionalsites are also needed to evaluate the potential influence of geographic clustering on blood and urinelevels of chemicals.
CDC will update the Report each year. Next year, CDC will combine the 1999 and 2000 data fromNHANES to provide new national estimates. In the future, the Report will also include data fromother large exposure studies and studies of exposure of special-population groups within theUnited States.

4
Biomonitoring Exposure Measurements
The biomonitoring exposure measurements presented in the Report were made at CDC’sEnvironmental Health Laboratory (Division of Laboratory Sciences, National Center forEnvironmental Health). The analytical methods used for measuring these environmental chemicalsor their metabolites in blood and urine were isotope dilution mass spectrometry, inductivelycoupled plasma mass spectrometry, or graphite furnace atomic absorption spectrometry.Information about the analytical methods used appears in the “References for Analytical Methods”section of this document.

5
Data Sources
The National Health and Nutrition Examination Survey
The National Health and Nutrition Examination Survey (NHANES) is a series of surveysconducted by CDC’s National Center for Health Statistics (NCHS) that is designed to collect dataon the health and nutritional status of the U.S. population. NHANES is unique in its ability toexamine public health issues that can best be addressed through physical and laboratoryexaminations of the U.S. population. NHANES collects information about a wide range of topics,from the prevalence of infectious diseases to risk factors for cardiovascular disease. Beginning in1999, NHANES became a continuous and annual survey. The sampling plan for each year followsa complex, stratified, multistage, probability-cluster design to select a representative sample of thecivilian, noninstitutionalized population.
The current sample design includes oversampling of African Americans, Mexican Americans,adolescents (12-19 years old), older Americans (60 years old and older), and pregnant women toproduce more reliable estimates for these groups. The NHANES protocol includes a homeinterview followed by a standardized physical examination in a mobile examination center. As partof the examination protocol, blood is obtained by venipuncture for participants aged 1 year andolder, and urine specimens are collected for people aged 6 years and older. The 1999 NHANESwas conducted in 12 counties across the United States. From these locations, 5,325 people wereselected to participate in the survey. Of these, 3,812 (71%) participated in the examinationcomponent.
Environmental chemicals were measured either in blood or urine specimens collected as part of theexamination component. The age range for which a chemical was measured varied. Because of theavailability of samples and the speed of analytical measurements, some environmental chemicals(metals, phthalate metabolites, and organophosphate metabolites) were measured only in randomlyselected subsamples within specific age groups.
Blood lead and cadmium levels were measured in all people aged 1 year and older. Serum cotininewas measured in all people aged 3 years and older. Blood mercury was measured in children aged1-5 years and in women 16-49 years of age. Urine measurements for metals and phthalates wereconducted for random one-third samples of people aged 6 years and older. Urine organophosphatepesticide metabolites were measured in a random one-half sample of children aged 6 through 11years and in a random one-quarter sample of people aged 12-59 years. Age groups and samplesizes for each exposure measurement are shown in the tables.
NHANES Data Analysis
Because the NHANES sample design is complex, sample weights must be used to account for theunequal probability of selection into the survey. Sample weights are also used to adjust for possiblebias resulting from nonresponse and are post-stratified to U.S. Census Bureau estimates of the
6
U.S. population. All data analyses were conducted at NCHS using the statistical software package,WESVAR, which uses sample weights and calculates variance estimates that account for thecomplex survey design. Selected percentiles and geometric means of analyte concentrations arepresented. For each estimate, 95% confidence intervals are shown. Results are shown for the totalpopulation. For analytes that were measured in the full sample of people, results are also shown byage, sex, and race or ethnicity.
For these analyses, race or ethnicity is categorized as non-Hispanic black, Mexican American, andall others (most are non-Hispanic white). Analyte-concentration levels less than the limit ofdetection were assigned a value equal to the detection limit divided by the square root of 2 forcalculation of geometric means. If the proportion of results below the limit of detection wasgreater than 40%, geometric means were not calculated. For urine measures, the Report showsdata for both the concentration in urine and the concentration corrected for urine-creatinine level.Creatinine-corrected values for results below the limit of detection were calculated only if theproportion of results below the limit of detection was less than 10%. In those cases, the fill valueused to calculate geometric means was used in the calculation.
Limitations On Estimates of Chemical Exposures From One Year of Data
Although the current NHANES is conducted using annual samples that are nationallyrepresentative, the sample size in any one year is relatively small, resulting in large variability forestimates, especially those for detailed demographic groups or other detailed analyses. NHANES isdesigned to increase precision by combining data across calendar years. Because of the smallsample size in 1999, a number of survey participants have large sample weights, and the potentialexists that these sample weights may strongly influence estimates. This factor is particularlyimportant for chemical results that were only measured in subsamples of the population.
Another analytic limitation of the NHANES sample is that it is selected from a relatively smallnumber of sampling units (PSUs) or counties; the 1999 sample was planned for only 12 PSUs.With a small number of PSUs, variance estimates that account for the complex design will berelatively unstable, a factor which introduces a higher level of uncertainty in the annual estimates.Although the annual NHANES is nationally representative, it is not possible to produceenvironmental exposure estimates by geographic region. Because the number of geographic sitessampled each year is small and because environmental exposure measures may vary geographically,national estimates based on one year of data may be highly variable.
These limitations related to measuring environmental exposures from a single year of NHANESwill be addressed as more data become available from the ongoing survey. More detailed analysesby demographic groups and other variables will be possible with increased sample size and with alarger number of geographic locations.

7
Major Findings
First-Time Information About Exposure Levels in the U.S. Population
The Report provides information to scientists, public health officials, and the public about exposureto environmental chemicals in the U.S. population. It provides measures of exposure for 27chemicals in the U.S. population based on blood and urine samples from people participating in the1999 NHANES. CDC has previously assessed the exposure of the population through NHANESfor three chemicals: lead, cadmium, and cotinine. The Report provides new data on thesechemicals for the 1999 calendar year as well as data on 24 additional environmental chemicals(metals, organophosphate pesticides, and phthalates). Because the sample size in any one year ofNHANES is relatively small and because the 1999 survey was only conducted in 12 locationsacross the country, data from additional years of the survey will be needed to confirm thesefindings.
Information About U.S. Population-Based Reference Ranges for Physicians and Health Researchers
The 1999 Report provides unique reference range values that are based on a sampling of the U.S.population. CDC had previously determined U.S. population-based reference ranges for lead,cadmium, and cotinine using NHANES data; the 1999 Report provides U.S. population-basedreference-range results for 24 additional environmental chemicals.
Physicians use “normal” ranges for laboratory results to determine whether their patients have highor low values that would indicate that a health problem exists. These normal ranges are obtainedfrom people who are generally healthy. In the 1999 Report, CDC determined reference ranges for24 environmental chemicals from a group of people in the general population who were selectedwithout regard to known exposure to these chemicals. Sometimes these reference ranges arereferred to as “background exposure levels.”
Reference ranges are extremely helpful to physicians and health researchers because levels abovethe reference range usually indicate exposure to a particular source. For example, if a physicianwas concerned about a patient’s potential exposure to cadmium and measured a cadmium level inthe patient’s urine, the results could be compared with the population reference range shown in the1999 Report. A cadmium level similar to those found in the Report would indicate exposure nodifferent from those found in the general population, and a level much higher than those in theReport would indicate that there may have been an unusual exposure to cadmium worthy offurther investigation.
Decline in Blood Lead Levels Among Children Since 1991-1994
Since 1976, CDC has measured levels of lead in blood as part of NHANES. Results presented inthe 1999 Report show that the geometric mean blood lead level for children aged 1-5 years has

8
decreased to 2.0 micrograms per deciliter (µg/dL) from 2.7 µg/dL, the geometric mean for theperiod 1991-1994. This decrease documents that blood lead levels continue to decline among U.S.children when considered as a group and highlights the success of public health efforts to decreasethe exposure of children to lead. Nevertheless, special populations of children at high risk for leadexposure (e.g., those living in homes containing lead-based paint or lead-contaminated dust)remain a major public health concern.
Better Assessment of Children’s and Women’s Exposure to Mercury
The 1999 Report provides important new data on levels of mercury in blood among children 1 to 5years old and among women of childbearing age (16-49 years old). The geometric mean of bloodmercury levels among children (0.3µg/L) was about 25% of the geometric mean of blood mercurylevels among women of childbearing age (1.2 µg/L). Compared with an adult, the fetus or child isusually more vulnerable to the effects of metals. Consequently, when addressing mercuryexposures, health officials are particularly careful to protect the fetus and child. The Reportprovides data for children and levels for women of childbearing age that reflect levels of mercuryto which the fetus is exposed. Scientists will use these new data to better estimate health risks forthe fetus, children, and women of childbearing age from potential sources of mercury exposure.
Setting Priorities for Research on Phthalates
Phthalates are compounds commonly used in such consumer products as soap, shampoo, hairspray, and many types of nail polish. Some phthalates are used in flexible plastics such as bloodbags and tubing. Animal research has focused on the reproductive effects of phthalates. For the1999 Report, CDC scientists measured metabolites of seven major phthalates. Di-2-ethylhexylphthalate (DEHP) and di-isononyl phthalate (DINP) are the two phthalates produced in greatestquantity, with diethyl phthalate (DEP) and dibutyl phthalate (DBP) produced in much lowerquantities. However, data from the 1999 Report showed that levels of metabolites of DEP andDBP were much higher in the population than metabolites of either DEHP or DINP.
These new data have prompted CDC to conduct additional studies to explain these findings byexamining the pathways by which these phthalates get into people’s bodies. The data also indicatethat health research needs to focus on DEP and DBP, given that the levels of their metabolites aremuch higher in the U.S. population.
Reduced Exposure of the U.S. Population to Environmental Tobacco Smoke
Cotinine is a metabolite of nicotine that tracks exposure to environmental tobacco smoke (ETS)among nonsmokers; higher cotinine levels reflect more exposure to ETS, which has been identifiedas a known human carcinogen. From 1988 through 1991, as part of NHANES III, CDCdetermined that the median level (50th percentile) of cotinine among nonsmokers in the UnitedStates was 0.2 nanograms per milliliter (ng/mL). Results from the 1999 Report showed that the

9
median cotinine level among people aged 3 years and older has decreased to less than 0.050ng/mL— more than a 75% decrease. This reduction in cotinine levels objectively documents adramatic reduction in exposure of the general U.S. population to ETS since the period 1988-1991.However, since more than half of American youth are still exposed, ETS remains a major publichealth concern.


11
Toxicology and Health-Risk Information
The Report presents new data on the exposure of the U.S. population to environmental chemicals. This new information can be used to promote and prioritize research to determine health risks fromdifferent exposure levels of these chemicals when the risks are not known. One important factor toinclude in such research is duration of exposure. The measurement of an environmental chemical ina person’s blood or urine does not by itself mean that the chemical causes disease. Advances inanalytical methods allow us to measure lower and lower levels of environmental chemicals inpeople, but studies of varying exposure levels and health effects are required to determine whichblood and urine levels are safe and which result in disease.
Information Available on the Internet
Links to non-federal organizations are provided solely as a service to our readers. These links donot constitute an endorsement of these organizations or their programs by CDC or the federalgovernment, and none should be inferred. CDC is not responsible for the content of the individualorganization’s Web pages found at these links. For information about toxicology and health risks,see the following sites:
Federal and Non-Federal Internet Links# ATSDR ToxFAQs: www.atsdr.cdc.gov/toxfaq.html or www.atsdr.cdc.gov/toxprofiles# National Institute for Occupational Safety and Health (NIOSH), Occupational Health and
Safety Guidelines for Chemical Hazards: www.cdc.gov/niosh/81-123.html# National Toxicology Program Report on Carcinogens: http://ehis.niehs.nih.gov/roc/# EPA Integrated Risk-Information System (IRIS): www.epa.gov/iris/# International Programme on Chemical Safety (IPCS): www.who.int/pcs# Chemfinder: www.chemfinder.com# Material Safety Data Sheets: www.hazard.com/msds/index.html
U.S. Government-Related Internet LinksCenters for Disease Control and Prevention (CDC)# NIOSH Pocket Guide to Chemical Hazards: www.cdc.gov/niosh/npg/npgd0000.html# Registry of Toxic Effects of Chemical Substances (RTECS): www.cdc.gov/niosh/rtecs.html# CDC’s Tobacco Information and Prevention Source: www.cdc.gov/tobacco/# CDC’s National Center for Health Statistics: www.cdc.gov/nchs# National Health and Nutrition Examination Survey: www.cdc.gov/nchs/nhanes.htm# CDC’s Childhood Lead Poisoning Prevention Program: www.cdc.gov/nceh/lead/lead.htm# Pesticides and Public Health: Integrated Methods of Mosquito Management:
www.cdc.gov/ncidod/eid/vol7no1/rose.htm
U.S. Department of Health and Human Services (HHS)# Environmental Health Policy Committee: http://web.health.gov/environment

12
U.S. Food and Drug Administration (FDA)# Center for Devices and Radiological Health: www.fda.gov/cdrh# Center for Food Safety and Applied Nutrition: www.cfsan.fda.gov/# Center for Toxicological Research: www.fda.gov/nctr/
National Institutes of Health (NIH)# National Cancer Institute: www.nci.nih.gov# National Institute of Child Health and Human Development: www.nichd.nih.gov# National Institute for Environmental Health Sciences: www.niehs.nih.gov# National Toxicology Program (NTP) Chemical Health and Safety Data: http://ntp-
server.niehs.nih.gov/Main_Pages/Chem-HS.html# National Toxicology Program Report on Carcinogens: http://eihs.niehs.nih.gov/roc/toc9.html# Chemical Carcinogenesis Research Information System: http://toxnet.nlm.nih.gov/cgi-
bin/sis/htmlgen?CCRIS# Hazardous Susbstances Data Bank (HSDB®): http://toxnet.nlm.nih.gov/cgi-
bin/sis/htmlgen?HSDB
U.S. Environmental Protection Agency (EPA)# Office of Air and Radiation Organizational Chart: www.epa.gov/oar/# Office of Environmental Information (OEI): www.epa.gov/oei/# Office of Prevention, Pesticides, and Toxic Substances (OPPTS):
www.epa.gov/opptsfrs/home/opptsim.htm# Office of Research and Development (ORD): www.epa.gov/ORD# Office of Water (OW): www.epa.gov/OW/# Office of Pesticide Programs: www.epa.gov/pesticides# EPA Integrated Risk-Information System (IRIS): www.epa.gov/iris# EPA Envirofacts: www.epa.gov/enviro/index_java.html# Organophosphate pesticide common and trade names:
www.epa.gov/oppbead1/matrices/oplist.htm# Lead: www.epa.gov/OGWDW/dwh/c-ioc/lead.html
U.S. Department of Agriculture (USDA)# Food Safety and Inspection Service: http://www.fsis.usda.gov# USDA, Forest Service Pesticide Fact Sheets: http://svinet2.fs.fed.us/foresthealth/pesticide
U.S. Department of Energy# Office of Environment, Safety and Health: http://tis.eh.doe.gov/portal/home.htm
U.S. Department of Housing and Urban Development (HUD)# Office of Healthy Homes and Lead-Hazard Control: www.hud.gov/offices/lead/
U.S. Consumer Product Safety Commission (CPSC)# www.cpsc.gov/

13
U.S. Department of Transportation (DOT)# Hazardous Materials Emergency-Response Guidebook:
http://hazmat.dot.gov/erg2000/psnsort.htm
U.S. Department of Labor, Occupational Safety and Health Administration (OSHA):# http://www.osha.gov/index.html
Other Related Internet Sites# American College of Occupational and Environmental Medicine: http://www.acoem.org/# Association of Occupational and Environmental Clinics: http://www.aoec.org/# Association of Public Health Laboratories: http://www.aphl.org# International Chemical Safety Cards:
http://www.ilo.org/public/english/protection/safework/cis/products/icsc/dtasht/index.htm# NRC Mercury Report: http://books.nap.edu/books/0309071402/html/index.html

15
Results By Chemical Group
Metals
Lead (CAS No. 7439-92-1)General Information
Elemental lead is a naturally occurring, blue-gray metal found in small amounts in rock and soil.Lead has no distinctive taste or smell. Lead and lead compounds are used in storage batteries,ammunition, metal products (solder and pipes), roofing, gasoline, and devices to shield peoplefrom X-rays. Because of health concerns, lead had been banned from gasoline, ceramic products,paints for residential use, and solder used on food cans.
Industrially, lead and lead-contaminated dusts are released into the environment from the burningof fossil fuels or waste. Workplace exposures come mostly from dusty environments. Lead-basedpaint and lead-contaminated dust from this type of paint are the primary sources of lead exposurein the home. Preventing adverse health effects to children resulting from lead exposure remains amajor public health effort.
Interpreting Lead Levels Reported in Tables
Table 1 presents blood lead results, and Table 2 shows urine lead results. Because of lead’sadverse effects on cognitive development, CDC has defined an elevated blood lead level as equalto or greater than (>) 10 µg/dL for children younger than 6 years of age. Data from NHANES III,Phase 2 (1991-1994)6 showed that the geometric mean blood lead level for children 1-5 years oldwas 2.7 µg/dL (95% confidence interval: 2.5 µg/dL–3.0 µg/dL). Results in this 1999 Report forthe same age group show that the geometric mean blood lead level has decreased to 2.0 µg/dL(95% confidence interval 1.7 µg/dL–2.3µg/dL). The sample size in the Report for 1999 is toosmall to provide reliable estimates of the percentage of children with blood lead levels > 10 µg/dL.In future Reports, more data about blood lead levels will be available for this group, thuspermitting reliable estimates of the percentage of children with elevated blood lead levels.
For other age and population groups defined by sex and race or ethnicity, the 1999 Report datashow consistently lower levels than those measured in the 1991-1994 period,3 and the relation ofblood lead levels to age is consistent with that seen previously as well. 3 A recent CDCpublication6 included data from the 1999 Report for children 1-5 years old and additional state andlocal surveillance data for elevated blood lead levels among children. The article notes thatalthough blood lead levels are dropping in these children when considered as a group, elevatedblood lead levels among children continue to be a major public health concern.
Table 2 presents urine lead levels. Measuring lead in urine is used less often to gauge leadexposure. Percentiles shown in Table 2 will serve as reference levels so that urine results forindividual patients can be compared with background levels found in the U.S. population in 1999.
sog3
>
sog3
>

16
Table 1. Geometric mean and selected percentiles of blood lead concentrations (in µg/dL) for the U.S. population, aged 1 year and older, by selected demographic groups, National Health and NutritionExamination Survey, 1999.
Samplesize
Geometricmean
(95% confidenceinterval)
Selected percentiles(95% confidence interval)
10th 25th 50th 75th 90th
Total, age 1 andolder
3,189 1.6(1.4-1.8)
0.7(0.6-0.7)
1.0(0.9-1.1)
1.5(1.4-1.7)
2.3(2.2-2.6)
3.7(3.2-4.3)
Gender
Male 1,594 1.9(1.7-2.1)
0.8(0.7-0.9)
1.2(1.1-1.4)
1.8(1.7-2.0)
2.7(2.5-3.1)
4.3(3.7-5.3)
Females 1,595 1.3(1.2-1.5)
0.6(0.4-0.7)
0.8(0.7-0.9)
1.2(1.1-1.4)
1.9(1.7-2.1)
3.0(2.6-3.5)
Race/Ethnicity
Black, non- Hispanic
693 1.7(1.5-2.0)
0.8(0.6-0.8)
1.1(0.9-1.3)
1.6(1.4-1.8)
2.5(2.2-3.0)
4.2(3.3-5.2)
Mexican American
1,289 1.8(1.6-2.0)
0.7(0.6-0.8)
1.1(0.9-1.2)
1.6(1.4-1.9)
2.8(2.3-3.3)
4.1(3.8-5.2)
White, non- Hispanic*
1,207 1.5(1.4-1.7)
0.6(0.5-0.7)
1.0(0.8-1.1)
1.5(1.3-1.6)
2.3(2.1-2.5)
3.5(3.1-4.1)
Age Group
1-5 years 254 2.0(1.7-2.3)
0.9**(0.5-1.1)
1.3(1.1-1.5)
1.9(1.6-2.1)
2.7(2.2-4.4)
4.7**(3.5-9.8)
6-11 years 419 1.3(1.0-1.6)
0.6(0.5-0.7)
0.8(0.7-1.0)
1.2(1.0-1.5)
1.7(1.4-2.2)
2.7(1.9-4.7)
12-19 years 868 1.0(0.8-1.2)
0.4(0.2-0.5)
0.6(0.5-0.8)
0.9(0.8-1.1)
1.4(1.2-1.6)
2.1(1.9-2.4)
20-39 years 595 1.4(1.2-1.5)
0.6(0.5-0.7)
0.8(0.8-1.0)
1.3(1.1-1.5)
2.0(1.7-2.2)
2.8(2.5-3.2)
40-59 years 471 1.9(1.7-2.0)
0.9(0.7-1.0)
1.2(1.1-1.3)
1.8(1.6-1.9)
2.7(2.4-3.2)
3.8(3.6-4.4)
60+ years 582 2.5(2.2-2.8)
1.2(1.1-1.3)
1.6(1.5-1.9)
2.3(2.1-2.7)
3.5(3.0-4.3)
5.0(4.5-6.4)
Numbers in parentheses are 95% confidence intervals.* Includes other racial/ethnic groups.**Estimate meets minimum standards of reliability but should be interpreted with caution.

17
Table 2. Geometric mean and selected percentiles of urine lead concentrations and creatinine-adjustedlevels for the U.S. population aged 6 years and older, National Health and Nutrition ExaminationSurvey, 1999
Samplesize
Geometricmean(95%
confidenceinterval)
Selected percentiles(95% confidence interval)
10th 25th 50th 75th 90th
µg/L of urine 1,007 0.80(0.68-0.91)
0.21(0.15-0.26)
0.42(0.34-0.51)
0.80(0.72-0.88)
1.36(1.17-1.69)
2.21(1.98-2.72)
µg/L ofcreatinine*
1,007 0.72(0.62-0.83)
0.31(0.23-0.36)
0.45(0.39-0.50)
0.69(0.61-0.79)
1.11(0.96-1.35)
1.67(1.47-2.31)
Numbers in parentheses are 95% confidence intervals.*µg per gram of creatinine in urine.
Mercury (CAS No. 7439-97-6)General Information
Mercury is a naturally occurring metal that has several forms. Metallic mercury is a shiny, silver-white, odorless liquid. If heated, it forms a colorless, odorless gas. Mercury combines with otherelements, such as chlorine, sulfur, or oxygen to form inorganic mercury compounds or salts thatare usually white powders or crystals. Mercury also combines with carbon to make organicmercury compounds. The most common of these, methylmercury, is produced mainly by smallorganisms in water and soil. Increased levels of mercury in the environment can increase theamount of methylmercury that these small organisms produce. Metallic mercury is used to producechlorine gas and caustic soda. It is also used in thermometers, dental fillings, and batteries.
Inorganic mercury (metallic mercury and mercury compounds) enters the air from the mining ofore deposits, the burning of coal, and the incineration of waste. It also enters the water or soil fromnatural deposits, disposal of wastes, and volcanic activity. Methylmercury concentrates in the foodchain. Fish contaminated with mercury are a major source of methylmercury. Organic mercury ismore toxic than inorganic mercury. The blood mercury level in the Report is total blood mercuryand thus includes both organic and inorganic mercury. Most measures of inorganic mercury werebelow the limit of detection; therefore, these measurements are a good indication of methylmercuryexposure.
Interpreting Mercury Levels Reported in the Table
Total blood mercury levels shown in Table 3 are for children selected to represent the general U.S.population aged 1- 5 years and women aged 16-49 years. Extremely limited information has beenavailable about children’s exposure to mercury and how it relates to levels in adults. The geometricmean of blood mercury levels among children (0.3µg/L) was about 25% of the geometric mean of

18
blood mercury levels among women of childbearing age (1.2µg/L). Levels among women ofchildbearing age are particularly important because they reflect levels of mercury to which the fetusis exposed.7
The National Research Council (NRC) recently completed a toxicologic review of mercury levels.7 The NRC calculated a benchmark dose (BMD), which was an estimate of a methylmercuryexposure to the fetus associated with an increase in abnormal scores on cognitive function testsamong children.7 The lower 95% confidence bound of the BMD was 59µg/L. The 90th percentilesof mercury levels among children 1- 5 years old and women of childbearing age are below thislevel. Approximately 10% of women have mercury levels within one-tenth of this level.
Table 3. Geometric mean and selected percentiles of total blood mercury concentrations (in µg/L) forU.S. children aged 1-5 years and women aged 16-49 years, National Health and Nutrition ExaminationSurvey, 1999.
Samplesize
Geometricmean(95%
confidenceinterval)
Selected percentiles(95% confidence interval)
10th 25th 50th 75th 90th
Children,aged 1-5years,males andfemales
248 0.3(0.2-0.4)
< LOD* < LOD 0.2(0.2-0.3)
0.5(0.4-0.8)
1.4**(0.7-4.8)
Females,16-49years
679 1.2(0.9-1.6)
0.2(0.1-0.3)
0.5(0.4-0.7)
1.2(0.8-1.6)
2.7(1.8-4.5)
6.2(4.7-7.9)
Numbers in parentheses are 95% confidence intervals.< LOD means below the limit of detection of the analytical method.* Less than the limit of detection of 0.1µg/L blood.**Estimate meets minimum standards of reliability but should be interpreted with caution.

19
Cadmium (CAS No. 7440-43-9)General Information
Elemental cadmium is a silver-white metal. In nature, it is usually found combined with otherelements such as oxygen (cadmium oxide), chlorine (cadmium chloride), or sulfur (cadmiumsulfate, cadmium sulfide). Cadmium does not corrode easily and has many uses. In industry andconsumer products, it is used for batteries, pigments, metal coatings, and plastics. Cadmium or itscompounds have no definite taste or odor.
Cadmium gets into the environment from the weathering of rocks and minerals that containcadmium. Exposure to cadmium can occur in industries, such as mining or electroplating, thatcommonly use or produce the chemical. Cadmium exposure can also occur from exposure tocigarette smoke.
Interpreting Blood and Urine Cadmium Levels Reported in the Tables
In the 1999 Report, blood cadmium levels were measured in people 1 year old and older, and urinecadmium levels were measured in a sample of people 6 years old and older. Blood cadmium resultsare shown in Table 4 and urine cadmium results in Table 5, expressed as urine concentration andurine concentration adjusted for creatinine. Blood and urine cadmium levels in these tables are forpeople selected to represent the general U.S. population. Measuring cadmium at these levels inblood and urine is possible because of advances in analytical chemistry. Finding a measurableamount of cadmium in the blood or urine does not mean that the level of cadmium causes anadverse health effect.
The Occupational Safety and Health Administration (OSHA) has developed criteria for evaluatingoccupational exposures. For blood cadmium, the criterion is 5 micrograms per liter (µg/L) ofblood; for urine cadmium, the criterion is 3 µg/gram.8 Occupational criteria are provided here forcomparison only, not to imply a safety level for general population exposure. The 90th percentilefor blood cadmium reported in Table 4 is less than the OSHA blood cadmium level, and the 90th
percentile for urine cadmium shown in Table 5 is less that the OSHA urine cadmium level.Whether cadmium at the levels reported here is a cause for health concern is not yet known; moreresearch is needed.
The blood cadmium data indicate that exposure is similar among males and females as well asamong the racial or ethnic groups sampled. Levels were higher among people 20 years old andolder than among people aged 1 through 19 years.
These data provide physicians with a reference range so that they can determine whether peoplehave been exposed to higher levels of cadmium than those found in the general population. Thesedata will also help scientists plan and conduct research about cadmium exposure and health effects.

20
Table 4. Geometric mean and selected percentiles of blood cadmium concentrations (in µg/L) for theU.S. population, aged 1 year and older, by selected demographic groups, National Health andNutrition Examination Survey, 1999.
Samplesize
Selected percentiles(95% confidence interval)
10th 25th 50th 75th 90th
Total, age 1year and older
3,189 < LOD** < LOD 0.3(0.2-0.3)
0.5(0.4-0.6)
0.9(0.7-1.1)
Gender Males Females
1,594
1,595
< LOD
< LOD
< LOD
< LOD
< LOD
0.3(0.2-0.3)
0.5(0.4-0.6)
0.5(0.4-0.6)
0.9
(0.8-1.1)0.9
(0.7-1.2)
Race/Ethnicity
Black, non- Hispanic
693 < LOD < LOD < LOD 0.5(0.4-0.6)
0.9(0.7-1.2)
Mexican American
1,289 < LOD < LOD 0.3(0.2-0.4)
0.5(0.4-0.5)
0.7(0.6-1.0)
White, non- Hispanic*
1,207 < LOD < LOD 0.3(0.2-0.3)
0.5(0.4-0.6)
0.9(0.7-1.1)
Age Group
1-19 years 1,541 < LOD < LOD < LOD < LOD 0.4(0.3-1.0)
20+ years 1,648 < LOD < LOD 0.3(0.3-0.4)
0.6(0.5-0.7)
1.0(0.8-1.3)
Numbers in parentheses are 95% confidence intervals.* Includes other racial/ethnic groups.**Less than the limit of detection of the analytical method.

21
Table 5. Geometric mean and selected percentiles of urine cadmium concentrations and creatinine-adjusted levels for the U.S. population aged 6 years and older, National Health and NutritionExamination Survey, 1999.
Samplesize
Geometricmean(95%
confidenceinterval)
Selected percentiles(95 % confidence interval)
10th 25th 50th 75th 90th
µg/L ofurine
1,007 0.32(0.30-0.33)
0.10(0.08-0.12)
0.18(0.15-0.19)
0.33(0.29-0.35)
0.57(0.52-0.62)
0.95(0.85-1.04)
µg/g of creatinine*
1,007 0.29(0.27-0.31)
0.11(0.10-0.13)
0.17(0.15-0.19)
0.27(0.26-0.30)
0.46(0.43-0.50)
0.74(0.66-0.79)
Numbers in parentheses are 95% confidence intervals.* µg per gram of creatinine in urine.
Cobalt (CAS No. 7440-48-4)General Information
Cobalt is an element that occurs in nature either as a steel-gray, shiny, hard metal or combined withother elements. The cobalt used in U.S. industry is imported or obtained by recycling scrap metalthat contains cobalt. Among its many uses are making alloys (mixtures of metals), coloredpigments, and fertilizers. It is also used as a drier for paint and porcelain enamel used on steelbathroom fixtures, large appliances, and kitchenware. Small amounts of cobalt naturally occur infood. In addition, vitamin B12 is a cobalt-containing compound that is essential for good health.
Cobalt occurs naturally in dust, seawater, and many types of soil. It is also emitted into theenvironment from burning coal and oil and from car and truck exhaust.
Interpreting Urine Cobalt Levels Reported in the Table
Urine cobalt levels were measured in a subsample of NHANES participants aged 6 years and olderwho were selected to be representative of the U.S. population. Measuring cobalt at these levels inurine is possible because of advances in analytical chemistry. Finding a measurable amount ofcobalt in urine does not mean that the level of cobalt causes an adverse health effect.
There are no OSHA criteria for occupational levels of cobalt in blood or urine. The AmericanConference of Governmental Industrial Hygienists (ACGIH), a private organization, publishesbiological exposure indices (BEIs) and has determined that the BEI “generally indicate aconcentration below which nearly all workers should not experience adverse health effects.”9 TheBEIs generally correspond to the uptake levels expected when workers are exposed at air-exposure limits set by ACGIH. This organization notes that these values are for workers and that itis not appropriate to apply them to the general population. Information about the BEI level is

22
provided here for comparison, not to imply that the BEI is a safety level for general populationexposure. For urine cobalt, the BEI is 15µg/L.9 The 90th percentile of urine cobalt levels reportedin Table 6 is less than this level. Whether cobalt at the levels reported here is a cause for healthconcern is not yet known; more research is needed.
These data provide physicians with a reference range so that they can determine whether peoplehave been exposed to higher levels of cobalt than those found in the general population. These datawill also help scientists plan and conduct research about cobalt exposure and health effects.
Table 6. Geometric mean and selected percentiles of urine cobalt concentrations and creatinine-adjusted levels for the U.S. population aged 6 years and older, National Health and NutritionExamination Survey, 1999.
Samplesize
Geometricmean(95%
confidenceinterval)
Selected Percentiles(95% confidence interval)
10th 25th 50th 75th 90th
µg/L ofurine
1,007 0.36(0.32-0.40)
0.11(0.08-0.14)
0.23(0.19-0.26)
0.40(0.35-0.41)
0.60(0.54-0.68)
0.89(0.79-1.10)
µg/g ofcreatinine*
1,007 0.33(0.29-0.36)
0.14(0.12-0.16)
0.20(0.18-0.22)
0.30(0.27-0.34)
0.47(0.42-0.54)
0.80(0.63-1.11)
Numbers in parentheses are 95% confidence intervals.*µg per gram of creatinine in urine.
Uranium (CAS No. 7439-97-6)General Information
Uranium is a silver-white, extremely dense radioactive metal. It almost never occurs as anuncombined metal but rather as a compound with oxygen, chlorine, or fluorine. Uranium has manycommercial uses, including its use in nuclear weapons, nuclear fuel, armor-piercing shells, and incolored glass and ceramics.
Uranium exposure generally is associated with its commercial uses, occurring mostly by inhalingdust and other small particles. Some uranium can be absorbed from food and water, especially inareas where large amounts of uranium occur naturally.
Interpreting Uranium Levels Reported in the Table
Urine uranium levels were measured in a subsample of NHANES participants 6 years old and olderwho were selected to be representative of the U.S. population. The analytical method usedmeasured levels of the U 238 isotope, not levels of the U 235 isotope (the form of uranium used as

23
nuclear fuel). More than 99% of naturally occurring uranium is U 238. Measuring uranium at theselevels in urine is possible because of advances in analytical chemistry. Finding a measurable amountof uranium in urine does not mean that the level of uranium causes an adverse health effect. TheUnited States Nuclear Regulatory Commission has set an action level for uranium in urine toprotect workers occupationally exposed to uranium.10 This urine uranium level is 15µg/L. The 90th
percentile of urine uranium levels in Table 7 is below this level. Whether uranium at the levelsreported here is cause for health concern is not yet known; more research is needed.
These urine uranium data provide physicians with a reference range so that they can determinewhether people have been exposed to higher levels of uranium than those found in the generalpopulation. These data will also help scientists plan and conduct research about uranium exposureand health effects.
Table 7. Geometric mean and selected percentiles of uranium urine concentrations and creatinine-adjusted levels for the U.S. population aged 6 years and older, National Health and NutritionExamination Survey, 1999.
Samplesize
GeometricMean (95%confidenceinterval)
Selected percentiles(95% confidence intervals)
10th 25th 50th 75th 90th
µg/L ofurine
1,006 0.008(0.006-0.011)
< LOD** < LOD 0.007(0.004-0.010)
0.014(0.009-0.030)
0.034(0.022-0.053)
µg/g ofcreatinine*
1,006 --- < LOD < LOD (0.005)(0.002-0.009)
0.011(0.005-0.026)
0.024(0.015-0.109)
Numbers in parentheses are 95% confidence intervals.* µg per gram of creatinine in urine.**Less than the limit of detection of 0.004 µg/L in urine.
Antimony (CAS No. 7440-36-0)General Information
Elemental antimony is a silver-white metal. In nature, antimony can be found in ores or otherminerals, usually combined with oxygen to form antimony oxide. Antimony is used in storagebatteries, solder, sheet and pipe metal, bearings, castings, and pewter. Antimony oxide is added totextiles and plastics to prevent them from catching fire. It is also used in paints; ceramics;fireworks; and in enamels for plastics, metal, and glass.
Antimony gets into the environment from natural sources and from industry. Exposure to antimonycan come from food, drinking water, or air. Workplace exposure occurs as a result of breathing theair near industries such as smelters, coal-fired plants, and refuse incinerators that process or releaseantimony.
24
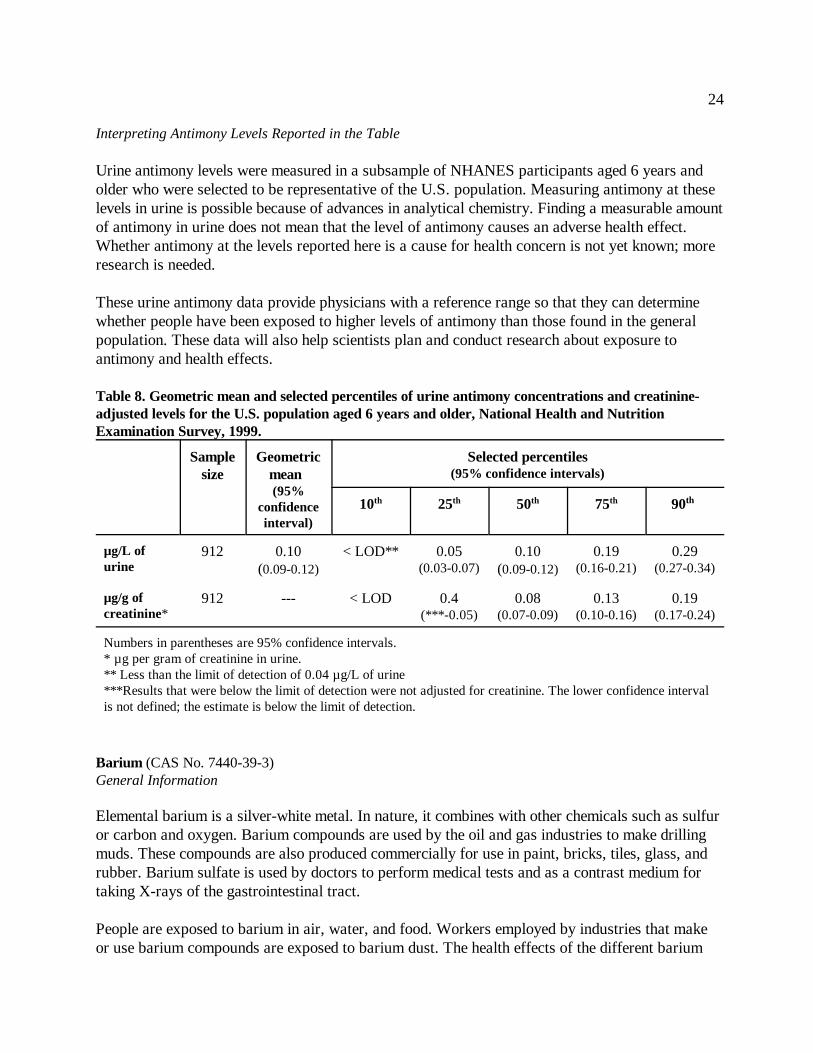
Interpreting Antimony Levels Reported in the Table
Urine antimony levels were measured in a subsample of NHANES participants aged 6 years andolder who were selected to be representative of the U.S. population. Measuring antimony at theselevels in urine is possible because of advances in analytical chemistry. Finding a measurable amountof antimony in urine does not mean that the level of antimony causes an adverse health effect.Whether antimony at the levels reported here is a cause for health concern is not yet known; moreresearch is needed.
These urine antimony data provide physicians with a reference range so that they can determinewhether people have been exposed to higher levels of antimony than those found in the generalpopulation. These data will also help scientists plan and conduct research about exposure toantimony and health effects.
Table 8. Geometric mean and selected percentiles of urine antimony concentrations and creatinine-adjusted levels for the U.S. population aged 6 years and older, National Health and NutritionExamination Survey, 1999.
Samplesize
Geometricmean (95%
confidenceinterval)
Selected percentiles(95% confidence intervals)
10th 25th 50th 75th 90th
µg/L ofurine
912 0.10(0.09-0.12)
< LOD** 0.05(0.03-0.07)
0.10(0.09-0.12)
0.19(0.16-0.21)
0.29(0.27-0.34)
µg/g ofcreatinine*
912 --- < LOD 0.4(***-0.05)
0.08(0.07-0.09)
0.13(0.10-0.16)
0.19(0.17-0.24)
Numbers in parentheses are 95% confidence intervals.* µg per gram of creatinine in urine.** Less than the limit of detection of 0.04 µg/L of urine***Results that were below the limit of detection were not adjusted for creatinine. The lower confidence intervalis not defined; the estimate is below the limit of detection.
Barium (CAS No. 7440-39-3)General Information
Elemental barium is a silver-white metal. In nature, it combines with other chemicals such as sulfuror carbon and oxygen. Barium compounds are used by the oil and gas industries to make drillingmuds. These compounds are also produced commercially for use in paint, bricks, tiles, glass, andrubber. Barium sulfate is used by doctors to perform medical tests and as a contrast medium fortaking X-rays of the gastrointestinal tract.
People are exposed to barium in air, water, and food. Workers employed by industries that makeor use barium compounds are exposed to barium dust. The health effects of the different barium

25
compounds depend on how well the compound dissolves in water.
Interpreting Barium Levels Reported in the Table
Urine barium levels were measured in a subsample of NHANES participants aged 6 years andolder who were selected to be representative of the U.S. population. Measuring barium at theselevels in urine is possible because of advances in analytical chemistry. Finding a measurable amountof barium in urine does not mean that the level of barium causes an adverse health effect. Whetherbarium at the levels reported here is a cause for health concern is not yet known; more research isneeded.
These urine barium data provide physicians with a reference range so that they can determinewhether people have been exposed to higher levels of barium than those found in the generalpopulation. These data will also help scientists plan and conduct research about exposure tobarium and health effects.
Table 9. Geometric mean and selected percentiles of urine barium concentrations and creatinine-adjusted levels for the U.S. population aged 6 years and older, National Health and NutritionExamination Survey, 1999.
Samplesize
Geometricmean(95%
confidenceinterval)
Selected percentiles(95% confidence interval)
10th 25th 50th 75th 90th
µg/L ofurine
779 1.6(1.5-1.7)
0.3(0.3-0.4)
0.8(0.7-0.9)
1.7(1.5-1.9)
2.9(2.7-3.3)
5.5(4.2-6.2)
µg/g ofcreatinine*
779 1.5(1.3-1.6)
0.4(0.4-0.6)
0.9(0.8-1.0)
1.5(1.4-1.6)
2.4(2.1-2.8)
4.5(3.9-5.1)
Numbers in parentheses are 95% confidence intervals.* µg per gram of creatinine in urine.
Beryllium (CAS No. 7440-41-7)General Information
Pure beryllium is a hard, gray metal. In nature, beryllium can be found in mineral rocks, coal, soil,and volcanic dust. Beryllium compounds are commercially mined, and the beryllium is purified foruse in mirrors; nuclear weapons; and electrical, aircraft, and machine parts. Beryllium compoundshave no distinctive smell. Beryllium dust gets into ambient air from burning coal and oil. Exposureto beryllium occurs mostly in the workplace, near some hazardous waste sites, and from breathingtobacco smoke.
26
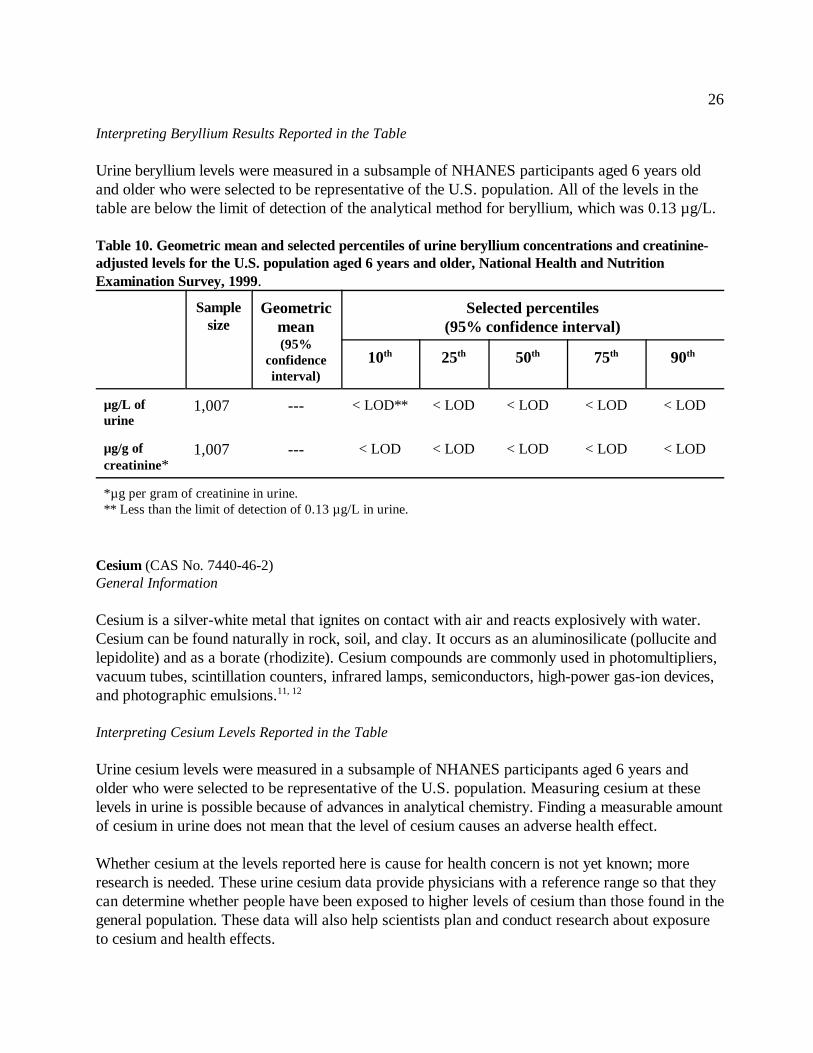
Interpreting Beryllium Results Reported in the Table
Urine beryllium levels were measured in a subsample of NHANES participants aged 6 years oldand older who were selected to be representative of the U.S. population. All of the levels in thetable are below the limit of detection of the analytical method for beryllium, which was 0.13 µg/L.
Table 10. Geometric mean and selected percentiles of urine beryllium concentrations and creatinine-adjusted levels for the U.S. population aged 6 years and older, National Health and NutritionExamination Survey, 1999.
Samplesize
Geometricmean(95%
confidenceinterval)
Selected percentiles(95% confidence interval)
10th 25th 50th 75th 90th
µg/L ofurine
1,007 --- < LOD** < LOD < LOD < LOD < LOD
µg/g ofcreatinine*
1,007 --- < LOD < LOD < LOD < LOD < LOD
*µg per gram of creatinine in urine.** Less than the limit of detection of 0.13 µg/L in urine.
Cesium (CAS No. 7440-46-2)General Information
Cesium is a silver-white metal that ignites on contact with air and reacts explosively with water.Cesium can be found naturally in rock, soil, and clay. It occurs as an aluminosilicate (pollucite andlepidolite) and as a borate (rhodizite). Cesium compounds are commonly used in photomultipliers,vacuum tubes, scintillation counters, infrared lamps, semiconductors, high-power gas-ion devices,and photographic emulsions.11, 12
Interpreting Cesium Levels Reported in the Table
Urine cesium levels were measured in a subsample of NHANES participants aged 6 years andolder who were selected to be representative of the U.S. population. Measuring cesium at theselevels in urine is possible because of advances in analytical chemistry. Finding a measurable amountof cesium in urine does not mean that the level of cesium causes an adverse health effect.
Whether cesium at the levels reported here is cause for health concern is not yet known; moreresearch is needed. These urine cesium data provide physicians with a reference range so that theycan determine whether people have been exposed to higher levels of cesium than those found in thegeneral population. These data will also help scientists plan and conduct research about exposureto cesium and health effects.

27
Table 11. Geometric mean and selected percentiles of urine cesium concentrations and creatinine-adjusted levels for the U.S. population aged 6 years and older, National Health and NutritionExamination Survey, 1999.
Samplesize
Geometricmean(95%
confidenceinterval)
Selected percentiles(95% confidence interval)
10th 25th 50th 75th 90th
µg/L ofurine
1,006 4.7(4.2-5.2)
1.8(1.4-2.2)
3.3(2.9-3.6)
5.3(4.7-5.8)
7.2(6.7-8.0)
9.6(8.5-11.6)
µg/g ofcreatinine*
1,006 4.3(3.8-4.7)
2.5(2.1-2.7)
3.2(2.9-3.5)
4.2(3.8-4.6)
5.4(4.9-6.3)
7.1(6.5-8.7)
*µg per gram of creatinine in urine.Numbers in parentheses are 95% confidence intervals.
Molybdenum (CAS No. 7439-98-7)General Information
Molybdenum occurs naturally in compounds with other elements. Elemental molybdenum is asilver-white, hard metal with many commercial uses, including the production of metal alloys.Molybdenum is also a nutritionally essential trace element.
Molybdenum enters the environment from the weathering of ores that contain it and from watercontaining the metal in its soluble forms. In industry, the dust and other fine particles produced inrefining or shaping molybdenum are the most important sources of exposure.
Interpreting Molybdenum Levels Reported in the Table
Urine molybdenum levels were measured in a subsample of NHANES participants aged 6 yearsand older who were selected to be representative of the U.S. population. Measuring molybdenumat these levels is possible because of advances in analytical chemistry. Finding a measurable amountof molybdenum in urine does not mean that the level of molybdenum causes an adverse healtheffect. Whether molybdenum at the levels reported here is cause for health concern is not yetknown; more research is needed.
These urine molybdenum data provide physicians with a reference range so that they can determinewhether people have been exposed to higher levels of molybdenum than those found in the generalpopulation. These data will also help scientists plan and conduct research about molybdenumexposure and health effects.

28
Table 12. Geometric mean and selected percentiles of molybdenum urine concentrations andcreatinine-adjusted levels for the U.S. population aged 6 years and older, National Health andNutrition Examination Survey, 1999.
Samplesize
Geometricmean(95%
confidenceinterval)
Selected percentiles(95% confidence interval)
10th 25th 50th 75th 90th
µg/L ofurine
904 48.4(43.6-53.2)
13.1(10.8-17.3)
27.6(23.4-32.8)
53.3(47.3-61.5)
86.6(78.6-97.5)
140(120-174)
µg/g ofcreatinine*
904 43.9(40.6-47.2)
19.0(15.4-23.3)
28.4(26.6-29.3)
41.1(38.6-44.9)
65.2(61.4-71.5)
113(90.6-126)
*µg per gram of creatinine in urine.Numbers in parentheses are 95% confidence intervals.
Platinum (CAS No. 7440-06-4)General Information
Platinum is a silver-gray, lustrous, malleable metal found naturally in the earth’s crust and typicallyis associated with nickel, copper, or iron-sulfide seams. Important properties of platinum and thecompounds it forms are resistance to corrosion, strength at high temperatures, and high catalyticactivity.
Platinum-rhodium and platinum-palladium crystals are used to reduce automobile-exhaustemissions. Platinum-rhodium compounds are used in glass and glass-fiber manufacture and in high-temperature thermocouples. Other platinum compounds have a variety of uses, includinganticancer treatments. Platinum compounds are also used in electrodes and jewelry, as oxidationcatalysts in chemical manufacturing, and in thick-film circuits printed on ceramic substrates.11, 12
Interpreting Platinum Levels Reported in the Table
Urine platinum levels were measured in a subsample of NHANES participants aged 6 years andolder who were selected to be representative of the U.S. population. All of the levels in the tableare below the limit of detection of the analytical method for platinum, which was 0.04 µg/L.

29
Table 13. Geometric mean and selected percentiles of platinum urine concentrations and creatinine-adjusted levels for the U.S. population aged 6 years and older, National Health and NutritionExamination Survey, 1999.
Samplesize
Geometricmean(95%
confidenceinterval)
Selected percentiles(95% confidence interval)
10th 25th 50th 75th 90th
µg/L ofurine
1,007 --- < LOD** < LOD < LOD < LOD < LOD
µg/g ofcreatinine*
1,007 --- < LOD < LOD < LOD < LOD < LOD
*µg per gram of creatinine in urine.** Less than the limit of detection of 0.04µg/L in urine.
Thallium (CAS No. 7440-28-0)General Information
Elemental thallium is a blue-white metal that is found in small amounts in soil and rocks. In thepast, thallium was obtained as a byproduct of smelting other metals; however, it has not beenproduced in the United States since 1984. Thallium and most of its compounds are odorless andtasteless.
Thallium exposure occurs primarily from commercial processes such as coal-burning and smelting.In these and other sources, thallium is produced in fine particles that can then be absorbed bybreathing. One rare, but significant, accidental exposure to thallium can occur by eating rat poisonthat contains water-soluble thallium salts. In the United States, thallium has been banned for use inrat poisons.
Interpreting Thallium Levels Reported in the Table
Urine thallium levels were measured in a subsample of NHANES participants aged 6 years andolder who were selected to be representative of the U.S. population. Measuring thallium at theselevels in urine is possible because of advances in analytical chemistry. Finding a measurable amountof thallium in urine does not mean that the level of thallium causes an adverse health effect.Whether thallium at the levels reported here is a cause for health concern is not yet known; moreresearch is needed.
These urine thallium data provide physicians with a reference range so that they can determinewhether people have been exposed to higher levels of thallium than those found in the generalpopulation. These data will also help scientists plan and conduct research about thallium exposureand health effects.

30
Table 14. Geometric mean and selected percentiles of urine thallium concentrations and creatinine-adjusted levels for the U.S. population aged 6 years and older, National Health and NutritionExamination Survey, 1999.
Samplesize
Geometricmean(95%
confidenceinterval)
Selected percentiles(95% confidence interval)
10th 25th 50th 75th 90th
µg/L ofurine
974 0.19(0.17-0.20)
0.07(0.06-0.07)
0.12(0.10-0.13)
0.21(0.19-0.23)
0.30(0.28-0.33)
0.42(0.39-0.45)
µg/g ofcreatinine*
974 0.17(0.16-0.18)
0.09(0.08-0.09)
0.13(0.11-0.14)
0.17(0.16-0.18)
0.22(0.21-0.24)
0.29(0.27-0.35)
Numbers in parentheses are 95% confidence intervals.*µg per gram of creatinine in urine.
Tungsten (CAS No. 7440-33-7)General Information
Tungsten, also known as wolfram, is a steel-gray to tin-white metal naturally occurring in theearth’s crust, mainly as scheelite (CaWO4). A major use of tungsten is in the production of hardmetals (i.e., tungsten carbide, which is common in rock drills and metal-cutting tools; orferrotungsten, which is used in the steel industry). Additionally, tungsten compounds are used ascatalysts in the petroleum industry, as lubricating agents, in filaments for incandescent lamps, andas bronzes in pigments.11, 12
Interpreting Tungsten Levels Reported in the Table
Urine tungsten levels were measured in a subsample of NHANES participants aged 6 years andolder who were selected to be representative of the U.S. population. Measuring tungsten at theselevels in urine is possible because of advances in analytical chemistry. Finding a measurable amountof tungsten in urine does not mean that the level of tungsten causes an adverse health effect.Whether tungsten at the levels reported here is a cause for health concern is not yet known; moreresearch is needed.
These urine tungsten data provide physicians with a reference range so that they can determinewhether people have been expose to higher levels of tungsten than those found in the generalpopulation. These data will also help scientists plan and conduct research about tungsten exposureand health effects.

31
Table 15. Geometric mean and selected percentiles of tungsten urine concentrations and creatinine-adjusted levels in the U.S. population aged 6 years and older, National Health and NutritionExamination Survey, 1999.
Samplesize
Geometricmean(95%
confidenceinterval)
Selected percentiles(95% confidence interval)
10th 25th 50th 75th 90th
µg/L ofurine
892 0.10(0.09-0.12)
< LOD** 0.05(0.03-0.06)
0.10(0.08-0.11)
0.18(0.16-0.22)
0.32(0.27-0.45)
µg/g ofcreatinine*
892 --- < LOD 0.03(***-0.05)
0.07(0.06-0.09)
0.14(0.11-0.18)
0.23(0.19-0.38)
Numbers in parentheses are 95% confidence intervals.*µg per gram of creatinine in urine.** Less than the limit of detection of 0.04µg/L of urine.***Results that were below the limit of detection were not adjusted for creatinine. The lower confidence intervalis not defined; the estimate is below the limit of detection.


33
Tobacco Smoke
Cotinine (CAS No. 486-56-6)General Information
Tobacco use is the most important, preventable cause of premature morbidity and mortality in theUnited States. The consequences of smoking and the use of smokeless tobacco products are wellknown and include, but are not limited to, an increased risk for cancer, emphysema, andcardiovascular disease. For example, lung cancer is the number-one cancer killer of both men andwomen in the United States, and smoking is by far the leading cause of lung cancer. Environmentaltobacco smoke (ETS) is a known human carcinogen, and persistent exposure to ETS is associatedwith an increased risk for lung cancer and other disease. Children are at particular risk from ETS,which may exacerbate asthma among susceptible children and also greatly increase the risk forlower respiratory-tract illness, such as bronchitis and pneumonia, among young children.
Cotinine is a major metabolite of nicotine and is currently regarded as the best biomarker forexposure of active smokers and nonsmokers to ETS. Measuring cotinine is preferred overmeasuring nicotine because, although both are specific for exposure to tobacco, cotinine is retainedin the body much longer than nicotine. Cotinine can be measured in blood (i.e., in serum), urine,saliva, and hair. Nonsmokers exposed to typical levels of ETS have cotinine levels of less than 1ng/mL, with heavy exposure to ETS producing levels in the 1-15 ng/mL range. Active smokersalmost always have levels higher than 15 ng/mL and sometimes greater than 500 ng/mL.
Interpreting Cotinine Levels Reported in the Table
Table 16 presents data for the U.S. nonsmoking population aged 3 years and older. For theseresults, nonsmoking is defined as a serum cotinine level less than or equal to (<) 15 ng/mL, andfor people 12 years and older, no reported use of tobacco or nicotine-containing products in thelast 5 days. The limit of detection (LOD) for these measurements was 0.050 ng/mL.
From 1988 through 1991, as part of NHANES III, CDC determined that the median level (50th
percentile) of cotinine among nonsmokers in the United States was 0.20 ng/mL.5 Results shown inTable 16 show that the median cotinine level in 1999 has decreased to less than 0.050ng/mL— more than a 75% decrease. This reduction in cotinine levels objectively documents adramatic reduction in exposure of the general U.S. population to ETS since the period 1988-1991.
Compared with results for the period 1988-1991 for population groups defined by age, sex, andrace or ethnicity,5 all results in Table 16 show declines in cotinine levels. Previously, higher levelsof cotinine have been noted for non-Hispanic blacks,13 and although levels for this populationgroup have declined, they are still higher than those of other racial or ethnic groups. As seenpreviously,5 males continue to have higher levels than females, and people 20 years old and olderhave lower levels than those younger than 20 years of age. Table 16 appears on the next page.
sog3
<

34
Table 16. Selected percentile of serum cotinine concentrations (in ng/mL) for the U.S. nonsmokingpopulation aged 3 years and older, National Health and Nutrition Examination Survey, 1999.
Samplesize
Selected percentiles(95% confidence intervals)
10th 25th 50th 75th 90th
Total, age 3years and older
2,263 < LOD*** < LOD < LOD 0.15(0.11-0.23)
0.52(0.38-1.01)
Gender
Males 1,075 < LOD < LOD 0.6(0.04-0.09)
0.20(0.13-0.31)
0.61(0.41-1.46)
Females 1,188 < LOD < LOD < LOD 0.12(0.09-0.17)
0.46(0.30-0.93)
Race/Ethnicity
Black, non- Hispanic*
467 < LOD < LOD 0.12(0.10-0.14)
0.50(0.42-0.67)
1.59(1.14-2.16)
Mexican American
937 < LOD < LOD < LOD 0.12(0.08-0.24)
0.34(0.21-1.01)
White, non- Hispanic**
859 < LOD < LOD < LOD 0.12(0.09-0.21)
0.45(0.30-1.01)
Age Group
3-19 years 1,152 < LOD < LOD 0.07(0.04-0.13)
0.32(0.16-0.63)
1.13(0.58-2.77)
20+ years 937 < LOD < LOD < LOD 0.12(0.09-0.15)
0.38(0.30-0.56)
Numbers in parentheses are 95% confidence intervals.*Research in progress to determine whether levels for black, non-Hispanic people may be affected by biologicalfactors.**Includes other racial/ethnic groups.***Less than the limit of detection of 0.05ng/mL in serum.

35
Organophosphate PesticidesGeneral Information
Organophosphate pesticides account for about half of the insecticides used in the United States.Approximately 60 million pounds of organophosphate pesticides are applied to about 60 millionacres of U.S. agricultural crops annually; nonagricultural uses account for about 17 million poundsper year.14 Organophosphate pesticides are active against a broad spectrum of insects and are usedon food crops as well as in residential and commercial buildings and on ornamental plants andlawns. Exposure of the general population to these pesticides occurs primarily from ingestion offood products or from residential use.
About 75% of the registered pesticides metabolize to the dialkyl phosphate metabolites.15 ThisReport provides measurements in urine for the following six urinary metabolites oforganophosphate pesticides:
# Dimethylphosphate (DMP).# Dimethylthiophosphate (DMTP).# Dimethyldithiophosphate (DMDTP).# Diethylphosphate (DEP).# Diethylthiophosphate (DEPT).# Diethyldithiophosphate (DEDTP).
Table 17 shows the six urinary metabolites and their parent organophosphate pesticides. Forexample, chlorpyrifos metabolizes to diethylphosphate and diethythiophosphate. Measurement ofthese metabolites reflects exposure to organophosphate pesticides that has occurred predominantlyin the last few days. Note that each of the six urinary metabolites can be produced from themetabolism of more than one organophosphate pesticide. In addition to reflecting exposure to theparent pesticides, the level of the metabolite in a person’s urine may also reflect exposure to themetabolite itself if it was present in the person’s environment.
The mechanism of toxicity of the organophosphate pesticides is inhibition of acetylcholinesterase,which catalyzes the deacetylation of acetylcholine. Acetylcholine helps transfer nerve impulsesbetween nerve cells or from a nerve cell to other types of cells, such as muscle cells. Inhibition ofthe enzyme acetylcholinesterase leads to the build-up of acetylcholine, which then overstimulatesmuscles, causing symptoms such as weakness and sometimes paralysis.
Interpreting Organophosphate Metabolite Levels in the Tables
Urine levels of metabolites of organophosphate pesticides were measured in a subsample ofNHANES participants 6 through 59 years of age who were selected to be representative of theU.S. population. As noted above, a particular metabolite may come from multiple parentorganophosphate pesticides. Measuring these metabolites at these levels in urine is possiblebecause of advances in analytical chemistry. Finding a measurable amount of one or moremetabolites in urine does not mean that the level of the organophosphates causes an adverse healtheffect. Whether organophosphate pesticides at the levels of metabolites reported here are a cause

36
for health concern is not known; more research is needed.
These data provide physicians with a reference range so that they can determine whether peoplehave been exposed to higher levels of organophosphate pesticides than those experienced in thegeneral population. Tables 18-23 summarize results of these tests. These data will help scientistsplan and conduct research about exposure to organophosphate pesticides and health effects.
Table 17. Organophosphate pesticides and their metabolites
Pesticide DMP* DMTP DMDTP DEP DEPT DEDTP
Azinphos methyl X X X
Chlorethoxyphos X X
Chlorpyrifos X X
Chlorpyrifos methyl X X
Coumaphos X X
Dichlorvos (DDVP) X
Diazinon X X
Dicrotophos X
Dimethoate X X
Disulfoton X X X
Ethion X X X
Fenitrothion X X
Fenthion X X
Isazaphos-methyl X X
Malathion X X X
Methidathion X X X
Methyl parathion X X
Naled X
Oxydemeton-methyl X X
Parathion X X
Phorate X X X
Phosmet X X X
Pirimiphos-methyl X X
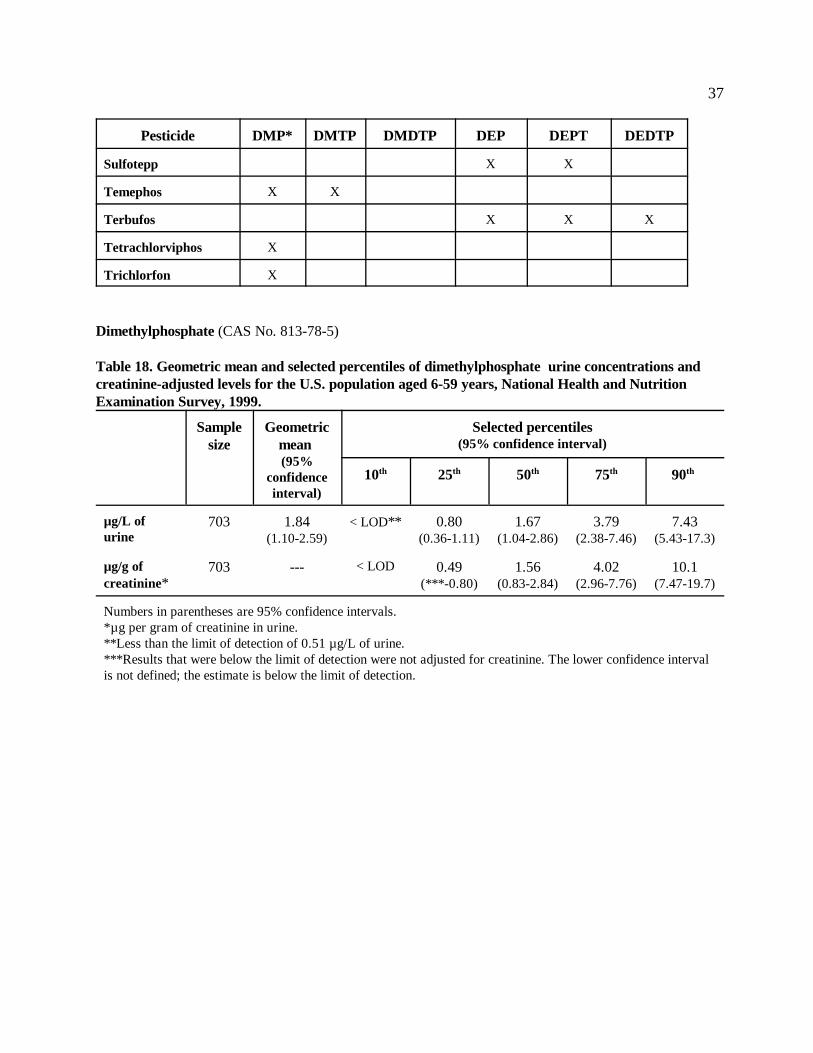
37
Pesticide DMP* DMTP DMDTP DEP DEPT DEDTP
Sulfotepp X X
Temephos X X
Terbufos X X X
Tetrachlorviphos X
Trichlorfon X
Dimethylphosphate (CAS No. 813-78-5)
Table 18. Geometric mean and selected percentiles of dimethylphosphate urine concentrations andcreatinine-adjusted levels for the U.S. population aged 6-59 years, National Health and NutritionExamination Survey, 1999.
Samplesize
Geometricmean (95%
confidenceinterval)
Selected percentiles(95% confidence interval)
10th 25th 50th 75th 90th
µg/L ofurine
703 1.84(1.10-2.59)
< LOD** 0.80(0.36-1.11)
1.67(1.04-2.86)
3.79(2.38-7.46)
7.43(5.43-17.3)
µg/g of creatinine*
703 --- < LOD 0.49(***-0.80)
1.56(0.83-2.84)
4.02(2.96-7.76)
10.1(7.47-19.7)
Numbers in parentheses are 95% confidence intervals.*µg per gram of creatinine in urine.**Less than the limit of detection of 0.51 µg/L of urine.***Results that were below the limit of detection were not adjusted for creatinine. The lower confidence intervalis not defined; the estimate is below the limit of detection.

38
Dimethylthiophosphate (CAS No. 1112-38-5)
Table 19. Geometric mean and selected percentiles of dimethylthiophosphate urine concentrations andcreatinine-adjusted levels for the U.S. population aged 6-59 years, National Health and NutritionExamination Survey, 1999.
Samplesize
Geometricmean (95%
confidenceinterval)
Selected percentiles(95% confidence interval)
10th 25th 50th 75th 90th
µg/L ofurine
703 2.61(1.77-3.45)
< LOD** 0.72(0.13-1.73)
3.80(2.93-4.53)
9.00(7.35-12.3)
22.9(18.7-30.7)
µg/g of creatinine*
703 --- < LOD** 0.59(***-0.42)
3.08(2.33-3.53)
7.87(6.16-11.5)
23.6(17.0-27.2)
Numbers in parentheses are 95% confidence intervals.*µg per gram of creatinine in urine.**Less than the limit of detection of 0.18 µg/L in urine.***Results that were below the limit of detection were not adjusted for creatinine. The lower end of theconfidence interval is not defined; the estimate is below the limit of detection.
Dimethyl dithiophosphate (CAS No. 756-80-9)
Table 20. Geometric mean and selected percentiles of dimethyldithiophosphate urine concentrationsand creatinine-adjusted levels for the U.S. population aged 6-59 years, National Health and NutritionExamination Survey, 1999.
Samplesize
Geometricmean (95%
confidenceinterval)
Selected percentiles(95% confidence interval)
10th 25th 50th 75th 90th
µg/L ofurine
703 0.51(0.39-0.62)
< LOD** < LOD 0.60(0.39-0.78)
2.05(1.65-2.42)
5.43(3.16-10.3)
µg/g of creatinine*
703 --- < LOD < LOD 0.42(0.31-0.55)
1.57(1.31-2.00)
5.33(3.99-6.72)
Numbers in parentheses are 95% confidence intervals.*µg per gram of creatinine in urine.**Less than the limit of detection of 0.08 µg/L in urine.

39
Diethylphosphate (CAS No. 598-02-7)
Table 21. Geometric mean and selected percentiles of diethylphosphate urine concentrations andcreatinine-adjusted levels for the U.S. population aged 6-59 years, National Health and NutritionExamination Survey, 1999.
Samplesize
Geometricmean (95%
confidenceinterval)
Selected percentiles(95% confidence interval)
10th 25th 50th 75th 90th
µg/L ofurine
703 2.55(1.33-3.78)
0.78(0.70-0.90)
1.09(0.93-1.31)
1.85(1.19-4.11)
4.87(2.58-14.0)
10.6(6.29-**)
µg/g of creatinine*
703 2.24(1.11-3.37)
0.43(0.40-0.49)
0.81(0.48-1.25)
1.87(1.12-4.13)
5.85(2.77-12.1)
12.13(8.69-26.9)
Numbers in parentheses are 95% confidence intervals.*µg per gram of creatinine in urine.**Upper end of confidence interval cannot be reliably estimated.
Diethylthiophosphate (CAS No. 5871-17-0)
Table 22. Geometric mean and selected percentiles of diethylthiophosphate urine concentrations andcreatinine-adjusted levels for the U.S. population aged 6-59 years, National Health and NutritionExamination Survey, 1999.
Samplesize
Geometricmean (95%
confidenceinterval)
Selected percentiles(95% confidence interval)
10th 25th 50th 75th 90th
µg/L ofurine
703 0.81(0.69-0.94)
0.51(0.41-0.53)
0.58(0.55-0.59
0.70(0.64-0.78)
0.98(0.78-1.45)
1.52(1.16-2.91)
µg/g of creatinine*
703 0.71(0.56-0.87)
0.26(0.24-0.29)
0.38(0.33-0.42)
0.64(0.47-0.84)
1.25(0.91-1.90)
2.32(1.85-3.00)
Numbers in parentheses are 95% confidence intervals.*µg per gram of creatinine in urine.

40
Diethyldithiophosphate (CAS No. 298-06-6)
Table 23. Geometric mean and selected percentiles of diethyldithiophosphate urine concentrations andcreatinine-adjusted levels for the U.S. population aged 6-59 years, National Health and NutritionExamination Survey, 1999.
Samplesize
Geometricmean (95%
confidenceinterval)
Selected percentiles(95% confidence interval)
10th 25th 50th 75th 90th
µg/L ofurine
703 0.19(0.14-0.23)
0.08(0.07-0.08)
0.09(0.09-0.09)
0.14(0.09-0.26)
0.30(0.25-0.39)
0.54(0.44-0.86)
µg/g of creatinine*
703 0.16(0.12-0.21)
0.04(0.04-0.05)
0.07(0.05-0.09)
0.14(0.10-0.21)
0.33(0.22-0.49)
0.70(0.55-0.91)
Numbers in parentheses are 95% confidence intervals.*µg per gram of creatinine in urine.

41
PhthalatesGeneral Information
Phthalates are industrial chemicals commonly found in many consumer products, including vinylflooring and wall covering; detergents; lubricating oils; solvents; food packaging; and personal-careproducts such as soaps, shampoo, hair spray, and nail polish. Other phthalates are used in flexibleplastics, such as blood bags, tubing, or children’s toys, and in some pharmaceutical and pesticideformulations.
Results of animal studies have found that some phthalates given at very high doses to animalsduring pregnancy produce birth defects among offspring.16, 17 Table 24 shows the relation betweenphthalates and their metabolites and also includes their commonly used abbreviations.
Table 24. Phthalates and their metabolites
Phthalate name Abbreviation CAS Number Primary urine metabolite
Diethyl phthalate DEP 84-66-2 Mono-ethyl phthalate
Dibutyl phthalate DBP 84-74-2 Mono-butyl phthalate
Benzylbutyl phthalate BzBP 85-68-7 Mono-benzyl phthalate
Dicyclohexyl phthalate DCHP 84-61-7 Mono-cyclohexyl phthalate
Di-2-ethylhexyl phthalate DEHP 117-81-7 Mono-2-ethylhexyl phthalate
Dioctyl phthalate DOP 117-84-0 Mono-n-octyl phthalate
Di-isononyl phthalate DINP 28553-12-0 Mono-isononyl phthalate
Interpreting Phthalate Metabolite Levels Reported in the Tables
Urine levels of phthalates were measured in a subsample of NHANES participants aged 6 yearsand older who were selected to be representative of the U.S. population. Results are presented intables 25-31. Measuring phthalate metabolites at these levels in urine is possible because ofadvances in analytical chemistry. Finding a measurable amount of one or more phthalatemetabolites in urine does not mean that the level of one or more of these causes an adverse healtheffect. Whether phthalates at the levels of metabolites reported here are a cause for health concernis not yet known; more research is needed.
These levels of phthalate metabolites in urine provide physicians with a reference range so that theycan determine whether people have been exposed to higher levels of phthalates than thoseexperienced in the general population. These data will also help scientists plan and conductresearch on phthalate exposure and health effects.

42
Mono-ethyl Phthalate (CAS No. 2306-33-4)(Metabolized from diethyl phthalate, CAS No. 84-66-2)
People exposed to diethyl phthalate will excrete mono-ethyl phthalate in their urine. The amount ofmono-ethyl phthalate is an indicator of how much contact with diethyl phthalate has occurred.Diethyl phthalate is an industrial solvent used in many consumer products, particularly thosecontaining fragrances. Products that may contain diethyl phthalate include perfume, cologne, soap,shampoo, and hand lotion.
Table 25. Geometric mean and selected percentiles of mono-ethyl phthalate urine concentrations andcreatinine-adjusted levels for the U.S. population, aged 6 years and older, National Health andNutrition Examination Survey, 1999.
Samplesize
Geometricmean (95%
confidenceinterval)
Selected percentiles(95% confidence interval)
10th 25th 50th 75th 90th
µg/L ofurine
1,024 176.0(132-220)
27.7(17.5-38.3)
61.5(43.1-80.0)
171(121-226)
424(362-563)
1160(971-1,350)
µg/g of creatinine*
1,024 151.5(121-182)
30.8(20.5-42.7)
63.9(45.6-84.3)
134(112-152)
337(265-402)
892(716-1,400)
Numbers in parentheses are 95% confidence intervals.*µg per gram of creatinine in urine.
Mono-butyl Phthalate (CAS No. 131-70-4)(Metabolized from dibutyl phthalate, CAS No. 84-66-2)
People exposed to dibutyl phthalate will excrete mono-butyl phthalate in their urine. The amountof mono-butyl phthalate is an indicator of how much contact with dibutyl phthalate has occurred.Dibutyl phthalate is an industrial solvent used in many consumer products such as nail polish,cosmetics, and insecticides.

43
Table 26. Geometric mean and selected percentiles of mono-butyl phthalate urine concentrations andcreatinine-adjusted levels for the U.S. population aged 6 years and older, National Health andNutrition Examination Survey, 1999.
Samplesize
Geometricmean (95%
confidenceinterval)
Selected percentiles(95% confidence interval)
10th 25th 50th 75th 90th
µg/L ofurine
1,029 26.7(23.9-29.4)
5.9(4.6-7.3)
13.2(10.5-15.4)
27.5(24.6-31.5)
53.8(51.2-59.7)
98.6(89.1-122)
µg/g of creatinine*
1,029 23.0(20.9-25.0)
8.2(6.2-9.5)
13.0(11.9-14.6)
22.0(19.4-24.6)
38.7(34.2-42.6)
69.0(56.2-93.0)
Numbers in parentheses are 95% confidence intervals.*µg per gram of creatinine in urine.
Mono-benzyl Phthalate (CAS No. 2528-16-7)(Metabolized from benzylbutyl phthalate, CAS No. 85-68-7)
People exposed to benzylbutyl phthalate will excrete mono-benzyl phthalate in their urine. Theamount of mono-benzyl phthalate is an indicator of how much contact with dibutyl phthalate hasoccurred. Benzylbutyl phthalate is an industrial solvent used in many consumer products such asadhesives, sealants, cosmetics, and car-care products.
Table 27. Geometric mean and selected percentiles of mono-benzyl phthalate urine concentrations andcreatinine-adjusted levels for the U.S. population aged 6 years and older, National Health andNutrition Examination Survey, 1999.
Samplesize
Geometricmean (95%
confidenceinterval)
Selected percentiles(95% confidence interval)
10th 25th 50th 75th 90th
µg/L ofurine
1.029 17.4(14.1-20.7)
3.5(2.2-4.5)
8.0(5.9-9.8)
18.5(15.4-22.6)
38.6(31.5-48.7)
82.3(64.0-101)
µg/g of creatinine*
1,029 15.0(12.8-17.2)
4.7(3.9-5.2)
8.0(6.3-9.5)
14.2(12.3-16.0)
25.7(23.2-30.3)
57.5(44.0-72.7)
Numbers in parentheses are 95% confidence intervals.*µg per gram of creatinine in urine.
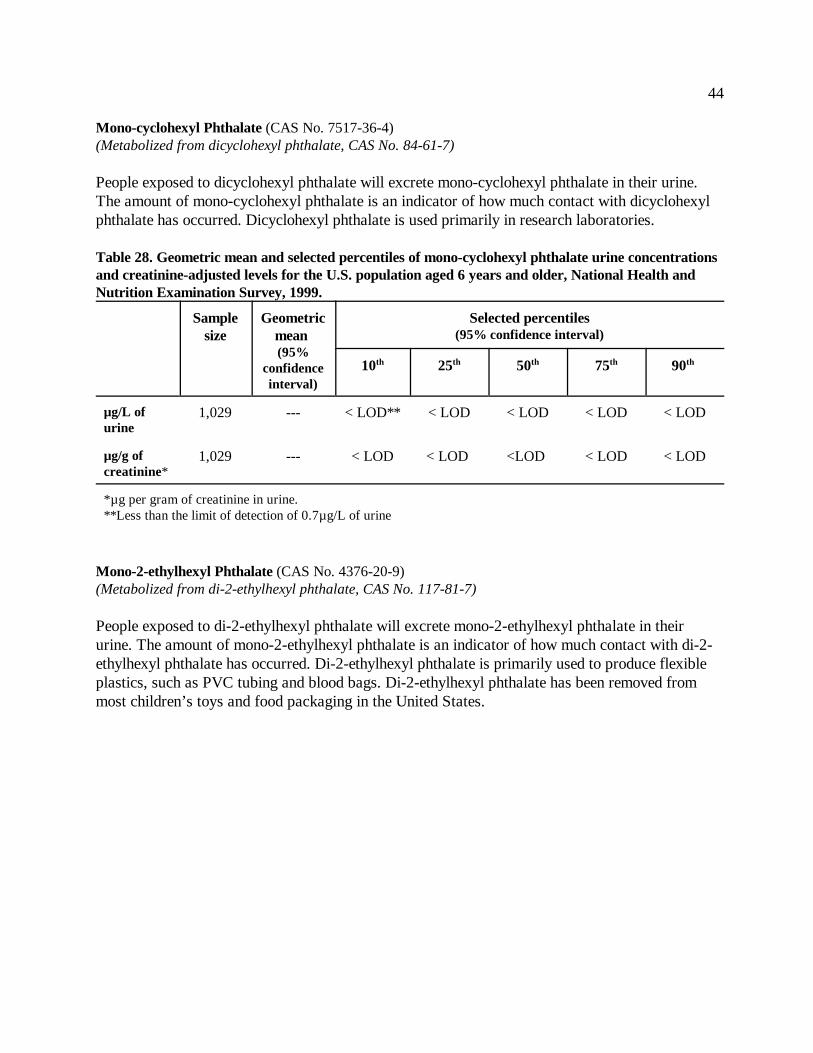
44
Mono-cyclohexyl Phthalate (CAS No. 7517-36-4)(Metabolized from dicyclohexyl phthalate, CAS No. 84-61-7)
People exposed to dicyclohexyl phthalate will excrete mono-cyclohexyl phthalate in their urine.The amount of mono-cyclohexyl phthalate is an indicator of how much contact with dicyclohexylphthalate has occurred. Dicyclohexyl phthalate is used primarily in research laboratories.
Table 28. Geometric mean and selected percentiles of mono-cyclohexyl phthalate urine concentrationsand creatinine-adjusted levels for the U.S. population aged 6 years and older, National Health andNutrition Examination Survey, 1999.
Samplesize
Geometricmean (95%
confidenceinterval)
Selected percentiles(95% confidence interval)
10th 25th 50th 75th 90th
µg/L ofurine
1,029 --- < LOD** < LOD < LOD < LOD < LOD
µg/g of creatinine*
1,029 --- < LOD < LOD <LOD < LOD < LOD
*µg per gram of creatinine in urine.**Less than the limit of detection of 0.7µg/L of urine
Mono-2-ethylhexyl Phthalate (CAS No. 4376-20-9)(Metabolized from di-2-ethylhexyl phthalate, CAS No. 117-81-7)
People exposed to di-2-ethylhexyl phthalate will excrete mono-2-ethylhexyl phthalate in theirurine. The amount of mono-2-ethylhexyl phthalate is an indicator of how much contact with di-2-ethylhexyl phthalate has occurred. Di-2-ethylhexyl phthalate is primarily used to produce flexibleplastics, such as PVC tubing and blood bags. Di-2-ethylhexyl phthalate has been removed frommost children’s toys and food packaging in the United States.

45
Table 29. Geometric mean and selected percentiles of mono-2-ethylhexyl phthalate urineconcentrations and creatinine-adjusted levels for the U.S. population aged 6 years and older, NationalHealth and Nutrition Examination Survey, 1999.
Samplesize
Geometricmean (95%
confidenceinterval)
Selected percentiles(95% confidence interval)
10th 25th 50th 75th 90th
µg/L ofurine
1,029 3.5(3.0-4.0)
< LOD** 1.5(0.8-1.9)
3.3(3.0-3.8)
7.7(6.1-9.6)
13.6(11.2-17.3)
µg/g of creatinine*
1,029 --- < LOD 1.1(0.7-1.3)
2.8(2.3-3.3)
5.2(4.5-6.2)
9.1(7.4-11.2)
Numbers in parentheses are 95% confidence intervals.*µg per gram of creatinine in urine.**Less than the limit of detection of 1.2 Fg/L of urine
Mono-n-octyl Phthalate (CAS No. 5393-19-1)(Metabolized from dioctyl phthalate, CAS No. 117-84-0)
People exposed to dioctyl phthalate will excrete mono-n-octyl phthalate in their urine. The amountof mono-n-octyl phthalate is an indicator of how much contact with dioctyl phthalate has occurred.Dioctyl phthalate is used primarily to produce flexible plastics.
Table 30. Geometric mean and selected percentiles of mono-n-octyl phthalate urine concentrations andcreatinine-adjusted levels for the U.S. population aged 6 years and older, National Health andNutrition Examination Survey, 1999.
Samplesize
Geometricmean (95%
confidenceinterval)
Selected percentiles(95% confidence interval)
10th 25th 50th 75th 90th
µg/L ofurine
1,029 --- < LOD** < LOD < LOD < LOD 1.9(1.2-3.5)
µg/g of creatinine*
1,029 --- < LOD < LOD < LOD < LOD 1.3(0.7-2.9)
Numbers in parentheses are 95% confidence intervals.*µg per gram of creatinine in urine.**Less than the limit of detection of 0.9 µg/L of urine

46
Mono-isononyl Phthalate (Metabolized from di-isononyl phthalate, CAS No. 28553-12-0)
People exposed to di-isononyl phthalate will excrete mono-isononyl phthalate in their urine. Theamount of mono-isononyl phthalate is an indicator of how much contact with di-isononyl phthalatehas occurred. Di-isononyl phthalate is actually a mixture of many compounds. These compoundsare produced with side alkyl chains of C8, C9, and C10 isomers. Di-isononyl phthalate is primarilyused to produce flexible plastics.
Table 31. Geometric mean and selected percentiles of mono-isononyl phthalate urine concentrationsand creatinine-adjusted levels for the U.S. population aged 6 years and older, National Health andNutrition Examination Survey, 1999.
Samplesize
Geometricmean (95%
confidenceinterval)
Selected percentiles(95% confidence interval)
10th 25th 50th 75th 90th
µg/L ofurine
1,029 --- < LOD** < LOD < LOD 0.6(0.6-0.9)
4.3(0.6-22.3)
µg/g of creatinine*
1,029 --- < LOD < LOD < LOD < LOD 3.8(0.2-12.1)
Numbers in parentheses are 95% confidence intervals.*µg per gram of creatinine in urine.**Less than the limit of detection of 0.8 µg/L of urine

47
References
1. Brody D, Pirkle JL, Kramer R, Gunter EW, Matte TD, Paschal DC, Flegal KM. Blood lead levels inthe U.S. population: Phase I of the Third National Health and Nutrition Examination Survey. JAMA1994;272:277-83.
2. Pirkle JL, Brody D, Gunter EW, Pashcal DC, Flegal KM, Matte TD. The decline in blood lead levelsin the United States: The National Health and Nutrition Examination Surveys. JAMA 1994;272:284-91.
3. Pirkle JL, Kaufmann RB, Brody DJ, Hickman T, Gunter EW, Paschal DC. Exposure of the U.S.population to lead: 1991-1994. Environ Health Perspect 1998;106:745-50.
4. Paschal DC, Burse V, Gunter EW, Pirkle JL, Sampson EJ, Miller DT, Jackson RJ, Caudill SP.Exposure of the U.S. population aged 6 years and older to cadmium: 1988-1994. Arch EnvironContam Toxicol 2000;38:377-83.
5. Pirkle JL, Flegal KM, Bernert JT, Brody DJ, Etzel RA, Maurer KR. Exposure of the U.S.population to environmental tobacco smoke: The Third National Health and Nutrition ExaminationSurvey, 1988-1991. JAMA 1996;275:1233-40.
6. Centers for Disease Control and Prevention. Blood lead levels in young children— United States andselected states, 1996–1999. MMWR Morb Mortal Wkly Rep ;49(50):1133-7.
7. National Academy of Sciences. Toxicologic effects of methylmercury. Washington (D.C.):NationalResearch Council;2000.
8. Occupational Safety and Health Administration. OSHA 29 CFR 1910.1127, Section 1–MedicalSurveillance. Washington (D.C.): OSHA; 1992.
9. American Conference of Government Industrial Hygienists. 2000 TLVs and BEIs: Threshold limitvalues for chemical substances and physical agents and biological exposure indices. Cincinnati (OH):ACGHI;2000. p.91, 97.
10. U.S. Nuclear Regulatory Commission. U.S. Nuclear Regulatory Commission (NRC) Guide8.22–Bioassay at Uranium Mills. Washington (D.C.): NRC; July 1978.
11. Seiler HG, Sigel H, Sigel A, eds. Handbook on toxicity of inorganic compounds. New York: MardelDecker, 1988. p. 217-21.
12. Budavari S, ed. The Merck Index. 11th ed. Rahway (NJ): Merck & Co., Inc; 1989. p. 308-9.
13. Caraballo R, Giovino G, Pechacek TF, Mowery PD, Richter PA, Strauss WJ, Sharp DJ, EriksenMP, Pirkle JL, Maurer KR. Racial/ethnic differences in serum cotinine levels among U.S. adultcigarette smokers: The Third National Health and Nutrition Examination Survey, 1988-1991. JAMA1998;280:135-140.

48
14. U.S. Environmental Protection Agency (EPA), Office of Pesticide Programs. Organophosphatepesticides in food: A primer on reassessment of residue limits [Online]. Available:www.epa.gov/pesticides/op/primer.htm [2001, March 16]
15. U.S. Environmental Protection Agency (EPA), Office of Pesticide Programs. Status summary of theorganophosphate review process [Online]. Available: www.epa.gov/pesticides/op/status.htm [2001,March 16].
16. Mylchreest E, Cartley RC, Foster PMD. Male reproductive tract malformations in rats followinggestational and lactational exposure to dibutyl phthalate: an antiandrogenic mechanism? Toxicol Sci1998;43:47-60.
17. Thomas JA, Thomas MJ. Biological effects of diethylhexyl phthalate and other phthalic acid esters.Crit Rev Toxicol 1984;13:283-317.

49
References for Analytical Methods
Metals
1. Chen HP, Paschal DC, Miller DT, Morrow JC. Determination of total and inorganic mercury inwhole blood by on-line digestion with flow injection. Atomic Spectroscopy 1998;19:176-9.
2. Miller DT, Paschal DC, Gunter EW, Stroud PE, D’Angelo J. Determination of lead in blood usingelectrothermal atomization atomic absorption spectrometry with a L’vov platform and matrixmodifier. Analyst 1987;112:1701-4.
3. Paschal DC, Ting BG, Borrow JC, Pirkle JL, Jackson RJ, Sampson EJ, Miller DT, Caldwell KT.Trace metals in urine of United States residents: reference range concentrations.Environ Res 1998;76:53-9.
4. Stoeppler M, Brandt K. Determination of cadmium in whole blood and urine by electrothermalatomic-absorption spectrophotometry. Fresenius A Anal Chem 1980;300:372-80.
Tobacco Smoke (Cotinine)
Bernert JT, Turner WE, Pirkle JL, Sosnoff CS, Akins JR, Waldrep MK, Ann Q, Covey TR,Whitfield WE, Gunter EW, Miller BB, Patterson DG, Needham LL, Hannon WH, Sampson EJ.Development and validation of a sensitive measurement of serum cotinine in both smokers andnonsmokers by liquid chromatography/atmospheric pressure ionization tandem mass spectrometry.Clin Chem 1997;43:2281-91.
Metabolites of Organophosphate Pesticides
Bravo R, Driskell WJ, Whitehead Jr RD, Needham LL, Barr DB. Determination of dialkylphosphate metabolites of organophosphate pesticides in urine using GC-MS/MS with stable isotopeinternal standards. [Note: This manuscript is in review for publication. For a copy of the methods,submit an e-mail request to [email protected].
Phthalate Metabolites
Blount BC, Milgram KE, Silva M, Malek N, Reidy J, Needham LL, Brock JW. Quantitativedetection of eight phthalate metabolites in human urine using HPLC-APCI-MS/MS. Anal Chem2000;72:4127-34.

51
Glossary
acaricideA chemical agent that kills mites.
acetylcholinesteraseAn enzyme that exists in skeletal muscle, red blood cells, and the gray matter of nerve tissue.
alkyl groupA group of atoms derived from an alkane (a hydrocarbon with no carbon-to-carbon multiple bonds) by theremoval of one hydrogen atom.
alloyA substance that is a mixture of two or more metals. Alloys are often harder, stronger, lighter, or moredurable than individual metals.
analytical methodA laboratory procedure used to measure a chemical in a human specimen, such as blood or urine.
antimony (CAS No. 7440-36-0)A silver-white metal found in the earth’s crust. In nature, antimony can be found in ores and other minerals.Antimony ores are mixed with other metals to form antimony alloys, or they combine with oxygen to formantimony oxide.
barium (CAS No. 7440-39-3)A silver-white metal that exists in nature and combines with other chemicals, such as sulfur or carbon andoxygen. These combinations are called compounds. Industry also produces barium compounds.
beryllium (CAS No. 7440-41-7)A hard, gray metal. In nature, beryllium can combine with other chemicals in rocks, coal, soil, and volcanicdust.
biomonitoringLaboratory analysis of human specimens, such as blood or urine, to measure people’s exposure to chemicalsin the environment.
bloodThe fluid that circulates through the heart, arteries, veins, and capillaries of the body. Blood carries oxygenand nutrients to cells and removes carbon dioxide and other waste products from cells.
blood leadLead that is in blood.
blood mercuryMercury that is in blood.
cadmium (CAS No. 7440-43-9)

52
A mineral that naturally exists in the earth’s crust. All soils and rocks, including coal and mineral fertilizers,have some cadmium in them. Industry takes out cadmium during the production of other metals such aszinc, lead, and copper.
carbamate pesticidesA group of organic pesticides that are used as herbicides, insecticides, and fungicides. These pesticides donot stay in the soil for a long time.
carcinogenicCapable of causing cancer.
CAS numberA unique number assigned to a given compound by the Chemical Abstracts Service, a division of theAmerican Chemical Society. Also known as CAS registry number, CAS RN, or CAS #.
catalytic activityThe activity of a catalyst, a substance that increases the rate of a chemical reaction.
cesium (CAS No. 7440-46-2)A silver-white metal that catches fire when exposed to air and that reacts explosively with water. Cesium isfound naturally in rock, soil, and clay. Cesium sometimes combines with other chemicals. Thesecombinations are called compounds. Cesium is used primarily to convert and conduct electricity.
chlorpyrifos (CAS No. 2921-88-2)An organophosphate pesticide.
cobalt (CAS No. 7440-48-4)An element that occurs in nature either as a steel-gray, shiny, hard metal or combined with other elements.These combinations are called compounds. Cobalt occurs naturally in many types of soil and in dust andseawater. Small amounts also occur naturally in food.
compoundA substance composed of two or more elements. For example, table salt (sodium chloride or Na Cl) is acompound composed of sodium (Na) and chlorine (Cl).
confidence intervalA range of statistical values within which a true value or result is expected to fall with a specific probability.
copper (CAS No. 7440-50-8)An element that occurs in nature as a soft, reddish, flexible metal. Copper is an excellent conductor ofelectricity.
cotinine (CAS No. 486-56-6)A metabolite— or breakdown product— of nicotine, one of the chemicals found in smoking and chewingtobacco. Cotinine is produced when the body takes in nicotine and breaks it down. Nicotine gets intopeople’s bodies if they smoke or chew tobacco of if they are exposed to environmental tobacco smoke (alsocalled “secondhand” smoke).

53
creatinine (CAS No. 60-27-5)A nitrogen compound that is found in muscle, blood, and urine.
deciliter (dL)A unit of volume equal to one-tenth of a liter, about one-half cup of liquid.
detection limitThe amount of a substance that a laboratory can measure reliably in a sample of air, water, soil, or othermedium, such as blood or urine.
diazinon (CAS No. 333-41-5)An insecticide. In 1986, the U.S. Environmental Protection Agency (EPA) banned its use in open areas,such as sod farms and golf courses, because it posed a danger to migratory birds. The ban applies toagricultural, home-lawn, or commercial-establishment uses.
diethyldithiophosphate (CAS No. 298-06-6)An organophosphate pesticide metabolite or breakdown product that is formed when the body is exposed toone of four different organophosphate pesticides. This metabolite can be measured in a person’s urine if thatperson has been exposed to disulfoton, ethion, phorate, or terbufos.
diethylphosphate (CAS No. 598-02-7)An organophosphate pesticide metabolite or breakdown product that is formed when the body is exposed toone of ten different organophosphate pesticides. This metabolite can be measured in a person’s urine if thatperson has been exposed to chlorethoxyphos, chlorpyrifos, coumaphos, diazinon, disulfoton, ethion,parathion, phorate, sulfotepp, or terbufos.
diethylthiophosphate (CAS No. 5871-17-0)An organophosphate pesticide metabolite or breakdown product that is formed when the body is exposed toone of ten different organophosphate pesticides. This metabolite can be measured in a person’s urine if thatperson has been exposed to chlorethoxyphos, chlorpyrifos, coumaphos, diazinon, disulfoton, ethion,parathion, phorate, sulfotepp, or terbufos.
dimethyldithiophosphate (CAS No. 756-80-9)An organophosphate pesticide metabolite or breakdown product that is formed when the body is exposed toone of five different organophosphate pesticides. This metabolite can be measured in a person’s urine if thatperson has been exposed to azinphos methyl, dimethoate, malathion, methidathion, or phosmet.
dimethylphosphate (CAS No. 813-78-5)An organophosphate pesticide metabolite or breakdown product that is formed when the body is exposed toone of 18 different organophosphate pesticides. This metabolite can be measured in a person’s urine if thatperson has been exposed to azinophos methyl, chlorpyrifos methyl, dichlorvos (DDVP), dicrotophos,dimethoate, fenitrothion, fenthion, isazaphos-methyl, malathion, methidathion, methyl parathion, naled,oxydemeton-methyl, phosmet, pirimiphos-methyl, temephos, tetrachlorviphos, or trichlorfon.
dimethylthiophosphate (CAS No. 1112-38-5)An organophosphate pesticide metabolite or breakdown product that is formed when the body is exposed toone of 13 different organophosphate pesticides. This metabolite can be measured in a person’s urine if that

54
person has been exposed to azinphos methyl, chlorpyrifos methyl, dimethoate, fenitrothion, fenthion,isazaphos-methyl, malathion, methidathion, methyl parathion, oxydemeton-methyl, phosmet, pirimiphos-methyl, or temephos.
dioxinAny of a family of compounds known chemically as dibenzo-p-dioxins. Concern about these compoundsarises from their potential toxicity and ability to contaminate commercial products.
disulfoton (CAS No. 298-04-4)A pale yellow insecticide used on some vegetables and flowers.
elementA substance that cannot be separated into its constituent parts and still retain its chemical identity. Anexample of an element is sodium (Na).
exposureContact with a chemical by swallowing, breathing, or touching (such as through the skin or eyes). Exposuremay occur immediately or over a longer period.
fenthion (CAS No. 55-38-9)A substance that is used as an insecticide and acaricide.
fossil fuelA substance found in the layers of the earth that can be burned. Fossil fuel is formed by the remains ofplants and animals that lived millions of years ago. Oil, natural gas, peat, and coal are fossil fuels.
furan (CAS No. 110-00-9)A colorless, flammable liquid that is used as a solvent. Furan is also used to make polymers such as nylon.
geometric meanA special mathematical average.
gram (g)A gram is basic unit of mass in the metric system and is equal to the weight of one cubic centimeter of waterat 4 degrees centigrade.
inductively coupled plasma mass spectrometry (ICPMS)A method for analyzing several chemicals at the same time.
industrial solventA substance or liquid that industry uses to dissolve other substances.
isomerOne of two or more molecules that have the same chemical formula but have a different arrangement of theiratoms.
lead (CAS No. 7439-92-1)

55
A naturally occurring blue-gray metal found in the earth’s crust. Lead is found in small amounts in rock andsoil. Lead can be found in all parts of the environment. Most lead comes from human activities such asmining, manufacturing, and burning fossil fuels.
limit of detectionThe minimum concentration of a substance being analyzed that can be measured with high confidence.
liter (L)A liter is the basic unit of volume in the metric system, equal to 1.06 liquid quarts.
logarithmic scaleThe power to which a base must be raised to equal a given number. In this Report, logarithms are expressedusing a base of 10.
malathion (CAS No. 121-75-5)A yellow-brown liquid that is widely used as an insecticide.
mass spectrometryA scientific method that separates organic matter into basic elements and compounds and analyzes themaccording to atomic and molecular mass.
meanA mathematical average.
medianIn a group of numbers, the value of the middle number when the numbers are arranged in ascending order.
mercury (CAS No. 7439-97-6)A naturally occurring metal that comes in several forms. Metallic mercury is a shiny, silver-white, odorlessliquid. If heated, mercury forms a colorless, odorless gas. Mercury combines with other elements to formmercury compounds.
metabolismAll the chemical reactions that enable the body to work. For example, food is metabolized (chemicallychanged or broken down) to supply the body with energy. Chemicals can be metabolized and made eithermore or less harmful by the body.
metaboliteA byproduct of metabolism that happens when the body takes in a substance, such as an environmentalchemical, and breaks it down.
metalAn element that is typically shiny and conducts heat and electricity. Mercury, lead, and cadmium areexamples of metals.
methyl parathion (CAS No. 298-00-0)Methyl parathion is an insecticide that comes in two forms: white crystals or a brown liquid. It smells like

56
rotten eggs, is similar to nerve gas, and is used to kill insects on farm crops, especially cotton. Methylparathion is a restricted-use pesticide that only trained people are allowed to mix, load, and spray. It isbanned for indoor residential use.
microgram (µg)A unit of mass equal to one-millionth of a gram.
milliliter (mL)A unit of volume equal to one-thousandth of a liter.
molybdenum (CAS No. 7439-98-7)A silver-white, hard metal with many commercial uses. Molybdenum withstands high temperatures and highpressure and is a byproduct of copper mining.
mono-benzyl phthalate (CAS No. 2528-16-7)A metabolite or breakdown product of benzylbutyl phthalate. This product can be measured in a person’surine.
mono-butyl phthalate (CAS No. 131-70-4)A metabolite or breakdown product of dibutyl phthalate. This product can be measured in a person’s urine.
mono-cyclohexyl phthalate (CAS No. 7517-36-4)A metabolite or breakdown product of dicyclohexyl phthalate. This product can be measured in a person’surine.
mono-ethyl phthalate (CAS No. 2306-33-4)A metabolite or breakdown product of diethyl phthalate. This product can be measured in a person’s urine.
mono-2-ethylhexyl phthalate (CAS No. 4376-20-9)A metabolite or breakdown product of di-2-ethylhexyl phthalate. This product can be measured in aperson’s urine.
mono-isononyl phthalate (does not have a CAS No.)A metabolite or breakdown product of di-isononyl phthalate. This product can be measured in a person’surine.
mono-n-octyl phthalate (CAS No. 5393-19-1)A metabolite or breakdown product of dioctyl phthalate. This product can be measured in a person’s urine.
nanogram (ng)A unit of mass equal to one-billionth of a gram.
National Health and Nutrition Examination Survey (NHANES)A series of surveys designed to collect data on the health and nutritional status of the U.S. population. In1999, NHANES became a continuous and annual survey.
nitrosamine

57
An organic compound that is found in many foods. Nitrosamines can cause cancer.
nonpersistent pesticideA pesticide that breaks down into nontoxic components almost immediately after application or that onlylasts for a few days before breaking down.
organophosphate pesticidesPesticides that contain phosphorus. They can be poisonous to animals and people because they preventessential nervous system enzymes from working. Organophosphate pesticides are chemically unstable ornonpersistent.
parathion (CAS No. 56-38-2)An organophosphate pesticide used to control many insects and mites. Trade names for parathion includeAC 3422, Alkron, Alleron, Aphamite, Corothion, E-605, ENT 15108, Ethyl parathion, Etilon, Fosferno 50,Niran, Orthophos, Panthion, Paramar, Paraphos, Parathene, Parawet, Phoskil, Rhodiatox, Soprathion,Stathion, and Thiophos.
percentileThe set of divisions that produce exactly 100 equal parts in a series of continuous values.
phorate (CAS No. 298-02-2)A toxic, clear liquid used as an insecticide.
phosmet (CAS No. 732-11-6)An organophosphate pesticide mainly used on apple trees, although it is also used on a other fruit crops,ornamentals, and vines to control aphids, suckers, mites, moths, and fruit flies. The compound is also anactive ingredient in some pet collars. Trade names for phosmet include Appa, Decemtion, Fesdan, Imidan,Kemolate, Prolate, PMC, and Safidon.
phthalatesA family of chemicals used primarily as plasticizers that are added to products to make them soft or flexible.
pigmentA natural or synthetic substance that is used to transfer color to another substance.
platinum (CAS No. 7440-06-4)A silver-gray, lustrous metal found naturally in the earth’s crust. Platinum and the compounds it formsresist corrosion and can withstand high temperatures.
pollutantAny substance or agent that causes pollution.
polyaromatic hydrocarbons (PAHs)A group of more than 100 different chemicals that are formed during the incomplete burning of coal, oil,gas, garbage, or other organic substances, including tobacco or charbroiled meat. PAHs are found in soot,coal tar, crude oil, creosote, and roofing tar. Some PAHS are used in medicines, dyes, plastics, andpesticides.

58
polychlorinated biphenyls (PCBs)A group of manufactured organic chemicals that contain 209 individual chlorinated chemicals (known ascongeners). PCBs are oily liquids or solids and range from being colorless to light yellow. Productscontaining PCBs are old fluorescent lighting fixtures; electrical appliances containing PCB capacitators; oldmicroscope oil; and hydraulic fluids, paints, inks, adhesives, electrical condensers, batteries, and lubricants.
reference rangeA set of numerical quantities that serves as a base against which further quantities are measured.
sampleA portion of a population that is observed to make generalizations about the whole population.
sample sizeThe number of units (such as people or animals) in a population to be studied. If a scientist surveys 200people about their pesticide use, the sample size would be 200.
serumThe liquid portion of blood that remains after the removal of clotting proteins and blood cells.
substrateA compound that reacts with a substance.
temephos (CAS No. 3383-96-8)An organophosphate pesticide used to control mosquito, midge, and black fly larvae. Temephos is used onlakes, ponds, and wetlands. It is also used to control fleas on dogs and cats and to control lice on humans.Trade names for temephos include Abat, Abate, Abathion, Acibate, Biothion, Difennthos, Ecopro, Nimitox,and Swebate.
thallium (CAS No. 7440-28-0)A blue-white metal that is found in the earth’s crust. Thallium is found in small amounts in soil and rocks.In the past, thallium was obtained as a byproduct of smelting other metals; however, it has not beenproduced in the United States since 1984.
thermocoupleA device consisting of two different metallic conductors that are connected at both ends, producing a loop inwhich heat is converted into electrical current. A thermocouple is used to measure the temperature of asubstance.
toxicantA toxic or poisonous substance.
tungsten (CAS No. 7440-33-7)A steel-gray to tin-white metal found naturally in the earth’s crust. This metal is highly flammable and maycatch fire spontaneously when exposed to air. Tungsten may be combined with other chemicals such ascarbon. Tungsten is also called wolfram.

59
uranium (CAS No. 7439-97-6)A silver-white, extremely dense radioactive metal. Uranium almost never occurs by itself but rather incombination with oxygen, chlorine, or fluorine.
volatile organic compounds (VOCs)Organic compounds that evaporate readily into the air. VOCs are released when cars or other machines burnfuel. VOCs contribute significantly to smog production. VOCs include chemicals such as benzene, toluene,methylene chloride, and methyl chloroform and can cause serious health problems.
zinc (CAS No. 7440-66-6)One of the most common elements in the earth’s crust. Zinc is found in air, soil, and water and is present inall foods. Pure zinc is a blue-white, shiny metal. Zinc is used in coatings to prevent rust and in dry-cellbatteries. It is also mixed with other metals to make alloys such as brass and bronze. A zinc and copperalloy is used to make pennies in the United States. Zinc compounds are widely used in industry to makepaint, rubber, dye, wood preservatives, and ointments.


Centers for Disease Control and PreventionNational Center for Environmental Health
Division of Laboratory SciencesMail Stop F-20
4770 Buford Highway, N.E.Atlanta, Georgia 30341-3724
Telephone (toll-free): 1-866-670-6052E-mail: [email protected]
Web site: www.cdc.gov/nceh/dls/reportMarch 2001
NCEH Pub. No. 01-0379


