
National propensity to cycle tool project: summary report · 1 National Propensity to Cycle Tool...
40
1 National Propensity to Cycle Tool Project: Summary Report Executive Summary The Summary Report describes the work undertaken for the Department for Transport on the National Propensity to Cycle Tool (NPCT) project. It summarises Stage 1 of the project and lays out a plan for the future work. In addition to the main report, full details are available in a series of appendices. Based on the results from the project and user feedback, the NPCT team are well-placed to deliver Stages 2 and 3 of the project. This short Executive Summary briefly describes the key outputs of Stage 1 and provides an outline of the planned work over the next three years. We have designed, developed and deployed on-line a public-facing Prototype for Three Cities (NPCT Prototype). This is now live at http://geo8.webarch.net/master/ and hosted under a contract with Webarch.net until January 2016. This has a high quality and user- friendly interface, thanks partly to user-testing sessions with Local Authority transport planners and other key stakeholders. The user testing has demonstrated a clear demand for the tool, indicated features to add, and shown what is needed to ensure that practitioners have the resources and expertise to use it. Different use cases have become apparent. The tool is available with open-source code providing transparency and supporting future development of the work. The prototype tool allows users to see commuting cycling potential at the area and route level comparing the 2011 Census against three scenarios (‘Government Target’, ‘Gender Equality’, and ‘Go Dutch’, with an e-bike scenario to be added soon). See Page 2, Figure 1. Rapid progress has been achieved in parallel with the other strands of the project: Analysis of Propensities to Cycle has, for the first time, provided detailed comparison of cycling patterns in England and the Netherlands. This includes analysis on how propensity to cycle varies by age and gender, and how this interacts with distance. For England we also have a new quantitative understanding of the role of hilliness in the decision to cycle, and can use this to appropriately adjust ‘go Dutch’ scenarios to English topography. The two Evidence Reviews have identified a clear stated preference for separation from busy or fast motor traffic, plus some support from intervention studies that creating such routes can increase cycling levels. Stated preferences for separation from motor traffic are particularly strong for women and appear also to be stronger for older people. The related Inequalities Report has developed key principles and recommendations for addressing inequalities in cycling. The Policy and Practice report draws out the policy implications of the work. Both the Co-Benefits Model (CBM) and Transport and Health Assessment Tool (THAT) provide insights into the potential and limitations of trip based scenario modelling. These
Transcript of National propensity to cycle tool project: summary report · 1 National Propensity to Cycle Tool...
1
National Propensity to Cycle Tool Project: Summary Report
Executive Summary The Summary Report describes the work undertaken for the Department for Transport on
the National Propensity to Cycle Tool (NPCT) project. It summarises Stage 1 of the project
and lays out a plan for the future work. In addition to the main report, full details are
available in a series of appendices.
Based on the results from the project and user feedback, the NPCT team are well-placed to
deliver Stages 2 and 3 of the project. This short Executive Summary briefly describes the key
outputs of Stage 1 and provides an outline of the planned work over the next three years.
We have designed, developed and deployed on-line a public-facing Prototype for Three
Cities (NPCT Prototype). This is now live at http://geo8.webarch.net/master/ and hosted
under a contract with Webarch.net until January 2016. This has a high quality and user-
friendly interface, thanks partly to user-testing sessions with Local Authority transport
planners and other key stakeholders. The user testing has demonstrated a clear demand for
the tool, indicated features to add, and shown what is needed to ensure that practitioners
have the resources and expertise to use it. Different use cases have become apparent. The
tool is available with open-source code providing transparency and supporting future
development of the work.
The prototype tool allows users to see commuting cycling potential at the area and route
level comparing the 2011 Census against three scenarios (‘Government Target’, ‘Gender
Equality’, and ‘Go Dutch’, with an e-bike scenario to be added soon). See Page 2, Figure 1.
Rapid progress has been achieved in parallel with the other strands of the project:
Analysis of Propensities to Cycle has, for the first time, provided detailed comparison of
cycling patterns in England and the Netherlands. This includes analysis on how propensity to
cycle varies by age and gender, and how this interacts with distance. For England we also
have a new quantitative understanding of the role of hilliness in the decision to cycle, and
can use this to appropriately adjust ‘go Dutch’ scenarios to English topography.
The two Evidence Reviews have identified a clear stated preference for separation from
busy or fast motor traffic, plus some support from intervention studies that creating such
routes can increase cycling levels. Stated preferences for separation from motor traffic are
particularly strong for women and appear also to be stronger for older people. The related
Inequalities Report has developed key principles and recommendations for addressing
inequalities in cycling. The Policy and Practice report draws out the policy implications of
the work.
Both the Co-Benefits Model (CBM) and Transport and Health Assessment Tool (THAT)
provide insights into the potential and limitations of trip based scenario modelling. These

2
insights will inform the NPCT in Stage 2. The CBM provides results on the health, mode shift,
and carbon impacts if we created new cyclists or e-bikers. It indicates substantial health
benefits (6% reduction in years of life lost due to premature mortality) and reductions in car
miles (8%) if non-cyclists had the same propensity to cycle as current cyclists. We have
created a prototype webtool visualising National Travel Survey data and the model’s results.
The Spatial Microsimulation (SMS) feasibility study for Manchester provides
complementary analysis to the aggregate approach implemented in the NPCT Prototype.
We have generated a novel SMS technique and used this to allocate individuals to Census
flows for Manchester. Compared with the prototype the SMS approach provides greater
detail about who is cycling and which modes they switch from, better estimating health and
environmental impacts.
We have also developed a preliminary National Model for estimating cycling potential at
the local authority level. Results from this will be presented early in Stage 2.
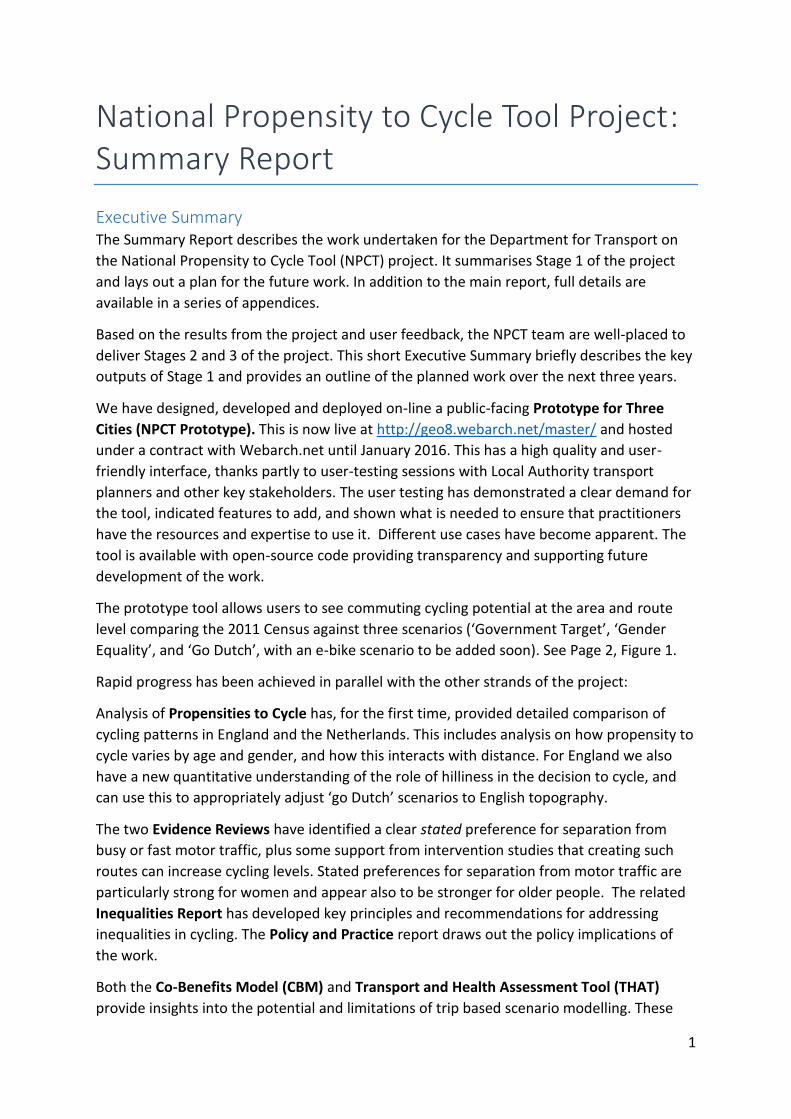
NPCT Prototype In Figure 1 we see for Coventry the fours scenarios with the 20 highest flows indicated and
the highest cycling areas indicated in yellow. It should be noted the shading is normalised
for each scenario and the highest rate of cycling changes from 159 cycle commuters in the
top Medium Super Output Area to 819 cycle commuters under ‘Go Dutch’.
Figure 1a, b, c, d: Cycle commuting in Coventry: ‘Census 2011’, ‘Government Target’, ‘Gender Equity’, ‘Go Dutch’.

3
Stages 2 and 3 The models developed, analysis undertaken, and evidence synthesised in Stage 1 provide a
robust basis for implementing and rolling out the NPCT in Stage 2. In Stage 1 these separate
strands have spread out to each contribute to an understanding of what a propensity to
cycle model would look like and how it should be constructed. In Stage 2 we will weave
these strands together to create the NPCT. In the past five months, our dedicated team of
experts has produced a high quality, fully operational prototype. User testing has indicated
the demand and range of potential use cases for the tool.
For Stage 2 we propose to roll-out the NPCT in two versions. Version 1 will be an aggregate
version, similar to the current prototype but taking account of the key features requested at
user testing. Version 2 will be use full microsimulation. This two-step approach allows the
very real benefits of the NPCT to be realised in the short term (England roll out mid-2016),
while allowing us to bring the even greater benefits from microsimulation on stream in
2017.
The key features of Version 1 will be a fully operational web based propensity to cycle
model for the whole of England. With this interactive tool, local authority transport planners
will be able to visualise which small areas and routes have the greatest cycle commuting
potential under different scenarios. At the regional and national level planners will be able
to investigate which towns and cities have the greatest potential. The tool will be WebTag
compatible, including health economic savings estimated using the World Health
Organization Health Economic Assessment Tool (HEAT) approach. Concurrently we will
produce a new version of the CBM web tool, incorporating benefits on specific diseases and
using more detailed methods for calculating greenhouse gas emissions.
Version 2 will be released in 2017. It will come with significantly improved functionality and
much richer data, allowing investigation of impacts across multiple population subgroups,
e.g. age, gender, ethnicity, car-ownership. This will be achieved through use of synthetic
spatial microsimulation. Version 2 will go beyond commuting data to incorporate other trips
purposes, including education trips at route and area level and other non-commuting trips
at area level.
More advanced health impact modelling methods will allow estimation of impacts on
mortality and morbidity across different subgroups. The wider range of outcomes will
include which mode cycling trips are coming from, including associated change in
greenhouse gas emissions, and with results stratified by age, socioeconomic status, ethnicity
and gender. This will allow us to estimate impacts on health and social inequalities.
For Stage 3 we will produce a report on pathways to impact. This will be involve collating
information from Stage 2, bringing out the policy implications of the findings, and laying out
the options for achieving the Government’s cycle ambition. The report will be based on the
material from the NPCT modelling, as well as updating and expanding reviews from Stage 1.
We will conduct a new online survey to enhance understanding as to what practitioners see
as the key local and national policies that could support our achieving the national cycling
ambition.

4
Contents Executive Summary ......................................................................................................................... 1
1.0 Introduction ......................................................................................................................... 7
2.0 Policy and Practice ............................................................................................................... 7
3.0 User Testing ......................................................................................................................... 8
4.0 Prototype for Three Cities (NPCT Prototype) using an Aggregate Model ........................... 9
5.0 Review of evidence on cycling infrastructure and uptake ................................................ 12
6.0 Rapid Evidence Assessment: How Age and Gender Affect Cycle Infrastructure
Preferences ........................................................................................................................ 13
7.0 Inequalities Review ............................................................................................................ 15
8.0 Spatial Microsimulation (SMS) Feasibility Study ............................................................... 16
9.0 Propensities to Cycle .......................................................................................................... 18
10.0 Transport and Health Assessment Tool (THAT) ................................................................. 21
11.0 Co-Benefits Model and Data Visualisation Tool ................................................................ 22
12.0 National level analysis: preliminary results ....................................................................... 25
13.0 Stage 2 of the NPCT Project ............................................................................................... 26
14.0 Stages 2 and 3 Gantt Chart ................................................................................................ 32
15.0 Risks and Risk Mitigation ................................................................................................... 33
16.0 Stage 3: Pathways to Implementation ............................................................................... 34
17.0 Future work ........................................................................................................................ 35
18.0 Stages 2 and 3 Academic Team members ......................................................................... 37
19.0 Authorship and contributors ............................................................................................. 39
List of Figures
Figure 1a, b, c, d: Cycle commuting in Coventry: ‘Census 2011’, ‘Government Target’,
‘Gender Equity’, ‘Go Dutch’. ........................................................................................................... 2
Figure 2: Conceptual map showing links between selected project workpackages ...................... 6
Figure 3: Model output on the rate of cycling by distance band, and under a range of
scenarios, for Coventry ................................................................................................................. 10
Figure 4: Model output illustrating the geographic distribution of cycling uptake for
Coventry, by area and highest 20 flows........................................................................................ 11
Figure 5: Proportion of (a) commuting and (b) non-commuting trips made by bicycle in
England, by age, sex and urban/rural status. ............................................................................... 19

5
Figure 6: Proportion of (a) commuting and (b) non-commuting trips made by bicycle in the
Netherlands, by age, sex and urban/rural status ......................................................................... 19
Figure 7: Probability of cycling longer trips relative to the probability of cycling a trip <1.5
miles. Shown A) for males versus females among younger adults in the UK, and B) for e-
bikes versus normal bikes among individuals in the Netherlands ............................................... 20
Figure 8: Illustrative figure from the Co-benefits Model web interface
http://geo8.webach.net/cbm/ ..................................................................................................... 24
Figure 9: Potential growth in cycle commuters in percentage points across highway
authorities in England. .................................................................................................................. 26
Figure 10: Proportion of all trips made for commuting purposes for adults in England ............. 30
Workpackages and Appendices
The research for Stage 1 of the National Propensity to Cycle Project consisted of the
following Workpackages.
1. Rapid Evidence Assessment (REA) and Inequalities Report
2. THAT model: A web-based tool of cycling potential and its impact on health in
London
3. Co-Benefits Model
4. Comparing propensities to cycle in England and the Netherlands
5. Propensities to cycle with prototype model for three cities
6. Scoping Report
With the development of the project, the clearest structure is not a one-to-one
correspondence between the Workpackages and the sections but rather we have presented
results from some Workpackages across more than one summary section and Appendix.
Therefore, for each section of this summary report, we indicate which Workpackage it
corresponds to.
The full reports for each section are available in the following appendices:
Appendix 1: Policy and Practice
Appendix 2: User Testing
Appendix 3: Prototype for Three Cities (NPCT Prototype) using an Aggregate Model
Appendix 4: Review on evidence on cycling infrastructure and uptake
Appendix 5: Rapid Evidence Assessment: How Age and Gender Affect Cycle
Infrastructure Preferences
Appendix 6: Inequalities Review
Appendix 7: Spatial Microsimulation Feasibility Study
Appendix 8: Propensities to Cycle
Appendix 9 THAT model: A web-based tool of cycling potential and its impact on
health in London
Appendix 10: Co-benefits model

6
Appendix 11: Server Requirements
An overview of how the different workpackages across the three Stages of the project come
together is presented in Figure 2 below.
Figure 2: Conceptual map showing links between selected project workpackages

7
1.0 Introduction This document summarises results of Stage 1 of the National Propensity to Cycle project. In
a short timeframe, the team has produced one advanced prototype model (the NPCT), an
earlier stage prototype interface for the co-benefits model (illustrating the health, carbon,
and transport impacts of higher cycling scenarios), new data analysis of English and Dutch
travel patterns, a feasibility study on the potential for a full microsimulation model, and
three reviews to inform the development of our tool and broader cycling policy. To test out
the practical relevance of our work we have carried out two half day user testing sessions
plus shorter sessions and demonstrations.
2.0 Policy and Practice This summarises the work described in Appendix 1.
Realising England’s cycling ambition requires attracting a much more diverse demographic
spread. Accordingly, the NPCT will allow planners to explore not just trips made by current
cyclists, but potential origins, destinations, and even routes of new cycle trips, if mode share
increases. For some trip purposes (primarily commuting) it will help answer the question
‘where do we need to build routes if we want to get to X% of trips by cycle’, as well as
allowing targeting of local trips made by specific groups. Our work on co-benefits helps
evidence the benefits that investing in cycling can provide under different scenarios,
enabling policy-makers to consider targeting policy to specific aims (e.g. health, equity,
travel time, CO2 reduction).
Our data analysis of the English and Dutch travel survey highlights the potential to increase
cycling among women and older people, groups currently under-represented in English
cycling but whose trips tend to be relatively short. Our systematic review of infrastructure
preferences by age and gender demonstrates the particularly strong preferences of these
groups for cycle infrastructure separated from motor traffic. Growing evidence suggests
creating high-quality cycle routes can increase cycling, if built in the right place and as part
of a developing network.
2.1 The need for the NPCT Our reviews and data analysis have provided evidence for what kind of infrastructure to
build in order to grow and diversify cycling. The tool itself will transform cycle planning by
creating an evidence base for prioritising routes; telling us where routes should be built.
As investment in cycling grows – confirmed by the review of evidence on infrastructure and
uptake – it is crucial to build not just the right thing, but to build it in the right place. While
primarily aimed at indicating where new cycle routes might be built, the tool can also add
economic value in other ways, e.g. identifying locations to set up new cycle shops, or where
to locate new cycle/e-cycle hire stations or residential cycle parking.
Stakeholders see the tool as an invaluable aid that will help them take and evidence
decisions, justify investment and – through an attractive visual interface – communicate the
potential and its benefits:

8
“We have been very pleased to be involved in early testing of the prototype and based on
this experience we think it has substantial potential to help us better plan our cycling
interventions and achieve our ambitious mode shift targets.” – Dominic Smith, Transport for
Greater Manchester
“Very interesting piece of work – very keen to see how we can use it!” – Graham Lennard,
Birmingham City Council
“Very impressive use of data – looks like a great tool and I look forward to being able to use
it!” – Nick Grudgings, Surrey County Council
“The tool shows considerable promise in terms of assessing the potential for cycling.” – Tim
Mellors, Norwich City Council
3.0 User Testing This summarises the work described in Appendix 2 and forms part of Workpackage 5.
User testing of the tool has included three well attended half day sessions with formal
feedback mechanisms, held in London and Manchester (with invited attendees) in April-May
2015, and as part of the Newcastle Cycle City Active City event held at the end of June 2015.
We have discussed this structured material in meetings and will use it to guide work in
Stages 2-3, also putting in place a larger programme of user testing to ensure maximum
relevance and usability for practitioners as we prepare for national roll-out.
The Newcastle event demonstrated the wide appeal of the tool. It attracted 35 practitioners
to what was an optional session before the main conference, running alongside two other
optional events. All attending wanted to be kept informed about the tool. People came from
a wide range of geographical areas (from the Northern Ireland Department for Regional
Development to Surrey County Council), had a range of roles, from strategic programme
managers and experienced consultants to interns and early career staff, and were working
for government, NGOs and private sector organisations.
The user testing has helped us think about what people want from the tool and what we can
do to help ensure that practitioners have the resources and expertise to use (and potentially
develop) it. We were pleased that people very much liked the look and idea of the NPCT.
People said the tool was easy and intuitive, appreciated the map detail and the ability to
visualise cycling potential. We were alerted to possible misunderstandings, which will help
us guard against these and develop case studies highlighting ways to use the tool.
Feedback helped us to understand how people might use the NPCT. Users suggested that
the tool could be used (i) to help present business cases to the DfT, for bid and proposal
writing, including through demonstrating benefits of cycling (ii) in communication to
members and decision makers, including communicating that there is a demand for cycling,
and visually representing routes (iii) in planning where to target future infrastructure
improvement, to prioritise routes, to influence design of road schemes, and to justify cycling
investment, (iv) as an input for other tools e.g. TfL modelling, (v) to sense check estimates of

9
demand provided in other ways, to challenge or confirm existing assumptions or
understandings.
People liked the fact that the tool is academic led, and felt this would help provide high
quality, credible evidence to inform strategy development. There has been discussion about
how simple or self-explanatory it should be, and this is something we will monitor and
continue to discuss within the team. One question asked was: ‘Are we aiming at something
that doesn’t need an instruction manual?’ Stakeholders discussed who would be the
intended audience, and the merits of providing a ‘pro’ version with advanced functionality.
There was also the expressed need to have something that can be used by officers to
communicate with members about strategic cycle planning.
People suggested that there will be a need for training and written materials, which we have
already been developing in the form of ‘help text’. During Stages 2 and 3, we will be
developing closer relationships with some authorities, and this may lead to further
documentation providing examples of applying the tool and of using in within a policy
context. Different authorities and organisations have different priorities; for example,
maximising speedy take-up of cycling versus maximising health benefits. Some stakeholders
are interested in the potential for cycling to benefit more deprived areas where people have
fewer other transportation options, as well as the potential to reduce carbon emissions or
congestion. The choice of primary outcome might imply concentrating efforts on different
types of area and the tool will be able to assist in this process.
The lively and engaged discussions at these three more formal user testing events, as well as
at additional shorter demonstrations and presentations, have illustrated the level of interest
in the tool. We look forward to continuing to involve users and learn from their policy and
practice needs and interests.
4.0 Prototype for Three Cities (NPCT Prototype) using an Aggregate Model This summarises the work described in Appendix 3, and forms part of Workpackage 5.
The main engine driving the local and national scenarios for the NPCT in Stage 1 is a model
operating at the ‘flow level’ based on origin-destination (OD) data between (Medium Super
Output Areas (MSOAs)i. Overall, the model identifies areas and routes in which there is a
high rate of commuting over short distances yet a low rate of cycling. The model draws
attention to areas and routes that have the greatest potential for increased rates of cycling
under various assumptions.
The approach uses distance, hilliness and other explanatory variables to estimate distance
decayii corresponding to the current rate of cycle commuting within a Local Authority area.
We then generate alternative scenarios in which the propensity to cycle increases and
different distance decay functions are generated. The geographical distribution of cycling
iMedium Super Output Area unit of Census geography with 5000 to 15,000 people ii Distance decay refers to the declining probability of making a trip by bicycle with increasing distance

10
potential is then estimated by applying these different distance decay curves to the existing
transport flows, allowing the NPCT to identify local 'desire linesiii'.
Scenarios have been generated for achieving gender equity in cycle commuting uptake and
achieving the National Cycling Ambition plan, and we are currently implementing a ‘Go
Dutch’ scenario based on propensities to cycle in The Netherlands, Europe’s highest-cycling
country. These scenarios allow stakeholders to consider the different implications of
planning for different demographics and different levels of uptake.
The primary source of input data for the model is 2011 Census OD flow results. The model
provides detailed break-downs of the rate of cycle commuting under each scenario, taking
into account the current rate of commuting, the circuity of the road network and hilliness
(more explanatory factors will be added in Stage 2). Example model outputs are presented
in the figures below. Figure 3 shows the rate of cycling by distance band under a range of
scenarios for Coventry. Figure 4 illustrates the geographic distribution of cycling uptake by
area (green:yellow) and for the 20 'desire lines' with the highest potential for cycling based
on a scenario in which Coventry achieves the Cycling Delivery Plan,
Figure 3: Model output on the rate of cycling by distance band, and under a range of scenarios, for Coventry
iii Desire lines represent the shortest or most easily navigated route between an origin and destination for
walking or cycling.

11
Figure 4: Model output illustrating the geographic distribution of cycling uptake for Coventry, by area and highest 20 flows.
The primary interface to the model is through the 'Interactive map' tab. This has been
created using Shinyiv. This provides a range of options for interacting with the model's
outputs and for displaying different types of model output via a number of ‘widgets’,
defined by Shiny, which allow the user to interact with the graphical display of the model
output. These widgets are moveable and 'dockable', allowing the user to focus on the
aspects of the map of most interest.
The widgets are:
1. The 'Scenario' widget, which allows users to select which scenario to represent
2. The 'Attribute' dropdown menu, which allows users to focus on the expected potential
rate of cycling or increase current levels.
3. 'Cycling Flows', which allows the user to view key flows as direct desire lines or as
cyclist-optimised routes allocated to the road network via the CycleStreets.net
Application Programming Interface (API).
4. The 'Freeze Lines' button, which allows the lines to move with the current map zoom or
to stay fixed for zooming-in to the map.
5. 'Flows to show', which allows the user to focus on specific set of routes or take a more
strategic view of the study area with up to 50 lines (this can be increased in Stage 2).
iv The internet tool uses Shiny Server (see http://shiny.rstudio.com/), a web application designed to work
with the statistical software R (http://www.r-project.org/).

12
Additional controls are revealed with an additional button for setting the basemap (allowing
the user to quickly see the current cycling network from Open Street Map) and displaying
flow data separately from zone data.
Additional tabs provide further information to users. These are:
• ‘Lines Data and Zone Data’, allowing users to see the raw data underlying the model,
focusing on the zones and lines currently under investigation.
• ‘Help’, a tab providing instruction to new users of the tool. In Stage 2 of the project a
video and interactive elements will be added to assist with training and to make the
tool more accessible.
• ‘Model Output’, a tab under development that will contain key information about the
study area. This will allow local transport planners to compare their area quantitatively
with England averages. Critically, this final tab will also present results such as the local
distance decay parameters and the extent to which hilliness seems to be a deterrent.
5.0 Review of evidence on cycling infrastructure and uptake This forms part of Workpackage 1 and summarises the work described in Appendix 4
This review provides evidence about the infrastructural interventions that should be
prioritised on key desire lines, such as routes identified through the National Propensity to
Cycle Tool. Academic and other evidence was reviewed rapidly and iteratively, focusing on
how different types of cycling infrastructure are associated with uptake.
There is good evidence that what people say would most encourage them to cycle is being
able to ride completely away from motor traffic (i.e. ‘Greenway’ routes, such as the Bristol
to Bath cycle path where virtually all the route is completely away from motor traffic, with
grade separated junctions inherited from the railway). Other strongly preferred routes
include those with substantial physical separation along roads (e.g. with hedge or kerb
separation), and on very quiet streets with little or no motor traffic.
The evidence base related to behaviour change is weaker. This is partly because cycling
interventions in many countries have traditionally not been rigorously evaluated. In
addition, many cycling interventions in low-cycling contexts have been relatively limited.
Rather than building the most preferred infrastructural types identified here, often the
focus has been on smaller-scale changes involving paint and signage which, according to the
preference evidence, are much less likely to show substantial changes in uptake.
However, evaluation methods and interventions are both changing, and correspondingly the
evidence base is beginning to improve. This is the case for example in the United States,
where cities have invested in higher-quality ‘protected’ or ‘green’ cycle lanes, with
associated studies of impacts. In England, higher quality interventions are being planned
and implemented, with more substantial evaluation, for example in London related to
Superhighways, mini-Hollands and other schemes. Evidence is starting to emerge that such

13
high-quality routes along key desire lines (e.g. the Cambridge Busway Cycleway) can
demonstrably increase cycling uptake.
Therefore, the review suggests building routes that correspond to stated preferences,
particularly given evidence from the Rapid Evidence Assessment described below, that
under-represented groups may have particularly strong preferences for separation from
motor traffic. We need to move towards making evaluation and monitoring results publicly
available in a form that is easy to access and to use in reviews and in planning. This should
include both summaries of findings and the data on which conclusions are based. More in-
depth robust evaluation of specific interventions is also needed, especially using longitudinal
methods with adequate controls to track changes in behaviour over time.
The evidence highlights the need to prioritise routes that meet demand, to improve wider
networks and to ensure there are good connections to new pieces of infrastructure. Some
impressive results have been achieved from infrastructure-focused interventions and
programmes; including in England as part of the Cycling Demonstration Town programme.
However, the evidence suggests that building small amounts of infrastructure in isolation,
where a wider cycle network remains poor and cycling levels are low, may have relatively
little effect. In building new infrastructure, it is important to follow desire lines and where
needed improve the quality of the surrounding cycle network.
6.0 Rapid Evidence Assessment: How Age and Gender Affect Cycle
Infrastructure Preferences This forms part of Workpackage 1 and summarises the work described in Appendix 5.
The Rapid Evidence Assessment (REA) is a systematic review that examines and synthesises
the evidence for age and gender differences in cycle infrastructure preferences. It focuses
on views about cycling infrastructure and routes that keep cyclists away from motorised
traffic, shown in the literature review to be generally preferred. The REA complements the
accompanying review of cycling interventions and uptake summarised above. It looks at
under-represented groups within UK cycling (specifically women and older people, who
represent the majority of the English population, and the majority of cyclists in countries
such as The Netherlands) exploring whether, and how, their infrastructural preferences vary
from those expressed by men and younger adults.
The academic and policy literature was systematically searched to find studies on cycle
route infrastructure preferences, which reported on findings in relation to age or gender.
After several rounds of exclusion the evidence base consisted of 56 studies. Fifty-one of the
56 studies examined preferences in relation to gender, with 33 covering age (older versus
younger adults) and only four studies investigating preferences related to child cycling.
While men and women both prefer cycling environments which keep riders away from
motor traffic, women's preferences are stronger. Forty-one studies provided evidence as to
whether preferences for separation from motor traffic differed by gender. Of these, 24
reported statistically significant evidence that women expressed stronger preferences for
segregation from motor vehicles than did men. The remaining 17 studies reported no

14
statistically significant differences in gender preferences. No studies reported that men had
stronger preferences than women for greater segregation from motor vehicles. Studies with
larger sample sizes were more likely to find a difference in preferences by gender.
We regard this as good evidence of women’s stronger preferences for greater segregation
from motor vehicles. However, this must be seen within the context of what were often
similar overall hierarchies of preference across genders. That is, rather than expressing
different preferences, women express the same preferences but more strongly. Four-fifths
(19/24) of those studies that reported gender differences in preferences highlighted overall
similarity in preferences across genders, even if specific differences in strength (for example,
women and men choosing fully separated cycle tracks as the preferred option, but women
rating them most highly) were found.
Fewer studies, only 25, reported on age in relation to preferences around segregation from
motor vehicles. Findings here were less consistent than for gender. While nine studies found
that older people expressed stronger preferences for separation from motor vehicles, 13
found no differences, and three reported that older people had less strong preferences for
separation from motor vehicles than did younger people. Nearly nine in ten (22/25) of all
studies covering the impact of age on preferences for separated infrastructure highlighted
overall similarity in preferences across age groups, even if specific differences were found
one way or the other.
While the evidence on age is more mixed, it provides some support for the hypothesis that
older people have less tolerance of riding in mixed traffic than younger people. The
evidence is likely to be weakened by selection bias, given many studies mostly or only
include cyclists. Older cyclists will disproportionately include the small minority of people
who have been cycling for many years, and so will be skewed towards those who are
satisfied with or at least tolerant of current cycling conditions. The gap in risk tolerance
between older cyclists and older non-cyclists is thus likely to be larger than the gap in risk
tolerance between younger cyclists and younger non-cyclists, confounding results.
There is ample evidence that motor traffic forms a major barrier to child cycling, yet
surprisingly little evidence exploring exactly what kind of infrastructure would meet the
needs of parents and children. What does exist suggests strongly that riding away from
motor traffic becomes more important. The failure to study and build for child cycling may
contribute to the gender inequalities in cycling in low-cycling countries, given women’s
higher likelihood of making escort trips.
This review supports building for the preferences of under-represented groups. The
evidence suggests that such groups have particularly strong preferences for infrastructure
separated from motor traffic either through physical barriers, or through route-level
separation (e.g. Greenway-type routes, kerb segregation on main roads, streets with very
low levels of motor traffic).
These are preferences that are not qualitatively different from preferences expressed by
younger adults and men. Rather they are stronger, so building for under-represented groups
represents a form of inclusive design that can cater for a broad range of cyclists. Hence the

15
evidence does not support a 'dual networks' approach, but rather suggests that these kinds
of segregated routes are attractive for the majority of potential cyclists. This means that
such routes should be built with the understanding that they are not 'only' for women,
children, and older people, but also for men and younger adults. This has implications for
capacity, design speed, and location planning, and stakeholder involvement.
7.0 Inequalities Review This forms part of Workpackage 1 and summarises the work described in Appendix 6
The Inequalities Review explores how we might draw upon the broader transport literature
to define and address inequalities in access to cycling. Although so far cycling has been
marginalised within work on transport inequalities, the transport literature does provide
useful frameworks that can be adapted to study cycling and inequality. Increasing and
diversifying cycling could contribute to the reduction of inequalities in other areas, such as
access to services. The Inequalities Appendix explores how conceptualising cycling as a
transport service can help identify barriers and solutions. Dimensions of cycling inequality
are proposed, with implications and recommendations outlined in the following table
Table 1: Summary of six broad types of exclusion and principles for solving these
EXCLUSIONS
SOLUTIONS
1. Area-based exclusion implies that a local area lacks the route infrastructure to support local cycle trips, affecting those living in the area or wishing to travel through it.
1. Install high quality dense local network of cycle routes.
2. Destination-based exclusion is more specific, affecting people if activity destinations are not accessible via high-quality routes available when needed. For example, people who work in a city’s centre may have good cycle routes to work, but those working in a suburban business park do not.
2. Strategic network planning linking trip attractors, identifying and incorporating range of potentially cycled trips.
3. Capability or Distance-based exclusion: distances are prohibitively long for cycling to necessary facilities within an area, or for a particular group. Willingness or ability to cycle longer distances declines faster for some groups than others: as for many exclusions, everyone is affected to some extent but this is not evenly distributed across social groups.
3. Reduce effective distances; ensure land-use planning system helps create cycleable distances to facilities for all; support e-bikes, park and cycle/cycling and public transport for longer trips
4. Risk-based exclusion: some groups are disproportionately affected by risk (both physical and social) that are associated with cycling in countries such as the UK: a. Motor traffic risks: while people are put off cycling by having to share with busy motor traffic, some groups are more risk averse than others. b. Personal safety risks: differentially affecting people who are more concerned about/vulnerable to such risks c. Risk of social stigma: cycling remains stigmatised, with
4. Increasing participation through focusing on the needs and preferences of those users who are most intolerant of risk. This implies an inclusive approach in infrastructure design and network planning, alongside work on specific stigma barriers, ensuring that promotional and educational

16
barriers heightened for some groups (e.g. poverty stigma for low income people, sports stigma for teenage women)
material does not inadvertently reinforce stigma.
5. Obstacle-based exclusion affects people using non-standard cycles and/or who are unable easily to walk or carry their cycle (and/or cargo).
5. Planning that maximises cycling by building to accommodate diverse physical capabilities and types of cycle. It must not be assumed that all cyclists can dismount and walk with their cycles, for example.
6. Cost-based exclusion: people are unable to afford cycle purchase or hire.
6. Subsidised access or ownership for lower-income groups, and/or where cycles are more expensive: such as cargo bikes, e-bikes, hand-cycles, children’s cycles which need regular replacement.
8.0 Spatial Microsimulation (SMS) Feasibility Study This forms part of Workpackage 5 and summarises the work described in Appendix 7.
Spatial microsimulation (SMS) is a mathematical technique used to tackle transport
simulation problems by generating individual level data. SMS will be central to our approach
in Version 2, Stage 2. In Stage 1 we have generated the synthetic population for
Manchester, and made the methodological innovation of allocating individuals to Census
flows data.
In essence SMS produces a synthetic population of individuals at a small area level and, with
our methodological developments, for commuting flows that closely resembles the real
underlying data. To build this population it uses as a source local aggregate data, e.g. the
number of individuals by age, by sex, and by commuting mode. This can be combined with
individual level data produced at a higher level of geography, e.g. National Travel Survey
(NTS) data for an English region. For NPCT Stage 1 the sources are 2011 Census commuters
and their travelling flows, with special emphasis on cyclists.
The advantage of the SMS population is that it explains real behaviours and responses to
scenarios much better than aggregate data. In Stage 2 we will use SMS for creating the
second version of the NPCT for England. Our main goal in Stage 1 has therefore been to
prove the feasibility of using SMS on a larger geographical scale, combined with multiple
data sources.
To prove the feasibility we have to overcome diverse technical challenges on areas such as:
Data availability and confidentiality
Consistent merging of data from used sources (Census, Nat. Travel Survey,…)
Extension of the microsimulation technique to flows allocation

17
The tests undertaken have proven successful and provide now a robust basis for
undertaking Stage 2.
In Stage 2 the data sampled from NTS, passed through an SMS process, will combine the
current commuting trips, already in the web model, with non-commuting and education
trips, offering the most comprehensive picture of transport nationwide.
The work done for the DfT cycling propensity project has followed 2 main lines:
1. Microsimulation: generating the synthetic populations in full for Manchester, and in
part for Coventry & Norwich.
2. Flow Allocation: allocating individuals to the known commuting trips, obtained from
the Census 2011 flow files.
Both lines are needed to prove the feasibility of microsimulation and the flow allocation
method, beyond the requirements of Stage 1, thus allowing for more complex scenarios and
a better simulation.
Of these (2) represents the key breakthrough over previous SMS approaches: we can now
allocate individuals to commuting flows, and not just to areas.
Because of data availability restrictions, both lines of work have been set at MSOA level.
Line 1) has the potential to be easily extended to lower geographical levels (e.g. Lower
Super Output Areas- LSOAs, Output Areas- OAs, and Workplace Zones- WZsv) or to different
variables sets; line 2) could also be extended to lower geographies, making some
compromises re accuracy and depending on data availability.
Line 1) has already provided detailed information on the [Age-Sex-Mode of transport]
variables for Manchester city, plus Ethnicity-Socioeconomic status, and potentially others,
which in Stage 2 can prove revealing to understand cycling propensities and to simulation of
differential response towards different interventions.
Line 2) has been used to allocate individuals to commuting flows between two MSOAs of a
city. This level can trivially be extended out of the city as well, for example to a whole
county. Once we have the cyclists’ traits, the individuals in the flow can be studied as
separate entities, and scenarios applied to them.
Since these traits are not available in the Census flow data, a new technique has been built
to fill this gap. It relies on a combination of probability and algorithmics and can highly
improve the outcome both in terms of realism and detail of the resulting scenarios.
We believe that the detail provided by Flow Allocation will allow us to further discriminate
cycling interventions by demographics, targeting these interventions more effectively.
Understanding the potential for change from interventions such as a campaign that is aimed
v LSOA: Lower Super Output Area (1000 to 3000 residents), OA: Output Area (100 to 625 residents), WZ:
Workplace Zone, a working population rather than resident population unit of geography.

18
at younger people with low socioeconomic status, or older women, becomes more feasible
by knowing the real demographics of the population.
The basis of the allocation technique is to build the city flows incrementally so that they
match 2 constraints:
a) The flow specific figures.
b) The total city aggregates (e.g. % of younger female cycling, or of older men not
cycling; % of middle aged car users,…. or almost any combination of the variables)
In practical terms, this means that for each flow we get a solution that minimises the error
and is as close as it gets to the real population figures. The SMS generated population can
then be used as the input for multiple scenarios using the Propensities to Cycle described in
Appendix 8.
9.0 Propensities to Cycle This forms part of Workpackage 4 and summarises the work described in Appendix 8.
These analyses examine current cycling behaviour in England, using National Travel Survey
data. They focus on individual, household and geographical predictors of the likelihood of
cycling trips of different lengths. The English patterns are compared with those found in
Dutch National Travel Survey data, the nation with the highest rates of cycling.
These analyses are not intended to provide a comprehensive examination of cycling
behaviour, but to provide an evidence base for our proposed use of spatial microsimulation
in Stage 2. As explained in Section 7, microsimulation will allow us to allocate commute and
non-commute trips to members of our synthetic individual population. For commute trips
we will also be able to represent flows (based on Census flow data) but for non-commute
trips we will only be able to represent trip origins.
The analysis summarised here represents the first stage of this process, providing
information about the likelihood that trips made by different individuals are cycled.
Differences in cycling propensity (for example, by age and gender) provide a rationale for
stratifying within the microsimulation model.
The discussion below provides examples of key differences in propensity to cycle, in relation
to trip distance, trip purpose, and various geographic and demographic factors. These
differences will be used within our microsimulation model to develop and document
scenarios sensitive to these differences, and what happens if they change.
9.1 Mode share, and patterning by age, sex and purpose In England, 1.9% of trips recorded in the National Travel Survey between 2008 and 2012
were made by bicycle. Around this overall figure there is considerable variation according
to age, sex, purpose (e.g. commuting/non-commuting) and, to a lesser extent, urban-rural
status, see Figure 5. The highest proportion is among males aged 40-49 in urban areas, who
cycle 6.5% of commuting trips. The lowest proportion is among females in rural areas, who
at all ages make under 1% of non-commuting trips by bicycle.

19
Figure 5: Proportion of (a) commuting and (b) non-commuting trips made by bicycle in England, by age, sex and urban/rural status.
Equivalent figures in the Netherlands are far higher, with 26.7% of all trips are cycled. The
Netherlands also differs from England in having smaller differences between age and sex
groups (which are for sex in the opposite direction) and between men’s commuting and
non-commuting cycle trip rates, see Figure 6.
Figure 6: Proportion of (a) commuting and (b) non-commuting trips made by bicycle in the Netherlands, by age, sex and urban/rural status
9.2 Probability of cycling a trip as a function of distance The probability of cycling a trip declines rapidly with increasing trip distance. In England, the
rate of this decline is generally steeper for females than for males, as illustrated Figure 7,

20
Part A. The rate of this decline with distance is also generally steeper for older adults and
for children than for younger adults, and for commute trips than for non-commute trips. No
large differences are seen by urban-rural status.
Figure 7: Probability of cycling longer trips relative to the probability of cycling a trip <1.5 miles. Shown A) for males versus females among younger adults in the UK, and B) for e-bikes versus normal bikes among individuals in the Netherlands
Based on these observations, and as distance is a key determinant of cycling, we plan to
stratify into the following groups when estimating ‘propensity to cycle’ a given trip in the
proposed microsimulation model:
1. Male, age 0-15 years, all trips
2. Male, age 16-59 years, commute trips
3. Male, age 16-59 years, non-commute trips
4. Male, age 60+ years, all trips
5. Female, age 0-15 years, all trips 6. Female, age 16-59 years, commute trips
7. Female, age 16-59 years, non-commute trips
8. Female, age 60+ years, all trips
Using data from the Netherlands, we have also characterised the distance decay function
for trips made by electric bicycles (‘e-bikes’). Unsurprisingly, distance decay for these trips is
less steep than for other bicycle trips (Figure 7, Part B).
9.3 Other individual, household and geographic characteristics as predictors of
cycling For each of the eight stratified groups listed above, we examined how additional individual,
household and geographic characteristics affected the probability that a given trip is cycled.
We found that ethnicity and household car ownership were particularly strong predictors,
even after adjusting for factors such as urban/rural status and socio-economic position.
Lower rates of cycling were observed among non-white children and adults, and among
adults with more cars in their household. For example, white men aged 16-59 made 6.0% of
their commute trips and 2.3% of non-commute trips by bicycle, as opposed to 2.2% and
1.3% for non-White men aged 16-59. We therefore decided to use ethnicity and household
car ownership alongside age and sex as key characteristics in the microsimulation model.

21
9.4 Development of a methodological basis for microsimulation modelling Alongside analysis of how broader trip purposes and distances vary by group, these new
analyses of cycling propensities form the basis for us to develop the microsimulation model.
We have information about (a) distributions of trips by distance and purpose, in relation to
the factors described above, and (b) propensities to cycle commute or non-commute trips
by distance, again in relation to the factors described above.
This provides the potential to create sophisticated scenarios in Stage 2. For example, in
modelling potential origins and/or routes of new cycle trips made as uptake increases, we
will be able to study the impact of changes in relative propensities by age and gender. One
way of doing this is using Dutch data, adjusted for hilliness which is greater in England than
The Netherlands. This ‘Go Dutch’ scenario provides a real life example of what might
happen to age and gender disparities in cycling propensity, given a substantial increase in
cycling. Worked examples of this and other possible scenarios are provided in Appendix 8.
10.0 Transport and Health Assessment Tool (THAT) This summarises the work described in Appendix 9 and forms part of Workpackage 2.
THAT model is a web tool that allows the user to generate scenarios based on reallocating
trips to walking and cycling and to visualise the health and carbon reduction benefits for
these scenarios.
THAT model has been used by Transport for London in 2014 to create and test different
scenarios and their health effects in London. It has also been presented at academic
conferences and to policy makers.
For this project we have run new scenarios using THAT model to look at the impacts of
mode shift to cycling across a range of outcomes. We have trialled the methods for deciding
which trips could be shifted, and based on this and feedback from stakeholders we have
undertaken analysis of the strengths and weaknesses of the modelling approach and
software used.
The key points from the development and testing of THAT model include:
The demonstrated ability to create a practically useful model based on individual
level trip data that could be run with minimum input from the development team
The limitations of the Analytica software for creating flexible web interfaces
The desire for geographically localised results
The burden on the user creating rules based on each trip distance band
The desire for additional variables, most notably socioeconomic status and ethnicity
The desire for greater data visualisation, including of baseline data
These findings have been used to inform the development of the Co-Benefits Model
described below.

22
11.0 Co-Benefits Model and Data Visualisation Tool This summarises the work described in Appendix 10 and forms part of Workpackage 3.
Cycling has the potential impact to benefit multiple societal outcomes. The largest societal
benefits are likely to come from improved population through increasing physical activity.
However the importance of other impacts should not be downplayed. These potential
benefits include faster travel times for users and for others (through reduced congestion),
lower road traffic danger, lower urban air pollution, cost savings, lower greenhouse gas
emissions, increased journey reliability, and greater choice about travel options. The relative
size of these different impacts will depend on who is taking up cycling and which trips are
cycled.
The purpose of the CBM is to indicate how impacts across a wide range of outcomes and
population groups can be assessed through modelling the uptake of cycling using individual
level data. We also have produced an early prototype tool for visualisation of the results
from the CBM http://geo8.webarch.net/cbm/
In the CBM we take trips from the NTS previously not cycled and model the impacts on a
range of outcomes if they were cycled. We do this by assuming that some non-cyclists take
up cycling and have the same distance based propensity to cycle as current cyclists. To
model the take up of cycling we simulated both scenarios in which current gender and age
inequities persist and in which they are overcome. We have also developed scenarios based
in which we assume that the increase in cycling is from e-bike users, with different levels of
physical activity and propensity to cycle trips of different distances.
11.1 Data sources The main data source is the National Travel Survey 2012 (NTS), used for trip data and
personal characteristics. NTS includes detailed data for Great Britain, both for the trip itself
and the individual performing the trip. We have only analysed results for adults aged 18 to
85 years. In addition we use the Health Survey of England 2012 (HSE) for non-travel physical
activity and the Netherland Travel Survey 2012 for the probability of using e-bikes.
11.2 Generation of scenarios The CBM simulation relies on creating multiple scenarios by changing four core parameters.
Every new scenario is generated by a combination of the parameters described below.
Key Concept Values Meaning
CM Cycling
multiplier
1, 2, 4, 8, 16, 32, 64 Multiplies the odds of being a cyclist by a given number
TDR Total Distance
Reduction
1, 0.9, 0.8, 0.7 Reduces the distance travelled by a factor. This assumes a shift
towards shorter trips with more localised living
Equity Gender equity Yes / No (1,0) Assumes that probability of becoming a cyclist is equal for men
and women and for younger and older adults
E-bike E-bike use Yes / No (1,0) Assumes increase in cycling is from people becoming e-bike
users, who then use a mixture of e-bikes and regular bikes

23
11.3 Rules for switching a trip to cycling To generate new cycling trips, we apply a two-step process:
Step 1: Probabilities of becoming a cyclist
In the non-equity scenario, we assume that the current age and specific probability of being
a cyclist (defined as having a cycle trip in the last week) is increased by the Cycling Multiplier
(CM). If we assume cycling grows in an equitable manner, male and female probabilities of
cycling are the same, and there are also no differences by age.
Step 2: Probabilities of cycling a trip
If the individual is now a cyclist, then each trip is assigned a probability of being cycled and
longer trips have lower probabilities of being cycled.
Thus for a scenario (CM 64, TDR 1, equity 1, e-bikes 1), we would increase the odds of
becoming a cyclist by 64 (CM 64), assuming that everyone in the population has equal
chance of becoming a cyclist (equity 1), we would use unchanged trip distances from the
NTS (TDR 1), and we would assume all the new cyclists had access to e-bikes (e-bikes 1) and
used them for some of their cycling trips (with a greater chance of using them the longer the
trip).
This 2-step method mimics real life situations more realistically than other strategies
previously used, as cycling trips are effectively clustered at the individual level. Further
development of the model could change the probabilities that cyclist cycle trips, as even
amongst existing UK cyclists there may be trips they would like to cycle but that they do not
cycle at the moment.
Finally, if the trip is now cycled, all its variables (e.g. travel times, total physical activity) are
recalculated.
11.4 Physical activity and health impact We are interested in physical activity from two areas, active travel and other – considered
as one broad category. For active travelling modes (walking or cycling trips), we calculate
the Marginal Metabolic Equivalent hours per week (MMETh).
Using HSE we can also calculate the physical activity spent by individuals in non-travel
activities. Individuals are matched from NTS against a pool of individuals from HSE, using
age, sex, and socio-economic status.
Changes in physical activity can then be used in assessing impact of risk of premature
mortality. Health outcomes are calculated using the methods designed as part of the
Integrated Transport and Health Impact Modelling Tool (ITHIM) approach that we have
developed at the Centre for Diet and Activity Research (CEDAR). From this we calculate
population impact fractions and apply a comparative risk assessment approach to age and
gender specific disease burden data from the World Health Organization. The main health
outcome calculated is change in years of life lost (YLLs) due to premature mortality.

24
11.5 Analysis of results The CBM model produces 112 scenarios and, for each of these scenarios, multiple outcomes for the whole population and specific subgroups. In this report we are only able to focus on a few results and have chosen to mainly present results from the scenarios with cycling multiplier 64 (CM 64), without trip distance reduction (TDR 1).
In addition to the report listed in the deliverables, we have created a prototype web tool that allows users to visualise results from the baseline NTS and under each of the scenarios, see Figure 8 below.
Because we are using individual level data from the NTS, we have the ability to drill down by a wide range of socio-demographic factors e.g. age, gender, socio-economic group, car ownership, ethnicity, and income. This illustrates what can be achieved with the NPCT in Stage 2 when we introduce the microsimulation data.
11.6 Results In the most optimistic traditional bike scenario (CM 64, equity 1) we found a much higher percentage of the population achieving recommended levels of physical activity (up from 45% to 66%), with the disease burden for the UK population reduced by up to 390 thousand YLLs in a single accounting year (6%). This scenario would also see the cycling mode share reach 20% and cycling replace up to 8% of car miles.
In this scenario the mode share for cars would fall from 68% to 52%. Of the new cycle trips approximately 60% would come from cars and 30% from walking. The mode switch ratios were relatively stable across different scenarios.
Mean travel times increased by around 10-15% per trip switched but in around 40% of cases travel times fell (with e-bikes travel times increased by around 5%, and nearly half of trips were faster). It should be noted that these travel time changes are for those making the switch; reduced congestion could also speed up other road users.
If we assumed that the increase in cycling was mostly from e-bikes then we would see a greater replacement of car miles (11% vs 8%) and a higher cycling mode share (26% made-

25
up of 19% e-bikes + 7% traditional bikes). The health impacts were smaller but still
substantial, 320 thousand YLLs. Interestingly only with e-bikes do we see a mode share
equal to that currently seen in the Netherlands (27% mainly traditional but also including
some e-bikes).
Impacts varied across population subgroups, in part depending on the trip patterns of each
group. For example, total miles cycled was higher for white compared with non-white
populations, reflecting the higher trip rate among the white population. The same was true
for non-car owners. These differences might arise from starting from current trips patterns
rather than desired trips. This was supported by our finding that time savings were much
more common for those without car access. Future work could include differences in take
up between car and non-car owners as suggested in Section 9 above.
11.7 Discussion and Conclusions The work undertaken in the CBM provides valuable evidence in itself, is extendable into a
useful policy tool, and lays the basis for what can be incorporated in Version 2 of the NPCT.
If people in the UK who do not currently have cycling trips had the same propensity to cycle
as those who do, then their potential increase in physical activity and corresponding
reductions in diseases associated with physical inactivity would be considerable.
The reductions in car distance and emissions from transport are more substantial than some
previous studies in the area have suggested. Even greater benefits might be possible if we
simulated the potential to replace car trips with multi-modal rail and cycling journeys.
Our results indicate that, for a given increase in the propensity to cycle, the health benefits
of a switch to e-bikes would be smaller, while the carbon benefits would be larger. This is
not surprising but this study may be the first to quantify these impacts.
The CBM approach has the potential to be extended in many ways. The rules could be made
more sophisticated, e.g. the probabilities for switching mode could be sensitive to relative
trip times or trip purposes. The range of outcomes could be increased and some modelled in
more detail, e.g. inclusion of specific diseases and injury risks, and the greenhouse gas
emissions modelling could be more sophisticated by taking account of trip speed. The
interface could also be developed to provide a comprehensive tool to analyse the data from
the NTS (and the simulated NTS + HSE).
This study has shown the potential of modelling uptake of cycling using individual travel
survey data and providing a user interface to interact with the data.
12.0 National level analysis: preliminary results We have undertaken preliminary analysis of the potential for cycling increase across
different areas covering all of England. This analysis, like the flow-model of cycling uptake
(see Section 4), was based on commuting data from the 2011 Census.
The results for the Cycling Delivery Plan scenario (CDP), aggregated to the level of Highways
authorities, are displayed below (Figure 9).

26
Figure 9: Potential growth in cycle commuters in percentage points across highway authorities in England.
The method used to identify these areas with high unmet cycling potential was the same as
that used in the flow-model but without using local origin-destination data. Instead we used
data on the proportion of trips by distance band, and applied to each band the probability of
cycling trips of that distance. Thus the areas shaded in darker green in Figure 1 are those
that have the highest potential to increase the cycle modal share among commuters based
on the area’s distribution of commute trip distances.
In Stage 2 we will complete the analysis by:
Inclusion of non-work trips from the National Travel Survey
Inclusion of hilliness as a predictor of cycling potential
This will be of use to the DfT for developing a nationwide Cycling and Walking Investment
Strategy (CWIS). The results of the national level analysis will help inform the decision of
where investment is likely to be most cost-effective in the early and later stages of CWIS.
13.0 Stage 2 of the NPCT Project The models developed, analysis undertaken, and evidence synthesised in Stage 1 provide a
robust basis for implementing and rolling out the NPCT in Stage 2. In the past five months,
our dedicated team of experts has produced a high quality, fully operational prototype.
User testing has indicated the demand and range of potential use cases for the tool.

27
For Stage 2 we will roll-out the NPCT in two versions. Version 1 will be an aggregate version,
similar to the current prototype. Then later in Stage 2 this will be replaced with Version 2,
utilising full microsimulation. This two-stage approach allows the very real benefits of the
NPCT to be realised in the short term, while allowing us to bring the even greater benefits
that will be possible with full microsimulation on stream soon after.
The feedback from the workshops and user testing highlights the valuable insights that can
be generated using the simpler aggregate model but also the even greater potential from
the individual level microsimulation approach. We envisage that the aggregate model will
be rolled-out around eight months after the start of Stage 2 and that the microsimulation
model will be rolled-out 12 months later.
The key features of Version 1 will be a fully operational web based propensity to cycle
model for the whole of England. With this interactive tool local authority transport planners
will be able to investigate which small areas and routes have the greatest cycle commuting
potential under a range of assumptions. At the broader level regional and national planners
will be able to investigate which towns and cities have the greatest potential. The tool will
be WebTag compatible, including health economic savings estimated using the World
Health Organization HEAT approach.
Version 2 will be released a year later, in 2017. It will come with significantly improved
functionality allowing the user to interrogate results on a much more detailed population.
Using synthetic microsimulation population will enable investigation of more results across
multiple population subgroups. For example age, gender, ethnicity, car ownership that we
have shown to be important determinant of cycling propensity (see Section 9). Key features
of Version 2 will be estimation of non-commuting cycling potential at an area level and the
inclusion of education trips at a route and area level. More advanced health impact
modelling methods will be used, allowing estimation of impacts on mortality and morbidity
across different subgroups. Other outcomes will include which mode cycling trips are
coming from and the associated change in greenhouse gas emissions.
At the same time as developing Version 1 we will extend the web-interface for the CBM and
undertake user testing on this. The CBM will be available as a stand-alone product, as with
the NPCT available through an open source licence. The CBM will be usable both to model
scenarios and to analyse data from the NTS. User testing of the CBM will inform
development of the results interface for Version 2 of the NPCT.
13.1 Use of the NPCT User testing with local authority transport planners and other key stake holders in London,
Manchester, and Newcastle suggested that the tool could be used in multiple ways. Chief
among these were uses related to:
i. Planning where to target future infrastructure improvement
ii. Communication to decision makers and visually representing routes
iii. Bid and proposal writing,
iv. As an input for other tools

28
v. To sense check estimates of demand provided in other ways, to challenge or confirm
existing assumptions/understandings.
Overall planning was the most commonly mentioned, but many people included more than
one suggestion. These range of uses go with a range of users, and already in the NPCT
Prototype we have created advanced features, to satisfy those users who want to go deeper
but are not intrusive to those less experienced who wish to use the more basic functions.
Our plans for user testing, training and post-launch evaluation are well under way. We have
developing mailing lists of interested users from stakeholder organisations across the
country. We plan to hold up to ten events during Stages II and III, plus associated non-event
feedback gathering, which will include:
(a) User testing events where Version 1 and 2 will be tested in locations across the
UK prior to launch, similar to our already held user testing events
(b) The development of case study material that can be used for training and to
assist users post-launch; this material will be user tested at and outside events
(c) Post-launch evaluation of the tool conducted through a short online survey of
stakeholders
A key question that has arisen in Stage 1 is the extent to which we are modelling cycling
propensity vs cycling potential. In other words, are we looking for quick wins in the near
market (high ‘propensity’) or are we looking for where, based on the urban form and trip
distances, the greatest potential exists (high ‘potential’). In the near term people are more
likely to take up cycling if they match the demographics of those who currently cycle and in
areas with already above average cycling. However, in the longer term there may be much
greater potential to increase cycling among groups currently less likely to cycle (e.g. women
and older people make more short trips). In some cases this will also translate into greater
potential to improve health, for example from getting older people on bikes, as shown using
the CBM (see Section 11). The NPCT will be designed so that with Version 2 the user can
look at both.
13.2 Version 1 For Version 1 we will first add two strongly requested user features, aggregation of cycling
flows on specific routes and health impact modelling using the HEAT tool approach. The
aggregation of cycling flows from multiple MSOAs on to specific routes is a way of
representing that cycling flows will combine at certain key points. Providing the information
on where the combinations produce the highest flow provides more valuable information
for planning than just looking at flows between any two zones alone.
Inclusion of the HEAT tool calculation will enable WebTag compliant outputs, in which the
economic case can be included based on the statistical value of a life. We will also add video
and interactive elements to assist with training and to make the tool more accessible. This
will be followed by extensive user testing with local authorities, regional planning
authorities, DfT, and cycling organisations. The model will then be refined in the light of this

29
feedback and then rolled out, that is made freely available on a website and with open
source code, covering the whole of England.
New features planned for Version 1 include:
'Headline stats' section at beginning of model output tab saying 'Under 'Go Dutch'
xx% of commuters would cycle, compared with xx% of commuters under the ‘Go
Dutch’ scenario nationally’
‘Heatmap' view of propensity to cycle 'desire lines', potentially with different
'bandwidth' options
Results tab, illustrating model output (e.g. extra cyclists, HEAT output, with
economic benefits allocated to routes)
'Quadrant view', showing only top n lines in specific quadrants of the city
'Select flows' functionality, allowing selection of specific origins/destinations or both
A scenario based on the Get Britain Cycling recommendations.
13.3 Version 2 Based on Stage 2 starting in autumn 2015, Version 2 will be launched in early summer 2017.
The final year of the project will consist of website maintenance and support and
evaluation.
For Version 2 we will generate a synthetic individual level population covering the whole of
England. When completed and after user testing, the Spatial Microsimulation Model will
supersede the Aggregate Model. Propensities to Cycle will be included based on the Stage 1
analysis. The data will be at the smaller area level, most likely LSOA and LSOA to Workplace
Zone. An additional education layer will be included based on travel to school data.
We will integrate non-commuting travel data from the National Travel Survey, producing
best estimates at a small area level of other travel patterns. The data will be rich and allow
detailed interrogation by users with extensive data visualisation. Here we will draw on the
lessons learned from the CBM and THAT model.
Previous work using the National Travel Survey has indicated that, at a population level, the
proportion of commuters using cycling as their ‘usual, main commute mode’ is reasonably
well correlated with the proportion of total travel time in an area that is accounted for by
cycling (r=0.77) vi. In other words, populations in which a larger proportion of commuters
cycle to work tend also to be populations in which cycling accounts for a larger proportion of
vi Goodman, A. (2013). Walking, Cycling and Driving to Work in the English and Welsh 2011
census: Trends, Socio-Economic Patterning and Relevance to Travel Behaviour in General.
PLOS ONE, 8 (8), e71790. Available from:
http://journals.plos.org/plosone/article?id=10.1371/journal.pone.0071790

30
all travel. This gives some confidence that areas defined as high-cycling based on commute
modal share will also be high-cycling for other types of trips. We will also calibrate estimates
at the Local Authority level using the Active People Survey.
This strong correlation between levels of commute and non-commute cycling will be useful
for Stage 2, as it provides some justification for assigning non-commute cycling trips to local
populations based on their commuting trip patterns. However, our analysis shows that
areas differ substantially in the proportion of commuters among the population (and hence
the ratio at area level between commute and non-commute trips), depending on factors
such as employment levels, student population, and age structure. For variation by age see
Figure 10.
This means that those areas with highest commuter cycling potential under a given scenario
may not be the same areas as those with highest non-commuter cycling potential.
Note also that the correlation between commuter and non-commuter cycling at population
level may not apply at route level – the routes that individuals might use when cycling to
work are likely to over-represent commuting corridors between residential and business
areas, and may not be the same routes that people use in making other trip types, such as
shopping trips or trips to visit friends. This is one (of many) reasons why the route allocation
on NPCT will be only one of multiple pieces of evidence that transport planners should draw
on in deciding where to build infrastructure.
In Stage 2, extending NPCT to include non-commuting trips will not only make the model
more comprehensive but also more inclusive. This is because commuting is a type of trip
disproportionately made by younger as opposed to older adults, and by men as opposed to
women:
Figure 10: Proportion of all trips made for commuting purposes for adults in England
The commute is also, by definition, a type of trip that is only made by those in work, and
therefore excludes some disadvantaged groups such as the unemployed and those unable
0%
5%
10%
15%
20%
25%
30%
35%
16-29 30-39 40-49 50-59 60-69 70-79 80+
female male

31
to work because of disability. As such, a model that only examined propensity to cycle for
commuting trips would disproportionately be seeking to facilitate cycling among relatively-
advantaged younger men, a group that is already over-represented among cyclists. By
contrast, incorporating other trip types will help to give greater consideration to the cycling
potential of trips by a wider range of individuals.
A far wider range of scenarios will be testable, in this case building on the Rapid Evidence
Reviews. In particular the user will be able to investigate how cycling uptake might vary if
we assume current propensities by age, gender, ethnicity, car ownership and region are
maintained or if they are overcome. Rather than using an area level propensity based on
average characteristics e.g. as in the Mosaic approach, we will use individual level data
combined with area level characteristics. This approach will enable us to explain a large
proportion of variation in behaviour, whilst recognising that areas are not homogenous but
include heterogeneous individuals with different propensities.
The user will be able to choose in detail both where the greatest short term wins will be
realisable and where the longer term potential is highest. It will enable estimation of who is
cycling under different scenarios and what this means in terms of health, greenhouse gas
emissions, and equity.
The users will be able to look at outcomes as a series of tables, similar to the currently
available Census tables. For example a table could consist of the number of cycle
commuters by socio-economic status, age, ethnicity, gender, or car ownership under a
range of scenarios. At higher levels of geography more results will be available. Although
the data presented will be aggregated, to ensure data confidentiality, the analysis behind it
will be at the individual level so far more combinations of results will be realisable than if we
were starting with aggregated data.
Again building on the CBM and THAT model we will integrate a more sophisticated health
impact modelling approach that will allow calculation of demographic specific changes in
disease burdens across a range of conditions affected by physical inactivity. Diseases will
include ischemic heart disease, stroke, type 2 diabetes, colon cancer, breast cancer, lung
cancer, depression, and dementia. These models will be populated with the best evidence
from a series of dose response meta-analyses the MRC Epidemiology Unit are currently
conducting.
In conclusion, the development and testing of the prototype NPCT and the complementary
workpackages have demonstrated both the feasibility and the demand for a NPCT.

32
14.0 Stages 2 and 3 Gantt Chart
Oct-
Dec
2015
Jan-
Mar
2016
Apr-
June
2016
July-
Sept
2016
Oct-
Dec
2016
Jan-
Mar
2017
Apr-
June
2017
July-
Sept
2017
Oct
2017-
Sept
2018
Version 1
National Model
Adding features (aggregated
flows, buffered zones,
visualisation at different levels,
Improving hilliness)
Adding features HEAT
Additional scenarios (e-bikes)
Extension to all of England
User testing
Modification following user testing
Training and post launch
evaluation
Co-Benefits model (other health
outcomes, CO2 and webtool)
Co-Benefits model user testing
Version 2
Generating and testing MS
population
Implementation into webtool
Additional scenarios
Education layer
Inclusion of NTS
ITHIM health calculation
User testing
Modification following user testing
England roll out
Training and post launch
evaluation
Maintenance and updating
Stage 3: Pathways to National
Objective
The work laid out for Stage 2 is ambitious but realistic and will put a fit for purpose model in
the hands of practitioners backed by a wealth of in-depth evidence and research.

33
There are further steps that could be taken with the work but that are not realisable within
the budget, see Section 16. The costs will be front loaded such that around half the budget
will spent in year 1, around one third in year 2, and one sixth in year 3.
15.0 Risks and Risk Mitigation All projects come with risks. Producing a fit for purpose propensity to cycle tool that covers
the whole of England and is publicly available is an ambitious undertaking. That we can
achieve this goal is evidenced by our success in producing a robust prototype in six months
that has stood up well under user testing. We have gone beyond the requirements to
develop this for three cities and have a process in place that allows comparatively rapid
deployment for multiple areas. Further evidence is provided by our having concurrently
developed the methodology required for the more advanced microsimulation approach.
15.1 Scalability During Stage 1 we have monitored demands on server capability (e.g. during our user
testing events) and have researched options for scaling up server capacity to allow roll-out
of the NPCT and reasonable levels of simultaneous use. We have obtained quotes for
technical support and are confident of our ability to create a resilient system supporting
national roll-out. See Appendix 11 for more details.
15.2 Data access Building the models requires access to data, including requesting access to bespoke and
restricted data, as well as freely available data. We have requested access to a number of
additional ONS tables, which will allow us to more accurately populate our micro-simulation
model. So far we have already purchased more detailed tables at the LSOA level. We are
still in discussion with the Census teams on more detailed flow data. It is possible that not
all of these will be made available to us, due to confidentiality concerns. In this case we will
be able to use Census datasets already provided, which will be acceptably accurate for our
purposes. The work conducted for the SMS feasibility study has demonstrated that even
with the data already available we can produce an accurate population with multiple
characteristics at the LSOA to LSOA flow level.
For the proposed education layer we will need to access data from the National Pupil
Database 2010-11, which has data on pupil postcodes, schools, and mode of travel. As with
the additional Census tables, it is not guaranteed that we will be able to access this data in
the form we would ideally like, and we may have to make compromises based on this. In the
worst-case scenario that it proves impossible to operationalise an education layer,
alternative functionalities could be prioritised instead (for example, looking at trips to
transport interchanges).
15.3 Data management and data security Our team has extensive data management expertise and is used to dealing with ‘big data’
type problems. The lead institution is the MRC Epidemiology Unit which has considerable
experience in handling large, sensitive and complex data sets. All secure data will be stored
at the MRC Epidemiology Unit. No sensitive data will be placed on the server.

34
Version 1 of the model is based on Census data at sufficient levels of aggregation such that
there is no sensitive or potentially disclosive data on the server.
In Version 2 we will be creating a realistic microsimulation population that, in many cases,
for some characteristics will closely match the ‘real’ population in 2011 of England. This,
therefore, creates a greater challenge for data security. This challenge will be met by
ensuring the individual level data generated is not stored on the server. Instead we will
generate summary tables, similar to those currently provided by the Census, for each
scenario and these will be stored on the server. This will also considerably reduce the
amount of data that needs to be placed on the server.
We will also apply various thresholds to make sure the summary tables we generate do not
include potentially disclosive data. We plan to apply stricter rules than those currently
applied by the Census disclosure team when we are displaying data that is close to real or
baseline synthetic data; for variables that are model generated (e.g. switch to cycling) the
need for caution is lower.
16.0 Stage 3: Pathways to Implementation This report will collate information from Stage 2 to consider the policy implications of the
findings and set out a range of options for achieving the Government’s cycle ambition. This
will include central material from the NPCT and associated co-benefits modelling, as well as
updating and expanding reviews from Stage 1, and conducting a new online survey to
enhance understanding of what practitioners see as the key local/national policies that
could support our achieving the national cycling ambition.
In Stage 1 we have developed and (in our case study cities) implemented scenarios that
have explored the different implications of building for the near market versus building for
the kind of cycling demographic we see in high-cycling countries. As we build upon this work
in Stage 2, we will be able to take both a local and a national view of these choices. In a local
context, we can ask what the different implications are of building routes to cater for
different groups of potential cyclists: for example, building for a different commuter market
may imply catering for different origin-destination pairs than if one were to attempt to
attract more people who are similar to already existing cyclists.
At a national level, we will be able to identify particularly promising areas under different
scenarios. For example, there may be areas with many short trips made by under-
represented groups (e.g. women, older people), where building transformative
infrastructure might unlock substantial suppressed cycling potential. These areas might not
be identified without our tool.
The report will cover these issues, highlighting and contrasting specific local case studies
where the tool has informed approaches to investment and planning. It will discuss
implications of different strategies for co-benefits, which may include: travel time benefits,
health benefits, decongestion benefits, carbon benefits, and increases in access to mobility
and facilities.

35
The report will update and summarise reviews already conducted in Stage 1, which have
provided evidence about the type of infrastructure which can attract different market
segments. This will be built upon to provide recommendations for building for areas without
a tradition of cycling, and for under-represented groups. The case studies already
mentioned can provide specific local illustrations, as well as broader examples of location
specific interventions. An online survey of built environment practitioners will contribute to
recommendations about national changes that may be needed to support this local activity.
Proposed structure of report:
Discussion of broader issues involved in realising our cycling ambition, drawing on
Stage 1 reviews, updating these and summarising for a broad policy audience.
Summary of results of national survey of built environment practitioners on barriers
to planning for cycling, and national/local changes that could enable these.
Discussion of investment options in relations to co-benefits and specific
strategies/targets; informed by our co-benefits model, examples will be drawn from
this.
Examples of how the tool has been used to develop location specific investment
plans; this material can also be used as training/guidance for other areas.
Specific recommendations about how places with low levels of cycling and/or
targeting under-represented groups might grow cycling substantially within a
decade.
Recommendations for national policy interventions needed to support local
transport authorities seeking to make the change.
17.0 Future work The two versions of the NPCT that we envisage will provide a robust and transparent basis
for transport planners to support evidence based decision making. The tool will go
considerably beyond the armoury that decision makers currently have at their disposal.
However, we recognise that there is always more than can be done in any one project. In
this section we highlight what we consider the most significant additional steps that could
be taken.
1) Modelling of multimodal trips.
The NPCT focuses on trips that can be cycled all the way. Currently the vast majority of cycle
trips are cycle all the way trips. Thus it makes sense to start with these trips. However, the
potential for multimodal cycle trips is still significant, particularly in rail commuter belts.
Multimodal cycle trips have the advantage of allowing physical activity to become part of
longer journeys that could not realistically be cycled all the way.
Multimodal trips are harder to model than all the way trips. Different combinations of
multimodal cycle trips are possible with the most important likely to be multimodal train
plus cycle. The easiest trips to model would be existing rail trips where the train is currently
accessed by a non cycle mode. In areas of the country in which there is substantial rail
commuting estimates of this potential would be significant. A more difficult question is the

36
potential for replacing existing car journeys with rail plus cycle. Whilst challenging we
believe that credible estimates are possible and answering this question could bring bigger
benefits where longer distance car travel is the norm. Replacing these longer car journeys
could bring substantial benefits in terms of greenhouse gas emissions as well as additional
health outcomes.
2) Scaling up for other nations in UK
The NPCT is being created for England, while the CBM also covers Scotland and Wales.
Further work could extend the tool to cover the other constituent countries of the United
Kingdom. For a large part the work would be quickly extendable to these countries due to
the generalisable nature of the methods developed and the similarities in the data available.
However, in each case some additional work will be required around data harmonisation,
initial propensity parameterisation and developing the tool to fit with the needs of local
stakeholders.
3) Locally detailed versions
Using generalisable methods allows the creation of a national useful model with a
transparent method. However, specific areas and regions could take the approach further
using local data. In some cases, e.g. London, more densely sampled additional travel survey
data is available and this could be used to improve estimates of non-commuting flow and
locally parameterised estimates on propensities. In other cases more detailed work could
focus on the attractiveness of destinations to provide estimates of transport demand and
corresponding cycling potential.
4) Impact of policies
The NPCT is designed to answer the question if cycling increased, in which areas, on which
routes and amongst which groups would the impacts be greatest. It is not designed to
predict what the effect of an intervention might be on cycling rates, although we do
envisage providing data that will help with this question. The data to answer this question
remains limited, although members of the research team are involved in other research
projects taking this forward. Incorporation of methods for estimating the impact of policies,
whilst recognising the considerable uncertainty that such estimates would come with, could
be a further development of the NPCT.
5) Inclusion of new big data sources to estimate flows
Flows for all trips, not only commuting trips, could be estimated based on new data sources.
The most promising of these would be mobile phone data. This data would not inform on
mode or trip purpose but offers by far the most potential for estimating total flows between
areas.
6) Improved linkage to other transport models.

37
For example, TRICSvii/TRAVL provides data on likely trip generation from different types of
development. This could be used to predict overall flows to particular destinations, such as a
shopping centre or a new housing development. Our cycling potential analysis could then be
applied to these flows. Another option would be to link up with local transport models
which contain local origin-destination information. Unfortunately there is no such national
model available and the local models will typically be commercially restricted and not open
source.
7) Road traffic injury risk
Cycling poses low risk to other road users but cyclists typically face higher risks than they
would if they travelled by car, with the possible exception of young men. Mode shift could
reduce the risk cyclists face as there would be fewer cars on the road. Putting in better
infrastructure could also reduce risks. Risks vary substantially by age, gender and location.
Estimating local risks is difficult because of small numbers of events. Producing small area
estimates on baseline and scenario risks would require research including literature reviews,
data analysis, model development and model calibration. The ITHIM model developed by
CEDAR and the associated calibrations conducted for Metropolitan Planning Organisations
conducted in the USA could form the basis for this work.
18.0 Stages 2 and 3 Academic Team members Dr James Woodcock – Research Lead
James leads the Public Health Modelling Group within CEDAR
http://www.cedar.iph.cam.ac.uk/people/leads/james-woodcock/ James is a Medical
Research Council Population Health Scientist fellow and Principal Investigator on an
Economic and Social Research Council (ESRC) study using agent based modelling to
understand propensity to cycle. He is Principal Investigator on a project for Public Health
England creating a microsimulation model England to evaluate the ‘Health Checks’
Programme. He has been awarded Engineering and Physical Sciences Research Council
(EPSRC) funding to collaborate with Transport for Greater Manchester on a bespoke cycling
propensity model. James has extensive experience managing systematic reviews for
governmental, third sector, and commercial clients. James has led development of the
ITHIM and THAT health impact models. These models are used globally in both academic
research and in transport practice
http://www.cedar.iph.cam.ac.uk/research/modelling/ithim/ . He is also on the expert core
group for the World Health Organization HEAT tool.
Dr Rachel Aldred – Co-Investigator
Rachel is a Senior Lecturer in Transport at the University of Westminster’s Department of
Planning and Transport. She specialises in research on cycling and has published many
articles in key journals. By training a qualitative sociologist she now collects, analyses and re-
vii See http://www.trics.org/ and http://travl.org/homepage.aspx

38
analyses qualitative and quantitative transport data. She led the ESRC seminar series
'Modelling on the Move' (focusing on transport modelling) and has recently had work
funded by British Cycling, TfL, and the Arts and Humanities Research Council. Rachel has
given evidence on cycling to the London Assembly (twice) and the All-Party Parliamentary
Cycling Inquiry. She has been invited to speak at many relevant conferences and meetings
including TfL’s Highway Assignment Modelling Forum.
http://scholar.google.co.uk/citations?user=jycgGvsAAAAJ&hl=en
Dr Anna Goodman – Co-Investigator
Anna is a Lecturer at the London School of Hygiene and Tropical Medicine, and has expertise
in the use of secondary data to understand cycling behaviour. This expertise is core to two
grants on which she is Principle Investigator: a Fellowship funded by the National Institute
for Health Research (NIHR) on socio-economic inequalities in walking and cycling; and an
ESRC Secondary Data Analysis grant to evaluate DfT’s Bikeability scheme. Anna has
collaborated with CEDAR for 5 years. Anna has experience collaborating with DfT including
in relation to evaluations of the Cycling Demonstration Towns, Bikeability, and the Local
Sustainable Transport Fund. http://researchonline.lshtm.ac.uk/view/creators/106408.html
Dr Robin Lovelace – Co-Investigator
Robin is an Environmental Scientist and quantitative geographer. Robin’s expertise includes
modelling modal shift, spatial data analysis and GIS. Through a recent 1 month placement at
the $20+ million Australian Urban Research Infrastructure Network, Robin has direct
experience with development and deployment of governmental online planning tools.
Robin is Research Fellow on the newly formed Consumer Data Research Centre at the Leeds’
Institute for Data Analytics. Working for the National Centre for Research Methods, Robin
teaches data visualisation and spatial microsimulation methods. Robin’s skill-set combines
computing (e.g. online interactive visualisation), data analysis and multi-disciplinary
collaboration. http://www.geog.leeds.ac.uk/people/r.lovelace
Alvaro Ullrich – Data manager and programmer
Alvaro has extensive experience in data handling and analysis, on an assorted range of
platforms. Recent relevance experience includes:
Multiple Imputation using NTS and Health Survey for England data
Spatial microsimulation: refining methods to produce a model including commuting routes for Cambridgeshire County Council
Handling of spatial data: analysis of 900 GPS files, using R scripts to automate the mapping
Data cleaning: using Structured Query Language (SQL) and R to deal with missing values, data entry errors, and anonymisation.
Relational databases: experience with SQL-based languages including Postgres and SQLite.
Bespoke web tools to display study results (GoActive study).
Shiny: building and deploying apps.

39
Ali Abbas- Researcher and programmer
Ali is an experienced programmer with expertise in R, Java, and Netlogo and at developing
apps with Shiny. He has worked extensively with microsimulation models including social
network models, agent based models, and other models representing individual variation in
propensity to cycle.
Dr Nikolai Berkoff – Programmer
Nikolai is a freelance web developer and consultant, with experience working on a number
of complex, innovative and high-volume website applications in a commercial programming
environment. He mainly programs in Ruby, but also is expert in Go, R and JavaScript. Nikolai
has a Ph.D. in mathematics and adopts a strongly analytic approach to programming. Nikolai
has previous experience hosting web servers; and as part of the NPCT project team leads on
server administration and technically challenging aspects of the tool's online interface.
19.0 Authorship and contributors The work presented in the report was a team effort, led by the academic team (James
Woodcock, Rachel Aldred, Anna Goodman, and Robin Lovelace) and Alvaro Ullrich. James
Woodcock led on workpackages 2, 3, 6; Anna Goodman led on workpackage 4; Rachel
Aldred led on workpackage 1; and Robin Lovelace led on workpackages 5 and 7, with Alvaro
Ullrich leading on the microsimulation section of workpackage 5.
In addition contributors to each section were Ali Abbas (Appendix 10), Nikolai Berkoff
(Appendices 3 and 11), Bridget Elliott (Appendix 5), David Fell (Summary Report), Eva
Heinen (Appendices 4 and 8), Geoff King (Appendix 4 & Summary Report), Tim Knight
(Appendix 4), Rick Prins (Appendix 8), Marko Tainio (Appendix 9), and Alvaro Ullrich
(Appendix 10).

40