NATIONAL PRODUCTIVITY COUNCIL WELCOMES YOU TO A PRESENTATION ON
115
NATIONAL PRODUCTIVITY COUNCIL WELCOMES YOU TO A PRESENTATION ON CONTROL CHARTS By B.Girish Dy. Director
-
Upload
garth-porter -
Category
Documents
-
view
21 -
download
1
description
NATIONAL PRODUCTIVITY COUNCIL WELCOMES YOU TO A PRESENTATION ON. CONTROL CHARTS By B.Girish Dy. Director. Three SQC Categories. Traditional descriptive statistics e.g. the mean, standard deviation, and range - PowerPoint PPT Presentation
Transcript of NATIONAL PRODUCTIVITY COUNCIL WELCOMES YOU TO A PRESENTATION ON
NATIONAL PRODUCTIVITY COUNCIL
WELCOMES YOU TO A PRESENTATION
ON
CONTROL CHARTSBy B.Girish
Dy. Director

Three SQC Categories Traditional descriptive statistics
e.g. the mean, standard deviation, and range
Acceptance sampling used to randomly inspect a batch of goods to determine acceptance/rejection
Does not help to catch in-process problems
Statistical process control (SPC) Involves inspecting the output from a process Quality characteristics are measured and charted Helpful in identifying in-process variations
Statistical Process Control (SPC)
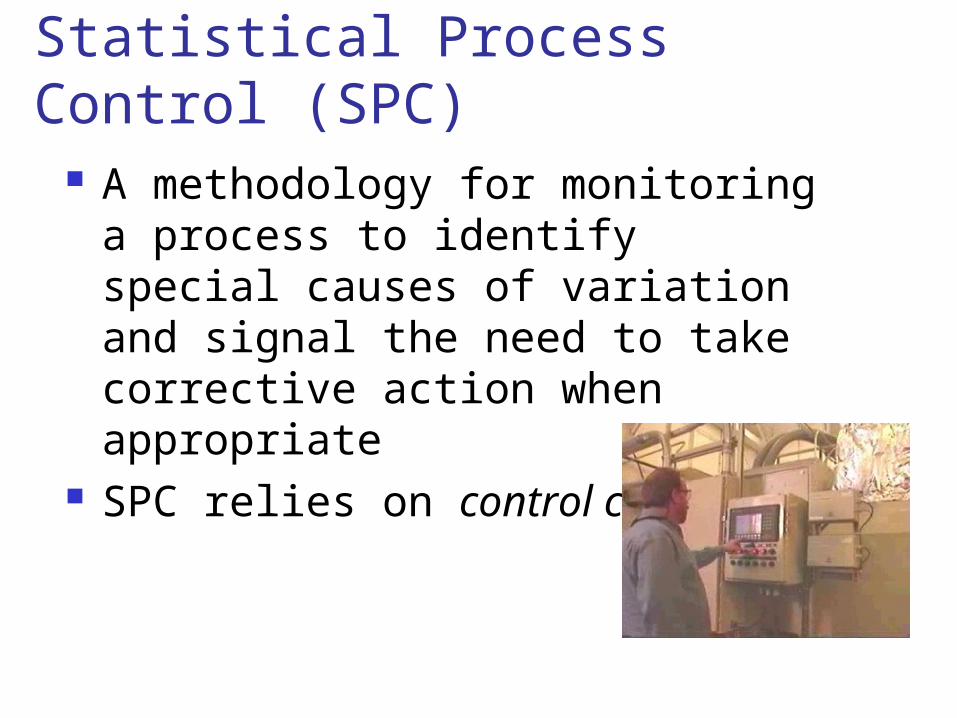
A methodology for monitoring a process to identify special causes of variation and signal the need to take corrective action when appropriate
SPC relies on control charts
SPC Implementation Requirements Top management commitment Project champion Initial workable project Employee education and
training Accurate measurement system
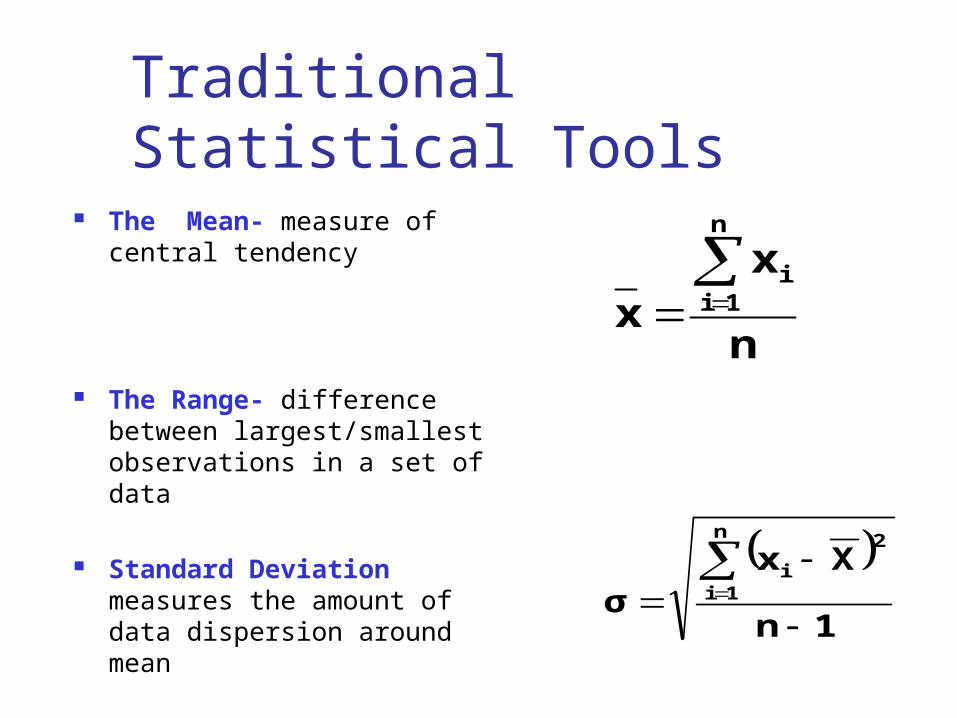
Traditional Statistical Tools The Mean- measure of
central tendency
The Range- difference between largest/smallest observations in a set of data
Standard Deviation measures the amount of data dispersion around mean
n
xx
n
1ii
1n
Xxσ
n
1i
2
i

Distribution of Data Normal distributions Skewed distribution

Sources of Variation Common causes of variation
Random causes that we cannot identify Unavoidable e.g. slight differences in process variables like diameter,
weight, service time, temperature
Assignable causes of variation Causes can be identified and eliminated e.g. poor employee training, worn tool, machine needing
repair

Common Causes
Special Causes
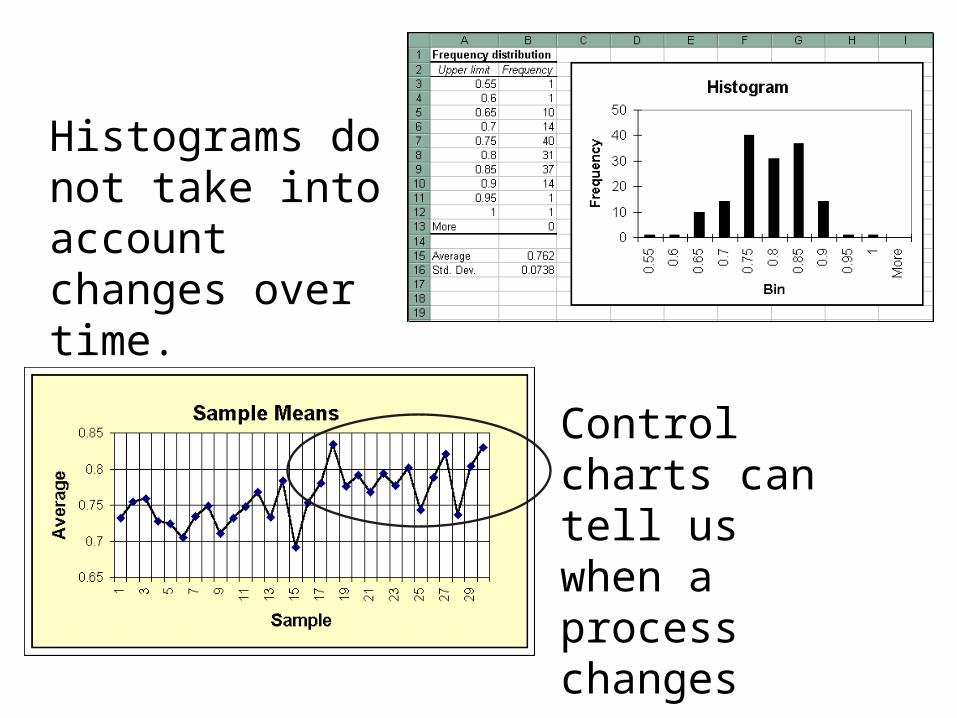
Histograms do not take into account changes over time.
Control charts can tell us when a process changes
Introduction to Control Charts
Important uses of the control chart
1. Most processes do not operate in a state of statistical control
2. Consequently, the routine and attentive use of control charts will identify assignable causes. If these causes can be eliminated from the process, variability will be reduced and the process will be improved
3. The control chart only detects assignable causes. Management, operator, and engineering action will be necessary to eliminate the assignable causes.

Monitor Variation in Data Exhibit trend - make correction before
process is out of control A Process - A Repeatable Series of
Steps Leading to a Specific Goal
Introduction to Control Charts

Show When Changes in Data are Due to: Special or assignable causes
Fluctuations not inherent to a process Represent problems to be corrected Data outside control limits or trend
Chance or common causes Inherent random variations Consist of numerous small causes of random
variability
(continued)Introduction to Control Charts
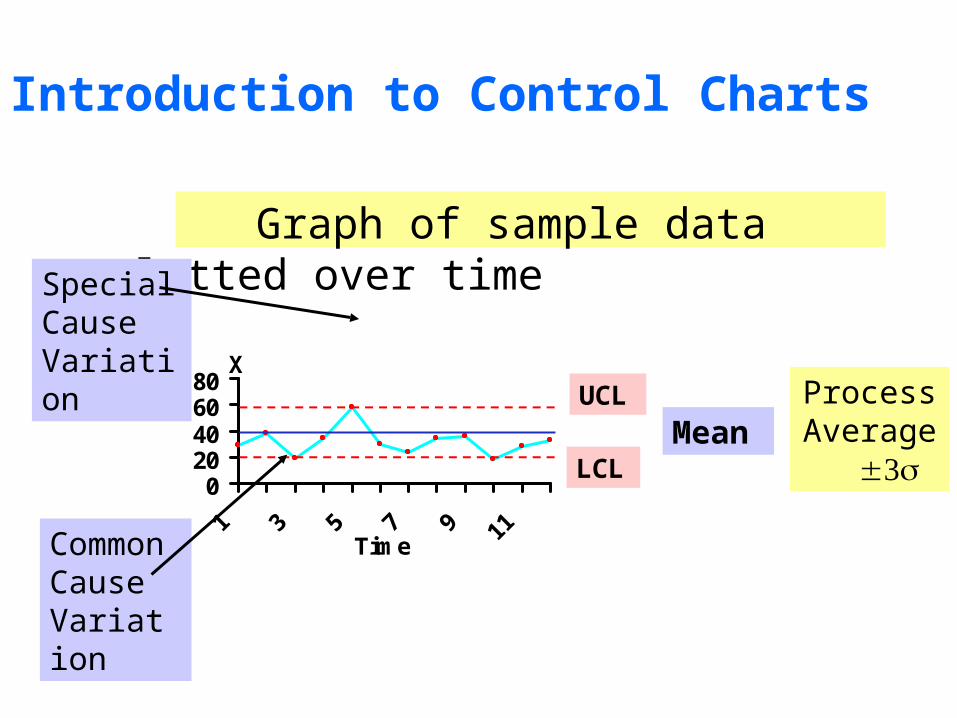
Graph of sample data plotted over time
020406080
1 3 5 7 9 11
X
Time
Special Cause Variation
Common Cause Variation
Process Average
Mean
UCL
LCL
Introduction to Control Charts

Commonly Used Control Charts
Variables data x-bar and R-charts x-bar and s-charts Charts for individuals (x-charts)
Attribute data For “defectives” (p-chart, np-chart) For “defects” (c-chart, u-chart)
Introduction to Control Charts
Popularity of control charts
1) Control charts are a proven technique for improving productivity.
2) Control charts are effective in defect prevention.
3) Control charts prevent unnecessary process adjustment.
4) Control charts provide diagnostic information.
5) Control charts provide information about process capability.
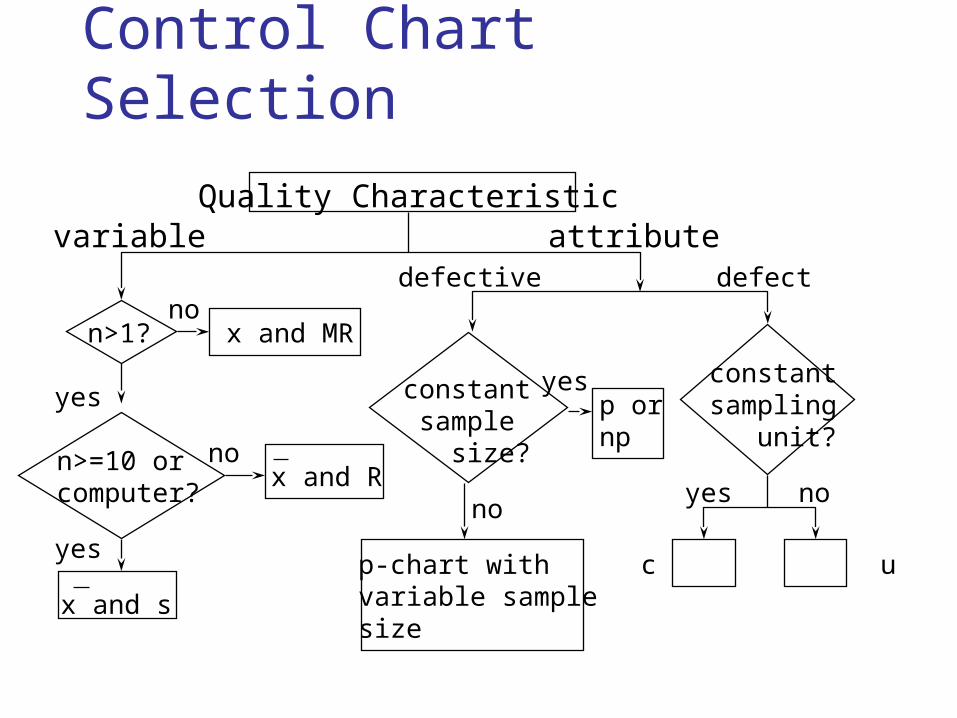
Control Chart Selection
Quality Characteristicvariable attribute
n>1?
n>=10 or computer?
x and MRno
yes
x and s
x and Rno
yes
defective defect
constant sample size?
p-chart withvariable samplesize
no
p ornp
yes constantsampling unit?
c u
yes no

SPC Methods-Control Charts
Control Charts show sample data plotted on a graph with CL, UCL, and LCL
Control chart for variables are used to monitor characteristics that can be measured, e.g. length, weight, diameter, time
Control charts for attributes are used to monitor characteristics that have discrete values and can be counted, e.g. % defective, number of flaws in a shirt, number of broken eggs in a box
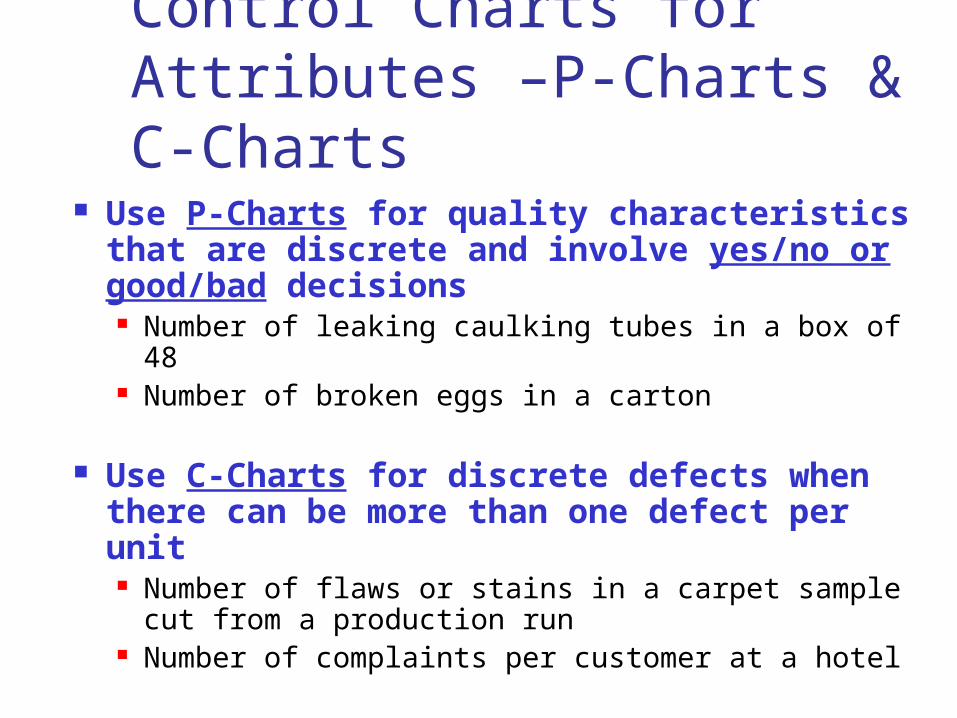
Control Charts for Attributes –P-Charts & C-Charts
Use P-Charts for quality characteristics that are discrete and involve yes/no or good/bad decisions Number of leaking caulking tubes in a box of 48 Number of broken eggs in a carton
Use C-Charts for discrete defects when there can be more than one defect per unit Number of flaws or stains in a carpet sample
cut from a production run Number of complaints per customer at a hotel

Control Chart Design Issues Basis for sampling Sample size Frequency of sampling Location of control limits

Developing Control Charts
1. Prepare Choose measurement Determine how to collect data,
sample size, and frequency of sampling
Set up an initial control chart
2. Collect Data Record data Calculate appropriate statistics Plot statistics on chart

Pre-Control
nominal value
Green Zone
Yellow Zones
RedZone
RedZone
LTL UTL
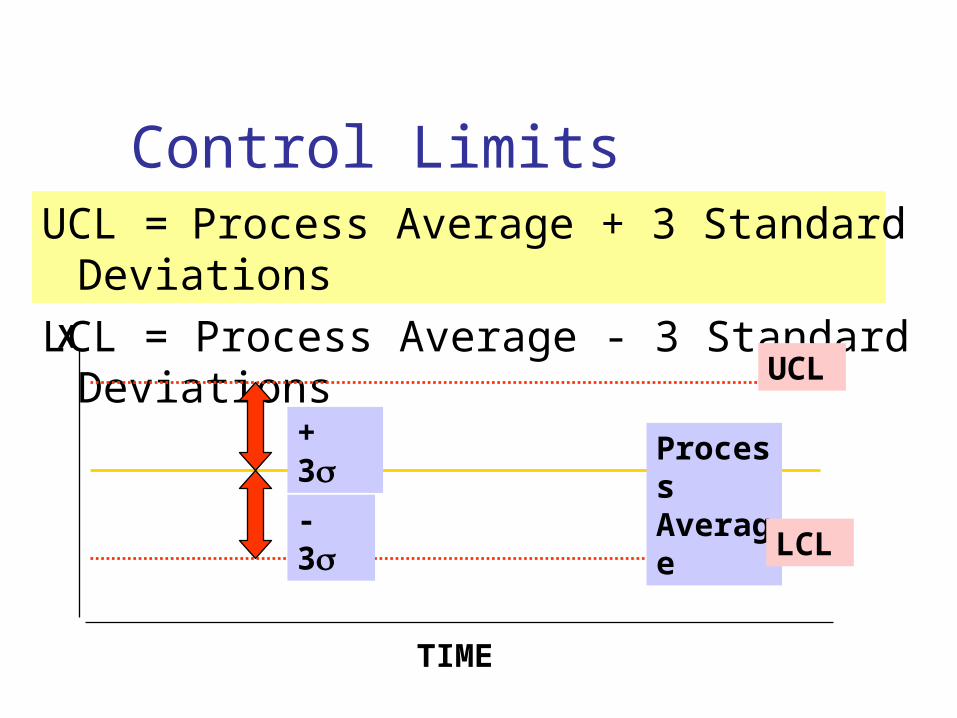
Control LimitsUCL = Process Average + 3 Standard
DeviationsLCL = Process Average - 3 Standard
DeviationsProcess Average
UCL
LCL
X
+ 3
- 3
TIME
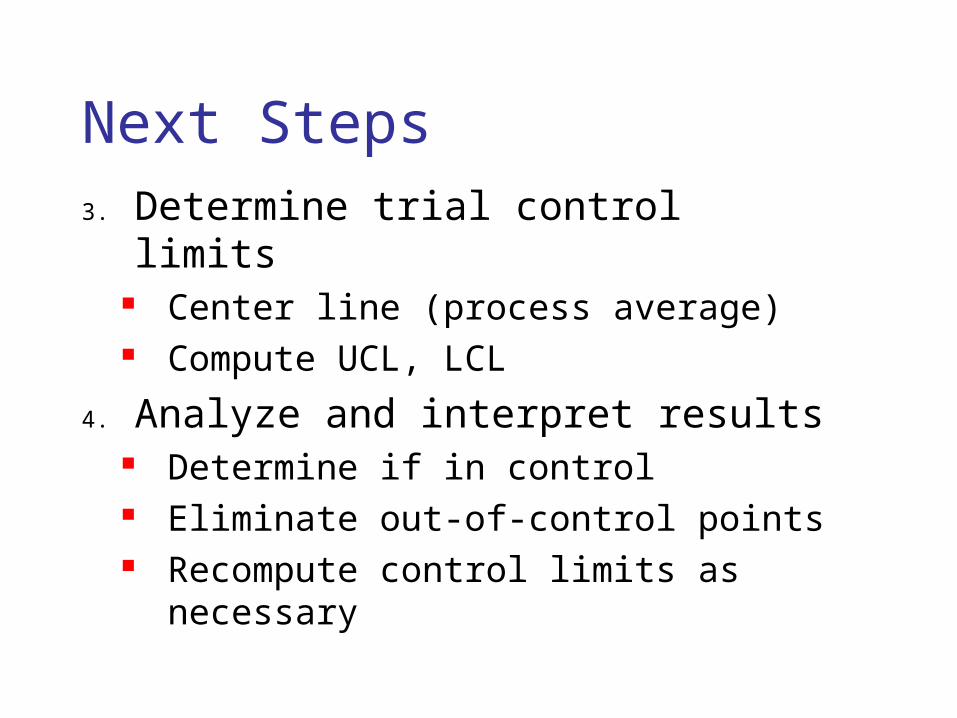
Next Steps3. Determine trial control limits
Center line (process average) Compute UCL, LCL
4. Analyze and interpret results Determine if in control Eliminate out-of-control points Recompute control limits as
necessary
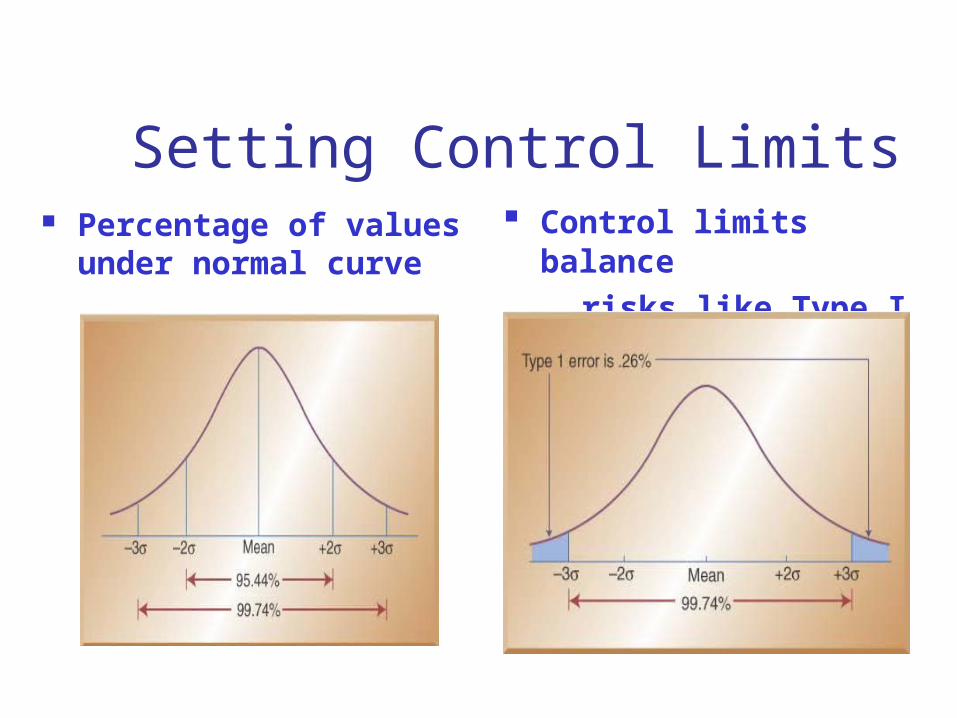
Setting Control Limits Percentage of values
under normal curve
Control limits balance
risks like Type I error

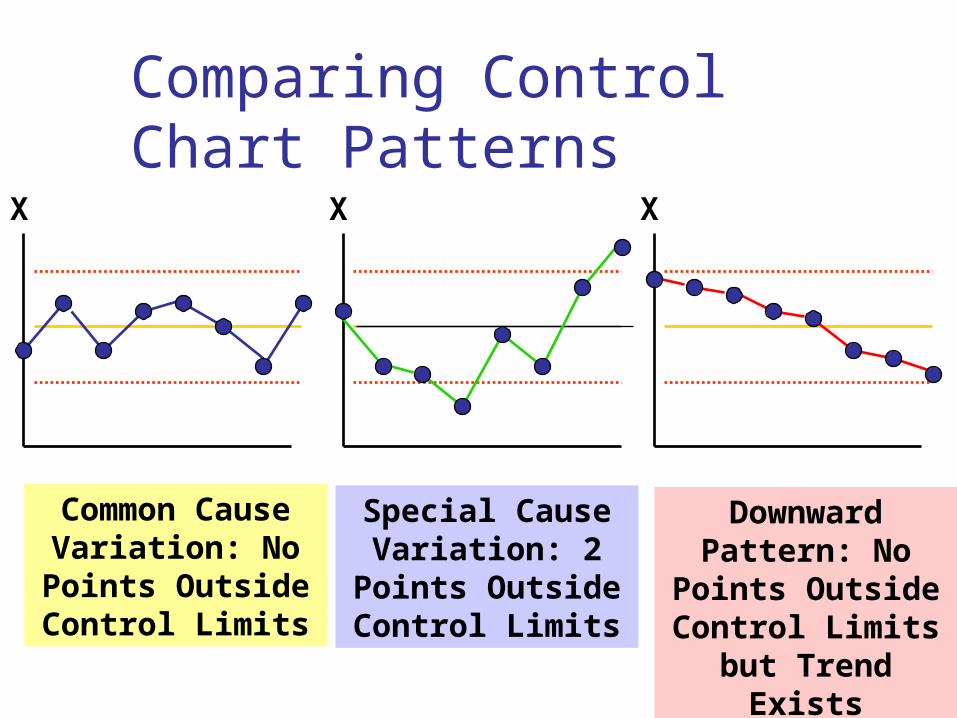
Comparing Control Chart Patterns
X XX
Common Cause Variation: No Points
Outside Control Limits
Special Cause Variation: 2 Points
Outside Control Limits
Downward Pattern: No Points Outside Control Limits but
Trend Exists

Typical Out-of-Control Patterns Point outside control limits Sudden shift in process average Cycles Trends Hugging the center line Hugging the control limits Instability

Control Charts for Variables
Use x-bar and R-bar charts together
Used to monitor different variables
X-bar & R-bar Charts reveal different problems
In statistical control on one chart, out of control on the other chart? OK?
� � �
�
�
� �
�
� � �
� �
� � �
�
� �
�
�
� �
� �
� �
�
� � �
� � � �
�
�
�
�
� �
�
�
�
�
�
� �
� �
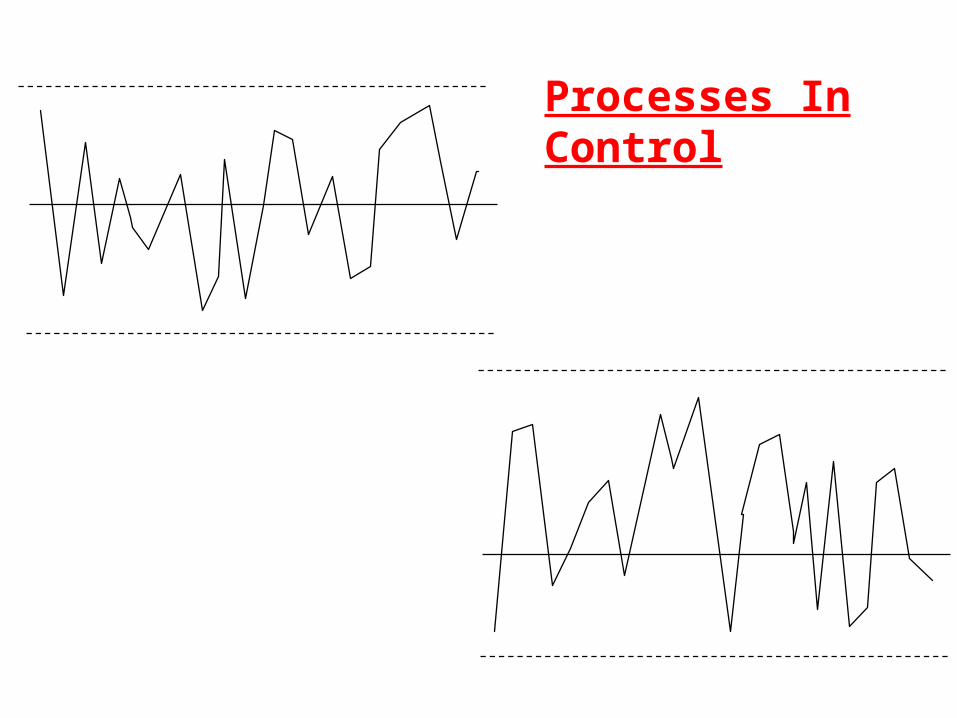
Processes In Control

� �
�
�
�
� �
�
�
�
�
�
�
� �
�
�
�
�
�
�
�
�
� �
Process Out of Control
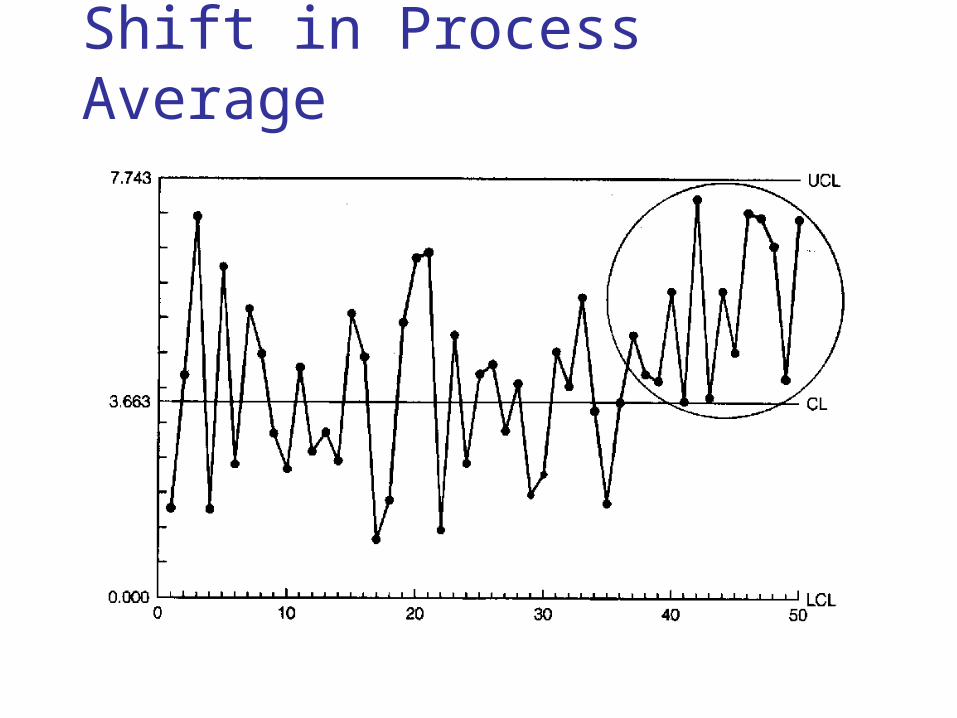
Shift in Process Average
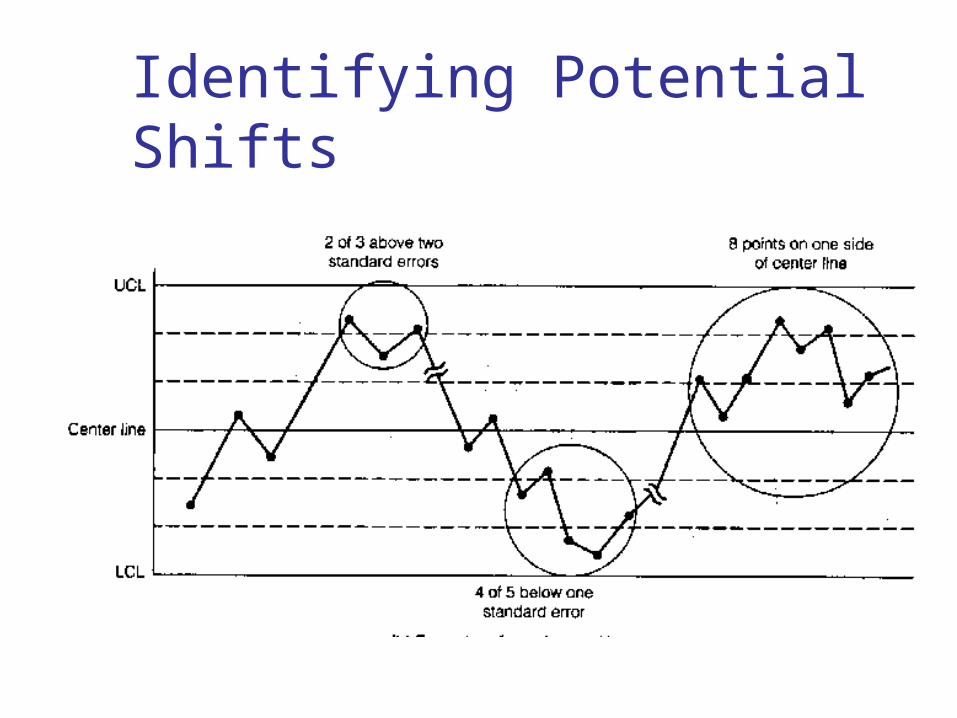
Identifying Potential Shifts

Cycles
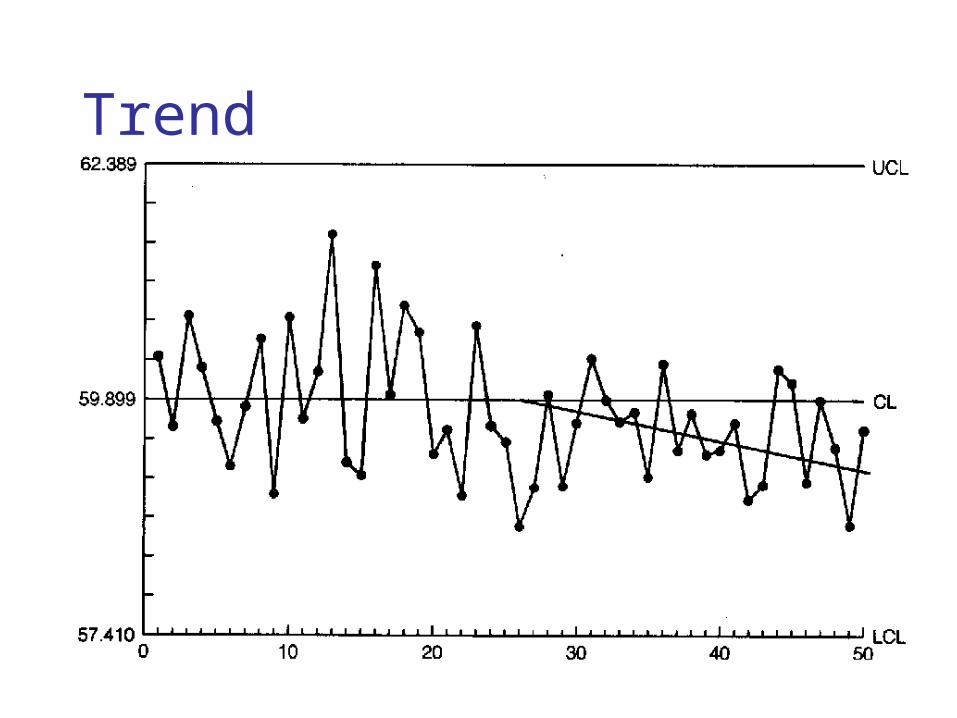
Trend

�
�
�
�
�
�
�
� �
� �
� �
� � � �
�
� � �
� �
� �
Sudden stability
�
�
�
�
�
�
�
� �
�
� �
Mixtures
� �
� � � �
� �
� �
UCL
Center
line
LCL
PROCESS STREAMS

Chart
ProcessIn
Control
ProcessOut ofControl
Run
Chart points donot form a parti-cular pattern andlie within theupper and lowerchart limits
Chart points form a particular pattern OR oneor more pointslie beyond theuppor or lowerchart limits
Chart points areon one side of thecenter line. The number of pointsin a run is calledthe “length of therun”
UCL 10
x 19
lcl 30
UCL 10
x 19
lcl 30
UCL 10
x 19
lcl 30
UCL 10
x 19
lcl 30
UCL 10
x 19
lcl 30
UCL 10
x 19
lcl 30
The process is stable, notchanging. Doesn’t necesarily mean to leavethe process alone. Maybe opportunities to improvethe process and enjoy substantial benefits
Alerts us that the processis changing. Doesn’t mean you need to take a corrective action. May berelate to a change you havemade. Be sureto identifythe reason\(s) before takingany constructive actions(w)
Suggest the process hasundergone a permanentchange (positive ornegative) and is nowbecoming stable. Often requires tha t you recompute the controllines for future interpre-tation efforts.
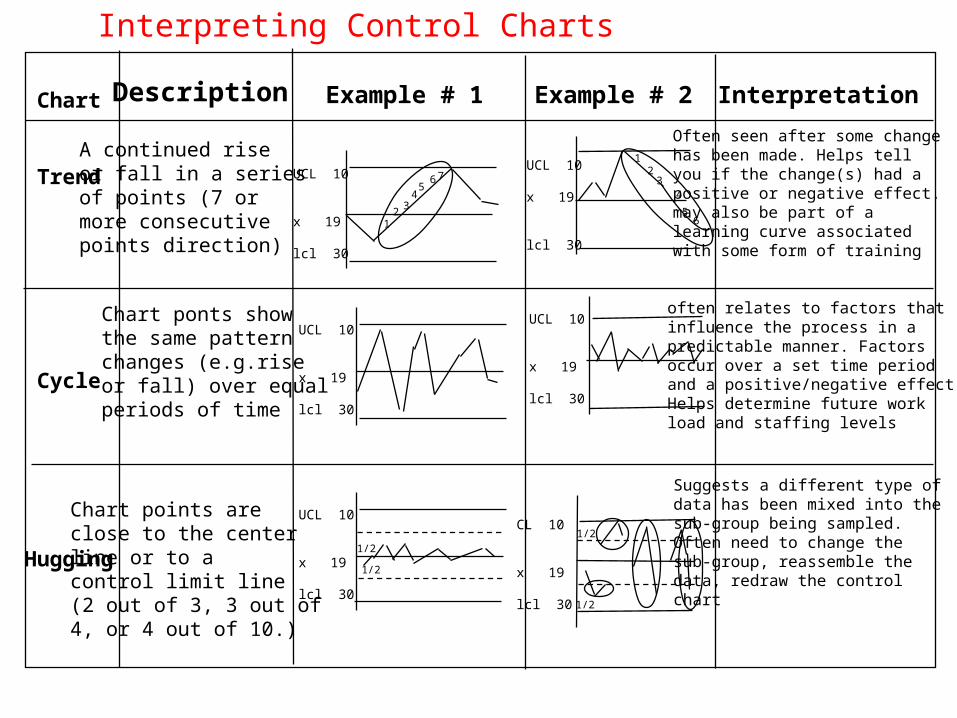
Description Example # 1 Example # 2 Interpretation
Interpreting Control Charts
Chart
Trend
Cycle
Hugging
A continued riseor fall in a seriesof points (7 ormore consecutivepoints direction)
Chart ponts showthe same patternchanges (e.g.riseor fall) over equalperiods of time
Chart points areclose to the centerline or to a control limit line(2 out of 3, 3 out of4, or 4 out of 10.)
UCL 10
x 19
lcl 30
UCL 10
x 19
lcl 30
UCL 10
x 19
lcl 30
UCL 10
x 19
lcl 30
UCL 10
x 19
lcl 30
CL 10
x 19
lcl 30
Description Example # 1 Example # 2 Interpretation
12 3
45
67
1/2
1/2
12
34
56
1/2
1/2
Often seen after some changehas been made. Helps tellyou if the change(s) had apositive or negative effect.may also be part of a learning curve associatedwith some form of training
often relates to factors thatinfluence the process in apredictable manner. Factorsoccur over a set time periodand a positive/negative effectHelps determine future workload and staffing levels
Suggests a different type ofdata has been mixed into thesub-group being sampled.Often need to change thesub-group, reassemble thedata, redraw the controlchart
Interpreting Control Charts
When to Take Corrective Action Corrective Action Should Be Taken
When Observing Points Outside the Control Limits or when a Trend Has Been Detected Eight consecutive points above the
center line (or eight below) Eight consecutive points that are
increasing (decreasing)
Out-of-Control Processes If the Control Chart Indicates an Out-of-
Control Condition (a Point Outside the Control Limits or Exhibiting Trend) Contains both common causes of variation
and assignable causes of variation The assignable causes of variation must be
identified If detrimental to quality, assignable causes of
variation must be removed If increases quality, assignable causes must be
incorporated into the process design
In-Control Process If the Control Chart is Not Indicating
Any Out-of-Control Condition, then Only common causes of variation exist It is sometimes said to be in a state of
statistical control If the common-cause variation is small,
then control chart can be used to monitor the process
If the common-cause variation is too large, the process needs to be altered

Types of Error First Type:
Belief that observed value represents special cause when, in fact, it is due to common cause
Second Type: Treating special cause variation as if
it is common cause variation

Remember Control does not mean that the
product or service will meet the needs. It only means that the process is consistent (may be consistently bad).
Capability of meeting the specification.

How to use the results By eliminating the special causes
first and then reducing the common causes, quality can be improved.

Final Steps
5. Use as a problem-solving tool
Continue to collect and plot data
Take corrective action when necessary
6. Compute process capability
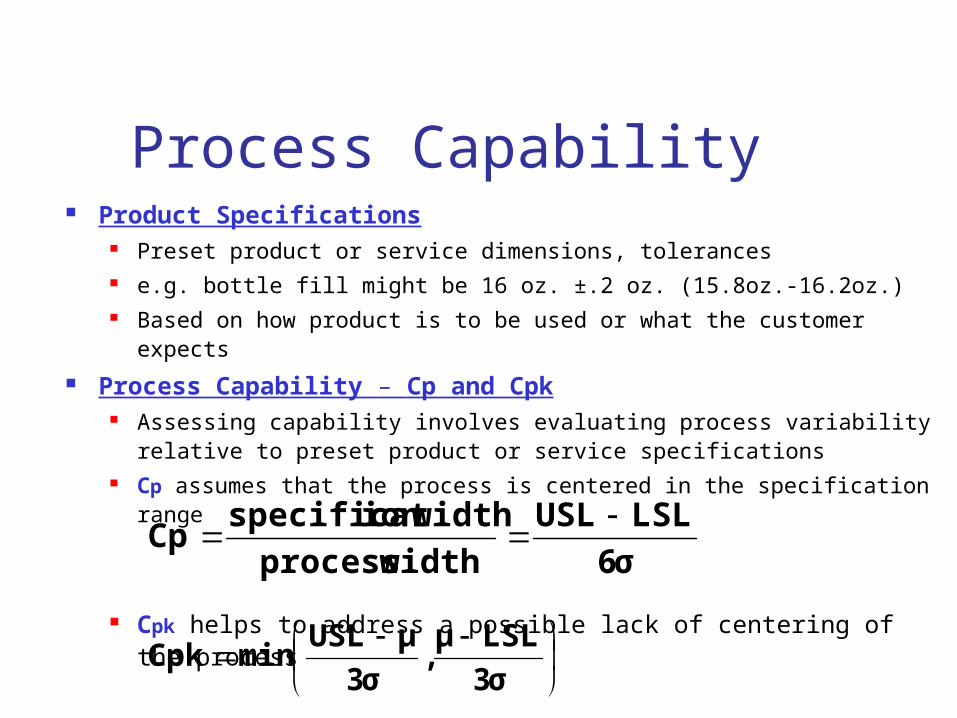
Process Capability Product Specifications
Preset product or service dimensions, tolerances e.g. bottle fill might be 16 oz. ±.2 oz. (15.8oz.-16.2oz.) Based on how product is to be used or what the customer expects
Process Capability – Cp and Cpk Assessing capability involves evaluating process variability relative
to preset product or service specifications Cp assumes that the process is centered in the specification range
Cpk helps to address a possible lack of centering of the process
6σ
LSLUSL
width process
width ionspecificatCp
3σ
LSLμ,
3σ
μUSLminCpk

Relationship between Process Variability and Specification Width
Three possible ranges for Cp
Cp = 1, as in Fig. (a), process variability just meets
specifications
Cp ≤ 1, as in Fig. (b), process not capable of producing within specifications
Cp ≥ 1, as in Fig. (c), process exceeds minimal
specifications
One shortcoming, Cp assumes that the process is centered on the specification range
Cp=Cpk when process is centered

Computing the Cp Value at Cocoa Fizz: three bottling machines are being evaluated for possible use at the Fizz plant. The machines must be capable of meeting the design specification of 15.8-16.2 oz. with at least a process capability index of 1.0 (Cp≥1)
The table below shows the information gathered from production runs on each machine. Are they all acceptable?
Solution: Machine A
Machine B
Cp=
Machine C
Cp=
Machine
σ USL-LSL
6σ
A .05 .4 .3
B .1 .4 .6
C .2 .4 1.2
1.336(.05)
.4
6σ
LSLUSLCp
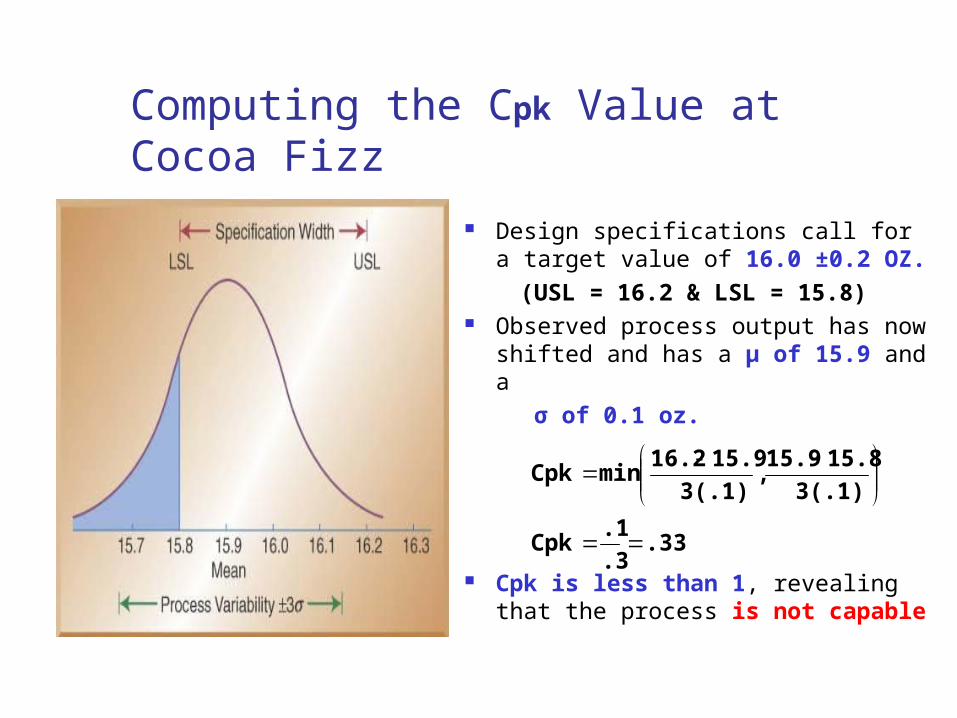
Computing the Cpk Value at Cocoa Fizz
Design specifications call for a target value of 16.0 ±0.2 OZ.
(USL = 16.2 & LSL = 15.8) Observed process output has
now shifted and has a µ of 15.9 and a
σ of 0.1 oz.
Cpk is less than 1, revealing that the process is not capable
.33.3
.1Cpk
3(.1)
15.815.9,
3(.1)
15.916.2minCpk

Target theis T
12
2 T
CC ppm
10.7171mmat centered is process assumebut above, as same :Example
2 where1
,min3
3
Tolerance
TKKCC
CCC
LTLC
UTLC
ppk
puplpk
pl
pu
Process Capability (2)
086.10868.03
7171.100.11
puC
834.00868.03
5.107171.10
plC
8977.0
868.075.107171.10
1
960.0
2
2
pmC

Capability Versus Control
Control
Capability
Capable
Not Capable
In Control Out of Control
IDEAL

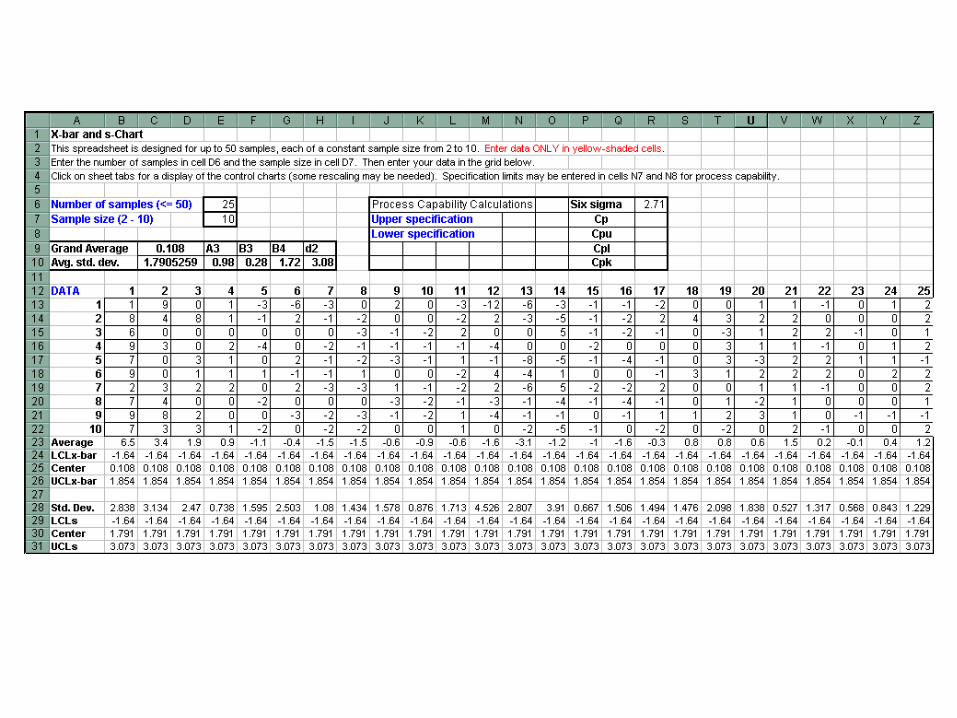
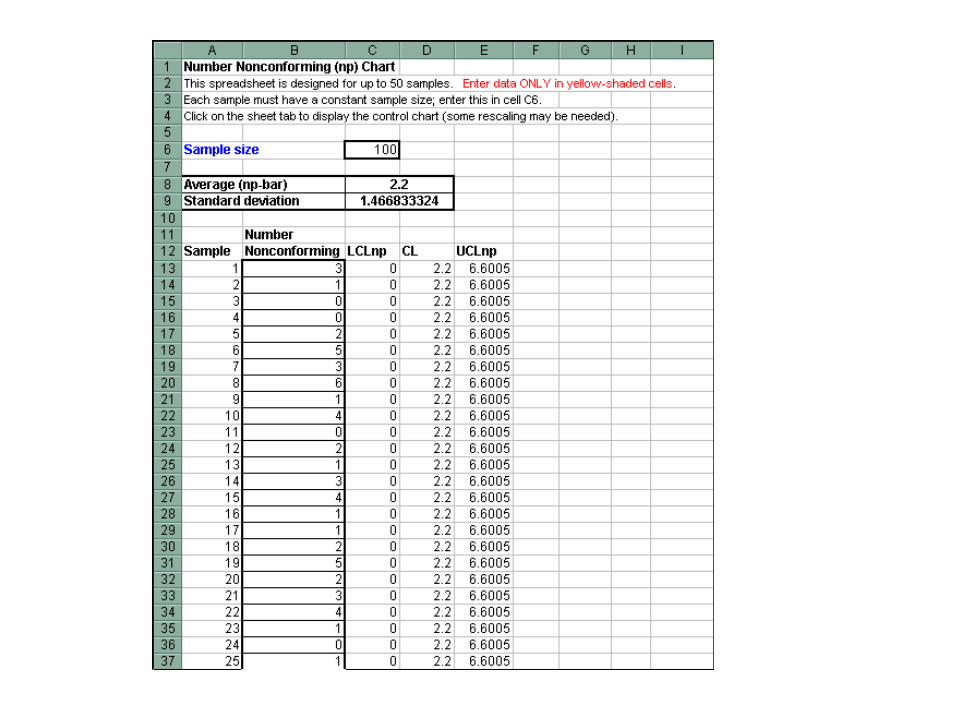
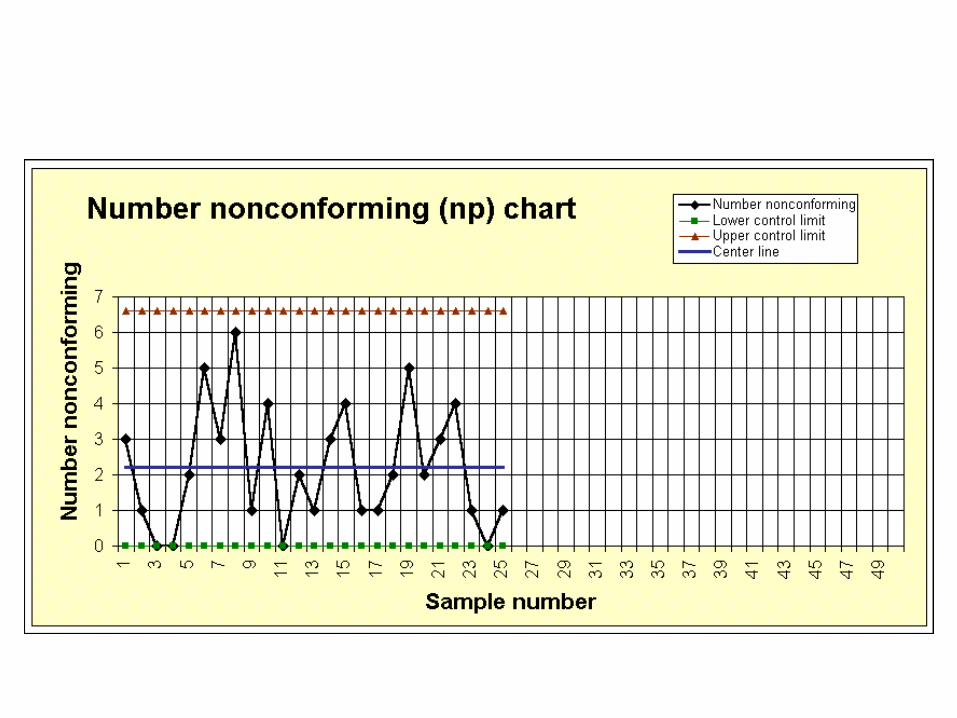
Excel Template

Special Variables Control Charts
x-bar and s charts x-chart for individuals


Charts for Attributes Fraction nonconforming (p-chart)
Fixed sample size Variable sample size
np-chart for number nonconforming
Charts for defects c-chart u-chart


p Chart Control Chart for Proportions
Is an attribute chartattribute chart Shows Proportion of Nonconforming (Success Success
) Items E.g., Count # of nonconforming chairs & divide by
total chairs inspected Chair is either conforming or nonconforming
Used with Equal or Unequal Sample Sizes Over Time Unequal sizes should not differ by more than
±25% from average sample size

p Chart Control Limits
(1 )max 0, 3p
p pLCL p
n
(1 )3p
p pUCL p
n
1
k
ii
nn
k
Average Group Size
1
1
k
iik
ii
Xp
n
Average Proportion of Nonconforming Items
# Defective Items in Sample i
Size of Sample i
# of Samples

p Chart Example
You’re manager of a 500-room hotel. You want to achieve the highest level of service. For 7 days, you collect data on the readiness of 200 rooms. Is the process in control?
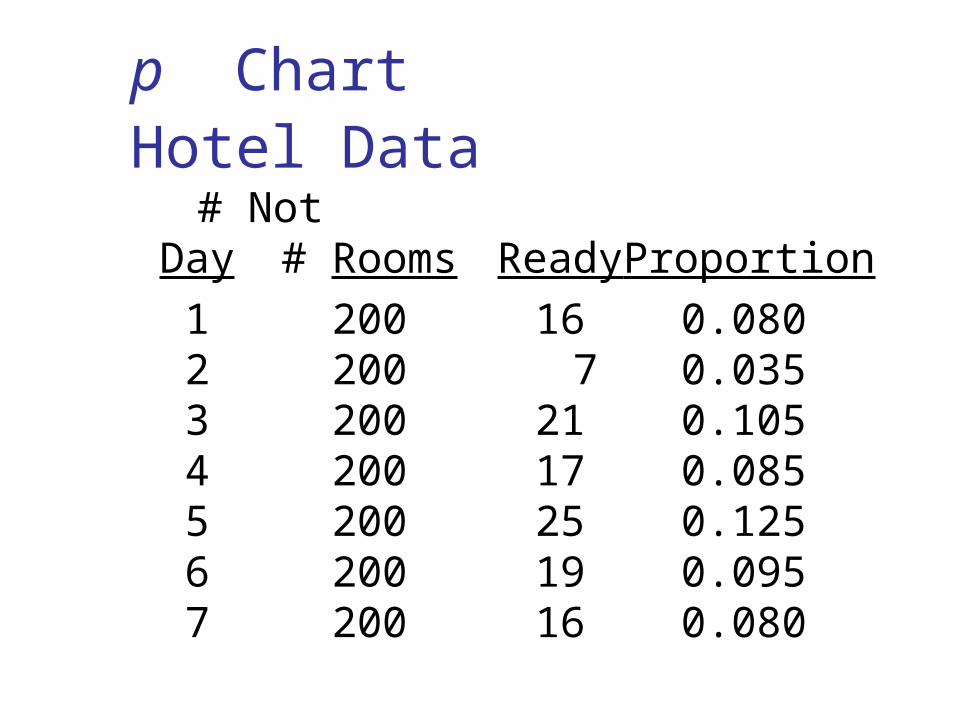
p Chart Hotel Data
# NotDay # Rooms Ready Proportion
1 200 16 0.0802 200 7 0.0353 200 21 0.1054 200 17 0.0855 200 25 0.1256 200 19 0.0957 200 16 0.080

1
1
121.0864
1400
k
iik
ii
Xp
n
p Chart Control Limits Solution
16 + 7 +...+ 16
1 1400200
7
k
ii
nn
k
1 .0864 1 .08643 .0864 3
200
.0864 .0596 or .0268,.1460
p pp
n

Mean
p Chart Control Chart Solution
UCL
LCL
0.00
0.05
0.10
0.15
1 2 3 4 5 6 7
P
Day
Individual points are distributed around without any pattern. Any improvement in the process must come from reduction of common-cause variation, which is the responsibility of the management.
p
p
p Chart in PHStat PHStat | Control Charts | p Chart …
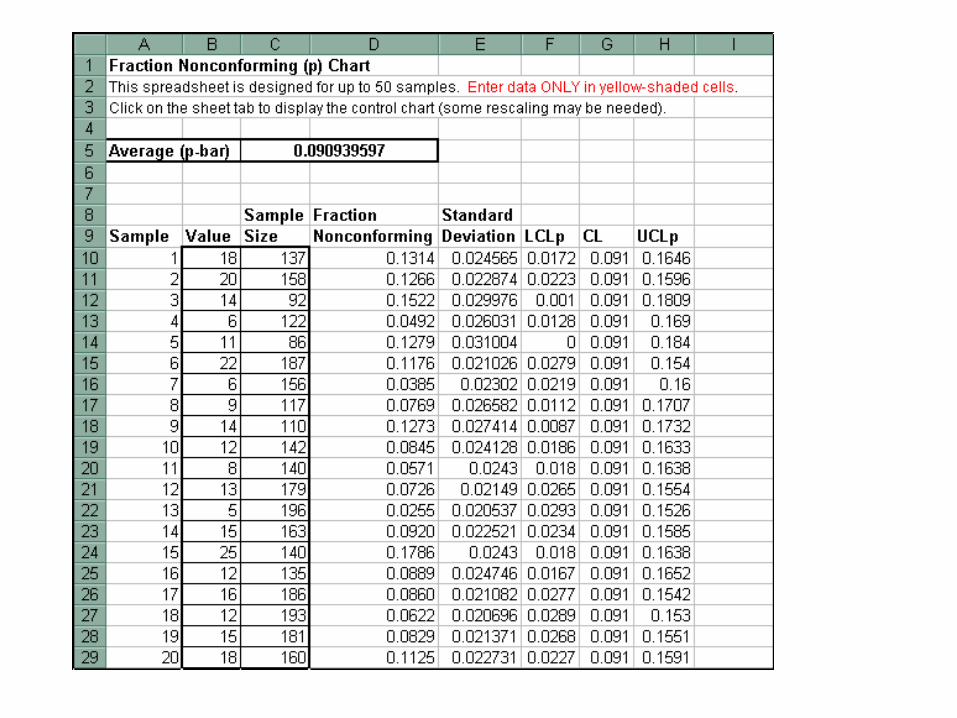
Excel Spreadsheet for the Hotel Room Example
Microsoft Excel Worksheet

Worker Day 1 Day 2 Day 3 All Days
A 9 (18%) 11 (12%) 6 (12%) 26 (17.33%)
B 12 (24%) 12 (24%) 8 (16%) 32 (21.33%)
C 13 (26%) 6 (12%) 12 (24%) 31(20.67%)
D 7 (14%) 9 (18%) 8 (16%) 24 (16.0%)
Totals 41 38 34 113
Understanding Process Variability:Red Bead Example
Four workers (A, B, C, D) spend 3 days to collect beads, at 50 beads per day. The expected number of red beads to be collected per day per worker is 10 or 20%.

Average Day 1 Day 2 Day 3 All Days
X 10.25 9.5 8.5 9.42
p 20.5% 19% 17% 18.83%
Understanding Process Variability:Example Calculations
113.1883
50(12)p
(1 ) .1883(1 .1883)3 .1883 3
50 .1883 .1659
p pp
n
_
.1883 .1659 .0224
.1883 +.1659 .3542
LCL
UCL

0 A1 B1 C1 D1 A2 B2 C2 D2 A3 B3 C3 D3
Understanding Process Variability:Example Control Chart
.30
.20
.10
p
UCL
LCL
_

Morals of the Example
Variation is an inherent part of any process. The system is primarily responsible for worker performance. Only management can change the system. Some workers will always be above average, and some will be below.
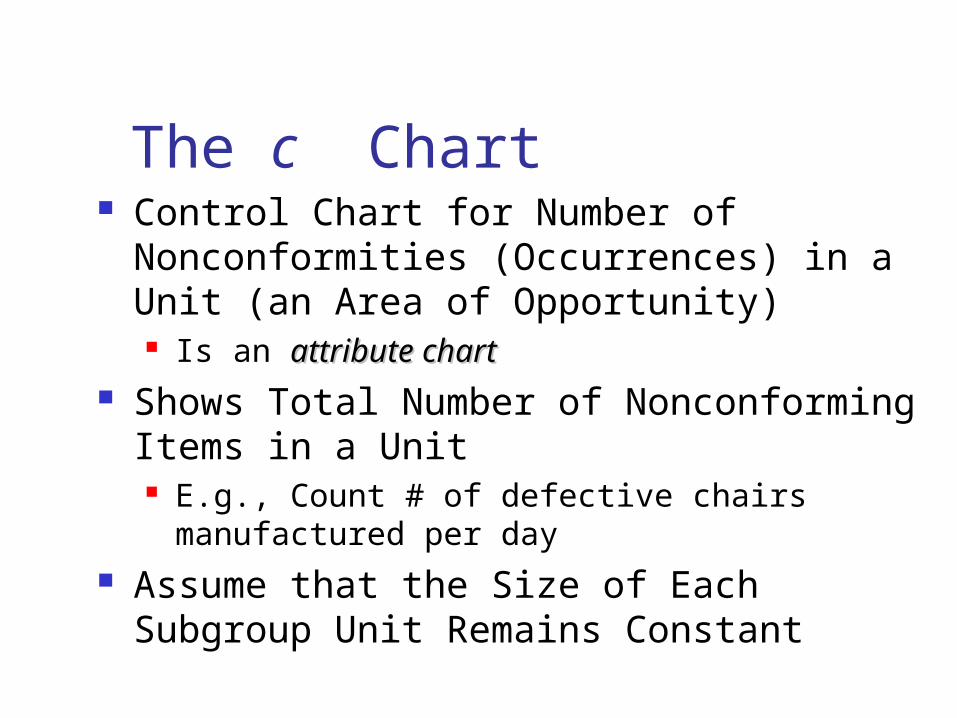
The c Chart Control Chart for Number of
Nonconformities (Occurrences) in a Unit (an Area of Opportunity) Is an attribute chartattribute chart
Shows Total Number of Nonconforming Items in a Unit E.g., Count # of defective chairs
manufactured per day Assume that the Size of Each Subgroup
Unit Remains Constant

c Chart Control Limits
3cLCL c c 3cUCL c c
1
k
ii
cc
k
Average Number of Occurrences
# of Samples
# of Occurrences in Sample i
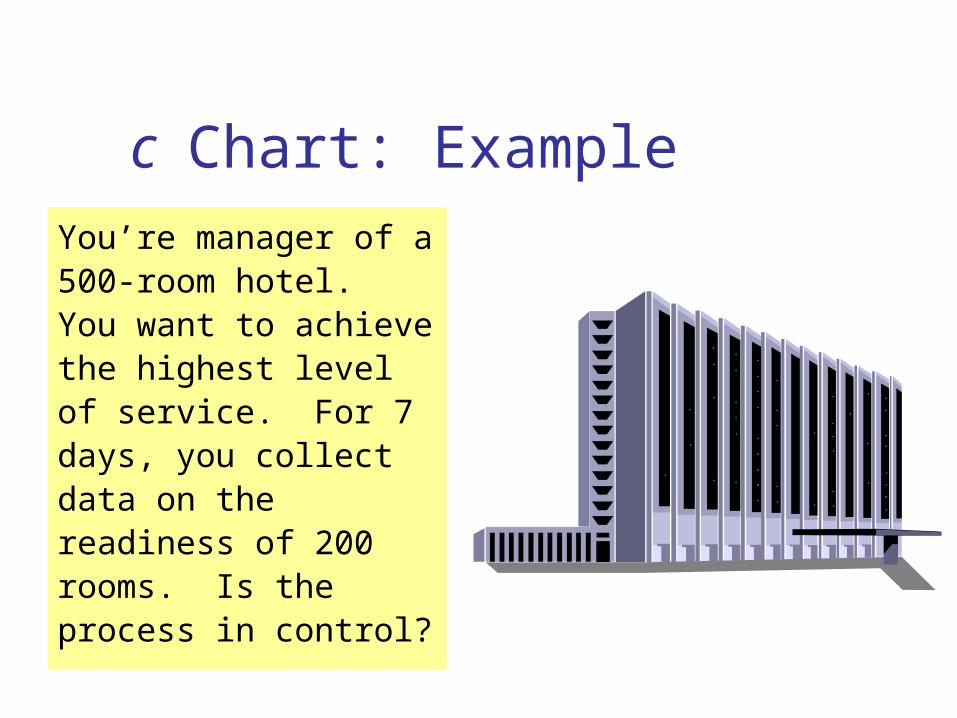
c Chart: Example
You’re manager of a 500-room hotel. You want to achieve the highest level of service. For 7 days, you collect data on the readiness of 200 rooms. Is the process in control?

c Chart: Hotel Data# Not
Day # Rooms Ready1 200 162 200 73 200 214 200 175 200 256 200 197 200 16

c Chart: Control Limits Solution
1 16 7 19 1617.286
7
3 17.286 3 17.285 4.813
3 29.759
k
ii
c
c
cc
k
LCL c c
UCL c c
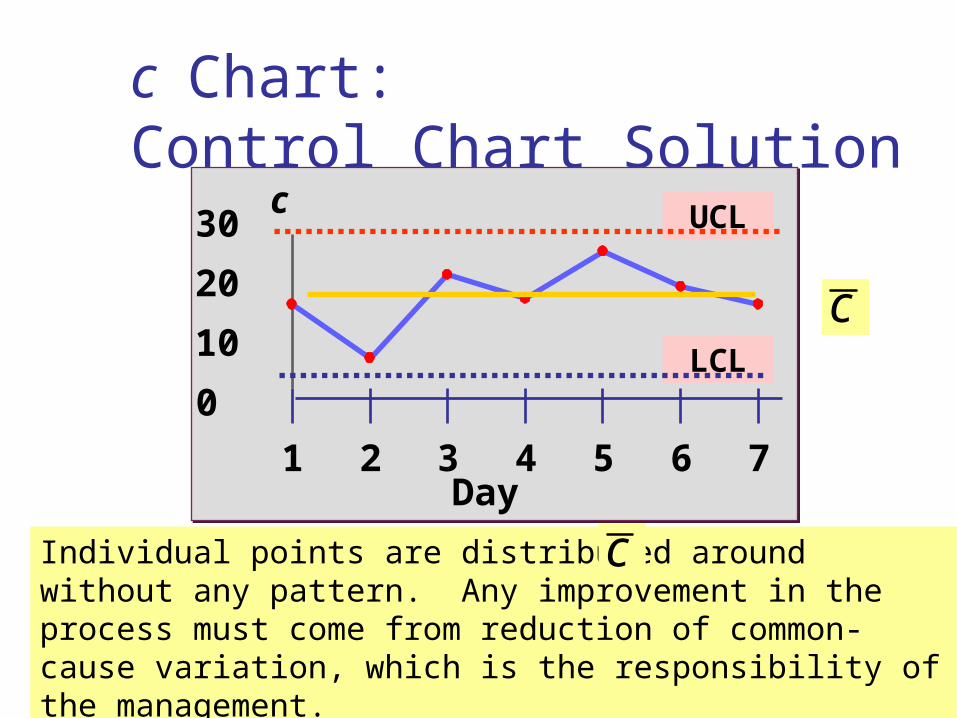
c Chart: Control Chart Solution
UCL
LCL0
10
20
30
1 2 3 4 5 6 7
c
Day
c
Individual points are distributed around without any pattern. Any improvement in the process must come from reduction of common-cause variation, which is the responsibility of the management.
c
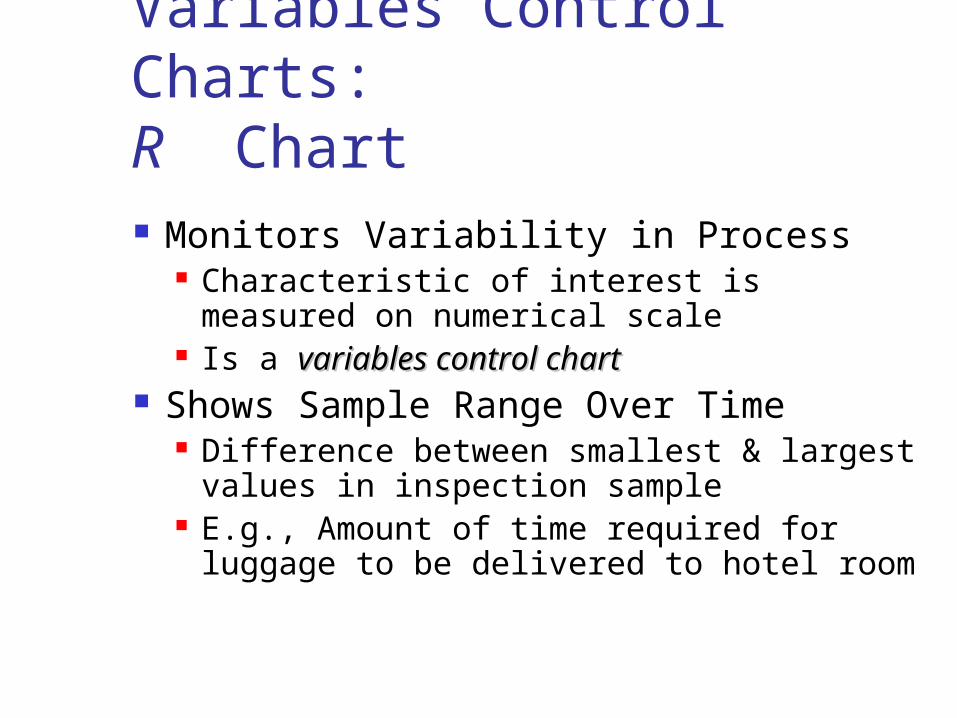
Variables Control Charts: R Chart Monitors Variability in Process
Characteristic of interest is measured on numerical scale
Is a variables control chartvariables control chart Shows Sample Range Over Time
Difference between smallest & largest values in inspection sample
E.g., Amount of time required for luggage to be delivered to hotel room
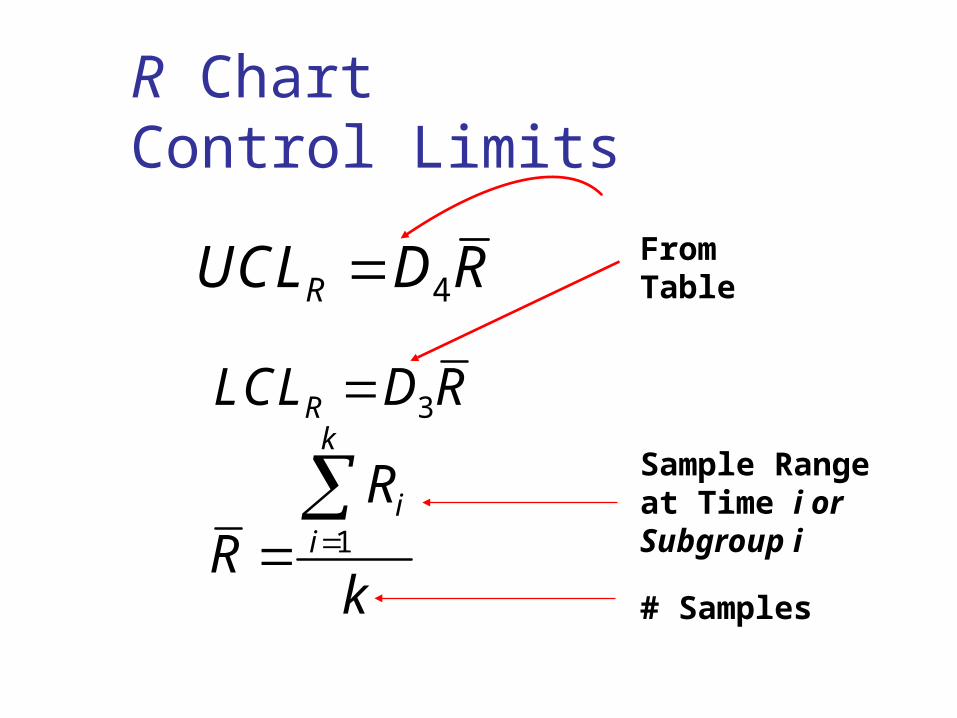
R Chart Control Limits
Sample Range at Time i or Subgroup i
# Samples
From Table4RUCL D R
3RLCL D R
1
k
ii
RR
k
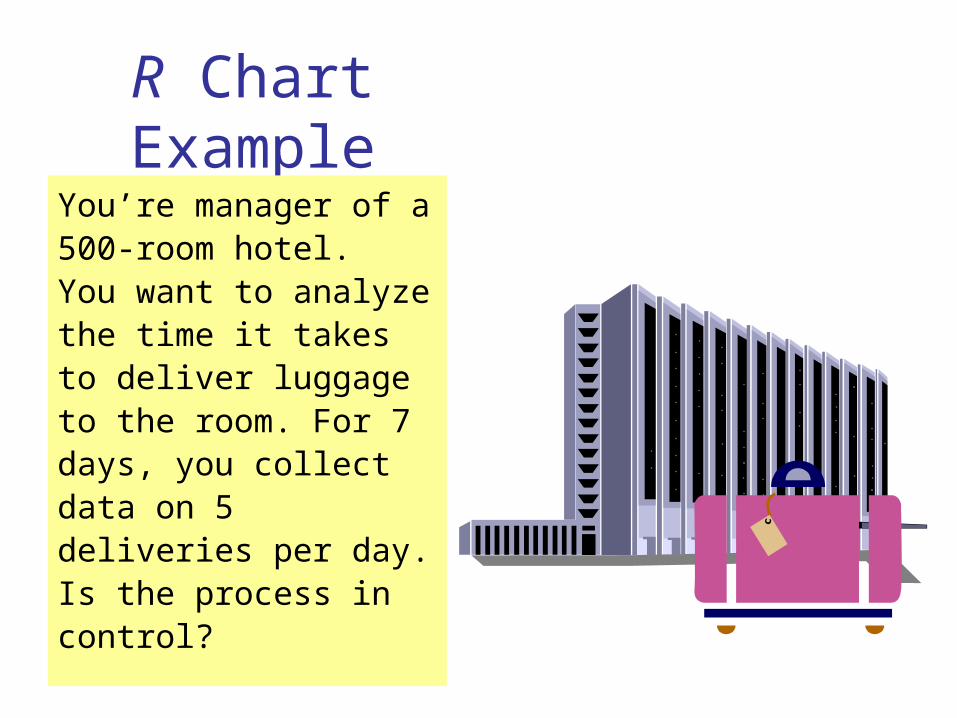
R Chart Example
You’re manager of a 500-room hotel. You want to analyze the time it takes to deliver luggage to the room. For 7 days, you collect data on 5 deliveries per day. Is the process in control?

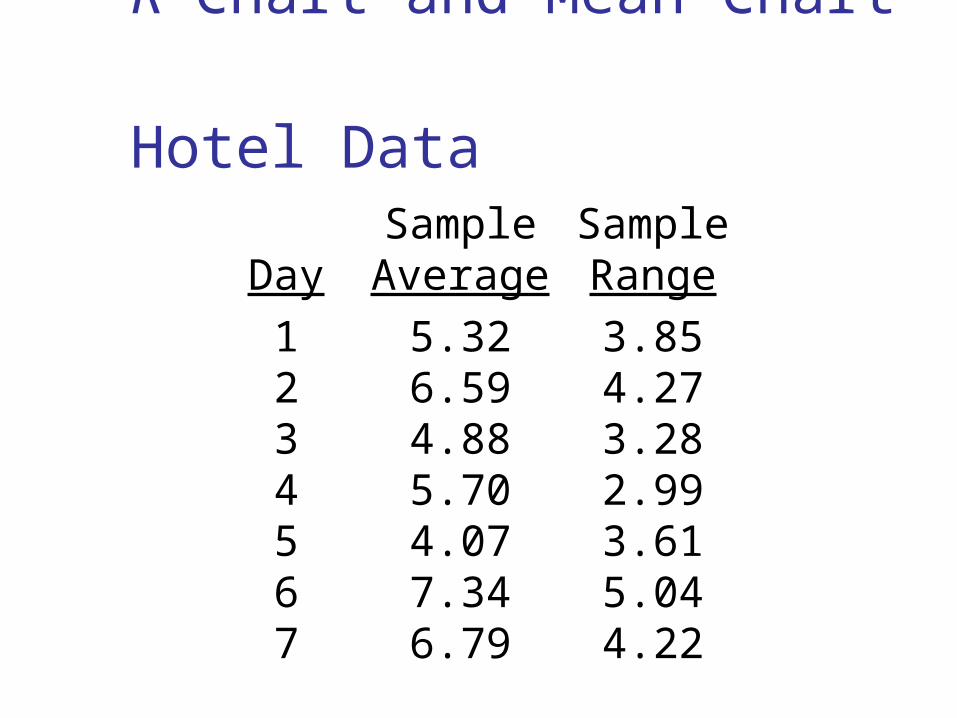
R Chart and Mean Chart Hotel Data
Sample SampleDay Average Range
1 5.32 3.852 6.59 4.273 4.88 3.284 5.70 2.995 4.07 3.616 7.34 5.047 6.79 4.22

R Chart Control Limits Solution
From Table (n = 5)
1 3.85 4.27 4.223.894
7
k
ii
RR
k
4
3
2.114 3.894 8.232
0 3.894 0
R
R
UCL D R
LCL D R

R Chart Control Chart Solution
UCL
02468
1 2 3 4 5 6 7
Minutes
Day
LCL
R_

Variables Control Charts: Mean Chart (The Chart) Shows Sample Means Over Time
Compute mean of inspection sample over time
E.g., Average luggage delivery time in hotel
Monitors Process Average Must be preceded by examination of
the R chart to make sure that the process is in control
X
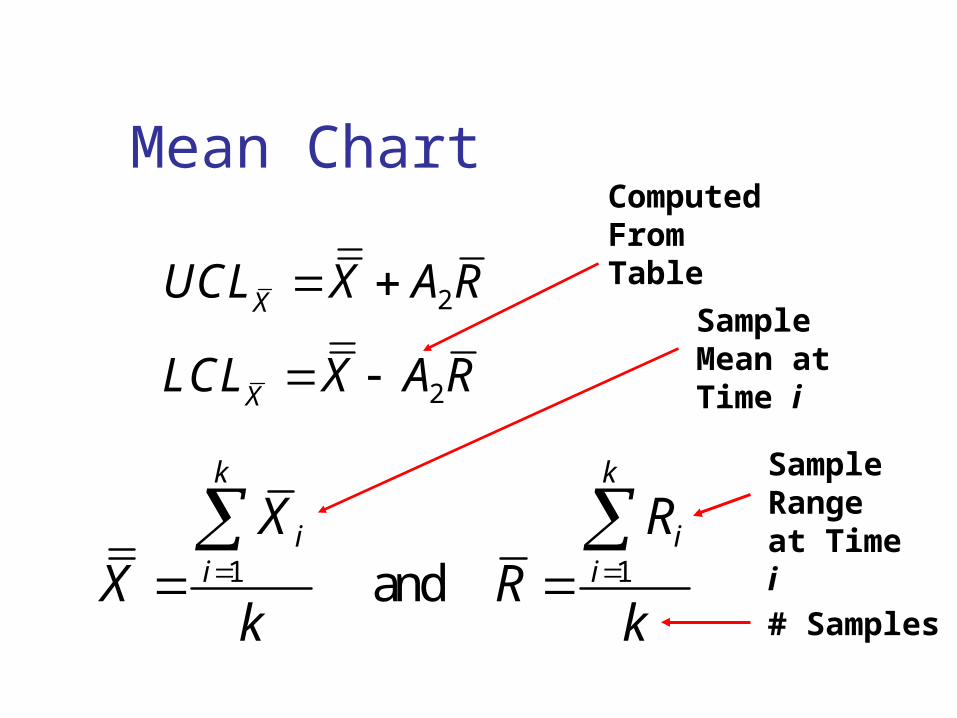
Mean Chart
Sample Range at Time i
# Samples
Sample Mean at Time i
Computed From Table
2XUCL X A R
2XLCL X A R
1 1 and
k k
i ii i
X RX R
k k

Mean Chart ExampleYou’re manager of a 500-room hotel. You want to analyze the time it takes to deliver luggage to the room. For 7 days, you collect data on 5 deliveries per day. Is the process in control?
R Chart and Mean Chart Hotel Data
Sample SampleDay Average Range
1 5.32 3.852 6.59 4.273 4.88 3.284 5.70 2.995 4.07 3.616 7.34 5.047 6.79 4.22

Mean Chart Control Limits Solution
1
1
2
2
5.32 6.59 6.795.813
7
3.85 4.27 4.223.894
7
5.813 0.577 3.894 8.060
5.813 0.577 3.894 3.566
k
i
i
k
ii
X
X
XX
k
RR
k
UCL X A R
LCL X A R
From Table E.9 (n = 5)
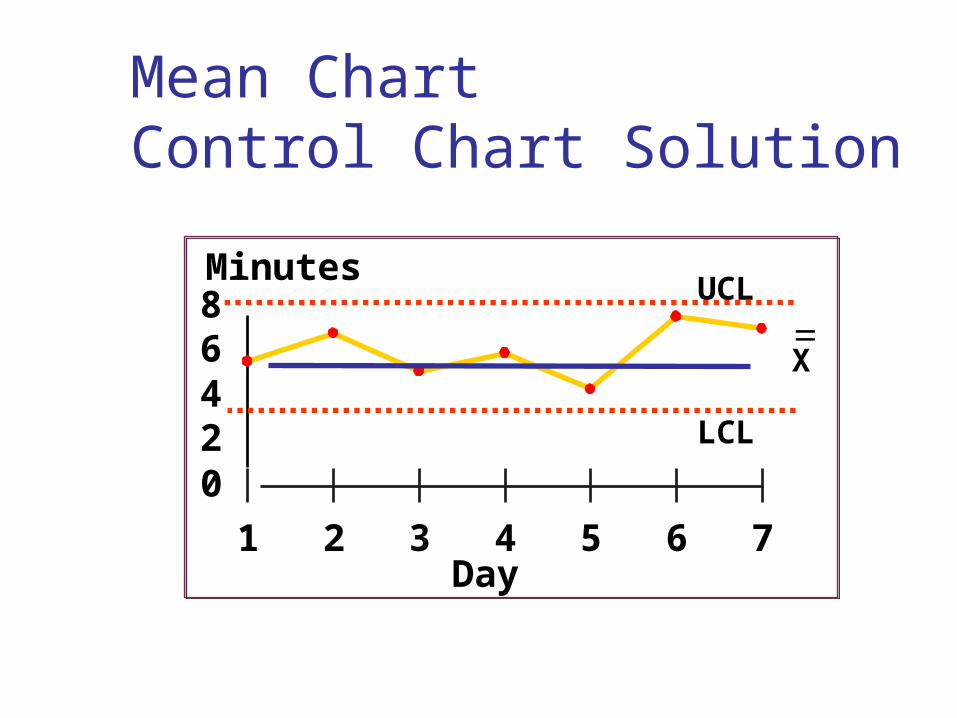
Mean Chart Control Chart Solution
UCL
LCL
02468
1 2 3 4 5 6 7
Minutes
Day
X__
R Chart and Mean Chartin PHStat PHStat | Control Charts | R & Xbar
Charts …
Excel Spreadsheet for the Hotel Room Example
Microsoft Excel Worksheet
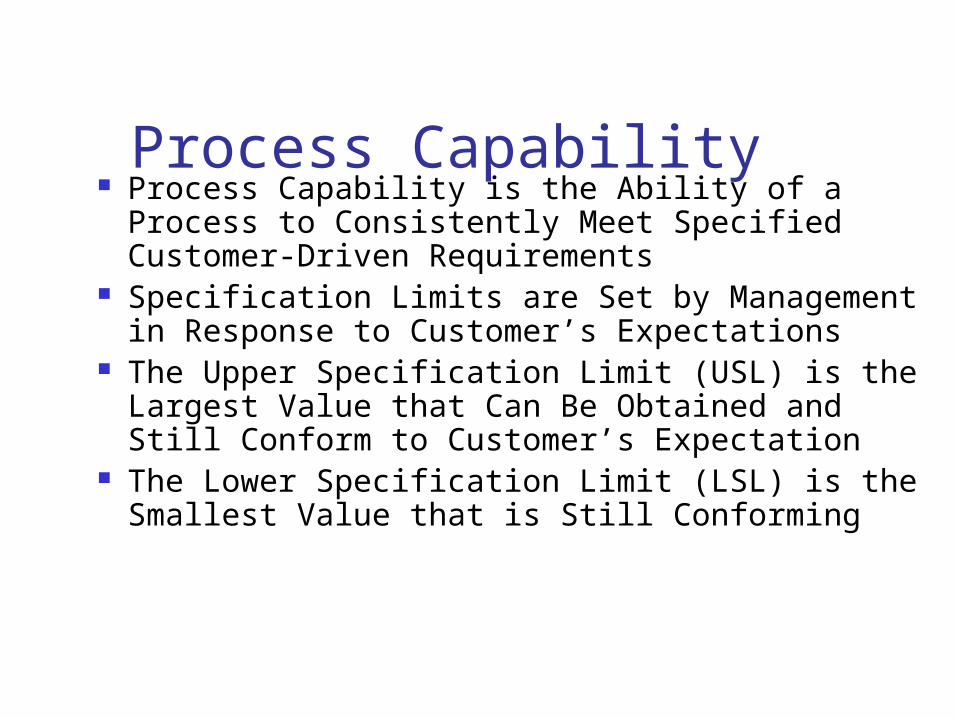
Process Capability Process Capability is the Ability of a
Process to Consistently Meet Specified Customer-Driven Requirements
Specification Limits are Set by Management in Response to Customer’s Expectations
The Upper Specification Limit (USL) is the Largest Value that Can Be Obtained and Still Conform to Customer’s Expectation
The Lower Specification Limit (LSL) is the Smallest Value that is Still Conforming
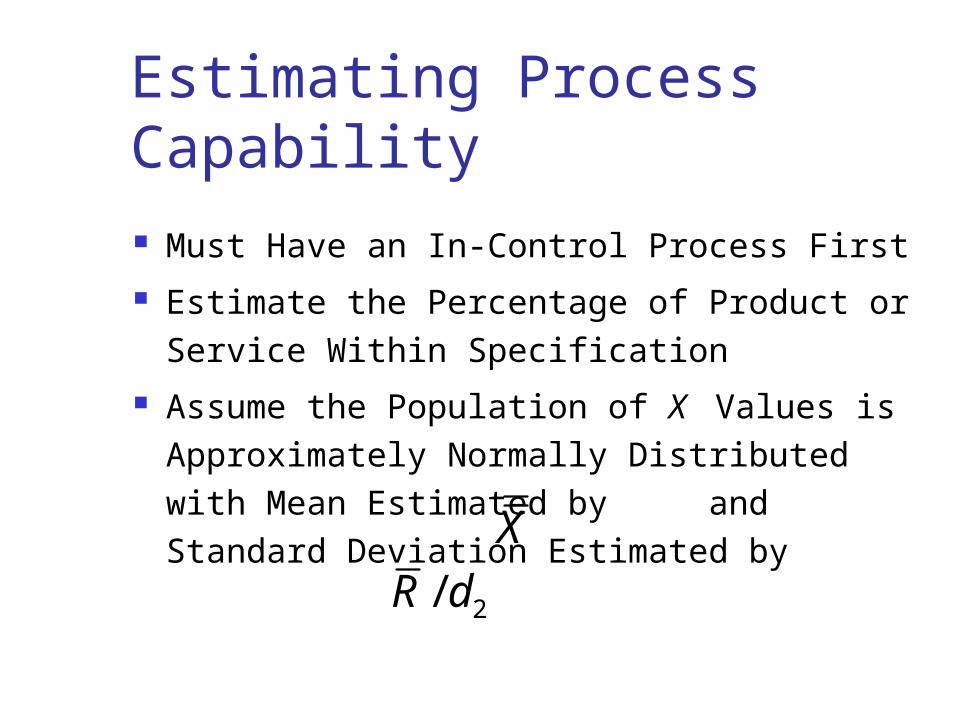
Estimating Process Capability Must Have an In-Control Process First Estimate the Percentage of Product or
Service Within Specification Assume the Population of X Values is
Approximately Normally Distributed with Mean Estimated by and Standard Deviation Estimated by
X
2/R d
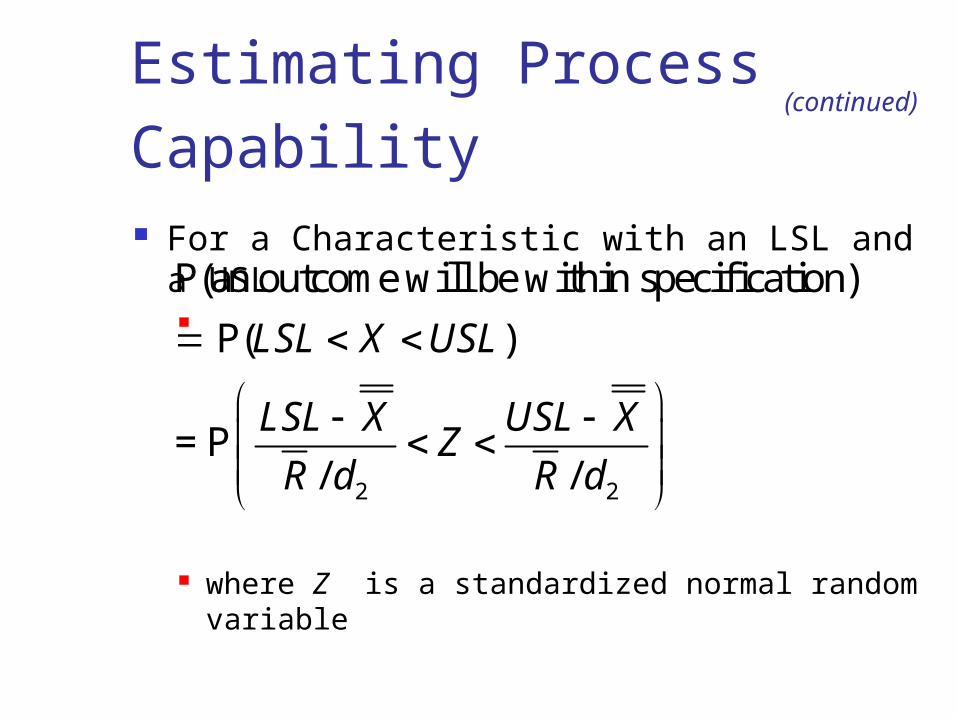
Estimating Process Capability For a Characteristic with an LSL and a
USL
where Z is a standardized normal random variable
(continued)
2 2
P(an outcome will be within specification)
P( )
= P/ /
LSL X USL
LSL X USL XZ
R d R d
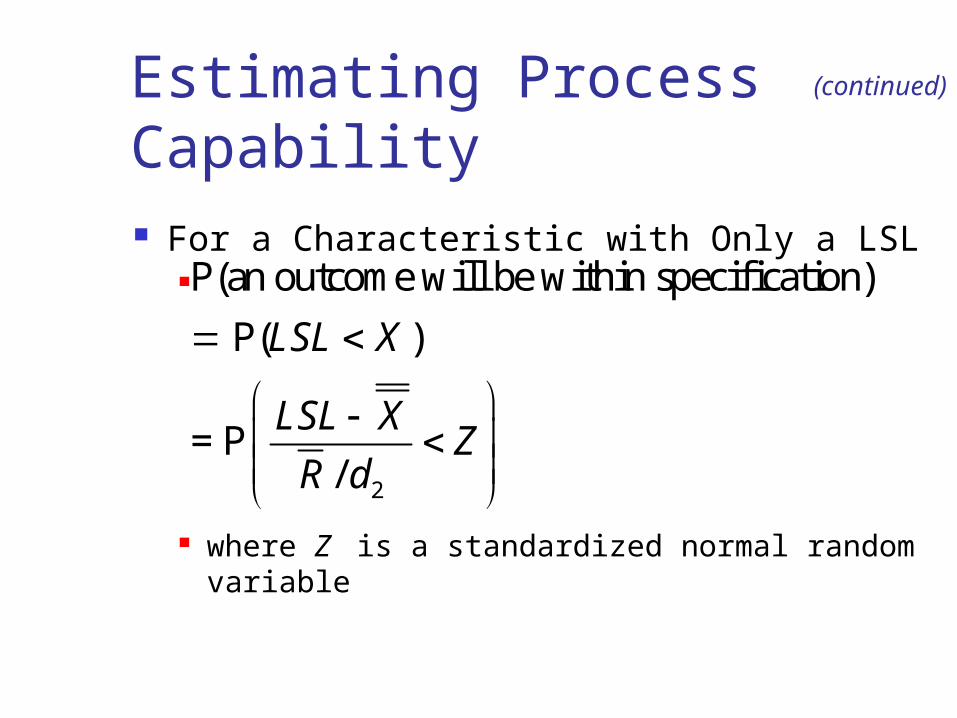
Estimating Process Capability For a Characteristic with Only a LSL
where Z is a standardized normal random variable
(continued)
2
P(an outcome will be within specification)
P( )
= P/
LSL X
LSL XZ
R d
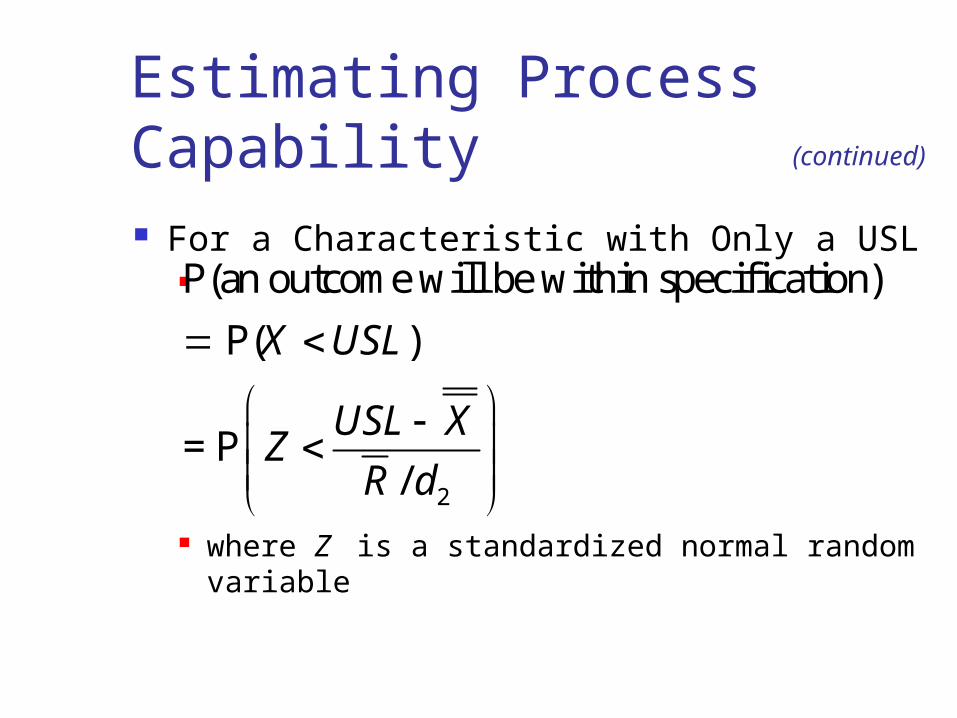
Estimating Process Capability For a Characteristic with Only a USL
where Z is a standardized normal random variable
(continued)
2
P(an outcome will be within specification)
P( )
= P/
X USL
USL XZ
R d
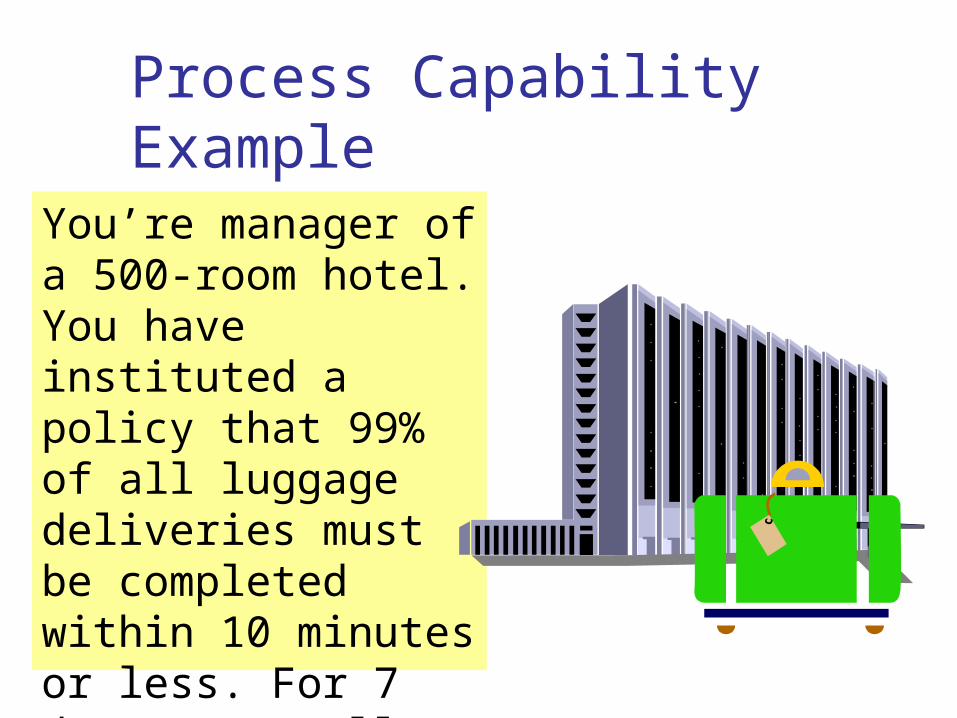
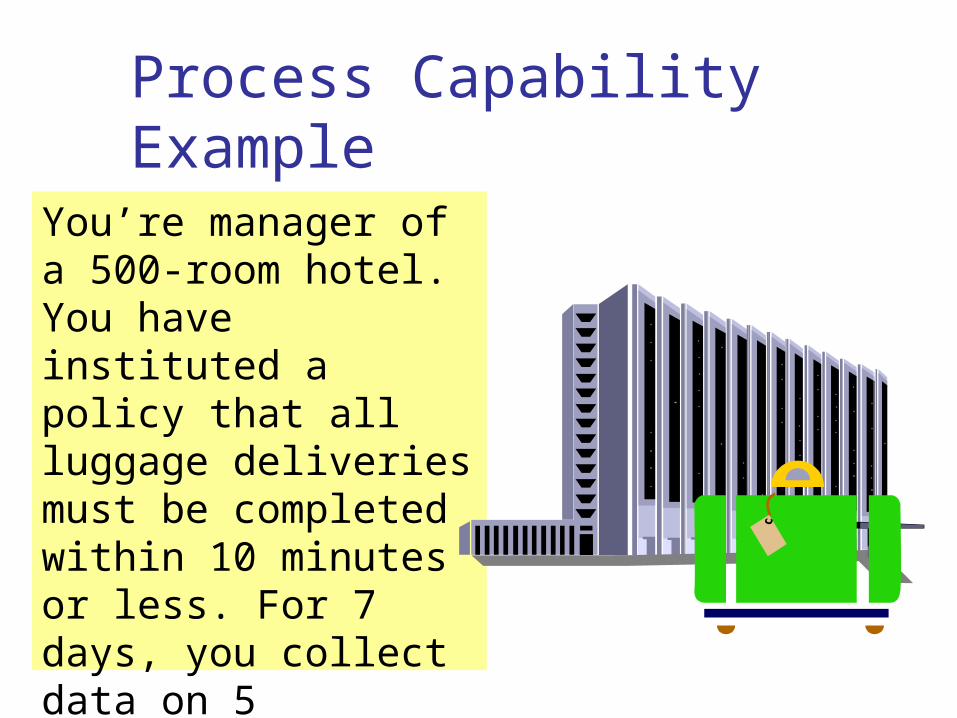
You’re manager of a 500-room hotel. You have instituted a policy that 99% of all luggage deliveries must be completed within 10 minutes or less. For 7 days, you collect dataon 5 deliveries per day. Is the process capable?
Process Capability Example

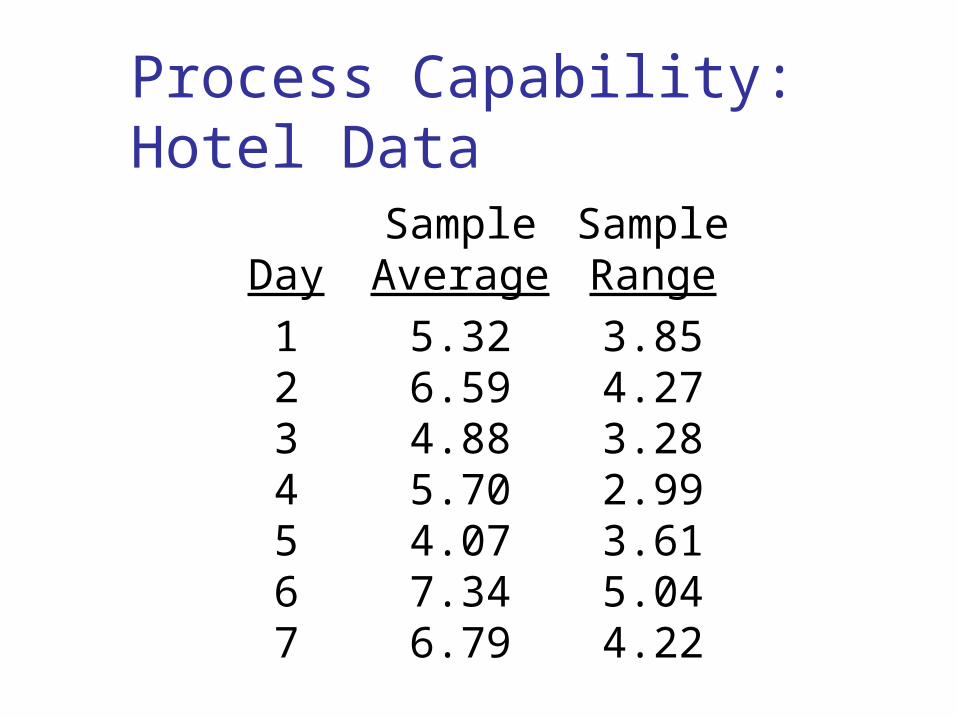
Process Capability:Hotel Data
Sample SampleDay Average Range
1 5.32 3.852 6.59 4.273 4.88 3.284 5.70 2.995 4.07 3.616 7.34 5.047 6.79 4.22
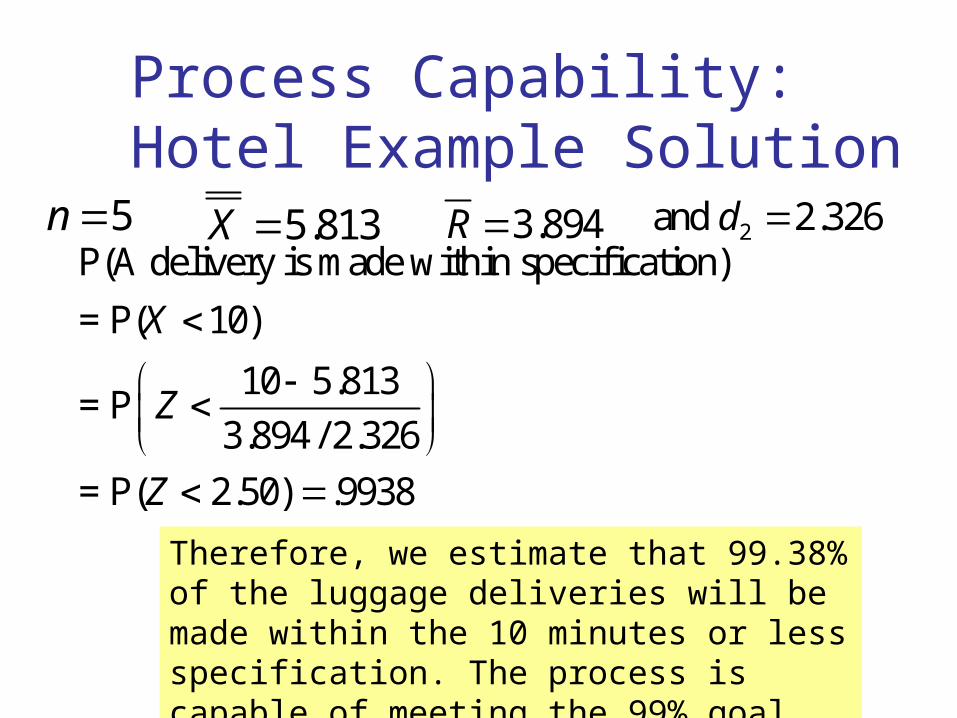
Process Capability:Hotel Example Solution
5.813X 3.894R 2and 2.326d P(A delivery is made within specification)
= P( 10)
10 5.813= P
3.894 / 2.326
= P( 2.50) .9938
X
Z
Z
5n
Therefore, we estimate that 99.38% of the luggage deliveries will be made within the 10 minutes or less specification. The process is capable of meeting the 99% goal.

Capability Indices Aggregate Measures of a Process’ Ability
to Meet Specification Limits The larger (>1) the values, the more capable
a process is of meeting requirements Measure of Process Potential Performance
Cp>1 implies that a process has the potential of having more than 99.73% of outcomes within specifications
2
specification spread
process spread6 /p
USL LSLC
R d

Capability Indices Measures of Actual Process Performance
For one-sided specification limits
CPL (CPU) >1 implies that the process mean is more than 3 standard deviations away from the lower (upper) specification limit
(continued)
23 /
X LSLCPL
R d
23 /
USL XCPU
R d
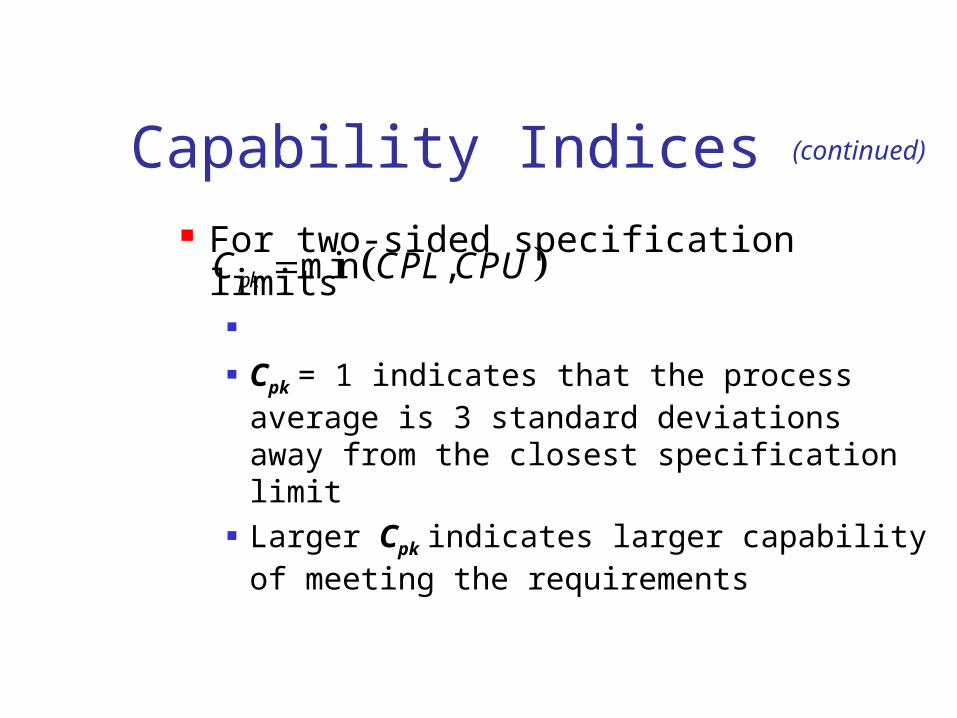
Capability Indices For two-sided specification limits
Cpk = 1 indicates that the process average
is 3 standard deviations away from the closest specification limit
Larger Cpk indicates larger capability of meeting the requirements
(continued)
min ,pkC CPL CPU
You’re manager of a 500-room hotel. You have instituted a policy that all luggage deliveries must be completed within 10 minutes or less. For 7 days, you collect data on 5 deliveries per day. Compute an appropriate capability index for the delivery process.
Process Capability Example
Process Capability:Hotel Data
Sample SampleDay Average Range
1 5.32 3.852 6.59 4.273 4.88 3.284 5.70 2.995 4.07 3.616 7.34 5.047 6.79 4.22

Process Capability:Hotel Example Solution
5.813X 3.894R 2and 2.326d 5n
Since there is only the upper specification limit, we need to only compute CPU. The capability index for the luggage delivery process is .8337, which is less than 1. The upper specification limit is less than 3 standard deviations above the mean.
2
10 5.8130.833672
3 3.894 / 2.3263 /
USL XCPU
R d