National Prescribing Indicators 2017–2018 - AWMSG Prescribing Indicators... · There has been...
51
National Prescribing Indicators 2017–2018 Analysis of Prescribing Data to September 2017
Transcript of National Prescribing Indicators 2017–2018 - AWMSG Prescribing Indicators... · There has been...

National Prescribing Indicators 2017–2018 Analysis of Prescribing Data to September 2017

This report has been prepared by the Welsh Analytical Prescribing Support Unit (WAPSU), part of the All Wales Therapeutics and Toxicology Centre (AWTTC).
Please direct any queries to AWTTC:
All Wales Therapeutics and Toxicology Centre (AWTTC) University Hospital Llandough Penlan Road Llandough Vale of Glamorgan CF64 2XX
[email protected] 029 2071 6900

National Prescribing Indicators 2017–2018. Analysis of Prescribing Data to September 2017
Page 1 of 49
EXECUTIVE SUMMARY The All Wales Medicines Strategy Group (AWMSG) has endorsed the National Prescribing Indicators (NPIs) as a means of promoting safe and cost-effective prescribing since 2003. Background information supporting the choice of NPIs is detailed in the document National Prescribing Indicators 2017–2018. This report contains data relating to the primary and secondary care NPIs for the second quarter of 2017–2018. Unit of measure and threshold for each NPI is also included in Appendix 1 and primary care NPI prescribing data for GP clusters is presented in Appendix 2. PRIMARY CARE For 2017–2018, there are 14 primary care NPIs focusing on seven areas of prescribing and the reporting of adverse events (Yellow Cards). Four of the indicators – high strength inhaled corticosteroids (ICS), opioid patches, anticholinergic burden, and non-steroidal anti-inflammatory drugs (NSAIDs) and chronic kidney disease (CKD) – are new for 2017–2018. A threshold level of prescribing/reporting is set for 11 of the 14 NPIs based upon quarter three data for 2016–2017. The threshold for the NSAIDs and CKD NPI has been based upon quarter one data for 2017–2018, due to the unavailability of historical data. • Of the 12 NPIs with a threshold, there was an overall improvement (in line with the aim of each indicator) across Wales in 11 NPIs,
compared with the equivalent quarter of the previous year (quarter ending September 2016), or quarter one 2017–2018 for NSAIDs and CKD. The NPI that did not show an improvement was gabapentin and pregabalin, where prescribing increased in all health boards (8.11% national increase).
• At a national level, the NPIs associated with the largest improvements were: – Yellow Card reporting by GPs increased by 61% compared with the equivalent quarter of the previous year, and Yellow
Card reporting for all health board reporters increased by 42%. – Number of patients on the CKD register (CKD stage 3–5) who have received a repeat prescription for an NSAID within
the last 3 months, as a percentage of all patients on the CKD register (32.5% reduction, September quarter 2017 compared with June quarter 2017)
– Number of patients not on the CKD register but have an eGFR of < 59 ml/min, and have received a repeat prescription for an NSAID within the last 3 months, as a percentage of all patients who are not on the CKD register but have an eGFR of < 59 ml/min (28.7% reduction, September quarter 2017 compared with June quarter 2017).
– NSAIDs ADQs per 1,000 STAR-PUs (11.2% reduction, September quarter 2017 compared with the equivalent quarter of the previous year)
– Cephalosporin items per 1,000 patients (8.77% reduction, September quarter 2017 compared with the equivalent quarter of the previous year)

Welsh Analytical Prescribing Support Unit
Page 2 of 49
– Hypnotics and anxiolytics ADQs per 1,000 STAR-PUs (8.52% reduction, September quarter 2017 compared with the equivalent quarter of the previous year)
– Tramadol DDDs per 1,000 patients (8.15% reduction, September quarter 2017 compared with the equivalent quarter of the previous year).
• In line with the aim of the indicator, high strength ICS prescribing decreased in all of the health boards compared with the equivalent quarter of the previous year. The largest decrease was seen in Aneurin Bevan UHB (12.1% reduction).
• Prescribing of tramadol decreased in all of the health boards compared with the equivalent quarter of the previous year (in line with the aim of the NPI). The largest decrease of 10.2% was seen in Abertawe Bro Morgannwg UHB.
SECONDARY CARE For 2017–2018, there are three secondary care NPIs focusing on three areas of prescribing:
– Insulin prescribing – Prescribing of biosimilars – Antibiotic surgical prophylaxis
For two of the NPIs (insulin prescribing and biosimilars), primary care data are also provided to facilitate a more comprehensive analysis.
• Prescribing of long-acting insulin analogues decreased in secondary care compared with the equivalent quarter of the previous year,
in line with the aim of the NPI; there was also a decrease in primary care usage.
• Prescribing of biosimilar infliximab, etanercept, rituximab and insulin glargine all increased when compared with the equivalent quarter of the previous year, in line with the aim of the NPI.
• Data for duration of colorectal surgical antibiotic prophylaxis indicate that there has been no change in the percentage of patients in Wales receiving prophylaxis for greater than 24 hours compared with the equivalent quarter of the previous year.
The 2017–2018 NPI report for quarter ending December 2017 will be available on 16th April 2018.

National Prescribing Indicators 2017–2018. Analysis of Prescribing Data to September 2017
Page 3 of 49
CONTENTS PRACTICES ACHIEVING INDICATOR THRESHOLDS FOR PRIMARY CARE NPIS .................................................................................5
PRIMARY CARE ..........................................................................................................................................................................................6
1.0 PROTON PUMP INHIBITORS ............................................................................................................................................................6
2.0 INHALED CORTICOSTEROIDS .........................................................................................................................................................7
3.0 HYPNOTICS AND ANXIOLYTICS ......................................................................................................................................................8
4.0 ANALGESICS .....................................................................................................................................................................................9
4.1 Tramadol .........................................................................................................................................................................................9
4.2 Opioid patches .............................................................................................................................................................................. 10
4.3 Gabapentin and pregabalin ........................................................................................................................................................... 11
5.0 ANTIBIOTICS ................................................................................................................................................................................... 12
5.1 Total antibacterial items ................................................................................................................................................................. 12
5.2 Co-amoxiclav, cephalosporins and fluoroquinolones ..................................................................................................................... 13
6.0 ANTICHOLINERGIC BURDEN ......................................................................................................................................................... 17
7.0 NON-STEROIDAL ANTI-INFLAMMATORY DRUGS ........................................................................................................................ 18
7.1 All NSAIDs .................................................................................................................................................................................... 18
7.2 NSAIDs and CKD .......................................................................................................................................................................... 19
8.0 YELLOW CARDS ............................................................................................................................................................................. 21

Welsh Analytical Prescribing Support Unit
Page 4 of 49
SECONDARY CARE .................................................................................................................................................................................. 22
1.0 INSULIN ........................................................................................................................................................................................... 22
2.0 BIOSIMILARS ................................................................................................................................................................................... 24
2.1 Filgrastim....................................................................................................................................................................................... 25
2.2 Infliximab ....................................................................................................................................................................................... 26
2.3 Etanercept ..................................................................................................................................................................................... 27
2.4 Rituximab ...................................................................................................................................................................................... 28
2.5 Insulin glargine .............................................................................................................................................................................. 29
3.0 ANTIBIOTICS ................................................................................................................................................................................... 31
CAUTION WITH INTERPRETING NPI MONITORING DATA .................................................................................................................... 32
GLOSSARY ............................................................................................................................................................................................... 33
APPENDIX 1. AWMSG NATIONAL PRESCRIBING INDICATORS 2017–2018 ......................................................................................... 34
APPENDIX 2. PRIMARY CARE NPI PRESCRIBING BY GP CLUSTER .................................................................................................... 36

National Prescribing Indicators 2017–2018. Analysis of Prescribing Data to September 2017
Page 5 of 49
PRACTICES ACHIEVING INDICATOR THRESHOLDS FOR PRIMARY CARE NPIS The table below shows the extent to which practices in each health board met the indicator thresholds:
• The figure in the cell is the number of practices in each health board meeting the indicator threshold. • The percentage figure and cell colour represent the proportion of practices in each health board meeting the indicator threshold.
Practices achieving the indicator threshold – Quarter ending September 2017

Welsh Analytical Prescribing Support Unit
Page 6 of 49
PRIMARY CARE 1.0 PROTON PUMP INHIBITORS Purpose: To encourage appropriate use of proton pump inhibitors (PPIs). Unit of measure: PPI DDDs per 1,000 PUs. Aim: To reduce prescribing
Although PPIs are generally well tolerated, there is emerging evidence that serious adverse effects may be linked with long-term PPI use. These include fractures of the hip, wrist and spine, Clostridium difficile infection, and hypomagnesaemia. Prescribers are therefore encouraged to review and reduce where possible. In the quarter to September 2017, PPI prescribing (DDDs per 1,000 PUs) in Wales was 12% higher than that seen in England.
• For the quarter ending September 2017, PPI usage ranged from 6,477 to 7,325 DDDs per 1,000 PUs across the health boards.
• The health board with the lowest prescribing was Cardiff and Vale UHB whilst the highest prescribing was seen in Aneurin Bevan UHB.
• Six out of the seven health boards demonstrated a reduction in DDDs per 1,000 PUs, compared with the equivalent quarter of the previous year. Betsi Cadwaladr UHB demonstrated the largest percentage decrease.
• Cwm Taf UHB demonstrated an increase in prescribing.
Table 1. PPI DDDs per 1,000 PUs 2016–2017 Qtr 2 2017–2018 Qtr 2 % Change Betsi Cadwaladr 7,752 7,249 -6.49% Cardiff and Vale 6,792 6,477 -4.64% ABMU 7,084 6,898 -2.63% Aneurin Bevan 7,475 7,325 -2.01% Powys 7,160 7,048 -1.55% Hywel Dda 6,707 6,691 -0.24% Cwm Taf 7,139 7,265 1.76% Wales 7,226 7,010 -2.99%
Figure 1. Trend in PPI prescribing DDDs per 1,000 PUs

National Prescribing Indicators 2017–2018. Analysis of Prescribing Data to September 2017
Page 7 of 49
2.0 INHALED CORTICOSTEROIDS Purpose: To encourage the routine review of inhaled corticosteroids (ICS) in people with asthma, particularly those on high strengths, encouraging step down of the strength when clinically appropriate. Unit of measure: High-strength ICS items as a percentage of all ICS prescribing. Aim: To reduce prescribing
This indicator is new for 2017–2018 and replaces the low-strength ICS indicator. Potentially serious systemic side effects, such as adrenal suppression, growth failure, decrease in bone mineral density, cataracts and glaucoma, may be associated with ICS, particularly at high doses.
• For the quarter ending September 2017, the proportion of high-strength ICS prescribing ranged from 19.8% to 31.8% across the health boards.
• The health board with the lowest percentage was Cardiff
and Vale UHB, whilst the highest percentage was seen in Abertawe Bro Morgannwg UHB.
• The proportion of high-strength ICS prescribing decreased
across all health boards compared with the equivalent quarter of the previous year.
• The greatest percentage decrease was seen in Aneurin
Bevan UHB, and the smallest percentage decrease was seen in Abertawe Bro Morgannwg UHB.
Table 2. High-strength ICS prescribing as a percentage of all ICS prescribing
2016–2017 Qtr 2 2017–2018 Qtr 2 % Change Aneurin Bevan 24.9 21.9 -12.1% Powys 24.5 22.1 -10.1% Hywel Dda 27.4 25.0 -8.64% Cardiff and Vale 21.1 19.8 -6.23% Cwm Taf 31.1 29.3 -5.78% Betsi Cadwaladr 24.2 23.2 -4.27% ABMU 32.9 31.8 -3.33% Wales 26.7 24.9 -6.71%
Figure 2. Trend in high-strength ICS prescribing as a percentage of all ICS prescribing

Welsh Analytical Prescribing Support Unit
Page 8 of 49
3.0 HYPNOTICS AND ANXIOLYTICS Purpose: To encourage a reduction in the inappropriate prescribing of hypnotics and anxiolytics. Unit of measure: Hypnotic and anxiolytic ADQs per 1,000 STAR-PUs. Aim: To reduce prescribing
There has been ongoing concern with regard to the high level of anxiolytic and hypnotic prescribing within NHS Wales. Some prescribing may be inappropriate and contribute to the problem of physical and psychological dependence, and/or may be responsible for masking underlying depression. The prescribing of hypnotics and anxiolytics continues to decrease across Wales, in line with the aim of this indicator. However, for the quarter ending September 2017, prescribing in Wales (ADQs per 1,000 STAR-PUs) was almost 49% higher than that seen in England.
• For the quarter ending September 2017, hypnotic and anxiolytic prescribing ranged from 2,124 to 3,618 ADQs per 1,000 STAR-PUs across the health boards.
• The health board with the lowest prescribing was Cardiff
and Vale UHB, whilst the highest prescribing was seen in Cwm Taf UHB.
• Hypnotic and anxiolytic prescribing decreased compared
with the equivalent quarter of the previous year in all of the health boards.
• The largest percentage decrease was seen in Cardiff and
Vale UHB, and the smallest percentage decrease was seen in Powys Teaching HB.
Table 3. Hypnotic and anxiolytic ADQs per 1,000 STAR-PUs
2016–2017 Qtr 2 2017–2018 Qtr 2 % Change Cardiff and Vale 2,447 2,124 -13.2% Betsi Cadwaladr 3,594 3,252 -9.53% Aneurin Bevan 3,357 3,086 -8.09% Hywel Dda 3,563 3,291 -7.63% ABMU 3,388 3,138 -7.39% Cwm Taf 3,901 3,618 -7.25% Powys 2,295 2,218 -3.35% Wales 3,316 3,034 -8.52%
Figure 3. Trend in hypnotic and anxiolytic prescribing ADQs per 1,000 STAR-PUs
National Prescribing Indicators 2017–2018. Analysis of Prescribing Data to September 2017
Page 9 of 49
4.0 ANALGESICS There are three NPIs monitoring the usage of medicines used for the treatment of pain for 2017–2018:
1. Tramadol 2. Opioid patches 3. Gabapentin and pregabalin
4.1 Tramadol
Purpose: To encourage the appropriate use and review of tramadol, minimising the potential for diversion and misuse.
Unit of measure: Tramadol DDDs per 1,000 patients.
Aim: To reduce prescribing Whilst there is a recognised place in pain management for tramadol, there are concerns regarding the risks associated with misuse and diversion. This NPI promotes a prudent approach to prescribing tramadol, taking into account the risks and benefits, and encouraging timely review.
Across Wales, prescribing of tramadol was lower in the quarter ending September 2017, than in the equivalent quarter of the previous year. This is in line with the aim of the indicator.
• For the quarter ending September 2017, tramadol prescribing ranged from 428 to 698 DDDs per 1,000 patients across the health boards.
• The health board with the lowest prescribing was Powys Teaching HB, whilst the highest prescribing was seen in Cwm Taf UHB.
• Tramadol prescribing decreased compared with the equivalent quarter of the previous year in all of the health boards.
• The largest percentage decrease was seen in Abertawe Bro Morgannwg UHB and the smallest percentage decrease was seen in Powys Teaching HB.
Table 4. Tramadol DDDs per 1,000 patients
2016–2017 Qtr 2 2017–2018 Qtr 2 % Change ABMU 726 652 -10.2% Hywel Dda 708 638 -9.79% Cwm Taf 771 698 -9.40% Betsi Cadwaladr 689 634 -8.04% Aneurin Bevan 652 610 -6.49% Cardiff and Vale 604 568 -5.91% Powys 453 428 -5.39% Wales 675 620 -8.15%
Figure 4. Trend in tramadol prescribing DDDs per 1,000 patients

Welsh Analytical Prescribing Support Unit
Page 10 of 49
4.2 Opioid patches
Purpose: To encourage the appropriate use and review of opioid patches.
Unit of measure: Opioid patch items as a percentage of all opioid prescribing.
Aim: To reduce prescribing
Opioid patches are recommended as a treatment option only where analgesic requirements are stable and where oral opioids are unsuitable. A number of safety concerns around the use of opioid patches have been highlighted, with anecdotal evidence suggesting that patches are not always prescribed appropriately.
This is a new indicator for 2017–2018, the aim of which is to highlight that prescribers should make evidence-based, informed decisions based on the individual needs of the patient. Prescribers should ensure that when an opioid patch is indicated, the patch with the lowest acquisition cost is initiated.
Across Wales, use of opioid patches as a percentage of all opioid prescribing was lower in the quarter ending September 2017 than in the equivalent quarter of the previous year. This is in line with the aim of the indicator.
• For the quarter ending September 2017, the proportion of opioid patch prescribing ranged from 7.21% to 15.3%.
• The health board with the lowest proportion was ABMU UHB, whilst the highest proportion was seen in Cwm Taf UHB.
• The proportion of opioid patches prescribed decreased compared with the equivalent quarter of the previous year in six out of the seven health boards. The largest percentage decrease was seen in Abertawe Bro Morgannwg UHB.
• Betsi Cadwaladr demonstrated an increase in prescribing.
Table 5. Opioid patch items as a percentage of all opioid prescribing
2016–2017 Qtr 2 2017–2018 Qtr 2 % Change ABMU 7.75 7.21 -6.96% Aneurin Bevan 11.3 10.7 -5.56% Cardiff and Vale 10.5 10.3 -2.37% Cwm Taf 15.6 15.3 -2.22% Hywel Dda 13.3 13.2 -1.29% Powys 14.3 14.2 -0.98% Betsi Cadwaladr 10.6 10.9 2.21% Wales 11.3 11.1 -2.05%
Figure 5. Trend in opioid patch items as a percentage of all opioid prescribing

National Prescribing Indicators 2017–2018. Analysis of Prescribing Data to September 2017
Page 11 of 49
4.3 Gabapentin and pregabalin
Purpose: To encourage the appropriate use and review of gabapentin and pregabalin, minimising the potential for diversion and misuse. Unit of measure: Gabapentin and pregabalin DDDs per 1,000 patients. Aim: To reduce prescribing
Gabapentin and pregabalin have a well-defined role in the management of a number of conditions including epilepsy and neuropathic pain, and pregabalin also has a role in treatment of generalised anxiety disorder. Both gabapentin and pregabalin have known psychiatric side effects and there is a potential risk of dependence, misuse and diversion. Prescribers should make evidence-based, informed decisions on whether to prescribe, taking into account the risks and benefits of these medicines. Across Wales, for the quarter ending September 2017, prescribing of gabapentin and pregabalin increased compared with the same quarter of the previous year.
• For the quarter ending September 2017, gabapentin and pregabalin prescribing ranged from 1,075 to 1,838 DDDs per 1,000 patients across the health boards.
• The health board with the lowest prescribing was Cardiff
and Vale UHB, whilst the highest prescribing was seen in Cwm Taf UHB.
• Gabapentin and pregabalin prescribing increased
compared with the equivalent quarter of the previous year in all of the health boards.
• The smallest percentage increase was seen in Cardiff and Vale UHB and the largest percentage increase was seen in Cwm Taf UHB.
Table 6. Gabapentin and pregabalin DDDs per 1,000 patients
2016–2017 Qtr 2 2017–2018 Qtr 2 % Change Cardiff and Vale 1,029 1,075 4.55% Powys 1,015 1,084 6.75% ABMU 1,456 1,569 7.76% Betsi Cadwaladr 1,187 1,285 8.22% Aneurin Bevan 1,556 1,691 8.70% Hywel Dda 1,224 1,332 8.87% Cwm Taf 1,662 1,838 10.6% Wales 1,320 1,427 8.11%
Figure 6. Trend in gabapentin and pregabalin prescribing DDDs per 1,000 patients
Note: DDDs per 1,000 patients for Aneurin Bevan UHB Q1 2016–2017 should be 1,530 rather than 1,619 as reported.

Welsh Analytical Prescribing Support Unit
Page 12 of 49
5.0 ANTIBIOTICS
Purpose: To encourage the appropriate prescribing of antibiotics. The development of NPIs for antibiotic prescribing supports one of the key elements of the Welsh Antimicrobial Resistance Programme: to inform, support and promote the prudent use of antimicrobials.
There are four primary care antibiotic NPIs for 2017–2018: 1. Total antibacterial items 2. Co-amoxiclav 3. Cephalosporins 4. Fluoroquinolones
5.1 Total antibacterial items
Unit of measure: Total antibacterial items per 1,000 STAR-PUs.
Aim: To reduce prescribing
No target is set for this indicator due to seasonal variations in prescribing, although a reduction in prescribing year on year is encouraged, with measurement based on data for quarter ending December. Across Wales, for the quarter ending September 2017, antibacterial prescribing decreased by 2.95%, compared with the equivalent quarter of the previous year.
• For the quarter ending September 2017, the total number of antibacterial items per 1,000 STAR-PUs ranged from 251 to 322 across the health boards.
• The health board with the lowest prescribing was Powys Teaching HB, whilst the highest prescribing was seen in Cwm Taf UHB.
• For the quarter ending September 2017, antibacterial prescribing decreased in five of the seven health boards compared with the equivalent quarter of the previous year.
• Betsi Cadwaladr UHB demonstrated the greatest percentage reduction in prescribing compared with the equivalent quarter of the previous year.
• Cwm Taf UHB and Powys Teaching HB demonstrated increases in prescribing, compared with the equivalent quarter of the previous year.
Table 7. Total antibacterial items per 1,000 STAR-PUs
2016–2017 Qtr 2 2017–2018 Qtr 2 % Change Betsi Cadwaladr 299 277 -7.46% ABMU 309 299 -3.36% Hywel Dda 301 293 -2.66% Cardiff and Vale 273 268 -1.81% Aneurin Bevan 290 287 -1.14% Powys 248 251 0.82% Cwm Taf 318 322 1.25% Wales 295 286 -2.95%
Figure 7. Trend in antibacterial prescribing items per 1,000 STAR-PUs
National Prescribing Indicators 2017–2018. Analysis of Prescribing Data to September 2017
Page 13 of 49
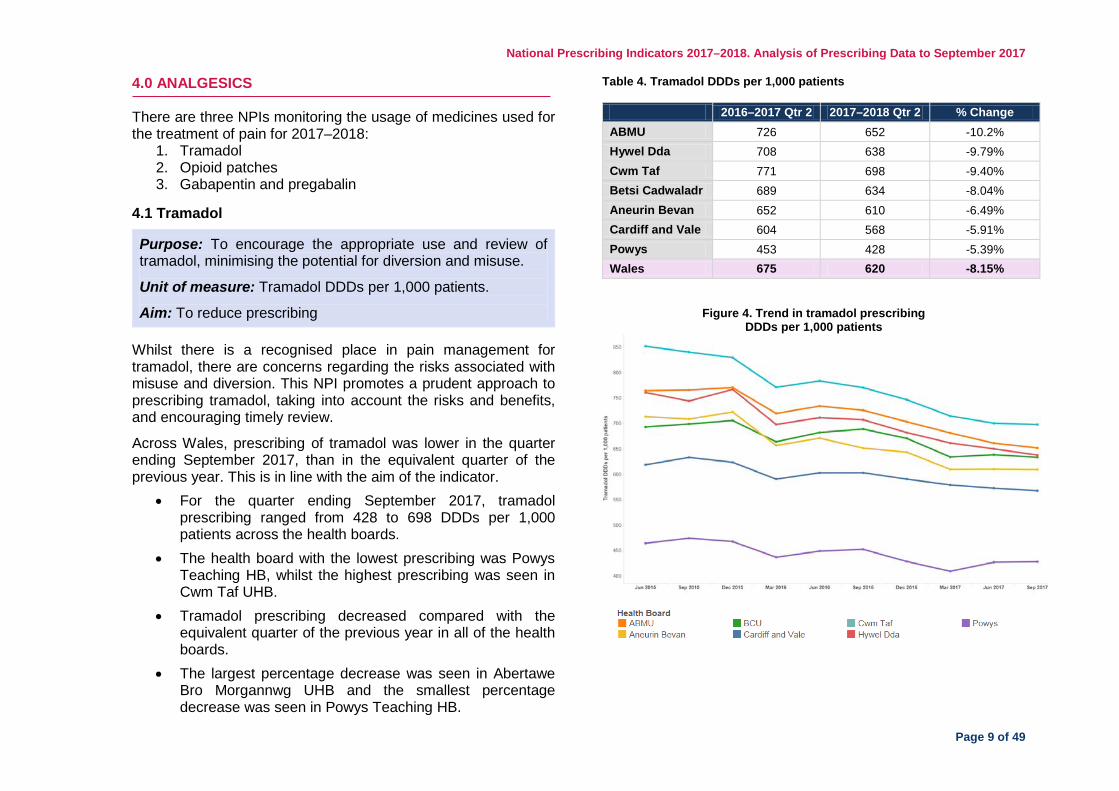
5.2 Co-amoxiclav, cephalosporins and fluoroquinolones
Unit of measure: Each of these antibacterial indicators is monitored using two measures:
1. Items as a percentage of total antibacterial items 2. Items per 1,000 patients
Aim: To reduce prescribing
Prescribing of co-amoxiclav, cephalosporins and fluoroquinolones are monitored, as these antibacterials are associated with an increased risk of Clostridium difficile infection. 5.2.1 Co-amoxiclav, cephalosporins and fluoroquinolones as a percentage of total antibacterial items Across Wales, for the quarter ending September 2017, the number of items of co-amoxiclav, cephalosporins and fluoroquinolones as a percentage of all antibacterial prescribing was lower than the equivalent quarter of the previous year.
• The proportion of co-amoxiclav prescribing decreased, compared with the equivalent quarter of the previous year, in five out of the seven health boards. The largest percentage decrease was seen in Hywel Dda UHB (5.14%). There were increases of 6.92% and 4.82% in ABMU UHB and Powys Teaching HB respectively.
• The proportion of cephalosporin prescribing decreased, compared with the equivalent quarter of the previous year, in six out of the seven health boards. The largest percentage decrease was seen in Aneurin Bevan UHB (17.2%). Abertawe Bro Morgannwg UHB demonstrated a small increase of 0.47%.
• The proportion of fluoroquinolone prescribing decreased, compared with the equivalent quarter of the previous year, in four out of the seven health boards. The largest percentage decrease was seen in Powys Teaching HB (6.35%). Hywel Dda UHB and Abertawe Bro Morgannwg UHB demonstrated increases of 4.34% and 2.66% respectively.
Figure 8. Co-amoxiclav, cephalosporins and fluoroquinolones as a percentage of total antibacterial prescribing

Welsh Analytical Prescribing Support Unit
Page 14 of 49
5.2.2 Co-amoxiclav items per 1,000 patients Across Wales, for the quarter ending September 2017, the number of co-amoxiclav items per 1,000 patients decreased by 3.41%, compared with the equivalent quarter of the previous year, in line with the aim of this indicator.
• For the quarter ending September 2017, co-amoxiclav prescribing ranged from 4.37 to 7.81 items per 1,000 patients across the health boards.
• The health board with the lowest prescribing was Betsi Cadwaladr UHB, whilst the highest prescribing was seen in Hywel Dda UHB.
• Co-amoxiclav prescribing decreased compared with the equivalent quarter of the previous year in five out of the seven health boards. The largest percentage decrease was seen in Betsi Cadwaladr UHB.
• Powys Teaching HB and Abertawe Bro Morgannwg UHB demonstrated increases of 5.75% and 3.70% respectively.
Table 8. Co-amoxiclav items per 1,000 patients
2016–2017 Qtr 2 2017–2018 Qtr 2 % Change Betsi Cadwaladr 4.85 4.37 -9.93% Hywel Dda 8.49 7.81 -8.03% Aneurin Bevan 5.76 5.52 -4.13% Cardiff and Vale 4.65 4.52 -2.69% Cwm Taf 7.65 7.52 -1.73% ABMU 6.91 7.17 3.70% Powys 5.68 6.00 5.75% Wales 6.09 5.88 -3.41%
Figure 9. Trend in co-amoxiclav prescribing items per 1,000 patients

National Prescribing Indicators 2017–2018. Analysis of Prescribing Data to September 2017
Page 15 of 49
5.2.3 Cephalosporin items per 1,000 patients Across Wales, for the quarter ending September 2017, the number of cephalosporin items per 1,000 patients decreased across Wales by 8.77%, compared with the equivalent quarter of the previous year, in line with the aim of this indicator.
• For the quarter ending September 2017, cephalosporin prescribing ranged from 3.17 to 9.19 items per 1,000 patients across the health boards.
• The health board with the lowest prescribing was Cardiff
and Vale UHB, whilst the highest prescribing was seen in Cwm Taf UHB.
• Cephalosporin prescribing decreased compared with the
equivalent quarter of the previous year in six out of the seven health boards. The largest percentage decrease was seen in Aneurin Bevan UHB.
• Cwm Taf UHB demonstrated a small percentage increase.
Table 9. Cephalosporin items per 1,000 patients
2016–2017 Qtr 2 2017–2018 Qtr 2 % Change Aneurin Bevan 4.61 3.77 -18.2% Powys 4.06 3.55 -12.7% Hywel Dda 6.75 5.99 -11.3% BCU 8.02 7.17 -10.7% Cardiff and Vale 3.49 3.17 -9.21% ABMU 5.99 5.84 -2.55% Cwm Taf 9.12 9.19 0.72% Wales 6.09 5.55 -8.77%
Figure 10. Trend in cephalosporin prescribing items per 1,000 patients

Welsh Analytical Prescribing Support Unit
Page 16 of 49
5.2.4 Fluoroquinolone items per 1,000 patients Across Wales, for the quarter ending September 2017, the number of fluoroquinolone items per 1,000 patients decreased by 2.83%, compared with the equivalent quarter of the previous year. This is in line with the aim of the indicator.
• For the quarter ending September 2017, fluoroquinolone prescribing ranged from 2.58 to 4.22 items per 1,000 patients across the health boards.
• The health board with the lowest prescribing was Aneurin
Bevan UHB, whilst the highest prescribing was seen in Abertawe Bro Morgannwg UHB.
• Fluoroquinolone prescribing decreased compared with the equivalent quarter of the previous year in six out of the seven health boards. Betsi Cadwaladr UHB demonstrated the greatest percentage reduction in prescribing compared with the equivalent quarter of the previous year.
• Hywel Dda UHB demonstrated an increase in prescribing compared with the equivalent quarter of the previous year.
Table 10. Fluoroquinolone items per 1,000 patients
2016–2017 Qtr 2
2017–2018 Qtr 2 % Change
Betsi Cadwaladr 4.26 3.97 -6.84% Powys 3.43 3.24 -5.52% Cwm Taf 3.66 3.55 -2.95% Cardiff and Vale 3.10 3.03 -2.37% Aneurin Bevan 2.63 2.58 -2.25% ABMU 4.23 4.22 -0.43% Hywel Dda 4.01 4.05 1.15% Wales 3.64 3.54 -2.83%
Figure 11. Trend in fluoroquinolone prescribing items per 1,000 patients

National Prescribing Indicators 2017–2018. Analysis of Prescribing Data to September 2017
Page 17 of 49
6.0 ANTICHOLINERGIC BURDEN Purpose: To encourage a review of patients with an Anticholinergic Effect on Cognition (AEC) score of 3 or more, with the aim of reducing anticholinergic use where appropriate. Unit of measure: Patients aged 75 and over with an AEC score of 3 or more for items on active repeat, as a percentage of all patients aged 75 and over. Aim: To reduce the prescribing of medicines contributing to the AEC score
An increasing number of studies report that medicines with anticholinergic effects are associated with an increased risk of cognitive impairment, dementia and falls in older people. The cumulative effect of taking one or more medicines with anticholinergic properties is referred to as anticholinergic burden. As risk of adverse clinical outcomes in older people prescribed anticholinergic medication increases with increasing anticholinergic exposure, it is good practice to use medicines with AEC scores of zero. This is a new indicator for 2017–2018 and aims to encourage timely review to reduce the anticholinergic burden in older people, by avoiding, reducing doses and deprescribing medicines with anticholinergic activity where clinically possible.
Statement from Audit+: Following deployment of the AEC module in Audit+, it was identified that the data being presented by the Vision Health system and subsequently being used by Audit+ was resulting in acute prescriptions being identified and counted as part of the overall AEC score, which was incorrect. An update to the Audit+ software across the entire Vision Health estate was subsequently required to remedy the situation. This has now taken place along with an update to the Audit+ AEC module itself. NWIS are now undertaking test activities in a Vision Health pilot site to confirm that the calculation of AEC scores within the Audit+ AEC module are correct. Once this work is complete the updated Audit+ module will be rolled out across all Vision Health and EMIS Web practices to ensure consistency of reporting throughout Wales. At the latest, data will be available to practices at the end of the third quarter.

Welsh Analytical Prescribing Support Unit
Page 18 of 49
7.0 NON-STEROIDAL ANTI-INFLAMMATORY DRUGS Purpose: Ensure that the risks associated with non-steroidal anti-inflammatory drugs (NSAIDs) are minimised by appropriate use.
There are two NSAID NPIs for 2017–2018. 1. All NSAIDs 2. NSAIDs and chronic kidney disease (CKD)
7.1 All NSAIDs
Unit of measure: NSAID ADQs per 1,000 STAR-PUs.
Aim: To reduce prescribing
This indicator aims to encourage a reduction in total NSAID prescribing, which has been consistently higher than that seen in England. NSAIDs are associated with increased risk of serious gastro-intestinal toxicity, cardiovascular adverse events and renal failure, and are contraindicated in many other disease areas.
Across Wales, for the quarter ending September 2017, NSAID prescribing decreased, in line with the aim of the indicator, in all seven health boards, compared with the equivalent quarter of the previous year.
• For the quarter ending September 2017, total NSAID prescribing ranged from 1,284 to 1,709 ADQs per 1,000 STAR-PUs across the health boards.
• The health board with the lowest prescribing was Cardiff and Vale UHB, whilst the highest prescribing was seen in Cwm Taf UHB.
• Total NSAID prescribing decreased compared with the equivalent quarter of the previous year in all of the health boards.
• The largest percentage decrease was seen in Cardiff and Vale UHB, and the smallest percentage decrease was seen in Cwm Taf UHB.
Table 11. NSAID ADQs per 1,000 STAR-PUs
2016–2017 Qtr 2
2017–2018 Qtr 2 % Change
Cardiff and Vale 1,564 1,284 -17.9% Powys 1,589 1,392 -12.4% Aneurin Bevan 1,673 1,487 -11.1% BCU 1,687 1,501 -11.0% Hywel Dda 1,726 1,553 -10.0% ABMU 1,727 1,559 -9.73% Cwm Taf 1,838 1,709 -7.05% Wales 1,688 1,498 -11.2%
Figure 12. Trend in NSAID prescribing ADQs per 1,000 STAR-PUs

National Prescribing Indicators 2017–2018. Analysis of Prescribing Data to September 2017
Page 19 of 49
7.2 NSAIDs and CKD
Units of measure: • Number of patients on the CKD register (CKD stage 3–
5) who have received a repeat prescription for an NSAID within the last 3 months, as a percentage of all patients on the CKD register.
• Number of patients who are not on the CKD register but have an eGFR of < 59 ml/min, and have received a repeat prescription for an NSAID within the last 3 months, as a percentage of all patients who are not on the CKD register but have an eGFR of < 59 ml/min.
Aim: To reduce prescribing
In patients with CKD, the chronic use of NSAIDs may be associated with disease progression. The effects on GFR should be monitored when treating people with CKD with NSAIDs over prolonged periods of time. NSAIDs may precipitate renal failure, and vulnerable patients, such as the elderly, may be at increased risk. The aim of this NPI is to highlight the requirement for regular review of the ongoing need for an NSAID, and reassessment of the risk versus benefit. As this is a new indicator for 2017–2018, data are presented as a quarter on quarter change.
Table 12. Number of patients on the CKD register (CKD stage 3–5) who have received a repeat prescription for an NSAID within the last 3 months, as a percentage of all patients on the CKD register
2017–2018 Qtr 1 2017–2018 Qtr 2 % Change Cardiff and Vale 2.84 1.46 -48.6 Hywel Dda 3.91 2.22 -43.2 ABMU 3.44 2.04 -40.7 Cwm Taf 3.37 2.27 -32.6 Aneurin Bevan 2.88 1.97 -31.6 Betsi Cadwaladr 2.30 1.97 -14.3 Powys 3.24 2.81 -13.3 Wales 3.02 2.04 -32.5
Figure 13. Number of patients on the CKD register (CKD stage 3–5) who have received a repeat prescription for an NSAID within the last 3 months,
as a percentage of all patients on the CKD register

Welsh Analytical Prescribing Support Unit
Page 20 of 49
Table 13. Number of patients who are not on the CKD register but have an eGFR of < 59 ml/min, and have received a repeat prescription for an
NSAID within the last 3 months, as a percentage of all patients who are not on the CKD register but have an eGFR of < 59 ml/min
2017–2018 Qtr 1 2017–2018 Qtr 2 % Change
Cwm Taf 5.06 2.93 -42.1 Cardiff and Vale 4.82 2.86 -40.7 Hywel Dda 5.21 3.39 -34.9 ABMU 4.69 3.39 -27.7 Aneurin Bevan 4.04 2.97 -26.5 Betsi Cadwaladr 3.48 3.16 -9.20 Powys 4.57 4.28 -6.35 Wales 4.50 3.21 -28.7
Figure 14. Number of patients who are not on the CKD register but have an eGFR of < 59 ml/min, and have received a repeat prescription for an NSAID within the last 3 months, as a percentage of all patients who are
not on the CKD register but have an eGFR of < 59 ml/min

National Prescribing Indicators 2017–2018. Analysis of Prescribing Data to September 2017
Page 21 of 49
8.0 YELLOW CARDS Purpose: To encourage an increase in the number of Yellow Cards submitted in Wales. Unit of measure: Number of Yellow Cards submitted, per practice and per health board. Aim: To increase reporting
Adverse drug reactions (ADRs) are a significant clinical problem, increasing morbidity and mortality. Approximately 6.5% of hospital admissions in adults and 2.1% in children are attributed to ADRs.
The Yellow Card Scheme is vital in helping the Medicines and Healthcare products Regulatory Agency (MHRA) monitor the safety of medicines and vaccines that are on the market.
The number of Yellow Cards submitted by GP practices in Wales increased by 61% compared with the equivalent quarter of the previous year. The largest percentage increase in GP practice Yellow Card reporting was seen in Cwm Taf UHB. The largest percentage decrease was seen in Cardiff and Vale UHB. Table 14. Number of Yellow Cards submitted by GP practices
2016–2017 Qtr 2 2017–2018 Qtr 2 % Change Cwm Taf 8 49 513 Betsi Cadwaladr 31 125 303 Hywel Dda 21 33 57 Powys 16 20 25 Aneurin Bevan 76 84 11 ABMU 55 53 -4 Cardiff and Vale 46 43 -7 Wales 253 407 61
Figure 15. Number of GP practice reports per 100,000 health board population
The number of Yellow Cards submitted by health boards in Wales increased by 42% compared with the equivalent quarter of the previous year. Table 15. Number of Yellow Cards submitted by health boards
2016–2017 Qtr 2 2017–2018 Qtr 2 % Change Cwm Taf 15 66 340 Betsi Cadwaladr 75 193 157 Powys 19 28 47 Hywel Dda 55 65 18 Cardiff and Vale 84 90 7 Aneurin Bevan 115 117 2 ABMU 96 94 -2 Wales 459 653 42
0
5
10
15
20
25
30
35
40
Num
ber o
f GP
repo
rts p
er 1
00,0
00 H
B
popu
latio
n

Welsh Analytical Prescribing Support Unit
Page 22 of 49
SECONDARY CARE 1.0 INSULIN
Purpose: Ensure long-acting analogue insulin prescribing in type 2 diabetes mellitus is in line with NICE guidance to maximise cost-effective prescribing within Wales. Unit of measure: Items/number of long-acting insulin analogues expressed as a percentage of total insulin prescribed within primary and secondary care. Aim: To reduce prescribing
NICE guidance recommends human isophane (neutral protamine Hagedorn [NPH]) insulin as the first choice insulin-based treatment when prescribing insulin in type 2 diabetes mellitus. For most people with type 2 diabetes, long-acting insulin analogues offer no significant benefit over human isophane insulin and are more expensive. This report considers data sets from both secondary and primary care, as prescribing will usually be continued in the primary care setting following secondary care initiation. Secondary care prescribing
• Across Wales, secondary care use of long acting insulin as a percentage of all insulin prescribing was lower in the quarter ending September 2017 than in the equivalent quarter of the previous year in line with the aim of the indicator.
• For the quarter ending September 2017, prescribing of long-acting insulin analogues as a percentage of total long- and intermediate-acting insulin ranged from 52.8% to 85.7%.
• The health board/trust with the lowest prescribing percentage was Cwm Taf UHB (52.8%). This was a
decrease of 5.99% from the equivalent quarter of the previous year.
• The highest prescribing was seen in Velindre NHS Trust; however, usage in this trust is very low and so percentage changes are likely to show a greater magnitude of fluctuation between comparative periods. Betsi Cadwaladr UHB had the next highest prescribing at 83.9%, an increase of 5.31% compared with the equivalent quarter of the previous year.
• The health board/trust with the greatest percentage decrease was Cardiff and Vale UHB. There was a reduction from 83.0% to 67.2%.
• The proportion of long-acting insulin analogue prescribing decreased in four of the seven health boards/trusts, compared with the equivalent quarter of the previous year.
Table 16. Long-acting insulin analogues as a percentage of total long- and intermediate-acting insulin prescribing in secondary care
2016–2017 Qtr 2 2017–2018 Qtr 2 % Change Cardiff and Vale 83.0 67.2 -19.0 Velindre 100 85.7 -14.3 Cwm Taf 56.2 52.8 -5.99 ABMU 85.8 83.6 -2.53 Hywel Dda 81.2 83.7 3.08 Aneurin Bevan 73.0 75.7 3.68 Betsi Cadwaladr 79.7 83.9 5.31
Wales 77.7 76.0 -2.22

National Prescribing Indicators 2017–2018. Analysis of Prescribing Data to September 2017
Page 23 of 49
Primary care prescribing Across Wales, the prescribing of long-acting insulin analogues as a proportion of total long- and intermediate-acting insulin prescribing decreased by approximately 1.45% for the quarter ending in September 2017, compared with the equivalent quarter of the previous year. This is in line with the aim of the indicator.
• For the quarter ending September 2017, long-acting insulin analogue prescribing ranged from 78.0% to 94.3% across the health boards.
• Across the seven health boards in Wales prescribing decreased compared with the equivalent quarter of the previous year in five health boards and increased in two health boards.
• The health board with the lowest prescribing was Cwm Taf
UHB, whilst the highest prescribing was seen in Hywel Dda UHB.
• The largest percentage decrease was seen in Cardiff and Vale UHB and the largest increase was seen in Hywel Dda UHB.
Table 17. Long-acting insulin analogues as a percentage of total long- and intermediate-acting insulin prescribing in primary care
2016–2017 Qtr 2 2017–2018 Qtr 2 % Change Cardiff and Vale 90.9 87.4 -3.85 Cwm Taf 80.1 78.0 -2.62 Betsi Cadwaladr 93.3 90.9 -2.57
Aneurin Bevan 85.8 84.8 -1.17 Powys 86.4 85.8 -0.69 ABMU 93.6 94.1 0.53 Hywel Dda 93.7 94.3 0.64 Wales 89.8 88.5 -1.45
Figure 16. Trend in long-acting analogue prescribing as a percentage of total long- and intermediate-acting insulin prescribed in primary care
74
78
82
86
90
94
98
Jun-
11S
ep-1
1D
ec-1
1M
ar-1
2Ju
n-12
Sep
-12
Dec
-12
Mar
-13
Jun-
13S
ep-1
3D
ec-1
3M
ar-1
4Ju
n-14
Sep
-14
Dec
-14
Mar
-15
Jun-
15S
ep-1
5D
ec-1
5M
ar-1
6Ju
n-16
Sep
-16
Dec
-16
Mar
-17
Jun-
17S
ep-1
7
Per
cent
age

Welsh Analytical Prescribing Support Unit
Page 24 of 49
2.0 BIOSIMILARS Purpose: Ensure prescribing of biosimilar medicines is in line with AWMSG guidance to support cost-effective prescribing within Wales. Unit of measure: Quantity of biosimilar medicines prescribed as a percentage of total ‘reference’ product plus biosimilar. Aim: To increase appropriate prescribing in line with guidance and increase commercial competition.
Biological medicines are those that are made or derived from a biological source and, as such, are complex, with inherent variability in their structure. A biosimilar medicine is a biological medicine that is developed to be highly similar and clinically equivalent to an existing biological medicine (i.e. ‘reference’ medicine or ‘originator’ medicine). Continuing development of biosimilar medicines offers an increased choice for patients and clinicians.
There is an increasing range of biosimilar products becoming available and therefore new products will be monitored and reported on in this section of the NPI report as they begin to be used within NHS Wales. Data reporting MHRA guidelines state that biological medicines, including biosimilar medicines, must be prescribed by brand name to prevent automatic substitution taking place without clinician and patient involvement, and to support ongoing pharmacovigilance of the individual products. However, Medusa data suggest some generic prescribing. For infliximab the cost per item for these generic items is identical to that of the reference product; these generic items have therefore been included in figures for total quantity of the reference product. For filgrastim the cost per item falls between reference and biosimilar, so these generic items have been presented separately.

National Prescribing Indicators 2017–2018. Analysis of Prescribing Data to September 2017
Page 25 of 49
2.1 Filgrastim Across Wales there was a decrease in the use of filgrastim biosimilars (Nivestim®, Zarzio® and Ratiograstim®) as a percentage of all filgrastim for the quarter ending September 2017 compared with the quarter ending September 2016, from 97.7% to 95.4%. Table 18. Quantity of filgrastim generic, reference (Neupogen®) and biosimilar (Nivestim®, Zarzio®, Ratiograstim®) prescribed
Filgrastim (generic) 2016–2017 Qtr 2 2017–2018 Qtr 2 % Change Primary care 10 5 -50.0 Secondary care 165 250 51.5 Total 175 255 45.7 Reference (Neupogen®) 2016–2017 Qtr 2 2017–2018 Qtr 2 % Change
Primary care 0 0 0 Secondary care 26 140 438.5 Total 26 140 438.5 Biosimilar (Nivestim®, Zarzio®, Ratiograstim®)
2016–2017 Qtr 2 2017–2018 Qtr 2 % Change
Primary care 0 10 N/A Secondary care 8,597 8,240 -4.2 Total 8,597 8,250 -4.0
Table 19. Filgrastim biosimilars as a percentage of reference, generic and biosimilar prescribed
2016–2017 Qtr 2 2017–2018 Qtr 2 % Change Primary care 0 66.7 N/A Secondary care 97.8 95.5 -2.35 Total 97.7 95.4 -2.35
2.1.1 Secondary care Prescribing of filgrastim biosimilars decreased as a percentage of all filgrastim from 97.8% to 95.5% in secondary care for the quarter ending September 2017 compared with the quarter ending September 2016.
Figure 17. Proportion of filgrastim prescribing as generic, reference (Neupogen®) and biosimilar (Nivestim®, Ratiograstim® and Zarzio®) in
secondary care – Quarter ending September 2017
Figure 18. Health board filgrastim generic, reference (Neupogen®) and biosimilar (Nivestim®, Ratiograstim® and Zarzio®) as a percentage of total filgrastim prescribed in secondary care – Quarter ending September 2017
2.1.2 Primary care Prescribing of filgrastim biosimilar increased as a percentage of all filgrastim from 0% to 66.7% for the quarter ending September 2017 compared with the quarter ending September 2016.

Welsh Analytical Prescribing Support Unit
Page 26 of 49
2.2 Infliximab Within Wales there was an increase in the use of the infliximab biosimilar (Inflectra®) as a percentage of all infliximab for the quarter ending September 2017 compared with the quarter ending September 2016, from 54.1% to 72.3%. Table 20. Quantity of infliximab reference (Remicade®) and biosimilar (Inflectra®) prescribed in NHS Wales
Reference (Remicade®)Ɨ
2016–2017 Qtr 2 2017–2018 Qtr 2 % Change
Total 2,516 1,908 -24.2 Biosimilar (Inflectra®) 2016–2017 Qtr 2 2017–2018 Qtr 2 % Change
Total 2,964 4,982 68.1 Ɨ These data include supplies recorded through homecare. Table 21. Infliximab biosimilars as a percentage of reference and biosimilar prescribed
2016–2017 Qtr 2 2017–2018 Qtr 2 % Change Total 54.1 72.3 33.6
Figure 19. Infliximab reference (Remicade®) and biosimilar (Inflectra®)
percentage change
Figure 20. Proportion of infliximab prescribing as reference (Remicade®) and biosimilar (Inflectra®) – Quarter ending September 2017
2.2.1 Secondary care
Figure 21. Infliximab generic, reference (Remicade®) and biosimilar (Inflectra®) as a proportion of total infliximab prescribed in secondary care
– Quarter ending September 2017

National Prescribing Indicators 2017–2018. Analysis of Prescribing Data to September 2017
Page 27 of 49
2.3 Etanercept Within Wales there was an increase in the use of the etanercept biosimilar (Benepali®) as a percentage of all etanercept for the quarter ending September 2017 compared with the quarter ending September 2016, from 7.5% to 49.5%. Table 22. Quantity of etanercept reference (Enbrel®) and biosimilar (Benepali®) prescribed in NHS Wales
Reference (Enbrel®)Ɨ
2016–2017 Qtr 2 2017–2018 Qtr 2 % Change
Total 15,253 9,384 -38.5 Biosimilar (Benepali®) 2016–2017 Qtr 2 2017–2018 Qtr 2 % Change
Total 1,228 9,192 648.5 ƗThese data include supplies recorded through homecare. Table 23. Etanercept biosimilar as a percentage of reference and biosimilar prescribed
2016–2017 Qtr 2 2017–2018 Qtr 2 % Change Total 7.5 49.5 560
Figure 22. Etanercept reference (Enbrel®) and biosimilar (Benepali®)
percentage change
Figure 23. Proportion of etanercept prescribing as reference (Enbrel®) and biosimilar (Benepali®) – Quarter ending September 2017
2.3.1 Secondary care Six health boards have data for biosimilar etanercept prescribing in secondary care. Three health boards (Abertawe Bro Morgannwg, Aneurin Bevan and Hywel Dda University Health Boards) use the biosimilar for the majority of their supplies.
Figure 24. Etanercept generic, reference (Enbrel®) and biosimilar (Benepali®) as a proportion of total etanercept prescribed in secondary
care – Quarter ending September 2017

Welsh Analytical Prescribing Support Unit
Page 28 of 49
2.4 Rituximab Within Wales there was an increase in the use of the rituximab biosimilar (Truxima®) as a percentage of all rituximab from 0.00% to 41.2% for quarter ending September 2017 compared with the quarter ending September 2016. Table 24. Quantity of rituximab reference (MabThera®) and biosimilar (Truxima®) prescribed in NHS Wales
Reference (MabThera®)Ɨ
2016–2017 Qtr 2 2017–2018 Qtr 2 % Change
Total 2,427 1,195 -50.8 Biosimilar (Truxima®) 2016–2017 Qtr 2 2017–2018 Qtr 2 % Change
Total 0 838 N/A ƗThese data include supplies recorded through homecare. Table 25. Rituximab biosimilar as a percentage of reference and biosimilar prescribed
2016–2017 Qtr 2 2017–2018 Qtr 2 % Change Total 0 41.2 N/A
Figure 25. Rituximab reference (MabThera®) and biosimilar (Truxima®)
percentage change
Figure 26. Proportion of rituximab prescribing as reference (MabThera®) and biosimilar (Truxima®) – Quarter ending September 2017
2.4.1 Secondary care Six health boards show biosimilar rituximab prescribing in secondary care.
Figure 27. Rituximab generic, reference (MabThera®) and biosimilar (Truxima®) as a proportion of total rituximab prescribed in secondary care
– Quarter ending September 2017

National Prescribing Indicators 2017–2018. Analysis of Prescribing Data to September 2017
Page 29 of 49
2.5 Insulin glargine Within Wales there was an increase in the use of insulin glargine biosimilar (Abasaglar®) for quarter ending September 2017 compared with the quarter ending September 2016, from 1.1% to 3.1%. The biosimilar insulin glargine usage is illustrated in Figures 28–30. Table 26. Quantity of insulin glargine reference (Lantus® and Toujeo®) and biosimilar (Abasaglar®) prescribed
Reference (Lantus® and Toujeo®)
2016–2017 Qtr 2
2017–2018 Qtr 2 % Change
Primary care 206,310 193,154 -6.4 Secondary care 4,211 3,909 -7.2 Total 210,521 197,063 -6.4 Biosimilar (Abasaglar®)
2016–2017 Qtr 2
2017–2018 Qtr 2 % Change
Primary care 1,949 5,872 201.3 Secondary care 402 486 20.9 Total 2,351 6,358 170.4
Table 27. Insulin glargine biosimilar (Abasaglar®) as a percentage of reference (Lantus® and Toujeo®) and biosimilar prescribed
2016–2017 Qtr 2 2017–2018 Qtr 2 % Change Primary care 0.9 3.0 233.3 Secondary care 8.7 11.1 27.6 Total 1.1 3.1 181.8
Figure 28. Insulin glargine reference (Lantus® and Toujeo®) and biosimilar
(Abasaglar®) percentage change
Figure 29. Insulin glargine reference (Lantus® and Toujeo®) and biosimilar (Abasaglar®) – Quarter ending September 2017
Figure 30. Insulin glargine reference (Lantus® and Toujeo®) and biosimilar (Abasaglar®) as a proportion of total insulin glargine prescribed – Quarter
ending September 2017

Welsh Analytical Prescribing Support Unit
Page 30 of 49
2.6 Total biosimilar usage Within Wales there was an increase in the use of the reported biosimilar medicines (filgrastim, infliximab, etanercept, rituximab and insulin glargine) combined as a percentage of reported ‘reference’ biological medicines plus biosimilars combined, from 6% to 12% for the quarter ending September 2017 compared with the quarter ending September 2016.
Figure 31. Biological reference and biosimilar as a proportion of total reference plus biosimilar prescribed – Quarter ending September 2017

National Prescribing Indicators 2017–2018. Analysis of Prescribing Data to September 2017
Page 31 of 49
3.0 ANTIBIOTICS
Purpose: To encourage the appropriate prescribing of antibiotics. The development of NPIs for antibiotic prescribing supports one of the key elements of the Welsh Antimicrobial Resistance Programme: to inform, support and promote the prudent use of antimicrobials Unit of measure: Proportion of elective colorectal patients receiving surgical prophylaxis for more than 24 hours. Aim: To reduce prescribing.
Due to surgical prophylaxis numbers being small and prone to misinterpretation at hospital level, the data are presented at health board level. Hospital level data are available if required.
• There was no change in the percentage of patients receiving colorectal surgical prophylaxis for greater than 24 hours for quarter ending September 2017 compared with the quarter ending September 2016.
• The largest percentage decreases were in Betsi Cadwaladr UHB (100%) and Abertawe Bro Morgannwg UHB (57%).
• There was a small percentage increase in Cwm Taf UHB (5%). There was also a percentage increase in Aneurin Bevan UHB (67%) and Hywel Dda UHB (400%).
• In Cardiff and Vale UHB all patients were receiving
prophylaxis for less than 24 hours in the quarters ending September 2017 and September 2016.
Table 28. Percentage of patients receiving colorectal surgical prophylaxis for greater than 24 hours
2016–2017 Qtr 2
2017–2018 Qtr 2 % Change
BCU 5% 0% -100 ABMU 35% 15% -57 Cwm Taf 20% 21% 5 Aneurin Bevan 6% 10% 67 Hywel Dda 6% 30% 400 Cardiff and Vale 0% 0% N/A Powys N/A N/A N/A Wales 14% 14% 0
Figure 32. Percentage of patients whose duration of colorectal surgical prophylaxis is > 24 hours
0
5
10
15
20
25
30
35
40
Jun-16 Sep-16 Dec-16 Mar-17 Jun-17 Sep-17
Per
cent
age

Welsh Analytical Prescribing Support Unit
Page 32 of 49
CAUTION WITH INTERPRETING NPI MONITORING DATA Calculations for the percentage difference reported are based on raw data, and values may therefore vary slightly from those calculated from the data tables or graphs, where figures have been rounded up or down. Data for the anticholinergic burden and NSAIDs and CKD NPIs have been provided by Audit+, the GP software tool delivered and supported by the NHS Wales Informatics Service (NWIS). The Medusa data warehouse is reliant on data input by individual hospital pharmacy departments. If the data on a medicine are input under an alternative name to the usual generic or brand name, it may not be identified at extraction. Medusa records the issue of medicines within the secondary care setting in Wales. Where supplies are issued to named patients, it can be assumed that the difference between number of medicines issued and number administered to patients is not significant. However, when the supplies are issued to wards or clinics, these items are often held as stock and therefore may be administered to patients at a considerably later point in time. However, within this report they are only considered for analysis within the time period they were issued.
The report includes medicines supplied by homecare and recorded through the hospital system; medicines supplied through other homecare providers are not included in this report. Therefore some medicines use data may currently be incomplete. This issue is being worked on within NHS Wales as a priority. Medicines supplied through hospitals in England or on FP10HP (issued by hospital clinicians in NHS England) to patients resident in Wales, which do not get issued via Medusa or recorded through CASPA, are not included in this report. Combining data obtained from two different software systems provides challenges, particularly as CASPA and Medusa report data via different measurement criteria. Hence, in order to amalgamate data, total cost of medicine usage is reported for all indicators and, where relevant, other measures such as total quantity, items and number are also reported.

National Prescribing Indicators 2017–2018. Analysis of Prescribing Data to September 2017
Page 33 of 49
GLOSSARY ADQ – The average daily quantity (ADQ) is a measure of prescribing volume based upon prescribing behaviour in England. It represents the assumed average maintenance dose per day for a medicine used for its main indication in adults. The ADQ is not a recommended dose but an analytical unit to compare prescribing activity. DDD – The defined daily dose (DDD), developed by the World Health Organization, is a unit of measurement whereby each medicine is assigned a value within its recognised dosage range. The value is the assumed average maintenance dose per day for a medicine when used for its main indication in adults. A medicine can have different DDDs depending on the route of administration. PU – Prescribing units (PUs) were adopted to take account of the greater need of elderly patients for medication in reporting prescribing performance at both the practice and primary care organisational level.
PRESCRIBING – Although the term ‘prescribing’ is used in this report, the data presented within the primary care section of the report represent prescriptions that have been dispensed and forwarded for pricing. It is assumed that the difference between the number of prescriptions issued and those dispensed is not significant, and that dispensing provides an accurate representation of prescribing. In relation to the secondary care data presented within this report please see information above. STAR-PU – Specific therapeutic group age-sex related prescribing units (STAR-PUs) are designed to measure prescribing weighted for age and sex of patients. There are differences in the age and sex of patients for whom medicines in specific therapeutic groups are usually prescribed. To make such comparisons, STAR-PUs have been developed based on costs of prescribing of items within therapeutic groups.

Welsh Analytical Prescribing Support Unit
Page 34 of 49
APPENDIX 1. AWMSG NATIONAL PRESCRIBING INDICATORS 2017–2018
Primary care indicator Unit of measure Target for 2017–2018
Proton pump inhibitors PPI DDDs per 1,000 PUs Maintain performance levels within the lower quartile, or show a reduction towards the quartile below
Inhaled corticosteroids High strength ICS items as a percentage of all ICS prescribing Maintain performance levels within the lower quartile, or show a reduction towards the quartile below
Hypnotics and anxiolytics Hypnotic and anxiolytic ADQs per 1,000 STAR-PUs Maintain performance levels within the lower quartile, or
show a reduction towards the quartile below
Analgesics
Tramadol DDDs per 1,000 patients Maintain performance levels within the lower quartile, or show a reduction towards the quartile below
Opioid patch items as a percentage of all opioid prescribing Maintain performance levels within the lower quartile, or show a reduction towards the quartile below
Gabapentin and pregabalin DDDs per 1,000 patients Maintain performance levels within the lower quartile, or show a reduction towards the quartile below
Antibiotics
Total antibacterial items per 1,000 STAR-PUs No performance target set; aim for reduction in prescribing year on year, measuring quarter to December only
Co-amoxiclav items per 1,000 patients Co-amoxiclav items as a percentage of total antibacterial items
Maintain performance levels within the lower quartile, or show a reduction towards the quartile below
Cephalosporin items per 1,000 patients Cephalosporin items as a percentage of total antibacterial items
Maintain performance levels within the lower quartile, or show a reduction towards the quartile below
Fluoroquinolone items per 1,000 patients Fluoroquinolone items as a percentage of total antibacterial items
Maintain performance levels within the lower quartile, or show a reduction towards the quartile below
Anticholinergic burden Patients aged 75 and over with an Anticholinergic Effect on Cognition (AEC) score of 3 or more for items on active repeat, as a percentage of all patients aged 75 and over
Maintain performance levels within the lower quartile, or show a reduction towards the quartile below
Non-steroidal anti-inflammatory drugs (NSAIDs)
NSAID ADQs per 1,000 STAR-PUs Maintain performance levels within the lower quartile, or show a reduction towards the quartile below
Number of patients on the CKD register (CKD stage 3–5) who have received a repeat prescription for an NSAID within the last 3 months, as a percentage of all patients on the CKD register. Number of patients who are not on the CKD register but have an eGFR of < 59 ml/min and have received a repeat prescription for an NSAID within the last 3 months, as a percentage of all patients who are not on the CKD register but have an eGFR of < 59 ml/min
Maintain performance levels within the upper quartile, or show an increase towards the quartile above
Yellow Cards Number of Yellow Cards submitted per practice and per health board
Target for GP practice – GPs to submit one Yellow Card per 2,000 practice population. Target for each health board – submit Yellow Cards in excess of one per 2,000 health board population

National Prescribing Indicators 2017–2018. Analysis of Prescribing Data to September 2017
Page 35 of 49
Secondary care indicator Unit of measure
Insulin prescribing Items/number of long-acting insulin analogues expressed as a percentage of total insulin prescribed within primary and secondary care. Prescribing of biosimilars Quantity of biosimilar medicines prescribed as a percentage of total ‘reference’ product plus biosimilar.
Antibiotic surgical prophylaxis Proportion of elective colorectal patients receiving surgical prophylaxis for more than 24 hours.
ADQ = average daily quantity; DDD = defined daily dose; PU = prescribing unit; STAR-PU = specific therapeutic group age-sex related prescribing unit

Welsh Analytical Prescribing Support Unit
Page 36 of 49
APPENDIX 2. PRIMARY CARE NPI PRESCRIBING BY GP CLUSTER
Figure 1. PPI prescribing – Quarter ending September 2016 versus quarter ending September 2017

National Prescribing Indicators 2017–2018. Analysis of Prescribing Data to September 2017
Page 37 of 49
Figure 2. High strength ICS prescribing as a percentage of all ICS prescribing – Quarter ending September 2016 versus quarter ending September 2017

Welsh Analytical Prescribing Support Unit
Page 38 of 49
Figure 3. Hypnotic and anxiolytic prescribing – Quarter ending September 2016 versus quarter ending September 2017

National Prescribing Indicators 2017–2018. Analysis of Prescribing Data to September 2017
Page 39 of 49
Figure 4. Tramadol prescribing – Quarter ending September 2016 versus quarter ending September 2017

Welsh Analytical Prescribing Support Unit
Page 40 of 49
Figure 5. Opioid patch prescribing as a percentage of all opioid prescribing – Quarter ending September 2016 versus quarter ending September 2017

National Prescribing Indicators 2017–2018. Analysis of Prescribing Data to September 2017
Page 41 of 49
Figure 6. Gabapentin and pregabalin prescribing – Quarter ending September 2016 versus quarter ending September 2017

Welsh Analytical Prescribing Support Unit
Page 42 of 49
Figure 7. Antibiotic prescribing – Quarter ending September 2016 versus quarter ending September 2017

National Prescribing Indicators 2017–2018. Analysis of Prescribing Data to September 2017
Page 43 of 49
Figure 8. Co-amoxiclav prescribing – Quarter ending September 2016 versus quarter ending September 2017

Welsh Analytical Prescribing Support Unit
Page 44 of 49
Figure 9. Co-amoxiclav as a percentage of total antibacterial items – Quarter ending September 2016 versus quarter ending September 2017
National Prescribing Indicators 2017–2018. Analysis of Prescribing Data to September 2017
Page 45 of 49
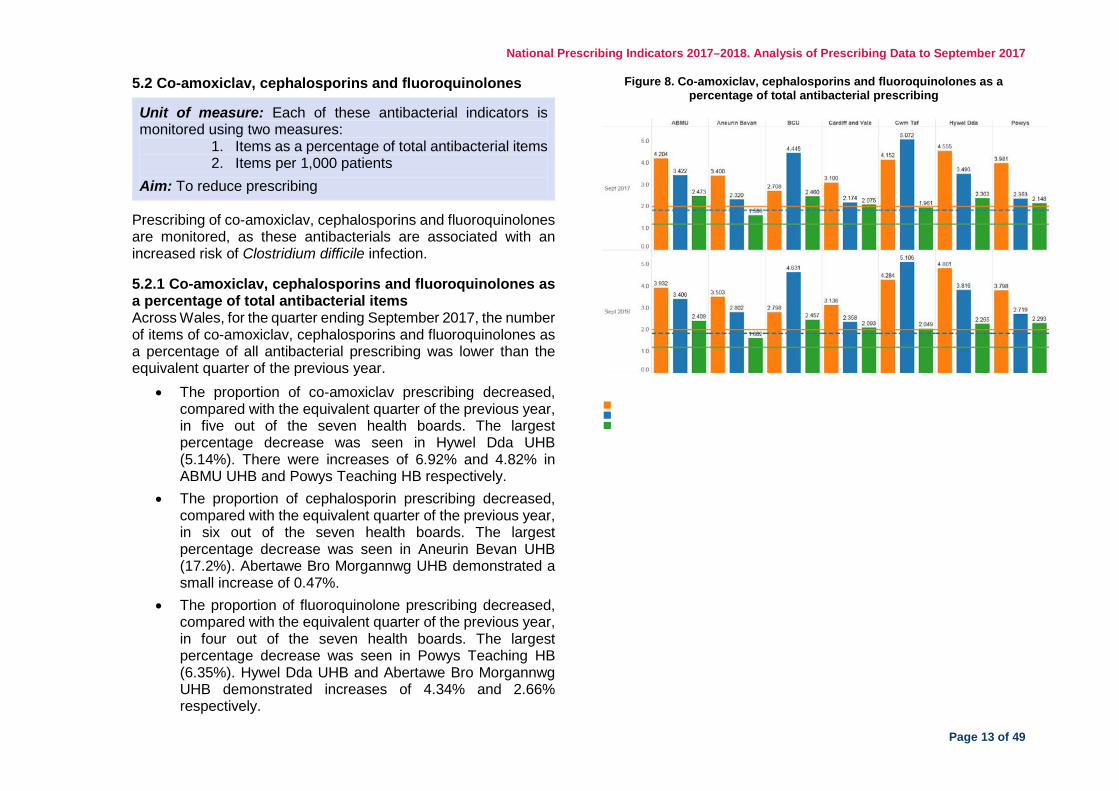
Figure 10. Cephalosporin prescribing – Quarter ending September 2016 versus quarter ending September 2017

Welsh Analytical Prescribing Support Unit
Page 46 of 49
Figure 11. Cephalosporins as a percentage of total antibacterial items – Quarter ending September 2016 versus quarter ending September 2017

National Prescribing Indicators 2017–2018. Analysis of Prescribing Data to September 2017
Page 47 of 49
Figure 12. Fluoroquinolone prescribing – Quarter ending September 2016 versus quarter ending September 2017

Welsh Analytical Prescribing Support Unit
Page 48 of 49
Figure 13. Fluoroquinolones as a percentage of total antibacterial items – Quarter ending September 2016 versus quarter ending September 2017

National Prescribing Indicators 2017–2018. Analysis of Prescribing Data to September 2017
Page 49 of 49
Figure 14. NSAID prescribing – Quarter ending September 2016 versus quarter ending September 2017