National Planning Support Systems Appropriation in Secondary … · 2017. 5. 8. · BENSON MUTINDA...
105
National Planning Support Systems Appropriation in Secondary Cities in Rwanda BENSON MUTINDA MUTUKU February, 2017 SUPERVISORS: Dr.Ir. L.G.J. Boerboom (1 st Supervisor) Dr. M. Madureira (2 nd Supervisor)
Transcript of National Planning Support Systems Appropriation in Secondary … · 2017. 5. 8. · BENSON MUTINDA...

National Planning Support Systems
Appropriation in Secondary Cities in
Rwanda
BENSON MUTINDA MUTUKU
February, 2017
SUPERVISORS:
Dr.Ir. L.G.J. Boerboom (1st Supervisor)
Dr. M. Madureira (2nd Supervisor)

BENSON MUTINDA MUTUKU
SUPERVISORS:
Dr. Ir. L.G.J. Boerboom (1st Supervisor) Dr. M. Madureira (2nd Supervisor)
National Planning Support Systems
Appropriation in Secondary Cities in
Rwanda
Enschede, The Netherlands, February, 2017
Thesis submitted to the Faculty of Geo-Information Science and Earth
Observation of the University of Twente in partial fulfilment of the
requirements for the degree of Master of Science in Geo-Information
Science and Earth Observation.
Specialization: Urban Planning and Management
THESIS ASSESSMENT BOARD Dr. R.V. Sliuzas (Chairperson) Prof. Dr. S. Geertman (External examiner)


DISCLAIMER
This document describes work undertaken as part of a programme of study at the Faculty of Geo-
Information Science and Earth Observation of the University of Twente. All views and opinions expressed
therein remain the sole responsibility of the author and do not necessarily represent those of the Faculty.


i
ABSTRACT
Planning support systems (PSS) are a set of computer-based geo-information tools which consist of special
features that stakeholders within a planning process can utilise for tasks such as analysis, communication
and handling information. These tools have captured the attention of many researchers who have shown
that PSS can be used in various domains such as transport, water management and policy implementation.
Many of the PSS studies have focused on the application at one administrative level (national, regional and
local levels) but little on how PSS can link the different administrative levels. Therefore this study sought to
understand how local governments might appropriate national level PSS tools and outcomes in the local
planning processes. The study used special PSS (SDF’s PSS tools and outcomes) that are part of the Spatial
Development Framework of Rwanda (SDF), a methodology developed to guide spatial development in
Rwanda and help in the implementation of the Rwanda National Urbanisation Policy (NUP). To understand
how PSS can be used in linking national and local levels, the study operationalises the concept of
appropriation. Appropriation is the process by which people make constructive use of an object, in this
study, how people in the districts appropriate SDF’s PSS tools and outcomes within the districts’ planning
processes.
The study was conducted in Rubavu and Musanze districts. The data sources were primarily interviews with
key informants and research workshops with potential PSS users. In total, 10 people were interviewed and 21
staff members participated in the research workshops. Mixed methods (QUAL+quan) were used for data
collection. Data analysis was done using Atlas.ti and SPSS software for qualitative and quantitative data
respectively. The results revealed that existing social-institutional structures and users’ characteristics are likely to
influence PSS appropriation- first, there is a strong institutional framework in the districts with a clear definition
of roles and tasks of the stakeholders involved in the planning processes:- second, bottom-up planning
processes, involving multiple stakeholders at the different administration levels: - and third, a top-down
approach for the plans and policy implementation were directives are established at the top level and passed to
lower levels. The results suggest that the appropriation of SDF’s PSS tools and outcomes can promote better
spatial understanding, and communicate the planning needs in an analytical manner. This can serve to strengthen
regional competition and economic development among the districts in line with national goals and policies (in this
case, NUP). The challenges that may impede the SDF’s PSS appropriation in the districts include issues related
to trust of the SDF tools data and the preparedness of the potential users (in terms of finances, skilled
personnel in PSS application and knowledge of the NUP and the Rwanda SDF).
This study concludes that the appropriation of SDF’s PSS tools and outcomes, which were originally
developed for national use, can be used for policy transfer by the national government and for policy translation
by the districts. The Rwanda SDF implementation may help the national government in planning,
monitoring, and evaluating the transfer of the Rwanda National Urbanisation Policy to the districts. On the
other hand, the districts may appropriate the SDF’s PSS tools and outcomes in translating the Rwanda
National Urbanisation Policy and other local plans within the districts’ planning contexts. The SDF’s PSS
appropriation in the districts can happen in two ways. First, the vertical appropriation where the national
government transfers the SDF’S PSS tools and outcomes to early adopters in the districts and second,
horizontal appropriation were early adopters in the districts translate the PSS to the late adopters in the
districts. The study recommends an appropriation of the Rwanda SDF’s PSS tools and outcomes both in
national and district governments.
Key words: Appropriation, PSS, EAST, Planning processes, Policy translation, SDF, NUP, Districts,
Rwanda.

ii

iii
ACKNOWLEDGEMENTS
My gratitude to God Almighty for the strength and grace to undertake this study successfully. To the believer
and followers of Jesus Christ, relatives and friends who prayed for me faithfully, may God bless you richly
reward you. I wish to sincerely thank the Netherland Fellowship Program for giving me the scholarship and
a chance to actualise my dream. My heartfelt appreciation to my supervisors Dr. Luc Boerboom and Dr.
Mafalda Madureira whose experience in planning support systems, regional planning, governance and
human geography have shaped this study. You advised me, reviewed my work and held my hand all along -
I say, thank you. To the rest of ITC staff and UPM teaching staff, I appreciate the yearlong preparation and
training that qualified me to be a researcher. I say, thank you.
I wish to convey my appreciation to Director General, Rwanda Housing Authority, Ir. Didier Sagashya for
allowing your staff to help me in organising my research workshops and providing necessary support during
my data collection. I highly acknowledge your support. My sincere thanks to Catherine Kalisa of UN-Habitat
Rwanda, Theophile Mutaganda of Rwanda Housing Authority, Directors Human Resource, Planning and
One Stop Centre Units, and the staff in Rubavu and Musanze districts for the support during my data
collection period.
To my ITC comrades, I wish to acknowledge your support too. The ITC-UPM class of 2017 who gave me
a chance to serve them as class representative. We had a nice time throughout the MSc course and you all
shaped me to be a good listener and leader. My friends Chuks Otioma, Jacob Onyimbi, Grachen Oneko,
Ebrima Manneh and Dorothy Kaaya, you have been an inspiration throughout this thesis period. I say
thank you. Special thanks to Rwandan community at ITC for support in my post-fieldwork analysis. Mr.
Oscar Gasuku and Emmanuel Nyandwi, thank you for your unmeasurable support. Finally, to the Kenyan
community in ITC, you have been a family away from home. Your unity and support have been a strength
throughout my studies. I wish to express my gratitude to all of you fellow Kenyans.

iv

v
DEDICATION
I dedicate this thesis to my beloved family:
Mbaa Kilele Mwai
Your love has kept me strong.
And
The people of the Republic of Rwanda:
Your hardworking spirit and hospitality have inspired me to write this thesis.
Abanyarwanda, Murakoze!

vi

vii
TABLE OF CONTENTS
Abstract................................................................................................................................................................................................ i
Acknowledgements........................................................................................................................................................................iii
Dedication..........................................................................................................................................................................................v
Table of contents .......................................................................................................................................................................... vii
List of figures ...................................................................................................................................................................................ix
List of tables .....................................................................................................................................................................................xi
List of acronyms ........................................................................................................................................................................... xii
1. INTRODUCTION ..............................................................................................................................................................1
1.1. Background and justification................................................................................................................... 1
1.2. Research problem ..................................................................................................................................... 2
1.3. Research objectives and questions ......................................................................................................... 3
1.3.1. Main objective ........................................................................................................................................... 3
1.3.2. Sub – objectives and research questions ............................................................................................... 3
1.4. Conceptual framework ............................................................................................................................. 4
1.5. Research design ......................................................................................................................................... 5
1.6. Thesis structure ......................................................................................................................................... 6
2. LITERATURE REVIEW .................................................................................................................................................7
2.1. Introduction ............................................................................................................................................... 7
2.2. Theoretical background ........................................................................................................................... 7
2.2.1. Adaptive Structuration Theory ............................................................................................................... 7
2.2.2. Enhanced Adaptive Structuration Theory ............................................................................................ 8
2.3. What are planning support systems (PSS)? ........................................................................................... 9
2.3.1. GIS, PSS and DSS .................................................................................................................................... 9
2.3.2. PSS in planning process ........................................................................................................................ 10
2.4. Application of PSS in urban governance ........................................................................................... 11
2.5. Policy translation and institutionalisation .......................................................................................... 12
2.6. Planning in Rwanda ............................................................................................................................. 13
2.6.1. The National Urbanisation Policy (NUP) .......................................................................................... 13
2.6.2. The Spatial Development Framework of Rwanda ........................................................................... 14
2.6.3. Some of the SDF’s PSS outcomes and tools discussed with the districts’ staff .......................... 15
3. RESEARCH METHODOLOGY .............................................................................................................................. 21
3.1. Selection of study area ........................................................................................................................... 21
3.1.1. Rubavu district ........................................................................................................................................ 21
3.1.2. Musanze district ..................................................................................................................................... 21
3.2. Research strategy .................................................................................................................................... 23
3.2.1. Data sources ............................................................................................................................................ 23
3.2.2. Sampling strategy ................................................................................................................................... 24
3.3. Data collection methods ....................................................................................................................... 24
3.4. Data analysis methods ........................................................................................................................... 27
3.5. Ethical issues ........................................................................................................................................... 27
viii
4. RESULTS AND DISCUSSION: PLANNING IN THE DISTRICTS ........................................................ 29
4.1. Introduction ............................................................................................................................................. 29
4.2. Governance and structure of the districts .......................................................................................... 29
4.3. Stakeholders in the districts’ planning process .................................................................................. 30
4.3.1. Key stakeholders ..................................................................................................................................... 30
4.3.2. Roles of stakeholders in the districts ................................................................................................... 31
4.4. Outcomes of districts planning processes .......................................................................................... 32
4.4.1. The Master Plan ...................................................................................................................................... 32
4.4.2. District Development plan (DDP) ...................................................................................................... 33
4.4.3. Performance contracts (Imihigo) ......................................................................................................... 34
4.4.4. Annual Action plans ............................................................................................................................... 36
4.4.5. Medium term expenditure framework (MTEF): ............................................................................... 36
4.5. Implementation of planning processes outcomes ............................................................................. 37
4.6. Discussion ................................................................................................................................................ 38
5. RESULTS AND DISCUSSION: APPROPRIATION OF PSS OUTCOMES AND TOOLS .......... 41
5.1. Introduction ............................................................................................................................................. 41
5.2. Perception of PSS outcomes and tools usefulness ............................................................................ 41
5.2.1. Perception on SDF’s PSS outcomes.................................................................................................... 42
5.2.2. Positive perception on the SDF’s PSS tools ...................................................................................... 43
5.2.3. Negative perception on the SDF’s PSS tools ..................................................................................... 44
5.3. PSS within districts planning processes .............................................................................................. 45
5.4. PSS appropriation within the districts’ Units ..................................................................................... 46
5.5. Discussion ................................................................................................................................................ 47
6. RESULTS AND DISCUSSION: NATIONAL PSS APPROPRIATION IN THE DISTRICTS ..... 49
6.1. Introduction ............................................................................................................................................. 49
6.2. SDF’s PSS capabilities appropriation .................................................................................................. 49
6.3. User – Designer knowledge gap ........................................................................................................... 52
6.4. Potential challenges for PSS appropriation in the districts .............................................................. 53
6.5. Discussion ................................................................................................................................................ 55
7. CONCLUSIONS AND RECOMMENDATIONS ............................................................................................. 57
7.1. Conclusions ............................................................................................................................................. 57
7.2. Study limitations...................................................................................................................................... 58
7.3. Contribution to policy ............................................................................................................................ 59
7.4. Contribution to research ....................................................................................................................... 60
LIST OF REFERENCES ........................................................................................................................................................ 63
APPENDICES ............................................................................................................................................................................. 69
Appendix 1: Questionnaire ............................................................................................................................... 69
Appendix 2: Semi-structured interview .......................................................................................................... 71
Appendix 3: Workshop participants invitation ............................................................................................. 73
Appendix 4: Workshop details ......................................................................................................................... 74
Appendix 5: Qualitative analysis results.......................................................................................................... 86
Appendix 6: Quantitative analysis results ....................................................................................................... 86
Appendix 7: Literature search strategy ............................................................................................................ 87
Appendix 8: Workplan ...................................................................................................................................... 88

ix
LIST OF FIGURES
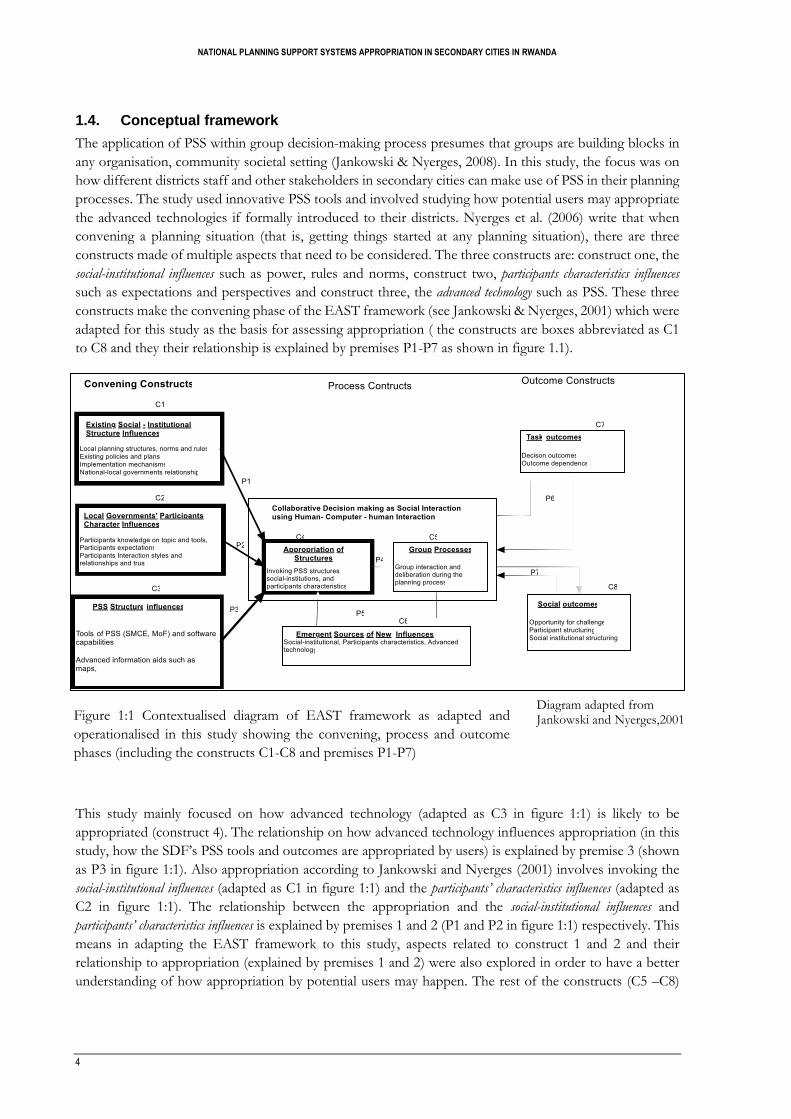
Figure 1:1 Contextualised diagram of EAST framework as adapted and operationalised in this study showing
the convening, process and outcome phases (including the constructs C1-C8 and premises P1-P7) ............. 4
Figure 1:2 Research design diagram showing the main steps involved in the study .......................................... 5
Figure 2:1 The SDF methodology flowchart ......................................................................................................... 14
Figure 2:2 SDF outcome showing the three urban settlement typology: local, intermediate and main urban
centres which are based on Rwanda demographic data ....................................................................................... 16
Figure 2:3 SDF outcome showing the Rwanda socio-economic linkages in an isopleth map which is based
in Rwanda demographic data. ................................................................................................................................... 16
Figure 2:4 SDF outcome showing the districts’ economic potentialities across the whole of Rwanda ....... 17
Figure 2:5 SDF outcome showing the emerging spatial structures in Rwanda ................................................ 17
Figure 2:6 An Extract of the matrix of function showing the data entry window with list of provinces,
districts and sectors on the rows and the functions list and categories in the columns. ................................. 18
Figure 2:7 Image of the ILWIS SMCE window showing the criteria tree, the three objectives under
economic pillar economic tree, their weights, the sub-objectives and the outputs in form of raster maps at
far right. ........................................................................................................................................................................ 18
Figure 2:8 A composite index map showing the Economic pillar performance in Rwanda overlaid with the
roads layer shown in grey and the study area Sectors boundaries layers shown in black. .............................. 19
Figure 3:1 A map of Rubavu district showing the 12 Sectors, and other physical features ........................... 22
Figure 3:2 A map of Musanze district showing the 15 Sectors and the urban area ......................................... 23
Figure 3:3 Interview session with the Building Inspector, Rubavu district ....................................................... 25
Figure 3:4 Interview session with the Director of Planning, Monitoring and Evaluation Unit, Rubavu district
....................................................................................................................................................................................... 25
Figure 3:5 A workshop in Musanze showing the introduction session ............................................................. 26
Figure 3:6 Participants interacting with the MoF outcome in a printed format............................................... 26
Figure 4:1 Structure of the districts in Rwanda showing the existing Units ..................................................... 29
Figure 4:2 Atlas.ti analysis results showing the key stakeholders involved in the districts’ planning processes
....................................................................................................................................................................................... 30
Figure 4:3 The steps followed in master plan preparation process and review process ................................. 33
Figure 4:4 DDP Preparation process in the districts ............................................................................................ 34
Figure 4:5 The Imihigo preparation process and the flow of information in a bottom – up approach various
administration levels ................................................................................................................................................... 35
Figure 4:6 A diagram showing the link between MTEF to national and district planning and budgetary
processes, stakeholders involved and actions at various phases ......................................................................... 37
Figure 5:1 Box plot presentation for perception of workshop participants on the SDF’s PSS tools and
willingness to appropriate .......................................................................................................................................... 41

x
Figure 5:2 Box plot presentation of participants’ perceptions of the effectiveness of the workshop sessions
........................................................................................................................................................................................ 47
Figure 6:1 Visualising the green transport status in Rwanda as presented in SDF outcomes ........................ 50
Figure 6:2 An extract of the visualisation of EICV 3 data on transport accessibility showing better
performance in Musanze than Rubavu .................................................................................................................... 51
Figure 6:3 Questionnaire results showing the challenges that may impede SDF’s PSS tools appropriation in
the districts. .................................................................................................................................................................. 54

xi
LIST OF TABLES
Table 3:1 Primary and secondary data needed and their sources ....................................................................... 24
Table 3:2 Research ethical issues and potential solution used in this study ...................................................... 28
Table 4:1 Role of some stakeholders in planning processes as identified from the interviews results and
secondary materials and considered relevant for SDF’s PSS appropriation in the districts. .......................... 31
Table 4:2 Stakeholders in the DDP implementation, their reporting method, and duration. ...................... 38
Table 5:1 Summary on how PSS tools and outcomes can be applied within the planning processes across
the administration levels. ........................................................................................................................................... 45

xii
LIST OF ACRONYMS
AAP Annual Action Plan
AST Adaptive Structuration Theory
CIM Centre for International Migration
DDP District Development Plan
DSS Decision Support Systems
EAST Enhanced Adaptive Structuration Theory
EDPRS-2 Second Economic Development and Poverty Reduction Strategy
GIS Geographic Information System
ICT Information and Communication Technology
IMF International Monetary Fund
ITC Faculty of Geo-Information Science and Earth Observation at the University of Twente, the Netherlands
JADF Joint Action Development Forum
MIFOTRA Ministry of Service and Labour
MINALOC Ministry of Local Governments
MININFRA Ministry of Infrastructure, Rwanda
MoF Matrix of Functions
MTEF Medium-Term Expenditure Framework
NUP National Urbanisation Policy
PPD Project Profile Document
PSF Private Sector Federation
PSS Planning Support Systems
RHA Rwanda Housing Authority
RNRA Rwanda Natural Resources Authority
SDF Spatial Development Framework
SDGs Sustainable Development Goals
SDP Sector Development Plan
SIP Strategic Issue Paper
SMCE Spatial Multi- Criteria Evaluation
TAM Technology Acceptance Model
UTAUT Universal Theory of Acceptance and Use of Technology
NATIONAL PLANNING SUPPORT SYSTEMS APPROPRIATION IN SECONDARY CITIES IN RWANDA
1
1. INTRODUCTION
1.1. Background and justification
Technological advancement in the recent past has contributed to the development of specialised tools. Such
tools include Planning Support Systems (PSS) in the Geo technology domain that are designed to support
stakeholders involved in any planning task (Geertman & Stillwell, 2009). PSS have been used in various
domains such as transport (Te Brömmelstroet & Schrijnen, 2010), policy implementation (Batenburg &
Bongers, 2001), water resource planning (Garriga, de Palencia, & Foguet, 2015; Giupponi & Sgobbi, 2013;
Nyerges et al., 2016; Nyerges, Jankowski, Tuthill, & Ramsey, 2006). Nevertheless, different users in these
domains have appropriated PSS differently.
Appropriation is a concept that traces its root in philosophical studies on how humans control and change
the natural environment in order to advance the human society, in other words, appropriation seeks to
understand the subject-object relationship where the user (subject), must realise the object and make
meaningful use of it progressively in a constructive manner (DeSanctis & Poole, 1994). In technology,
appropriation can be defined as how people make use of technology and at the same time how people
continuously change that technology in adapting it to meet their needs (Jankowski & Nyerges, 2001).
Understanding how advanced technologies such as PSS are appropriated constructively needs a longer
period of time in order to establish a meaningful study on the use of such technologies (DeSanctis & Poole,
1994). However, several theories and scientific works can help new studies in building scientific claims on
chances of appropriating a new technology and likeliness of its success within any planning context.
Several studies have shown that appropriation of PSS can happen at different planning levels. This includes
municipal level (Elbeltagi & Mcbride, 2005), city level (Te Brömmelstroet & Schrijnen, 2010; Todes, 2012)
or national level (Boerboom, Gibert, Spaliviero, & Spaliviero, 2015). Indeed, a lot has been done to show
how PSS can help planning stakeholders in executing specific planning tasks and add value to a planning
process at specific administrative level (Geertman & Stillwell, 2009; Pelzer, Geertman, Heijden, & Rouwette,
2014).
However, planning tends to be hierarchical, developing down from national to local levels. Many PSS tools
are developed to meet specific policy concerns at a certain level of this hierarchy. Surprisingly, little has been
done to show how PSS can help in aligning national and local planning goals (see literature search strategy
table in appendix 7). In many governmental organisations, for example, policies, strategies and development
goals are formulated at the national level and expected to be implemented across the country. Therefore,
there is a need to study how national PSS tools are used at local levels and how meaningful are the outcomes
to the targeted users. Although Pelzer, Geertman and Heijden (2015) do not consider explicitly the issue of
hierarchy in planning, they recommend that PSS should be studied in a broader context of application not
just within a specific domain.
Several approaches have been applied in PSS appropriation studies to engage potential PSS users. Many
studies have recommended the incorporation of potential users in the designing and developing the PSS
(Batenburg & Bongers, 2001; Olafsson & Skov-Petersen, 2014; Te Brömmelstroet & Schrijnen, 2010). The
approaches aim to ensure that the interests of potential users are matched with the skills of the developers.
Surprisingly, there is no clear contribution of any empirical work on how PSS can be appropriated across

NATIONAL PLANNING SUPPORT SYSTEMS APPROPRIATION IN SECONDARY CITIES IN RWANDA
2
the hierarchy of planning that is, from national to local levels. Therefore, there is a need to understand how
national PSS could be appropriated at local levels.
With this regard, this study contributes to understanding how national PSS tools hereby referred to as SDF
PSS, can be appropriated at local levels (districts in Rwanda). These questions can be answered from a
theoretical argumentation as well as empirically through a research with the potential users. Many PSS testing
happens in laboratories which have contributed to the poor widespread use of PSS (Reinig & Shin, 2002).
This study went beyond such a limitation and experimented with the potential users who according to
Batenburg and Bongers (2001) understand the existing planning hierarchy, specific needs and problems in
their domains. Goodspeed (2016) argues that field studies are needed to complement the results obtained
from laboratory studies in order to capture the complexity of planning stakeholders (Goodspeed, 2016).
A PSS appropriation study is arguably most relevant in Rwanda. Rwanda is ranked number one in
government success in promoting ICT in Africa according to Global Information Technology Report of
2015 (World Economic Forum, 2015). Rwanda has made significant achievements in the use of advanced
technologies in its national organisations. Some of these achievements include the development of a national
Geoportal (RNRA, 2016) and Geodatabase in the Ministry of Infrastructure (MININFRA, 2016b). More
significantly, Rwanda has developed a national spatial planning methodology hereby referred to as the Spatial
Development Framework of Rwanda (SDF), which is targeted to support the implementation and
actualisation of the National Urbanization Policy (NUP). However, little has been done to understand how
national policies and initiatives are actualised in districts and secondary cities in Rwanda. This study,
therefore, contributes to understanding how the national PSS (focusing on the tools and their outcomes)
will be appropriated by secondary cities, in the process enhance the link between urban areas, and contribute
to the implementation of the NUP. One of the goals of the NUP is to promote urbanisation and economic
growth in the secondary cities through prioritisation and preparation for good governance (MININFRA,
2015). This study contributes to understanding how the use of advanced technologies such as PSS can help
in achieving the NUP goals.
1.2. Research problem
The use of PSS in the recent past has increased and diversified to different disciplines. PSS have been used
in areas such as water management (Garriga et al., 2015; Nyerges et al., 2006), transport planning (Todes,
2012), local governments’ planning process (Arciniegas & Janssen, 2012), urban public policy assessment
(Bakker & Jacob Trip, 2013), tourism and recreational planning (Lekies, Yost, & Rode, 2015). However, a
few gaps are noticeable from the PSS literature. First, the appropriation of PSS appears to be targeted to a
specific purpose within a specific discipline. Secondly, while planning is a hierarchical process, there is little
work done to show how the appropriation of national plans and tools occurs at the local level. The question
arising surrounds the contextual use of PSS at the local level and subsequently the need to understand how
local governments make use of national plans, PSS tools and the associated outcomes. Therefore, there is a
need to understand the link between national and local level as well as contextual issues that may contribute
to success or failure in appropriating these planning tools and outcomes in the local planning processes.
Various issues affect PSS appropriation. Such issues include the technology itself, the dynamics of the
potential users ( their skills and background), willingness to appropriate (Wang, Ying, Jiang, & Klein, 2006),
cultural issues (Elbeltagi & Mcbride, 2005), and the reliability of decision outcomes (Baud, Scott, Pfeffer,
Sydenstricker-Neto, & Denis, 2015; Huber, 1984). However, little research efforts have been put into
understanding how the above issues at local levels are likely to influence the national level PSS appropriation.

NATIONAL PLANNING SUPPORT SYSTEMS APPROPRIATION IN SECONDARY CITIES IN RWANDA
3
A deeper understanding of the local level (secondary cities) users’ characteristics, their needs and planning
processes will go a long way in helping the national government in implementing the national policies (NUP)
and the appropriation of the SDF’s PSS tools. Given the growing use of geospatial data in Rwanda and the
need to implement the National Urbanisation Policy (NUP) at secondary cities, there is a need for research
on how secondary cities will appropriate national PSS tools and make use of the outcomes within their local
contexts. This study’s findings should give insights to government authorities and other stakeholders on
how national PSS tools and their outcomes are meaningfully utilised at local levels and perhaps show the
importance of SDF in the implementation of NUP.
1.3. Research objectives and questions
1.3.1. Main objective
The main objective of this study was to understand how local governments might appropriate national level
PSS tools and outcomes in the local planning processes.
1.3.2. Sub – objectives and research questions
1. To understand the local planning processes in Rubavu and Musanze cities.
1.1 Who are the people involved in local planning processes and their roles?
1.2 What are the local planning procedures and processes?
1.3 What are the outputs of the local planning processes?
1.4 In which ways are the outputs of the local planning processes implemented?
2. To discuss how secondary cities can make a meaningful appropriation of PSS outcomes and tools in
their local planning processes
2.1. What is the perception of local governments on the usefulness of PSS outcomes and tools?
2.2. Where is PSS likely to be appropriated within the local planning procedures and processes?
2.3. By which Units1 are PSS perceived more useful in Rubavu and Musanze districts?
3. To understand how the national PSS tools are likely to be appropriated by users in the secondary cities.
3.1. How can potential users appropriate the capabilities of the PSS tools?
3.2. What are the user- expert knowledge gaps that may affect the appropriation of PSS in the districts?
3.3. What challenges are likely to hinder appropriation of PSS tools in Rubavu and Musanze
3.4. What recommendations can be made regarding PSS appropriation in Rubavu and Musanze cities
1 Unit refers to an administrative entity in the districts that is headed by a director and consist of several departments. Each unit is mandated to carry out specific domain tasks such as governance, education, health, agriculture, and finance.
NATIONAL PLANNING SUPPORT SYSTEMS APPROPRIATION IN SECONDARY CITIES IN RWANDA
4
1.4. Conceptual framework
The application of PSS within group decision-making process presumes that groups are building blocks in
any organisation, community societal setting (Jankowski & Nyerges, 2008). In this study, the focus was on
how different districts staff and other stakeholders in secondary cities can make use of PSS in their planning
processes. The study used innovative PSS tools and involved studying how potential users may appropriate
the advanced technologies if formally introduced to their districts. Nyerges et al. (2006) write that when
convening a planning situation (that is, getting things started at any planning situation), there are three
constructs made of multiple aspects that need to be considered. The three constructs are: construct one, the
social-institutional influences such as power, rules and norms, construct two, participants characteristics influences
such as expectations and perspectives and construct three, the advanced technology such as PSS. These three
constructs make the convening phase of the EAST framework (see Jankowski & Nyerges, 2001) which were
adapted for this study as the basis for assessing appropriation ( the constructs are boxes abbreviated as C1
to C8 and they their relationship is explained by premises P1-P7 as shown in figure 1.1).
This study mainly focused on how advanced technology (adapted as C3 in figure 1:1) is likely to be
appropriated (construct 4). The relationship on how advanced technology influences appropriation (in this
study, how the SDF’s PSS tools and outcomes are appropriated by users) is explained by premise 3 (shown
as P3 in figure 1:1). Also appropriation according to Jankowski and Nyerges (2001) involves invoking the
social-institutional influences (adapted as C1 in figure 1:1) and the participants’ characteristics influences (adapted as
C2 in figure 1:1). The relationship between the appropriation and the social-institutional influences and
participants’ characteristics influences is explained by premises 1 and 2 (P1 and P2 in figure 1:1) respectively. This
means in adapting the EAST framework to this study, aspects related to construct 1 and 2 and their
relationship to appropriation (explained by premises 1 and 2) were also explored in order to have a better
understanding of how appropriation by potential users may happen. The rest of the constructs (C5 –C8)
Figure 1:1 Contextualised diagram of EAST framework as adapted and
operationalised in this study showing the convening, process and outcome
phases (including the constructs C1-C8 and premises P1-P7)
Diagram adapted from Jankowski and Nyerges,2001

NATIONAL PLANNING SUPPORT SYSTEMS APPROPRIATION IN SECONDARY CITIES IN RWANDA
5
and the premises (P4 –P7) that are part of the process and outcome2 phases are assumed constant in the
scope of this study.
Since this study involved studying small groups and how they are likely to appropriate PSS within their
planning processes, EAST theory is perhaps the most suitable in explaining appropriation concept. This is
because the convening phase constructs (see figure 1.1) can help in understanding how the districts are
organised, the people from the districts who will use the PSS and the kind of PSS tools that they can utilise
in their planning.
1.5. Research design
The research design presented in figure 1.2 summarises the main steps followed in carrying out this research.
The first step shows how the research was conceived based on a literature review and study of existing
policies in Rwanda. The materials served to scientifically define and frame the research problem, objectives
and scientific methods that were used to answer the research questions. In addition, the existing SDF tools,
outcomes, data and reports were reviewed and helped to define the SDF outcomes and tools that were used
for data collection. This knowledge also helped in choosing the other data collection methods. The second
step was preparation for fieldwork and data collection exercise in Rwanda that involved designing the data
collection instruments and SDF’s PSS tools and outcomes that were used for the research workshops. The
third step was the actual fieldwork exercise, which was carried out in two phases.
The first phase included collecting secondary data and interviewing government officials in Rubavu and
Musanze in order to understand local planning processes, stakeholders involved and the main planning
outcomes in the districts (this was relevant in answering research objective one). Phase two involved
research workshops sessions where SDF’s PSS outcomes and tools were shown to the districts’ staff
members who were invited for workshops to discuss the applicability of SDF’s PSS outcomes and tools in
their local planning (this was relevant to answer objective two and three). This phase involved focus group
discussion about SDF’s PSS outcomes, interactive session of using SDF’s PSS tools and then personal
2 Outcomes: refers to the long term results of using technology which reflect changes in the social structure and how people handle tasks after the introduction of the technology. This shouldn’t be confused with SDF outcomes which are part of the introduced advanced technology (PSS).
Figure 1:2 Research design diagram showing the main steps involved in the study

NATIONAL PLANNING SUPPORT SYSTEMS APPROPRIATION IN SECONDARY CITIES IN RWANDA
6
feedback session through a self-administered questionnaire. The final step of this research involved data
analysis and answering the research questions leading to conclusions and recommendations.
1.6. Thesis structure
This research work is organised in chapters.
Chapter 1: The first chapter introduces the research topic and gives background and justification, research
problem, objectives and the study outline.
Chapter 2: The second chapter explores the key concepts and terminologies related to appropriation of
PSS. This includes literature on the theoretical background, PSS appropriation and institutionalisation, latest
evolution of PSS and their application as well as contextual analysis of Rwanda with regard to PSS potential
application.
Chapter 3: The third chapter discusses the research method. This include choice of the study area, research
strategy, data collection techniques, data analysis techniques, and a reflection on ethical issues related to the
study.
Chapter 4: Chapter four presents the results and discussion related to the planning in Rubavu and Musanze
districts, focusing on the stakeholders involved and their roles, the planning processes and the outcomes of
those processes, and how are the outcomes of districts planning processes implemented, i.e. answering the
first research objective.
Chapter 5: Chapter five presents the findings and discussion related to how districts can make meaningful
use of the SDF’s PSS tools and outcomes, where in the districts’ planning processes can the tools and
outcomes be appropriated and by which Units are the tools and outcomes perceived more useful, i.e.
answering second research objective.
Chapter 6: Chapter six discusses the findings and results on understanding how the SDF’S PSS capabilities
are appropriated by users in the districts, the local users- expert knowledge gap and the observed potential
challenges that may influence the SDF’S PSS appropriation, i.e. answering the third research objective.
Chapter 7: Chapter seven outlines the conclusions, the contribution of this study to the research community
and to the policy, and finally some recommendations for further research. Supportive materials and data
used in this research are provided in the appendices.

NATIONAL PLANNING SUPPORT SYSTEMS APPROPRIATION IN SECONDARY CITIES IN RWANDA
7
2. LITERATURE REVIEW
2.1. Introduction
The concept of appropriation was first explained by philosophers Hegel and Marx to illustrate how people
continuously learn to control and change the natural environment they live in and in return, how this
changed human society. In other words, the concept is based on object – subject relationship with the main
attention on the process of making constructive use of the object and how it successfully enters human
activities (Poole & DeSanctis, 1989). Over time, the concept of appropriation has been applied differently
in different disciplines such as advanced technologies. This section presents key literature used in the
appropriation of planning support systems as an advanced technology being introduced to an organisation.
The focus is centred on a theoretical framework that informed the researcher’s approach in carrying out the
study. First, the focus is on appropriation theories applied to the field of organisational studies, followed
by the concept of PSS, relating PSS to policy translation and governance, and then focusing on the planning
context in Rwanda.
2.2. Theoretical background
A theory is an array of constructs that are well organised to explain a certain phenomenon (Silverman, 2005).
Several theories have been put forward to explain how technology is appropriated by organisations. These
theories emerge from various disciplines such as sociology, information science, psychology and in the
recent past, participatory GIS. Delaney (2010) devoted a whole chapter in his work to explore literature on
the appropriation of information and technology. Although his work focused on the appropriation of
information systems, it gives a grounded exploration of existing theories. Delaney (2010) further categorised
the theories into three groups based on the theoretical background. These include adoption theories
(Technology Acceptance Model (TAM) and Universal Theory of Acceptance and Use of Technology (UTAUT)),
sociocultural theories (Participatory Appropriation) and Appropriation theories (Adaptive Structuration Theory
(AST), Structuration Model of Technology, and Technology Appropriation Model) (Berend, 2013). This study focused
on appropriation theories namely Adaptive Structuration Theory (AST) and Enhanced Adaptive Structuration
(EAST) that focuses on processes of appropriating new technology within organisations. Furthermore, the
focus was turned to a specific technology (GIS- technology) used in Planning Support Systems.
2.2.1. Adaptive Structuration Theory
Adaptive structuration theory (AST) draws from the concepts of structuration (Giddens, 1984) and
appropriation (Ollman, 1971) to explain the technology and people interaction. The way to understand how
people make use of an advanced technology, especially in a group setting is by focusing on how the people
adapt to the technology. DeSanctis and Poole (1994) adapted Giddens’ structuration theory in explaining
how people adapt to advanced technology, specifically group decision support system. When technology is
introduced to any organisation, it brings new social structures (patterns of social relationships) which are
embedded in the structural features and the spirit of the technology (DeSanctis & Poole, 1994)
Structural features refer to those specific rules, resources and capabilities that a technology presents (DeSanctis
& Poole, 1994). Examples of such structural features include the ability of a PSS to record videos, audios,
support voting by users and multiple visualisation modes. On the other hand, the spirit can be defined as the
general intent based on the objective and purpose of a given structural feature (Berend, 2013). The spirit is
seen as a property of the technology that is presented to users, defining how to act when using the system,

NATIONAL PLANNING SUPPORT SYSTEMS APPROPRIATION IN SECONDARY CITIES IN RWANDA
8
how to interpret the features or explore the technology. In addition, AST explains that when people use
technology, they create a perception about the importance, the role and the usefulness of the technology
(Jankowski & Nyerges, 2001). Therefore, AST can be utilised to study the structures that advanced
technologies introduce to an organisation and the new structures that are likely to emerge as people use
these technologies. Several studies have confirmed the claim of DeSanctis and Poole (Berend, 2013) while
others introduce new theories (Jankowski & Nyerges, 2001). AST serves as the mainstay for Enhanced
Adaptive Structuration Theory (EAST) that Jankowski and Nyerges use to explain how an advanced
technology is appropriated in organisations.
2.2.2. Enhanced Adaptive Structuration Theory
This study aimed to understand how local governments (districts) will appropriate PSS tools and in so doing
implement national policies. The attention is to see the relevance of PSS tools as an advanced technology in
helping local governments understand and implement national policies in Rwanda. In addition, this study
touches on planning processes that are complex activities involving various stakeholders. This study was
considerate of the dynamics of planning processes thus; the use of EAST was relevant to understand
decision-making dynamics in a group, organisation or community setting. However, the EAST was adapted
to capture the elements of PSS which are different from the DSS as studied by Jankowski and Nyerges
(these differences are highlighted in section 2.3.1) although the concept of adaptive structuration remains
the same as borrowed, originally from AST and other frameworks. That means in EAST the constructs (the
C’s boxes in figure 1.1), the premises (the P’s in figure 1.1) and aspects (the texts inside the boxes in figure
1.1) are majorly borrowed from AST hence the name Enhanced AST.
The EAST was adapted to help position this study theoretically (see section 1.4). The EAST developed eight
constructs, seven premises and twenty-one aspects (many of which are drawn from AST). Constructs refer to
mental abstractions that are used to explain some phenomenon of interest (Merriam-Webster). The premises
are statements that show the relationship between the aspects. In EAST, premises show how aspects of the
subject construct relate to aspects of the object constructs. The premises are used in empirical studies to explore
how some variables relate to each other (Jankowski & Nyerges, 2001). The aspects are the observable variables
that build up the constructs. Jankowski and Nyerges (2001) also points out that when EAST is used in
empirical research, some aspects, by means of premises may be more important than others. The importance
depends on the research design and the focus of the study that explains why the EAST was partially adapted
in this study to understand appropriation concept (see section 1.4).
To help researchers in understanding the theory, Jankowski and Nyerges positioned the EAST constructs
into three phases namely: convening, process and outcomes constructs (see figure 1:1). The convening phase is
concerned with the initial stages of the interaction between the users and the new technology. The convening
phase includes three constructs aimed at understanding social-institutional structures (policies, laws, norms and
power), group participants influence (local governments’ officials and other stakeholders relation, trust,
perspectives and expectations) and technology influence (relating to PSS tools and their outcomes). The process phase
involves decision-making and social interaction using human- computer-human interaction. The process phase
includes three constructs namely structure appropriation, group process and emergent influence. The outcome phase
includes two constructs namely task outcome and social outcome (Jankowski & Nyerges, 2001). Phase 2
and 3 takes a longer period of time to study in order to understand the appropriation (DeSanctis & Poole,
1994). Given the nature of this research, the study focused on convening phases to understand how
appropriation might happen. According to Jankowski and Nyerges, appropriation is affected by three
aspects that are related to the convening constructs.
The first aspect that affects appropriation relates to social institutional structures. This relates to existing
organisational policies, power, norms and the ways of doing things. In any given organisation, there is

NATIONAL PLANNING SUPPORT SYSTEMS APPROPRIATION IN SECONDARY CITIES IN RWANDA
9
established a mechanism that dictates how people relate and respond to new ideas and challenges. Jankowski
and Nyerges (2001) explains that technology being appropriated is likely to alter or completely change how
people relate and communicate when faced with a common problem. For instance, if the PSS tools can only
be used by a qualified facilitator, the relationship between the facilitator and other social norms, participants’
mandates will affect how the tools are appropriated (Jankowski & Nyerges, 2001).
The second aspect that affects appropriation is related to the users. The potential users have a way of
appreciating or rejecting technology depending on how they perceive it. If people feel appreciated and valued
in the process of using the introduced tools, then they tend to attach value in the tools and help in the
process of appropriation by disclosing genuine and useful information. In addition, EAST articulates that if
people receive fair voice in an organisation, they treat the technology in a fair way and thus appropriate the
technology accordingly (Nyerges et al., 2006).
The third aspect affecting appropriation relate to the technology being appropriated. Introducing advanced
technologies such as PSS into organisation brings with it new structures. Jankowski and Nyerges (2001)
argues that advanced technologies will be received differently depending on the nature of user engagement.
For instance, if users are needed to meet in a specific room in order to use the tools or they can use the
tools anywhere anytime. Another influence to the PSS tools is how the tools give an array of information.
This related to diverse visualisation, communication and outputs display techniques. In many organisations,
the use ranges from educative tools that are more to communication tools that help deliver information to
less specialist personnel in a more understandable way. Jankowski and Nyerges explain that many people
will understand maps and graphics more easily that table thus how these advanced technologies display the
information affects the perception of the potential users and their willingness to appropriate the
technologies (Jankowski & Nyerges, 2001, 2008).
2.3. What are planning support systems (PSS)?
Planning Support Systems (abbreviated as PSS) can be defined as a variety of geo- technology computer-
based tools that are designed and organised to support both private and public planning processes at any
spatial scale ( national, regional or local) within any planning context (Geertman & Stillwell, 2003). PSS tools
are specifically developed to aid stakeholders involved in planning processes in weighing/evaluating
alternatives in making a future choice of action. PSS will always contain an element of GIS and in some
cases, they are closely related to Decision Support Systems (DSS).
2.3.1. GIS, PSS and DSS
GIS can be defined as systems that consist of tools for processing geo-referenced data and they are usually
used in diverse domains and problems (Geertman & Stillwell, 2009). GIS offers a generic solution whereas
PSS are focused on the specific application which may involve both spatial and non-spatial data(Geertman
& Stillwell, 2009). In many cases, PSS will contain elements of GIS, especially in spatial data analysis.
Decision Support Systems (DSS) on the other hand, are an interactive set of computer-based systems that
are designed to help people who are engaged in a decision-making activity (Gray, 1987). DSS application in
the real world has diversified, resulting in a plethora of terms. For instance, when DSS are used for spatially
related tasks, they are referred to as Spatial DSS (SDSS) (Barton, Plume, & Parolin, 2005; Kim,
Wunneburger, Neuman, & An, 2014; Ochola & Kerkides, 2004; Sugumaran, Ramanathan, Degroote, &
John, 2010), in group meetings they are called Group DSS (GDSS) (Chun & Park, 1998; DeSanctis et al.,
2008; Euske & Dolk, 1990; Lim, Raman, & Wei, 1994; Limayem, Banerjee, & Ma, 2006) and in collaborative
processes, they are called Collaborative DSS (CDSS) (Karacapilidis & Papadias, 2001).

NATIONAL PLANNING SUPPORT SYSTEMS APPROPRIATION IN SECONDARY CITIES IN RWANDA
10
PSS are distinct from DSS in several aspects. PSS focuses on long-term and strategic planning and are made
to help in group discussions and interventions. On the other hand, DSS are made for short term decision
making (usually policy related) by a set of people consisting mainly of executive decision makers (Geertman
& Stillwell, 2003). Consequently, PSS are developed from a broad scope of the planning process that
involves three steps namely planning task, planning problem at hand and modelling capabilities that help in
analysing and developing alternatives to a solution. In this sense, PSS contains in them the ability of DSS,
which are primarily sharing information, modelling capabilities and visualisation made to help decision
makers in solving problems. Moreover, in the real world, PSS have their entry point of application in
planning processes while DSS have their entry point in decision making processes which are two distinct
processes. In a nutshell, PSS are different from DSS although components of DSS are often found in PSS
(Geertman & Stillwell, 2009).
The similarity between DSS and PSS is based on the fact that both have a computer-based set of
components such as a database, user- interface and modelling options. In addition, both PSS and DSS are
designed for specific tasks (supporting planning and decision making processes respectively) and their
application cannot be generalised in the real world (Geertman & Stillwell, 2009; Geertman & Stillwell, 2003).
2.3.2. PSS in planning process
PSS are made for planning support but, the question is understanding how this happens. Geertman and
Stillwell, from an inventory of PSS across 15 countries concluded that PSS are used and dedicated for four
distinct uses. First, to assist and boost stakeholders’ participation in planning processes. Second, specifically
designed to handle particular planning problem and promote the uniform course of actions. Third, to inform
stakeholders about key policies being implemented or targeted to their local area or at the country level.
Fourth, the majority of PSS are designed to help professionals in specific planning tasks such as transport,
policy planning, land - use planning environmental planning among others (Geertman & Stillwell, 2004).
Klosterman (1997) argues that PSS should be seen as information infrastructure. This implies that PSS are a set
of organised tools for planning that enhance interaction and idea sharing among stakeholders. Klosterman
further states that PSS should aim at supporting a continuous and interactive process of analysing, designing
and evaluating outcomes and making meaningful use of the outcomes while adapting to any changes in the
information demands (Klosterman, 1997). Klosterman’s focus is on how PSS tools are organised to bring
meaningful benefits into the planning processes as well as to give better outcomes that can be adopted by
affected users. On similar view, Te Brömmelstroet (2013) argues that PSS application in the planning
processes is a dual affair. First, it is concerned with improving planning processes by introducing new
structures (which are embedded in PSS’s capabilities) in order to make planning more interactive and improve
on users’ participation. Second, PSS application is concerned with the outcomes which touch on the plans,
policies and strategies generated at the end. Whether the end products are used or not also depends on the
structure PSS introduces and how the potential users are well informed about these outcomes. This implies
another role of PSS other than merely an information infrastructure as Klosterman argues.
The PSS role in planning processes can be understood based on the underlying aim or goal of use. Te
Brömmelstroet (2013) identifies three categories of PSS namely informing, communicating and analysing.
Informing PSS can be seen as tools for information sharing. That means helping organisations achieve
their goals or visions (De Man, 2000). In this regard, the developers of the PSS must consider the design
that will provide information to users in the best way possible. Communication PSS are more tuned to
enhance communication between different people in a groups, organisation or community setting. The
majority of public participation oriented PSS falls into this category. Analysing PSS, according to Te
Brömmelstroet “aim to facilitate advance processing of data and information in order to find patterns and underlying

NATIONAL PLANNING SUPPORT SYSTEMS APPROPRIATION IN SECONDARY CITIES IN RWANDA
11
processes, and to facilitate information modelling for projection, simulation and evaluation” (Te Brömmelstroet, 2013 p.
303).
Despite this knowledge, achieving PSS role is not an easy thing. Whichever role or aim a PSS is developed
for, the success of PSS appropriation in the planning processes and any organisation at large, is determined
by many factors and this explains why up to date the use of PSS is still low globally (See Vonk, Geertman,
& Schot, 2005; Pelzer et al., 2014). Geertman & Stillwell (2009) studied the use of PSS in planning processes
globally and underpin three approaches associated with the low usage of PSS. These include instrumental,
transfer and user approach. Instrumental approach relates to capabilities of the PSS and how well they fit the
context of the application. For example, how well does the PSS fit to the planning context. The transfer
approach relates to measures used to move the PSS from the developers to the potential users and practically
operationalise them within the planning processes. For example, how is the top-down transfer organised
in case of inter-organisational settings. The user approach related to characteristics of the users that influences
their perception and willingness to appropriate the PSS for example, the awareness and experience in PSS
application (Geertman & Stillwell, 2009).
Whether PSS will achieve its expected role is highly determined by the reality in which it is being
implemented (Klosterman, 1995). For instance, just like any other advanced technology information
system, PSS are regarded as highly powerful tools and their outcomes reliable simply because they are
computer generated. Because the outcomes are likely to affect multiples stakeholders, whether within or
outside the government, the success of PSS appropriation depends on how well the tools integrate with
existing social-institutional structures (norms, power, policies and laws), users’ characteristics and the advanced
technology being appropriated (based on EAST convening constructs) and how overt is the appropriation
process in the planning context.
2.4. Application of PSS in urban governance
In the recent past, innovative technologies have revolutionised how urban planning and governance happens
in many places. Particularly, the advancement in ICT, linked to Geographic information systems (GeoICT)
has helped organisations consolidate knowledge and information about towns and urban areas (Pfeffer et
al, 2013). These achievements have contributed to better engagement of stakeholders involved in urban
governance.
Elwood (2001) pointed out that uses of advanced technologies in urban governance have contributed to
changes in how government officials, citizens and communities make decisions. The use of advanced
planning tools such as PSS has contributed to language, practices and paradigms changes, especially in
community planning. For instance, Pfeffer et al. (2013) explain that we can use Geo-technology tools to link
qualitative community information, district infrastructure, housing patterns and land information system
together with a wealth of spatial knowledge that may be overlooked in typically written words. Similar
thoughts are shared in the literature of participatory GIS and Public participatory GIS (see Auma, 2012;
Batenburg & Bongers, 2001).
Other application studies have shown intergovernmental and departmental benefits of using advanced
technologies. Pawlowska (2001) explains the potential of using GIS technology to convey information
horizontally and vertically within any given context. For instance, the use of revenue systems to consolidate
tax return across and within the administrative levels. One area that has benefited from the GIS technology
is the land information system. Krakow municipality, for instance, recorded 15% efficiency and
improvement in service delivery due to introductory of GIS technology (Pawlowska, 2001). In addition,
O’Looney explains that advanced technologies’ benefits cut across: economic development, health care,

NATIONAL PLANNING SUPPORT SYSTEMS APPROPRIATION IN SECONDARY CITIES IN RWANDA
12
public housing, law enforcement, education planning, land use and urban growth planning, infrastructure
and transport planning, environmental monitoring, site selection for service delivery, public information
system among other uses (O’Looney, 1997).
In another study, Lin, Zhang, and Geertman (2015) explore the opportunities of using PSS in China to
promote smart urban governance. In their work, the authors argue that the use of PSS in China can promote
social sustainability. In addressing the problem of rural immigrants in china form instance, Lin, Zhang, and
Geertman (2015) point out the potential of PSS to help create a more reliable decision-making platform that
brings together the key stakeholders such as government, the private sector and the society. Given the
growing use of smartphones and the internet, there is also a growing need of PSS that can be easily integrated
with a smartphone and social media and allow real-time public participation.
Although advanced technologies such as PSS offers commendable advantages in urban governance, some
studies have argued against the potential of these technologies. The main shortcomings of application of
advanced technologies relate to their technicalities and cost (Pfeffer et al., 2013). The cost of acquiring and
installing new systems such as PSS, maintaining and keeping up to date technology has discouraged many
organisations from fully adopting such technologies. However, global trends are changing, which has seen
the development of open source software and services that can help cut down the cost and technicalities
needed and thus many organisations can gradually afford the services of the innovative technologies
(Kumar, Thakur, Umashankar, & Ramana, 2014).
2.5. Policy translation and institutionalisation
In Rwanda, the SDF’s PSS tools and outcomes appropriation do not happen in isolation. The Rwanda SDF
is specifically designed to help in National Urbanisation Policy implementation. Therefore, the appropriation
of SDF’s PSS tools in the districts makes it possible for policy translation and transfer to happen.
Translation is defined differently in various research fields (Freeman, 2009). Translation from organisational
perspectives can be understood as how ideas, orders, artefacts, goods, concepts in the hands of people
spread over time and in any space (globally, nationally, regionally or locally). People act differently by
modifying, reducing, repelling, betraying, adding or even appropriating the subject (Czarniawska & Sev’on,
2005).
Policy translation reflects an interactive process by which new ideas are conceived, synthesised, turned into
operational slogans, objects and actions in practice and then communicated across the organisation within
the concepts of the original policy idea (Hossain, Scholz, & Baumgart, 2015; Mukhtarov, 2012). For instance,
in addressing the climate change in the world, several countries deduced adaptation measures (Weisser,
Bollig, Doevenspeck, & Muller-Mahn, 2014). But Gebauer and Doevenspeck (2015) argues that stating the
problem does not bring all actors on board thus, the process of translating the idea of climate change
adaptation involves understanding how multiple actors will act in moving the idea to the “ground” (Gebauer
& Doevenspeck, 2015). The concept of translation is closely related to the concept of policy transfer.
Policy transfer, on the other hand, focuses on the actor and the agent in the process of moving the policy
from one level to another (Mukhtarov, 2012). In other words, policy transfer assumes the policy is
conformable and immutable which means the actors involved in the policy transfer have less role in
influencing the policy. On the other hand, policy translations look into how multiple actors in a complex
interaction are likely to contribute into how the idea travels and possibly influence the outcomes
(Mukhtarov, 2012).

NATIONAL PLANNING SUPPORT SYSTEMS APPROPRIATION IN SECONDARY CITIES IN RWANDA
13
Translation can help in explaining how policies are institutionalised. An institution in this research is used to
imply policies, customs, rules, and norms that govern people within an organisational setting.
Institutionalisation is used to explain the process by which a new institution become formally embedded in
the routine operations of an organisation. The process entails detailed and repeated application such that
the subject (institution) application becomes the prescriptive choice of action in any course of the problem
(de Man, 2000).
However, Freeman (2009) argues that implementing institutions is literally impossible in that, “Words on
paper, mandated by an executive or administrative order, a statute, or a court ruling are translated into actual operations in a
real environment. The process of adaptive translation subjects a policy to the most fundamental evolutionary test, that of its
viability within the environment.” (As cited in Freeman, 2009.p 431). In this regards, translation bridges the gap
between institutions in papers and the existing local knowledge (see Dvora Yanow, 2004) and establish a
working local practice that leads to the actualisation of the translated policy in the application context.
2.6. Planning in Rwanda
Rwanda has two forms of government namely central and local governments. The central government
(sometimes referred to as national government) directs activities across the country through several
ministries and agencies but the ministry of local government (MINALOC) specifically, oversees the activities
of local governments. The central government includes the provincial administration levels (there are 5
provinces in Rwanda). The local governments (commonly referred to as the districts governments) include
the districts the 30 districts (Akarere), the 416 Sectors3 (Imerenge), the 2,148 Cells (Utugari) and the 14,837
Villages (Imudungu).
The local governments are the result of the decentralisation process in Rwanda. Decentralisation in
Rwandan context refers to means of transferring authority, function and responsibilities from national
government to the districts and Sectors (MINALOC, 2012). One of the decentralisation outcomes is the
performance contracts, locally known as Imihigo.
Imihigo entails two concepts namely “ I challenge myself to deliver” and “compete among one another” (Rwandapedia, 2016;
Scher, 2010). The Imihigo is a unique tool in Rwanda that was institutionalised in 2007 to promote service delivery in
the districts. For instance, the annual evaluation of districts performance. Over the years, Imihigo spirit has continued
to motivate districts to endeavour to achieve the set goals as well as the national cohesion (Scher, 2010). Imihigo has
continued to aid planning in Rwanda which led to the successful adoption in other government organisations such as
national agencies, ministries and embassies (Bugingo & Interayamahanga, 2010).
In terms of policies, the National Urbanisation Policy (NUP) is the principle policy that guides urbanisation
in Rwanda both in national and local governments. The NUP also promote decentralisation by underpinning
the importance of decentralised development by focusing urbanisation attention to the secondary cities. The
secondary cities as defined in NUP include Rubavu, Musanze, Huye, Rusizi, Nyagatare and Muhanga
(MININFRA, 2015). The NUP is discussed below and its importance in Rwanda planning processes.
2.6.1. The National Urbanisation Policy (NUP)
The NUP was approved by the cabinet of Rwanda in 2015 and asserted to be the policy guiding urbanisation
process in the country. The policy is set to guide how governmental and non-governmental stakeholders
work together in the urban planning processes to achieve sustainable development (NUP, 2015). The NUP
is based on values of sustainable land use, decentralised urban governance, social inclusion, participatory
planning, integrative planning, urban resilience, urban competitiveness and use of appropriate tools and
3 A Sector is the third level of administration in Rwanda after province and district.

NATIONAL PLANNING SUPPORT SYSTEMS APPROPRIATION IN SECONDARY CITIES IN RWANDA
14
technology for urban management which in this case supports the SDF’s PSS introduction to secondary
cities. NUP establishes four main pillars to guide urban development across the country:
I. Coordination: This pillar is centred on promoting good urban governance. The aim is to have all-
inclusive governance, where organisations are well coordinated to promote effectiveness in urban
planning and management.
II. Densification: This pillar is centred on having competitive cities. This means, urban areas that are
sensitive to the environment, promotes efficient land use, local economic development (while
preserving natural resources) and strives for strategic investment planning.
III. Conviviality: This pillar is centred on creating inclusive cities. The goal here is to have urban areas with
a guarantee of quality of life in all regions, promote social integration as well as upholding traditional
and cultural heritage.
IV. Economic growth: This pillar is centred on creating sustainable and smart cities. The target here is to have
cities that are geared towards sustainable economic strategies, based on innovative and entrepreneurial
methods that seek to promote socio-economic services and create more opportunities.
In implementing the NUP, the policy provides a room for use of advanced technologies in various
governmental organisations and administration levels. For instances, in local governments revenue and
financial management, the NUP proposes “use of ICT technology such as GIS-based property taxation to reduce the
constraints of spatial coverage, inefficient tax management and constraints to efficient payment” (NUP, 2015 p.41). This
among other provisions has led to a collaboration among stakeholders to develop a methodology of
implementing NUP. This methodology is referred to as Rwanda Spatial Development Framework as
discussed below.
2.6.2. The Spatial Development Framework of Rwanda
The SDF (see figure 2:1) is a methodology that is designed to promote the implementation of NUP and
harmonise the urban development plans in any country (Boerboom et al., 2015). SDF can be implemented
at a national ( case of Rwanda), regional (case of Darfur) or local level where the vision is to establish a
spatial framework for maximising returns on investments, balance regional developments and foster
economic growth (Un-Habitat, 2015).
Diagram adapted from: Boerboom et al, 2015
Figure 2:1 The SDF methodology flowchart

NATIONAL PLANNING SUPPORT SYSTEMS APPROPRIATION IN SECONDARY CITIES IN RWANDA
15
The Rwanda SDF 4 was developed in the year 2016. The first phase includes data collection, workshops,
the matrix of functions (MoF), spatial multi-criteria evaluation and emerging spatial structures (see figure
2.1). This first phase of the SDF methodology defines the PSS characteristics of the SDF methodology. The
computer-based tools (SMCE and MoF) and their outcomes (spatial structures) are used in the second phase
of the SDF methodology as the starting point for guiding planning, monitoring and evaluation processes in
the country. The second phase involves the strategic/spatial action planning and final political validation as
shown in figure 2.1. The final SDF will then be presented to the cabinet/parliament for approval.
The framework starts by identifying the spatial planning challenges and opportunities in each planning level
(whether national, regional or local). The main source of information and knowledge about the spatial
planning challenges is the NUP which also shapes the goals of the Rwanda SDF. The Rwanda SDF has
three steps in addressing spatial planning issues:
I. The matrix of Functions (MoF): The MoF is used to categorise areas based on the availability or absence of
key functions. A function is defined here to imply a specific service, activity, resource, social, economic
or political facility in any given settlement (for example in domains of education, finance, health, security
among others). MoF helps in identifying hierarchies the territories by finding the central functions such
as universities and basic functions such as primary schools as well as functional completeness of the
territories (Rondinelli, 1985). The first SDF’s PSS tool (based on Ms-excel programming for non-spatial
data and ArcGIS software for spatial data) uses MoF concept in generating some of the SDF’s PSS
outcomes.
II. Consultative training/ workshops: these meetings target the stakeholders to present results of the SDF PSS
outcomes to them for validation and explanation including familiarising with the SDF’s PSS tools.
III. Spatial Multicriteria Evaluation (SMCE): The concept of SMCE aims to stakeholders involved in the
planning process to evaluate, compare and choose the best alternative based on how good it performs
within the set conditions/criteria. SMCE has been used in several PSS tools to help in achieving the
overall goal (Haaren & Fthenakis, 2011). The second SDF’s PSS tool uses the SMCE concept in
producing some of the SDF’s PSS outcomes. The implementation of the SMCE was in the ILWIS GIS
tool (Zucca, Sharifi, & Fabbri, 2008).
2.6.3. Some of the SDF’s PSS outcomes and tools discussed with the districts’ staff
SDF’s PSS outcomes
The SDF’s PSS outcomes as used in this study refer to the outcomes of the Rwanda SDF methodology
which are generated using SDF’s PSS tools. The SDF’s PSS outcomes used in this research are adopted
from the SDF methodology (Boerboom et al., 2015). Figure 2.2 shows the urban settlement typology in
Rwanda. This is as a result of MoF analysis which established hierarchies of urban areas. There are three
urban hierarchies namely Local Urban Centres (LUC), Intermediate Urban Centres (IUC) and Main Urban
Centre (MUC). The classification is based on the availability of basic, intermediate and central functions5.
Figure 2.3 shows the socio-economic linkages in an isopleth map. The isopleth map shows how regions
relate and link not only in terms of functions availability but also social, economic and physical aspects. This
concept is important for planning and regional balance as well as motivation for potential investment. The
Rwanda SDF developers have identified economic potentialities in every region in Rwanda based on the
4 The second phase of the SDF (Strategic action/spatial action plans and final technical and political validation in figure 2:1) is not yet implemented. But the first phase (method and outcomes) has been approved by the senior management of Ministry of Infrastructure. 5 A video explaining how SDF’s PSS outcomes are generated is found can be found in https://www.youtube.com/watch?v=CqDad75SpBU (ITC Utwente, 2016)

NATIONAL PLANNING SUPPORT SYSTEMS APPROPRIATION IN SECONDARY CITIES IN RWANDA
16
findings of the MoF and consultation meetings. These results are shown in Figure 2.4. The final outcome
considered in this research that relates to MoF is the resulting spatial structure which is shown in figure 2.5.
The map shows emerging spatial structures that are likely to spur development and regional integration in
Rwanda. They include economic development area, nodal cities, gateway cities, northern corridor, primary
corridors and secondary corridors (Boerboom et al., 2015).
Figure 2:2 SDF outcome showing the three urban settlement typology: local, intermediate and main urban centres which are based on Rwanda demographic data
Figure 2:3 SDF outcome showing the Rwanda socio-economic linkages in an isopleth map which is based in Rwanda demographic data.
Data source: Rwanda SDF, 2016

NATIONAL PLANNING SUPPORT SYSTEMS APPROPRIATION IN SECONDARY CITIES IN RWANDA
17
The SDF’s PSS Tools
I. The matrix of functions (MoF)
The MoF is used to give an understanding of how physical development and social-economic activities vary
spatially across a territory. The tool involves a table where columns represented functions and the rows
represented the Sectors in the study districts as shown in figure 2.6. The functions are categorised into 13
functional classes that are presented as column heads for each class of functions. If a function is present,
then it is recorded with value 1 (black box) or else 0 (white box). After the data entry, the summation of the
functions is done based on the frequency of the each function. The frequency is then converted into function
weight by dividing by 100. The higher the frequency the lower the weight which means a function that is
found in few Sectors has more weight (more rare and central function) than a function that is found in
almost all Sectors (basic function). When the Sectors are sorted according to the weight, MoF can show
(from a large set of functions) various categories and centrality of urban areas. The final sorted matrix table
shows ordered Sectors according to centrality score where stakeholders can distinguish basic, intermediate
and central functions (Boerboom et al., 2015).
Figure 2:4 SDF outcome showing the districts’ economic potentialities across the whole of Rwanda
Figure 2:5 SDF outcome showing the emerging spatial structures in Rwanda
Data source: Rwanda SDF, 2016

NATIONAL PLANNING SUPPORT SYSTEMS APPROPRIATION IN SECONDARY CITIES IN RWANDA
18
II. Spatial Multi-Criteria Evaluation (SMCE)
The SMCE helps to spatially evaluate, compare and prioritise possibilities in an area, giving an understanding
of how well certain areas compare to others. The tool was developed using ILWIS software which is an
open source GIS software (Zucca et al., 2008).
The SMCE starts by establishing a criteria tree. In this case, four criteria trees each based on one of the four
pillars of the Rwanda National Urbanisation Policy (see section 2.6.1). The criteria tree consist of the
objectives, sub-objectives, criteria and indicators (see figure 2.7). In ILWIS raster data is applied into the
indicators which are then aggregated to criteria by means of weighted summation. ILWIS allows
standardisation of raster pixels such that the values range between 0 and 1. The final output which is called
composite index map shows the overall performance of the territory according to the specified criteria and
used indicators (Boerboom et al., 2015). The colour red shows areas that are performing poorly while green
shows regions performing well based on the input data (see figure 2.8)
Figure 2:7 Image of the ILWIS SMCE window showing the criteria tree, the three objectives under economic pillar economic tree, their weights, the sub-objectives and the outputs in form of raster maps at far right.
Figure 2:6 An Extract of the matrix of function showing the data entry window with list of provinces, districts and sectors on the rows and the functions list and categories in the columns.
Data source: Rwanda SDF, 2016
Data source: Rwanda
SDF, 2016

NATIONAL PLANNING SUPPORT SYSTEMS APPROPRIATION IN SECONDARY CITIES IN RWANDA
19
Figure 2:8 A composite index map showing the Economic pillar performance in Rwanda overlaid with the roads layer shown in grey and the study area Sectors boundaries layers shown in black.
Data source: Rwanda SDF, 2016

NATIONAL PLANNING SUPPORT SYSTEMS APPROPRIATION IN SECONDARY CITIES IN RWANDA
20

NATIONAL PLANNING SUPPORT SYSTEMS APPROPRIATION IN SECONDARY CITIES IN RWANDA
21
3. RESEARCH METHODOLOGY
This chapter discusses the research methodology for this study. The first section is the selection of the study
area and justification on the choice of Rubavu and Musanze districts in Rwanda. The next section explains
the research strategy followed by a section on the methods used in data collection, processing and analysis.
The section ends with a reflection on some ethical issues that were considered throughout the study.
3.1. Selection of study area
In this study, two secondary cities6 in Rwanda were used to study the PSS appropriation. These cities are
Rubavu and Musanze. Rubavu is the second largest city in Rwanda after Kigali (the country’s capital city)
while Musanze is the third in terms of population. In addition, the choice of these cities was informed by
their geographical location (relatively closer) as well as their role in implementing the SDF. These two cities
are considered key pillars in the tourism industry and infrastructure development in Rwanda (Boerboom et
al., 2015). It is, therefore a valid study to explore the possibility of implementing the Rwanda SDF by
focusing on the major secondary cities in the country.
3.1.1. Rubavu district
Rubavu district is one of the 30 districts in Rwanda and it is located in the Western Province, 152 Km from
the Capital City Kigali. Rubavu City, in particular, is found in the northeast of Lake Kivu and near the border
city of Goma, in Democratic Republic of Congo (DRC) hence Rubavu is commonly regarded as
International Gateway city. Rubavu district the following hierarchy of administrative levels: 12 Sectors, 80
cells and 525 villages. Although Rubavu city (Sometimes called Gisenyi) is the second largest city, there is
no autonomous urban administration authority for the city. The urban Sectors that make the Rubavu
secondary city include Gisenyi, Rubavu7 and Rugerero. The rest of the Sectors make the rural part of the
district (see figure 3.1).
Rubavu district has a population of about 423,000 out of which 149000 are living in the urban area. Rubavu
city has an estimated urban growth rate of 5% that is higher compared to 3.3% in the whole district. The
national bureau of statistics projects an urban population of 200,000 inhabitants by the year 2020 (Rubavu
DDP, 2013). The land is characterised by physical features such as volcanic mountains, Gishwati Forest and
Lake Kivu. In the recent past, the national government launched the KivuWatt project which is power
project aimed to tap deposit of methane and carbon dioxide gases which is one of the major economic
investment in the district (MININFRA, 2016b).
3.1.2. Musanze district
Musanze district is among the five north province districts. Musanze district borders Uganda and DRC to
the north, Gakenke and Burera districts to the East and Nyabihu district to the West. Musanze district has
a total surface area of 530km2. Some of the major attractions in the district are the Virunga national park
which is approximately 60km2 and Lake Ruhondo which is about 28 km2. Musanze has got 15 Sectors. The
6 The secondary cities are part of the larger districts administrations because there are no autonomous administration authorities for the secondary cities in Rwanda. Therefore, the word secondary cities is interchangeably used with the word districts. 7 The word Rubavu here is used to refer to a Sector but has not been used elsewhere in this study. The word is used throughout this study to refer to the Rubavu districts.

NATIONAL PLANNING SUPPORT SYSTEMS APPROPRIATION IN SECONDARY CITIES IN RWANDA
22
urban area (making the Musanze secondary city) includes Muhoza, Cyuve, Kimonyi, and Musanze
(Ruhengeri) Sectors as shown in figure 3.2.
By the year 2012, Musanze had a population of about 307,078 people with a population density of 695
habitats per km2. The annual growth rate in the district is 1.8%. Musanze is ranked third best district in
terms of poverty reduction with 70.9% of the population in Musanze regarded as non-poor (Musanze DDP,
2013). This can be attributed to high level of agricultural activities with the largest population in the district
practising farming in pyrethrum, potatoes, sorghum and foliage (Musanze DDP, 2013). Musanze takes pride
in been the home of the gorillas which is one of the major tourism attraction in Rwanda. In addition,
Musanze has the highest mountains in Rwanda. With the five of the eight Virunga chain mountains namely
Karisimbi, Bisoke, Sabyinyo, Gahinga and Muhabura are all found in this district.
Data Source: Rwanda SDF, 2016
Figure 3:1 A map of Rubavu district showing the 12 Sectors, and other physical features

NATIONAL PLANNING SUPPORT SYSTEMS APPROPRIATION IN SECONDARY CITIES IN RWANDA
23
3.2. Research strategy
A case study approach was used in this study. This helped in understanding how PSS appropriation in the
districts is likely to happen in Rwanda and understand key factors that are likely to influence the
appropriation process. A case study, as a research type was preferred because it gives a researcher an
opportunity to explore the case study area in line with the study objectives in a detailed and intensive manner
(Bryman, 2012). For example, in this study, the choice to study PSS appropriation in the districts in Rwanda
was based on the fact that, Rwanda has developed a spatial framework, hereby referred to as Spatial
Development Framework of Rwanda. The choice of a case study allows a detailed understanding of how
the PSS appropriation can happen in the study area (Rubavu and Musanze).
This study used mixed method approach. That means, integrating qualitative and quantitative
(QUAL+quan) approach in data collection (Bryman, 2012). Although qualitative methods took centre
priority in this study, the importance of a mixed approach that triangulates between the qualitative and
quantitative methods helped in building a strong argument and offer variant approaches to explain the real
situation in the case study area (Iacono, Brown, & Holtham, 2011). Similar justification is supported by
Mahmood (2013) who explains that using all possible methods in research gives a researcher a broader scope
to explain the problem rather than focusing on method (Mahmood, 2013).
3.2.1. Data sources
The primary data needed in this study was mainly obtained from the districts. Secondary data was obtained
from the Ministry of Infrastructure, government policies and documents (both at national and districts),
ITC database and websites of key partners in the districts’ planning processes. The spatial data was obtained
mainly from the Rwanda SDF database developed during the first phase of the SDF methodology (see
section 2.6.2). More specifically, the matrix of functions (MoF) and the Spatial Multicriteria Evaluation
Data Source: Rwanda SDF, 2016
Figure 3:2 A map of Musanze district showing the 15 Sectors and the urban area

NATIONAL PLANNING SUPPORT SYSTEMS APPROPRIATION IN SECONDARY CITIES IN RWANDA
24
(SMCE) were used in designing the research workshop materials that are explained in appendix 4. Table 3.1
below shows the summary of main data needed and the relevant sources.
Table 3:1 Primary and secondary data needed and their sources
Category Data Need Sources
Secondary data
SDF framework, Dimension and SMCE, MoF relevant in Rubavu and Musanze.
SDF report, ITC, Un-Habitat, Rwanda, MININFRA and RHA
Secondary and primary data
Mechanism of adoption of national policies, strategies at local governments.
Key informants, documents, websites, reports and websites
Secondary and primary data
Secondary Cities Planning process Reports, Official documents, websites, Key informants,
Primary data Perception about SDF outcomes Focus group discussion, Questionnaire
Primary data Applicability of PSS tools in the secondary cities Focus group discussion, questionnaire
Primary data Challenges of appropriating PSS tools and Outcomes in the Districts
Focus group discussion, observation, and questionnaire.
3.2.2. Sampling strategy
This study was targeted to the secondary cities staff members who are the potential users of the SDF’s PSS
tools and outcomes. Therefore, the participants were purposely selected from the two case study cities
(Rubavu and Musanze). Representative sampling approach was used to ensure that all interest of potential
PSS users in the districts were represented in the study. Representative sampling aims to ensure the chosen
sample is as accurate as possible to represent the entire population (Bryman, 2012), in this case, all Rubavu
and Musanze administration Units and other stakeholders involved in planning processes. See the details of
the workshop participants and interviewees list in appendix 3.
3.3. Data collection methods
The data collection involved a five weeks fieldwork. The fieldwork started on 19th September up to 22nd
October 2016. This section discusses the methods used in data collection namely. Qualitative (Semi-
structured interviews, research workshops, notebook, recording, observation and focused group discussion)
and quantitative (questionnaires) methods.
Semi-structured interviews
Semi-structured interviews were conducted with the key informants (see appendix 3). This is a method of
collecting data that involves an interviewer gathering detailed information from an interviewee by asking
directing questions but giving room for the interviewee to explore their area of interest and disclose
important issues (Silverman, 2005).
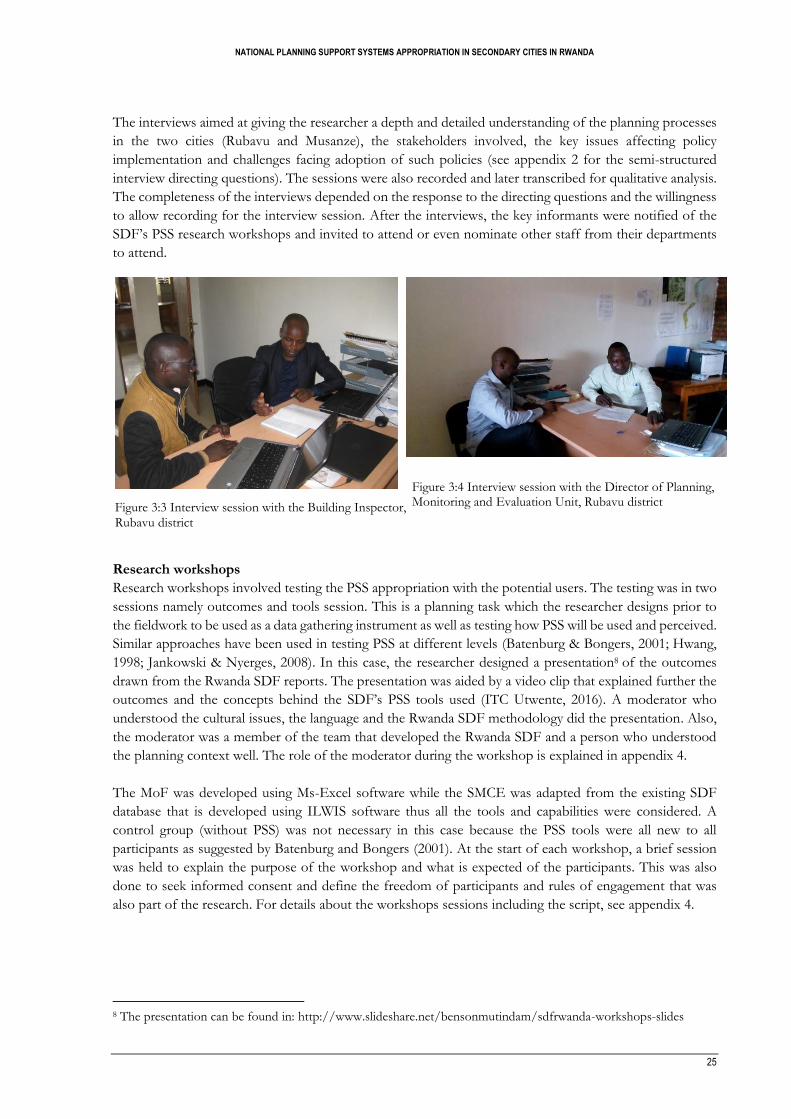
NATIONAL PLANNING SUPPORT SYSTEMS APPROPRIATION IN SECONDARY CITIES IN RWANDA
25
The interviews aimed at giving the researcher a depth and detailed understanding of the planning processes
in the two cities (Rubavu and Musanze), the stakeholders involved, the key issues affecting policy
implementation and challenges facing adoption of such policies (see appendix 2 for the semi-structured
interview directing questions). The sessions were also recorded and later transcribed for qualitative analysis.
The completeness of the interviews depended on the response to the directing questions and the willingness
to allow recording for the interview session. After the interviews, the key informants were notified of the
SDF’s PSS research workshops and invited to attend or even nominate other staff from their departments
to attend.
Research workshops
Research workshops involved testing the PSS appropriation with the potential users. The testing was in two
sessions namely outcomes and tools session. This is a planning task which the researcher designs prior to
the fieldwork to be used as a data gathering instrument as well as testing how PSS will be used and perceived.
Similar approaches have been used in testing PSS at different levels (Batenburg & Bongers, 2001; Hwang,
1998; Jankowski & Nyerges, 2008). In this case, the researcher designed a presentation8 of the outcomes
drawn from the Rwanda SDF reports. The presentation was aided by a video clip that explained further the
outcomes and the concepts behind the SDF’s PSS tools used (ITC Utwente, 2016). A moderator who
understood the cultural issues, the language and the Rwanda SDF methodology did the presentation. Also,
the moderator was a member of the team that developed the Rwanda SDF and a person who understood
the planning context well. The role of the moderator during the workshop is explained in appendix 4.
The MoF was developed using Ms-Excel software while the SMCE was adapted from the existing SDF
database that is developed using ILWIS software thus all the tools and capabilities were considered. A
control group (without PSS) was not necessary in this case because the PSS tools were all new to all
participants as suggested by Batenburg and Bongers (2001). At the start of each workshop, a brief session
was held to explain the purpose of the workshop and what is expected of the participants. This was also
done to seek informed consent and define the freedom of participants and rules of engagement that was
also part of the research. For details about the workshops sessions including the script, see appendix 4.
8 The presentation can be found in: http://www.slideshare.net/bensonmutindam/sdfrwanda-workshops-slides
Figure 3:3 Interview session with the Building Inspector, Rubavu district
Figure 3:4 Interview session with the Director of Planning, Monitoring and Evaluation Unit, Rubavu district

NATIONAL PLANNING SUPPORT SYSTEMS APPROPRIATION IN SECONDARY CITIES IN RWANDA
26
Field notebook
The researcher used a notebook to record discussions, reactions and comments during the interviews,
workshops and focus group discussion. This proved to be helpful especially with the language challenges.
Any question asked by the participants in Kinyarwanda would be translated to the researcher by the
moderator and then written down in the field notebook. Field notes are also considered in this research as
a supporting method to write down insights and quotes which were used as a supplement to the findings of
analysed data just as some authors have recommended in similar studies (Iacono et al., 2011).
Recording
Both the interviews and the workshop sessions were audio recorded. During the experiment workshop sessions,
the interaction between the participants was video recorded to allow after session analysis. Video recording
is a helpful method of qualitative studies which does not only keep the verbal information but also keeps
the non-verbal information that many methods may not disclose (Nyerges et al., 2006).
Observation
An independent observer kept a record of observed patterns and interactions during the research workshop.
The observer was an expert with knowledge of the PSS as well as qualitative research skills. The observation
was targeted on issues related to difficulties in understanding the tools, interactions of participants, groups’
ability to make a decision based on the PSS tools and outcomes and the peculiarities of participants regarding
the SDF’s PSS tools and outcomes. An observer in PSS testing sessions has proved to be reliable in
qualitative data analysis (Nyerges, Jankowski, & Drew, 2002). Although the presence of an observer may
influence the participants (Bryman, 2012), this was done with minimal influence on the process whereby the
observer focused on the behaviour of participants within a given framework ( in this case, in line with PSS
tools).
Focused group discussion:
After the workshop, the participants were engaged in a focused group discussion to share their experience and
challenges in using the SDF’s PSS tools and outcomes. The moderator who understood the cultural issues,
Figure 3:5 A workshop in Musanze showing the introduction session
Figure 3:6 Participants interacting with the MoF outcome in a printed format
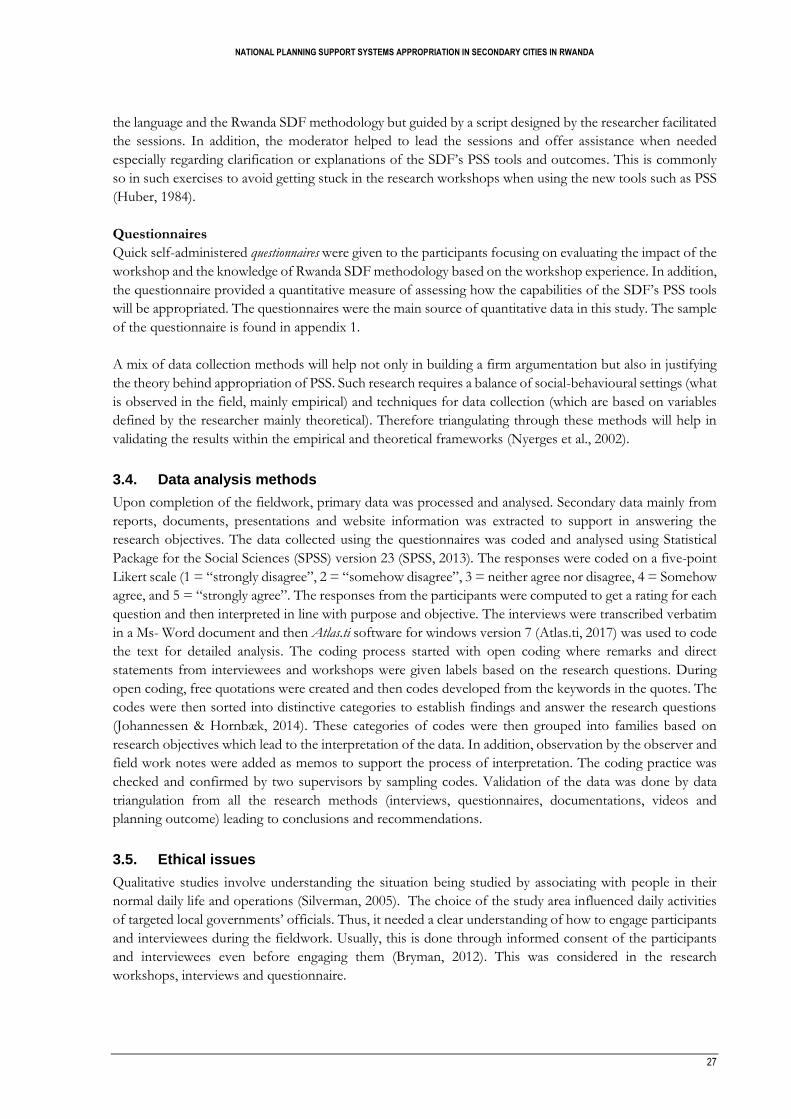
NATIONAL PLANNING SUPPORT SYSTEMS APPROPRIATION IN SECONDARY CITIES IN RWANDA
27
the language and the Rwanda SDF methodology but guided by a script designed by the researcher facilitated
the sessions. In addition, the moderator helped to lead the sessions and offer assistance when needed
especially regarding clarification or explanations of the SDF’s PSS tools and outcomes. This is commonly
so in such exercises to avoid getting stuck in the research workshops when using the new tools such as PSS
(Huber, 1984).
Questionnaires
Quick self-administered questionnaires were given to the participants focusing on evaluating the impact of the
workshop and the knowledge of Rwanda SDF methodology based on the workshop experience. In addition,
the questionnaire provided a quantitative measure of assessing how the capabilities of the SDF’s PSS tools
will be appropriated. The questionnaires were the main source of quantitative data in this study. The sample
of the questionnaire is found in appendix 1.
A mix of data collection methods will help not only in building a firm argumentation but also in justifying
the theory behind appropriation of PSS. Such research requires a balance of social-behavioural settings (what
is observed in the field, mainly empirical) and techniques for data collection (which are based on variables
defined by the researcher mainly theoretical). Therefore triangulating through these methods will help in
validating the results within the empirical and theoretical frameworks (Nyerges et al., 2002).
3.4. Data analysis methods
Upon completion of the fieldwork, primary data was processed and analysed. Secondary data mainly from
reports, documents, presentations and website information was extracted to support in answering the
research objectives. The data collected using the questionnaires was coded and analysed using Statistical
Package for the Social Sciences (SPSS) version 23 (SPSS, 2013). The responses were coded on a five-point
Likert scale (1 = “strongly disagree”, 2 = “somehow disagree”, 3 = neither agree nor disagree, 4 = Somehow
agree, and 5 = “strongly agree”. The responses from the participants were computed to get a rating for each
question and then interpreted in line with purpose and objective. The interviews were transcribed verbatim
in a Ms- Word document and then Atlas.ti software for windows version 7 (Atlas.ti, 2017) was used to code
the text for detailed analysis. The coding process started with open coding where remarks and direct
statements from interviewees and workshops were given labels based on the research questions. During
open coding, free quotations were created and then codes developed from the keywords in the quotes. The
codes were then sorted into distinctive categories to establish findings and answer the research questions
(Johannessen & Hornbæk, 2014). These categories of codes were then grouped into families based on
research objectives which lead to the interpretation of the data. In addition, observation by the observer and
field work notes were added as memos to support the process of interpretation. The coding practice was
checked and confirmed by two supervisors by sampling codes. Validation of the data was done by data
triangulation from all the research methods (interviews, questionnaires, documentations, videos and
planning outcome) leading to conclusions and recommendations.
3.5. Ethical issues
Qualitative studies involve understanding the situation being studied by associating with people in their
normal daily life and operations (Silverman, 2005). The choice of the study area influenced daily activities
of targeted local governments’ officials. Thus, it needed a clear understanding of how to engage participants
and interviewees during the fieldwork. Usually, this is done through informed consent of the participants
and interviewees even before engaging them (Bryman, 2012). This was considered in the research
workshops, interviews and questionnaire.

NATIONAL PLANNING SUPPORT SYSTEMS APPROPRIATION IN SECONDARY CITIES IN RWANDA
28
Several authors have written about key ethical issues related to qualitative research. Sanjari, Bahramnezhad,
Fomani, Shoghi, & Cheraghi, (2014) gave a detailed explanation of such issues and their views shed some
light in this study. Table 3:3 shows a summary of the ethical issues and the solutions adopted.
Table 3:2 Research ethical issues and potential solution used in this study
Ethical issues Potential solutions
Role of
researcher
Seek informed consent from interviewees and participants. This was done first by brief
identification of the researcher, through a formal writing by the university and the
RHA. And second, by clearly explaining to participants, the purpose of the session,
expected role, the use of outcomes and right to participate.
Researcher -
participants
relationship
The researcher had to minimise chances of intrusion by focusing on guided questions
for interview and questionnaires that relate directly to the research.
The researcher also sent the meeting request in advance (2 to 4 weeks) to allow
participants and interviewees to prepare for the sessions. This was followed by phone
call and confirmation few days before the actual meeting.
Disclosing the role of every participant in the research. Such include the roles of
researcher, workshop participants, observer, and moderator, among others.(see
appendix 4)
Research
design
challenges
The choice of case study meant working closely with local government officials in
Rubavu and Musanze. The researcher aimed at no harm policy by focusing on
protecting the privacy of the involved people as well as their rights to benefit from the
study. Thus, measures to protect the identity of participants was highly considered
throughout the research. For example, workshop numbers (workshop 1, 2, 3 and 4)
identifies participants and interview schedule number identifies interviewees during the
data analysis.
Data collection
issues
Ethnographic studies (studying culture, socio behaviour and ethical characteristics
within people’s context) may raise eyebrows among the participants. The researcher
was, therefore aware of potential conflicts. Thus informed consent and overtness in
every process were sought before the start of any activity.
To deal with potentials of conflicts, the research sought approval from the right
government authorities, including been introduced to participants by the right person
and authority.
Workshop
scripts
translators
Many useful data from the workshop was collected in Kinyarwanda, which needed to
be translated into English for interpretation during data analysis phase. In order to
avoid partialities, the interpreter was a “neutral” person who does not take interest in
Rubavu and Musanze districts.

NATIONAL PLANNING SUPPORT SYSTEMS APPROPRIATION IN SECONDARY CITIES IN RWANDA
29
4. RESULTS AND DISCUSSION: PLANNING IN THE DISTRICTS
4.1. Introduction
The first sub-objective of this study was to understand the existing planning processes and procedures in
Rubavu and Musanze districts. These included understanding the people involved in the planning processes,
their roles, the key outputs (plans) and their preparation process, and finally, measures taken to implement
the planning processes outcomes (the plans). It is important to understand the existing procedures, people
and policies in Rwanda in order to have a contextual understanding of the where the SDF’s PSS
appropriation will happen (Jankowski & Nyerges, 2001). This chapter presents the findings related to
existing governance structures, policies, planning processes and their outcomes and implementation
methods in the Rubavu and Musanze districts. The results are based on the interviews and cross-checked
with secondary materials. The details of the interviews are attached in appendix 2.2. The chapter ends with
a discussion on the findings of the planning in the districts in Rwanda.
4.2. Governance and structure of the districts
The districts’ governments in Rwanda are established by the constitution and order papers which give all
the districts the same structure of government (see figure 4:1). The head of a district is the mayor who is
assisted by two assistant mayors and the Executive Secretary in charge of administrative duties in the
districts. Below the office of the Executive Secretary, there are autonomous agencies, corporate service
division, District Administration Security Support Organ (DASSO) and 10 units. The Units that are involved
in the district planning processes include the One Stop Centre, Planning, Monitoring and Evaluation,
Finance, Education, Social Development, Good Governance, Health, Human Resource and
Administration, Agriculture and Natural Resource and Business Development and Employment units.
Source: (MIFOTRA, 2015) Figure 4:1 Structure of the districts in Rwanda showing the existing Units
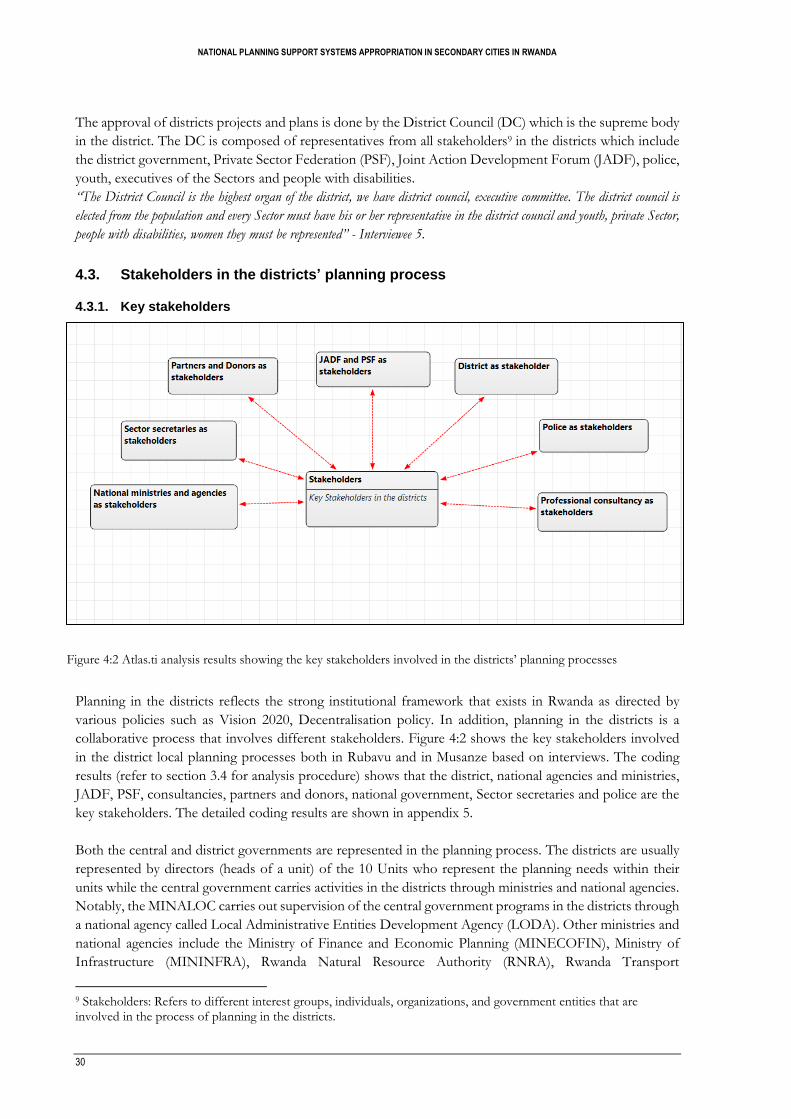
NATIONAL PLANNING SUPPORT SYSTEMS APPROPRIATION IN SECONDARY CITIES IN RWANDA
30
The approval of districts projects and plans is done by the District Council (DC) which is the supreme body
in the district. The DC is composed of representatives from all stakeholders9 in the districts which include
the district government, Private Sector Federation (PSF), Joint Action Development Forum (JADF), police,
youth, executives of the Sectors and people with disabilities.
“The District Council is the highest organ of the district, we have district council, executive committee. The district council is
elected from the population and every Sector must have his or her representative in the district council and youth, private Sector,
people with disabilities, women they must be represented” - Interviewee 5.
4.3. Stakeholders in the districts’ planning process
4.3.1. Key stakeholders
Planning in the districts reflects the strong institutional framework that exists in Rwanda as directed by
various policies such as Vision 2020, Decentralisation policy. In addition, planning in the districts is a
collaborative process that involves different stakeholders. Figure 4:2 shows the key stakeholders involved
in the district local planning processes both in Rubavu and in Musanze based on interviews. The coding
results (refer to section 3.4 for analysis procedure) shows that the district, national agencies and ministries,
JADF, PSF, consultancies, partners and donors, national government, Sector secretaries and police are the
key stakeholders. The detailed coding results are shown in appendix 5.
Both the central and district governments are represented in the planning process. The districts are usually
represented by directors (heads of a unit) of the 10 Units who represent the planning needs within their
units while the central government carries activities in the districts through ministries and national agencies.
Notably, the MINALOC carries out supervision of the central government programs in the districts through
a national agency called Local Administrative Entities Development Agency (LODA). Other ministries and
national agencies include the Ministry of Finance and Economic Planning (MINECOFIN), Ministry of
Infrastructure (MININFRA), Rwanda Natural Resource Authority (RNRA), Rwanda Transport
9 Stakeholders: Refers to different interest groups, individuals, organizations, and government entities that are involved in the process of planning in the districts.
Figure 4:2 Atlas.ti analysis results showing the key stakeholders involved in the districts’ planning processes

NATIONAL PLANNING SUPPORT SYSTEMS APPROPRIATION IN SECONDARY CITIES IN RWANDA
31
Development Agency (RTDA), National Union of disability Organisations on Rwanda (NUTOR), Rwanda
Development Board (RDB), and Rwanda Agricultural Board (RAB).
The civil society and private business community are represented by the Joint Action Development Forum
(JADF) and the Private Sector Federation (PSF) respectively. JADF is a combination of all civil society
organisations, non-governmental organisations (NGO’s), Community Based Organisations (CBOs) and
other development partners. JADF was established in 2007 by ministerial instruction No 04/07 and the
forums have expanded their operations not only in Musanze and Rubavu but also in other 20 districts
(Rwandapedia, 2016). The PSF, on the other hand, is divided into 9 operational themes namely agriculture,
art & craft, tourism, women entrepreneurship, commerce, youth empowerment, industry, finance and liberal
professionalism districts (Private Sector Federation, 2017). Not all of these themes are currently found in
Rubavu and Musanze districts.
Donors and international agencies operate in the district either directly or indirectly. That is, the international
development partners can initiate projects in a particular district directly or through national ministries and
agencies such as RHA and LODA. For instance, development partners like Netherlands embassy in Kigali
give financial support to the districts through the MINECOFIN and LODA, World Bank gave planning
tools for online construction permitting directly to Musanze district. In another case, Japan International
Corporation Agency (JICA) and Volunteer Services Overseas (VSO) implemented capacity-building
projects directly in Musanze district.
Interviewer: The project by VSO and JICA, did they come directly to Musanze or through national government?
Interviewee 7: they come directly…like VSO we worked here together for 3 years their volunteers we worked together for three
years.
4.3.2. Roles of stakeholders in the districts
Table 4:1 below shows the analysis results for the roles played by some of the stakeholders discussed in
section 4.1.1. The focus is on the districts’ Units, national government, JADF and PSF whose roles are
considered relevant in this study, that is for the SDF’s PSS appropriation in the districts.
Table 4:1 Role of some stakeholders in planning processes as identified from the interviews results and secondary materials and considered relevant for SDF’s PSS appropriation in the districts.
Stakeholders Roles in the planning process
Central
Government
Hires and awards tenders to the consultants, to undertake development projects in the districts on behalf of the districts.
Supervises the operation of hired consultancies in the undertaking of any assigned projects on behalf of the people and the national government.
Supports the districts in the planning process through training and capacity building
Gives financial support to the district for planning and development projects
Elaborates national plans and vision to the districts through relevant ministries and agencies.
Oversees and support districts’ decentralisation progress.
Districts Gives supportive information (local knowledge) to consultancies and national government agencies in preparation, implementation and evaluation of any development projects.
Prepares annual action plans, performance contract (Imihigo) annually.
Data collection and profiling the district for planning purposes.
Elaborates districts’ plans, vision and development strategies to the Sectors and Cells.
Validates the districts’ plans, budget and policies

NATIONAL PLANNING SUPPORT SYSTEMS APPROPRIATION IN SECONDARY CITIES IN RWANDA
32
One Stop
Centre
In charge of the preparation, drafting and elaborating the Master plan.
Coordinates the urban planning activities in the districts.
Works closely with RHA and MININFRA to implement urbanisation goals and visions in the districts
Prepares local development plans, layout plans and help in elaborating the outputs to others district units.
Approval of development and investments projects within the districts in accordance with building codes and permissions.
Planning,
monitoring
and
evaluation
Unit
Consolidates districts’ actions plans from all units and other strategic documents emanating from different units and Sectors.
In charge of implementing, monitoring and evaluating the DDP and Action plans with the supervision of Executive secretary.
In charge of budgeting and financial allocation for all development projects within the districts
In charge of preparing Strategic Issue paper (SIP), Project Profile Document (PPD), district’s Annual action plan and tender plans
In charge of data storage, analysis and providing information relevant for planning in the districts such as statistical data, evaluation criteria and performance indicators.
JADF and
PSF
Participates in all district planning processes, evaluation and elaboration of plans
Serves as an intermediate body between the civil society, private organisation and the districts by advocating corporation and joint governance.
Represent the interest of the civil society and Private organisations in the districts planning process.
Accountability role, which includes working with district planning, monitoring and Evaluation Unit to ensure private organisations, NGOs and civil societies, honour their development commitment and support in the districts, especially in community development and investment.
Source: MIFOTRA, 2015
4.4. Outcomes of districts planning processes
The following section highlights some of the key planning processes and their outcomes in the districts
(these relate to research questions 1.2 and 1.3). The main outcomes of the district planning processes include
long (master plan and DDP), medium (MTEF) and short (Imihigo and Annual action plans) term plans.
4.4.1. The Master Plan
The master plan is one of the long-term plans in the districts. Master plans in Rwanda are designed to guide
development and urban growth for a period of 20 years. According to the urban planners in Rubavu and
Musanze, the master plan is an important plan in the districts for guiding implementation of infrastructural
development projects such as roads.
The master plan is prepared by the One Stop Centre unit, in collaboration with the district technical
committee (see MIFOTRA, 2015). The process of preparing a master plan starts with tendering process
done by the MININFRA through the RHA. The hired consultant prepares the master plan with the
supervision of the districts (usually the One Stop Center Urban planners). The consultant provides technical
skills in understanding the development processes in the districts and conceptualising the spatial challenges.
The draft master plan is then presented to the District Council for consultative discussion followed by a
series of field exercises. After the consultative meetings, preliminary plans and economic strategy are
designed which are presented to members of JADF and PSF to communicate the district’s vision and receive

NATIONAL PLANNING SUPPORT SYSTEMS APPROPRIATION IN SECONDARY CITIES IN RWANDA
33
private sector and civil society inputs. The next step is the preparation of the final master plan together with
a financial plan developed in conjunction with Planning, Monitoring and Evaluation Unit. The financial
plan and the master plan are finally presented to the District Council for approval. This process is
summarised in figure 4:3 below.
The communication of master plan to different administrative levels is a top – down approach. The
approach involves districts’ staff drawn from One Stop Centre Unit, going up to the Sector level to elaborate
the plans to Sector’s staff. The elaboration involves several communication techniques such as the use of
general public workshops, formal meeting invitations, printed copies and online platform. In Rubavu,
specifically, the master plan is hosted on the website (this is effective communication channel given that all
the 12 Sectors in Rubavu district have reliable internet connection.
4.4.2. District Development plan (DDP)
The DDP is the main planning document in the districts. The provision for preparation of DDP is in line
with the vision of decentralisation that aims to transfer power and responsibilities to local authorities in
Rwanda (MINALOC, 2012). Thus, in line with national goals and visions, the districts prepare the DDP,
every 5 years which aims to achieve economic growth and poverty reduction (Rubavu DDP, 2013).
The DDP preparation process starts with needs identification activities (see figure 4.4). This involves a
bottom- up approach where the districts’ staff go up to smallest administration levels for data collection.
The findings of the families are harmonised to formulate needs at the Villages while the needs in the Villages
are consolidated and prioritised to identify needs at the Cell level. Similarly, needs at the Cells are
consolidated to become the Sectors’ development priorities which then are consolidated to become districts’
priorities. The process at each administrative level is led by the head at that level with financial support from
the district through Planning, Monitoring and Evaluation Unit.
After needs identification, the planning team chooses the indicators and targets for addressing those
identified needs. This involves consultative meetings with all stakeholders in the districts, mainly led by a
professional consultant hired by the central government. In choosing the indicators, the districts are guided
not only by the identified needs but also a set of national and international policies such as EDPRS-2, Vision
2020, Seven Year Government Program and SDG’s. The set of priorities identified helps the professional
Master plan preparation process
Step 1: Understanding the development process
Step 2: Assessing the existing master plan
Step 3: Set targets (after consultation with stakeholders)
Step 4: Preliminary physical plan and economic strategy development
Step 5: Consultation with stakeholders (discuss the preliminary plan)
Step 6: Develop the final plan
Step 7: Elaboration and draft financial plan (done in two phases each 10 years)
Step 8: Approval by district council
Figure 4:3 The steps followed in master plan preparation process and review process Source: Musanze district, 2016

NATIONAL PLANNING SUPPORT SYSTEMS APPROPRIATION IN SECONDARY CITIES IN RWANDA
34
consultant in drafting a DDP then followed by input meetings with District Council. After the input
meetings, a final DDP copy is prepared and submitted to the districts. The whole DDP preparation process
takes approximately three months.
The District Council is responsible for the implementation of the DDP although the implementation must
happen in a collaborative and inclusive approach as stated in the DDP.
“The District Council on regular basis, will evaluate the progress made in implementing DDP, identifies challenges and
strategies to overcome them and set strategies for next step of implementation” –Musanze DDP, 2013 p. 60).
The districts’ planning process reflects a high level of collaboration and inclusion which is provided for in
the policies and exercised accordingly in the districts. This has been possible given a strong institutional
framework in the whole of Rwanda which is seen in how people adhere to the policies (see Goodfellow,
2013).
4.4.3. Performance contracts (Imihigo)
Performance contracts are locally known as Imihigo. The Imihigo entails two concepts namely “ I challenge
myself to deliver” and “compete among one another” (Rwandapedia, 2016; Scher, 2010). The Imihigo is a unique
tool in Rwanda that was institutionalised in 2007 to promote service delivery in the districts. Over the years,
Imihigo concepts have continued to motivate districts to endeavour to achieve the set goals as well as the
national cohesion (Scher, 2010). In this regards, Imihigo is now used in other government organisations
such as national ministries, embassies, public service among others. However, the concept of Imihigo (see
section 2.6) started in the districts with an aim of fostering public participation and holding the mayors in
the district accountable to perform (Scher, 2010). The Imihigo preparation process is summarised in figure
4.5 below.
Assemble Statistical Evidence
and Indicators
Problems assessment and needs/
recommendations through
governance local organic: Village,
Cell, Sector, District and by
Proposal solution to problems
and asset targets
Analysis of statistical evidence
and indicators
Implement the planned programs
Set up planning documents
Monitor and evaluate
Consultation of national
programs
Figure 4:4 DDP Preparation process in the districts Source: Musanze District, 2016

NATIONAL PLANNING SUPPORT SYSTEMS APPROPRIATION IN SECONDARY CITIES IN RWANDA
35
The Imihigo preparation process starts from the lowest administration levels10 up to the national level. In
the districts, the districts’ Imihigo is prepared in a collaborative approach. The district executive committee
(see MIFOTRA, 2015) holds several consultative meetings with representatives from the lower-level
councils. Each district is divided into Sectors, each Sector into Cells, each Cell into Villages, each Village
into Umudugudu and each Umudugudu is made of several households. Members of the households set a
representative to the Umudugudu council, members from each Umudugudu set a representative to the
Village council, and so on, up to district level. The district executive committee considers the inputs from
the lower-level councils and other stakeholders in the districts such as JADF and PSF in drafting the final
districts’ Imihigo. The final draft of Imihigo in the districts is then presented to the District Council for
approval.
10 The administration levels below the districts include: Sector, Cells, Villages, Umudugudu, and Household in the order of hierarchy.
Diagram Source: Rwandapedia, 2016 Figure 4:5 The Imihigo preparation process and the flow of information in a bottom – up
approach various administration levels

NATIONAL PLANNING SUPPORT SYSTEMS APPROPRIATION IN SECONDARY CITIES IN RWANDA
36
The districts’ Imihigo is finally signed by the mayors (see figure 4.1) in a national ceremony headed by the
President of Rwanda. The annual ceremony marks the end of the current year’s Imihigo cycle as well as the
start of the following year’s Imihigo cycle. The awarding of the best performing districts is done by the
President while the decision to remove any underperforming mayors can be removed from the office by the
District Council (see Scher, 2010)
4.4.4. Annual Action plans
The action plans are prepared annually and individually by every staff working in the districts. As the name
suggests, any individual, department or unit prepares a plan that guides the action of the entity within the
next year of operation. The ideas, visions, goals and targets are centred on the long-term plans, mainly the
provision in the DDP.
“I have my own action plan as staff. Then the action plan for all staff becomes the action plan of the unit. The action plans
from all the units become the action plan for the district that which shows all the activities done in the district. We plan every
year but we have also another planning plan which is called DDP. The annual action plan comes from the DDP and we are
involved in every step” – Interviewee 6
The individual staffs’ Action plans are consolidated into departments’ plans and subsequently consolidated
into Units’ Action plan. The final district action plan is prepared by the Director of the Planning, Monitoring
and Evaluation Unit which incorporates all action plans from all the Units. The final draft is then presented
to the district staff drawn from all Units for verification and implementation strategy formulation. The
success in designing and preparing the Action plans is based on the fact that Rwanda has a strong
institutional framework as written by Goodfellow (2013). For instance, the DDP that establishes how Action
plans will be prepared, who are the stakeholders involved and how reporting should be done (Rubavu DDP,
2013). This is strictly adhered to not by the districts’ staff but also all the stakeholders involved in the
planning processes.
The preparation process for annual Action plans is similar to the Imihigo. However, the Action plans
contains many activities to be achieved within the year in a normal working environment, while the Imihigo
contains a set of measurable indicators that shows national focus guided by policies such as vision 2020,
EDPRS-2, DDP, SDP, SDG and aims on achieving good governance, economic development, poverty
reduction and social wellbeing (Rwandapedia, 2016). Some of the district Action plans’ activities end up
becoming the indicators of the Imihigo used in scoring the districts’ performance annually.
4.4.5. Medium term expenditure framework (MTEF):
The MTEF is an initiative of World Bank and International Monetary Fund (IMF) to help developing
countries in managing financial resources by focusing not only on short term plan but also multi-annual
budgeting approaches (World Bank, 2013). In Rwanda, MTEF in the districts is a fiscal planning concept
that is used to promote transparency, efficiency in resource allocation and create a link between different
levels of administration such as Sectors, districts and the national government. MTEF is prepared to cover
a period of 3 years (Short, 2003). Which was also confirmed by interviewee 1.
“When I’m planning and preparing the action plan we use the following: MTEF (Medium Term Expenditure Framework)
which is prepared for a 3 year period” – Interviewee 1
The MTEF is aimed at aligning both the national and districts’ budgetary processes (see figure MTEF in
figure 4.7). The alignment targets to create consistent national and local practice that is trustworthy to even
international stakeholders. As a result, the MTEF has been adopted at strategic planning levels (positioned
in line with national policies such as Vision 2020, EDPRS-2, Poverty Reduction Strategy Paper (PRSP), with

NATIONAL PLANNING SUPPORT SYSTEMS APPROPRIATION IN SECONDARY CITIES IN RWANDA
37
its indicators being part of the Sectoral plans, ministerial plans and DDPs, and operationalised as a channel
of translating strategies into action (Short, 2003).
4.5. Implementation of planning processes outcomes
This section shows the results in understanding the implantations mechanism for the planning outcomes in
the districts (this relate to research question 1.4). The outputs in the districts are implemented in a top-down
approach. That means outputs of the planning processes are communicated to lower levels for
implementation. For instance, the results of districts planning are communicated to Sectors through relevant
Units and from Sectors to cells through cell leaders. The implementation process commonly entails
elaborating the outputs and the roles of the people towards actualising any development plans. For example,
as indicated concerning master plan, the One Stop Centre unit staff member said
“We go down and try to explain to the people and we went in each Sector that the master plan covers and we tell them about
the project, explaining how it will look like so that we can make them understand about the master plan.”- Interviewee 1
Figure 4:6 A diagram showing the link between MTEF to national and district planning and budgetary processes, stakeholders involved and actions at various phases
Source: Short (2003)

NATIONAL PLANNING SUPPORT SYSTEMS APPROPRIATION IN SECONDARY CITIES IN RWANDA
38
The implementation phase in the districts reflects a collaborative process. During the interview with the
district staff, it comes out clearly that the district cannot do anything without involving the JADF and PSF
representatives. In addition, the districts operate closely with the national ministries and agencies to
implement the projects initiated by those ministries. Some plans and outputs have the roles of each
stakeholder formulated and clearly defined as shown in table 4.2. However, the District Council is the
supreme organ that monitors and evaluates the implementation of many plans in the districts. For instances,
according to the DDP, “The district council is the main responsible for the implementation of this DDP” (Musanze
District, 2013. P 58).
Table 4:2 Stakeholders in the DDP implementation, their reporting method, and duration.
Stakeholders Duties Means of Verification
Periodicity
Central government Elaboration of policies, Budget financing policies, annual budget
Annually
Province Ensures the implementation of national policies and directives. Monitor and evaluate performance contracts
Reports Termly (every 3 months)
District executive committee
Coordinates, monitors and evaluates the DDP, prepare and implement performance contracts of district
Reports and field visit reports
Monthly, termly and annual
Sector executive committee
Carries out monitoring and evaluation, decides strategies of actions at their level. Collects and analyses quantitative and qualitative data and transmits reports to District.
Report and field visit report
Monthly, termly and annual
Beneficiaries (from household to cell level)
Contribute to the implementation of projects, participate in the field evaluation.
field visit reports
Monthly
JADF Act as the bridge between partners and District
meeting reports Termly
Information obtained from the Rubavu and Musanze DDPs (Musanze District, 2013; Rubavu District, 2013).
4.6. Discussion
The districts and the whole of Rwanda at large reflects a powerful institutional framework for planning and
governance. This explains why the structure, organisation and administration of the Villages, Cells, Sectors,
districts, and provinces is the same across the country. There exists a strong link between national and
districts governments. National policies such as vision 2020, EDPRS-2, Cabinet Resolutions, MTEF, and
Seven Year Government Programs are strictly observed from national to Sector level. According to
Goodfellow (2013), such policies and regulations have been effective and culminated to transformation in
government service delivery and credibility in Rwanda. Although the districts are decentralised units, there
is strong upward accountability and supervision across the levels of administration (Goodfellow, 2013). In
line with the EAST framework, the socio-institutional influence (refer to section 2.2.2) in Rwanda reflects a
strong power and control aspects (refer to Jankowski and Nyerges, 2001) related to policies which direct
how people in the districts carry out planning activities.
The strong social-institutional structures are seen in how the districts planning processes clearly define the goals
and task of all stakeholders across the administration levels. The existing social-institutional structures have

NATIONAL PLANNING SUPPORT SYSTEMS APPROPRIATION IN SECONDARY CITIES IN RWANDA
39
influenced the participants’ characteristics and the decision-making process. For example, the Imihigo, a
home - grown and unique tool within Rwanda planning and governance framework has promoted planning,
decentralisation and improved performance output (MINALOC, 2011). Imihigo is argued to have nurtured
a culture of transparency and accountability as well as norm and perception of competition for development.
Similar findings were presented by Scher (2010) who points out that Imihigo is a key tool that has a
promising long-term effect on achieving decentralisation in Rwanda. Applying EAST framework aspects
according to Jankowski and Nyerges (2001), the SDF’s PSS tools should be in line with existing structures such
as: methods of implementation (strictly top – down approach), people engagement style (collaborative processes
involving all stakeholders) as well as interaction styles (methods of meetings and sharing ideas) that promote
inter-organisational relationship.
The interests and roles of the districts and national government are clearly defined in Rwanda. The national
government seeks to achieve national goals outlined in national and global documents by transferring the
policies, ideas to the districts and financing the implementation of such ideas. On the other hand, the
districts must integrate the national ideas with the needs of the people which are gathered from within the
districts. Thus despite the common national policies and visions, local planning in Musanze and Rubavu
differs on the priorities and the objectives. This is what Freeman (2009) attributes to policy translation (see
section 2.5) which aims at creating a common local modification of the national policies and then
materialising them into working ideas and plans.
The policy transfer mechanism in Rwanda follows a strictly top-down approach which aims at implementing
the visions, policies as envisioned from national levels. However, the districts translate the national policies
locally and operationalise them differently which explains why the Rubavu and Musanze have different
priorities in their DDPs. Also, the policy translation is also reflected in how the districts score differently in
the annual Imihigo evaluation which is based on national goals of well-being, economic growth, governance
and poverty eradication. Therefore, the SDF’S PSS appropriation in the districts will help the districts in
translating the national policies locally while at the same time strengthening the existing link between
national and district governments.
This chapter has expounded on the existing institutional framework in the districts and the people involved
the planning processes. These relate to social-institutional and user’ characteristics constructs in the EAST
framework which provides a background understanding of where the PSS tools are being introduced. Such
aspects like local planning processes, norms, and rules, implementation procedures and national-local
governments’ relationships will influence the perception of the users. This corroborates the Jankowski and
Nyerges (2001) formulation in the EAST framework.

NATIONAL PLANNING SUPPORT SYSTEMS APPROPRIATION IN SECONDARY CITIES IN RWANDA
40

NATIONAL PLANNING SUPPORT SYSTEMS APPROPRIATION IN SECONDARY CITIES IN RWANDA
41
5. RESULTS AND DISCUSSION: APPROPRIATION OF PSS OUTCOMES AND TOOLS
5.1. Introduction
The objective two of this study focused on understanding how secondary cities (Rubavu and Musanze) will
make meaningful use of SDF’s PSS tools and outcomes in their local planning processes. To this regard,
three questions were formulated to understand the users’ perceptions (positive and negative) of the
usefulness of the SDF’s PSS outcomes and tools, how the tools are likely to be appropriated to the local
planning processes and which Units in the districts are likely to appropriate these outcomes and tools. The
results are from research workshops held in Musanze (workshop 1 and 2) and Rubavu (workshop 3 and 4)
districts. The list of participants and their Units is attached in appendix 4. The following sections report on
the results in answering these questions (related to research objective two) and finalises with a discussion
on the findings.
5.2. Perception of PSS outcomes and tools usefulness
The quantitative results in figure 5.1 show that there was high satisfaction among the 21 workshop
participants in using the SDF’s PSS tools. In figure 5.1, the numbers refer to the participants’ questionnaire
number, the asterisks means extreme outliers (cases that fall 3 times away from the lower or upper fence of
the box plot) and the circles means the normal outliers (cases that fall outside the lower fence of the box
plot). In general, the questions relating to the SDF’s PSS tools and the willingness to appropriate the tools
show a median score of 4 (agree) and a mean of above 4.00 (the detailed analysis results are presented in
appendix 6).
Figure 5:1 Box plot presentation for perception of workshop participants on the SDF’s PSS tools and willingness to appropriate

NATIONAL PLANNING SUPPORT SYSTEMS APPROPRIATION IN SECONDARY CITIES IN RWANDA
42
All the questions represented in figure 5.1 show that the central tendency with participants’ responses
median of 5.0 (for question-related to appropriation, that is, the first three representations in figure 5.1) and
median of 4.0 (for question-related to tools, that is, the last four representations in figure 5.1).
The central tendency shown by high median score implies that many people were satisfied in using the
SDF’s PSS tools which agree with the qualitative findings as discussed in section 5.2.2. Few participants
(shown by numbers 4,6,10, and 15 in the box plot as outliers) expressed negative perception in some
questions. A follow-up discussion with these participants revealed their feedback was influenced by the lack
of prior disclosure of the workshop material and language barrier which limited their participation freedom.
5.2.1. Perception on SDF’s PSS outcomes
The research workshops were organised to demonstrate the SDF PSS outcomes and allow potential users
in the districts to assess the outcomes’ usefulness within the districts. Generally, in Musanze and Rubavu,
potential users perceived the outcomes to be useful for planning, decision-making and monitoring and
evaluation.
The SDF’s PSS outcomes can be used in the district as an aid for planning. The potential users in the districts
pointed that the SDF’s PSS outcomes can be used in urban planning for example, in guiding the process of
master plan formulation and updating. Specifically, the information of MoF (presence or absence of
function) can help in knowing what are the set targets, what is missing and what actions need to be taken.
“In our district, such outcomes can be used in the urban planning for updating master plan. What we need to achieve, what we
need to do... For instances, if some parts or Sectors here there no health cares, it is interesting to us and us as planners we need
to know and we can take necessary measures and see the needs. So I think it is useful in all Units.” – Participant 1:2
In addition, the outcomes of SMCE can be used in the district for planning. According to the participants,
the information of SMCE showing territorial differences based on availability or absence of the functions is
helpful in guiding the districts towards achieving regional balance and development by focusing on closing
the gaps in the Sectors.
“For example take a village that people live near classrooms or schools. So if you see one Sector where you have to do 4 or more
km going to school and there is another Sector where we find that someone can go maybe 500m, it means that there is somehow
a gap. So this kind of maps should help you in planning those. How to fill those gaps ….” Participant 4:1
The other aspect how SDF’s PSS outcomes were perceived useful relates to decision making. The users in the
districts are engaged in various development projects that need decision making. Each unit works closely
with relevant national ministry or agencies in implementing national goals and vision in the districts e.g.
MININFRA working through One Stop Centre unit, MINECOFIN working through planning unit (refer
to section 4:2). The SDF outcomes thus can be useful in decision-making in where to invest and how much
to invest in which area. Accordingly, decision making in the districts involves several stakeholders (see
section 4.3.1) and these outcomes are useful in decision-making while involving all these interested parties.
The outcomes point out territorial gaps based on reality thus making-decision process is made easier guided
by a factual understanding of the region. Similarly, the decision in resource allocation especially budgeting
can be aligned with SDF outcome which helps in seeing the development need and where to implement it
and who are the involved stakeholders.
“It (referring to MoF outcomes) is good for decision-making and filling the gaps…and budgeting for the activities and
then take action and the same time involving the government.” - Participant 4.2
The other usefulness of SDF’s PSS outcomes in the district relates to monitoring and evaluation. Monitoring
and evaluation can be either for the set goals in the districts or any development project undertaken in the
districts. In Rwanda, development projects are usually initiated in the districts by national ministries or
NATIONAL PLANNING SUPPORT SYSTEMS APPROPRIATION IN SECONDARY CITIES IN RWANDA
43
agencies (see section 4.3.2). During the project implementation, the national agencies usually carry out
monitoring and evaluation activities as part of their oversight role in the district. The SDF’s PSS outcomes
can be a baseline for performance evaluation by the districts as well as by the national agencies thus helping
the stakeholders understand the current state of the projects and the progress towards the set goals.
The SDF’s PSS outcomes can also be used in evaluating the development potentialities in the districts
especially in the ranking of territories based on performance and function availability. The MoF scoring can
be useful in evaluating the territorial performance, not just locally, but also nationally towards national goals.
“.. If you are working knowing what is required. I mean the standards, vision, (uses French word “ideale:” which mean
what you what to achieve) in that vision you have the set target which will help you measure the task which is covered and
which is not covered. In every planning, you have the projection, you have the base for setting the projection.” - Participant 2:3
The SDFs PSS outcomes can be used to promote regional competition and development. According to the Rwanda
SDF methodology, the analysis of spatial structures should capture uniqueness in the territories and help in
promoting internationally competitive urban areas (Boerboom et al., 2015). The findings from workshop
show an existing culture of competition as a result of Imihigo scoring and awarding. Scher (2010) explains
that because of the Imihigo “Now districts both citizens and mayors want to compete and want to be the best. This
competition drives development.” (As cited in Scher, 2010 p8). Relating to SDF’s PSS outcomes the participants
referred to their districts with respect to other districts which are secondary cities in competitive terms like
“we want to be the best”, “compare us” or as one participant said “you can see this district or Sector is higher than
my Sector and my Sector or my district, for example, we want to be higher than that other district” – Participant 3.1
Clearly, the drive to be the best pushes the districts to compete in performance and development. Therefore,
the SDF’s PSS outcomes depict the national and regional picture allowing the districts to compare their
current status to the other districts of the same categories (for this case, the other secondary cities).
“Ok, you see.... There (pointing to the spatial structure, a MoF outcome, see figure 2.4) When you look there
around university campus (Huye secondary city) we have agriculture, ok? But here in Rubavu agriculture is a very good
opportunity because we are near the park and we have good seasons. And we get a good quantity of food when we invest in
agriculture.” – Participant 3.2
5.2.2. Positive perception on the SDF’s PSS tools
The responses from the research workshops about the SDF’s PSS tools shows variant perceptions of the
SDF’s PSS tools. Both in Musanze and Rubavu, there was a positive perception by the potential users in
the districts to appropriate the SDF’s PSS tools across the planning hierarchies and in their daily
processes.
Positive perception is interpreted from the remarks of the workshop participants and their willingness to
own the tools. For instance a participant in workshop 1 said “So I like this (referring to the MoF tool) very
much”, during workshop 2, participants asked for the SDF’s PSS tools to use them in their workplaces, in
workshop 3, one participant was asking for the SDF’s PSS tools to be installed in his workplace and in
workshop 4, one participant commented that the tools are interesting to own and very easy to use.
The participants pointed out the usefulness of SDF tool also in the Cells and Sectors planning. The
workshop presented SDF’s PSS outcomes and tools with Sector as analysis unit. Interestingly, the users
pointed out that such tools would be more useful in the Cells and Sectors for the leaders at those levels of
administration to understand their areas better. This is based on the fact that the districts get their data from
the Cells and Sectors (noted from interviews and secondary materials). Therefore, having correct data from
the Cells and Sector would be more useful even for the district in planning and profiling the territories for
development. In fact, planning in the districts is based on the reality in the villages, Cells and the Sectors

NATIONAL PLANNING SUPPORT SYSTEMS APPROPRIATION IN SECONDARY CITIES IN RWANDA
44
because Rwanda uses bottom – up approach in needs identification for planning and only top – down
approach applies for policy implementation and capacity building (refer to roles of stakeholders in section
4.3.2). For example, participant 2.5 in workshop 2 pointed out the usefulness of having the focus on cells
and Sector while relating such to national policies and goals.
“You have shown use the Sectors. You have shown us the situation of the Sectors, do you have for the situation in the Cells in
our Sectors, because I want to know that. For example, now we have studied the health situation in the every cell. And it is
the vision of the ministry of Health is to put a health care in every Cell and even to arrive in every village. Even if we consider
the education domain, in every village, we want to put an ECD in every village, like nursery school to put there so that the
pupils therein, those small children can reach those schools without a problem. So I think, because this is Sector situation, I
think if you have the cell situation and the village situation it will be very fortunate.” – Participant 2:5
The participants showed a willingness to appropriate the PSS tools in their daily operations. These
operations include activities such as data collection, profiling the Villages, Cells and Sectors based on
indicators, and ranking the performance of villages, Cells and Sectors towards districts’ goals and vision.
The participants saw the usefulness of the tools because the data collection for the matrix of functions
crosscut all the Units and thus participants could easily relate their work and the data they use with the data
in the SDF’s PSS tools especially the MoF. However, the more positive reaction was inclined towards the
MoF which is non–spatial data collection and analysis tool, unlike the ILWIS SMCE that was referred to as
“technical” tool that can only be used by some Units as discussed in section 5:2.3.
“We want these tools to use them in our daily activities and do the data collection. We want this in Musanze, can we get the
software now…” – participant 2.1
“It can help in several items like what he has said(referring to participant 4:3) in terms of classrooms, schools, availability, in
terms water to our schools, which schools have water in terms of electricity we can use it in the education system. I think it can
be used in several items in our day to day activities…” – participant 4:2
5.2.3. Negative perception on the SDF’s PSS tools
Appropriation of the SDF’s PSS tools and outcomes may face some challenges in the districts. In all the
research workshops, the focus was to capture the participants’ perceptions either positively or negatively
regarding the SDF framework, SDF’s PSS outcomes and tools. The negative perceptions as coded in the
analysis related to SDF methodology, data and relating SDF with existing policies and procedures. In order
to protect the participants’ identity and allow free criticism, this section does not disclose the participants
and workshops details for ethical issues (refer to section 3.5) but they were mentioned in earlier drafts of this
study to the supervisors.
The Rwanda SDF preparation process according to the expert was inclusive and participatory with
representatives from all the districts (SDF report). However, the participants, who are mainly the people
involved in the districts’ planning processes were not involved in the Rwanda SDF preparation process.
This resulted in a lack of trust in the data collected and the quality of the SDF’s PSS data. Although the SDF’s
PSS data was collected from secondary sources, the negative perception, in this case, was not because of the
SDF framework, tools and outcomes rather the planning approach adopted in collecting data.
Data collection is usually done in a bottom – up approach in Rwanda. The districts are therefore more
confident with their own data collected from the Cells and Sectors. In all four workshops held during this
research, there was heated debate concerning data which related to who collects the data, the criteria,
updating and territorial ranking. One participant pointed out that the tools are useful but questioned the
data collection and quality:
“It is a very useful tool but the question is who is getting the data. We have to get the indicators together as a team and control
the database. If you do not get the backgrounds of the district… Who makes the data, who writes the data who shapes the data
and who is responsible for updating?”

NATIONAL PLANNING SUPPORT SYSTEMS APPROPRIATION IN SECONDARY CITIES IN RWANDA
45
The existing perceptions about the data collection procedures by other organisations (mainly national
agencies) from which SDF developers obtained their data, may influence the acceptance of Rwanda SDF.
For instance, negative feelings and reactions were expressed by one participant, who questioned the use of
secondary data from statistic department which according to him, was not well collected and does not
represent their district well.
“That kind of things (meaning statistics, with raising voice). Do you know that our district was ranked 29th in
collaborating with financial companies? …. (a lady clicked and said What kind of data!) …. (Participants laughing)...
we have banks, we cannot compare with Nyabihu. But they took guy who don’t know even where banks are, people who don’t
know where banks are and they said they are ahead of us”
Such perceptions may be influenced by existing practices. This can happen positively or negatively as
demonstrated during the workshops. One of such negative influence by existing practice is mistakes and
loopholes in the preparations of the master plan and local urban development plans in the districts.
“Am worried about data because I see even in our master plans, local urban development plans I see a lot of mistakes. Yes.
And even in all organisations, they have a problem with data.”
5.3. PSS within districts planning processes
Research question 2:2 sought to understand where SDF’s PSS tools are likely to be appropriated in the
districts’ planning processes. The planning processes and procedures are discussed in section 4.3 which leads
to several outcomes in the districts. Table 5.1 shows the summary of how SDF’s PSS tools and outcomes
can be used in various stages of districts planning. The planning stages are drawn from DDP which is the
main long term plan in the districts from which, other plans are formulated.
Table 5:1 Summary on how PSS tools and outcomes can be applied within the planning processes across the administration levels.
Planning steps
(from DDP )
Administration
Level
Who uses PSS Application (based on workshop
discussions)
Problem
assessment, data
collection and
community need
identification
step
Household
(HH),
Umudugudu,
Village, Cells,
Sectors and
districts.
The general
public in a
participatory
approach,
planning team
and hired
consultant
“Getting data from field and inserting to PSS and
making buffer according to Rwanda building codes the
buffer distance needed for such infrastructure, I think we
now know what we exactly need and where we need it. It
will be very easy. We go through the structure by structure
we find that we have many of the elements but where do
we have it? Where is it necessary to have it? I think it
will be necessary to have these tools?” – Participant 1:3
Districts’ data
analysis, target
setting and
indicators
identification
Sectors,
Districts
Sector
Executive
secretaries,
Districts Unit
staffs, JADF,
PSF
“..If you are working knowing what is required. I mean
the standards, vision, in that vision you have the set target
which will help you measure the task which is covered and
which is not covered. In every planning we have the
projection, you have the baseline for setting the projection.
To that point, I believe everyone can have that tool.” –
Participant 2.1
Consultation
stage and linking
national
programs
Sectors,
Districts
Sector
Executive
secretaries,
Districts Unit
“For the vision 2020, the planning for the whole country,
by 2020 all villages will be at the same level for basic
functions, So this is in line with the existing policies” –
participant 2:4

NATIONAL PLANNING SUPPORT SYSTEMS APPROPRIATION IN SECONDARY CITIES IN RWANDA
46
staffs, JADF,
PSF
Collaboration
meetings in
asserting targets
and needs
solutions
Districts District
Council,
JADF, PSF
“..It is good for making a decision, budgeting for the
activities and then takes action and the same time
involving the government (meaning other stakeholders)”-
Participant 3.2
Implementation,
Monitoring and
evaluation
Sectors,
Districts
Units, District
Council
“..In fact, when we are here when we go to the system, we
can see in our country we are moving like that. We are
here and we want to go to that step. You can see this
district or Sector is high and we are performing how”. –
participant 3.2
5.4. PSS appropriation within the districts’ Units
The research question 2:3 in this study aimed to understand how the Units in the districts are likely to
appropriate SDF’s PSS tools. The question asked during the research workshop was “which Units in the districts
can make use of these tools and outcomes?” The results show that Units in the districts will appropriate SDF’s PSS
tools and outcomes differently.
The One Stop Centre and the Planning, Monitoring and Evaluation Units are likely to be the early adopters
of SDF’s PSS tools. According to the participants in the workshops, the Director of Planning in the districts
is in charge of the overall district planning activities and consolidating units’ plans. Thus, the SDF’s PSS
tools can be more helpful in the Planning Unit by making the planning, monitoring and evaluation processes
easier.
“For the district, we have the department of planning which gathers all the ideas and what we need to do so about these tools
we can help us to know where to put the emphasis where there is gap according to existing conditions.” – Participant 2.3
The interviews carried before the works confirmed that the Planning Unit has used similar tools and
procedures which make SDF framework easier to understand and execute within the Unit.
“We use Excel Sheets, recently we developed the software for management and data collection. Not yet finalised but It is under
process but soon we will be using that system in Years’ time” – Interviewee 1.
In addition, in the past, there has been the institutionalisation of national tools in the Planning, Monitoring
and Evaluation Unit such as MTEF which is discussed in section 4.3.5.
Similarly, the One Stop Centre Unit is in charge of urban development in the districts. The Unit has been
using tools of planning similar SDF’s PSS tools which according to the urban planners, SDF may not be a
complex concept to them. The Unit also has a responsibility for preparing maps and plans on behalf of the
districts which gives the staff a quick understanding of spatial data and information. It was observed that
the participants from One Stop Centre and the Planning, Monitoring and Evaluation Units easily understood
the maps, the SDF’s PSS tools and the concepts of Rwanda SDF and even helped their colleagues to better
understanding and interpreting the SDF’s PSS outcomes.
Although the other Units involved in planning (refer to section 4.2.1) understood the PSS outcomes, the
appropriation of the PSS tools may take longer time and more capacity building may be needed. All the
Units in the district carry out planning assignments and the desire to appropriate the PSS tools over time
may be effective and useful even to all Units as expressed by participants. Interestingly, in the districts, such
advanced tools and concepts like GIS are passed to the other districts’ Units through the One Stop Centre
Unit from the national government. The national government vertically transfers the skills and tools to the

NATIONAL PLANNING SUPPORT SYSTEMS APPROPRIATION IN SECONDARY CITIES IN RWANDA
47
districts and then they are translated horizontally to the other Units in terms of suitable outputs such as
plans, maps and with clear elaborations.
“You see, the central government, first of all give us guidance to follow and you know every year or sometimes the tools of
planning or for the project planning format change. They are going to send use the new format or the new way to elaborate
projects, development project”- interviewee 2
“Why don’t you discuss this with One Stop Centre and then take these to them to put in action in master planning of the
master plan. They are the one concerned with maps” – Participant 4:3
5.5. Discussion
The objective 2 focused on understanding how secondary cities will make meaningful use of PSS tools and
outcomes. The results show a high level of satisfaction which is explained by the willingness to appropriate
among all the workshop participants. The results are from research workshops held in Musanze (workshop
1 and 2) and Rubavu (workshop 3 and 4) districts, with a total of 21 participants (n=21) for the four
workshops. The list of participants and their Units is attached in appendix 4. In figure 5.2, the circles show
the outliers falling below the lower fence of the box plots.
Figure 5:2 Box plot presentation of participants’ perceptions of the effectiveness of the workshop sessions
The boxplot in figure 5.2 shows a median greater than 4.0 which implies that people highly agreed in all
questions asked related to the workshop. Focusing on the participants’ mean (m) and standard deviation
(s.d) as shown in appendix 6, there was high learning level among the participants. The workshop
participants were free to question the outcomes and tools (m =4.1 s.d=1.1), learnt the perspectives of others
(m = 4.4, s.d=0.93), asked questions and got answered (m =4.4, s.d= 0.59) and shared their ideas (m= 4.5,
NATIONAL PLANNING SUPPORT SYSTEMS APPROPRIATION IN SECONDARY CITIES IN RWANDA
48
s.d = 0.75). The quantitative analysis results show a high factual learning (see Goodspeed, 2013) through
sharing ideas in active engagement and evidence seeking attitude through questioning new information in
the workshops.
The findings also confirm the existing structures in the districts where the decisions are made through
dialogue as pointed out by interviewee 5: “in our meetings, we like dialogue and we must have a conscience, we don’t
vote”. The EAST framework establishes that gathering people from diverse knowledge background to
address a specific problem needs a clear task definition at the start to reduce decision-making time and avoid
chances of conflicts (Jankowski & Nyerges, 2001). The results of this analysis show that participants from
districts understood each other and shared common social-institutional structures, where roles and tasks for all
stakeholders are clearly defined and institutions from which planning references is drawn, are strictly
observed by all involved stakeholders. These existing structures may have contributed to the perceptions of
potential users to appropriate the SDF’ PSS tools and outcomes.
Participants who expressed positive perception are influenced by existing policies in the districts. Existing
policies such as building codes and standards which govern development in the secondary cities where
mentioned across all the workshops. Potential users drawn from One Stop Centre who understand the
master plan preparation process linked the use of SDF’s PSS tools in planning such that “after getting data
from field and inserting to GIS and making buffer according to Rwanda building codes the buffer distance needed for such
infrastructure, I think we now know what we exactly need and where we need it and thus we can use these tools, it will be very
easy”. There is perceived the usefulness of the SDF’s PSS tools and outcomes which can be associated with
the understanding of the PSS concepts, capabilities and interpretation of the outcomes by the users
(Jankowski & Nyerges, 2001).
In the districts, there is a clear establishment of the mandates, roles and planning procedures. The roles of
each Unit and staff members are clearly defined and matters related to GIS and map making are handled by
One Stop Centre. The success of SDF’S PSS tools and outcomes will depend largely on how it is placed
within these norms. EAST framework stipulates that such norms, mandates and practices existing in the
districts influence the participants’ views. This can explain why the SMCE tools were referred by some
participants as One Stop Centre tools because all map making activities and tools related to spatial matters
are owned by the One Stop Centre Unit.
The results show potential early and late adopters of SDF’s PSS tools in the districts. The One Stop Centre
and the Planning, Monitoring and Evaluation Units are likely to be early adopters (see DeSanctis & Poole,
1994). These two Units are more likely to appropriate the SDF’s PSS tools within their normal operations
quickly than the other Units because the concepts behind the tools are in line with their existing duties and
match their expectations. The One Stop Centre and the Planning, Monitoring and Evaluation Units,
therefore, can learn from the national government and receive the tools on behalf of the districts and
facilitate the local translation in the districts. The translation in the districts involves elaborating the SDF
tools and outcomes to the other stakeholders (late adopters) within the districts and at various steps in the
districts’ planning process. Late adopters, on the other hand, would appropriate the SDF outcomes easily
but may need more capacity building to appropriate the SDF’s PSS tools. This is because, the late adopters
which include staff members from other Units such as Social, Education and Health, may not have high
expectations for spatial analysis within their roles and duties.

NATIONAL PLANNING SUPPORT SYSTEMS APPROPRIATION IN SECONDARY CITIES IN RWANDA
49
6. RESULTS AND DISCUSSION: NATIONAL PSS APPROPRIATION IN THE DISTRICTS
6.1. Introduction
This chapter focuses on the research objective 3 that aimed to understand how the national PSS tools are
likely to be appropriated by users in the secondary cities. This is answered in three dimensions. First,
understanding how the SDF’S PSS tools’ capabilities are appropriated by users in the districts, second,
discussing the local and expert knowledge gap and third, the observed potential challenges that may
influence SDF’S PSS tools appropriation.
6.2. SDF’s PSS capabilities appropriation
According to the Rwanda SDF developers, the SDF tools and outcomes were developed to help national,
regional and local planning stakeholders in implementing the NUP (see Boerboom et al. 2015). In general,
the results of this study show that the SDF’s PSS tools and outcomes can be used in the districts to achieve
the implementation of NUP and set goals. This can be seen in how the potential users used the SDF tools’
capabilities and the outcomes during the research workshops. The following section presents the capabilities
of SDF’S PSS that are more desired by potential users in the districts namely communication, decision-
making and analysing capabilities (see Te Brömmelstroet, 2013) of the SDF’S PSS tools and outcomes (refer
section 2.3.2).
Communication support capability: The SDF’S PSS tools and outcomes were useful in stimulating
debates and discussion aimed at planning issues relevant to the districts. In all the four workshops,
participants easily understood the SDF outcomes. The participants understood the information contained
in the outputs and recognised the implications which resulted in constructive discussions. This is because
many of the SDF outcomes are delivered to users in form of easy to understand maps. Jankowski and
Nyerges (2001) explain that many people will understand maps and graphics more easily that table thus how
these PSS tools display the information affects the perception of the potential users and their willingness to
appropriate (also see O’Looney, 1997). This explains the high willingness to adopt SDF’S PSS tools and
outcomes even to non-GIS specialists.
The SDF outcomes helped the users understand the spatial situation in their districts and the country at
large. The maps were easy to understand and interpret by the users. For instance, one participant helped
another to understand the meaning of the map showing the current status of the green transport system.
Participant 2.2: I want to know where the red colour in the West come from. ...
Participant 2.3: the red is because in the west there are no much roads, the terrain is bad… Those data that make the map
colour to be like that, they are entered into the software and then you can display the results in different colours and the
software can tell you that if cars which are using this road (pointing to the Musanze –Rubavu road next to workshop
venue), if they were not emitting gases that pollute the environment, then Musanze would be very very green. Like he
(presenter) said Kigali is very green because of those big buses in Kigali city and Kigali city is green (pointing to the map)
compared to Musanze which has pale green. It does not mean cars which are there (Kigali) are not emitting the CO2.

NATIONAL PLANNING SUPPORT SYSTEMS APPROPRIATION IN SECONDARY CITIES IN RWANDA
50
The SDF’s PSS tools and outcomes present a strong mapping and visualisation capabilities (see Jankowski,
Andrienko, & Andrienko, 2001) which make it easy for users to have a common understanding of the spatial
situation. For instance, the colour red is used throughout all the SDF’s PSS outcomes to show poor
performance and green colour showing excellent performance towards a particular goal (see figure 6.1). This
was easily understood by all participants in the workshops. Based on this understanding, then planning needs
are identified and decisions can be made.
Decision support capability: The aim of any decision-making tools in planning, is to make the planning
process more effective and efficiency (Huber, 1984). This can be related to the finding of this study where
participants would see what is missing and where it is missing and then make a well-versed decision. For
instance, the SMCE criteria tree allowed the participants to vary weight on indicators based on their priority.
The SMCE outcomes can be seen in real time and allow the participants to reach the best decision within
the short time. Another capability is the Euclidean distance in the spatial analysis which allows the
participants to assess territorial performance more easily by factoring all existing policies such as building
codes. The participants can then see which areas are more suitable for specific development and take the
best decision.
“After getting data from field and inserting to PSS and making buffer according to Rwanda building codes, the buffer distance
needed for such infrastructure, I think we now know what we exactly need and where we need it” – participant 1.3
In addition, Participants’ response to a question on decision making capability of the tools and outcomes
shows they agree with the question “Tools are good for decision making and implementing current policies”
(mean= 4.29, s.d=0.72). This reflects a strong internal commitment to the choices made by the participants
during the workshops.
Figure 6:1 Visualising the green transport status in Rwanda as presented in SDF outcomes Data Source: Rwanda SDF, 2016

NATIONAL PLANNING SUPPORT SYSTEMS APPROPRIATION IN SECONDARY CITIES IN RWANDA
51
Analysis support capability: the analysing capability of PSS is aimed at bringing advanced data
manipulation and processing in order to help the potential users to derive meaning. SDF PSS tools use both
primary and secondary data. The secondary data is collected from national organisation such National
Institute of Statistics of Rwanda (NISR). The data is analysed and visualised to convey meaningful
information to the users in spatial perspectives. The analysis involves multiple inputs of both spatial and
non-spatial data. Multi-attribute decision analysis such as weighing of functions, decision criteria and
performance ranking generates a superior decision and informative results (see Malczewski & Rinner, 2015).
The data is visualised in an advanced manner in the MoF and SMCE outcomes. For instance, the analysis
of Integrated Household Living Conditions Survey (EICV), which is a national survey done every five years
on changes in wellbeing as shown in figure 6.2 for Musanze, Nyabihu and Rubavu, resulted in a debate
about the territories’ differences and also new perceptions about the territories in terms of basic functions.
The SDF’s PSS outcomes allow the participants to see the performance difference between the territories
in an advanced manner as compared to the normal tables and charts.
Interactive support capability: Interaction is used here to refer to two processes namely user- user
interaction and user- computer interaction. User-computer interaction is a process that allows the users to
interact with the tools and their capabilities. The SDF intractability was limited due to the fact that data
entry and analysis has to be done prior to stakeholders’ meeting. In addition, the design of the tools and the
outcomes are made as reference tools for any decision making and planning meetings. The question on how
Figure 6:2 An extract of the visualisation of EICV 3 data on transport accessibility showing better performance in Musanze than Rubavu
Data Source: Rwanda SDF, 2016

NATIONAL PLANNING SUPPORT SYSTEMS APPROPRIATION IN SECONDARY CITIES IN RWANDA
52
the SDF’s PSS outcomes were prepared and the demand by participants to understand the whole process
clearly highlights the need for interactive PSS in the districts where users can be involved in generating the
outcomes. For instance, one participant inquired “I was just asking for example if you see in excel if you are inputting
data in excel, then you need to produce graphs, they are produced automatically based on that data. Are the tools functioning
like that?”
Although the analysis is done using technical software (MS-excel, ArcGIS and ILWIS), the ability of the
designed SDF’S PSS to show the analysis in real –time can help in improving the interaction and acceptability
of the tools. This could allow the users have hands-on interaction with the tools and understand the process,
the data and the outcomes.
6.3. User – Designer knowledge gap
Geertman and Stillwell (2009) wrote a detailed survey about the use of PSS in the real world and identified
key bottlenecks that have contributed to poor penetration and usage of PSS. They summarise these into
three aspects namely instrumental, transfer and user approach.
The instrument approach is concerned with the quality of the instruments and how they can fit the purpose
they are designed for (Geertman & Stillwell, 2009). From the preliminary results, the developers have
considered the local planning needs and the policy frameworks in designing PSS tools which clearly
addresses the planning needs in the districts. The SDF’s PSS tools are based on the local planning context
in Rwanda and also guided by Rwanda National Urbanisation Policy. The tools are adapted to the needs in
Rwanda guided by the NUP and aimed to help the stakeholders involved in any planning processes in
Rwanda (see Boerboom et al., 2015). This adaptation of the SDF’s PSS tools gives the relevant of the tools
in the districts planning processes as discussed in section 5.3.
The user approach relates to the users’ characteristics and how these influence the perception of PSS. The
main issue identified in the districts relates to awareness and knowledge about Rwanda SDF and the NUP.
There is lack of information about the NUP and SDF methodology in the districts as pointed by one
participant who said: “…some of us are not informed about that National Urbanisation Policy”. In addition, there are
no qualified experts in the PSS application in the districts to facilitate the implementation of these SDF’S
PSS tools and outcomes. These findings corroborate Vonk et al (2005) who wrote that key issues that affect
widespread use of PSS include lack of experience, a little awareness and lack of intention to use the PSS
(Vonk et al., 2005). However, the designers of the SDF’S PSS proposed a solution aimed at the capacity
building across the districts in Rwanda.
“The use of GIS as a decision-making tool for regional and urban planning purposes is still low and skilled professionals
working at the governmental institutions at the national and local level are scarce. Given these circumstances, the SDF focused
on capacity building to start raising awareness on the use of GIS as a decision-making tool and reduce the capacity barrier
within national institutions.” (SDF, 2016 p 66).
Another main issue related to users which may affect the acceptance of SDF’S PSS is data related issues. In
the districts, there is low trust in data gathered by national agencies as opposed to locally collected data. It
was established that the districts collect data from and aggregated at the Villages, Cells and Sectors that they
consider more useful for local planning. The data from the lower administrative levels give more accurate
background situation of the districts which guides the districts in formulating Action plans and Imihigo.
The national agencies’ data, on the other hand, is collected across the country and aggregated at Sector and
district levels. The national agencies data is then analysed with national interest which sometimes does not
address specific issues as it may be needed in the districts. This study has found a difference in aggregation
levels between the data by national agencies and the data by the districts which leads to the low trust of the
national data by the districts.
NATIONAL PLANNING SUPPORT SYSTEMS APPROPRIATION IN SECONDARY CITIES IN RWANDA
53
In addition, the Rwanda SDF development process appeared to have not factored in local knowledge in the
districts. Such knowledge like who is answerable to issues of SDF’S PSS, who are the key person to supply
specific information among others.
“….where is the data coming from if you are not asking us… If you are not asking urban planners if you are not asking our
mayors, how you got the information, how did you make the information, how did you make the questionnaires?” – Participant
1.2
Challenges related to SDF’S PSS design as identified in the district include categorisation of functions. This
relates to how the SDF’s matrix of functions scores the districts based on absence or presence of function.
There is no adaptive strategy to classify and categorise functions according to preference and importance in
the districts. Thus it is unrealistic to say Musanze scores less because they do not have harbour and ports
which in reality is impractical. Therefore, the performance evaluation and ranking should be based on
existing standards that govern secondary cities and not just comparing the performance based on the cities
themselves, as one participant said “There are the standards that certain cities need to reach. We see that Musanze is not
just comparing to Huye but the standards that we need to reach. I think that is important to follow”.
Therefore, the design of the tools will be more meaningful to the districts, if they allow data integration
from the districts, allow regular updates and offer visualisation of the local situation at the same time
integrating national goals.
Another design challenge is related to implementing urban building codes and standards within SDF.
Rwanda urban building standards are adhered to strictly in the urban development. The Rwanda SDF is
made to guide urbanisation in Rwanda and thus, it should incorporate the principles envisioned in Rwanda
building codes and standards. The importance of this aspect is, the districts will not be assessed only by
availability or absence of function but the efforts towards implementing the urban planning rules. For
instance, the SMCE results should incorporate buffer zones around protected areas or distance from central
functions such as an airport, because it is not practical to have an airport in each Sector. As stated by
participant 1.1:
“For me, I think we cannot make airport in all Sectors. I think we can ask about distance from the Sector to the airport. If
we get one airport in all districts is enough. Or even one in two districts or all Northern Province. For me, I think the checklist
that we use must put the distance that is needed to access those infrastructure…. And we can use GIS to implement those codes.
GIS can help in implementing those codes.” –participant 1.1
The transfer approach is concerned with how PSS appropriation and use in the districts happens and moves
from a new concept to practices within the local planning process. For the workshops, there is high
excitement and willingness to appropriate the SDF’S PSS and need to own the tools. The transfer can
happen in two folds in the districts. It was observed that some Units are likely to understand the tools and
outcomes quickly than others (hereby referred to as early adopters). To this regards, the top – down
strategies can easily be transferred to these Units which will, over time, translate the SDF’S PSS tools to the
other Units (late adopters) in line with local planning needs.
6.4. Potential challenges for PSS appropriation in the districts
Existing challenges in the districts can be classified into three categories namely understaffing, financial
constraints and capacity building. Understaffing refers to a situation where Units have less number of staff
than the formally established positions. For instance, during data collection, one of the staff was working as
construction and permitting officer, GIS expert and urban planner. Such experiences have resulted to low
performance and motivation and staff have no time to engage in other tasks. This is likely to affect the

NATIONAL PLANNING SUPPORT SYSTEMS APPROPRIATION IN SECONDARY CITIES IN RWANDA
54
effectiveness of appropriation within the districts if the introduction of the SDF’S PSS tools and outcomes
implies more duties and responsibilities to the staff.
“The problem I saw here in Rwanda, we have good laws (meaning policies). All is very clear about the building permits,
the urban procedures all are clear by law. The problem here is colleagues are always overwhelmed by work and they do not have
time to read the procedures /laws” – interviewee 4.2
The financial constraint is a major issue in the districts given the fact that the districts operate under limited
financial resources (also confirmed by Planning, Monitoring and Evaluation Directors during the
interviews). Pfeffer et al. (2013) wrote that some of the challenges of using advanced technologies are its
technicalities and cost. Appropriating such tools in the districts needs budgeting which is a challenge for
both central and local governments.
“We are trying to link district priorities with national priorities and national program or national financial capacity, as you
know our financial capacity is very low due to the lack of budget and finance which is a big problem to implement the activities
set.” - Interviewee 1.
However, the designers of the SDF used a free open source software ( see Prem Kumar et al. 2014) called
ILWIS which significantly reduces the infrastructure cost.
Capacity building is related to lack of enough skilled labour in the districts. From the questionnaires
feedback, 18 out of 21 people identified the issue of knowledge and skills on the use of the SDF’s PSS tools
as the main challenge that can affect appropriation of the SDF’S PSS as shown in figure 6.3 (A copy of the
questionnaires is attached in appendix 1). Currently, in the districts, there is no qualified staff to appropriate
the SDF’S PSS tools and use them effectively. To overcome this challenge, the Rwanda SDF proposes a
capacity building grogram across all the districts to empower potential users on the use of SDF tools as an
alternative for decision-making (Rwanda SDF, 2016).
The Implementation of the Rwanda SDF is likely to face challenges related to tools ownership and data.
The results from the workshops indicate a need for tools ownership by the users in the districts and also
accessibility to the SDF tools database. The challenge in the appropriation process may include: how the
districts can use their locally acquired data within the SDF’s PSS tools and then generating the outcomes,
who updates the databases and how frequently the data should be updated.
0 5 10 15 20
Capacity Building
Tools and DataOwnership
Time
Financial Constrain
Frequency
Figure 6:3 Questionnaire results showing the challenges that may impede SDF’s PSS tools appropriation in the districts.
Data source: workshops participants’ feedback

NATIONAL PLANNING SUPPORT SYSTEMS APPROPRIATION IN SECONDARY CITIES IN RWANDA
55
6.5. Discussion
The results in this chapter depict which PSS tools’ capabilities are needed in the districts. The research
workshops revealed that the participants need SDF’S PSS tools for assessing their districts situation and
linking to existing local and national policies. There is an identifiable need for tools that can help the
potential users in the district’s plan, make a decision and understand their territories better. A clear
distinction why the need for SDF’S PSS for long term planning is needed but also with the ability to support
short-term managerial decision making (see Geertman & Stillwell, 2009). The results also show the potential
users’ ability to correctly appropriate SDF’S PSS structural features such as maps, charts and tables within their
context. The SDF’S PSS tools and outcomes use visualisation aids (maps and tables) which allow deep
thinking that forces users to interpret the results and evaluate their performance in details. EAST framework
establishes that such aids make a meeting more explicit, technical, and practical (Jankowski & Nyerges,
2001).
Another aspect related to PSS structural features is time and place of meeting. Apart from having good tools
for communication, analysis and decision making as shown in the results, there is a need for PSS that can
be accessed by all stakeholders when needed. The potential users in the districts work closely with respective
staff in the Cells and Sectors. This implies the need for PSS tools that can be accessed not only in the office
but also in the field. Poole and DeSanctis (1989) writes that the number of meetings, the flexibility of venue
and the comfort level in using the PSS determines the appropriation perception by users. The SDF’S PSS
tools should, therefore reduce the meeting time and data collection which was identified as a potential
challenge in the districts (see figure 6.3).
Challenges that may impede SDF’s PSS appropriation relate to the expert – user knowledge gaps. Vonk and
Geertman (2008) points out that one of the bottlenecks of the use of PSS is the mismatch of the designer
knowledge and the intended users need. For example, the district desire for SDF’S PSS tools that factor in
building codes and standards in the secondary cities confirm the need for tools that are adaptive to local
planning needs. This corroborates with the recommendation by Vonk, Geertman, and Schot (2007) on the
need to incorporate existing local knowledge in designing the PSS tools. This study also supports Goodspeed
(2016) claim that PSS study should be done with real users’ who reveal detailed information that cannot be
found in a lab- setting experiments (also see Batenburg and Bongers, 2001). The real stakeholders disclose
useful information about the context of PSS application such as norms, mandates and practices which
cannot be explored in a laboratory setting experiment.
Despite the potential challenges in the districts (capacity building, time, tool ownership and finances), there
are potential opportunities for SDF’S PSS appropriation. First, Early adopters (One Stop Centre Unit and
the Planning, Monitoring and Evaluation Unit) have prior experience in using similar tools such as Excel
sheets, GPS and DPIMS, which make it easier to appropriate SDF’S PSS tools and outcomes. Second, the
focus on secondary cities as important centres for urbanisation in Rwanda (as defined in NUP), offers a
conducive opportunity for Rwanda SDF appropriation in the districts.
While many participants in the districts were puzzled about data used in SDF tools, the Rwanda SDF
presents an opportunity for an integrated system that stakeholders can access remotely. This will promote
data interoperability within the districts and national government. The strength in the district is that there is
internet connectivity that makes it suitable to appropriate the SDF’S PSS tools and outcomes into a dynamic
online system.

NATIONAL PLANNING SUPPORT SYSTEMS APPROPRIATION IN SECONDARY CITIES IN RWANDA
56

NATIONAL PLANNING SUPPORT SYSTEMS APPROPRIATION IN SECONDARY CITIES IN RWANDA
57
7. CONCLUSIONS AND RECOMMENDATIONS
7.1. Conclusions
The main objective of this study was to understand how secondary cities in Rwanda are likely to appropriate
national Planning Support Systems (PSS), which are part of the Rwanda Spatial Development Framework
(SDF). Based on the results derived from the research workshops in Rubavu and Musanze districts in
Rwanda, this study has established that existing social-institutional structures (policies, laws, norms and power)
and user characteristics (knowledge, mandate and expectations) in the districts are likely to influence SDF’S
PSS appropriation and users’ perceptions.
The analysis of the existing social-institutional structures in the districts as discussed in chapter 4 revealed a
strong link between the national and district governments. Typically, in Rwanda, there is a strong
institutional framework that defines tasks and roles of stakeholders in the planning processes. This
corroborates Goodfellow (2013). The planning processes in the districts reflect a collaborative bottom – up
process (mainly districts, Private Sector Federation, Joint Action Development Forum, and Sectoral
Executives as stakeholders) and a participatory approach that starts from household level up to district level
(see section 4.4). In terms of policy implementation, there is a top – down approach of policy transfer where
directives are issued from higher to lower administration levels (see section 4.5). This study, therefore
concludes, in line with Jankowski and Nyerges (2001), that the existing social-institutional structures are likely to
influence the PSS appropriation.
The users’ characteristics such as participants’ knowledge and expectations reveal potential of vertical and horizontal
SDF’S PSS appropriation in the districts. Some staff in the districts such as the staff of the One Stop Centre
Unit and the Planning, Monitoring and Evaluation Unit are likely to appropriate SDF’S PSS more quickly
than the other Units. In addition, the One Stop Centre Unit and the Planning, Monitoring and Evaluation
Unit staff members are more likely to appropriate both SDF’s PSS tools and outcomes (see section 5.4)
more quickly than the other Units because such tools and outcomes are in line with their existing duties,
mandates and knowledge (see section 4.3.2). The SDF’S PSS tools (Matrix of Functions and Spatial Multi-
Criteria Evaluation) facilitate data collection, analysis and help in decision making process. The SDF’S PSS
outcomes (mainly maps) are the products of the SDF’S PSS tools and are used to communicate information
(see section 6.2). The staff in the One Stop Centre Unit and the Planning, Monitoring and Evaluation Unit
are involved in data collection (spatial and non- spatial), analysis and communication hence both the SDF’s
PSS tools and outcomes are relevant to them (see section 5.2.2). Therefore, the staff in One Stop Centre
Unit and the Planning, Monitoring and Evaluation Unit represent early adopters (DeSanctis & Poole, 1994)
whom the national government can vertically transfer the SDF’s PSS tools and outcomes.
The other Units in the districts such as Education, Health and Social Units represent late adopters who are
likely to fit in the horizontal appropriation. The horizontal appropriation happens when the early adopters
in the districts translate the SDF’S PSS tools and outcomes to the late adopters in the districts. The
horizontal appropriation is based on the fact that the late adopters, within their existing mandates, do not
have high expectations and knowledge of spatial matters. Since late adopters’ expectations and knowledge are
aligned with using the products of the analysis process, only the SDF’S PSS outcomes are more relevant to
them. Therefore, the late adopters may need translation by the early adopters in order to make meaningful
use of the SDF’s PSS tools and outcomes.
NATIONAL PLANNING SUPPORT SYSTEMS APPROPRIATION IN SECONDARY CITIES IN RWANDA
58
The results of the users’ perception analysis revealed different perceptions of SDF’s PSS tools and outcomes.
The result of this study in section 5.2.1 shows that the SDF’s PSS outcomes can be used in the districts, in
line with existing plans and policies for: planning (long term goals), decision making (short term goals), monitoring
and evaluating and promoting regional competition and development (comparing one district performance to another
and competing to be the best in line national policies). The results on SDF’s PSS tools in section 5.2.2 show
that the districts are likely to appropriate the tools for improving their operations in terms of communication,
data analysis, visualisation and interactivity (see section 6.2).
In contrary, challenges that could impede the appropriation of SDF’s PSS tools are those which are
associated with SDF’s PSS data on one hand, and preparedness of the potential users on the other hand.
The results in section 5.2.3 show that SDF methodology used secondary data from national agencies such
as National Institute of Statistics Rwanda, which is not trusted by some of the participants in the districts.
This is because National agencies aggregate their data at Sector and district levels. The districts collect their
data from the Cells and Sectors (see section 4.4) in a bottom-up approach and use such data for district
planning purposes. The SDF’s PSS tools should integrate the locally acquired data in order to improve
acceptability of SDF’s PSS tools in the districts. The preparedness of the potential users in the districts relate
to issues of finance, skilled personnel in the PSS application, which corroborates Klosterman (1995), and
the knowledge about the Rwanda Spatial Development Framework and the Rwanda National Urbanisation
Policy (NUP).
There have been successful policy transfers from national government to districts in Rwanda. Such policies
as Medium Term Expenditure Framework and Imihigo have been successfully institutionalised and
implemented in the districts under the supervision of national agencies and ministries. Similarly, this study
concludes that the Rwanda Spatial Development Framework, under the Ministry of Infrastructure (in charge
of urbanisation and spatial development) can follow a similar procedure and be appropriated across the
country. The strong institutional framework in Rwanda is likely to offer a favourable ground for national
policies such as Rwanda Spatial Development Framework to succeed because national initiatives are strictly
implemented in a top-down approach as identified in this study and agree with Goodfellow (2013).
This study concludes that the SDF’s PSS tools and outcomes are likely to be appropriated in the districts
not only for spatial planning but also as a platform for the Rwanda National Urbanisation Policy transfer
and translation. The policy transfer happens between the national government and the districts’ early
adopters where the policy is moved to the districts and expected to be implemented (as the SDF’s PSS tools
and outcomes are being appropriated). The policy translation happens locally within the districts when
potential users in the district operationalise the NUP goals in the local context.
7.2. Study limitations
This study aimed to understand how PSS appropriation would happen in the districts. Though this target
has been achieved, the study focused on potential users in the districts. Therefore, it is inevitable to overlook
the interest of other stakeholders such as Private Sector Federation and Joint Action Development Forum
who are actively involved in the district planning processes. The conclusions of this study, therefore, may
be limited to the interests of the districts’ staff and not representing the interest of the other stakeholders.
This study found no significant differences in Rubavu and Musanze districts. This is in terms of existing
social-institutional structures, user’ characteristics and perceptions of SDF’s PSS tools and outcomes. The
similarities may be due to factors such as the location (close to each other), planning needs and economic
goals (tourism and gateway cities) in Rubavu and Musanze districts. These similarities may not apply in other
NATIONAL PLANNING SUPPORT SYSTEMS APPROPRIATION IN SECONDARY CITIES IN RWANDA
59
secondary cities such as Huye that has different planning needs and economic goals (education and
innovation).
The duration of each workshop was 2 to 3 hours. The time may have limited the possibilities to explore all
relevant aspects of the SDF methodology, tools and outcomes. This was overcome by use of printed copies
of the SDF’s PSS outcomes, PowerPoint presentation and video clips that helped the participants to
understand the SDF’s PSS tools and outcomes. However, a more detailed study with longer period may
allow the users in the districts to explore, in details, the aspects of the SDF’s PSS tools and outcomes.
Qualitative data acquired in this study need to be understood in the right context. The information disclosed
by the people involved (interviewees and research workshop participants) may be limited to their knowledge
of the districts planning processes and their own perspectives and attitude towards new ideas. Cross-
checking the information from these people (triangulation) with other sources helped in building consistency
in the study.
Another limitation is related to the language barrier. The language barrier was minimised by interviewing
staff who could speak English and Swahili, and the use of a moderator for the research workshops.
However, the participants and interviewees would have expressed themselves more freely to the researcher
if they were engaged in the native Kinyarwanda language. In addition, the language translation may have led
to the loss of some data that would have been useful (to the researcher and the participants).
While this study focuses on how appropriation would happen, the complexity of any process may not
happen as anticipated by potential regular users. The appropriation also may be influenced by other factors
such as political will. For example, L. Boerboom (Personal Communication, December 19, 2016) confirmed
the Ministry of Infrastructure is committed to the Rwanda Spatial Development Framework. Political will
among other factors were not the focus of this study although they may influence SDF’s PSS appropriation.
The study of appropriation also demands a long-term investigation of how people make use of technology
in planning processes. While this study builds on existing literature in understanding its appropriation
potentialities, a future research window exists in Rwanda to understand how PSS appropriation will happen
in real time once the PSS are introduced and institutionalised.
7.3. Contribution to policy
The findings of this study should serve as a guideline in implementing Rwanda SDF in the six secondary
cities. This study recommends an appropriation of the Rwanda SDF in the secondary cities, within the One
Stop Centre Units with support from MININFRA (central government). The MININFRA within their
established urbanisation roles can transfer the NUP and Rwanda SDF to the One Stop Centre Units. The
One Stop Centre can then translate SDF’s PSS tools and outcomes into an understandable local context in
the districts for all other Units.
The SDF’S PSS tools should be adaptive to the peculiarities of the districts. That is, allowing districts to
integrate their locally acquired data from the Sectors and Cells, and then comparing to a national database
that gives a national outlook. This is because of the differences in the aggregation level for the national
government’s data (Sector and district level) and the districts’ data (Cell and Sector levels). The SDF’s PSS
tools appropriation presents an opportunity for data interoperability between the national and districts the

NATIONAL PLANNING SUPPORT SYSTEMS APPROPRIATION IN SECONDARY CITIES IN RWANDA
60
governments through a networked database accessible by both national and districts governments although
the capacity building is needed at district levels.
This study has identified a need for capacity building in the districts. Capacity building includes financial
support, staff training and tools ownership in the districts. This study recommends that the national
government, within its mandate, should train staff in the districts on the Rwanda National Urbanisation
Policy and Spatial Development Framework of Rwanda and how the SDF’s PSS tools and outcomes are
relevant in implementing the NUP at the districts levels.
These recommendations are in line with what MININFRA intends to implement, that is, the project to roll
out GeoData platforms in the MININFRA national database and districts (MININFRA, 2016a). The
GeoData platform implementation should benefit from this study in its background survey.
7.4. Contribution to research
This study contributes to the scientific community in understanding how PSS appropriation can link the
national and district administration levels. The study contributes to the ongoing studies on the application
of PSS in various domain and goes further to show how the PSS can be used for policy transfer and translation.
The study concludes that PSS appropriation has the potential to help in national policy transfer to the
districts and policy translation in the districts.
This study goes beyond a laboratory experiment and tests the appropriation of PSS with real world
stakeholders who understands the planning needs and policies in the PSS application context (Batenburg &
Bongers, 2001). Such real world study gives rich knowledge and information to the PSS experts and
developers as opposed to just role-play studies organised in laboratories which are part of the bottlenecks
that have hindered widespread use of PSS according to Vonk et al (2005). The study has shown how various
social-institutional aspect such as policies, norms, mandates can influence the PSS appropriation in the real
world. Furthermore, the study has explored how PSS appropriation is influenced by user characteristics such
as knowledge and expectation. The study identified that user’ mandates, roles, knowledge and expectations,
sets two groups of PSS adopters namely: the early adopters who can appropriate the PSS within a short time
and the late adopters who may take a longer period to appropriate the PSS.
In terms of PSS literature, the study was based on the EAST framework and it’s constructs, aspects and
premises (Jankowski & Nyerges, 2001). The study has contributed to the empirical studies that have applied
EAST aspects in studying how advanced technology introduced in an organisation get to be appropriated.
Further, this study has shown that PSS as an innovative technology can be studied within the EAST
framework. The EAST framework has been used to explain how the PSS appropriation can be influenced
by the existing social-institutional and user characteristics aspects in the PSS’s application context.
However, this study creates a chance for series of future studies related to SDF’s PSS appropriation. First,
the need to repeat this study with all stakeholders involved in the district’s planning processes and
incorporate diverse interests. This includes carrying out interviews and research workshops with participants
from the JADF, PSF, the Sectors’ Executives and representatives of the donor community.
Second, once the Spatial Development Framework of Rwanda is introduced and institutionalised in Rwanda,
there is a need to study the process and the outcome of appropriation of the SDF’s PSS tools in all the
districts. The future studies can be carried out in the same districts and compare to the findings of this study
or compare to the process and outcome phases as defined in EAST framework (Jankowski & Nyerges,
2001).

NATIONAL PLANNING SUPPORT SYSTEMS APPROPRIATION IN SECONDARY CITIES IN RWANDA
61
Third, comparative studies are recommended. The comparative studies can be in two ways. One, comparing
the other secondary cities in Rwanda with Rubavu and Musanze in order to establish factors that influence
successful PSS appropriation and policy translation in the secondary cities. The second way is by comparing
the PSS appropriation in another institutional framework, probably in a different country and establish how
appropriation differs from the Rwandan context.
Fourth, this study focused on the appropriation of PSS tools but not much on the institutionalisation
concept. While the case in Rwanda PSS appropriation involves policies, there is a need to study the role of
PSS tools in policy translation in the districts.

NATIONAL PLANNING SUPPORT SYSTEMS APPROPRIATION IN SECONDARY CITIES IN RWANDA
62

63
LIST OF REFERENCES
Arciniegas, G., & Janssen, R. (2012). Spatial decision support for collaborative land use planning workshops. Landscape and Urban Planning, 107(3), 332–342. http://doi.org/10.1016/j.landurbplan.2012.06.004
Auma, S. L. A. (2012). Integrating community participation for urban redevelopment planning in Zanzibar town. Faculty of Geo-Information Science and Earth Observation of the University of Twente. Retrieved from http://www.itc.nl/library/papers_2012/msc/upm/auma.pdf
Bakker, S., & Jacob Trip, J. (2013). Policy options to support the adoption of electric vehicles in the urban environment. Transportation Research Part D: Transport and Environment, 25, 18–23. http://doi.org/10.1016/j.trd.2013.07.005
Barton, J., Plume, J., & Parolin, B. (2005). Public participation in a spatial decision support system for public housing. Computers, Environment and Urban Systems, 29(6), 630–652. http://doi.org/10.1016/j.compenvurbsys.2005.03.002
Batenburg, R. S., & Bongers, F. J. (2001). The role of GSS in participatory policy analysis - A field experiment. Information and Management, 39(1), 15–30. http://doi.org/10.1016/S0378-7206(01)00076-3
Baud, I., Scott, D., Pfeffer, K., Sydenstricker-Neto, J., & Denis, E. (2015). Reprint of: Digital and spatial knowledge management in urban governance: Emerging issues in India, Brazil, South Africa, and Peru. Habitat International, 46, 225–233. http://doi.org/10.1016/j.habitatint.2015.01.018
Berend, A. (2013). Technology appropriation revisited: Mediation theory as a new philosophy of technology for information systems research. University of Twente. Retrieved from http://essay.utwente.nl/62736/1/Berend_Alberts_-_BIT_Master_Thesis.pdf
Boerboom, L., Gibert, M., Spaliviero, M., & Spaliviero, G. (2015). The spatial development framework for implementation of national urban policy. In GeoTech Rwanda (pp. 1–9). Kigali. Retrieved from https://www.geotechrwanda2015.com/wp-content/uploads/2015/12/219a_Luc-Boerboom.pdf
Bryman, A. (2012). Social research methods. Oxford University Press (4th ed., Vol. 4). New York: Oxford University Press. http://doi.org/10.1017/CBO9781107415324.004
Bugingo, I., & Interayamahanga, R. (2010). A study on the development and use of governance indicators in Rwanda. IRDP. Kigali. Retrieved from http://www.undp.org/content/dam/undp/library/Democratic Governance/rwanda_report_idasa_comparative_study_2011.pdf.
Chun, K. J., & Park, H. K. (1998). Examining the conflicting results of GDSS research. Information & Management, 33, 313–325. http://doi.org/10.1016/S0378-7206(98)00038-X
Czarniawska, B., & Sev’on, G. (2005). Translation ls a vehicle, imitation its motor, and fashion sits at the wheel. In S. R. Clegg & S. Ralph (Eds.), Global ideas: How ideas, objects and practices travel in the global economy (pp. 3–14). Malmö, Sweden: Liber & Copenhagen Business School Press.
De Man, E. (2000). Institutionalization of geographic information technologies: Unifying concept? Cartography and Geographic Information Science, 27(2), 139–151. http://doi.org/10.1559/152304000783547920
Delaney, P. J. (2010). A grounded theory study of technology appropriation in anaesthesia. Queensland University of Technology. Retrieved from eprints.qut.edu.au/37268/1/Patrick_Delaney_Thesis.pdf
DeSanctis, G., & Poole, M. (1994). Capturing the complexity in advanced technology use: Adaptive structuration theory. Organization Science, 5(2), 121–147. http://doi.org/doi: 10.2307/2635011
DeSanctis, G., Poole, M., Zigurs, I., DeSharnais, G., D’Onofrio, M., Gallupe, B., & Associates, O. (2008).
The Minnesota GDSS research project : Group support systems , group processes , and outcomes. Journal of the Association for Information Systems, 9(10), 551–608. Retrieved from http://aisel.aisnet.org/jais/vol9/iss10/6
64
Elbeltagi, I., & Mcbride, N. (2005). Evaluating the factors affecting DSS usage by senior managers in local authorities in Egypt. Journal of Global Information Management, 13(2), 42–65. http://doi.org/10.4018/jgim.2005040103
Elwood, S. A. (2001). GIS and collaborative urban governance: Understanding their implications for community action and power. Urban Geography, 22(8), 737–759. http://doi.org/10.1080/02723638.2001.11501633
Euske, K. ., & Dolk, D. . (1990). Control strategies for group decision support systems: An end-user computing model. European Journal of Operational Research, 46(2), 247–259. http://doi.org/10.1016/0377-2217(90)90135-X
Freeman, R. (2009). What Is “Translation” ? Evidence & Policy, 5(4), 429–447. http://doi.org/10.1007/978-1-349-26070-6_1
Garriga, R. G., de Palencia, A. J. F., & Foguet, A. P. (2015). Improved monitoring framework for local planning in the water, sanitation and hygiene sector: From data to decision-making. Science of the Total Environment, 526, 204–214. http://doi.org/10.1016/j.scitotenv.2015.04.078
Gebauer, C., & Doevenspeck, M. (2015). Adaptation to climate change and resettlement in Rwanda. AREA, 47(1), 97–104. http://doi.org/10.1111/area.12168
Geertman, S., & Stillwell, J. (2003). Planning support systems in practice. Springer International Publishing. http://doi.org/DOI 10.1007/978-3-540-24795-1
Geertman, S., & Stillwell, J. (2004). Planning support systems: an inventory of current practice. Computers, Environment and Urban Systems, 28(4), 291–310. http://doi.org/10.1016/S0198-9715(03)00024-3
Geertman, S., & Stillwell, J. (2009). Planning support systems: content, issues and trends. In S. Geertman & J. Stillwell (Eds.), Planning Support Systems Best Practice and New Methods (Vol. 95, pp. 1–26). Dordrecht: Springer Science+Business Media B.V.
Geertman, S., & Stillwell, J. (2009). Planning support systems best practice and new methods. (S. Geertman & J. Stillwell, Eds.)Planning Support Systems Best Practice and New Methods (Vol. 95). Springer. http://doi.org/10.1007/978-1-4020-8952-7
Giddens, A. (1984). Elements of the theory of structuration. In The Constitution of society: Outline of the theory of structuration. http://doi.org/10.1007/BF01173303
Giupponi, C., & Sgobbi, A. (2013). Decision support systems for water resources management in developing countries: Learning from experiences in Africa. Water, 5(2), 798–818. http://doi.org/10.3390/w5020798
Goodfellow, T. (2013). Planning and development regulation amid rapid urban growth: Explaining divergent trajectories in Africa. Geoforum, 48, 83–93. http://doi.org/10.1016/j.geoforum.2013.04.007
Goodspeed, R. (2016). Sketching and learning: A planning support system field study. Environment and Planning B: Planning and Design, 43(3), 444–463. http://doi.org/10.1177/0265813515614665
Gray, P. (1987). Group decision support systems. Decision Support Systems, 3(3), 233–242. http://doi.org/10.1016/0167-9236(87)90178-3
Haaren, van R., & Fthenakis, V. (2011). GIS-based wind farm site selection using spatial multi-criteria analysis (SMCA): Evaluating the case for New York State. Renewable and Sustainable Energy Reviews, 15(7), 3332–3340. http://doi.org/10.1016/j.rser.2011.04.010
Hossain, S., Scholz, W., & Baumgart, S. (2015). Translation of urban planning models: Planning principles, procedural elements and institutional settings. Habitat International, 48, 140–148. http://doi.org/10.1016/j.habitatint.2015.03.006
Huber, G. P. (1984). Issues in the design of group decision support sytems. MIS Quarterly, 8(3), 195–204. http://doi.org/10.2307/248666
65
Hwang, M. (1998). Did task type matter in the use of decision room GSS? A critical review and a meta-analysis. Omega Int.J.Mgmt Sci, 26(1), 1–15. http://doi.org/10.1016/S0305-0483(97)00047-9
Iacono, J. C., Brown, A., & Holtham, C. (2011). The use of the case study method in theory testing : The example of steel eMarketplaces. The Electronic Journal of Business Research Methods, 9(1), 57–65.
IBM Corp. (2013). IBM SPSS Statistics for Windows. Armonk,NY: IBM Corp.
ITC Utwente. (2016). Matrix of Functions methodology for regional planning and development animation. Retrieved September 17, 2016, from https://www.youtube.com/watch?v=CqDad75SpBU
Jankowski, P., Andrienko, N., & Andrienko, G. (2001). Map-centred exploratory approach to multiple criteria spatial decision making. International Journal of Geographical Information Science, 15(2), 101–127. Retrieved from http://www.tandfonline.com/doi/pdf/10.1080/13658810010005525
Jankowski, P., & Nyerges, T. (2001). Geographic Information Systems for group decision making: Towards a participatory, Geographic Information Science. New York. http://doi.org/10.1017/CBO9781107415324.004
Jankowski, P., & Nyerges, T. (2008). GIS-supported collaborative decision making : Results of an experiment. Annals of the American Association of Geographers, 91(1), 48–70.
Johannessen, G. H. J., & Hornbæk, K. (2014). Must evaluation methods be about usability? Devising and assessing the utility inspection method. Behaviour & Information Technology, 33(2), 195–206. http://doi.org/10.1080/0144929X.2012.751708
Karacapilidis, N., & Papadias, D. (2001). Computer supported argumentation and collaborative decision making: the HERMES system. Information Systems, 26(4), 259–277. http://doi.org/10.1016/S0306-4379(01)00020-5
Kim, H. Y., Wunneburger, D., Neuman, M., & An, S. Y. (2014). Optimizing high-speed rail routes using a Spatial Decision Support System (SDSS): the Texas Urban Triangle (TUT) case. Journal of Transport Geography, 34, 194–201. http://doi.org/10.1016/j.jtrangeo.2013.11.014
Klosterman, R. E. (1995). The appropriateness of geographic information systems for regional planning in the developing world. Computers, Environment and Urban Systems, 19(1), 1–13. http://doi.org/10.1016/0198-9715(94)00028-x
Klosterman, R. E. (1997). Planning support systems: A new perspective on computer-aided planning. Journal of Planning Education and Research, 17(1), 45–54. http://doi.org/10.1177/0739456X9701700105
Kumar, P. S., Thakur, A., Umashankar, C., & Ramana, V. V. (2014). Role of open source software in e-Governance. International Journal of Computer Engineering in Research Trends, 351(6), 2349–7084. Retrieved from https://www.academia.edu/9879133/role_of_open_source_software_in_e-Governance?auto=download
Lekies, K. S., Yost, G., & Rode, J. (2015). Urban youths experiences of nature: Implications for outdoor adventure recreation. Journal of Outdoor Recreation and Tourism, 9, 1–10. http://doi.org/10.1016/j.jort.2015.03.002
Lim, L. H., Raman, K. S., & Wei, K. K. (1994). Interacting effects of GDSS and leadership. Decision Support Systems, 12(3), 199–211. http://doi.org/10.1016/0167-9236(94)90004-3
Limayem, M., Banerjee, P., & Ma, L. (2006). Impact of GDSS: Opening the black box. Decision Support Systems, 42(2), 945–957. http://doi.org/10.1016/j.dss.2005.08.004
Lin, Y., Zhang, X., & Geertman, S. (2015). Toward smart governance and social sustainability for Chinese migrant communities. Journal of Cleaner Production, 107, 389–399. http://doi.org/10.1016/j.jclepro.2014.12.074
Mahmood, K. (2013). Mixed methods research. Lahore, Pakistan: University of the Punjab. Retrieved from http://www.slideshare.net/kmahmood2/mixed-methods-research

66
Malczewski, J., & Rinner, C. (2015). Multicriteria decision analysis in Geographic Information Science. http://doi.org/10.1007/978-3-540-74757-4
Merriam-Webster. (n.d.). Construct | Definition of Construct by Merriam-Webster. Retrieved February 10, 2017, from https://www.merriam-webster.com/dictionary/construct
MIFOTRA. (2015). Key Job duties and Attributions of Staff of the Districts, Sector and Cells. Kigali: Ministry of Public Service and Labour, Rwanda. Retrieved from https://xa.yimg.com/kq/groups/75952020/1580146070/name/job+description+rural+district,+sector+%26+cell.pdf
MINALOC. (2011). Ministry of Local Government; Decentralization Implementation Plan ( DIP ) 2011-2015. Kigali. Retrieved from http://www.minaloc.gov.rw/fileadmin/documents/Minaloc_Documents/DIP_3rd_Phase_Draft_14.3.11_final_version.pdf
MINALOC. (2012). National Decentralisation Policy (Revised). Kigali. Retrieved from http://www.minaloc.gov.rw/fileadmin/documents/Minaloc_Documents/Revised_Decentralisation_Policy_for_Cabinet_30_01_2013.pdf
MININFRA. (2015). National Urbanization Policy. Kigali, Rwanda. Retrieved from http://www.mininfra.gov.rw/fileadmin/user_upload/Rwanda_National_Urbanization_Policy_2015.pdf
MININFRA. (2016a). Consultancy for the Roll Out of Geodata Platform to Districts and MINIFRA Urban Dashboard and Goods. Retrieved January 16, 2017, from http://www.tendersunlimited.com/notice.php?idpost_meta=12551
MININFRA. (2016b). Republic of Rwanda, Ministry of Infrastructure. Retrieved May 31, 2016, from http://www.mininfra.gov.rw/index.php?id=188
Mukhtarov, F. (2012). Rethinking the travel of ideas: policy translation in the water sector. Policy & Politics, 42(1), 71–88.
Musanze District. (2013). Musanze district development plan. Musanze, Musanze district. Retrieved from https://www.academia.edu/25923221/Musanze_ddp_final
Musanze District. (2016). Planning and imihigo preparation in musanze district. Musanze, Musanze District: Planning, Monitoring and Evaluation Unit.
Nyerges, T., Ballal, H., Steinitz, C., Canfield, T., Roderick, M., Ritzman, J., & Thanatemaneerat, W. (2016). Geodesign dynamics for sustainable urban watershed development. Sustainable Cities and Society, 25, 13–24. http://doi.org/10.1016/j.scs.2016.04.016
Nyerges, T., Jankowski, P., & Drew, C. (2002). Data-gathering strategies for social-behavioural research about participatory geographical information system use. International Journal of Geographical Information Science, 16(1), 1–22. http://doi.org/10.1080/13658810110075987
Nyerges, T., Jankowski, P., Tuthill, D., & Ramsey, K. (2006). Collaborative water resource decision support: Results of a field experiment. Annals of the Association of American Geographers, 96(4), 699–725. http://doi.org/10.1111/j.1467-8306.2006.00512.x
O’Looney, J. (1997). Beyond maps : GIS and decision making in local government. ICMA.
Ochola, W. O., & Kerkides, P. (2004). An integrated indicator-based spatial decision support system for land quality assessment in Kenya. Computers and Electronics in Agriculture, 45(1–3), 3–26. http://doi.org/10.1016/j.compag.2004.05.005
Olafsson, A. S., & Skov-Petersen, H. (2014). The use of GIS-based support of recreational trail planning by local governments. Applied Spatial Analysis and Policy, 7(2), 149–168. http://doi.org/10.1007/s12061-013-9094-7
Ollman, B. (1971). Alienation : Marx’s conception of man in capitalist society. Cambridge University Press. Retrieved from

67
https://books.google.nl/books/about/Alienation.html?id=PGVSRwAACAAJ&redir_esc=y
Pawlowska, A. (2001). GIS as a tool in local policy -making. Lublin, Poland. Retrieved from http://unpan1.un.org/intradoc/groups/public/documents/NISPAcee/UNPAN017781.pdf
Pelzer, P., Geertman, S., Heijden, R. van der, & Rouwette, E. (2014). The added value of planning support systems: A practitioner’s perspective. Computers, Environment and Urban Systems, 48, 16–27. http://doi.org/10.1016/j.compenvurbsys.2014.05.002
Pfeffer, K., Baud, I., Denis, E., Scott, D., & Sydenstricker-Neto, J. (2013). Participatory spatial knowledge management tools empowerment and upscaling or exclusion? Information Communication & Society, 16(2, SI), 258–285. http://doi.org/10.1080/1369118X.2012.687393
Poole, M. S., & DeSanctis, G. (1989). Use of group decision support systems as an appropriation process. System Sciences, 1989. Vol.IV: Emerging Technologies and Applications Track, Proceedings of the Twenty-Second Annual Hawaii International Conference on, 4, 149–157 vol.4. http://doi.org/10.1109/HICSS.1989.48152
Private Sector Federation. (2017). The Private Sector Federation Rwanda (PSF). Retrieved January 5, 2017, from http://www.psf.org.rw/spip.php?rubrique1
Reinig, B. A., & Shin, B. (2002). The dynamic effects of group support systems on group meetings. Journal of Management Information Systems, 19(2), 303–325. http://doi.org/10.1080/07421222.2002.11045728
Rondinelli, D. A. (1985). Applied methods of regional analysis : the spatial dimensions of development policy. Boulder and London: Westview Press.
Rubavu District. (2013). Rubavu district development plan. Rubavu, Rubavu District: Rubavu district.
Rwanda Natural Resources Authority. (2016). Rwanda Geoportal. Retrieved June 18, 2016, from http://rwandageoportal.rnra.rw/
Rwanda SDF. (2016). Spatial Development Framework of Rwanda:To impel urbanization from real and current development. Kigali, Rwanda.
Rwandapedia. (2016). Imihigo | Rwandapedia. Retrieved December 30, 2016, from http://rwandapedia.rw/explore/imihigo
Sanjari, M., Bahramnezhad, F., Fomani, F. K., Shoghi, M., & Cheraghi, M. A. (2014). Ethical challenges of researchers in qualitative studies: the necessity to develop a specific guideline. Journal of Medical Ethics and History of Medicine, 7, 14. Retrieved from http://www.ncbi.nlm.nih.gov/pubmed/25512833
Scher, D. (2010). The promise of Imihigo : Decentralized service delivery in Rwanda , 2006-2010. Innovations for Successful Societies. New Jersey, USA. Retrieved from http://www.princeton.edu/successfulsocieties on
Scientific Software Development GmbH. (2017). ATLAS.ti 7 Windows. Scientific Software Development. Germany: The knowledge workbench. Retrieved from http://atlasti.com/product/v7-windows/
Short, J. (2003). Assessment of the MTEF in Rwanda: Country case study 5. Center for Aid and Public Expenditure. London.
Silverman, D. (2005). Doing Qualitative Research: A Practical Handbook (2nd ed.). London: Sage Publication Ltd.
Sugumaran, Ramanathan, Degroote, & John. (2010). Spatial Decision Support Systems: Principles and Practices. (1st ed.). NW Florida: CRC Press: Taylor & Francis Group. Retrieved from http://www.informationbuilders.com/decision-support-systems-dss
Te Brömmelstroet, M. (2013). Performance of planning support systems: What is it, and how do we report on it? Computers, Environment and Urban Systems, 41, 299–308. http://doi.org/10.1016/j.compenvurbsys.2012.07.004
Te Brömmelstroet, M., & Schrijnen, P. M. (2010). From planning support systems to mediated planning support: A structured dialogue to overcome the implementation gap. Environment and Planning B:

68
Planning and Design, 37(1), 3–20. http://doi.org/10.1068/b35019
Todes, A. (2012). Urban growth and strategic spatial planning in Johannesburg, South Africa. Cities, 29(3), 158–165. http://doi.org/10.1016/j.cities.2011.08.004
Un-Habitat. (2015). Regional spatial planning strategy of Dafur. Nairobi: UN-Habitat. Retrieved from http://unhabitat.org/books/regional-spatial-planning-strategy-of-darfur/
Vonk, G., & Geertman, S. (2008). Improving the adoption and use of planning support systems in practice. Applied Spatial Analysis and Policy, 1(3), 153–173. http://doi.org/10.1007/s12061-008-9011-7
Vonk, G., Geertman, S., & Schot, P. (2005). Bottlenecks blocking widespread usage of planning support systems. Environment and Planning A, 37(5), 909–924. http://doi.org/10.1068/a3712
Vonk, G., Geertman, S., & Schot, P. (2007). A SWOT analysis of planning support systems. Environment and Planning A, 39, 1699–1714. http://doi.org/10.1068/a38262
Wang, E. T. G., Ying, T.-C., Jiang, J. J., & Klein, G. (2006). Group cohesion in organizational innovation: An empirical examination of ERP implementation. Information and Software Technology, 48, 235–244. http://doi.org/10.1016/j.infsof.2005.04.006
Weisser, F., Bollig, M., Doevenspeck, M., & Muller-Mahn, D. (2014). Translating the “adaptation to climate change” paradigm: The politics of a travelling idea in Africa. The Geographical Journal, 180(2), 111–119. http://doi.org/10.1111/geoj.12037
World Economic Forum. (2015). The global information technology report 2015. The Global Information Technology Report. Geneva. Retrieved from www3.weforum.org/docs/WEF_Global_IT_Report_2015.pdf
Zucca, A., Sharifi, A. M., & Fabbri, A. G. (2008). Application of spatial multi-criteria analysis to site selection for a local park: A case study in the Bergamo Province, Italy. Journal of Environmental Management, 88(4), 752–769. http://doi.org/10.1016/j.jenvman.2007.04.026

69
APPENDICES
Appendix 1: Questionnaire
Spatial Development Framework (SDF) tools workshops
Planning Evaluation Survey
This survey is part of a research project on the use of Planning Support Systems in Secondary cities in Rwanda. The research is conducted by Benson Mutuku an MSc student at Faculty of Geo-Information Science and Earth Observation at the University of Twente, in the Netherlands. Your participation is highly appreciated and of great help to me. The responses and feedback will be kept anonymous and will be used to analyse people’s responses on both the SDF tools and outcomes which were shown during the workshops. Please fill this form as part of your participation in helping me in undertaking this research. Thank you for your help.
A. Please respond to the following questions about the workshop in general
(Please tick one choice per question)
Questions Strongly
Agree
Somehow
Agree
Neither
Agree
nor
Disagree
Somehow
Disagree
Strongly
Disagree
1. I was able to share my ideas and opinions with
others
2 The workshop helped me to know the
perspectives of the other participants
3 I felt the other participants listened to what I
said and understood me well
4 I got answers to my questions during the
workshop
5 Workshop participants discussed issues in a
clear and open way
6 Personally, I have learnt a lot
7 The workshop helped me understand what is
SDF
8 I would support the final decision made by the
participants of the workshop

70
B. Please respond to the following questions about the impact of the workshop in your
learning and understanding level (please tick one choice per question)
Questions Strongly
Agree
Somehow
Agree
Neither
Agree
nor
Disagree
Somehow
Disagree
Strongly
Disagree
9 The computer tools captured my unique
thinking and concerns
10 Workshop participants were free to questions
the outcomes of the computer tools
11 I am now familiar with the terms and
concepts used in the computer tools
12 The computer tools improved my ability to
imagine how local planning process can be
done better
13 What I learnt with the computer tools
changed what I thought can happen in my
city
14 Computer tools improved the ability of the
group to identify common goals and
differences
15 I can easily use these tools with little
assistance
16 I feel the computer tools are good for making
decision and implementing current policies
17 I can recommend these tools to my
workplace
18 I can recommend these tools to other
departments in my city.
C. Please respond to the following open questions about the implementation of the tools
used in the workshop and the SDF.
19. What challenges are likely to delay the use of these tools in your local planning process? (List them)
------------------------------------------------------------------------------------------------------------------------------------
------------------------------------------------------------------------------------------------------------------------------------
20. Please provide any general comments about the Computer tools or GIS below
------------------------------------------------------------------------------------------------------------------------------------
------------------------------------------------------------------------------------------------------------------------------------
21. Please provide any general comment about the SDF below (optional)
------------------------------------------------------------------------------------------------------------------------------------
------------------------------------------------------------------------------------------------------------------------------------

71
Appendix 2: Semi-structured interview
Appendix 2.1: Semi- Structured Interviews
Interviewer: Benson Mutuku
Leading questions
1. Background / introduction
1.1 What is your job/what do you do in the city?
1.2 What role do you play in the local planning process?
2. Planning process
3.1 How can you describe the planning process in the city?
3.2 Is there any recent city planning project that you were part of?
Explain more about it
How long did it take?
3.3 Who are the other stakeholders involved in the planning process?
Their background and
Interest in the planning process
3.4 How do you manage differences interest during the process? How do you achieve a decision?
Vote
Chair thumb rule
3.5 How is the collaboration/ togetherness/oneness of stakeholders during the planning process?
Do you remember any special incidence?
3.6 Do you use any support tools like computers, maps, graphs etc.
In which stage?
Who uses these tools
3.7 Is there any influence of the local planning process by other interest?
National government
Regional
Politics
International agencies
3. Planning outcomes
3.1 What are the outcomes of the planning process? End products?
3.2 How are they produced?
Can I see some of the outcomes?
3.3 How are the outcomes communicated to the stakeholders?
3.4 Are all stakeholders satisfied with the outcomes?
4. Implementation
Which methods /strategies do you use in implementing the outcomes?
Any formal policy /procedure
Who are in charge to of the implementation of the outcomes?
Jointly as a city or department wise?
Regular assessment and monitoring?
5. General and Closure
5.1 Do you think the local planning process can be more effective with planning support tools like
maps, GIS software among other?
5.2 Any additions
5.3 Thank you.

72
Appendix 2.2: List of interviews conducted in Rubavu and Musanze districts
Interviews Carried Out In The Districts
Interviewee Relevant in Understanding:
Job Title Completeness11 Name of District
District planning
Unit planning
Department
planning12
In-text interviewee number
1 Hygiene and Sanitation Officer Complete Rubavu No yes yes
2 Director Planning, Monitoring and Evaluation Complete Rubavu yes yes yes
Interviewee 2
3
Terrestrial administration and decentralised governance officer Complete Rubavu yes yes yes
Interviewee 5
4 Director Planning, Monitoring and Evaluation Complete Musanze yes yes yes
Interviewee 1
5 Disability mainstreaming officer Complete Musanze No yes yes
Interviewee 6
6
Director of urban planning and decentralisation (CIM rep)13 Complete Musanze yes yes yes
Interviewee 4
7 Secondary and VTC education officer Complete Rubavu No yes yes
8 Director Agriculture and Natural Resources Complete Rubavu No yes yes
9 Construction and Permitting Officer Complete Rubavu yes yes yes
Interviewee 3
10
Construction and Permitting Officer, urban planner/Acting GIS Expert Complete Musanze yes yes yes
Interviewee 4
11 Director One-stop Center Incomplete Rubavu yes yes yes
12 SMEs and cooperative development officer Incomplete Rubavu No yes yes
13 Director Health Unit Incomplete Musanze No yes No
14 Director One-stop Center Incomplete Musanze yes yes yes
15 Community-based health insurance officer Incomplete Rubavu No No yes
Appendix 2.2: A table showing the list of the districts’ officers interviewed, the completeness of the interview in line with research objectives and the relevant in understanding district planning processes, and the interviewee number for some of the interviewees quoted in the text of the study.
In some Units, the person interviewed depended mainly on the experience and the how long the person
has worked in the Unit. For instance in Musanze, the urban planner was interviewed instead of the
director of the One Stop Center Unit because the director new to the Unit.
11 Completeness of the interview depended on how well the interviewee responded to the leading questions (See appendix 2.1). Some of the interviews are not quoted in the text of the study but are mentioned here for their role in acquiring secondary materials and first-hand knowledge of the districts’, Units’ and departments’ planning. 12 Departments are the smaller administrative entities making up a Unit in the districts. Each department is headed by an officer who is answerable to the Unit’s Director. 13 Director of urban planning and decentralization (CIM representative) was interviewed together with the urban planner in Musanze district thus their contributions in text is referred to as interviewee 4.

73
Appendix 3: Workshop participants invitation
Appendix 3.1 Invitations for SDF’s PSS Outcomes & Tools Workshops per Unit
1. Planning, Monitoring and evaluation unit: 1 PERSON
Director or Planning M & E officer 2. Infrastructure One Stop Centre unit: 3 PERSONS
Director or
GIS and land surveyor
Construction and Permitting 3. Business development and employment unit: 1PERSON
Director or investment promotion and Finance 4. Agriculture and natural resources unit: 1 PERSON
Director or Animal Resource Officer or environmental officer 5. Good governance unit: 1 PERSON
Director or Territorial admin and Decentralisation governance officer 6. Social development unit: 1 PERSON
Director or Disability mainstreaming officer or disaster management officer 7. Health unit: 1 PERSON
Director or hygiene and sanitation officer 8. Education unit: 1 PERSON
Director or secondary and VCT education officer 9. Finance unit: 1 PERSON
Director or Local Revenue inspector 10. Human Resource Unit: 1 PERSON
Director or logistic officer
Appendix 4.2: Research workshops held in Rubavu and Musanze districts
Workshop Venue Participants from:
Workshop 1 Musanze Planning, Monitoring and evaluation, One Stop
Centre, Business development and employment,
Agriculture and Natural Resources and Good
governance Units
Workshop 2 Musanze Social development, Health, Education, Finance
Human Resource Units
Workshop 3 Rubavu One Stop Centre, Business development and
employment, Agriculture and Natural Resources and
Good governance Units
Workshop 4 Rubavu Planning, Monitoring and evaluation, Health,
Education, Finance
Appendix 4.2: Details of the research workshops held in the districts with the workshop numbers used to define the participant's groups as cited in the text of this study. For example, a participant number one in workshop one is referred to as participant 1:1.
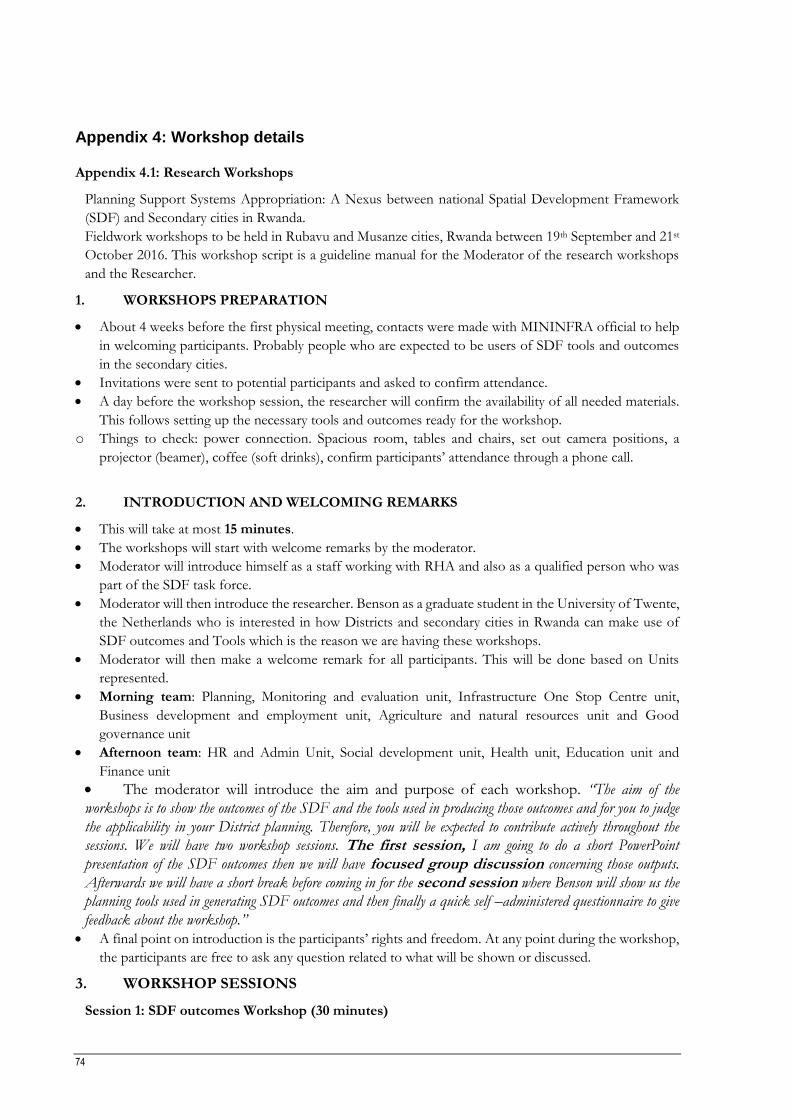
74
Appendix 4: Workshop details
Appendix 4.1: Research Workshops
Planning Support Systems Appropriation: A Nexus between national Spatial Development Framework
(SDF) and Secondary cities in Rwanda.
Fieldwork workshops to be held in Rubavu and Musanze cities, Rwanda between 19th September and 21st
October 2016. This workshop script is a guideline manual for the Moderator of the research workshops
and the Researcher.
1. WORKSHOPS PREPARATION
About 4 weeks before the first physical meeting, contacts were made with MININFRA official to help
in welcoming participants. Probably people who are expected to be users of SDF tools and outcomes
in the secondary cities.
Invitations were sent to potential participants and asked to confirm attendance.
A day before the workshop session, the researcher will confirm the availability of all needed materials.
This follows setting up the necessary tools and outcomes ready for the workshop.
o Things to check: power connection. Spacious room, tables and chairs, set out camera positions, a
projector (beamer), coffee (soft drinks), confirm participants’ attendance through a phone call.
2. INTRODUCTION AND WELCOMING REMARKS
This will take at most 15 minutes.
The workshops will start with welcome remarks by the moderator.
Moderator will introduce himself as a staff working with RHA and also as a qualified person who was
part of the SDF task force.
Moderator will then introduce the researcher. Benson as a graduate student in the University of Twente,
the Netherlands who is interested in how Districts and secondary cities in Rwanda can make use of
SDF outcomes and Tools which is the reason we are having these workshops.
Moderator will then make a welcome remark for all participants. This will be done based on Units
represented.
Morning team: Planning, Monitoring and evaluation unit, Infrastructure One Stop Centre unit,
Business development and employment unit, Agriculture and natural resources unit and Good
governance unit
Afternoon team: HR and Admin Unit, Social development unit, Health unit, Education unit and
Finance unit
The moderator will introduce the aim and purpose of each workshop. “The aim of the
workshops is to show the outcomes of the SDF and the tools used in producing those outcomes and for you to judge
the applicability in your District planning. Therefore, you will be expected to contribute actively throughout the
sessions. We will have two workshop sessions. The first session, I am going to do a short PowerPoint
presentation of the SDF outcomes then we will have focused group discussion concerning those outputs.
Afterwards we will have a short break before coming in for the second session where Benson will show us the
planning tools used in generating SDF outcomes and then finally a quick self –administered questionnaire to give
feedback about the workshop.”
A final point on introduction is the participants’ rights and freedom. At any point during the workshop,
the participants are free to ask any question related to what will be shown or discussed.
3. WORKSHOP SESSIONS
Session 1: SDF outcomes Workshop (30 minutes)

75
This session will start after introduction.
PowerPoint presentation should be already projected!!
The moderator explains the meaning of “SDF” and “outcomes”. The aim is to create a common
thinking ground for all participants regarding what is been called SDF outcomes.
Make this statements before moving the first slide!
SDF: A methodology designed to support national, regional and local government decision-
making by creating a ‘spatial’ understanding of the current state of the territory to support vision
and strategy development specific to a particular region.
Outcomes: these are fundamental products of the SDF methodology which outlines spatial
development in Rwanda and aimed to complement the implementation of National Urbanisation
Policy (NUP). They are produced using special computer tools which will be demonstrated during
the next workshop session.
PowerPoint presentation Slides starts:14
In this workshop, the following 6 outcomes will be shown:
List of functions (MoF): OUTPUT 1: this should give participants an understanding of the initial
profiling of functions across the country and emphasis should be on the fact that SDF uses Sector
level data. All Sectors across the country. Please see the PowerPoint slides for the definition of the
function.
14 The PowerPoint presentation can be found here: http://www.slideshare.net/bensonmutindam/sdfrwanda-workshops-slides

76
Map of the MoF centrality score: OUTPUT 2:
visualising the MoF centrality score spatially. A
better way to communicate. This shows how
Sectors perform depending on the number of
functions present in each Sector. Emphasis on
the basic, intermediate and central. See the
PowerPoint slides. This will be explained in
details in the video15 within the PPT.
Isopleth map: OUTPUT 3: Explaining territorial
linkages. This map captures a regional perspective in
planning. The regions are not only shown by
functions but also how they are integrated in terms of
socio-economic and physical connections. This is a
key concept in influencing investment and
infrastructure development in these regions.
15 The video can be found in the following link: https://www.youtube.com/watch?v=CqDad75SpBU

77
Consultative workshop map: OUTPUT 4:
this is the result of MoF and consultation
workshops which identified economic
potentialities for each settlement across
the country and clusters for development.
Spatial structures: OUTPUT 5: Several
Spatial structures emerges from a
spatial analysis of Matrix of Functions
and the results of District
Consultative Workshop.Economic
Development Areas (EDA), Nodal
cities, Gateways, Corridors.

78
SMCE: OUTPUT 6: Explain what
SMCE is: Guided by the Slide.
Criteria tree is formed consisting
of the overall objective of the
evaluation, its sub-objectives, and
criteria that are applied to
indicator maps.
The SDF SMCE was based on the
pillars of NUP: coordination,
densification, governance and
economic growth. For the purpose
of this workshop, we focus on
economic development (see the
screenshot on the left).
Explain the Economic pillar starting from the overall objective (which is the NUP pillar), the objectives
7, 8 & 9 (which are also driven from NUP), then how to break those objectives into sub-objectives (see
the example of Objective 7) and then into criteria upon which we can establish a measurable indicator.
At each level of the tree, inputs are given weight depending on their importance.

79
4. FOCUSED GROUP DISCUSSION (FGD)
o The moderator, at the end of the presentation, will notify the participants about the FGD.
o The following questions will guide the session:
Specific questions to each output: (1 hour)
Let’s go step by step, output by output. Starting with MoF to SMCE. The moderator rolls back the PowerPoint
presentation to the output in the discussion. We can also make use of the printed maps during this time. After
sufficient discussion and time, we move to the next.
i. What have we learned from these SDF outcomes? Give us your Responses in terms of comments or
questions (30 minutes )
a. MoF
b. Centrality score Map
c. Isopleth maps
d. Consultative workshop result map
e. Spatial structures ( EDA, Nodal towns, gateways, corridors )
f. SMCE concept
ii. Are these outputs useful to us and in our departments? (10 minutes)
a. How can we use these outcomes within our city planning process? (5 minutes)
iii. Which are departments/units likely to benefit quickly/easily from these outcomes? (10 minutes)
General questions about the Outcomes: (20 minutes) i. Any challenges that we may have here locally in adopting these outcomes? (10 minutes)
ii. Finally, any comments, or burning concern from participants. (10 minutes)
NOTE:
o Moderator will oversee the discussion and let all ideas come from the participants.
o Moderator will keep time spend on one question to ensure all questions are discussed within the
set time. On average 5 minutes per output.
In the case of clarification, the Researcher will help in making the questions more clear and
understandable. Any misunderstanding or discussion outside the question on the table will be controlled
through coordination between researcher and moderator.
5. COFFEE BREAK (15 MINUTES)
The moderator will facilitate the transition between tasks in the workshop as indicated in the workshop
timetable. Tell people we are breaking for 15 minutes to have coffee/snacks and then continue.
SESSION 2: SDF TOOLS WORKSHOP
Introduction (5 minutes)
Moderator will introduce the session by welcoming the participants back to the second session.
Invite participants to a session where tools used in the SDF will be demonstrated.
The researcher will do the demonstration of the tools. Moderator will help in case of any translation
needed.
The moderator will facilitate the session. Timekeeping and flow management are important here.

80
Confirm everyone can work with a computer. At least the assumption is all participants can us a
computer.
Part 1: MoF (20 minutes)
The aim of this session is to show how data about Functions was collected, programmed in Ms-Excel and
the ranking of Sectors based on centrality score is done in the special worksheet.
This is a hand on session where participants will use the tools and understand the concepts used.
Exercise:
Open the Excel document containing the Study area worksheet.
Explain the collection of function based on the Public Utilities and Facilities, Road Connection and
Transportation Services, Industries and Commercial Establishments, Markets, Health Facilities, Public recreational and
Cultural Facilities, Public Spaces, Judiciary Services, Security Services, Community Organizations, Specialized Health
Staff and services, Educational Institutions and Private Professionals.
Let the participants understand this is input data for many outputs which were demonstrated. If anything is
wrong at this point, the subsequent reporting will be wrong.
Explain the data is focused on Sectors, within the districts. Show the left-most columns.
Next, explain how the centrality score is done and the other calculation. Because this is a demonstration
workshop, the programming has already been done. Make the participants understand how it works. (Starting with the Sum
functions frequency, Standard and Function Weight) then centrality score.

81
Next is the sorting of functions and Sectors based on functions weights and then the total
functions (no of functions) in each Sector. For this open the Excel document containing the final MoF
computations. Connect this to output 1!!
Emphasise on the classification (basic, intermediate, and central functions) which emerge after sorting
based on Sectors performance.
Emphasise on the level of hierarchy which is used in the classification of urban centres. Make a
connection to output 2.
Explain how the data is then exported to ArcGIS software for visualisation.
End of part one.
Part 2: SMCE (30 minutes)
The aim of this part is to let participants understand the concept of SMCE. This will be
demonstrated using the product of Economic pillar.
EXERCISE
Open the ILWIS Software.
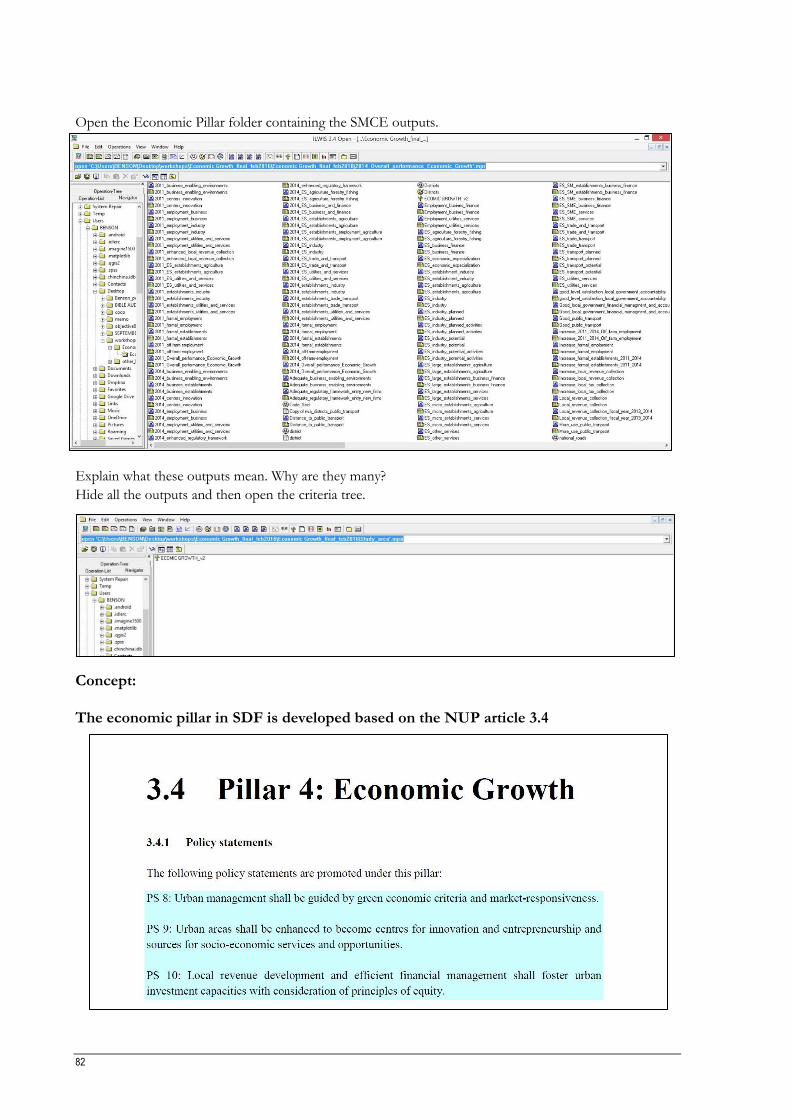
82
Open the Economic Pillar folder containing the SMCE outputs.
Explain what these outputs mean. Why are they many?
Hide all the outputs and then open the criteria tree.
Concept:
The economic pillar in SDF is developed based on the NUP article 3.4

83
Based on these three policy statements (PS), SDF developed three objectives to achieve this
pillar.
Now, Expand the Tree by double clicking it to see the statements. Maximise the Criteria window.
Note: The SDF team gave different weight to these Policy Statements depending on their
importance. The policy statement 9 which is Objective 8 on “urban settlements as centres for
innovation and entrepreneurship to increase socio-economic services and off-farm job
opportunities” was given a higher weight of 0.5.
Confirm the weights for the other objectives.
On the right side of the objectives, the ILWIS shows the map output of these objectives.
Explore these output. See the performance of your District and compare to the others.
Focus only on Rubavu, Musanze and Nyabihu. Then see the overall Economic
Performance output
Next step: Sub-objectives, criteria and Indicators
These three objectives are realised through more specific sub – objectives.
Expand “To develop urban settlements as centres for innovation and entrepreneurship to increase
socio-economic services and off-farm job opportunities Source: Article 3.4.1 Policy Statement 9, NUP,
July 2015” by clicking + sign on the left.
How many sub-objectives does this Objective have? What is the weight for each Sub-objective?
Check the corresponding output maps on the right-hand side by double clicking the map icons.
Expand the “To have an adequate regulatory environment that enables the entry of new firms and
employment in the "formal” Sector. Source: Article 3.4.6 Local economic development, Job creation
and skills development., NUP, July 2015, and EDPRS2”

84
Notice the sub-objective has two criteria. Check their corresponding maps on the right.
Expand these criteria and check the least possible level. This shows the indicators which contain the
input data.
The input data is at Sector level. Double click one of the corresponding input of the indicators.
This is shown by a column - icon
Note: the operations in SMCE starts with data. If we have any data about the Sectors we can do a
spatial analysis to compare the Sectors and see their performance. Not only for NUP policy but
much more application.
This data can be obtained from various agencies.
Think of some within your department.
End of part 2.
Part 3: Questionnaires and Feedback (20 minutes)
Moderator will facilitate a quick feedback discussion session. This involves a quick questionnaire and
also discussion.
At the end of Tools Workshop, the moderator should tell the participants to fill the questionnaire as
part of their participation in the workshop
We give participants 10 minutes to fill the questionnaire.
After this, we have a feedback session about the workshop for 10 minutes.
A quick feedback session for 10 minutes
General feedbacks about the two workshops.
6. CLOSING (5 MINUTES)
Roles (Moderator and researcher to give their views and comments including thanking all
participants for sacrificing their time to be part of the workshop)
Expectations management (moderator and researcher). Explain to the participants what they
should expect. From the research view and also the SDF itself as a new method of doing things.
The moderator should close the workshops officially.
Thank you

85
END OF WORKSHOPS
7. ROLES AND RESPONSIBILITIES
A. Researcher/ observer Organise for the workshop logistics: snacks and coffee
Observe the participants interactions and reaction during the workshop
Create a good atmosphere by interacting with the participants. Learn from within
Give clarification in consultation with the moderator
Respond to any questions arising regarding the tools and outcomes
Explain the research at the end of the workshops and what people should expect
Thank the participants
B. Participants
Feel free to ask any question relating to the workshops
Participate, contribute to the discussion and share experience
Actively participate the focus group discussion. Please contribute and share your thoughts
Fill a self-administered questionnaire at the end of the tools workshop
C. Moderator
Greet all the participants and welcome them (at the start of the workshops).
Introduce all the people: researcher and the participants according to their departments.
Explain the aim of the workshop and the idea of SDF with a focus on the use of SDF at local
levels.
Moderate/facilitate the sessions. Timekeeping is important, good communication, create a
learning atmosphere
Respond to questions asked by the participants about the outcomes. Can consult the researcher
for a more collaborative response.
Give people time for break (at 11 am and explain when the next session is starting)
Keenly lead and moderate the focus group discussion. See the guiding questions in the workshop
timetable.
Close the workshop sessions with a vote of thanks and explain what participants should expect.
Please, emphasis on the link between NUP and SDF and the tools being shown today.
Note: No Suggestions or Opinions from the Moderator. Every Idea And Concerns Should Come From The Participants.
Let Allow the Participants to Expose Their Thoughts about the SDF Outcomes and the Tools.
8. CONTINGENCY PLAN (RESEARCHER)
In the case of a power blackout, what possible solutions do we have? Print out maps and the
PowerPoint presentations?
In the case of a new moderator, the researcher will meet him/her a day or two before the
workshop for acquainting with the tools and outcomes. I hope Theo will be available for the
possible 4 workshops
Accommodation: Organise accommodation a day before the workshops.
Transport. Confirm travelling plan and time for a moderator to and from the two cities.
Snacks: organise and buy the snacks a day before the workshop. Consult with local people what is
offered in such workshops.

86
Appendix 5: Qualitative analysis results
A. Stakeholders’ roles in the Districts
Appendix 5.1: Key stakeholders involved in the districts’ planning processes Results of the Atlas.ti analysis showing the key stakeholders (in green background) and sampled quotes (grey background). These data is from the interviews held in Rubavu and Musanze districts.
Appendix 6: Quantitative analysis results
The table below shows the analysis if the questionnaire that summarise the feedback for each question, presenting the mean and standard deviation (s.d) for all the participants (n=21).
1. Learning Appendix 6.1: Questionnaire feedback analysis for questions related to learning and user perceptions
Question Variable16 Governing Principles
N Mean s.d
Personally, I learnt a lot Reported learning
Factual learning
21 4.24 .768
Participants discussed issues in clear and open way
Valid information
Open discussion
21 4.62 .805
I got answers to my questions Answered questions
Evidence seeking
21 4.38 .590
I would support the final Decision Internal commitment
Commitment to choice
21 4.29 .717
I felt other participants listened to what I said and understood me well
Engagement Others listened 21 3.90 1.091
I can easily use these tools with little assistance
Quick learning Tools usage 21 3.90 .625
2. Results related to workshop, PSS tools and outcomes
16 The variables are the same as used by Goodspeed (2013). The word variable is used in this research to support the governing principle behind every asked questions.

87
Appendix 6:1 Table showing the questionnaire feedback analysis for questions related to tools and the workshops
Appendix 7: Literature search strategy
Synonyms were combined using the conjunction OR while concepts were combined using conjunction
AND. The results below shows a summary of such from two academic resource databases science direct
(SciDir) and Web of Science (WoS). This search was done between August and September 2016
Appendix 7.1: Literature search strategy showing the combination of key concepts and their synonyms
Concept 1: Appropriation
Concept 2: Spatial Planning
Concept 3:
Tools
Concept 4: Government
Concept 5:
Theory
Synonyms 1
Appropriation National Spatial Plan*
Planning Support Systems or PSS
National government*
Enhanced Adaptive Structuration Theory or EAST
Synonyms 2
Adoption Local Spatial Plan*
Decision Support Systems or DSS
Local government*
Adaptive Structuration Theory or AST
Synonyms 3
Usage Regional Spatial Plan*
Spatial Planning Support Systems or SPSS
Municipal* Diffusion of Innovation
Synonyms 4
Acceptance National Development Plan*
Spatial Decision Support Systems or SDSS
District* Technology Acceptance model or TAM
Synonyms 5
Embrac* Regional Development Plan*
Group Decision Support Systems or GDSS
Question Variable Governing Principles
N Mean s.d
I was able to share my ideas Shared views engagement 21 4.52 .750
Workshop helped me know the perspectives of others
alignment Others perspectives
21 4.43 .926
Computer tools captured my unique thinking
Identification Unique issues 21 4.10 .700
I am now familiar with the terms and concepts of the tools
Identification tools familiarity) 21 4.00 .775
The computer tools improved my ability to imagine how local planning process can be done better
Imagination Ability to imagine
21 4.10 .768
the tools improved the ability of the group to identify common goals and difference
Alignment Group discussion
21 4.19 .680
Participants were free to question the outcomes and tools
Reification Question outputs
21 4.14 1.15
Tools are good for decision making and implementing current policies
Negotiation Policy implementation
21 4.57 .926

88
Synonyms 6
Diffusion Local Development Plan*
Synonyms 7
Rejection
Hits:
SciDir,
WoS
828,421,
2,535,963
1,152,
2,886
128,844
48,193
22,561
75,796
3,221
8,940
Search Words: Synonym OR Synonym: Concept AND concept
Appendix 8: Workplan
The work plan of the research is summarised in the table below. The table show highlights of the key
steps in the research process and the specific time (month and week) in which the steps were carried out.
CONCEPTS Hits:
Science
direct
Hits:Web of
Science
Appropriation AND Tools AND Theory 34 58
Appropriation AND Tools AND Spatial Planning 30 53
Appropriation AND Government AND Theory 8 11
Tools AND Government AND Appropriation AND Spatial Planning 2 4
Tools and Government and Spatial planning 9 12
Tools AND Appropriation AND Theory AND Spatial Planning 1 1
Tools AND Spatial Planning AND Appropriation 4 6
No Activities: (Aug 2016- Feb 2017)
Week 1 2 3 4 1 2 3 4 1 2 3 4 1 2 3 4 1 2 3 4 1 2 3 4 1 2 3 4
1 Proposal Development
2 Proposal Presentation
3 Pre-Field work Preparations
4 Literature Review
5 Prototype Design and Testing
6 Data collection instruments Design
7 Field work
8 Data cleaning, Decoding and analysis
9 Mid-Term Presentation
10 Statistical and text analysis
11 compailing Mixed methods outputs
12 Validating results
13 Report writing
14 Final Thesis Presentation
FebAug Sept Oct Nov Dec Jan
Appendix 8.1: Table showing the work plan for the research which was carried from August 2016 to February 2017