National Plan of Integrated Airport Systems (NPIAS) 2009 ... · PDF fileThe plan identifies...
86
Transcript of National Plan of Integrated Airport Systems (NPIAS) 2009 ... · PDF fileThe plan identifies...


Cover Photographs (from top to bottom) Chicago O’Hare International Airport, August 11, 2007. Photo courtesy of Marcin Sordyl. Boeing 737-900ER, the newest member of the Next-Generation 737 airplane family. Photo courtesy of Boeing. NPIAS 2009 – 2013 Illustrated by GRA, Incorporated

U.S. Department of TransportationFederal Aviation Administration
National Plan of Integrated Airport Systems (NPIAS) (2009-2013)
Report of the Secretary of Transportation to the United States Congress Pursuant to Section 47103 of Title 49, United States Code The NPIAS 2009-2013 report will be available online at http://www.faa.gov/airports_airtraffic/airports/planning_capacity/

Table of Contents FORWARD .........................................................................................................................................V EXECUTIVE SUMMARY .............................................................................................................VII
Status of the Industry .............................................................................................................. vii Development Estimates ......................................................................................................... viii
Estimates by Airport Type........................................................................................... ix Estimates by Type of Development............................................................................. xi
CHAPTER 1: SYSTEM COMPOSITION.......................................................................................1
Overview....................................................................................................................................1 U.S. Department of Transportation................................................................................2 Federal Aviation Administration ...................................................................................2 FAA’s Office of the Associate Administrator for Airports ...........................................3
Guiding Principles for the National Airport System..................................................................3 Airports Included in NPIAS.......................................................................................................5 Commercial Service Airports ....................................................................................................5
Large Hubs.....................................................................................................................6 Medium Hubs.................................................................................................................7 Small Hubs.....................................................................................................................7 Nonhub Primary.............................................................................................................7 Nonprimary Commercial Service ..................................................................................8
Reliever Airports........................................................................................................................8 General Aviation Airports..........................................................................................................9 New Airports............................................................................................................................10 Airports Not Included in NPIAS..............................................................................................10 State System Plans Include More Airports ..............................................................................10 Number of Airports Included in NPIAS - Historical ...............................................................11
CHAPTER 2: SYSTEM PERFORMANCE...................................................................................13
Overview..................................................................................................................................13 Airport Research ..........................................................................................................13 A National Look − Airport Capacity ...........................................................................14 Operational Evolution Plan Evolves into Next Generation Air Transportation
System..............................................................................................................14 Factors Indicating System Performance ..................................................................................16
Capacity .......................................................................................................................17 Alternative Capacity Enhancement Methods...............................................................24 Safety ..........................................................................................................................29 Environment.................................................................................................................35 Runway Pavement Condition ......................................................................................40 Surface Accessibility ...................................................................................................42 Financial Performance .................................................................................................45
CHAPTER 3: ACTIVITY FORECASTS.......................................................................................51
National Plan of Integrated Airport Systems (2009-2013) i

Overview..................................................................................................................................51 Activity Forecasts ...................................................................................................................51 Implications of Forecasts .........................................................................................................52 Other Factors............................................................................................................................53
Cargo 54 New Large Aircraft ......................................................................................................55 Fractional Ownership...................................................................................................56 Very Light Jets or Microjets ........................................................................................56 Conversion of Military Surplus Airfields ....................................................................57 Other Innovations.........................................................................................................58 Commercial Spaceports ...............................................................................................58 Airport Privatization ....................................................................................................58
CHAPTER 4: DEVELOPMENT REQUIREMENTS ..................................................................61
Overview..................................................................................................................................61 Process .....................................................................................................................................61 Development Costs ..................................................................................................................62 Development Categories..........................................................................................................66
Safety and Security ......................................................................................................66 Reconstruction .............................................................................................................67 Standards......................................................................................................................67 Environment.................................................................................................................67 Terminal Building........................................................................................................68 Surface Access .............................................................................................................68 Airfield Capacity..........................................................................................................68 New Airports................................................................................................................69 Other ..........................................................................................................................69
Anticipated Sources of Funding...............................................................................................69 Additional Costs Not Included in the NPIAS..........................................................................70
ii National Plan of Integrated Airport Systems (2009-2013)

List of Figures and Tables FIGURES
Figure 1: 5-Year Development Estimates from Published NPIAS Reports to Congress .................. ix Figure 2: NPIAS Cost by Airport Type ................................................................................................x Figure 3: Change in Development from Last NPIAS Report ...............................................................x Figure 4: NPIAS Cost by Type of Development ................................................................................ xi Figure 5: Number of Existing and Proposed Airports by Ownership and Use (January 2008)..............1 Figure 6: Historical - Existing and Proposed NPIAS Airports ...........................................................11 Figure 7: Percentage of Commuter and Air Carrier Operations at 35 OEP Airports in 2006 ............21 Figure 8: Percentage of Connecting Passengers at 35 OEP Airports in 2006 ....................................23 Figure 9: Airports with 10 Percent or More International Enplanements ..........................................24 Figure 10: Accident Rates...................................................................................................................29 Figure 11: Number of Runway Incursions by Fiscal Year .................................................................30 Figure 12: Illustration of Engineered Materials Arresting Systems (EMAS).....................................35 Figure 13: Population Expected to Benefit from Noise Funding .......................................................37 Figure 14: Runway Pavement Condition (2007) ................................................................................40 Figure 15: Illustration of the National Airport Pavement Test Facility..............................................42 Figure 16: Airports with Rail and Bus Access Having More Than a .................................................45 Figure 17: Distribution of Airport Revenues ......................................................................................46 Figure 18: Revenue and Expenses ......................................................................................................48 Figure 19: Net Income by Year and Hub Type...................................................................................49 Figure 20: Value of U.S. International Merchandise Exported and Imported by Mode 2006 ...........54 Figure 21: 5-Year Development Estimates from Published NPIAS Reports to Congress .................63 Figure 22: Comparison of 5-Year Development Costs by Airport Type............................................65 Figure 23: Comparison of 5-Year Development Costs by Category..................................................66 TABLES
Table 1: Airport Statistics .....................................................................................................................9 Table 2: New Runways and Airfield Reconfigurations......................................................................19 Table 3: New Runways, Runway Extensions, and Airfield Reconfigurations Under Construction
at OEP Airports (as of June 2008) ...........................................................................................19 Table 4: Selected Demand and Capacity Measures for 35 OEP Airports ..........................................22 Table 5: Population within 20 Miles of a NPIAS Airport ..................................................................42 Table 6: Airports Served by Rail ........................................................................................................43 Table 7: Airport Operating and Financial Summary 2006 ($ millions)..............................................47 Table 8: U.S. Aviation Activity Forecasts ..........................................................................................52 Table 9: Military Airfields Transferred to Civil Sponsors..................................................................57 Table 10: 2009 – 2013 NPIAS Cost by Airport and Development Category.....................................63 Table 11: 2007 – 2011 NPIAS Cost by Airport and Development Category.....................................64
National Plan of Integrated Airport Systems (2009-2013) iii

This page intentionally left blank.
iv National Plan of Integrated Airport Systems (2009-2013)

Forward The development estimates contained in this report were largely compiled in 2007 and reflect infrastructure needed in Fiscal Years (FY) 2009 through 2013. The statistics in this report were being prepared for publication prior to the sharp increase in oil prices and the slowing economy that occurred this year. The higher jet fuel prices are taking a toll on the aviation industry with airlines cutting capacity and increasing fares and fees which may dampen demand beginning in the fall. However, it is too early to predict whether this is a sustainable trend and the resulting long-term impact on the airport system. As a result of cuts in airline service, airports are taking steps to control costs and enhance revenue with some airports deferring capital projects and others cautiously proceeding with projects. Given the current uncertainty in the aviation industry, the development estimates in this report may be overstated for the 2009-2013 period. We anticipate that the next report, due to Congress in September 2010, will reflect the changes currently underway. About 39 percent of the development in the National Plan of Integrated Airport Systems (NPIAS) is intended to accommodate growth in travel, including more passengers and cargo and more and larger aircraft. These projects include major airfield programs, such as new runways, rehabilitation or expansion of passenger terminals, and improvements to the highways or transit systems on the airport. The large scale, long-term programs (i.e., a new runway or significant runway extension) involving a sequence of planning, environmental analysis, approval, financing, and construction, typically over a 10- to 15-year period, are not particularly sensitive to short-term fluctuations in traffic. About 61 percent of the development in the NPIAS is intended to rehabilitate existing infrastructure and keep airports up to standards for the aircraft that use them. The need for this type of development is not expected to change, but the timing may be affected by the financial concerns of airports.
National Plan of Integrated Airport Systems (2009-2013) v

This page intentionally left blank.
vi National Plan of Integrated Airport Systems (2009-2013)

Executive Summary The National Plan of Integrated Airport Systems (NPIAS) for Fiscal Year (FY) 2009 to 2013 is submitted to Congress in accordance with Section 47103 of Title 49 of the United States Code. A national airport plan has been prepared at regular intervals since the mid-1940s. The plan identifies 3,356 existing and 55 proposed public-use airports1 that are significant to national air transportation and therefore, eligible to receive grants under the Federal Aviation Administration Airport Improvement Program (AIP). The report estimates that over the next 5 years, there will be $49.7 billion of AIP eligible infrastructure development for all segments of civil aviation. This is an increase of $8.5 billion or 21 percent over the last report issued 2 years ago. Airport capital development needs are driven by traffic growth resulting in the need to expand facilities, normal maintenance due to use and age of facilities, and changing aircraft technology requiring airport facilities to update or replace equipment and infrastructure. The NPIAS is used by Federal Aviation Administration (FAA) management in administering the AIP. It supports the FAA’s goals identified in the Flight Plan for safety and capacity by identifying the specific airport improvements that will contribute to achievement of those goals. This report includes a section on the condition and performance of the national airport system, highlighting six topics: safety, capacity, pavement condition, financial performance, surface accessibility, and environment. The findings are generally favorable, indicating that the system is safe, convenient, well maintained, and largely supported by rents, fees, and taxes paid by users. Although air traffic delays rose in 2007, major airfield improvements and alternative capacity enhancement methods are expected to help mitigate those delays. STATUS OF THE INDUSTRY
Between 2000 and 2006, the domestic operations of the network carriers reported combined operating and net losses of $27.9 and $36.2 billion, respectively. In 2007, for the first time since 2000, the airline industry posted a $5.8 billion net profit. This is a result of rising load factors2 coupled with fare increases to offset the rising fuel prices. Cargo carriers continued to report strong results with net profits of $1.4 billion. However, continued high fuel prices and concerns about the economy are impacting the growth plans of carriers as they have deferred deliveries of new aircraft and trimmed growth plans in order to sustain profitability.
1 The word “airport”, as identified in this report, includes landing areas developed for conventional fixed-wing aircraft, helicopters, and seaplanes. 2 Load factor is the ratio of revenue passenger miles to available seat miles.
National Plan of Integrated Airport Systems (2009-2013) vii

In 2007, total aircraft operations remained flat as increases in air carrier operations were offset by declines in commuter/air taxi and military operations. Passenger load factors reached an all-time high at 79.9 percent. The domestic market share for the network carriers3 remained flat while the market share for low cost carriers4 grew. The regional carrier domestic market share declined for the first time since 1995. Congestion and delays are a system concern. In 2007, the 20 airlines5 reporting data for 32 airports posted the second worst on-time arrival record, 73.3 percent, which is just behind the all-time worst mark of 72.6 percent reached in 2000. The majority of airports in our national system have adequate airport capacity and little or no delays. Twenty-two airports accounted for 96 percent of the delayed flights in the United States in 2007, with three New York airports (Newark, LaGuardia, and John F. Kennedy) accounting for 37 percent of the flights delayed.6
In early 2008, fuel prices increased substantially. This has contributed to an economic slowdown and increased the cost of producing airline services and airfares. Both of these are impacting the demand for airline services. Some carriers have gone out of business and others are reducing their scale of operations. It is too early to assess the full impacts on the industry, but if fuel prices remain high for an extended period, these effects could be significant. DEVELOPMENT ESTIMATES
The cost estimates of future airport development included in this report are 21 percent higher than those found in the 2007 edition and 8 percent higher than those in the 2001 edition7. As shown in Figure 1, all but one edition since 1980 reflected an increase in development need. In recent years, this included a 32 percent increase in 2001 followed by a decrease in 2005 and a moderate increase in 2007. These historical costs reflect the financial situation of airports and airlines. Also reflected in this report are the rising costs of construction as a result of limited supplies and higher fuel prices. Since the last report issued 2 years ago, construction costs have increased approximately 11 percent, due in large part to increases in materials and labor.8
3 Network carriers reported by DOT are Alaska Airlines, American Airlines, Continental Airlines, Delta Air Lines, Northwest Airlines, United Airlines, and US Airways. 4 Low-cost carriers are Allegiant Air, American Trans Air, America West Airlines, AirTran Airways, Frontier Airlines, JetBlue Airways, Skybus Airlines, Southwest Airlines, Spirit Airlines, USA3000, and Virgin America Airlines. 5 Carriers that have one percent of total domestic scheduled service passenger revenues report on-time data and causes of delay for 32 airports accounting for at least one percent of the Nation’s total domestic scheduled service passenger enplanements. This information is available online at http://www.bts.gov./help/aviation/html/understanding.html6 Data is available for all carriers at 77 airports through the FAA’s Aviation System Performance Metrics (ASPM). 7 Estimates reflect the dollars at the time the report was prepared (2009 report reflects 2007 dollars; 2007 report reflect 2005 dollars; and 2001 report reflects 2000 dollars). 8 Source: Civil Works Construction Cost Index System (CWCCIS) calculated by the U.S. Army Corp of Engineers, March 2008. Comparing construction costs for fiscal year 2007 to fiscal year 2005.
viii National Plan of Integrated Airport Systems (2009-2013)

Figure 1: 5-Year Development Estimates from Published NPIAS Reports to Congress
49.7
41.2
35.1
8.7
29.7
24
46.2
39.5
0 5 10 15 20 25 30 35 40 45 50 55
1980
1990
1993
1998
2001
2005
2007
2009B
ase
Yea
r of
Publ
ishe
d R
epor
t
Development Cost ($Billions)
Note: Costs are not adjusted for inflation, they reflect the estimated cost at the time the report was prepared.
Estimates by Airport Type
Figure 2 shows the shares of development for each category of airports. Airports providing commercial service (large, medium, small, nonhubs and commercial service airports) account for 71 percent of the total development in this report. The 30 large hubs account for 36 percent ($18 billion) of the $49.7 billion development identified in the report. The 2,564 general aviation airports account for the second largest percentage of development (19 percent). While general aviation and reliever airports make up 84 percent of the airports, they account for 26 percent of the total development contained in the report (see Figure 3). Development estimates increased for all categories of airports; however, estimates for medium hub airports increased 54 percent and estimates for small hub airports increased 32 percent from the last report. Significant development was identified by Norman Y. Mineta San Jose International, Dallas Love Field, and Palm Beach International, along with Louisville International-Standiford Field and the City of Colorado Springs Municipal Airports. While development for large hub airports increased by $900 million to $18 billion, their share of the total development decreased from the last report by 5 percent. Large hub airports have identified capacity development, such as runway and taxiway construction, as the largest development need over the next 5 years. This includes major development programs at Chicago O’Hare International, Philadelphia International, Los Angeles International, and Denver International Airports. Terminal development is the second largest category of development for large hub airports. Large hub airports continue to fund terminal rehabilitation, expansion, and new terminal development primarily through passenger facility charges (PFC). The large hub airports also project significant pavement reconstruction needs
National Plan of Integrated Airport Systems (2009-2013) ix

through 2013. For instance, Denver International Airport, which opened in February 1995 with triple parallel runways, will need to reconstruct most of its airfield pavement for the first time during this period.
Figure 2: NPIAS Cost by Airport Type
New Airports3%
Large36%
Medium14%
Small8%
Nonhub 10%Commercial Service
2%
Reliever7%
GA19%
Figure 3: Change in Development from Last NPIAS Report
$0
$2,000
$4,000
$6,000
$8,000
$10,000
$12,000
$14,000
$16,000
$18,000
$20,000
Large
Hub
Medium
Hub
Small H
ub
Nonhub
Commercial
Service
Relieve
r
Genera
l Avia
tion
Airport Type
$ Th
ousa
nds
20072009
x National Plan of Integrated Airport Systems (2009-2013)

Development at reliever airports increased by 20 percent and needs at general aviation airports increased 24 percent. This increase reflects a continued focus, in part due to the nonprimary entitlement funding which began in FY 2001, on identifying development (rehabilitating airfield pavement, removing obstructions, installing perimeter fencing, etc.) at these airports.9 It is also due in part to the expanded eligibility for AIP funding at these facilities for hangars, fuel facilities, and other items contained in Vision 100-Century of Aviation Reauthorization Act. The availability of nonprimary entitlement funds has also allowed the funding of lower-priority items that were previously unlikely to be funded, such as access road improvements and general aviation terminal buildings. Estimates by Type of Development
Figure 4 identifies the NPIAS costs by type of development. The purpose of planned development contained in this report is primarily to bring existing airports up to current design standards (27 percent) and to replace or rehabilitate airport facilities, mostly pavement and lighting systems (19 percent). A significant amount is to increase airfield capacity (17 percent) and to modify, replace, and construct passenger terminal buildings to accommodate more passengers, larger aircraft, new security requirements, and increased competition among airlines (18 percent). To help accomplish this development, airports are directing the majority of their PFC revenues to fund landside projects such as terminals, ground access systems, noise mitigation, and the financing costs of these projects.
Figure 4: NPIAS Cost by Type of Development
Terminal18%Safety
4%Access
4%New Airport
3%
Security2%
Reconstruction19%
Standards27%
Capacity17%
Environment5%
9 Beginning in FY 2001, with the enactment of the Wendell H. Ford Aviation Investment and Reform Act for the 21st Century (AIR21), a total of 20 percent of the annual amount made available for obligation was apportioned for the use at nonprimary commercial service, general aviation, and reliever airports within the States and insular areas. These airports are collectively referred to as “nonprimary” airports. Nonprimary airports are entitled to an individual apportionment based on the lesser of one-fifth of the airport’s 5-year capital needs as identified in the NPIAS Report or $150,000.
National Plan of Integrated Airport Systems (2009-2013) xi

As airports respond to a changing aviation environment, their development needs also change. While overall development needs have increased, several types of development saw significant increases and decreases. Continuing the trend from the last report, which saw costs to replace or rehabilitate pavement increase by 40 percent from 2005 to 2007, rehabilitation costs rose 35 percent from 2007 to 2009, reflecting rising construction costs. Estimates for environmental remedial costs (noise, soundproofing, land easements, etc.) increased by 34 percent and terminal building costs increased 32 percent. Development to bring existing airports up to design standards increased 20 percent from the last report. The estimated need for safety projects decreased 3 percent and the need for security projects decreased 26 percent from the last report. Costs associated with modifying terminals to accommodate explosive detection systems, which accounted for 18 percent of the security development in the last report, are no longer included in this report because FAA is prohibited from funding these projects with AIP funding. However, these projects remain eligible under the PFC program and under the Transportation Security Administration’s grant program. Cost estimates in the NPIAS are obtained primarily from airport master and state system plans that were prepared by planning and engineering firms for airport sponsors, including local and state agencies. These plans are usually funded in part by FAA, are consistent with FAA forecasts of aeronautical activity, follow FAA guidelines, and have been reviewed and accepted by FAA planners who are familiar with local conditions. Efforts have been made to obtain realistic estimates of development needs that coincide with local and state capital improvement plans. The estimates only include development to be undertaken by airport sponsors. The development reflected in the NPIAS is based on planning documents available through 2007. As a planning document, the NPIAS should not be used in evaluating investment priorities. The development estimates may include contingency costs (increase in cost based on change in design or construction uncertainty), but generally, normal price escalation due to inflation (annual increase in costs) is not captured. For airports across the country, the infrastructure requirements needed to implement a lateral precision approach with vertical guidance (LPV) using FAA’s wide area augmentation system (WAAS) have not been fully assessed and, therefore, are not captured in this report. Aerial surveys are currently underway nationwide to help assess the physical obstacles that may impact improved approach minimums at a particular runway. Funds for airport development are derived from a variety of sources including Federal/State/local grants, bond proceeds, passenger facility charges, airport-generated funds (landing and terminal fees, parking and concessions revenues), and tenant and third-party financing. The availability of funding sources and their adequacy to meet needs varies with type of airport and level of activity. The NPIAS includes only planned development that is eligible to receive Federal grants under the AIP.
xii National Plan of Integrated Airport Systems (2009-2013)

Chapter 1: System Composition OVERVIEW
The United States accounts for approximately 40 percent of all commercial aviation and 50 percent of all general aviation activity in the world. An extensive system of almost 20,000 airports support this activity, with 26 percent of the airports classified as public-use (open to the public) and 74 percent classified as private-use airports (closed to the public). The NPIAS Report identifies for Congress and the public those airports included in the national system, the role they serve, and the amounts and types of airport development eligible for federal funding under the Airport Improvement Program (AIP) over the next 5 years. An airport must be included in the NPIAS to be eligible to receive a grant under the AIP. FAA, in concert with State aviation agencies and local planning organizations, identifies airports that are important to the system for inclusion in the NPIAS. Sixty-five percent (3,356) of the 5,190 public-use airports are included in the NPIAS (see Figure 5 below). There are 1,834 public-use airports that are not included in the NPIAS because they do not meet the minimum entry criteria,10 are located at inadequate sites, or cannot be expanded and improved to provide a safe and efficient airport. All primary and commercial service airports, all general aviation airports designated as reliever airports by FAA, and selected general aviation airports are included in the plan.
Figure 5: Number of Existing and Proposed Airports by Ownership and Use (January 2008)
19,815Total U.S. Airports
19,815Total U.S. Airports
5,190Open to Public
5,190Open to Public
14,625Closed to Public
14,625Closed to Public
4,150Public Owned
4,150Public Owned
3,411NPIAS Airports
(Of the 5,190 existing public use airports, 65% are NPIAS)
3,411NPIAS Airports
(Of the 5,190 existing public use airports, 65% are NPIAS)
3,356 Existing3,254 Public Owned
102 Private Owned
3,356 Existing3,254 Public Owned
102 Private Owned55 Proposed55 Proposed
383Primary
383Primary
139Commercial
Service
139Commercial
Service270
Reliever270
Reliever2,564
GeneralAviation
2,564GeneralAviation
3Primary
3Primary
6Commercial
Service
6Commercial
Service2
Reliever2
Reliever44
General Aviation
44General Aviation
1,040Private Owned
1,040Private Owned
19,815Total U.S. Airports
19,815Total U.S. Airports
5,190Open to Public
5,190Open to Public
14,625Closed to Public
14,625Closed to Public
4,150Public Owned
4,150Public Owned
3,411NPIAS Airports
(Of the 5,190 existing public use airports, 65% are NPIAS)
3,411NPIAS Airports
(Of the 5,190 existing public use airports, 65% are NPIAS)
3,356 Existing3,254 Public Owned
102 Private Owned
3,356 Existing3,254 Public Owned
102 Private Owned55 Proposed55 Proposed
383Primary
383Primary
139Commercial
Service
139Commercial
Service270
Reliever270
Reliever2,564
GeneralAviation
2,564GeneralAviation
3Primary
3Primary
6Commercial
Service
6Commercial
Service2
Reliever2
Reliever44
General Aviation
44General Aviation
1,040Private Owned
1,040Private Owned
10 NPIAS entry criteria is contained in Order 5090.3C, Field Formulation of the NPIAS, available online at http://www.faa.gov/airports_airtraffic/airports/planning_capacity/npias/
National Plan of Integrated Airport Systems (2009-2013) 1

SUPPORTING AIR TRANSPORTATION SYSTEM OBJECTIVES
The NPIAS supports the U.S. Department of Transportation (DOT) and FAA objectives for the air transportation system, as shown below. U.S. Department of Transportation
The mission of DOT is to develop transportation policies and programs that contribute to providing a fast, safe, efficient, and convenient transportation system at the lowest cost consistent with national objectives, including the efficient use and conservation of the resources of the United States. Toward this end, DOT has five strategic goals:11
1. Safety: Enhance the public health and safety by working toward the elimination of transportation-related deaths and injuries.
2. Reduce Congestion: Reduce congestion and other impediments to using the Nation’s
transportation system.
3. Global Connectivity: Facilitate an international transportation system that promotes economic growth and development.
4. Environmental Stewardship: Promote transportation solutions that enhance communities and
protect the natural and built environment.
5. Security, Preparedness, and Response: Balance transportation security requirements with the safety, mobility and economic needs of the Nation and be prepared to respond to emergencies that affect the viability of the transportation sector.
Federal Aviation Administration
FAA supports the DOT strategic goals with four mission-based strategic goals listed below. The specific objectives within each goal are available online.12
1. Safety: To achieve the lowest possible accident rate and constantly improve safety. There are six specific objectives within the safety goal.
2. Capacity: Work with local governments and airspace users to provide capacity in the U.S.
airspace system that reduces congestion and meets projected demand in an environmentally sound manner. There are three specific objectives within the capacity goal.
11 U.S. Department of Transportation Strategic Plan 2006-2011 available online at http://www.dot.gov/stratplan2011/index.htm12 Federal Aviation Administration Flight Plan 2008-2012 available online at http://www.faa.gov/about/plans_reports/media/FPP_Flight%20Plan%202008-2012.pdf
2 National Plan of Integrated Airport Systems (2009-2013)

3. International Leadership: Increase the safety and capacity of the global civil aerospace system in an environmentally sound manner. There are two specific objectives within the international leadership goal.
4. Organizational Excellence: Ensure the success of FAA’s mission through stronger
leadership, a better trained and safer workforce, enhanced cost-control measures, and improved decision-making based on reliable data. There are four specific objectives within the organizational excellence goal.
FAA’s Office of the Associate Administrator for Airports
Each organization within FAA sets annual performance goals in support of FAA and DOT strategic goals. The NPIAS and AIP, by improving the safety, capacity, and condition of the airport system, contribute substantially to achieving the strategic goals as described in the FAA Flight Plan and the FAA Airports Office Business Plan. Listed below are a few of the major goals that the Airports organization has set for FY 2008:
Where practical, upgrade all runway safety areas (RSA) to meet standards (see Chapter 2, Safety section).
Commission nine runway/taxiway projects, increasing the annual service volume (ASV) of
the 35 Operational Evaluation Plan (OEP) airports by at least one percent annually, measured as a five-year moving average through FY 2012 (see Chapter 2, Capacity section).
Ensure that 93 percent of runways at airports in the NPIAS are maintained at excellent, good
or fair condition (see Chapter 2, Runway Pavement Condition section).
Direct AIP funding to reduce capacity constraints of secondary and reliever airports located within the seven major metropolitan areas and corridors that most affect total system delay (see Chapter 2, Capacity section).
Provide AIP funding for noise compatibility projects that benefit an expected 100,000 people
for FY 2006 through 2010, measured on an annual basis, with a rolling average of 20,000 per year (see Chapter 2, Aircraft Noise section).
Maintain a total number of Category A, B, and C vehicle/pedestrian deviations at 56 or fewer
in FY 2008 (see Chapter 2, Safety section).
Design and implement Safety Management Systems (SMS) for airport regulation and certification (see Chapter 2, Safety section).
GUIDING PRINCIPLES FOR THE NATIONAL AIRPORT SYSTEM
The airport system envisioned in the first National Airport Plan in 1946, when civil aviation was in its infancy, has been developed and nurtured by close cooperation with airport sponsors including Federal, State, and local agencies. The general principles guiding Federal involvement have
National Plan of Integrated Airport Systems (2009-2013) 3

remained largely unchanged; the airport system should have the following attributes to meet the demand for air transportation:
Airports should be safe and efficient, located at optimum sites, and developed and maintained to appropriate standards.
Airports should be affordable to both users and Government, relying primarily on user fees
and placing minimal burden on the general revenues of the local, State, and Federal governments.
Airports should be flexible and expandable, able to meet increased demand and to
accommodate new aircraft types.
Airports should be permanent, with assurance that they will remain open for aeronautical use over the long term.
Airports should be compatible with surrounding communities, maintaining a balance
between the needs of aviation and the requirements of residents in neighboring areas.
Airports should be developed in concert with improvements to the air traffic control system and technological advancements.
The airport system should support national objectives for defense, emergency readiness, and
postal delivery.
The airport system should be extensive, providing as many people as possible with convenient access to air transportation, typically by having most of the population within 20 miles of a NPIAS airport.
The airport system should help air transportation contribute to a productive national economy
and international competitiveness. In addition to these principles specific to airport development, a guiding principle for Federal infrastructure investment, as stated in Executive Order 12893, is that such investments must be cost beneficial. FAA implements these principles by using program guidance to ensure the effective use of Federal aid. A national priority system guides the distribution of funds, supplemented when necessary by specific requirements for additional analysis or justification. For example, larger airport capacity development projects must be shown to be cost beneficial in order to receive support under the AIP.
4 National Plan of Integrated Airport Systems (2009-2013)
AIRPORTS INCLUDED IN NPIAS
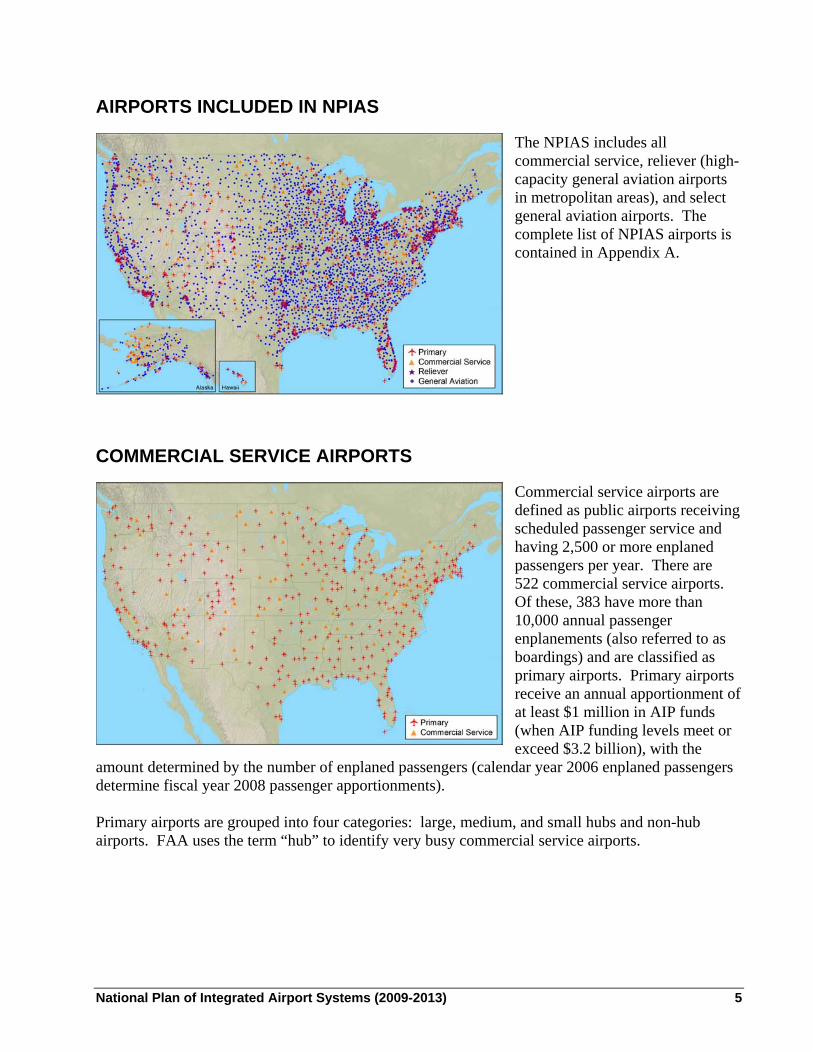
The NPIAS includes all commercial service, reliever (high-capacity general aviation airports in metropolitan areas), and select general aviation airports. The complete list of NPIAS airports is contained in Appendix A.
COMMERCIAL SERVICE AIRPORTS
Commercial service airports are defined as public airports receiving scheduled passenger service and having 2,500 or more enplaned passengers per year. There are 522 commercial service airports. Of these, 383 have more than 10,000 annual passenger enplanements (also referred to as boardings) and are classified as primary airports. Primary airports receive an annual apportionment of at least $1 million in AIP funds (when AIP funding levels meet or exceed $3.2 billion), with the
amount determined by the number of enplaned passengers (calendar year 2006 enplaned passengers determine fiscal year 2008 passenger apportionments). Primary airports are grouped into four categories: large, medium, and small hubs and non-hub airports. FAA uses the term “hub” to identify very busy commercial service airports.
National Plan of Integrated Airport Systems (2009-2013) 5

Large Hubs Large hubs are those airports that each account for at least one percent of total U.S. passenger enplanements.13 Some of these passengers originate in the local community and some are connecting passengers transferring from one flight to another. Several large hub airports such as: San Diego International (SAN), Tampa International (TPA), Fort Lauderdale/Hollywood International (FLL), and LaGuardia (LGA) have little passenger transfer activity (10 percent or less), while transfers account for more
than half of the traffic at others—Cincinnati/Northern Kentucky International (CVG), Charlotte/Douglas International (CLT), Memphis International (MEM), Hartsfield-Jackson Atlanta International (ATL), George Bush Intercontinental/Houston (IAH), Dallas/Ft. Worth International (DFW) and Chicago O’Hare International (ORD), for example. The 30 large hub airports account for 69 percent of all passenger enplanements. Large hub airports tend to concentrate on airline passenger and freight operations and have limited general aviation activity. Four large hub airports (Miami International, Salt Lake City International, Phoenix Sky Harbor International, and Honolulu International) have an average of 278 based aircraft, but the other 26 large hubs average 35 based aircraft each. Thus, locally based general aviation plays a relatively small role at most large hub airports. The Nation’s air traffic delay problems tend to be concentrated at the 30 large hub airports where the average delay per aircraft operation was six minutes in 2006.14 However, five airports experienced an average delay of nine or more minutes per aircraft operation and ten airports in eight metropolitan areas accounted for 84 percent of the delayed flights in the United States in 2006. Delays occur primarily during instrument weather conditions (i.e., reduced ceiling and visibility) when runway capacity is reduced below that needed to accommodate traffic levels. These 30 large hub airports plus five of the busiest medium hub airports are included in FAA’s plan to increase the capacity and efficiency of the national airspace system, known as the Operational Evolution Partnership (see the Capacity section in Chapter 2).
13 FAA’s use of the term hub airport is somewhat different than that of airlines, which use it to denote an airport with significant connecting traffic by one or more carriers. The hub categories used by FAA are defined in Section 40102 of Title 49 of the United States Code (2004). 14 The source of delay data is FAA’s Aviation System Performance Metric (ASPM) database and includes taxi-in, taxi- out, and airborne delays.
6 National Plan of Integrated Airport Systems (2009-2013)

Medium Hubs Medium hubs are defined as airports that each account for between 0.25 percent and 1 percent of total U.S. passenger enplanements. There are 37 medium hub airports, accounting for 20 percent of all enplanements. Medium hub airports usually have sufficient capacity to accommodate air carrier operations and a substantial amount of general aviation activity. Two medium hub airports have an average of 608 based aircraft—Dallas Love Field (DAL) and John Wayne Airport-Orange County (SNA) while the
other 35 medium hub airports have an average of 129 based aircraft. The average delay per operation increased slightly to 3.3 minutes at medium hub airports in 2006. Small Hubs
Small hubs are defined as airports that enplane 0.05 percent to 0.25 percent of total U.S. passenger enplanements. There are 72 small hub airports that together account for 8 percent of all enplanements. Less than 25 percent of the runway capacity at small hub airports is used by airline operations, so these airports can accommodate a great deal of general aviation activity, with an average of 134 based aircraft at each airport. These airports are typically uncongested and do
not have significant air traffic delays. Nonhub Primary
Commercial service airports that enplane less than 0.05 percent of all commercial passenger enplanements but have more than 10,000 annual enplanements are categorized as nonhub primary airports. There are 244 nonhub primary airports that together account for 3 percent of all enplanements. These airports are heavily used by general aviation aircraft, with an average of 99 based aircraft per airport.
National Plan of Integrated Airport Systems (2009-2013) 7

Nonprimary Commercial Service Commercial service airports that have from 2,500 to 10,000 annual passenger enplanements are categorized as nonprimary commercial service airports. There are 139 of these airports in the NPIAS, and they account for 0.1 percent of all enplanements. These airports are used mainly by general aviation and have an average of 38 based aircraft.
RELIEVER AIRPORTS
Due to different operating requirements between small general aviation aircraft and large commercial aircraft, general aviation pilots often find it difficult to use a congested commercial service airport.15 In recognition of this, FAA has encouraged the development of high-capacity general aviation airports in major metropolitan areas. These specialized airports, called relievers, provide pilots with attractive alternatives to using congested hub airports. They also
provide general aviation access to the surrounding area. To be eligible for reliever designation, these airports must have 100 or more based aircraft or 25,000 annual itinerant operations. The 270 reliever airports have an average of 230 based aircraft, which in total represents 28 percent of the Nation’s general aviation fleet.
15 Large commercial aircraft typically operate at much higher speeds than small general aviation aircraft thereby making it difficult to have both types of aircraft use the same runways during periods of high commercial aircraft activity. This is due, in part, to variances in approach airspeed and to wake turbulence considerations. Some of the busiest airports are in Class B and C airspace, which have specific requirements for aircraft equipage and pilot qualifications. In addition, general aviation pilots may be less familiar with air traffic control procedures used at airports that primarily serve air carrier operations.
8 National Plan of Integrated Airport Systems (2009-2013)

GENERAL AVIATION AIRPORTS
Communities that do not receive scheduled commercial service or that do not meet the criteria for classification as a commercial service airport may be included in the NPIAS as general aviation airports if they account for enough activity (having usually at least 10 locally based aircraft) and are at least 20 miles from the nearest NPIAS airport. The 2,564 general aviation airports in the NPIAS tend to be distributed on a one-per-county basis in rural areas and are often located near the county seat. These airports, with an
average of 35 based aircraft, account for 41 percent of the Nation’s general aviation fleet. They are the closest source of air transportation for about 19 percent of the population and are particularly important to rural areas. Table 1 shows the number of NPIAS airports by type as well as the percentage of enplanements, based aircraft, percentage of total development, and percentage of population within 20 miles of the NPIAS airport identified.
Table 1: Airport Statistics
Number of
Airports Airport Type
Percentage of 2006 Total
Enplanements
Percentage of All Based Aircraft1
Percentage of NPIAS 2009-2013
Cost
Percentage ofPopulation Within 20 Miles of Airport
30 Large Hub Primary 68.7 0.9 36 2637 Medium Hub Primary 20.0 2.6 14 1872 Small Hub Primary 8.1 4.3 8 14
244 Nonhub Primary 3.0 10.9 10 20
139 Nonprimary Commercial Service 0.1 2.4 2 3
270 Relievers 0.0 28.2 7 562,564 General Aviation 0.0 40.8 19 69
3,356 Existing NPIAS Airports 99.9 89.8 100 98
16,459 Low Activity Landing Areas (Non-NPIAS) 0.1 10.2 N/A N/C
1Based on active aircraft fleet of 221,942 aircraft in 2006. N/A – Not appropriate N/C – Not calculated
National Plan of Integrated Airport Systems (2009-2013) 9

NEW AIRPORTS
The NPIAS identifies 55 airports that are planned to open within the next 5 years. These new airports are shown separately in Appendix A and are also included in the list of airports by state in Appendix A. New airports are identified by a location identifier beginning with a plus symbol (i.e., +081) and include 44 new general aviation airports, 2 relievers, 6 nonprimary commercial service and 3 new primary airports. Two of the new primary airports replace an existing commercial service airport (St. George Municipal, UT and Panama City-Bay County International, FL) and one airport provides additional commercial service to serve the Chicago area (Peotone, IL). In addition, several other communities have planning studies underway to examine the feasibility of replacing existing airports (Bowling Green-Warren County Regional, KY and Hazleton Municipal, PA) or evaluate the need for an additional commercial service airport to serve the community (Las Vegas, NV). Because those new airports are not expected to open by 2013, they are not identified in Appendix A. AIRPORTS NOT INCLUDED IN NPIAS
There are 5,190 public-use airports in the U.S. (4,150 are owned by public entities and 1,040 are owned by private entities). Of these public-use airports, 3,356 are included in the NPIAS. There are 1,834 airports open to the public not included in the NPIAS. There are 938 privately owned, public-use airports that are not included because they are located at inadequate sites, are redundant to publicly owned airports, or have too little activity to qualify for inclusion. There are 896 publicly owned, public-use airports that are not included because they do not meet the minimum criteria for the NPIAS of ten based aircraft, are within 20 miles of a NPIAS airport, are located at inadequate sites, cannot be expanded and improved to provide safe and efficient airport facilities, or do not have adequate justification showing a significant national interest. In addition, 14,625 civil landing areas that are not open to the general public are not included in the NPIAS. The airports not included in the NPIAS have an average of one based aircraft, compared to 35 based aircraft at the average NPIAS general aviation airport. STATE SYSTEM PLANS INCLUDE MORE AIRPORTS
Each state has an aviation system plan that determines the development needed to establish a viable system of airports within that state. Each system plan involves examining the interaction of the airports with the aviation service requirements, economy, population, and surface transportation of a state’s geographic area. State plans define an airport system that is consistent with established state goals and objectives for economic development, transportation, land use, and environmental matters. State plans contain about 5,000 airports, about 33 percent more than the NPIAS. Airports included in the state plans but not in the NPIAS are usually smaller airports that have state or regional significance, but are not considered to be of national significance.
10 National Plan of Integrated Airport Systems (2009-2013)

NUMBER OF AIRPORTS INCLUDED IN NPIAS - HISTORICAL
America turned its attention to the development of civilian aviation after the end of World War II. This included the development of a national network of airports and a national airport plan. The plan identified existing airports and proposed new airports to serve the commercial and general aviation needs of a growing and dispersed population. Specific criteria were established to ensure that the network of airports met national mobility needs at a reasonable cost. Based on the type of airport, these criteria include: number of based aircraft, number of annual operations, scheduled air carrier service and proximity to other airports in the national plan. Criteria also permitted inclusion of airports that met special needs such as access to remote populations. As noted in Figure 6, the national airport plan released in 1951 identified 2,657 existing airports and 2,300 proposed airports. Many of the proposed airports were constructed in the 1950s, and today less than 2 percent of the national plan airports are proposed airports. Over the last half-century, aviation in the United States has matured, resulting in a fairly consistent number of airports (see Figure 6) included in the Nation’s airport plan. Although the number of airports has remained steady, many airports have changed in size and complexity to meet the travel demands of a growing population and expanding economy. In 2006, FAA began an update of the based aircraft inventory information that supports one of the NPIAS entry criteria noted above. This update includes verifying the “N” numbers for aircraft based at a NPIAS airport to ensure that the based aircraft counts are accurate. The initial verification is due to be completed in August 2008 and will be kept current as part of the airport inspection process. Using this updated information, along with other information, FAA will re-examine the criteria used to determine eligibility for inclusion in the national plan.
Figure 6: Historical - Existing and Proposed NPIAS Airports
2,657
3,382 3,2763,137 3,159 3,219 3,243 3,285 3,294 3,344 3,364 3,344 3,364 3,356
0
400
800
1,200
1,600
2,000
2,400
2,800
3,200
3,600
4,000
1951-1953
1963-1967
1973-1977
1978-1987
1980-1989
1984-1993
1986-1995
1990-1999
1993-1997
1998-2002
2001-2005
2005-2009
2007-2011
2009-2013
NPI
AS
Airp
orts
Existing Airports Proposed Airports
.
National Plan of Integrated Airport Systems (2009-2013) 11

This page intentionally left blank.
12 National Plan of Integrated Airport Systems (2009-2013)

Chapter 2: System Performance OVERVIEW
The Federal role in airport development is largely concerned with assuring a high level of system performance. This chapter describes the major initiatives underway to evaluate and improve the performance of the transportation system. It also describes how well the airport system is operating and highlights trends. Six key factors help determine the level of system performance: capacity, safety, environmental performance, pavement condition, surface accessibility, and financial performance, are described in this chapter. MAJOR INITIATIVES
Airport Research
Congress established the Airport Cooperative Research Program (ACRP) through Vision 100-Century of Aviation Reauthorization Act of 2003. A Memorandum of Agreement was developed to provide organizational guidance to three main entities that fund, administer, and oversee the ACRP. The FAA funds the program. The National Academies, acting through its Transportation Research Board (TRB), administers the program. The ACRP Oversight Committee (AOC), an independent governing board comprised of airport managers and other aviation officials appointed by the U.S. Secretary of Transportation, selects all of the program’s projects. The objective of the ACRP is to carry out applied research on problems that are shared by airport operators and are too difficult for individual airports to solve on their own. Additionally, ACRP studies issues that are not being adequately addressed by existing Federal research programs. ACRP undertakes research in a variety of airport subject areas, including planning, safety, environment, design, construction, maintenance, security, policy, human resources, administration, and operations. As of July 2008, ACRP had initiated 95 research projects. A complete listing of all ACRP research projects and results is available online, free of charge, to all who are interested in benefiting from this program.16 The ACRP complements existing Federal programs. As an example, FAA released a study, Capacity Needs in the National Airspace System 2007-2025 (commonly referred to as FACT 2, described in the next section) which indicated metropolitan areas and regions along the east and west coasts experiencing large amounts of growth in population and economic activity that translate into chronic congestion and delay problems in the air and on the ground. FAA requested TRB conduct a research synthesis project through the ACRP, Project 03-10, Innovative Approaches to Addressing Capacity Issues in Coastal Mega-regions, in order to develop integrated strategic actions to enhance decision making to address constrained aviation system capacity and growing travel demand in high-density, multijurisdictional, multimodal, coastal mega-regions along the east and west coasts. The research is intended to be used by transportation agencies and operators, as well as informing public officials at the Federal, state, and local levels. This action, coupled with other agency initiatives like
16 The ACRP website is: http://www.trb.org/acrp/.
National Plan of Integrated Airport Systems (2009-2013) 13

the Next Generation Air Transportation System (NextGen) Implementation Plan, which identifies airports and metropolitan areas forecast to be capacity constrained seeks to prepare projects and programs to alleviate the anticipated impact of future travel demand on the aviation system. A National Look − Airport Capacity
In 2003, FAA convened a team known as the Future Airport Capacity Task (FACT). Its task was to assess the future capacity of the Nation’s airports and metropolitan areas, and determine which airports and metropolitan areas have the greatest need for additional capacity. Because it is a system-wide analysis, FACT is intended to provide FAA with data about the timing and need for infrastructure improvements at the national level for agency planning purposes. The results of the latest FACT analysis referred to as FACT 2 were documented in the May 2007 FAA report Capacity Needs in the National Airspace System, An Analysis of Airport and Metropolitan Area Demand and Operational Capacity in the Future.17 The FACT 2 analysis identified a significant number of U.S. airports and metropolitan areas that can be expected to require additional capacity in the future if demand reaches forecast levels. This analysis not only highlights the importance of moving forward with current improvement plans, and keeping such plans on schedule, but of seeking new solutions to add even more capacity than is currently being planned by airports and communities. Currently, FAA is working with select airports and local communities to develop a toolbox of potential solutions addressing the anticipated future capacity shortfalls. The initial focus is on the 14 airports and eight metro areas identified in the FACT 2 report for the 2025 planning period as needing additional capacity, after accounting for planned improvements. Examples of potential solutions include: New runways, new supplementary commercial service airports, regional solutions (i.e. multiple airport solutions), multi-modal options within high-density corridors, congestion management, and the transformation of the national airspace system through NextGen. FAA is working with JPDO to integrate the various NextGen concepts into the development of the FACT 2 Toolbox.
Operational Evolution Plan Evolves into Next Generation Air Transportation System18
In 2001, FAA established the Operational Evolution Plan (OEP) to focus on increasing the capacity of the national airspace system by 30 percent and consolidate information about capacity enhancements into one document. The forecasted and actual benefits of these activities are measured annually; a recent analysis shows FAA will achieve the original goal by 2013.
17 The FACT 2 report is available online at http://www.faa.gov/airports_airtraffic/airports/resources/publications/reports/media/fact_2.pdf 18 A mandate for the design and deployment of the next generation air transportation system to meet the Nation’s needs in 2025 was established in the “Vision 100” legislation (Public Law #108-176) in December 2003. The legislation also established the JPDO to develop the NextGen concept. JPDO is a joint initiative of the Department of Transportation, Department of Defense, Department of Commerce, Department of Homeland Security, National Aeronautics and Space Administration, and the White House Office of Science and Technology Policy.
14 National Plan of Integrated Airport Systems (2009-2013)
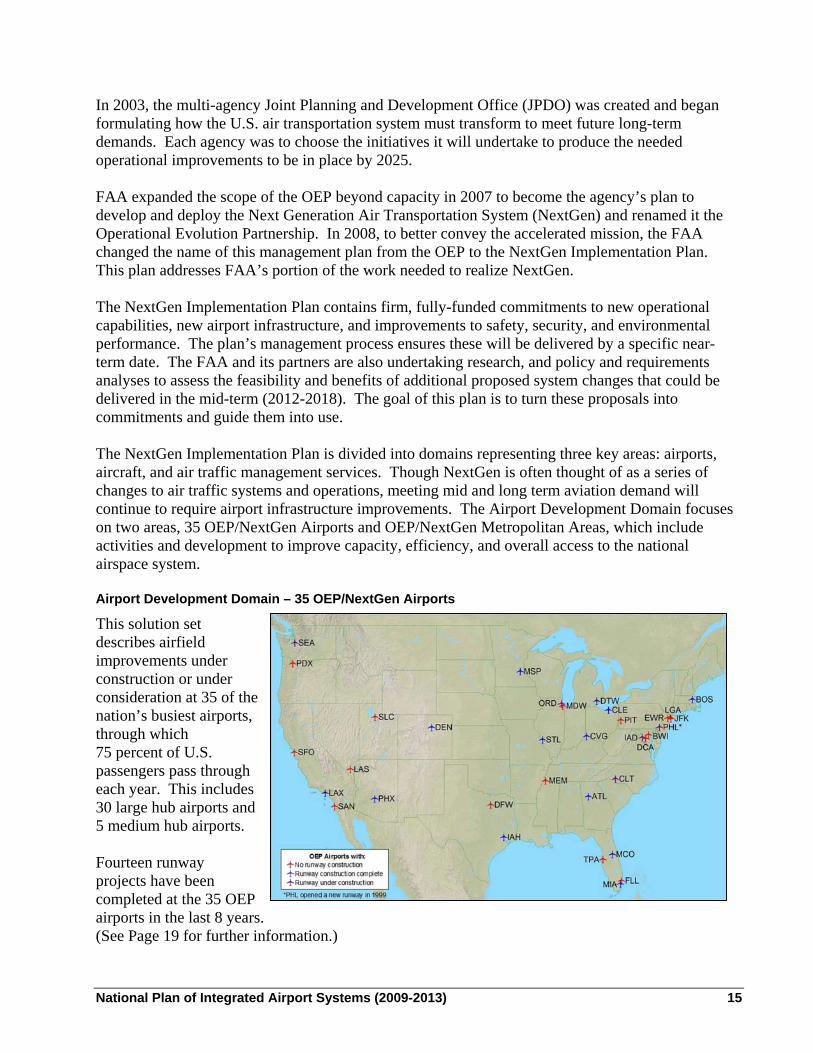
In 2003, the multi-agency Joint Planning and Development Office (JPDO) was created and began formulating how the U.S. air transportation system must transform to meet future long-term demands. Each agency was to choose the initiatives it will undertake to produce the needed operational improvements to be in place by 2025. FAA expanded the scope of the OEP beyond capacity in 2007 to become the agency’s plan to develop and deploy the Next Generation Air Transportation System (NextGen) and renamed it the Operational Evolution Partnership. In 2008, to better convey the accelerated mission, the FAA changed the name of this management plan from the OEP to the NextGen Implementation Plan. This plan addresses FAA’s portion of the work needed to realize NextGen. The NextGen Implementation Plan contains firm, fully-funded commitments to new operational capabilities, new airport infrastructure, and improvements to safety, security, and environmental performance. The plan’s management process ensures these will be delivered by a specific near-term date. The FAA and its partners are also undertaking research, and policy and requirements analyses to assess the feasibility and benefits of additional proposed system changes that could be delivered in the mid-term (2012-2018). The goal of this plan is to turn these proposals into commitments and guide them into use. The NextGen Implementation Plan is divided into domains representing three key areas: airports, aircraft, and air traffic management services. Though NextGen is often thought of as a series of changes to air traffic systems and operations, meeting mid and long term aviation demand will continue to require airport infrastructure improvements. The Airport Development Domain focuses on two areas, 35 OEP/NextGen Airports and OEP/NextGen Metropolitan Areas, which include activities and development to improve capacity, efficiency, and overall access to the national airspace system. Airport Development Domain – 35 OEP/NextGen Airports
This solution set describes airfield improvements under construction or under consideration at 35 of the nation’s busiest airports, through which 75 percent of U.S. passengers pass through each year. This includes 30 large hub airports and 5 medium hub airports. Fourteen runway projects have been completed at the 35 OEP airports in the last 8 years. (See Page 19 for further information.)
National Plan of Integrated Airport Systems (2009-2013) 15

Airport Development Domain – OEP/NextGen Metropolitan Areas
This solution set focuses on planning improvements for high-activity reliever and hub airports in 15 metropolitan areas that could be capacity constrained by 2025, unless action is taken now. These 15 metropolitan areas account for 58 percent of all passenger activity and almost 15 percent of based aircraft. The intention of this effort is to combine airfield improvements with NextGen operational changes to create the required capacity. NextGen Airport Concepts
New technology, operational procedures, and aircraft initiatives being developed and implemented through NextGen will allow airports to meet the long term aviation demand and enhance surface management and efficiency. As a result, airports will have greater safety, capacity, and design flexibility, as well as a reduced environmental impact on surrounding communities.
Safety will be improved because pilots and airport ground personnel will have greater situational awareness, which will reduce the number of runway incursions. Airports will be able to make better use of existing capacity by optimizing current infrastructure.
Reduced lateral, vertical, and in-trail separation standards for aircraft, especially during bad weather, will greatly increase capacity.
Design standards for runway separations will change, and independent operations on
closely spaced parallel runways may be allowed at separations as low as 750 feet. This allows for greater design flexibility, as it may be possible to add new runways within existing footprints of airport property.
Environmental impacts will be reduced due to smaller noise contours and reduced
emissions that Continuous Descent Arrivals (CDAs) and better flight tracks can provide. Some of these capabilities are already present today. New technologies and procedures will continue to evolve, however, helping airports as they prepare for the future.
FACTORS INDICATING SYSTEM PERFORMANCE
Each of the six factors, described throughout the rest of this chapter, is relevant to the quality of air transportation, and taken together they provide a good indication of system performance. However, the six factors are not equally sensitive to capital improvements, and increased investment in
16 National Plan of Integrated Airport Systems (2009-2013)

infrastructure is not necessarily the only way to improve performance. Federal aid to airports can be useful when focusing on specific issues, such as the provision for aircraft rescue and fire fighting equipment, development of safety areas around runways, removal of obstructions in runway approach zones, and planning and implementing noise compatibility measures. A section on monitoring the performance of airport passenger terminal facilities will be added to future NPIAS reports, after research efforts currently underway by the ACRP are completed and evaluated. The ACRP is currently pursuing seven separate research projects to update FAA Advisory Circular 150/5360-13, Design Guidelines for Airport Terminal Facilities. The expected completion date for these research projects is 2010. FAA airport passenger terminal facilities guidelines apply mainly to public areas of these facilities because individual airlines use proprietary standards for their own leased spaces. Capacity
The capacity of the airport system is affected by many factors, including the layout of individual airports, the manner in which airspace is organized and used, airport operating procedures, and the application of technology. The majority of airports in our national system have adequate airport capacity and little or no delay. For those airports that need additional capacity, a runway project is one means to improve capacity. However, not all airports are able to build a new runway or extend an existing one. The Alternative Capacity Enhancement Measures section below includes some non-capital alternatives that are being developed or have been implemented. FAA uses a comprehensive process to determine future airfield development. It includes airport master planning, FAA airspace studies, environmental analysis and documentation, airfield modeling, and delay analysis, as well as benefit-cost analyses for larger capacity projects. Airfield simulation models are employed to estimate the level of delay associated with current and forecast operations for both the existing airfield and for planned improvements. Benefit-cost analyses are applied to determine the benefit of the airfield improvements in relation to the cost of improvements. A major concern in airport planning is the adequacy of the runways and taxiways to handle anticipated aircraft operations safely and efficiently. A single runway with a parallel taxiway can normally accommodate approximately 200,000 annual aircraft operations. FAA provides guidance to help airport sponsors in deciding when airfield capacity improvements should be considered. Current FAA guidance recommends that capacity planning start when aircraft activity reaches 60 to 75 percent of an airport’s airfield capacity. Since major airfield improvements often take 10 or more years from concept to opening, the recommendation allows adequate lead-time so the needed improvement can be completed before a problem becomes critical. One of the tools used by airport planners to estimate the timing of capacity improvements and allow the airport to plan accordingly is the Annual Service Volume (ASV). ASV is an estimate of the number of aircraft operations that can be reasonably accommodated at an airport over a period of a year at a particular level of delay. It is not an absolute capacity number. Rather, it is the capability of the airport to accommodate aircraft operations with a given delay level. Experience shows that, usually, airfield delay increases gradually with rising levels of traffic. For larger airports, it appears that the onset of more rapid growth in delay often occurs when delay reaches between four and six minutes per aircraft operation.
National Plan of Integrated Airport Systems (2009-2013) 17

ASV is a measure included in the FAA Flight Plan. The goal is to increase the ASV of the OEP airports by at least one percent per year through 2013. The 14 runway projects that have been completed in the last 8 years, shown in Table 2, are keeping FAA on track to achieve this goal. Before a new runway or runway extension can be built, FAA must assess potential environmental impacts that may result from airport development projects. In the Vision 100-Century of Aviation Reauthorization Act, Congress directed FAA to implement a process for expedited and coordinated environmental reviews of airport capacity, safety, and security projects. In addition, FAA is continuing to work closely with the 35 OEP airports to ensure environmental studies for major runway projects or airfield reconfigurations are completed on schedule. FAA establishes environmental impact analysis teams, maximizes the use of available staff and consultant resources, and utilizes recommended best practices for accomplishing its environmental work in a timely manner. FAA works with other Federal and State environmental resource agencies to achieve concurrent reviews, analyses, and permit approvals to the greatest extent possible. Deadlines are set and monitored and a process is put in place to elevate and resolve disputes or disagreements between parties. Congestion and Delay
Concentration of aircraft arrivals and departures at an airport can result in congestion and delay. DOT defines a delayed operation as an aircraft arriving at or departing from a gate 15 minutes or more after its scheduled time. The number of arrivals and departures that are delayed 15 minutes or more is compiled by DOT for busy airports and is reported monthly. In 2007, the 20 airlines reporting data posted the second worst on-time arrival record of 73.3 percent, which is behind the all-time worst mark of 72.6 percent reached in 2000. Of the 26.7 percent of flights delayed in 2007, 8.1 percent were delayed because the aircraft arrived late (previous flight with same aircraft arrived late, causing the present flight to depart late), eight percent were delayed due to national aviation system delays (such as non-extreme weather conditions, runway closures, heavy traffic volume, and air traffic control). Seven percent were delayed due to air carrier delay (circumstances within the airline's control such as maintenance or crew problems, aircraft cleaning, baggage loading, fueling), 2.4 percent of the delays were attributed to cancelled or diverted flights, and one percent were delayed due to significant meteorological conditions that, in the judgment of the carrier, delayed or prevented the operation of a flight such as tornado, blizzard or hurricane. Other delay statistics are collected and used for specific purposes. For example, air traffic controllers identify instances where aircraft are delayed 15 minutes or more in a given flight segment. FAA uses this information to monitor the day-to-day operation of the air traffic control system. Airport planners and designers use the average delay per aircraft operation as a measure of congestion, which is related to demand and capacity. This statistic can be forecasted and translated into a dollar cost of delay. On July 14, DOT published a Federal Register Notice amending the Airport Rates and Charges Policy. The amendment provides two changes and one clarification, plus the addition of a definition for a “congested airport.” Initiatives for addressing congestion are discussed in the Congestion Management section below.
18 National Plan of Integrated Airport Systems (2009-2013)

Runways and Airfield Reconfiguration
The largest airport capacity increases can be achieved through new runway construction. Generally, new runways increase an airport’s capacity by 30 to 60 percent. Since 1999, 13 new runways and one airfield reconfiguration have opened (shown in Table 2) at airports identified in FAA’s OEP, providing these airports with the ability to accommodate more than 1.6 million additional operations per year. The southside reconfiguration completed in June 2008 at Los Angeles International Airport was to improve the safety and efficiency of the airport.
Table 2: New Runways and Airfield Reconfigurations Opened Since 1999 at OEP Airports
Airport Date Opened Runway Identifier
Runway Length (Feet)
Philadelphia December 1999 8/26 5,000 Phoenix October 2000 7R/25L 7,800 Detroit December 2001 4L/22R 10,000 Cleveland August 2004 6L/24R 9,000 Denver September 2003 16R/24L 16,000 Miami September 2003 8/26 8,600 Houston October 2003 8L/26R 9,000 Orlando December 2003 17L/35R 9,000 Minneapolis-St. Paul October 2005 17/35 8,000 Cincinnati-No. Kentucky December 2005 18R/36L 8,000 Lambert-St. Louis April 2006 11/29 9,000 Atlanta Hartsfield June 2006 10/28 9,000 Boston Logan November 2006 14/32 5,000
Los Angeles June 2008 Southside Reconfiguration
Relocated 7R/25L and New Taxiway
Currently, five OEP airports have airfield projects (three new runways, one runway extension, and one airfield reconfiguration) under construction as shown in Table 3. The projects are anticipated to provide these airports with the ability to accommodate about 400,000 additional operations per year. In addition, there are seven other runway projects under consideration at OEP airports that are currently in the planning or environmental review stage.
Table 3: New Runways, Runway Extensions, and Airfield Reconfigurations Under Construction at OEP Airports (as of June 2008)
Airport Anticipated Opening Date Status
Seattle-Tacoma November 2008 Under construction Washington Dulles November 2008 Under construction
Chicago O’Hare (Reconfiguration)
Extension – September 2008 New Runway – November 2008
Relocated Runway - 2011 Under construction
Philadelphia (Runway Extension) March 2009 Under construction
Charlotte February 2010 Under construction
National Plan of Integrated Airport Systems (2009-2013) 19

End-Around Taxiways
Another means to improve efficiency and capacity at a busy airport is to construct a taxiway around the end of a runway as an alternative to having aircraft cross an active runway. These taxiways allow an aircraft unrestricted taxiing to the terminal rather than having aircraft hold and cross an active runway. Although the taxiing distance will be longer, overall taxi time will decrease because the aircraft will not need to wait to cross an active runway. Two of the busiest airports in the United States, Hartsfield-Jackson Atlanta International and Dallas/ Ft. Worth International Airport undertook construction of end-around taxiways.
Hartsfield-Jackson Atlanta International Airport is the busiest airport in the world in terms of aircraft operations. In June 2006, the airport opened a new runway. In April 2007 an end-around taxiway at the approach end of runway 8R opened, eliminating about 612 runway crossings per day. A capacity study is underway to explore how the Atlanta metropolitan area will accommodate future demand for commercial aviation. One of the options being considered is an end-around taxiway around two other runway ends, runway 9R and 9L.
Dallas/Ft. Worth International Airport (DFW) is the third busiest airport in terms of aircraft
operations. The airport has approximately 1,700 runway crossings a day with some aircraft required to cross two runways to get to the terminal environment. Significantly reducing the number of daily runway crossings has the potential to reduce the chance of aircraft getting too close to each other. The taxiway at the approach end of Runways 35L and 35C is under construction and is scheduled to open in December 2008.
Evaluation Measures
There are a number of measures that can be used to evaluate the capacity of major airports where even moderate improvements in delay have the potential for large cost savings. Table 4 contains measures for the 35 major airports contained in the OEP that can be examined to determine their performance. These include the aircraft mix, percentage of originating and transfer traffic, percentage of international enplanements, number of runways, average enplanements per departure, and the average minutes of delay per operation. Figure 7 shows the share of commuter and air carrier operations by airport. There are five airports where commuter aircraft (aircraft with 60 or fewer seats) operations are greater than air carrier operations: Cincinnati (CVG), Cleveland (CLE), Pittsburgh (PIT), Washington Dulles (IAD), and Houston Intercontinental (IAH).
20 National Plan of Integrated Airport Systems (2009-2013)

Figure 7: Percentage of Commuter and Air Carrier Operations at 35 OEP Airports in 2006
(Ranked by Highest Share of Commuter/Air Taxi Operations)
0% 20% 40% 60% 80% 100%
MDWPHXMIAJFK
MCOHNLBWIFLLTPASANSEALASSFOLAXDENMSPATL
DFWORDPDXEWRMEMDTWSTL
DCACLTPHLBOSIAD
SLCLGA
PITIAH
CLECVG
Percentage of Operations
Commuter/Air TaxiAir Carrier
Air carrier operations are those by aircraft with more than 60 passenger seats; general aviation and industry operators not shown. Source: FAA Terminal Area Forecast
National Plan of Integrated Airport Systems (2009-2013) 21
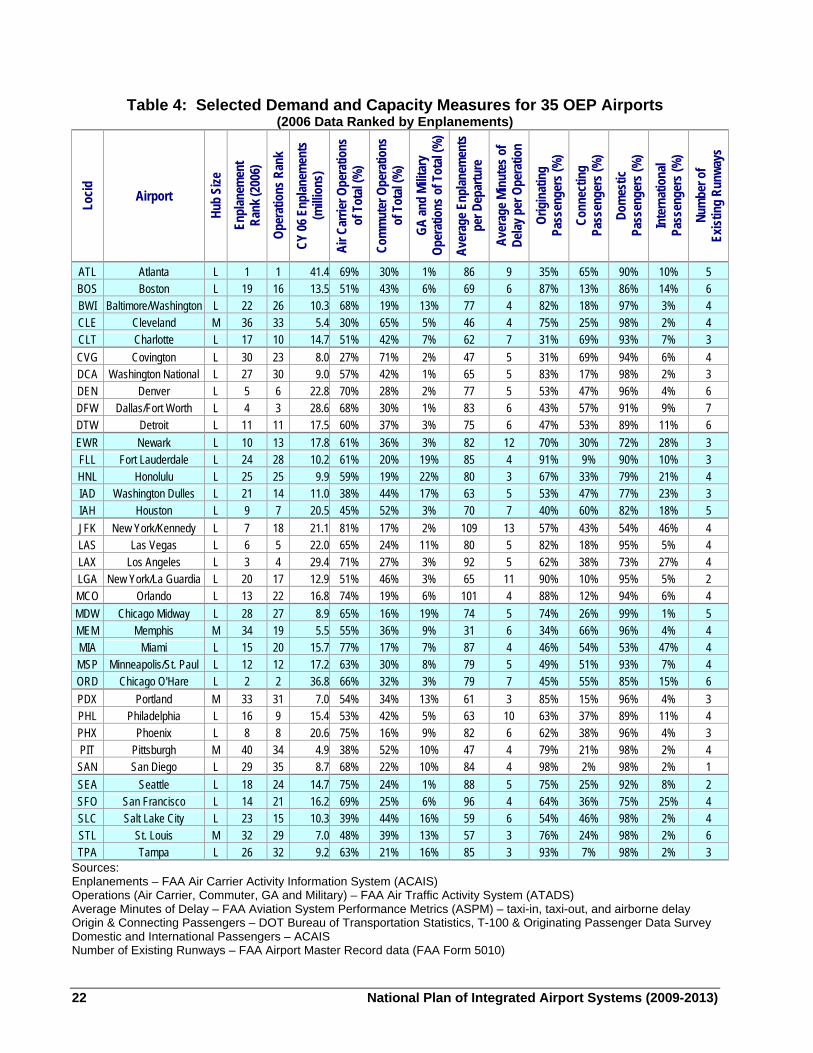
Table 4: Selected Demand and Capacity Measures for 35 OEP Airports (2006 Data Ranked by Enplanements)
Locid
Airport Hu
b Si
ze
Enpl
anem
ent
Rank
(200
6)
Oper
atio
ns R
ank
CY 06
Enp
lanem
ents
(m
illion
s)
Air C
arrie
r Ope
ratio
ns
of T
otal
(%)
Com
mut
er O
pera
tions
of
Tot
al (%
)
GA an
d Mi
litar
y Op
erat
ions
of T
otal
(%)
Aver
age E
nplan
emen
ts
per D
epar
ture
Aver
age M
inut
es o
f De
lay p
er O
pera
tion
Orig
inat
ing
Pass
enge
rs (%
)
Conn
ectin
g Pa
ssen
gers
(%)
Dom
estic
Pa
ssen
gers
(%)
Inte
rnat
iona
l Pa
ssen
gers
(%)
Num
ber o
f Ex
istin
g Ru
nway
s
ATL Atlanta L 1 1 41.4 69% 30% 1% 86 9 35% 65% 90% 10% 5 BOS Boston L 19 16 13.5 51% 43% 6% 69 6 87% 13% 86% 14% 6 BWI Baltimore/Washington L 22 26 10.3 68% 19% 13% 77 4 82% 18% 97% 3% 4 CLE Cleveland M 36 33 5.4 30% 65% 5% 46 4 75% 25% 98% 2% 4 CLT Charlotte L 17 10 14.7 51% 42% 7% 62 7 31% 69% 93% 7% 3 CVG Covington L 30 23 8.0 27% 71% 2% 47 5 31% 69% 94% 6% 4 DCA Washington National L 27 30 9.0 57% 42% 1% 65 5 83% 17% 98% 2% 3 DEN Denver L 5 6 22.8 70% 28% 2% 77 5 53% 47% 96% 4% 6 DFW Dallas/Fort Worth L 4 3 28.6 68% 30% 1% 83 6 43% 57% 91% 9% 7 DTW Detroit L 11 11 17.5 60% 37% 3% 75 6 47% 53% 89% 11% 6 EWR Newark L 10 13 17.8 61% 36% 3% 82 12 70% 30% 72% 28% 3 FLL Fort Lauderdale L 24 28 10.2 61% 20% 19% 85 4 91% 9% 90% 10% 3 HNL Honolulu L 25 25 9.9 59% 19% 22% 80 3 67% 33% 79% 21% 4 IAD Washington Dulles L 21 14 11.0 38% 44% 17% 63 5 53% 47% 77% 23% 3 IAH Houston L 9 7 20.5 45% 52% 3% 70 7 40% 60% 82% 18% 5 JFK New York/Kennedy L 7 18 21.1 81% 17% 2% 109 13 57% 43% 54% 46% 4 LAS Las Vegas L 6 5 22.0 65% 24% 11% 80 5 82% 18% 95% 5% 4 LAX Los Angeles L 3 4 29.4 71% 27% 3% 92 5 62% 38% 73% 27% 4 LGA New York/La Guardia L 20 17 12.9 51% 46% 3% 65 11 90% 10% 95% 5% 2 MCO Orlando L 13 22 16.8 74% 19% 6% 101 4 88% 12% 94% 6% 4 MDW Chicago Midway L 28 27 8.9 65% 16% 19% 74 5 74% 26% 99% 1% 5 MEM Memphis M 34 19 5.5 55% 36% 9% 31 6 34% 66% 96% 4% 4 MIA Miami L 15 20 15.7 77% 17% 7% 87 4 46% 54% 53% 47% 4 MSP Minneapolis/St. Paul L 12 12 17.2 63% 30% 8% 79 5 49% 51% 93% 7% 4 ORD Chicago O'Hare L 2 2 36.8 66% 32% 3% 79 7 45% 55% 85% 15% 6 PDX Portland M 33 31 7.0 54% 34% 13% 61 3 85% 15% 96% 4% 3 PHL Philadelphia L 16 9 15.4 53% 42% 5% 63 10 63% 37% 89% 11% 4 PHX Phoenix L 8 8 20.6 75% 16% 9% 82 6 62% 38% 96% 4% 3 PIT Pittsburgh M 40 34 4.9 38% 52% 10% 47 4 79% 21% 98% 2% 4 SAN San Diego L 29 35 8.7 68% 22% 10% 84 4 98% 2% 98% 2% 1 SEA Seattle L 18 24 14.7 75% 24% 1% 88 5 75% 25% 92% 8% 2 SFO San Francisco L 14 21 16.2 69% 25% 6% 96 4 64% 36% 75% 25% 4 SLC Salt Lake City L 23 15 10.3 39% 44% 16% 59 6 54% 46% 98% 2% 4 STL St. Louis M 32 29 7.0 48% 39% 13% 57 3 76% 24% 98% 2% 6 TPA Tampa L 26 32 9.2 63% 21% 16% 85 3 93% 7% 98% 2% 3
Sources: Enplanements – FAA Air Carrier Activity Information System (ACAIS) Operations (Air Carrier, Commuter, GA and Military) – FAA Air Traffic Activity System (ATADS) Average Minutes of Delay – FAA Aviation System Performance Metrics (ASPM) – taxi-in, taxi-out, and airborne delay Origin & Connecting Passengers – DOT Bureau of Transportation Statistics, T-100 & Originating Passenger Data Survey Domestic and International Passengers – ACAIS Number of Existing Runways – FAA Airport Master Record data (FAA Form 5010)
22 National Plan of Integrated Airport Systems (2009-2013)

Figure 8 illustrates that the majority of passengers (share greater than 50 percent) at 25 of the OEP airports are entering the system at these airports (“originating passengers”). Ten airports have connecting passenger levels greater than their originating passenger levels, and of those ten, only four (Cincinnati, Charlotte, Memphis, and Atlanta) have more than 65 percent of their passengers connecting to other flights.
Figure 8: Percentage of Connecting Passengers at 35 OEP Airports in 2006
0% 10% 20% 30% 40% 50% 60% 70% 80% 90% 100%
SANTPAFLLLGA
MCOBOSPDXDCABWILASPIT
STLCLESEA
MDWEWRHNLSFOPHLLAXPHXJFKSLCDENIAD
MSPDTW
MIAORDDFW
IAHATL
MEMCVGCLT
Source: DOT Bureau of Transportation Statistics, 2006
Most U.S. airports serve domestic markets, while international passenger service is concentrated at 35 U.S. airports (28 large hubs, four medium hubs, and three small hubs) accounting for 97 percent of international passenger activity. As shown in Figure 9, only 14 airports have international
National Plan of Integrated Airport Systems (2009-2013) 23

enplanements accounting for 10 percent or more of their activity. These airports account for 70 percent of the passengers who boarded international flights in the United States. Ft. Lauderdale and Atlanta increased their international passenger share from eight percent in 2004 to ten percent in 2006.
Figure 9: Airports with 10 Percent or More International Enplanements
0% 10% 20% 30% 40% 50%
ATL
FLL
DTW
PHL
BOS
ORD
IAH
HNL
IAD
SFO
LAX
EWR
JFK
MIA
20062004
Research – Capacity
Through the ACRP, research is being conducted to provide better airport planning and design. Future aviation demand will rely on the ability of airports to accommodate increased aircraft operations, larger aircraft, and more efficient passenger throughput. This capacity research program will prepare for those future needs while simultaneously solving near-term and current airport capacity issues. Alternative Capacity Enhancement Methods
The construction of new runways and runway extensions is not the only response to improve airside capacity and reduce delay. Continued focus on other measures, termed Alternative Capacity Enhancement Measures, can help reduce delay without substantial investment. Airspace/Procedural/Technology
Delays can be reduced, in part, by modifying air traffic control procedures or introducing new technologies to improve the flow of aircraft en route and in the terminal area. Changes in air traffic
24 National Plan of Integrated Airport Systems (2009-2013)

and flight procedures also have an impact on capacity. Agency initiatives to meet long-term demand for aviation are being monitored through the OEP. A description of these initiatives can be found on the OEP website.19 Airspace design changes are being made to fit sectors to the traffic demand, and to establish more effective airspace structures. An example is the Florida Airspace Redesign, implemented in October 2005, which made significant changes to en route and terminal airspace resulting in dozens of new north-south routes and airspace sectors. The redesign has reduced delays, reduced reroutes, and reduced reroute-related air traffic control fees paid to other countries for flights to and from South Florida. The benefit of this airspace optimization totals almost $35 million annually. An airspace redesign for New York, New Jersey, and Philadelphia was concluded in 2007. As a result, airspace routes and procedures will be reconfigured to make them more efficient and less complicated. This redesign will also provide more jet routes with increased and better access, improved use of available runways, fanned headings for departures and parallel arrivals, and more flexibility to manage delays in severe weather. This redesign is anticipated to reduce delays by 200,000 hours annually and save the airlines $248 million per year. The use of procedures like Area Navigation (RNAV) and Required Navigation Performance (RNP) is being expanded. These air traffic procedures result in improved safety, access, capacity, predictability, operational efficiency, and environmental impact. RNAV uses more precise routes for take-offs and landings, and permits flexible point-to-point aircraft operations. For instance, the RNAV procedures implemented in Atlanta in 2005 resulted in projected annual savings of $16 million in airline costs. The 16 new procedures implemented at Dallas-Ft. Worth during the summer of 2007 are projected to produce significant savings as well. There are over 100 RNAV procedures in place throughout the national airspace system. RNP is RNAV with the addition of onboard monitoring and alerting function. This onboard capability enhances the pilot’s situational awareness, providing greater access to airports in challenging terrain. It takes advantage of an airplane’s onboard navigation capability to fly a more precise flight path into an airport, reducing the overall noise footprint and aggregate emissions. Programs to help FAA traffic managers distribute delays equally among the relevant flights and enable FAA to safely meter the rate that traffic arrives at an affected airport or flies through the affected area have been developed and implemented nationwide. Over the next two decades, FAA expects additional enhancements due to advances in technology related to automation information systems, communications, navigation, surveillance, and weather. Much of this work will be conducted under the NextGen initiative. Congestion Management
Congestion management is a broad term that includes a number of administrative measures (e.g., caps or up-gauging of aircraft) or market-based mechanisms (e.g., auctions, congestion pricing) to reduce congestion and delay and allocate constrained capacity. FAA prefers to expand
19 For more information, see http://www.faa.gov/about/office_org/headquarters_offices/ato/publications/oep/
National Plan of Integrated Airport Systems (2009-2013) 25

capacity to meet demand because the aviation industry is a major economic engine, providing support and jobs both for the country as a whole and for local communities. However, there are a handful of airports where demand exceeds capacity in the short term, pending capacity expansions (such as Chicago O’Hare International Airport) or in the long term where capacity expansion is not a practical option (such as New York’s LaGuardia Airport). At these airports, we need to find a way to address congestion and allocate limited space efficiently and fairly. A market-based approach would provide the optimal outcome at constrained airports because it sets the right incentives for efficient use of the system. As discussed above, on July 14, 2008, FAA published a Federal Register Notice of Amendment to policy statement on the Airport Rates and Charges Policy. The Notice allows a congested airport to raise the price of using its runways during congested periods. This, in turn, could provide a financial incentive to aircraft operators to consider alternatives, such as scheduling flights outside of peak demand times, increasing aircraft size to use the congested runways more efficiently or meeting regional air service needs through alternative, less congested facilities. The operator of a congested airport may charge for airfield work under construction and may charge for airfield costs of other airports in its system. An airport meeting the statutory definition of “congested” in Title 49 of the U.S. Code—accounting for one percent of delays at U.S. airports or identified as congested in the FAA’s 2004 Capacity Benchmark Report20—would qualify as congested, as would an airport identified as currently congested or projected to be congested by 2015 as identified in the FAA’s FACT 2 report, Capacity Needs in the National Airspace System, 2007-2025. Finally, the Notice clarifies that airports may use a “two-part” landing fee structure with an operation-based and weight-based element. New York Metro Area
FAA continues to explore congestion management alternatives for New York’s LaGuardia Airport, which at times has accounted for as much as 25 percent of flight delays nationwide, and also at John F. Kennedy International and Newark Liberty Airports. LaGuardia Airport is physically constrained and has had a history of intractable demand and delay. Until relatively recently, FAA managed congestion at LaGuardia and JFK through the High Density Rule (HDR). However, Congress mandated the expiration of the HDR at both airports on January 1, 2007. To prevent the anticipated congestion at LaGuardia after the expiration of the HDR, FAA published a Notice of Proposed Rulemaking (NPRM) on August 29, 2006 that would cap operations and increase airport utilization by encouraging use of larger aircraft. Many of those who commented did not support the NPRM, in particular the proposal to encourage aircraft up-gauging. FAA developed a Supplemental Notice of Proposed Rulemaking (SNPRM) to modify the original proposal to introduce competition by auctioning a limited number of slots to airlines which would lease the slots for a period of up to 10 years. The FAA published the LaGuardia SNPRM on April 16 and anticipates implementation of a Final Rule in the fall of 2008. LaGuardia is operating under a temporary order that maintains an hourly cap on operations until the Final Rule is adopted. Since spring of 2006, JFK has evolved from its traditional international role as U.S. carriers have significantly increased their domestic scheduled operations throughout the day. As a result of the 20 The Capacity Benchmark Report is available online at http://www.faa.gov/about/office_org/headquarters_offices/ato/publications/bench/
26 National Plan of Integrated Airport Systems (2009-2013)

increase in scheduled operations at JFK, demand exceeds the airport’s capacity during some periods of the day. During the first 10 months of fiscal year 2007, the average daily operations at JFK increased 23 percent over the same period in the previous year. Unfortunately, delays also increased. The number of arrival delays exceeding one hour increased by 114 percent. During June and July 2007, JFK’s on-time arrival performance averaged 59 percent. In order to develop a coordinated response to growing delays in the New York area, FAA and DOT formed the New York Aviation Rulemaking Committee (ARC), with representatives from airlines, interest groups, the Port Authority of New York and New Jersey (Port Authority), and the State of New York. The ARC held weekly meetings from September to December 2007 and considered a wide-range of options for reducing delay and managing congestion in the New York region. The ARC had five working groups that evaluated various congestion mitigation approaches, including operational improvements, market-based solutions and administrative measures. Among other things, the ARC identified 77 initiatives to improve the operational efficiency of one or more of the New York airports. Many of these initiatives were identified in collaboration with the Port Authority of New York and New Jersey. We have completed 23 of the 77 recommendations and 10 additional initiatives are tentatively scheduled for completion in FY 2009. The final report of the ARC outlines the benefits and potential drawbacks of all of the solutions that were discussed.21 FAA also held a meeting in October 2007 to ask air carriers to discuss flight schedule reductions during peak operating hours for JFK Airport. As a result of these discussions, FAA issued an order to cap operations at JFK. The order caps operations at an average of 82 to 83 operations per hour. At the same time, about 100 new operations were accommodated throughout the day by shifting operations away from the peak hours. The order also specifies that if any new or returned capacity becomes available, FAA will allocate those slots by auction. The order became effective on March 30, 2008 and will expire on October 24, 2009. With the imposition of a cap on the number of hourly operations at JFK, FAA felt that it was also necessary to cap peak hour operations at Newark. After discussions with the air carriers operating at the airport, FAA issued an order to cap operations at Newark. The order keeps operations at an average of 83 per hour and allows for approximately 30 new operations throughout the day. These additional operations are possible by shifting operations away from peak hours. The order became effective on June 20, 2008 and expires on October 24, 2009. In the Newark order, FAA also said it planned to auction new or returned capacity. On May 21, FAA published a NPRM for Newark and JFK that would maintain the cap on operations and, similar to the LaGuardia SNPRM, introduce competition by auctioning a small percentage of slots. Chicago Metro Area
FAA also continues to monitor congestion and delay at Chicago O’Hare International Airport (O’Hare). On October 13, 2006, the FAA adopted a Final Rule capping flights at O'Hare. The rule is intended to minimize flight delays from persistent over-scheduling at O’Hare while the city of
21 The Final ARC Report can be obtained on the DOT website at http://www.dot.gov/affairs/FinalARCReport.pdf
National Plan of Integrated Airport Systems (2009-2013) 27

Chicago modernizes and expands the airport as part of the O’Hare Modernization Program.22 The city of Chicago has the first phase (one new runway, one runway extension, and one runway relocation) of the O’Hare Modernization Program under construction. FAA’s congestion management rule is set to expire on October 31, 2008, in conjunction with the opening of the first new runway in November 2008. On June 16, 2008, FAA announced it will eliminate the flight caps at O’Hare upon the expiration of the rule in October. The second phase of the airfield reconfiguration is projected to begin after the first phase is completed. Airline Schedules
Passenger demand for air travel rebounded in 2007. However, in 2008, continued high fuel prices and concerns about the economy impacted the growth plans of carriers. Network carriers23 have reduced operating costs and are replacing wide-body and larger narrow-body aircraft with smaller narrow-body and regional jet aircraft. The use of smaller narrow-body aircraft allows the air carrier to better match the number of seats to the number of passengers. In some cases, airlines have also downsized or closed hubs, redirecting capacity to their core or primary hubs. Use of Reliever and Secondary Airports
Redistribution of traffic among airports to make more efficient use of facilities is another measure that can be used to reduce delays. Reliever airports have been identified and improved in metropolitan areas to provide general aviation pilots an attractive alternative to congested commercial service airports. Large metropolitan areas usually have a system of reliever airports, one or more of which can accommodate corporate jet aircraft, with others designed for use by smaller, propeller-driven aircraft. Many former military airfields, with long runways and associated facilities, have been successfully converted to civil aviation use serving as reliever and secondary airports. Relievers have been successful at relocating general aviation activity from congested airports. As a result, general aviation activity at congested airports is a small and decreasing percentage of total operations (one percent of operations at Hartsfield-Jackson Atlanta, Seattle, Ronal Reagan Washington National, and Dallas-Ft. Worth; two percent of operations at John F. Kennedy Airport, Cincinnati, and Denver). Another factor that helps to limit delay is the ability of carriers to introduce service to outlying, suburban airports, using them to relieve congestion at the principal airport. This regional approach is particularly effective in very large cities that are the origin or destination point for many trips by air. Low-cost carriers have begun serving alternative airports in metropolitan areas and providing competition to carriers at the principal airport. Traffic has increased significantly at the alternative airports that attracted low-cost carriers. Examples include Boston (Manchester and Providence); Washington (Baltimore-Washington); San Francisco (Oakland, San Jose, and Sacramento); Miami (Ft. Lauderdale); Chicago (Midway); and Los Angeles (Long Beach, Burbank, Ontario, and Orange County).
22 14CFR Part 93, 71FR 51382-51404 “Congestion and Delay Reduction at Chicago O’Hare International Airport,” August 29, 2006. 23 Network carriers are Alaska Airlines, American Airlines, Continental Airlines, Delta Airlines, Northwest Airlines, United Airlines, and US Airways.
28 National Plan of Integrated Airport Systems (2009-2013)

Safety
The United States has not only the largest and most complex aviation system in the world, but also one of the safest, as demonstrated by the low accident rate (see Figure 10). The airport, as a key component of the aviation system, is an important contributor to the resulting safety record. Although the airport is rarely determined to be a cause of an aircraft accident, it may be cited as a contributing factor that impacts the severity of an accident.
Figure 10: Accident Rates
6.84
0.140.170.210.160.310.240.240.310.290.300.310.270.270.170.180.150.220.200.250.26
6.337.20
6.496.756.696.786.576.50
7.447.197.65
8.219.089.03
8.517.917.857.97
8.65
0
1
2
3
4
5
6
7
8
9
10
1988
1989
1990
1991
1992
1993
1994
1995
1996
1997
1998
1999
2000
2001
2002
2003
2004
2005
2006
2007
Year
Acc
iden
ts P
er 1
00,0
00 F
light
Hou
rs
Large Air CarriersGeneral Aviation
Source: National Transportation Safety Board Aviation Accident Statistics (Tables 5 and 10 available at http://www.ntsb.gov/aviation/Stats.htm).
Call to Action
FAA has made runway safety a focus since 1999 and the aviation community has made great progress over the years in improving runway safety. With the goal of making a safe system even safer, in August 2007 more than 40 representatives from a cross-section of the aviation industry agreed to an ambitious plan focused on solutions in improving cockpit procedures, airport signage and markings, air traffic procedures, and technology. The “call to action” plan committed the group to a list of five short-term actions that could be completed within 60 days. These actions included upgrading runway entrance markings, improved training programs, development of an Air Traffic Controller Aviation Safety Action Program (ASAP) to encourage voluntary reporting, and reviews of surface operations and cockpit procedures. Since then, all of these actions have either been implemented or are on schedule, and the operational reviews have resulted in more than 100 short-term and numerous mid- and long-term initiatives. FAA continues to strive to improve aircraft movement operations on the airport surface and reduce the number of runway incursions through a combination of initiatives including technology, airport improvements, training, and centralized database tools.
National Plan of Integrated Airport Systems (2009-2013) 29

Preventing Runway Incursions24
To operate safely and efficiently, the aviation system relies on communication and coordination among air traffic controllers, pilots, airports and airport vehicle operators. Their actions can cause or avert a runway incursion. From FY 1999 through FY 2007, FAA defined a runway incursion as when an aircraft, vehicle, person, or object on the ground created a collision hazard that resulted in a loss of required separation with an aircraft taking off, intending to take off, landing, or intending to land. That definition changed on October 1, 2007 (FY 2008), when FAA began using the definition for a runway incursion that had been adopted by the International Civil Aviation Organization (ICAO). ICAO defines a runway incursion as any occurrence at an airport involving the incorrect presence of an aircraft, vehicle or person on the protected area of a surface designated for the landing and take-off of aircraft. Each incursion is classified based on the severity of the incident into one of four categories. Category A, the most severe, is where a collision was narrowly avoided and Category D, the least severe is where there was no collision hazard. As a result of the new definition of a runway incursion, some incidents formerly classified as a surface incident25 will now be classified as a runway incursion. Figure 11 shows the number of runway incursions through FY 2007. FY 2008 data will reflect the revised definition and severity categorization. As a result, we anticipate that the number of reported incursions will increase, due to the inclusion of non-conflict events (classified as Category D). FAA has developed a number of initiatives to address runway safety issues.
Figure 11: Number of Runway Incursions by Fiscal Year
329
405 407
339 323 326 327 330370
0
50
100
150
200
250
300
350
400
450
500
1999 2000 2001 2002 2003 2004 2005 2006 2007
Fiscal Year
Incu
rsio
ns
Source: FAA Office of Runway Safety
24 The runway incursion program focuses largely on airports with air traffic control towers. 25 An incident without an aircraft in potential conflict, such as an unauthorized aircraft crossing an empty runway, was defined as a surface incident and not a runway incursion.
30 National Plan of Integrated Airport Systems (2009-2013)
FAA has deployed advanced technologies to address runway incursions and reduce the risks of runway collisions at commercial airports. The Airport Movement Area Safety System (AMASS) surface surveillance system identifies potential collisions of aircraft and vehicles and provides visual and aural warnings to controllers. AMASS alerts allow controllers to intervene and resolve potentially dangerous conflicts. This system has been installed at 34 of the Nation’s major airports. In addition, FAA is deploying a newer ground surveillance system called ASDE-X (Airport Surface Detection Equipment–Model X) to further enhance safety. The ASDE-X is a multi-sensor system that displays highly accurate aircraft position and identification information to the controller under all visibility conditions. ASDE-X capability will be deployed to the 35 busiest airports. Using ASDE-X, a system of Runway Status Lights (RWSL) is also being deployed to reduce the potential for runway incursions. The RWSL system uses automated, surveillance-driven lights that work as an independent, direct warning system to alert pilots intending to depart on or cross a runway that the runway is occupied. The lights are installed at runway/taxiway intersections and at departure points along the runways. Lights illuminate red when it is unsafe to cross or depart a runway, thus serving to decrease the potential for an incursion. Test systems are currently in operation at San Diego International Airport and Dallas/Ft. Worth International Airport (DFW). Los Angeles is expected to install a test system in 2009. DFW has seen a 70 percent reduction in runway incursions since the technology was installed on one of the airport’s seven runways. The FAA is in the final stages of the capital investment decision process to determine the extent of RWSL deployment throughout the nation's airports. In terms of infrastructure improvements, AIP funds are also used to enhance airport safety and support the agency goal for reducing accidents, fatalities and runway incursions. For example, AIP funding is provided to airports to upgrade airfield marking, signs, and lighting and construct perimeter roads to eliminate the need for vehicles to cross runways. AIP funds are also used to move runway and taxiways to enhance safety. FAA’s analysis of runway incursions indicates that many are attributed to pilots who acknowledge “hold short” instructions but then proceed to cross the holding position. To improve the pilot’s situational awareness, FAA developed and adopted a standard for an enhanced taxiway centerline that alerts pilots that they are approaching a holding position. AIP funds are available to airports for the initial installation of this enhancement. To address the need for enhanced taxiway markings, FAA issued a change to Advisory Circular (AC) 150/5340-1J, Standard for Airport Markings, on March 31, 2008. The revised AC establishes the enhanced taxiway markings as standard at all certificated airports. Enhanced taxiway centerline markings are simple to install; they have shown to be effective in the field. AIP funding can be provided for airfield reconfiguration to move runways and taxiways to enhance safety. At many airports, any modifications or improvements to the airfield have to be done within the existing boundaries of the airfield. (In many cases, the reconfiguration also reduces delays and increases capacity.) Projects in Los Angeles and Chicago are highlighted below.
Los Angeles International Airport, the fourth busiest airport in the world in terms of aircraft operations, is relocating and reconstructing runway 7R/25L about 55 feet south of the
National Plan of Integrated Airport Systems (2009-2013) 31

existing centerline. This will allow construction of a new parallel taxiway between the two parallel runways. This reconfiguration is designed to reduce the number and severity of runway incursions. The reconfiguration is scheduled for completion in June 2008.
Another example of an airfield reconfiguration is at the second busiest airport in the world in
terms of aircraft operations, Chicago O’Hare. The O’Hare Modernization Program (OMP) is the city of Chicago’s proposal to realign three existing runways, extend two existing runways, and construct one new runway at O’Hare. This will result in an eight-runway configuration consisting of six parallel east/west runways and two crosswind runways. Overall delays will be reduced by 66 percent, and the annual operational capacity will be increased from 974,000 to 1,194,000 aircraft operations. In addition to its primary capacity benefits, the OMP will conform to applicable FAA airport design standards and safety regulations, including wind coverage, runway separation distances, and runway/taxiway crossings. Through a reduction in the number of runway intersections and specifically designed aircraft taxi procedures, OMP will result in fewer active runway crossings in the middle third of the runway than the current airfield, conforming to suggested best practices.
Improved situational awareness of pilots, air traffic controller and airport personnel are another means to improve runway safety, and three initiatives have been identified. First, to enhance general aviation runway safety education, FAA produced DVDs that highlight safe surface operations and proper communications procedures. A similar DVD for commercial pilots is currently in production. Second, FAA has developed simulated re-creations of actual incursions to enhance air traffic supervisor and controller discussions of serious runway incursions. The third initiative is to have airport managers and fixed-base operators participate in Runway Safety Action Teams to address airport-specific factors (e.g., procedures, environment, and infrastructure) that affect runway safety. Additionally, driving simulators are being explored as a potential component of a comprehensive ground-vehicle operator training program for the overall improvement of runway safety. On March 31, 2008, FAA issued a change to AC 150/5210-20, Ground Vehicle Operations on Airports. The AC strongly recommends initial and recurrent driver training for all persons with access to the movement area. Before this change, only airport employees were required to be trained on a recurring basis. Four hundred airports require recurrent driver training for all with access to the movement area, and 82 more airports plan to adopt this. FAA uses database tools to track and understand operations, analyzing their impact on runway safety. Database tools that support the self-evaluation process at the facility, FAA Air Traffic Service Area, and national levels have been implemented. A centralized repository of safety, aircraft, and airport-related information allows access to gathered information and provides a systems view helpful in analyzing runway incursions and other safety related information.
Airport Certification
Since 1972, FAA has had an airport certification program. This program is contained in Title 14 Code of Federal Regulations, Part 139 “Certification of Airports.” Part 139 establishes 18 areas of safety standards, ranging from specific items, such as the condition of runway surfaces
32 National Plan of Integrated Airport Systems (2009-2013)

and training requirements for aircraft rescue and fire fighting personnel, to more general requirements for the development of an airport emergency plan and a wildlife hazard management plan. While all areas identified in Part 139 are inspected, special inspection initiatives may emphasize one or more aspects of Part 139. A certificated airport may use AIP funding to meet certain requirements under Part 139 certification standards, such as acquiring aircraft rescue and fire fighting equipment. There are approximately 570 public-use airports subject to annual Part 139 safety inspections to determine continued compliance with regulatory safety standards. Prior to 2004, FAA certificated airports were defined as airports having air carrier service for aircraft with a seating capacity of more than 30 passengers. Beginning in 2004, the certification program was expanded to include airports served by air carrier aircraft with a seating capacity of more than nine passengers.26 As a result of these changes, over 40 additional smaller airports are now required to meet FAA’s Part 139 safety standards. AIP funds are being used to help these airports comply with the regulatory requirements of Part 139. These small airports now are required to have airport personnel trained in airport safety standards.
Safety Management System (SMS) Pilot Study
FAA endorses the International Civil Aviation Organization (ICAO) initiative to implement safety management systems (SMS) for airport operators in accordance with recently adopted amendments to Annex 14 of the Convention on International Civil Aviation. An SMS is essentially a quality management approach to controlling risk. It also provides the organizational framework to support a sound safety culture. The SMS provides the airport management with a detailed roadmap for monitoring safety-related processes. Safety management is a collaborative effort between government and airport operators. Systems safety must be infused into the management systems of airport operators if it is to have the desired effect on safety outcomes. FAA is in the process of implementing SMS for certificated airports. In FY 2007, FAA initiated a pilot study to evaluate the implementation of SMS at a small group of airports of varying size and complexity.27 The pilot program will allow airports and FAA to gain experience establishing airport-specific SMS that are tailored for the individual airport. Additionally, this experience will provide SMS best practices and lessons learned that FAA can use as it considers how to incorporate SMS into Part 139. Participants in the pilot program first review existing safety standards to determine if the airport meets the intent of SMS requirements. Then, they develop an SMS implementation plan. In FY 2007, FAA issued AIP grants to pilot study participants to evaluate their current safety system against SMS requirements. The Office of Airport Safety and Standards is working with the participants to ensure that the evaluations are completed in FY 2008.
26 This was done to be consistent with FAA’s “one level of safety” initiative for scheduled commercial passenger flights. 27 A list of participating airports is available online at http://www.faa.gov/airports_airtraffic/airports/airport_safety/safety_management_systems/
National Plan of Integrated Airport Systems (2009-2013) 33

Runway Safety Areas
FAA helps airports maintain safe conditions by developing uniform airport design standards that apply to facilities throughout the system. Airports agree to meet these FAA standards when they accept AIP funds for capital improvements to their facilities. FAA standards address physical layout characteristics such as runway length and width, runway/taxiway/taxilane separation standards, runway safety areas, lighting, signs, and markings. The standards also address material characteristics such as pavement, wiring, and luminance of lights. Standards are also issued for such things as aircraft rescue and firefighting equipment and operations, snow removal equipment and operations, and wildlife hazard management. FAA airport design standards have developed over time and provide the necessary dimensions to accommodate aircraft operations, as well as an extra margin of safety. For example, the standards for runway safety areas (RSA) are designed to minimize damage to aircraft and injuries to occupants when an aircraft unintentionally leaves the runway. The standards provide for graded areas contiguous to the runway edges that are free of ruts, humps, and other surface irregularities. Only objects required to be there because of their function, such as runway lights or signs, can be in the runway safety area. These objects must be mounted so that they break away if struck by an aircraft. The consequences of incidents are less likely to be severe because of the adherence to design standards. However, as aircraft have become larger, faster and more demanding, the RSA dimensions have had to increase. As a result, many runway safety areas at commercial service airports do not meet current FAA standards. FAA is actively working with airport sponsors and local communities to improve, as rapidly as possible, runway safety areas that do not meet standards. This initiative is included in the FAA Flight Plan, 2008-2012. There are over 1,000 commercial service runways at airports nationwide certificated under Part 139. The number of commercial service runways with a full standard RSA has increased from 30 percent in 2000 to 56 percent in 2007. RSAs substantially meeting standards, defined as dimensions that are at least 90 percent of width or distance beyond the runway ends, have increased from 55 percent in 2000 to 74 percent in 2007. FAA maintains a long-range schedule and financial plan for the improvement of most of the remaining high-priority non-standard RSAs. Plans are in place to improve approximately 168 more RSAs to the extent practicable by the year 2015 at an estimated cost of $1.1 billion in Federal AIP funds. Although not all RSAs can be improved to standards because of extremely high costs of the required modifications and other physical constraints, 70 percent will meet full standards and 83 percent will substantially meet standards by 2015. This program will result in a runway system with a significantly improved margin of safety for the aircraft they serve. In 2004, FAA amended the RSA standard to allow the use of Engineered Materials Arresting Systems (EMAS) as an equivalent alternative to a standard RSA in terms of safety enhancement. The currently approved version of EMAS is a bed of highly crushable concrete blocks that are installed at the ends of the runway. When an aircraft leaves the runway traveling at high speed, the landing gear will crush the EMAS bed and the aircraft will come to a quick and safe stop. Figure 12 shows three illustrations of EMAS, one where the use of EMAS at Greenville safely stopped an
34 National Plan of Integrated Airport Systems (2009-2013)

overrun, and EMAS layouts at Boston and Chicago Midway. As of December 2007, 30 EMAS beds have been installed nationwide and many more are planned. EMAS will play an important role in allowing FAA to meet its long-range RSA improvement goals.
Figure 12: Illustration of Engineered Materials Arresting Systems (EMAS)
Research – Safety
Through the ACRP, research is being conducted to prevent and mitigate potential injuries and accidents within the airport operational environment. A fundamental element of this program is to produce results that provide protection of aircraft passengers and airport personnel through improved safety training, airport design, and advanced technology implementation. Environment
Community concern about environmental issues can be a major constraint to capacity expansion at existing airports. It impacts both their operation and expansion. It also makes it difficult to develop new airports. The problem is particularly serious in metropolitan areas. This is because there is high demand for airport services but also a strong pressure to develop residential and other incompatible uses around airports. In addition, airports in large metropolitan areas are frequently located in air quality nonattainment areas. Although historically communities have been concerned about noise levels, there are additional areas of increasing concern: air quality, water purity, and most recently, climate change. Noise
The noise situation around airports has improved dramatically since 1976.28 At that time, an estimated six to seven million people living near airports in the U.S. were exposed to significant levels of aircraft noise.29 In 2005, it was estimated that approximately 500,000 people in the United States lived in areas adjacent to airports with noise levels above 65dB DNL. This translates into a 93 percent reduction in the number of people exposed to significant levels of aircraft noise
28 In 1976, the Department of Transportation published its Aviation Noise Abatement Policy, which provided a course of action for reducing aviation noise impact. The principles contained in that document and subsequent legislative and regulatory action have resulted in a dramatic reduction in the number of Americans adversely exposed to aviation noise. An excerpt from that policy is available online at http://www.faa.gov/about/office_org/headquarters_offices/aep/planning_toolkit/29 A significant level of noise is defined by the Federal government as a Yearly Day-Night Average Sound Level (DNL) of 65 decibels (dB) or higher.
National Plan of Integrated Airport Systems (2009-2013) 35

since 1976. The phase-out of commercial aircraft that used older and louder engines (i.e., Stage 1 and Stage 2 aircraft) was completed in 1999 and helped to greatly reduce the number of people in 65dB DNL areas. The more modern Stage 3 aircraft with high bypass engines have lower noise emissions. It is anticipated there will be continued noise reduction as the fleet is modernized. On July 5, 2005, FAA published a Final Rule on a new noise standard for subsonic jet airplanes and subsonic transport category large airplanes. This new noise standard, Stage 4, ensures that the latest available noise reduction technology is incorporated into new aircraft designs. Research continues on quieter aircraft technology. FAA’s Part 150 program,30 established under the Aviation Safety and Noise Abatement Act of 1979 (re-codified at 49 U.S.C. 47501 et. seq.), helps airport operators develop comprehensive noise and land use compatibility programs. These programs identify noise mitigation projects and procedures to reduce aviation noise in the community and achieve more compatible land uses in areas surrounding the airport. Part 150 is a voluntary program encouraging airport operators to develop Noise Exposure Maps (NEM) and Noise Compatibility Programs (NCP). NEMs identify noise contours and land use incompatibilities. The airport operator uses NEMs to evaluate current noise impacts and to discourage future incompatible development. FAA determines whether the airport operator has prepared NEMs in accordance with Part 150. After active and direct participation of affected parties, the airport operator can then submit an NCP outlining mitigation measures to improve noise and land use compatibility. As of year-end 2007, there are 271 airports participating in the Part 150 program, and 238 had NCPs approved by FAA. Besides these first-time NCP approvals, FAA has approved 89 updates to these programs. An FAA-approved NCP clears the way for an airport to obtain Federal aid for noise mitigation projects.31 Since 1982, 252 airports have received grants for Part 150 studies and nearly $5 billion has been granted for airport noise compatibility projects. Besides AIP funding, airports have collected and used passenger facility charges for noise studies and mitigation totaling nearly $12 million and $3 billion, respectively. Over the past 35 years, considerable effort has been expended to provide relief to noise-impacted areas by funding noise compatibility projects under the AIP. Noise compatibility projects include residential and public building sound insulation, land acquisition, and relocating residents from significantly noise impacted areas. Airports have acquired noise monitoring equipment and installed noise barriers to reduce ground run-up noise. A few airports have even constructed taxiways and runways when the relocation of the pavement was shown to provide a significant noise relief. A few years ago, FAA evaluated the AIP noise set-aside program and developed a performance measure. The intent was to reduce the residential population exposed to high levels (DNL 65dB or greater) of aircraft noise by 62,500 (expected population) over a 5-year period, FY 2003 to FY 2007. During the first 2 years, AIP noise grants benefited 30,000 residents.
30 14 Code of Federal Regulation Part 150 “Airport Noise Compatibility Planning.” 31 Certain noise projects to benefit schools and medical facilities and mitigation in an approved Final Environmental Impact Statement can be Federally funded without an approved NCP.
36 National Plan of Integrated Airport Systems (2009-2013)

In FY 2005, FAA adjusted the methodology to include both student population and residential population exposed to high noise levels and began tracking this revised performance measure in FY 2006. FAA now intends to reduce residential and student population exposed to aircraft noise at DNL 65dB by 100,000 over a new 5-year period, FY 2006 to FY 2010. In the first year this information was tracked, FY 2005, AIP noise grants benefited 25,319 residents and students. In FY 2006, AIP noise grants benefited 22,000 residents and students and in FY 2007 18,617 residents and students benefited. Figure 13 shows the cumulative benefit of residents (FY 2003 and FY 2004) and residents and students (FY 2005 through FY 2010). Residents’ benefits are tracked if they have either had their homes insulated or been relocated from the areas of significant airport noise. Students’ benefits are tracked when the airport has completed noise insulation of schools or school relocation.
Figure 13: Population Expected to Benefit from Noise Funding Fiscal Year 2003 through 2010
0
20,000
40,000
60,000
80,000
100,000
2003 2003-04 2005 2006-07 2006-08 2006-09 2006-10
Fiscal Year
Cum
ulat
ive
Pop
ulat
ion
Bene
fit ActualGoal
Air Quality
Many of the Nation’s airports are located in air quality non-attainment or maintenance areas. Air quality improvements in these areas are accomplished through State Implementation Plans (SIPs), which provide controls and measures to meet health-based National Ambient Air Quality Standards under the Clean Air Act. FAA provides financial aid support for required airport mitigation through the AIP and PFC Program. FAA encourages early airport actions to reduce local emissions through the Voluntary Airport Low Emission (VALE) Program. The goal of the VALE Program is to reduce air pollutants caused by ground transportation sources at commercial service airports. It is designed to provide airport sponsors with financial and regulatory incentives to stimulate early investment in proven low-emission airport technologies, including alternative fuel vehicles and low-emission infrastructure. The VALE Program was established in FY 2005, and approximately $6.6 million in AIP funds has been invested in VALE projects.
National Plan of Integrated Airport Systems (2009-2013) 37

In addition, FAA is developing enhanced arrival capabilities that that will decrease fuel consumption, thereby reducing cost and emissions. As an example, an Optimized Profile Descent (OPD) or Continuous Descent Arrival (CDA) is an environmentally-friendly aircraft arrival procedure aimed at improving operations while reducing fuel consumption, engine emissions, and noise. To comply with these new procedures, aircraft descend from an en route altitude with minimum thrust, avoiding the inefficiencies of level flight at low altitudes to the extent permitted by the safe operation of the aircraft, and in compliance with published procedures and air traffic control instructions. FAA and UPS have been operating CDA at Louisville for some time. Demonstrations were conducted in May at the Atlanta Hartsfield-Jackson International Airport (ATL) with airline leadership provided by Delta Airlines, and at Miami International Airport (MIA) with airline leadership provided by American Airlines. Results of the Atlanta and Miami demonstrations will be used by FAA and European officials to determine the benefits of implementing CDA procedures at more airports throughout the U.S.
Water Quality
Many of the Nation’s airports are located near waterways. This is because when airports were originally built, the best available land suitable for an airport was located near water. Today, many airport activities can cause adverse water quality impacts. In particular, airport construction activities and seasonal airport anti-icing/deicing operations are a major concern. Biological and chemical breakdown of deicing chemicals in airport runoff can cause severe dissolved oxygen demands on receiving waters. Airport construction activities often cause sediment-laden runoff to enter waterways. For years, FAA has worked with the Environmental Protection Agency (EPA), airport operators, airlines, and industry groups to address water quality issues. FAA is a member of steering committees reviewing proposed experiments that will examine the effects of glycol-based deicing agents on fish living at various water temperatures. In addition, FAA reviews proposed airport projects under the National Environmental Policy Act and the Clean Water Act to minimize airport-related construction and operational effects on water quality. FAA works with airport sponsors and airlines in the search for alternatives to glycol-based aircraft deicing chemicals. Furthermore, FAA has encouraged airport sponsors to use acetate-based chemicals to treat runways, ramps, and taxiways because those chemicals place lower oxygen demands on receiving waters. FAA will remain active in the search for ways to reduce aviation’s effects on water quality. Environmental Streamlining
FAA addresses airport-related impacts on noise, air, and other environmental concerns. To do so, it complies with many Federal laws, executive orders, and regulations. Among these are Congressional and Presidential directives addressing FAA’s environmental review of certain airport projects. Title III of Vision 100 directs FAA to streamline (i.e., improve efficiency and effectiveness) its environmental review of capacity projects at specific major airports.32 Title III also requires FAA to conduct streamlined environmental reviews for Administrator-designated safety or security projects at any airport. 32 Airports listed in Table 1 of FAA’s 2001 Airport Capacity Benchmark Report.
38 National Plan of Integrated Airport Systems (2009-2013)

Further, FAA streamlines its environmental review of any airport project designated by the Secretary of Transportation for “expedited processing” under Executive Order 13274, Environmental Stewardship and Transportation Infrastructure Project Review. Implementation of both the Executive Order and Vision 100, require FAA to work more efficiently and effectively to identify and resolve concerns that various Federal agencies have about environmental impacts resulting from aviation development. As a result, FAA indentified and resolved several diverse environmental issues for three complex airport projects in an expedited manner. The three environmental projects were: a runway extension at Philadelphia International Airport which was completed ahead of schedule and under budget; reconfiguration of Los Angeles International Airport which resolved issues quicker and avoided delaying the project; and approval of a new replacement airport for St. George, UT which resolved differences of opinion between agencies quicker and avoided delaying the project. The Order also helped FAA, working with other agencies, to develop ways to promote environmental stewardship.
Airport Sustainability Efforts
FAA has joined forces with other aviation entities to determine how the aviation industry can conduct its activities in ways that will sustain (i.e., support) our environment. FAA’s airport sustainability efforts include:
The FAA liaison, through the Airports Cooperative Research Program (ACRP) Task Force, is responsible for publishing a synthesis report addressing airport operator environmental sustainability efforts throughout the United States.
FAA administers the VALE Program (described in the Air Quality Section above).
FAA developed an Advisory Circular and Program Guidance Letter to aid sponsors of
large or medium hub airports in requesting funding from the AIP to develop Environmental Management Systems (EMS) for U.S. airports. An EMS takes a systematic approach to identify goals, determine progress in implementing and then completing those goals, and change airport operations to ensure continual environmental improvement.
FAA has also updated its environmental guidance to ensure it reflects the most current
environmental laws, regulations, and Executive and Departmental orders that govern FAA actions and its approvals of actions by others.
Environmental Research
Through the ACRP, research is being conducted to examine the impact an airport has on the surrounding environment and to advance the science and technology necessary for creating an environmentally friendly airport system. Areas of focus include the study of airport-related hazardous air pollutants, the impact of airports on climate change, alternative aviation fuels, and advanced noise and emissions models. Since 2005, approximately $5 million has been allocated towards 16 environmental research projects. There is a proposal to increase the amount of funding for ACRP for fiscal year 2009 by $5 million, which would be used to undertake environmental research.
National Plan of Integrated Airport Systems (2009-2013) 39

Runway Pavement Condition
Airfield pavement needs regular maintenance to seal cracks and repair damage; major rehabilitation is needed on a 15 to 20-year cycle to remedy the effects of age, use, and exposure. If pavement maintenance is neglected, severe deterioration can cause damage to aircraft propellers, turbine engines, and landing gear and can lead to higher costs for rehabilitation. As part of airport inspections, FAA updates the Airport Master Records for public-use airports and reports the results through the Airport Safety Data Program. Runway pavement condition is classified as excellent (no visible deterioration), good (all cracks and joints sealed), fair (mild surface cracking, unsealed joints, some slab edge spalling), poor (large open cracks, slab surface and edge spalling, vegetation growing through cracks and joints), or failed (widespread, severe cracking with raveling and deterioration). For the purposes of this report, the excellent and good categories are combined into a good category and the poor and failed categories are combined into a poor category. FAA’s performance goal is to ensure that not less than 93 percent of runways at airports in the NPIAS are maintained in good or fair condition. Data for 2007 indicate that 97 percent of runways at NPIAS airports are rated good or fair (79 percent rated good, 18 percent rated fair) and three percent are rated poor. Pavement at commercial service airports is better, with 98 percent of the runways rated good or fair (80 percent good and 18 percent fair) and two percent rated poor. Figure 14 shows the percentage of runways reported in good, fair, and poor condition at NPIAS and commercial service airports over the last 20 years.
Figure 14: Runway Pavement Condition (2007)33
All NPIAS Airports
0
20
40
60
80
100
1986 1990 1993 1997 2000 2003 2005 2007
Poor Fair Good
Commercial Service Airports
0
20
40
60
80
100
1986 1990 1993 1997 2000 2003 2005 2007
Poor Fair Good
The pavement condition of the interstate highway system, which is comparable to the commercial service airports, was rated 77 percent good, 21 percent acceptable (fair), and two percent less than acceptable (poor) in FY 2005. The pavement condition of the national highway system, which is comparable to the NPIAS airports, was rated 67 percent good, 30 percent acceptable (fair), and three percent less than acceptable (poor) in fiscal year 2005. The favorable report on pavement condition at airports and the highway system is indicative of the focused Federal interest in these
33 Runway pavement condition data was not available for NPIAS airports in 1986.
40 National Plan of Integrated Airport Systems (2009-2013)
transportation systems. It is also a credit to the thousands of State and local agencies that operate and monitor airports and highways. In an effort to ensure that pavement receives the optimum level of maintenance, FAA has been authorized by Congress to permit the use of AIP grants for routine pavement maintenance at non-hub airports. In order for an eligible sponsor to receive an AIP grant for pavement maintenance, the sponsor must be unable to fund maintenance with its own resources and must implement an effective pavement maintenance management program. Pavement Research
Research has been integral to FAA’s ability to achieve performance goals for runway pavement condition. Several concentrated pavement-related research programs help address the continued need to improve FAA airport design, construction, and maintenance standards. The majority of pavement research is conducted at FAA’s William J. Hughes Technical Center (Tech Center) in Atlantic City. The Tech Center houses the National Airport Pavement Test Facility (NAPTF), a 1,200-foot building with 900 feet of full-scale airport test pavement. The NAPTF allows FAA and industry to validate new design standards for existing and proposed multiple wheel landing gear configurations. In FY 2007, FAA released draft versions of a new Advisory Circular 150/5320-6E and advance pavement design software that develops state-of-the-art airfield pavement design standards using results from full-scale testing programs and other industry research.34 Two independent airfield pavement research foundations funded through FAA’s appropriations contribute to airfield pavement knowledge through applied research. The Innovative Pavement Research Foundation (IPRF) (www.iprf.org) is focused primarily on improving rigid concrete airfield pavement performance and was funded at $2 million per year in FY 2001 through FY 2006. The Airfield Asphalt Pavement Technology Program (AAPTP) (www.aaptp.us) focuses on improving the quality of hot mix asphalt pavements and was funded at $2 million per year in FY 2004 through FY 2006. Additionally, a mandated program for research related to lithium technologies for Alkali-Silica Reactivity (ASR) in concrete pavements was funded at $1 million per year in FY 2003 through FY 2006. For efficiency, the lithium technology research is administered by the IRPF program. A total of 20 AAPTP/FAA projects have been identified and funded since 2004. Funding for these independent research programs was not provided in FY 2007 and FY 2008. Completed projects have contributed directly to improvements in FAA guidance. Other research is conducted through FAA funded Centers of Excellence located throughout the United States (www.coe.faa.gov).
34 The final AC and design programs are available on-line at http://www.faa.gov/airports_airtraffic/airports/
National Plan of Integrated Airport Systems (2009-2013) 41

Figure 15: Illustration of the National Airport Pavement Test Facility
Surface Accessibility
Airports generally are located to make air transportation as convenient and accessible as possible. The 2000 Census, extrapolated to 2007, reveals that most Americans reside within 20 miles of a NPIAS airport (see Table 5). Commercial service airports are within 20 miles of 66 percent of the population (78 percent when reliever airports are included). When general aviation airports are also included, 98 percent of the population lives within 20 miles of a NPIAS airport. Of the current total U.S. population of 302 million people, all but 5.4 million live within 20 miles of a NPIAS airport.
Table 5: Population within 20 Miles of a NPIAS Airport Airport Categories Percentage of U.S. Population
Commercial Service Airports 66% Commercial Service and Relievers 78%
All NPIAS Airports 98% Geographic proximity alone does not ensure that airports are easily accessible. Highway congestion in metropolitan areas can seriously impede ground access. Many airports are considering expanded use of public transportation to improve the convenience and reliability of airport surface access and to enhance air quality. Typically, public transportation to an airport consists of buses, rail, and shared-ride vans.
42 National Plan of Integrated Airport Systems (2009-2013)

Statistics for major airports in the United States indicate an important, but limited, role of public transportation in airport access. Data collected in 200735 indicates that 35 percent of commercial service airports are served by another scheduled public transportation mode, predominately transit bus (city-wide or metropolitan area buses). Nationwide, air and rail are linked at 23 busy airports, including five airports served by more than one rail mode. Table 6 provides a list of these U.S. airports and the type of rail mode. In addition, light rail is under construction to the Seattle-Tacoma International Airport and will be completed in 2009. A recent study36 shows that San Francisco International Airport has the highest public transportation ground access market share (23 percent) in the United States followed by New York Kennedy International Airport (19 percent). Ronald Regan Washington National Airport has the highest rail utilization in the United States (14 percent). Figure 16 illustrates the market share that rail and bus service provide to some of the busiest airports in the United States.
Table 6: Airports Served by Rail Ronald Reagan Washington National Heavy Rail
Chicago Midway Heavy Rail Atlanta-Jackson Hartsfield Heavy Rail
Boston Logan Heavy Rail Chicago O’Hare Commuter and Heavy Rail
St. Louis Lambert Light Rail Cleveland Heavy Rail
Los Angeles Light Rail Baltimore-Washington Intercity, Commuter & Light Rail
Philadelphia Commuter Rail Portland Light Rail
New York Newark Intercity and Commuter New York JFK Heavy Rail
Burbank-Glendale-Pasadena Intercity and Commuter Rail Miami Commuter Rail
Minneapolis-St. Paul Light Rail Milwaukee Mitchell Intercity (Amtrak)
San Francisco Heavy Rail Oakland Intercity and Heavy Rail
Anchorage Intercity (Amtrak) Dallas-Ft. Worth Commuter Rail Ft. Lauderdale Commuter Rail
South Bend Commuter Rail Note: Some direct rail connections to the airport require a bus, people mover or other connections to connect to the airport.
35 Bureau of Transportation Statistics, U.S. Department of Transportation, Special Report, “Making Connections: Intermodal Links in the Public Transportation System,” September 2007. 36 ACRP Report 4, “Ground Access to Major Airports by Public Transportation.”
National Plan of Integrated Airport Systems (2009-2013) 43

Experience to date suggests that with prevailing socio-economic conditions, public transportation (bus, rail, shared-ride vans) usually will not attract more than 25 percent of ground access trips to major airports. However, any future change in the supply and price of energy or in environmental policy should be closely monitored for impacts on how passengers and employees access airports. The same appears to be true in other countries, where cities are compact and high public transportation market shares are achieved only by airport linkages to extensive national rail systems that connect to cities beyond the metropolitan area served by the airport or where public transit serves airports isolated from the community.
In encouraging appropriate solutions to ground access problems, the Department of Transportation advocates a multimodal approach that is the most efficient and convenient to the public. In keeping with this, FAA encourages airport sponsors to be involved in the planning of airport access projects. FAA also encourages airport sponsors to plan airports in a manner consistent with ground access projects. As part of that multimodal approach, FAA has developed the first document in a series that highlights best practices in planning surface access. 37 The document offers recommendations on fostering effective coordination between aviation planning and metropolitan planning, and between airports and highway agencies/transit providers. Additionally, the FAA developed an intermodal training plan for its airport financial and planning staff in 2008. The plan uses courses available from the National Highway Institute and the National Transit Institute to improve FAA understanding of surface transportation planning, programming and design. FAA will continue to work with other DOT modes (Federal Highway Administration and Federal Transit Administration), as well as state and local agencies to address ground access issues at major airports.
37 FAA document entitled: Bulletin #1: Best Practices – Surface Access to Airports, issued September 2006. Available at: http://www.faa.gov/airports_airtraffic/airports/resources/publications/reports/#other
44 National Plan of Integrated Airport Systems (2009-2013)

Figure 16: Airports with Rail and Bus Access Having More Than a Five-Percent Market Share
0% 5% 10% 15% 20% 25%
DFWSt. Louis
ClevelandPhiladelphia
TampaDulles
LaGuardiaPhoenix
San DiegoIndianapolis
MidwayPortlandOrlandoSeattle
BWI O'Hare
Las VegasLos Angeles
NewarkAtlantaDenver
OaklandNew Orleans
ReaganBoston
JFKSan Francisco
Percentage of Market Share
RailBus/Van
Source: ACRP Report 4, Figures S-2 and S-3
Financial Performance
An understanding of airport finance is essential to the formulation of a national aviation funding policy. Because NPIAS airports are owned and operated by thousands of State and local agencies, it is difficult to compile comprehensive data on the financial operations of all 3,356 airports. However, FAA requires commercial service airports, typically about 500 of the NPIAS airports, to report financial data annually, including revenue and expense information. Since the remaining 2,800 NPIAS airports are not required to report financial information there is limited financial data available for general aviation airports.
National Plan of Integrated Airport Systems (2009-2013) 45

Data reported to FAA by 510 commercial service airports on FAA Form 5100-127, “Operating and Financial Summary” for fiscal years ending in 2006 are used to evaluate the financial performance of the airports. The statistics presented in Table 7 were derived from these data. There is considerable variation in revenue sources and expenditures among airports, as shown in Table 7. For example, concessions, rental car, and parking revenues are 23 percent of total revenues for large hub airports, 29 percent of revenues for medium hub airports, 25 percent for small hub airports, and 11 percent for nonhub primary and nonprimary commercial service airports. Total airport revenues for 510 commercial service airports were reported to be $20.1 billion in 2006, with the 30 large hub airports accounting for 62 percent of total airport revenues. As seen in Figure 17, airport operating revenue (aeronautical and non-aeronautical) totaled $13.6 billion (68 percent) and non-operating revenue (interest, grants, passenger facility fees) totaled $6.5 billion (32 percent). The revenue from landing fees, rent from terminal and hangars and fuel sales (shown as aeronautical operating revenue) accounted for $7.2 billion or 36 percent. The fees from parking and rental car operations, concessions, and retail operations (non-aeronautical operating) accounted for $6.4 billion or 32 percent.
Figure 17: Distribution of Airport Revenues
Aeronautical Operating Revenue
36%Passenger Facility
Charges12%
Grant Receipts13%Interest
5%
Other Non-Operating Revenue
2%
Non-Aeronautical Operating Revenue
32%
Non-Operating Revenue: 32%
46 National Plan of Integrated Airport Systems (2009-2013)

Table 7: Airport Operating and Financial Summary 2006 ($ millions) 30 38 69 373 510
Category Large Hub
Medium Hub
Small Hub
Nonhub Total
Operating Revenue Aeronautical Operating Revenue Landing Fees $1,932 $523 $146 $62 $2,663 Terminal Rents $2,339 $555 $197 $68 $3,159 Cargo and Hangar Rentals $252 $79 $51 $50 $432 Fixed Base Operator Revenue $33 $36 $23 $32 $124 Apron Charges/Tie Downs $52 $39 $20 $9 $120 Fuel Sales and Taxes $132 $60 $28 $66 $286 Other Aeronautical Fees $269 $61 $32 $35 $397 Total Aeronautical Operating Revenue $5,009 $1,353 $497 $322 $7,181 Non-Aeronautical Operating Revenue Parking and Rental Car $2,296 $1,057 $440 $153 $3,946 Concessions $593 $115 $43 $16 $767 Terminal Rents $347 $70 $23 $4 $444 Land Rental and Non-Terminal $302 $78 $91 $91 $562 Other Non-Aeronautical Fees $548 $85 $41 $30 $704 Total Non-Aeronautical Operating Revenue $4,086 $1,405 $638 $294 $6,423 Non-Operating Revenue Passenger Facility Charges $1,748 $478 $180 $64 $2,470 Grant Receipts $856 $544 $473 $718 $2,591 Interest $667 $191 $67 $32 $957 Other Non-Operating Revenue $164 $124 $60 $95 $443 Total Non-Operating Revenue $3,435 $1,337 $780 $909 $6,461 TOTAL REVENUE $12,530 $4,095 $1,915 $1,525 $20,065 Operating Expenses Personnel Compensation and Benefits $2,107 $682 $365 $299 $3,453 Contractual Services $1,559 $557 $170 $103 $2,389 Communications and Utilities $594 $164 $85 $63 $906 Supplies and Materials $472 $70 $49 $46 $637 Repairs and Maintenance $497 $110 $55 $48 $710 Insurance, Claims, and Settlements $150 $43 $26 $27 $246 Other $516 $174 $50 $67 $807 Total Operating Expenses $5,895 $1,800 $800 $653 $9,148 Non-Operating Expenses Interest Expense $2,145 $495 $151 $45 $2,836 Other $89 $131 $29 $68 $317 Total Non-Operating Expenses $2,234 $626 $180 $113 $3,153 TOTAL EXPENSES $8,129 $2,426 $980 $766 $12,301 Depreciation $2,480 $881 $439 $402 $4,202 NET INCOME $1,921 $788 $496 $357 $3,562 Other Information: Bond Proceeds $3,180 $1,369 $46 $44 $4,639 Sale of Property, Contributed Capital, Other $849 $600 $251 $317 $2,017 Reporting Year Debt Payments $2,757 $762 $249 $163 $3,931 Indebtedness at End of Year $49,759 $11,467 $3,156 $991 $65,373 Net Assets $25,466 $11,976 $6,715 $5,206 $49,363 Restricted Financial Assets $18,490 $5,054 $1,230 $746 $25,520 Unrestricted Financial Assets Including Cash $13,545 $7,158 $2,613 $2,375 $25,691
Source: Data collected by FAA on FAA Form 5100-127 (Operating and Financial Summary) for fiscal years ending in 2006. Due to rounding the numbers may not add exactly.
National Plan of Integrated Airport Systems (2009-2013) 47
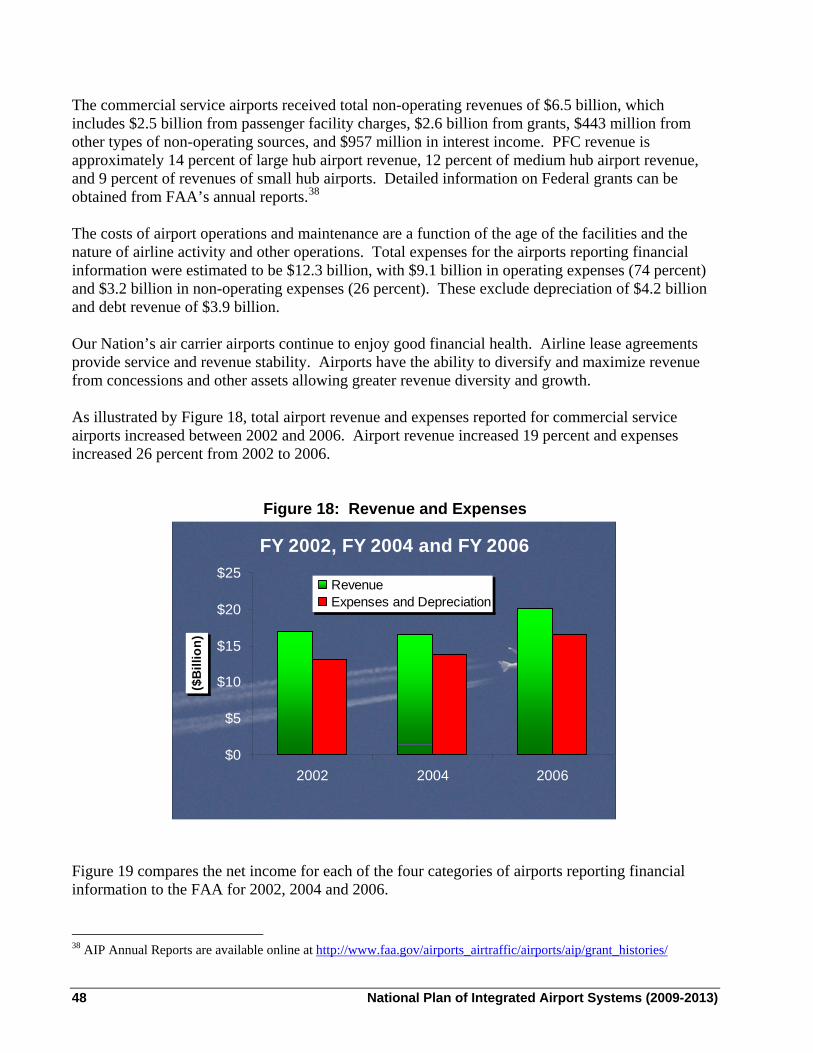
The commercial service airports received total non-operating revenues of $6.5 billion, which includes $2.5 billion from passenger facility charges, $2.6 billion from grants, $443 million from other types of non-operating sources, and $957 million in interest income. PFC revenue is approximately 14 percent of large hub airport revenue, 12 percent of medium hub airport revenue, and 9 percent of revenues of small hub airports. Detailed information on Federal grants can be obtained from FAA’s annual reports.38 The costs of airport operations and maintenance are a function of the age of the facilities and the nature of airline activity and other operations. Total expenses for the airports reporting financial information were estimated to be $12.3 billion, with $9.1 billion in operating expenses (74 percent) and $3.2 billion in non-operating expenses (26 percent). These exclude depreciation of $4.2 billion and debt revenue of $3.9 billion. Our Nation’s air carrier airports continue to enjoy good financial health. Airline lease agreements provide service and revenue stability. Airports have the ability to diversify and maximize revenue from concessions and other assets allowing greater revenue diversity and growth. As illustrated by Figure 18, total airport revenue and expenses reported for commercial service airports increased between 2002 and 2006. Airport revenue increased 19 percent and expenses increased 26 percent from 2002 to 2006.
Figure 18: Revenue and Expenses
FY 2002, FY 2004 and FY 2006
$0
$5
$10
$15
$20
$25
2002 2004 2006
($B
illio
n)
RevenueExpenses and Depreciation
Figure 19 compares the net income for each of the four categories of airports reporting financial information to the FAA for 2002, 2004 and 2006. 38 AIP Annual Reports are available online at http://www.faa.gov/airports_airtraffic/airports/aip/grant_histories/
48 National Plan of Integrated Airport Systems (2009-2013)

Figure 19: Net Income by Year and Hub Type
0
500
1,000
1,500
2,000
2,500
3,000
Large Hub Medium Hub Small Hub Nonhub
$ M
illio
ns200220042006
Commercial service airports have several sources to fund airport development projects, including Federal/state/local grants, bond proceeds, passenger facility charges, airport-generated funds (landing and terminal fees, parking and concessions revenues) and tenant and third-party financing. A majority of the development projects at major U.S. airports are funded through the capital markets, most commonly through airport revenue bonds. Bond ratings range from A at the low end to AA at the high end. Airports with more economic and financial strength and diversity tend to achieve higher ratings while smaller airports tend to be rated lower. Capital markets evaluate the creditworthiness of an airport based on several factors. These factors include the demand for air service in the region, the type of passenger demand (originating versus transferring), the number of commercial airports in the region, and the quantity and quality of service provided by the airlines. Credit quality has been stable in recent years as passenger traffic recovered from the steep declines of 2001 and 2002. Large and medium hubs typically have had excellent credit ratings and often borrow funds to accomplish some portion of needed development. However, these airports may face constraints, such as restrictions in use agreements, bond documents, and local ordinances, which can limit access to external debt financing. The pressure to remain cost competitive with other airports may limit the amount of borrowing an airport elects to undertake with revenue bonds. Nonhub primary and nonprimary commercial service airports have limited incomes and generally do not have adequate operating surpluses to repay borrowed funds. As a result, small airports tend to rely heavily on grants to finance capital improvements.
National Plan of Integrated Airport Systems (2009-2013) 49

This page intentionally left blank.
50 National Plan of Integrated Airport Systems (2009-2013)

Chapter 3: Activity Forecasts OVERVIEW
Increased demand for air transportation will affect the future pattern of capital investment in airports. Continued growth will lead communities to examine and undertake projects to expand their airport facilities. ACTIVITY FORECASTS 39
Despite the impacts of 9/11 and its aftermath, heightened concerns about pandemics, the bankruptcy of four network carriers, and record high fuel prices, the number of passengers that travel by air grew in 2007, demonstrating the value of air transportation to the public. In early 2008, fuel prices increased substantially, increasing the cost of producing airline services and airfares, and impacting the demand for airline services. It is too early to assess the full impacts on the industry, but if fuel prices remain high for an extended period, these effects could be significant. For the first time since the 1990s, the industry enjoyed profitability as rising load factors coupled with fare increases offset the impact from rising fuel prices. Despite continued high fuel prices, the turnaround in airline industry finances continued, with the industry posting a $5.8 billion net profit in 2007, the first since 2000. Both Delta and Northwest emerged from bankruptcy protection, after losing $3.2 billion in 2006; network carriers recorded their first annual net profit since 2000, earning $4.4 billion. However, the continued high fuel prices and concerns about the economy are impacting the growth plans of carriers as carriers have deferred deliveries of new aircraft and trimmed growth plans in order to sustain profitability. Vigorous competition is spurring carriers to continue to cut costs and prices in an increasing number of markets. FAA’s forecasts through 2025 are based on assumptions of continued economic growth, with the U.S. economy expected to grow at a moderate rate of between 2.5 and 3.0 percent and the worldwide economy projected to grow at a rate of 3.2 percent annually. Latin America and the Asia/Pacific region will continue to have the world’s highest economic growth rates, at 4.1 percent per year. In Asia, China’s economy is forecast to expand by 7.3 percent per year, becoming the world’s second largest economy. India’s economy is projected to grow at an average rate of 6.8 percent per year. Domestic U.S. commercial enplanements (sum of air carriers and regionals/commuters) are forecast to increase at an average annual rate of 2.9 percent through 2025, and international enplanements are forecast to increase by 4.8 percent, for a system average annual growth rate of 3.0 percent. Air carrier and regional/commuter aircraft operations are forecast to grow at 2.2 percent and 2.7 percent annually, respectively (see Table 8). The future of regional carriers is closely tied to the fortunes of larger network carriers for which they provide feeder service at major air carrier airports. New
39 Source: FAA Aerospace Forecasts, FY 2008-2025, issued in March 2008. http://www.faa.gov/data_statistics/aviation/aerospace_forecasts/2008-2025/
National Plan of Integrated Airport Systems (2009-2013) 51

general aviation aircraft and avionics are expected to stimulate growth in the general aviation fleet and activity. General aviation operations are forecast to increase 1.9 percent per year.40
Table 8: U.S. Aviation Activity Forecasts Aviation Activity FY 2007 FY 2025 Annual
Growth Enplanements (millions) Domestic 689.4 1,118.2 2.7% International 75.3 174.7 4.8%
Atlantic 24.1 54.1 4.6% Latin America 37.6 83.4 4.5% Pacific 13.6 37.2 5.7%
Total 764.7 1,292.9 3.1% Aircraft Operations (millions) Air Carrier 13.6 20.6 2.3% Commuter/Air Taxi 11.7 18.8 2.7% General Aviation 33.1 41.9 1.3% Military 2.7 2.7 0.0% Total 61.1 84.0 1.8%
Source: FAA Aviation Forecasts FY 2008 to FY 2025 IMPLICATIONS OF FORECASTS
The anticipated 69 percent increase in passengers over the 18-year period between 2007 and 2025 is expected to result from a 56 percent increase in air carrier and commuter operations. Over the next 18 years, system capacity is projected to increase an average of 4.1 percent per year. FAA anticipates that passenger trip length will continue to increase, reflecting the growth in longer international and domestic trips resulting from increased point-to-point service. Between 2007 and 2025, the average domestic aircraft size will have decreased by 1.7 seats. This decline in aircraft size will occur as network carriers continue to reconfigure their domestic fleets and low-cost carriers with relatively smaller aircraft sizes are reigning in their growth. While demand for 70-90 seat aircraft continues to increase, FAA expects the number of 50 seat regional jets to decrease, increasing the average regional aircraft size in 2008 by 0.9 seats to 50.5 seats per mile. The rise in passenger demand along with the shift in activity from larger aircraft to smaller regional jets has already contributed to increased delays at some U.S. airports during 2007. In addition, aircraft utilization is expected to continue to increase as more carriers seek to make more intensive use of costly capital equipment. Load factors are also expected to remain at historical high levels with moderate growth over the forecast period. The implication is that the increase in air carrier aircraft operations will vary, depending on activity levels at individual airports. The growth will present little problem for most low-activity airports that have unused runway capacity. The increase in air carrier operations at medium hubs will be addressed by scheduling more flights for
40 Forecast operations include activities at Federal Contract Towers.
52 National Plan of Integrated Airport Systems (2009-2013)
off-peak periods, accommodating a portion of general aviation activity at reliever airports, and developing new runways to increase airfield capacity. A substantial increase in aircraft operations at the busiest airports may warrant development of additional runways by the airport proprietor. The planning and environmental overview processes, which must be completed before a new runway can be built, generally take many years to complete and are typically controversial within the local community. Of the 35 OEP airports, 10 can be considered transfer airports (with 50 percent of their passengers connecting to another flight) and 25 can be considered origin airports (with 50 percent or more of their passengers originating at the airport). (See Table 4 in Chapter 2) Eight of the 10 transfer airports have opened a new runway, have a runway under construction, or are considering a new runway. Fifteen of the 25 origin airports have opened a new runway, have a new runway or an extension under construction, or are examining the feasibility of a new runway, runway extension, or new airport. Airlines select transfer airports as hubs in part because of their potential for expansion, and airport management is eager to provide adequate runway capacity in order to ensure that the airlines continue to operate there, rather than switching hub operations to a competing airport. Much of the additional capacity at transfer hubs is intended for use by commuter and regional airline aircraft, which transport passengers from smaller cities within several hundred miles of the hub. This traffic is expected to grow as regional carriers continue to acquire jet aircraft. Capacity-enhancing efforts are also underway at several of the airports that primarily serve originating passengers. However, in a few cases, new runways are not feasible and the alternative of congestion management is being explored. (See Chapter 2, Alternative Capacity Enhancement Measures) OTHER FACTORS
Capacity is affected not only by the volume of air transportation but also by the way in which it is provided. Airlines are expected to continue to concentrate their schedules at their primary hubs, where large numbers of flights converge in short periods of time to maximize the opportunity for passenger transfers. No additional airline hubs are expected to arise within the next 5 years. Increased point-to-point service, bypassing hubs, is occurring when warranted by market considerations. Lower-cost carriers usually serve major metropolitan areas by using uncongested, secondary commercial service airports where existing facilities are underutilized. In some cases, however, service has been initiated at major airports. For example, low-cost carriers presently operate a significant number of flights at the major airports in Las Vegas, Phoenix, Los Angeles, St. Louis, and Philadelphia. The globalization of the airline industry, the rapid growth of air transportation in other parts of the world, and the increased range and reduced size of aircraft will combine to bring international passengers to more U.S. airports. The effects will vary, but may include requirements for longer runways, terminal building expansion, and provision of Federal inspection facilities for immigration, customs, and agriculture at airports where international traffic is increasing.
National Plan of Integrated Airport Systems (2009-2013) 53

The increased number of jet aircraft in the general aviation fleet will result in a demand for longer runways at certain reliever and general aviation airports, particularly those with substantial use (500 or more annual operations) by business and corporate aircraft. Cargo
Air cargo, domestic and international freight/express and mail, is moved in the bellies of passenger aircraft and in dedicated all-cargo aircraft. Significant changes have occurred in the air cargo industry. These changes include new air cargo security regulations by FAA and the Transportation Security Administration (TSA), market maturation of the domestic package express market, shift from air to other modes (especially truck), increases in fuel surcharges, growth in international trade from open skies, expanded use of all-cargo carriers (e.g., FedEx) by the U.S. Postal Service to transport mail, and increased use of mail substitutes (e.g., e-mail). On August 3, 2007, “Recommendations of the 9/11 Commission Act of 2007” were signed into law. Section 1602 of this Act states that air cargo placed on passenger aircraft will receive the same level of screening as passenger-checked baggage. To this end, the legislation calls for the establishment of a system to be phased in within 3 years that requires 100-percent inspection of cargo transported on passenger aircraft. It is anticipated that the law will lead to increased cost and time requirements for shipment of cargo on passenger air carriers. Air cargo is very important to the U.S. economy, as illustrated by the fact that 32 percent of exports and 21 percent of imports measured by value in 2006 were shipped by air (see Figure 20).41 Air transportation is the preferred mode for the shipment of high-value, lightweight, and perishable goods.42 Lower shipping costs and more frequent service have made air cargo a major factor in the way global business is conducted. Figure 20: Value of U.S. International Merchandise Exported and Imported by Mode
2006
Exports
Air32%
Water29%
Truck26%
Rail4%
Other9%
Imports
Truck 15%
Water51%
Air 22%
Other4%
Pipeline3%
Rail5%
41 Compiled by U.S. Department of Transportation, Research and Innovative Technology Administration, Bureau of Transportation Statistics, Pocket Guide to Transportation, 2007. 42 Air cargo accounts for less than one percent of imports and exports by weight.
54 National Plan of Integrated Airport Systems (2009-2013)

The total air cargo revenue ton-miles flown by U.S. mainline air carriers and regionals/commuters are expected to grow at an annual rate of 5.1 percent through FY 2025. All-cargo carriers have increased their share of domestic cargo revenue ton-miles flown from 65.4 percent in 1997 to 80.8 percent in 2007. This is due to significant growth in express service by FedEx and United Parcel Service (UPS), lack of growth in domestic freight/express business for passenger carriers, increases in wide-body capacity for all-cargo carriers, and security considerations (which limit the cargo carried in passenger aircraft). Domestic revenue ton-miles for U.S. commercial air carriers are expected to increase at an average annual rate of 3.0 percent through 2025. International cargo revenue ton-miles are forecast to grow at an annual rate of 6.0 percent through 2025. All cargo carriers increased their share of international cargo ton-miles flown from 52.0 percent in 1996 to 66.7 percent in 2007. This increase has resulted from the demand for expedited service, activity from the war in Iraq, and the change in reporting of contract services. The all-cargo share is forecast to increase to 72.0 percent by 2025 based on increased capacity. Air cargo is generally concentrated at busy commercial service airports. Air-cargo flights usually occur during off-peak periods and do not substantially contribute to airport congestion and delay problems. The principal need for airport development to support cargo operations is related to the cargo sorting and transfer facilities developed by the package express carriers. These airports must have high-capacity, all-weather runway systems to support reliable operations. Improvements may also be warranted at selected airports, such as JFK, Los Angeles International, Chicago O’Hare, San Francisco, Dallas-Ft. Worth, Anchorage, Atlanta, New Orleans, and Miami to keep pace with rapid growth in international air cargo. Nine of the top 25 U.S. foreign trade freight gateways in terms of value of shipment are airports, with JFK being the busiest U.S. foreign gateway. New Large Aircraft
Airports in the United States and around the world will have trouble accommodating the first new large aircraft (the Airbus 380) because of the 262-foot wingspan (48 feet wider than the next largest aircraft), the 80-foot tail height (16 feet taller than the next tallest aircraft), and, for airports with runway and/or taxiway bridges, a maximum takeoff weight of approximately 1.3 million pounds (420,000 pounds heavier than the Boeing 747-400). It will generally seat 180 to 200 more passengers than the largest aircraft in commercial service today. The current distance between parallel taxiways and their runways, the configuration of taxiway systems, and the layout of terminal buildings are affected by the oversized wingspan while the strength of underlying structures, such as bridges and culverts, will prohibit their use unless they are reinforced for the aircraft’s heavier weight. Twelve airports are identified by A380 air carriers to receive service. The A380 is anticipated to initially serve four U.S. airports, including JFK, Los Angeles, San Francisco and Miami. If cargo operators FedEx and UPS reconsider the A380F, then service by this aircraft can also be expected at Anchorage, Memphis, Louisville, and Ontario (CA). Later passenger service is contemplated for Orlando and Washington Dulles. Although not designated by A380 operators, Chicago O’Hare, Dallas-Ft. Worth, and Denver are likely to have passenger service by the A380 after 2012, and Indianapolis is likely to have cargo service.
National Plan of Integrated Airport Systems (2009-2013) 55

Many airports are undertaking large modernization projects to improve airfield safety and efficiency and to prepare for projected increases in activity. Because airports are continuously upgrading terminals and airfields, it is difficult to determine exactly how much of those costs are solely attributable to accommodating the A380. Airports planning to receive service by the A380 started their preparations and financial planning for necessary improvements several years ago. They have indicated and taken measures that will have them ready to accept A380 service by the time service is scheduled to start at their airport. Fractional Ownership
An important factor cited in the growth of business jet operations is the growth of fractionally owned aircraft. The concept of fractional ownership, where corporations or individuals purchase an interest in an aircraft (can be as little as a 1/16thshare) and pay a fixed fee for operations and maintenance, was introduced in the mid-1980s. In the last few years, it has grown significantly, and this trend is expected to continue. According to the 2008 FAA aviation forecast, safety/security concerns for corporate staff, combined with increasing flight delays at some U.S. airports have made fractional, corporate, and on-demand charter flights practical alternatives to commercial flights. Fractional ownership aircraft fly about 1,200 hours annually compared to an average of 350 hours per year for business jets in all applications. Very Light Jets or Microjets
Delivery of smaller affordable business jets, also referred to as very light jets (VLJ) or microjets, began in 2007. Approximately 143 of these aircraft were delivered in 2007, with expectations they will continue to enter the active fleet at a rate of 400 to 450 aircraft a year, reaching 8,145 aircraft by 2025. These aircraft are expected to cost between $1 and 2 million each and provide seating capacity for five or six people. VLJs should be able to operate at most general aviation airports in the NPIAS without significant airfield improvements and with no significant impact on their capacity. VLJs are able to operate at smaller airports with shorter runways (anticipated runway lengths of 3,000 to 3,500 feet), thereby improving access to the national airspace system for rural areas and less-populated urban areas. However, VLJs used in air taxi service may require longer runway lengths due to Title 14, Code of Federal Regulation, Part 135 requirements.43 There are currently three Part 135 air taxi operators flying 37 VLJs, with a fourth operator scheduled to be operational by early 2009.44
43 Title 14 CFR Part 135, Operating Requirements: Commuter and On Demand Operations and Rules Governing Persons on Board Such Aircraft. 44 Three current operators are: DayJet based at Boca Raton, Florida; Linear based at Bedford, Massachusetts; and North American Jet based at Palwaukee, Illinois. POGO will be based at Westover, Massachusetts and is expected to be operational in 2009.
56 National Plan of Integrated Airport Systems (2009-2013)

Conversion of Military Surplus Airfields
Since 1989, the Base Realignment and Closure (BRAC) Commission have made many military airfields available for conversion to civil aviation use. About 30 surplus military airfields have been converted to civil use by local communities (see Table 9). Most of these military airfields have long runways and associated facilities that can accommodate large civil aircraft. Twelve of the surplus military airfields have become commercial service airports. Two other surplus airfields (Sacramento Mather Airport, CA and Rickenbacker International Airport, OH) have attracted significant cargo service. The remaining surplus airfields are located in areas where general aviation and reliever airports are needed.
Table 9: Military Airfields Transferred to Civil Sponsors State Principal City Civil Airport Name Name of Former
Military Installation Locid Service Level
AZ Mesa Phoenix-Mesa Gateway Airport Williams AFB IWA Reliever AR Blytheville Arkansas International Eaker AFB BYH GA CA San Bernardino San Bernardino International Airport Norton AFB SBD Reliever CA Sacramento Sacramento Mather Mather AFB MHR Reliever CA Victorville Southern California Logistics George AFB VCV Reliever CA San Bernardino San Bernardino Int’l Airport Norton AFB SBD Reliever CA Atwater Castle Airport Castle AFB MER GA FL Jacksonville Cecil Field Jacksonville NAS VQQ GA FL Homestead Homestead General Aviation Airport Homestead AFB X51 GA GU Agana Guam International Agana NAS GUM Primary HI Kapolei Kalaeloa (John Rodgers Field) NAS Barbers Point JRF Reliever
IL Rantoul Rantoul National Aviation Center - Frank Elliott Field Chanute AFB TIP GA
IL Belleville Scott AFB/MidAmerica Airport Scott AFB BLV Primary LA Alexandria Alexandria International England AFB AEX Primary MD Odenton Tipton Airfield Tipton AAF FME Reliever MI Marquette Sawyer International Airport K.I. Sawyer AFB SAW Primary MI Sault Ste. Marie Chippewa County International Airport Kincheloe AFB CIU Primary MI Oscoda Oscoda-Wurtsmith Airport Wurtsmith AFB OSC GA NE Lincoln Lincoln Airport Lincoln AFB LNK Primary NH Portsmouth Portsmouth International Airport at Pease Pease AFB PSM Primary NY Newburg Stewart International Airport Stewart AFB SWF Primary NY Plattsburgh Plattsburgh International Airport Plattsburgh AFB PBG GA NY Rome Griffiss Airfield Griffiss AFB RME GA
OH Columbus Rickenbacker International Airport Rickenbacker AFB LCK Nonprimary Commercial
Service SC Myrtle Beach Myrtle Beach International Myrtle Beach AFB MYR Primary TN Smyrna Smyrna Airport Sewart AFB MQY Reliever TN Millington Millington Regional Jetport Memphis NAS NQA GA TX Houston Ellington Field Ellington AFB EFD Reliever TX Laredo Laredo International Airport Laredo AFB LRD Primary TX Austin Austin-Bergstrom International Bergstrom AFB AUS Primary
National Plan of Integrated Airport Systems (2009-2013) 57

The 2005 BRAC Report identified more than 800 military installations across the country from the active National Guard and the Reserve that will either be closed or realigned. The Department of Defense is working with BRAC-affected communities, both those that will be losing an installation and those that will be gaining missions. Some communities are taking measures to prepare themselves for the changes. The 2005 BRAC Report only contains a few military airfields. Three communities have contacted FAA to explore the potential aviation reuse of the military facility being closed. Of those three, only Roosevelt Roads Naval Air Station in Puerto Rico has been turned over to the local government for civil use. Brunswick, ME, is preparing to take over Brunswick Naval Air Station (NAS) for civil use in 2011 when the base realignment is completed. The community surrounding Willow Grove NAS in Pennsylvania is not pursuing conversion of the naval facility into a civil airfield. Other Innovations
Efforts are underway to develop transportation and communication technology that may eventually affect the demand for conventional air transportation. Tiltrotor aircraft may evolve into effective vehicles for air travel between city centers or suburban areas, bypassing congested airports. High-speed trains are being demonstrated that could attract more passengers to rail in specific markets, and research is underway into magnetic levitation (maglev) vehicles. Teleconferencing and other electronic communication techniques could affect the demand for business air travel. These innovations may eventually have a significant effect on airport development needs, but this is not expected to occur during the next 5 years. Commercial Spaceports
Commercial space transportation refers to the launch of an object into space or the reentry of an object from space by a private, non-government entity. Typically, commercial space transportation concerns the activities of launch service providers, who place satellites into orbit under contract from corporations, governments, or other organizations. Objects are launched from licensed locations, referred to as commercial spaceports. There are currently five commercial spaceports in operation across the United States. At this time, two of the current spaceport locations (Mojave Airport, CA and Clinton-Sherman, OK) involve a public-use airport contained in the NPIAS. However, future consideration may be given to utilizing other NPIAS airports as “spaceports.” These airports are joint-use facilities that accommodate both aviation and space operations, particularly space operations involving horizontally launched reusable vehicles. The initial demand for this type of joint-use facility will be limited to only a few airports at more remote locations. FAA will continue to work with the space and aviation industries in identifying potential spaceport locations and in developing standards to ensure that the joint operations at NPIAS airports can be conducted in a safe, efficient, and environmentally responsible manner. Airport Privatization
Public-use airports in the United States that are owned and operated by a public agency or a government entity such as a county, city, or state government are eligible for participation in the
58 National Plan of Integrated Airport Systems (2009-2013)

Airport Privatization Pilot Program. Congress established the Airport Privatization Pilot Program (Title 49, Section 47134) in 1996 to determine if, once certain economic and legal impediments were removed, privatization could produce alternative sources of capital for airport development and provide benefits, such as improvements in customer service. The Pilot Program is limited to five participants; this includes one large hub airport and at least one general aviation airport. General aviation airports can be leased or sold; air carrier airports can only be leased. In 2000, FAA approved the participation of the first airport in the Pilot Program; Stewart International Airport located in Newburgh, NY. The airport was leased to National Express Group, a British company, under a 99 year lease. In 2007, the airport left the Pilot Program when National Express Group sold its leasehold interest in the airport to the Port Authority of New York and New Jersey. In October 2006, the FAA accepted the city of Chicago's preliminary application for Chicago Midway International Airport's participation in the Airport Privatization Pilot Program. In late 2007, the City reached preliminary agreement with the airport's major airlines on the amount of compensation that the City could receive under a lease arrangement. The Law requires that 65 percent of the airlines serving the Airport and 65 percent of the total airline landed weight in the preceding year must approve the amount of funds that the City can use for municipal purposes not related to the operation of the Airport. This action permits the City to solicit qualifications for potential airport operators. In April 2008, the City received qualification statements from six teams interested in obtaining a long-term lease for the operation of Chicago Midway International Airport. The City plans to select a private operator and submit a final application to the FAA during calendar year 2008.
National Plan of Integrated Airport Systems (2009-2013) 59

This page intentionally left blank.
60 National Plan of Integrated Airport Systems (2009-2013)

Chapter 4: Development Requirements OVERVIEW
Information on the development needed to provide an adequate national system of airports is derived from locally prepared airport master plans and airport system plans.45 The development recommendations are tied to the current use and condition of each airport and the forecast increase in activity. Because the NPIAS is an aggregation of airport capital development identified through the local planning process, rather than a spending plan, no attempt is made to prioritize the included development or evaluate whether the benefits of a specific development project would exceed its costs. As a planning document, the NPIAS should not be used in evaluating investment priorities. The development captured in this report was extracted from an FAA database that integrates development planning and AIP funding. FAA requires benefit cost analysis (BCA) to demonstrate the merit of capacity projects for which airport sponsors are seeking AIP discretionary funds.46 Airport capacity projects meeting a dollar threshold of $5 million or more in AIP discretionary grants over the life of the project and all airport capacity projects requesting a letter of intent47 must be shown to have total discounted benefits that exceed total discounted costs. Projects subject to the BCA are those projects that enhance airfield capacity in terms of increased aircraft operations, increased aircraft seating capacity or reduced airfield operational delays, or support development directly related to the project. The FAA policy requiring BCA does not apply to projects undertaken solely, or principally, for the objectives of safety, security, conformance with FAA standards, or environmental mitigation. PROCESS
Most of the data contained in the NPIAS is based upon individual airports’ master plans and capital improvement plan (CIP). These documents are prepared to support the modernization or expansion of existing airports, or the creation of new airports. Typically, operators of individual airports prepare airport master plans, usually with the assistance of consultants. FAA field offices review these plans, which follow a standard outline contained in an FAA advisory circular that links development to current and forecast activity. The plans include consideration of all significant aviation requirements, including the needs of national defense and the postal service. Periodically, FAA offices will meet airport sponsors and review the CIP making adjustments to reflect the current airport development needs. Plans for major development, such as new runways or runway
45 An airport master plan is a detailed, long-term development plan for an individual airport. Airport system plans (regional and state) study the performance and interaction of an entire aviation system to understand the interrelationships. 46 The amounts available under AIP fall into two basic categories: apportioned funds (also known as entitlement funds) and discretionary funds. Entitlement funds are funds to be apportioned by formula each year to specific airport sponsors, types of airports, or States. The remaining amount of AIP funding is known as discretionary funding. For further information see http://www.faa.gov/airports_airtraffic/airports/aip/ 47 An airport sponsor may request a Letter of Intent (LOI) for a project that will preserve or enhance capacity, with funding, including reimbursement, over several years.
National Plan of Integrated Airport Systems (2009-2013) 61

extensions, tend to be controversial, and the planning process provides interested parties with the opportunity to request a public hearing. Development that is not justified by the aviation activity forecast or is ineligible for Federal funding is screened by FAA planners and is not entered into the NPIAS database. The combination of a planning process that links development to activity, an FAA review that culls out unnecessary and ineligible development, and the discussion of controversial proposals at public hearings results in reasonable and well-documented estimates of future airport project requirements. However, the actual timing and cost of development may vary from the airport master plan. For instance, projects may be deferred or developed in stages in order to reduce immediate costs, or conversely, an unexpected rapid increase in activity may justify accelerating certain development. State system plans are also used as a data source for the NPIAS. The state system plan includes airport locations considered important to state air transportation objectives, as well as those that are of sufficient interest to be incorporated into the NPIAS. An important function of the state planning process is to identify airports that meet national interest criteria, but which might not be identified as such by FAA alone. These plans play a part in the development of airport role, condition and performance information. However, aviation system plan recommendations on capital development at individual airports or at a system of airports are usually secondary to master plan information. In these cases, the state or regional system plan identifies broad needs or priorities within its jurisdiction. Airports and airlines frequently engage in discussions about major airport investment programs. Airlines have questioned the scope and timing of specific development proposals, including major new airports, ground access projects, and certain terminal and airfield improvements. The NPIAS generally reflects the airport operator’s viewpoint about the scope and schedule for proposed development. If proposals are downsized, rescheduled, or accomplished in stages, development costs could be significantly lower. DEVELOPMENT COSTS
The cost estimates of future development included in this report of $49.7 billion are 21 percent higher than those found in the 2007 edition and 8 percent higher than those in the 2001 edition. These historical costs reflect the financial situation of airports and airlines. Also reflected in this report are the rising construction costs resulting from limited supplies and higher fuel prices. Since the last report issued 2 years ago, construction costs have increased approximately 11 percent, due in large part to increases in materials and labor. Figure 21 compares the development costs identified in previous NPIAS Reports.
62 National Plan of Integrated Airport Systems (2009-2013)

Figure 21: 5-Year Development Estimates from Published NPIAS Reports to Congress 48
8.7
24.0
29.7
35.1
46.2
39.5
41.2
49.7
0.0 10.0 20.0 30.0 40.0 50.0 60.0
1980
1990
1993
1998
2001
2005
2007
2009Ba
se Y
ear o
f Pub
lishe
d Re
port
Development Cost ($ Billions)
NPIAS costs are categorized by type of airport and by purpose of development. These development totals are shown in Table 10. For comparison purposes, Table 11 shows development requirements contained in the previous edition of the NPIAS.
Table 10: 2009 – 2013 NPIAS Cost by Airport and Development Category (2008 $ millions)
Development Category
Large Hub
Medium Hub
Small Hub Nonhub Commercial
Service Reliever GA Total Percent
Safety $457 $290 $174 $692 $46 $65 $161 $1,885 3.8% Security $386 $166 $59 $66 $22 $43 $224 $966 1.9% Reconstruction $2,484 $1,106 $988 $1,360 $367 $863 $2,441 $9,610 19.3% Standards $1,360 $1,034 $1,214 $1,762 $449 $1,844 $5,718 $13,382 26.9% Environmental $1,166 $607 $320 $199 $1 $7 $123 $2,502 5.3% Capacity $5,729 $1,432 $396 $189 $16 $414 $458 $8,634 17.4% Terminal $5,393 $2,009 $813 $675 $50 $29 $145 $9,115 18.3% Access $994 $508 $155 $124 $27 $110 $183 $2,101 4.2% Other $41 $14 $35 $33 $11 $23 $61 $218 0.4% New Airport $0 $0 $0 $0 $0 $0 $0 $1,305 2.6% Total New $18,009 $7,165 $4,155 $5,101 $990 $3,476 $9,516 $49,717 100.0% Percentage 36.2% 14.4% 8.4% 10.3% 2.0% 7.0% 19.1%
48 The year shown is the base year for the five-year calculation (i.e., 2009 identified costs for 2009 to 2013).
National Plan of Integrated Airport Systems (2009-2013) 63

Costs associated with planning (master plans, regional and state system plans, and environmental studies) are not reflected in Table 10, Table 11, or Appendix A. For the 5-year period covered by this report, planning costs total $327 million, an increase of 23 percent ($61 million) from the last report. Planning at large and medium hub airports account for 36 percent of the total, and general aviation and reliever airports account for 38 percent.
Table 11: 2007 – 2011 NPIAS Cost by Airport and Development Category (2006 $ millions)
Development Category
Large Hub
Medium Hub
SmallHub Nonhub Commercial
Service Reliever GA Total Percent
Safety $503 $369 $145 $612 $61 $74 $173 $1,937 4.7%Security $695 $241 $84 $44 $10 $54 $185 $1,313 3.2%Reconstruction $1,954 $976 $659 $952 $187 $618 $1,782 $7,128 17.3%Standards $1,356 $681 $834 $1,517 $366 $1,626 $4,730 $11,109 27.0%Environment $792 $468 $288 $130 $20 $80 $90 $1,868 4.5%Capacity $5,612 $1,470 $411 $255 $18 $315 $378 $8,459 20.6%Terminal $5,226 $366 $564 $563 $31 $28 $132 $6,910 16.8%Access $929 $89 $129 $106 $34 $84 $130 $1,501 3.6%Other $7 $8 $30 $24 $5 $17 $41 $132 0.3%New Airports - - - - - - - $809 2.0%Total $17,073 $4,667 $3,145 $4,203 $732 $2,896 $7,641 $41,167 100.0%Percentage 41.5% 11.3% 7.6% 10.2% 1.8% 7.0% 18.6%
Development is divided into categories on the basis of the principal purpose of development and by type of airport. Figures 22 and 23 compare the development by airport type and by development category over the last 10 years (1998, 2001, 2005, 2007, and 2009). Figure 22 highlights a continued increase in the development at general aviation airports and fairly consistent development needs at small, nonhub, general aviation, and reliever airports. Development estimates for medium hub airports increased by 54 percent and 32 percent for small hub airports from the last report.
64 National Plan of Integrated Airport Systems (2009-2013)

Figure 22: Comparison of 5-Year Development Costs by Airport Type Years 1998, 2001, 2005, 2007, and 2009
$0
$5,000
$10,000
$15,000
$20,000
$25,000
Large Medium Small Non-hub CommercialService
Reliever GeneralAviation
Airport Type
$ Th
ousa
nds
19982001200520072009
Figure 23 compares the type of needed development identified in the current report to the four previous reports. Continuing the trend from the last report, which saw pavement reconstruction increase by 40 percent from 2005 to 2007, pavement reconstruction is up 35 percent from 2007. Estimates for environmental costs (noise, soundproofing, land easements) increased by 34 percent and terminal building costs increased 32 percent. Development to bring existing airports up to design criteria increased 20 percent from the last report. The estimated need for safety projects decreased three percent, and the need for security costs decreased 26 percent from the last report. The decrease in security costs is largely due to the removal of airport terminal modifications to accommodate explosive detection systems from the NPIAS. These projects were removed because FAA is prohibited from funding development that can be funded by another Federal agency.
National Plan of Integrated Airport Systems (2009-2013) 65
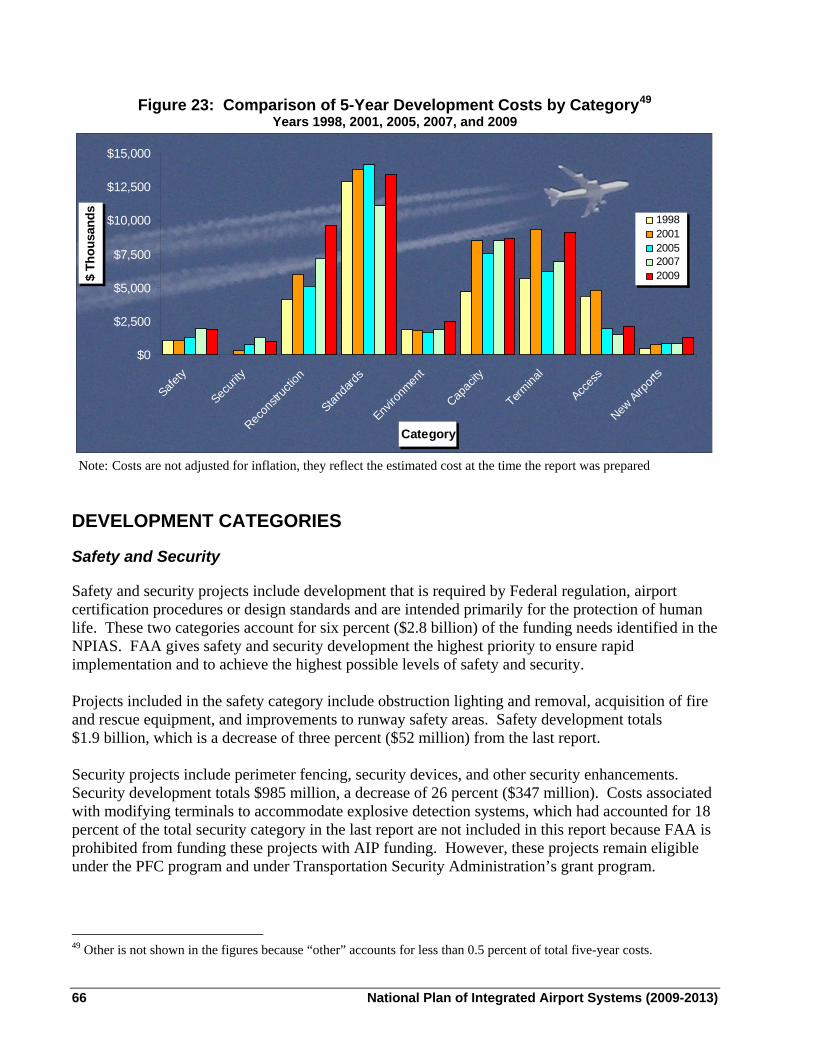
Figure 23: Comparison of 5-Year Development Costs by Category49
Years 1998, 2001, 2005, 2007, and 2009
$0
$2,500
$5,000
$7,500
$10,000
$12,500
$15,000
Safety
Securi
ty
Recon
struc
tion
Standa
rds
Enviro
nmen
t
Capac
ity
Termina
l
Acces
s
New Airp
orts
Category
$ Th
ousa
nds
19982001200520072009
Note: Costs are not adjusted for inflation, they reflect the estimated cost at the time the report was prepared
DEVELOPMENT CATEGORIES
Safety and Security
Safety and security projects include development that is required by Federal regulation, airport certification procedures or design standards and are intended primarily for the protection of human life. These two categories account for six percent ($2.8 billion) of the funding needs identified in the NPIAS. FAA gives safety and security development the highest priority to ensure rapid implementation and to achieve the highest possible levels of safety and security. Projects included in the safety category include obstruction lighting and removal, acquisition of fire and rescue equipment, and improvements to runway safety areas. Safety development totals $1.9 billion, which is a decrease of three percent ($52 million) from the last report. Security projects include perimeter fencing, security devices, and other security enhancements. Security development totals $985 million, a decrease of 26 percent ($347 million). Costs associated with modifying terminals to accommodate explosive detection systems, which had accounted for 18 percent of the total security category in the last report are not included in this report because FAA is prohibited from funding these projects with AIP funding. However, these projects remain eligible under the PFC program and under Transportation Security Administration’s grant program.
49 Other is not shown in the figures because “other” accounts for less than 0.5 percent of total five-year costs.
66 National Plan of Integrated Airport Systems (2009-2013)

Reconstruction
Reconstruction includes development to replace or rehabilitate airport facilities, primarily pavement and lighting systems that have deteriorated due to weather or use, and which have reached the end of their useful lives. This category, which accounts for about 19 percent, or $9.6 billion, of NPIAS funding needs, includes the rehabilitation of pavement on a 15- to 20-year cycle. This category of development increased by 35 percent and reflects an increase in reconstruction costs by every type of NPIAS airport. Failure to replace deteriorating pavement increases airport maintenance costs and can result in damage to aircraft propellers and engines, pooling of water and ice deposits, and eventually potholes that can damage landing gear. Airfield lighting cables and fixtures deteriorate with age, resulting in dim and unreliable lighting if they are not replaced. Reconstruction is included in the NPIAS when normal maintenance procedures are no longer economical and effective. Standards
Standards projects include development to bring existing airports up to design criteria recommended by FAA. This remains the largest development category, accounting for 27 percent of the NPIAS. This type of development saw a 20 percent increase from the last report with increases for every category of airport. Many commercial service airports were designed more than 50 years ago to serve relatively small and slow aircraft but are now being used by larger and faster turboprop and jet aircraft. As a result, runways and taxiways must be relocated to provide greater clearance for aircraft with larger wingspans, and aircraft parking areas must be adapted to accommodate larger aircraft. Standards development at general aviation and reliever airports is generally justified to accommodate a substantial number of operations by a “critical” aircraft with sizes and operating characteristics that were not foreseen at the time of original construction. If this work is not undertaken, aircraft may be required to limit fuel or passenger loads because of inadequate runway length. FAA usually requires an indication that an aircraft type will account for at least 500 annual itinerant operations at an airport before development is included in the NPIAS to accommodate it. For airports across the country, the infrastructure requirements needed to implement an approach, such as a lateral precision performance with vertical guidance (LPV), using FAA’s wide area augmentation system (WAAS) have not been fully assessed and, therefore, are not captured in this report. Aerial surveys are underway nationwide to help assess the obstacles that may impact the approach minimums to a particular runway. In addition, ongoing evaluations of airport master plans are occurring, which consider the airport infrastructure, like a parallel taxiway, that may need to be constructed to accommodate an LPV approach. Environment
The environment category includes projects designed to achieve an acceptable balance between airport operational requirements, environmental requirements, and the expectations of residents of the surrounding area for a quiet and clean environment. This development supplements the large noise reductions that have been achieved by quieter aircraft and the use of noise abatement procedures. It accounts for five percent, or $2.5 billion, of NPIAS costs and includes the relocation of households and soundproofing of residences and public buildings in areas underlying aircraft approach and departure paths. Eighty percent of the cost is for land acquisition in fee simple (complete ownership), for easements (partial ownership) to compensate property owners for
National Plan of Integrated Airport Systems (2009-2013) 67

overflights, or for noise mitigation for public buildings. Increased cost is expected due to projects funded under the Voluntary Airport Low Emissions Program for reducing airport air emissions. Environmental costs are concentrated at airports with frequent flights by jet aircraft (47 percent large hubs, 24 percent medium hubs, 13 percent small hubs, eight percent nonhubs, and three percent reliever airports). This development is part of an extensive Federal and industry program—involving land use planning, quieter aircraft, and noise abatement procedures—that has reduced the estimated number of people exposed to significant noise. Terminal Building
Terminal building costs are incurred for development to accommodate more passengers and different aircraft (small regional jets and new large aircraft). This is the third largest development category accounting for 18 percent of the NPIAS costs. While terminal costs increased 32 percent ($2.2 billion) from the last report, it is only two percent higher than the costs identified in the 2001 report. The NPIAS only includes the portion of terminals that are eligible for Federal aid (about 50 to 60 percent) and excludes revenue-generating areas50 used exclusively by a single tenant or by concessions, such as gift shops and restaurants. The development is concentrated at the busiest commercial service airports (59 percent large hubs, 22 percent medium hubs, nine percent small hubs, and seven percent nonhubs). Surface Access
Access includes the portion of airport ground access (highways and transit) that is within the airport property line and eligible for grants under the AIP. The large hubs account for 47 percent, and medium hubs account for 24 percent of the access development needs. Surface access currently accounts for four percent of the NPIAS costs, up 40 percent from the last report. FAA currently has research underway to assess the most critical surface access problems identified by airport sponsors. This includes curbside improvements and improving passenger access to the airport terminal from surface transportation facilities. The results of the research will be reported in the next edition of this report. Airfield Capacity
Airfield capacity is development that will improve an airport for the primary purpose of reducing delay and/or accommodating more passengers, cargo, aircraft operations, or based aircraft. This is the fourth largest development category, accounting for 17 percent of the NPIAS, and includes new runway, taxiway, and apron construction and extensions. Runway development that is warranted to relieve congestion but precluded because of political and environmental considerations is not included. The airfield capacity development included in this 5-year plan will help to reduce congestion. However, problems will remain in certain large metropolitan areas such as New York, Los Angeles, and Chicago, and FAA will continue to focus on the need for additional capacity at those locations.
50 Nonhub primary airports and smaller public-use airports can use AIP for revenue-producing aeronautical support facilities.
68 National Plan of Integrated Airport Systems (2009-2013)

New Airports
New airports are recommended in the NPIAS for communities that generate a substantial demand for air transportation and either do not have an airport or have an airport that cannot be improved to meet minimum standards of safety and efficiency. In addition, new commercial service and reliever airports are recommended for communities where existing airports are congested and cannot be expanded to meet the forecast demand for air transportation. During the next 5 years, a number of new reliever and general aviation airports, along with a few small commercial service airports and nonhub primary airports, are proposed. This category accounts for three percent of all NPIAS development. Other
This category of development accounts for less than one-half of one percent of the total development in the NPIAS. It includes fuel farms, utilities, and construction and rehabilitation of parking lots. General aviation and reliever airports account for 28 percent of this development. ANTICIPATED SOURCES OF FUNDING
There are generally four sources of funds used to finance airport development: airport cash flow, revenue and general obligation bonds, Federal/state/local grants, and passenger facility charges (PFCs). Access to these sources of financing varies widely among airports, with some large airports maintaining substantial cash reserves, while the small commercial service and general aviation airports often require subsidies from local and state governments to fund operating expenses and finance modest improvements. Since FY 2001, AIP grants have exceeded $3 billion annually, and for the last 5 years, PFC collections have exceeded $2 billion annually. Together, AIP grants and PFC collections account for about 40 percent of annual U.S. airport capital spending needs. Historically, the combined resources have been adequate to achieve needed development. Since 1990, annual funding for airport development has been in the range of $5.5 billion to $7.3 billion. In 2006, the commercial service airports reported expenditures of $9.1 billion in airport development projects representing the total public spending, including projects eligible for AIP grants (NPIAS) and projects ineligible for AIP grants, like automobile parking garages and hangars.51 This is an increase of about seven percent ($600 million) from reported expenditures in FY 2004 of $8.5 billion. The AIP serves as an effective investment tool to fund safety, security, and airfield projects that rank highest in national priority. The PFC program has broader eligibility than the AIP particularly for terminal projects, noise compatibility measures, and costs associated with debt financing, and is available in significant and predictable amounts to large and medium hub airports. As a result, airports, especially large and medium hubs, have been directing the majority of their PFC revenues to landside projects such as terminal development, ground access systems, noise mitigation, and the 51 Airport Operating and Financial Summary, FY 2006 (FAA Form 127).
National Plan of Integrated Airport Systems (2009-2013) 69

financing costs of these projects. The majority of nonhub primary airports use PFC revenues as the local “match” funds for AIP grants. ADDITIONAL COSTS NOT INCLUDED IN THE NPIAS
The NPIAS only includes development that is eligible to receive Federal grants under the AIP. It does not include ineligible airport development, such as automobile parking structures, hangars, air cargo buildings, or the revenue-producing portion of large passenger terminal buildings.52 It does not include:
Development eligible under the PFC Program but ineligible under the Federal grant program, such as gates and related areas.
Improvements to highway and transit systems beyond the airport property line.
Improvements funded by FAA’s Facilities and Equipment program.
Costs at airports for infrastructure improvements needed to take full advantage of Wide Area
Augmentation System (WAAS) LPV approaches.53
Development needed to relieve airfield congestion in metropolitan areas when there is no local consensus about how to address the problem. The NPIAS is drawn from approved plans only.
52 Vision 100 legislation changed eligibility for nonprimary airports and allows nonprimary entitlement funds to be used for hangars, provided the FAA believes that the airport has an adequate plan for financing all airside needs. 53 Future editions of the NPIAS will capture WAAS-related costs.
70 National Plan of Integrated Airport Systems (2009-2013)